
A Comprehensive Societal Energy Return on Investment Study of Portugal Reveals a Low but Stable Value


1
Faculty of Engineering (FEUP), University of Porto, Rua Dr. Roberto Frias, 4200-465 Porto, Portugal
2
INEGI—Institute of Mechanical Engineering and Industrial Management, Rua Dr. Roberto Frias, 400, 4200-465 Porto, Portugal
3
MARETEC—Marine, Environment and Technology Centre, LARSyS, Instituto Superior Técnico, Universidade de Lisboa, 1049-001 Lisboa, Portugal
4
Sustainability Research Institute, School of Earth and Environment, University of Leeds, Leeds LS2 9JT, UK
*
Author to whom correspondence should be addressed.
Energies 2022, 15(10), 3549; https://0-doi-org.brum.beds.ac.uk/10.3390/en15103549
Submission received: 30 March 2022
/
Revised: 6 May 2022
/
Accepted: 6 May 2022
/
Published: 12 May 2022
(This article belongs to the Topic Exergy Analysis and Its Applications)
Abstract
:Energy return on investment (EROI) is a ratio of the energy obtained in relation to the energy used to extract/produce it. The EROI of fossil fuels is globally decreasing. What do the declining EROIs of energy sources imply for society as a whole? We answer this question by proposing a novel EROI measure that describes, through one parameter, the efficiency of a society in managing energy resources over time. Our comprehensive societal EROI measure was developed by (1) expanding the boundaries of the analysis up to the useful stage; (2) estimating the amount of energy embodied in the energy-converting capital; (3) considering non-conventional sources such as the muscle work of humans and draught animals; and (4) considering the influence of imported and exported energy. We computed the new EROI for Portugal as a case study. We find a considerably lower EROI value, at around 3, compared to those currently available, which is stable over a long-time range (1960–2014). This suggests an independence of EROI from economic growth. When estimated at the final stage, using conventional methods (i.e., without applying the four novelties here introduced), we find a declining societal EROI. Therefore, our results imply that the production of new and more efficient final-to-useful energy converting capital has historically kept societal EROI around a stable value by offsetting the effects of the changing returns of energy sources at the primary and final stages. This will be crucial in the successful transition to renewables.
1. Introduction
1.1. Background on EROI
This paper presents a broader perspective on energy return on investment (EROI). EROI is a well-known metric in the field of energy analysis that expresses how much energy is returned by a certain energy extraction process in relation to the energy that has been spent to allow for that same process. The importance of this measure lies in this simple consideration: the more energy is used to obtain energy itself, the less can be used to ultimately provide energy services. Thus, we would naturally expect the EROI ratio to be related to the economic performance of a society. In fact, statistical studies have shown that below certain EROI values, economic growth seems unviable [1,2]. Therefore, a generalised concern has been raised by the evidence that the EROI of extracting fossil fuels (referred to as “mine mouth” or “well head” EROIs) is globally following a decreasing trend [3,4,5,6]. Moreover, from a future perspective, it is a matter of concern that renewable and non-conventional energy sources are supposed, by convention, to present lower EROI ratios compared to fossil energy [7].
Nowadays, a typical average measure of the EROI of fossil fuels ranges between 17 and 40 at the primary stage of energy conversion [4,6,7,8,9]. At the final stage, depending on the boundaries, the adopted method, and the energy vector, it varies between 4 and 18 [7,9,10,11]. In other words, this means that currently by using one unit of energy, it is possible to return between 4 and 18 energy units of a refined fossil fuel for societal use. On the other hand, both solar photovoltaic (PV) and wind energy seem to be mature technologies in terms of energy returns [12] and are still expected to slowly increase their EROI [13,14,15]. Nevertheless, the greatest part of the global solar potential is expected to have, in terms of EROI, an extraction efficiency lower than 9 [16], while the electricity provided by large hydropower plants show EROI values higher than 5 [17].
Although comparing renewable and non-renewable sources has raised methodological issues [18,19] (which must be overcome by a clear definition of the scope and the boundaries of EROI studies [20,21]), these outcomes question whether a fully renewable-based electric system could be capable of sustaining modern energy intensive societies [15,22,23,24,25]. Future scenarios seem to either imply energy shortages or an undesired increase in emissions, placing the economy in the so called “energy-emissions trap” [26].
In order to grasp the implications of declining and low EROI of different energy sources, the scope must be widened to the societal level, considering all energy extraction and conversion processes taking place in a given economy.
1.2. Limitations of Current Societal EROI Estimates
All societal energy conversion stages with corresponding EROI measures are shown in Figure 1.
Let us consider a certain amount of extracted coal (primary energy). Coal can be refined and transformed through a power plant into electricity (final energy). At this stage, the final energy available to the consumers is still not related to the use they will make of it. Indeed, from the same content of electricity, different actual amounts of light (useful energy) can be obtained, depending, for example, on the lamp efficiency. Finally, the light provided by the lamp will ensure visibility in a certain room (energy service).
The few analyses that have actually provided empirical estimates of EROI [9,27,28,29,30,31] adopting a societal scope, show five significant limitations:
- Omission of energy embodied in capital. Each of the stages shown in Figure 1 implies the availability of energy converting capital; two studies [30,31] have included as inputs the energy required for manufacturing it; all other studies, by omitting energy embodied in capital, have thereby overestimated the EROI.
- Overlooking muscle work. The flows related to muscle work delivered by living beings (humans and working animals) have always been neglected. Although in a fully industrialised country these contributions are negligible, they are extremely relevant at earlier periods [35]. Indeed, by overlooking muscle work, societal EROI is highly overestimated since the EROI of food and feed production and conversion to useful energy is extremely lower than that of conventional energy sources.
- Exclusion of imports and exports. The effect of importing and exporting energy resources was only considered by Lambert et al. [27]. For example, for a country importing all its final energy, EROI may be highly overestimated if the energy costs related to extraction and transformation of the imported energy sources is not considered, since it does not appear in national energy balances.
- Limited time range. With one exception [27], all studies considered a time frame shorter than 30 years. However, longer time ranges (of 50+ years) are required in order to significantly cover energy transitions.
1.3. Research Aim, Contribution and Article Structure
The main aim of this research is to propose a novel EROI measure that can describe, through one parameter, the overall efficiency of a society in managing energy resources over time. To do so, here, as our novel contribution, we address all of the above issues by developing a new EROI measure, named EROIx (see Figure 1), which embraces the following features:
- Conversion stage. We enlarged the boundaries of the EROI analysis taking into consideration the energy conversions up to the useful stage. To do so, we used the method of Serrenho et al. [35] which, starting from International Energy Agency (IEA) energy data at the final stage, allows for the evaluation of the useful stage energy use of a country.
- Energy embodied in capital. Through a redefinition of national accounts, following the method developed by Santos et al. [36], we estimated the overall national investment in energy converting capital and converted it in energy terms through appropriate and specific energy intensities.
- Muscle work. Taking advantage of the database built by Serrenho et al. [35], which includes the muscle work provided by humans and working animals, we included the whole food and feed production chains as part of the energy sector.
- Imports and exports. To consider the energy associated with the production of traded energy vectors, we developed a specific method that considers the energy consumed to produce imported energy and discount the energy spent inside the national borders to produce the exported energy vectors.
Moreover, in order to include in our analysis different energy and economic transitions, Portugal was chosen: indeed, for this country, the required detailed economic and energy data are available for a long time range (1960–2014).
This paper is structured as follows. In Section 2 we discuss the research status of the field; in Section 3 we explain our new method for estimating the societal EROI by introducing the main equations and describing the data used in the calculations; in Section 4 we show the main results regarding the historical evolution of societal EROI in Portugal; in Section 5 we discuss the main features of different EROI estimates, the advantages of computing our new EROI measure and the implications of such results for future energy scenarios; finally, in Section 6, we draw the conclusions.
2. Related Works
Figure 2 shows a simplified description of inputs and outputs considered for different EROI calculations regarding the boundaries, flows, and transformation sectors: the current status of EROI calculations at the primary and final stage (a) and the novel features of our analysis (b).
As shown in Figure 2a, the inputs (denominator of the EROI ratio) in standard EROI calculations (EROIs) include only direct and indirect energy and materials used in the extraction of energy sources [37]. In this kind of analysis, the energy output (numerator) reaching the rest of the economy is the primary energy exiting the extraction sector. Other more recent analyses [9,29] consider direct and indirect inputs of the extraction sector as well as the direct and indirect energy inputs necessary to run energy transformation industries such as power plants and refineries (EROIf). We name the direct inputs as De and the indirect inputs as Ie. We highlight that only two studies [30,31] have included as inputs the energy embodied in the capital employed in the extraction and transformation sectors of the energy conversion chain (K). The energy output considered is the final energy exiting the energy industries.
Focusing now on Figure 2b, we can now list the novelties introduced by our EROI measure. First, we adopt the boundaries of an extended energy sector up to the useful stage of energy flows, as defined by Santos et al. [36], which includes three subsectors: the extraction sector, the energy industry, and the final-to-useful energy conversion stage constituted by end-use devices. Regarding the energy output, it is now the useful energy reaching the rest of the economy. It is worth noting that both a net measure of EROI—considering as output the net useful energy after deducting all inputs or part of them—and a gross measure of EROI are meaningful. In our study, we adopt a gross measure of EROI, since it is conceptually easier to understand, by maintaining a clear separation between inputs (denominator) and outputs (numerator).
Second, the formation of the capital involved in each conversion stage requires a certain amount of energy use. In an energy-abundant renewable future, where the key constraint on energy availability might shift from energy scarcity to capital scarcity [38], accounting for the energy used to produce physical capital is even more necessary. Therefore, all machines involved in energy conversion are defined as capital investment in the extended energy sector. Thus, we account for the energy embodied in extraction machines (e.g., oil drills, tractors, etc.), in the energy industry (e.g., power plants, oil refineries, etc.) as well as in all the end-use devices (e.g., cars, electrical appliances, etc.) responsible for the final-to-useful energy conversion (K).
Third, food and feed production chains are included as they constitute the final energy commodity that is necessary to generate muscle work by the bodies of humans and draught animals. Therefore, we include the agricultural sector in the primary stage and the food and feed transformation industries in the final stage. Living beings (humans and draught animals) are then considered as part of the energy converting capital, which converts final energy (food or feed) into useful energy (muscle work) and therefore are here included in the definition of K. Subsequently, the direct inputs that allow the food and feed chain to work are included in the calculation of EROI (Df). In parallel, we define I as the sum of indirect inputs into both the energy and food and feed industries.
Fourth, energy can be either imported or exported through the boundaries of a national economy. Each unit of energy that is exchanged through these boundaries has an energy cost of production that should be accounted for in an EROI calculation. Therefore, the energy inputs associated with the net imported energy constitute an additional input in the calculation of our EROI measure (M).
All flows shown in Figure 2 represent the energy aggregates of different sources and processes at a national level. To compute such energy aggregates, we adopt the exergy metric to consider their differences in terms of quality. In fact, in the EROI literature, it is widely recognised that this aggregation should reflect the qualitative differences between energy vectors [39]. The most common way to consider energy quality differences is to make use of economic indices based on relative prices such as the Divisia aggregation index [3,4,40]. Another possibility regards the physical correction of different energy flows by considering their qualitative differences in terms of emergy or exergy. The former has been recently adopted by Chen et al. [41] by defining an EmROI, where environmental impact and labour are accounted for through an emergy measure.
Exergy has been used to aggregate different energy flows for EROI calculations at the technological level by Cleveland and Herendeen [42] by multiplying the EROI estimated for solar parabolic collectors by a Carnot (thermodynamic heat conversion loss) factor. Nevertheless, this thermodynamic correction has usually been disregarded in more comprehensive studies because accounting for the energy quality of a source by, for example, quantifying the exergy content of the implied energy flows, does not allow, in principle, to consider other factors such as transportability, density, cleanliness, cost of conversion, etc. [3]. On the other hand, we are interested in having a thermodynamically-consistent way of aggregating different energy flows, while the other factors influencing the quality of a source are intrinsically included in the framework of our calculations, since we considered energy at the useful stage and for a national scope.
The line of research studying the role of useful exergy in economic growth–opened by Ayres and Warr [32,43,44]—offers a further argument for adopting an exergy metric to measure energy flows at the useful stage. Indeed, these authors theorised that useful exergy is an explanatory factor of economic growth. They showed that in the short-run, an increment of exergy input can be sufficient to stimulate output growth [33]. The explicit utilisation of useful exergy as a factor of production was studied by Warr et al. [45] and Santos et al. [34], with the latter showing that plausible aggregate production functions are found only when capital and labour are quality adjusted and energy is measured at the useful stage through the exergy metric. More recently, Santos et al. [46] found that the residual total factor productivity (TFP) of Portugal can be fully explained by aggregate final-to-useful exergy efficiency and Sakai et al. [47] showed how the thermodynamic efficiency gains obtained in the conversion of final energy into useful exergy, contributed 25% of economic growth of UK between 1973 and 2013.
Finally, we stress that this paper focuses on the relevance for society of the overall efficiency of the aggregate of all energy transformation processes, without distinguishing between different energy sector structures. Indeed, the increasing share of distributed energy resources is modifying the unidirectional conventional structure of the energy sector, where a centralised production system serves a decentralised community of consumers. Advanced information and communication technologies such as blockchain may allow for the management of a new energy market where a multidirectional trading of energy takes place, and renewable energy sources are more efficiently exploited [48,49].
These radical changes can lead to direct energy savings and thus influence EROI, mostly through the creation of a stronger connection between the useful stage, which is the wider boundary of this study, and energy services, which constitute the last stage of the energy conversion chain. However, we highlight the fact that the direct energy savings that a change in the structure of energy provision could ensure may come with an increasing use of indirect energy (such as the energy spent to build the capital required by distributed energy resources). Therefore, from an EROI perspective, it is clear that broad system boundaries must be considered, but it is mostly uncertain whether the overall efficiency of energy activities will actually increase.
3. Materials and Methods
The basic definition of societal EROI, given by Hall et al. [1], represents the ratio of the total energy content of all fuels delivered to a society versus the overall energy used to produce these fuels. Therefore, a societal EROI, whether measured at the primary, final, or useful stage of the energy conversion chain, determines how much energy is effectively available for society, considering all types of energy sources. Mathematically, at the primary stage and without considering capital, we have:
where Pgross [TJ] is the gross primary energy exiting the extractive sector; De,EXT [TJ] represents the energy industry’s own uses (direct energy used for extraction); and Ie,EXT [TJ] is the sum of indirect energy inputs (i.e., the energy embodied in the products coming from the rest of the economy that are used in the extraction sectors). Similarly, at the final stage, we have:
where Fgross [TJ] is the gross final energy exiting the energy sector; De [TJ] represents the energy industry’s own uses (direct energy for extraction and transformation); and Ie [TJ] is the sum of indirect inputs used in the extraction and transformation sectors.
By gradually adding the novel features of our study (Figure 2b), we mathematically define the extended-societal EROI at the useful stage:
where Ugross [TJ] is the gross useful energy provided by the extended energy sector; D [TJ] represents the sum of energy industry’s own uses (direct energy for extraction and transformation De) and the direct consumption of the food and feed sectors (Df); I [TJ] is the sum of indirect inputs related to both the energy (Ie) and the food and feed sectors (If); K [TJ] is the annual contribution of energy embodied in energy converting capital; and the last factor of the denominator, M [TJ], represents the cost related to traded energy (i.e., net imports). All energy flows are measured through the exergy metric, as discussed in Section 2.
The direct uses of energy are directly obtained from the IEA accounting framework, by considering, in our case, the consumption of the energy industry, the agriculture and the food processing sector as own uses of the extended energy sector. To evaluate indirect inputs, we consider them as proportional to direct consumption. Based on the findings of Brockway et al. [9] on the relative size of direct and indirect inputs in fossil fuel production and refining, we assume I is equal to 30% of total direct inputs.
All the flows and stocks described above have been defined in terms of physical energy. In our EROI calculations, we consider as investment inputs the energy embodied in any physical capital used for energy conversion. Because of the lack of data for a broad scope such as a national economy, some assumptions have been made to quantify this kind of input. The approach here adopted consists of expressing monetary values of investment in energy terms () using suitable energy intensities. Therefore, for each period t:
where [M€] represents the capital investment in the extended energy sector in monetary terms and UIt [TJ/M€] is the useful energy intensity. is found through the reclassification of expenditure based on the work of Santos et al. [36] (see further ahead in this section). For example, items that are economically considered as final consumption goods, such as cars, were reclassified as investment in the extended energy sector since we consider them as end-use devices used in the final-to-useful energy conversion.
The choice of the most appropriate intensity is not trivial and radically influences the results. We test different assumptions by defining four different useful energy intensities according to the level of sectoral disaggregation: (a) the economy as a whole; (b) the industry sector; (c) the manufacturing sector; (d) a few selected subsectors related to machinery production. Since the type of capital that is used in the extended energy sector is mainly constituted by machines (manufactured products such as, for example, textiles, paper, wood, are generally not involved in their production), we define an original classification of gross value added (GVA) according to the subsectors that are directly or indirectly involved in machinery production. The adopted subsector classification is provided in Table 1.
With this procedure, we can estimate the energy embodied in any energy converting machine. In our framework, we also considered living beings as machines that transform the final energy stored in food and feed into muscle work (useful energy). However, it is hard to estimate which part of the final energy is transformed into useful energy and which is embodied in the capital (living being) in order to maintain its function. Nevertheless, considering the slow variation in population, we can interpret the process of embodiment of energy into living beings as almost steady state and thus, although we did not explicitly compute which part of energy constitutes a capital investment, this should not significantly affect our results.
The physical capital considered as indirect energy contribution to the extended energy sector includes primary-to-final conversion machines as well as end-use devices (e.g., motor vehicles, electrical appliances, etc.). According to the definition of the extended energy sectors developed by Santos et al. [36], we reclassify the final consumption of households and government and the gross fixed capital formation (GFCF) in four categories: capital invested in the extended energy sector (IE); capital invested in non-energy activities (INE); consumption in the non-energy sector (CNE); and direct consumption of energy (CE).
In the present work, we are interested in the IE. Some expenditures conventionally classified as the final consumption of the households or the government sector are reclassified as investments in the extended energy sector since they constitute devices that are implied in the conversion of energy (i.e., personal cars, house appliances, medical appliances, ICTs, etc.). Table A1, Table A2 and Table A3 in Appendix A report in detail the reclassification for each type of expenditure.
The factor related to traded energy (M) reflects the difference between the hidden energy cost of imported energy sources and the one related to exported energy products. For example, one unit of refined oil produced abroad can be bought and consumed by the country under analysis. Nevertheless, if no cost is associated to that unit of oil, since it does not appear in the energy industry’s own uses of the studied country, we would underestimate the physical inputs needed to gather that energy. On the other hand, the costs related to the production of exported energy must be discounted in a national EROI calculation. Since the benefits of the exported energy are not exploited in terms of energy services in the studied country, we consider the exported energy products as tradable goods produced by the rest of the economy.
To consider the costs associated with traded energy, we first assume that this value is a net measure given by the algebraic sum of the cost related to imported sources (positive) and the one relative to the exported ones (negative):
where MMP [TJ] and MEP [TJ] represent, respectively, the inputs related to the total imported and exported energy goods.
Therefore, for a mainly exporting economy, this factor would likely assume negative values. Second, we evaluate the costs associated with imported sources by using a world average value, while the exported refined energy products were computed considering the cost of production in the country under analysis (in our case, Portugal).
Regarding imports, we consider a hybrid EROI of extraction, or processing in the case of secondary fuels, of oil, gas, and carbon production for the world. We follow an analogous method to that of Brockway et al. [9], and create two hybrid EROI ratios for the extraction and refining of world fossil energy sources, respectively:
where PW,j represents the world production of primary fuel j; TW,j,e is the world use of primary fossil fuel j in the extractive sector e; FW,i,e is the final energy used in the world extraction sectors disaggregated by type of energy vector i; RW,k is the world output of the transformation industry of the secondary fossil fuel k; TW,k,r is the world use of secondary fuel k in the extractive or refinery sector r; and FW,i,r is the final energy used in the world extraction and refinery sectors r disaggregated per type of energy vector i. All flows are measured in TJ and converted to exergy from the original data (energy) by multiplying through an appropriate exergy factor.
Then, it is possible to evaluate the direct costs associated with imported fuels, which are either extracted or refined, as follows:
where PMP [TJ] represents the net imports of primary fuels and SMP [TJ] represents the net imports of secondary fuels. As noticeable, DMP is expressed in terms of final energy [TJ]. Therefore, since in the calculation of the useful stage EROI we need a cost in terms of useful energy, we apply the final-to-useful energy efficiency of the importing country (Portugal, in our case study). This assumption is coherent with our framework since the final-to-useful conversion of any energy good, imported or not, takes place within the physical boundary of the system under study.
Finally, assuming again that indirect inputs are approximately 30% of the direct inputs, we can evaluate the total inputs related to imports:
Regarding exports, we similarly define a hybrid EROI for Portugal as follows:
where each factor is analogous to those of Equation (7), but for Portugal. Unlike EROIREF,W, the refinery sector was the only one included as cost: extraction was excluded because fuels refined in Portugal are not extracted there. Finally, following the procedure presented above, analogously to Equations (8) and (9), we compute DEP [TJ], which is the direct cost associated to exported secondary fuels and, then, MEP [TJ]. Time series of EROIEXT,W, EROIREF,W and EROIREF,P as well as DMP, DEP, MMP and MEP are provided in the Supplementary Materials.
Although the EROI was first defined as an energy ratio, the aim of estimating a societal EROI is to depict its annual evolution, turning it into a power ratio. Nevertheless, when a calculation is made at the national level, it is difficult to consider all the energy inputs and their relative outputs at the time period in which they occur since energy statistics are available in an aggregate form and on an annual basis. This is the main issue related to the inclusion of the input factor K of Equation (3). Indeed, if we assumed yearly investments in evaluating EROI, it would imply a disconnection between the timing of capital investment and the exergy returns obtained in the following years through the exploitation of that capital.
At a project level, a life cycle approach can be adopted to overcome this issue. However, this is difficult to implement for the whole energy system. Court [2] considered the length of each period equal to the assumed average capital lifetime (20 years), turning the power ratios defined for computing EROI into energy ratios. However, this approach was not suitable for the time range and the level of detail considered in the present study. Still, even in the absence of specific information regarding the timing of the investment and returns, the validity of the obtained results is maintained if the energy system is in a steady state and long-term trends of EROI are identifiable [28].
Since we focus on a period of radical energy and economic transitions, we tackle this issue, similarly to Dupont et al. [31], by interpreting K as capital services and calculating it based on the depreciation of capital. Each type of capital invested in the extended energy sector provides equal annual contributions until it reaches the end of its life and is retired from use. In other words, the embodied energy of the investment in a certain type of asset is uniformly distributed along its service life.
We first evaluate the annual investment of each period t in terms of its embodied energy, as stated in Equation (4), by adding a further level of disaggregation according to each type of asset i = 1, …, n:
Considering the availability of data, a unique aggregate useful energy intensity is employed for all types of assets used in the extended energy sector.
Then, for each type of asset, a specific average lifetime Li [years] is set (see further ahead in this section). For each period t, the amount of energy embodied in physical capital, which represents the useful energy cost of capital services in that same period, is:
According to our procedure, the embodied energy of the investments made before the first year of the considered time range (1960) will still have a (decreasing) contribution to energy returns during the first years of the series, depending on the lifetime of the assets. Therefore, some assumptions must be made to consider these contributions. In the absence of more detailed data per type of asset, we consider the investment of the previous 10 years as a whole, setting an average lifetime of 10 years for all of the assets produced before 1960. Thus, being the first year of our series t0, we look at investments occurring since period t0–10. We compute the annual investments of the years before t0 by applying an average long-run annual growth rate θ. Mathematically:
Each investment is converted into its related embodied energy through the same procedure in Equation (11).
We choose Portugal as a case study to have access to detailed economic and energy data available from 1960 to 2014, thus spanning a longer time range than those generally adopted. The energy data, which are collected at the final stage from IEA, are transformed into exergy and evaluated at the useful stage following the method in Serrenho et al. [35]. While the final exergy data and final-to-useful exergy efficiencies are mainly taken from [35] until 2009, the data between 2009 and 2014 are obtained from Felício [52]. Data on muscle work were already included in the mentioned databases. Data on the industrial consumption of combustible renewables (i.e., firewood) were taken from IEA and allocated to the various industrial sectors according to the assumptions made by Henriques [53]. Data on the residential consumption of combustible renewables were taken from Felício et al. [54].
The definition of direct inputs given in the present study is consistent with the IEA data on energy industry own uses (EIOU) including both the energy used by power plants and the energy consumed by the energy extractive sector. Moreover, the overall consumption of the agriculture and food sectors is considered as the energy industry’s own uses when muscle work is included in the calculations.
The series for monetary investments in the extended energy sector by type of asset for the Portuguese economy between 1960 and 2014 are based on the work of Santos et al. [36] and built according to the reclassification previously described. The economic data are first taken from the AMECO database [55] and then derived from the Banco de Portugal database [56] since they provided more detailed statistics on previous year price volume estimates for the first part of the period under study (1960–1995). From 1995 to 2014, previous year prices volume series are taken from the OECD database [57].
In order to find the embodied energy of the physical capital, both the monetary series of expenditure and the useful energy intensities are computed for each year at previous year prices. By doing so, we eliminate the effect of inflation and obtain a better estimate of the volume of capital produced in each year. Since both the multiplying factors of the energy embodied in physical capital are found using as base year the previous one, the consistency of the derived energy series is maintained. With this method, we avoid the main drawback of chain linked series: non-additivity.
Regarding investment, in our calculations, we consider the five main types of assets listed in Table 2: machinery, transport equipment, other investments, investments reclassified from households, and investments reclassified from government. Time series of aggregate investment in the extended energy sector is provided in the Supplementary Materials file both at constant 2010 prices and previous years prices. Time series of the investment per type of asset and the useful exergy intensity of the machinery production sector are provided at previous year prices.
The average service life of each asset, when available, is taken from da Silva and Lains [58], which adopted these values for the calculation of the depreciation rates required for computing the capital services for Portugal. They defined these average lifetimes for the period 1960–2011 after conducting a meta-analysis of previous historical studies. However, as previously mentioned, the last two categories of assets considered in our study embrace a wide range of products. Therefore, in the absence of disaggregated data of each investment, for these two types of assets, we consider an average lifetime of 10 years (as the one used for the category “Other Investments” in [58]).
To establish the annual growth rate of investments required in Equation (13), the simplest assumption could be setting it as equal to the growth rate of volume GDP [59]. According to Pereira and Lains [60], the trend growth of GDP in the period 1950–1960 is between 4% and 5%. Rocha [61] estimated the average annual growth of GDP at constant prices between 1954 and 1960 to be equal to 4.3%. Therefore, this last value is used in our calculations. Finally, the useful energy intensities related to the periods prior to the time range under study are all set equal to the useful energy intensity of 1960.
4. Results
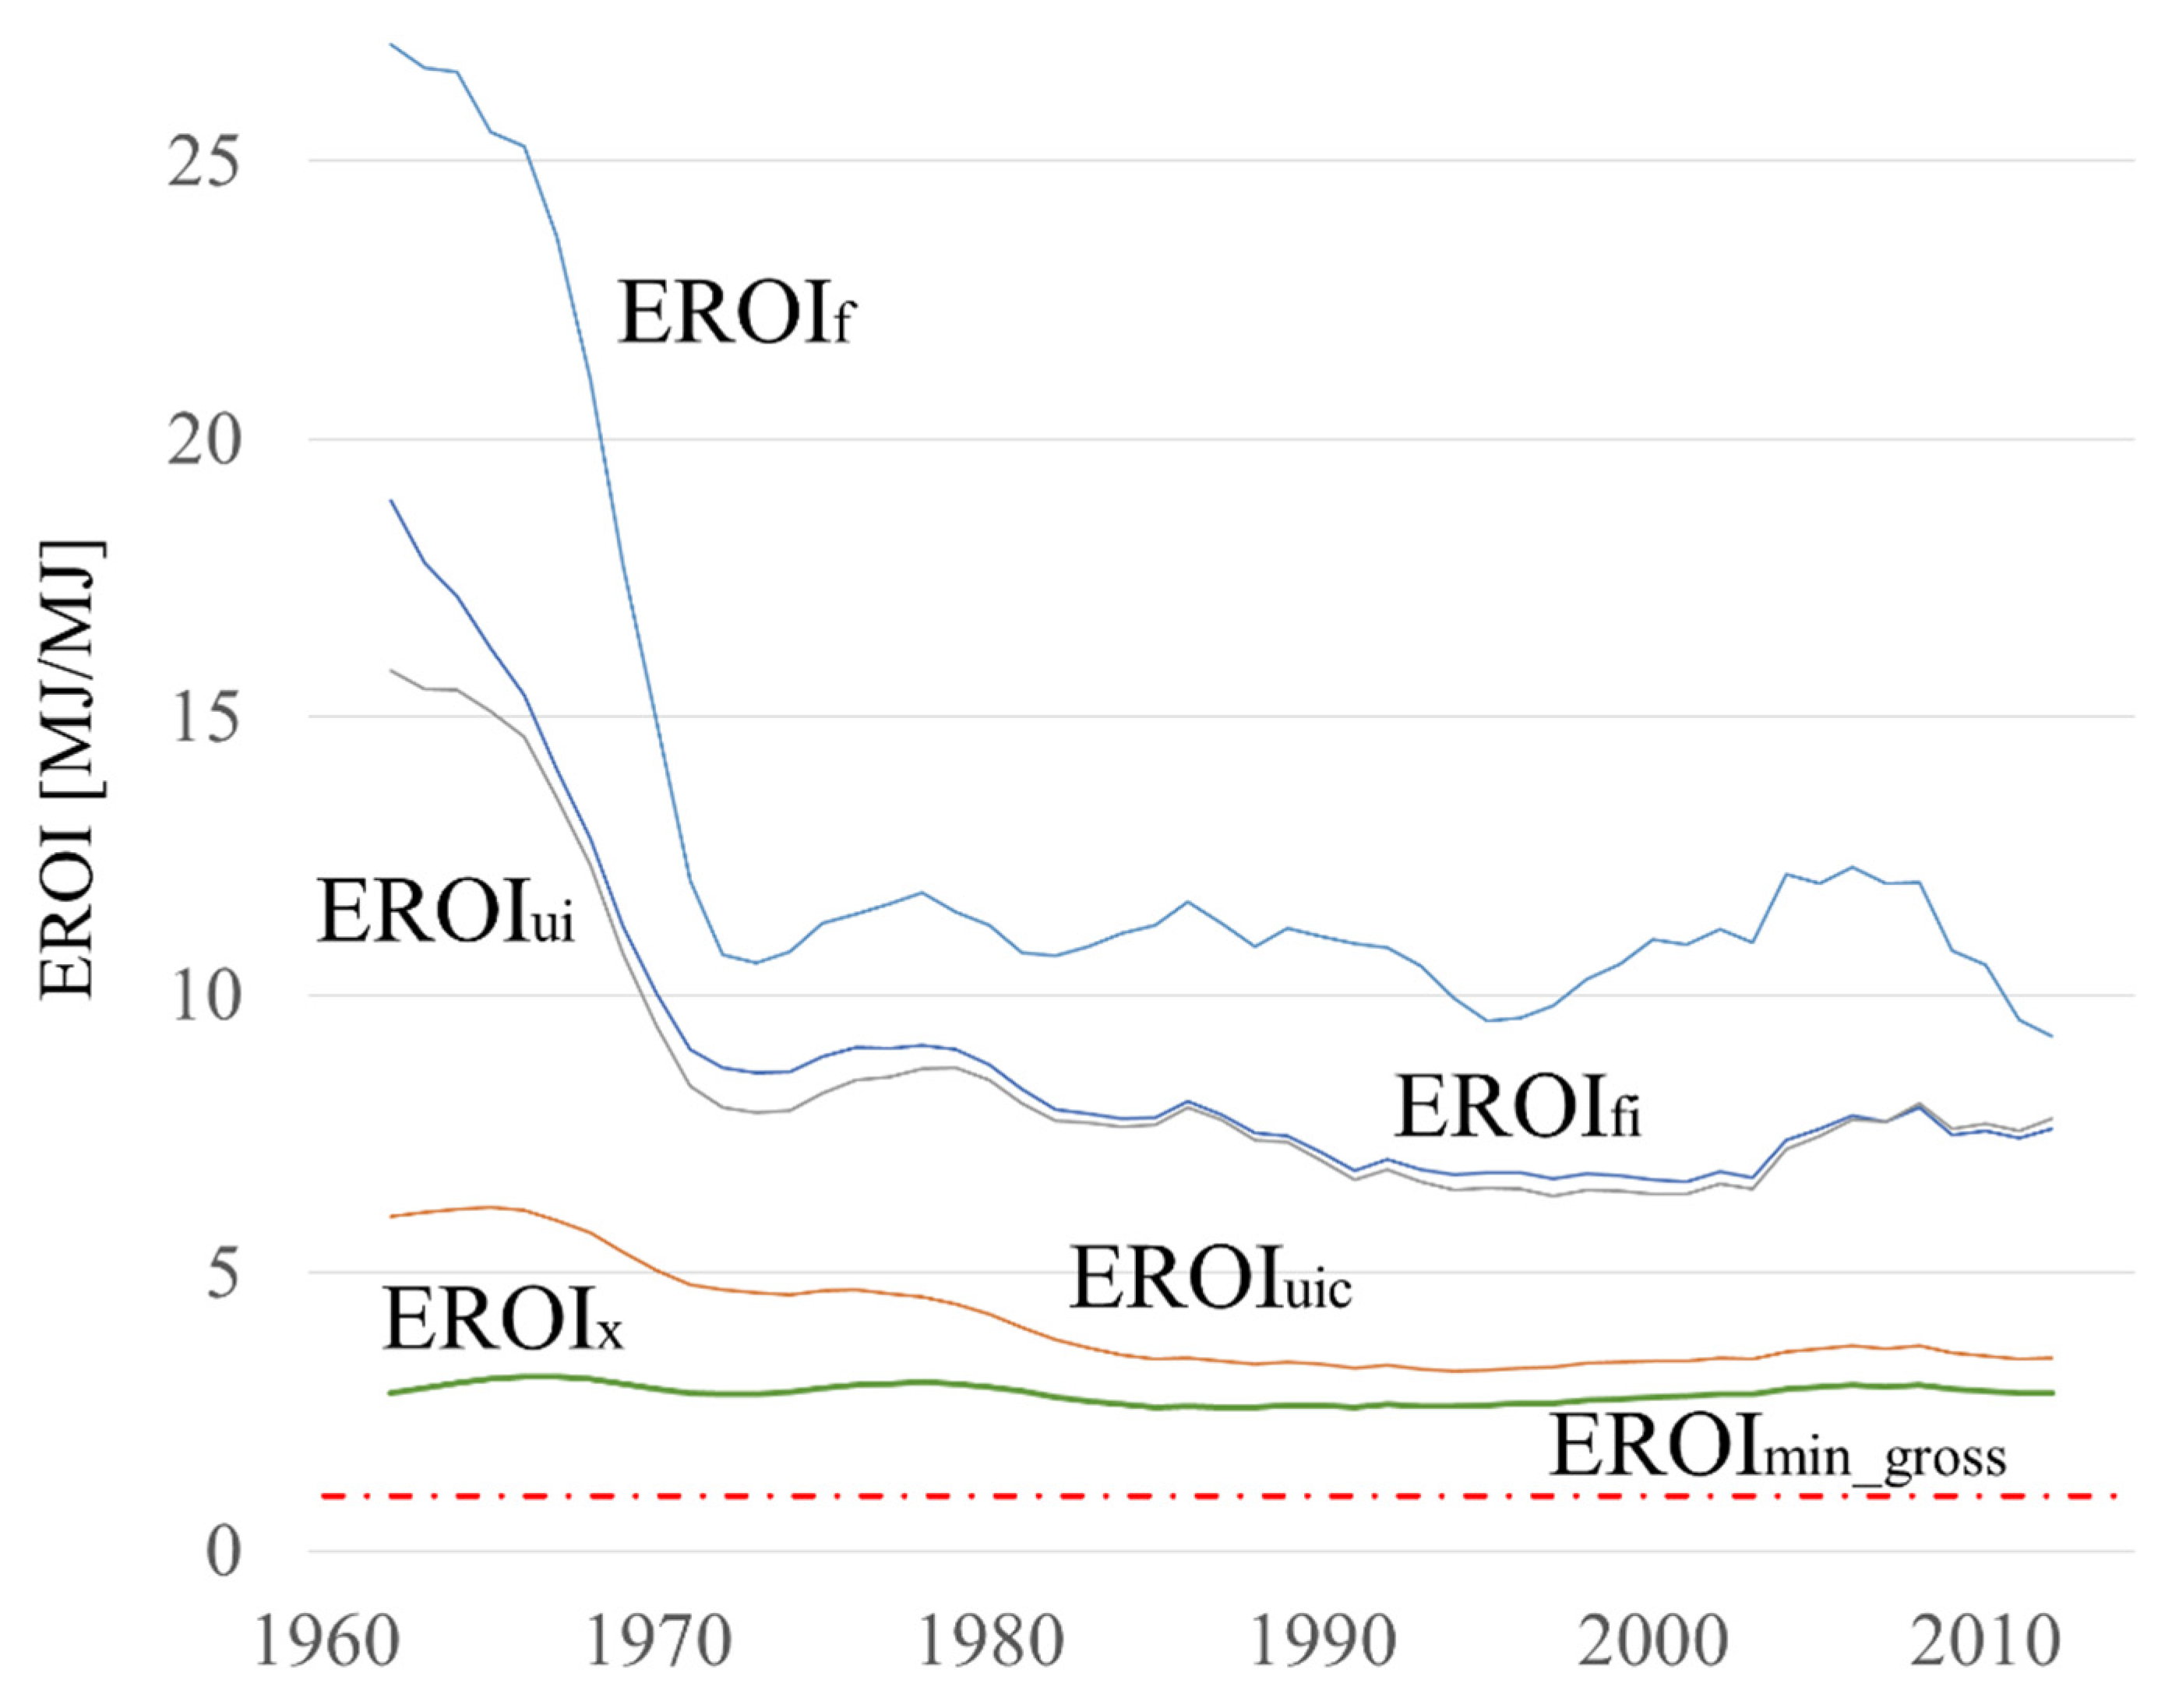
Our results highlight two key findings. First, compared to most of the literature, we obtain a much lower absolute value of societal EROI (EROIx), at around 3 (Figure 3).
This is mostly due to the comprehensive approach we take, which extends the existing boundaries (from the final to useful stage), whereby we include the capital and the useful stage in our calculations. By considering as inputs all the energy used to build any kind of capital involved in energy conversion including all end-use devices, we extend the concept of the energy sector to a whole category of capital that is seen as an unavoidable cost for using energy itself, instead of a discretionary use of a certain energy output.
Second, we find that the societal EROI value is very stable over the entire time period under study. Since Portugal has gone through different economic phases in the same period, such as fast economic growth and capital accumulation during industrialisation (1960–1973), services transition (from 1970s), stagnation (late 1990s–2007), and recession (2008–2014), this stability of the societal EROI suggests an independence of the EROI from economic growth. Figure 4 shows (a) the evolution of EROIx along time and (b) the shares of energy inputs appearing in the denominator of Equation (3). Investment inputs include the energy embodied in energy converting machines while indirect inputs are the yearly inputs from other industries. Direct inputs are split into the energy industry’s own uses (EIOU as defined by IEA) and the direct inputs of the food and feed industry. The costs related to energy trade are not shown in Figure 4b since they can be either positive or negative and affect the absolute value of EROI, rather than the relative size of the other inputs.
This stability is mainly induced by the combined effects of the inclusion of muscle work and the investment inputs up to the useful stage in the calculation of the EROI. Focusing on the energy inputs (Figure 4b), we can identify the main structural changes of the energy sector: first, the energy system has gradually shifted from being based on muscle work exploitation and hydroelectricity to fossil fuel utilisation through an increase in direct consumption in the conventional energy sector at the end of the 1960s. Furthermore, the investment in energy converting machines has strongly replaced living beings (oxen, horses, and humans), being nowadays the key factor in energy costs.
5. Discussion
Figure 3 shows the cumulative effects of the corrections that we introduce in the calculation of the societal EROI, starting from the calculation of EROIf (Equation (2)) and gradually adding all the terms in the definition of EROIx (Equation (3)).
We find five key discussion points. First, we observe in Figure 3 that a conventional calculation of societal EROI at the final stage (EROIf) shows a clear decline during the whole time period (full time series of inputs and outputs for EROIf calculation are provided in the Supplementary Materials file). The decrease in EROI from over 27 to a value around 10 takes place mostly during the first decade. We explain this effect by considering that the Portuguese energy system at the beginning of the period was mainly based on traditional energy sources (such as food and feed and firewood) and hydroelectricity, which has a very high EROIf. The latter source is based on a heavy initial energy investment that does not require a running energy cost during its lifetime. Moreover, during the first decade, Portugal switched to focus on the exploitation of hydrocarbons to produce thermoelectricity (especially fuel oil) [53], which showed considerably lower EROI compared to hydroelectricity. The production chain of this kind of source mainly requires direct annual energy inputs to be run. Since direct inputs were considered in the conventional final stage EROI calculation, the energy transition that Portugal faced during the 1960s is reflected by a strong decrease in societal EROIf (where muscle work contribution is not considered). It is worth noting that after 1970, Portugal did not face such strong changes in the structure of its energy system considered up to the final stage, leading to a more stable value of EROIf, oscillating around 10.
Second, by applying the first correction to the definition of EROIf (introducing the factor M), we observe the importance of including the energy costs related to imported fuels: the final stage EROIfi is significantly lower in terms of absolute values compared to the case where domestic boundaries are considered (EROIf). This is because Portugal has always been a net importer of fossil fuels. The total energy cost required to make the imported sources available for consumption (during the extraction and refinery processes) overcomes the total discount we apply regarding the secondary fuels that are exported and for which we subtract the energy cost that was paid in Portugal. Indeed, the exported fuels are not exploited as energy sources by the Portuguese economy and thus their cost must not be considered among those costs related to the energy consumed in Portugal.
Third, we define the EROIui by enlarging the boundaries up to the useful stage and thus including the final-to-useful conversion efficiency. We notice how EROIui is just slightly lower than EROIfi. This is because the conversion processes taking place in the economy, in general, have lower final-to-useful conversion efficiencies compared to those in the energy sector as conventionally defined. Therefore, by considering Equation (2), it is clear how the direct inputs in the denominator will be expressed in terms of useful energy through a final-to-useful energy efficiency, which is higher than the aggregate one appearing in the numerator.
Fourth, when capital investment is considered by including the energy embodied in energy converting machines, the EROI absolute values decrease substantially, with the EROIuic being around half of the EROIui along the whole considered period. We observe that, compared to the calculation of EROIf based on Equation (2), the decrease in EROI during the first decade is much smaller. This is because the way the EROIf is calculated implies a neglect of the energy costs related to the energy embodied in the physical capital and, thus, since the costs of hydroelectricity are mainly capital costs, the initial value of the EROIf in 1960 was “too high”; moreover, by considering all capital in the calculation of the EROIuic, the role of direct contributions was less predominant, making the transition to fossil fuels less heavy in terms of the change in total energy cost between 1960 and 1970. In other words, although at the final stage a relevant decrease in the EROI may have occurred as a result of the transition from hydroelectricity to fossil fuels, considering the whole energy chain, this effect has been offset by the introduction of more efficient capital. Moreover, we can see now how the value of the EROI was much closer to the physical limit of one (for gross ratios, the ones here calculated).
Finally, we present the most comprehensive gross societal ratio, EROIx: now, food and feed are also considered as energy sources and muscle work as the useful energy available for the rest of the economy (see Figure 2). By adding this last correction, we obtain a stable value over time. Comparing the EROIuic with EROIx (Figure 3), we note how EROIx remained stable. This stability is due to the fact that muscle work (with low associated EROI) had a predominant role in that early period. Therefore, the societal EROI of the 1960s appeared much lower relative to the value reached when fossil fuels had already taken a central role during the 1970s, compared to the case where we did not account for the muscle work. To better visualise the difference arising from the definition and interpretation of the different EROI measures shown in Figure 3, we summarise in Table 3 the shares of the inputs and outputs (denominator and numerator of the EROI) and their absolute values for each of them.
Through our novel extended-societal EROI measured at the useful stage, we show how the production of new energy converting capital has been able to ensure increased final-to-useful efficiencies at similar, or lower, unit energy cost, offsetting the effects of shifting the energy mix among the various energy sources that present different EROI at the final stage.
In the context of a transition to renewables, we advocate that the focus of EROI research and empirical work should move to the useful stage, at least at the societal level. Up to now, much research has been conducted on whether or not renewable sources can provide the final energy at an EROI comparable with that of non-renewable ones. However, our analysis demonstrates how a certain EROI at the final stage can be meaningless if it is not associated with the overall capability of the energy system of providing useful energy. This capability is strictly connected to the energy that has to be spent to produce energy converting capital and the final-to-useful efficiency, which this new capital can ensure. From this perspective, the current increasing electrification of the energy system may have an overall positive feedback on EROI by inducing the appearance of more efficient energy converting capital at the final-to-useful stage. In the future transition to renewables, this capital will thus constitute the crucial factor in maintaining the societal EROI above the minimum thresholds.
All of the above findings suggest that independently of the economic or energy transition taking place, the amount of energy returns available to society in relation to the required energy investments and costs vary around a stable value instead of decreasing as is often suggested in the literature. This leads to two insights. On one hand, it may mean that future economic growth, thanks to technical efficiency improvements, may be combined with stable energy returns and thus will not have to compensate for and face the effects of a decreasing societal EROI. On the other hand, it may mean that any technical improvement does not seems to be enough to increase the overall efficiency of the energy gathering activities (EROI), if considered up to the useful stage. Thus, future economic growth can only rely on an increase in the exploitation of resources.
These last insights suggest that the focus should shift to the provision of energy services, looking for strategies to save resources beyond the useful stage of the energy conversion stage. Indeed, through a tight coupling of the type of the obtained useful energy and the service we wish to provide, energy and material savings are still possible. Policies based on capital sharing, the minimisation of energy conversion stages, and the use of local sources would meet that aim.
Thus, to build effective policies, comparative studies on different solutions devoted to rationalising energy use (i.e., sharing, recycling, etc.) must be carried out with the inclusion of energy services. In this field, Ivanova et al. [62] showed how by following certain consumption options in the domains of food, housing, transport, and other consumptions, high mitigation potentials can be met. Moreover, Creutzig et al. [63] demonstrated that demand side mitigation options, categorised in the literature as avoid, shift, and improve, had a high mitigation potential that is synergistic with well-being. In the field of energy returns, the environmental measures of EROI including the energy investments required to mitigate detrimental environmental effects might be of interest in order to provide a wider view on which technological solutions are actually preferable.
6. Conclusions
The declining EROI of fossil energy sources and the relatively low EROI of renewable energy sources have raised concerns about the future development of society from the perspective of a renewable transition. Here, we first set out that the scope of EROI research must be widened to the societal level, considering all the energy extraction and conversion processes taking place in a given economy. We address five main issues in the societal EROI calculation by taking into consideration: (1) the useful stage of the energy conversion chain; (2) the muscle work provided by human and draught animals; (3) all the energy converting capital; (4) the effect of the energy trade; and (5) applying this method to an economy that provides a sufficiently long-time range of analysis. In this way, various energy and economic transitions are analysed.
We apply the newly developed comprehensive societal EROI method to Portugal between 1960 and 2014. Two key findings are identified. First, our most comprehensive societal EROI measure, named EROIx, shows a value around 3, which is much lower than the ones currently found in the literature. This is mostly due to the extension of the boundaries from the final to the useful stage and the fact that we include all kinds of capital investments in our calculations. Second, the stability of our EROI measure suggests an independence from economic growth since Portugal has passed through different economic phases in the considered time period. This result is obtained by considering all of the energy flows related to muscle work including food and feed as energy carriers.
These two findings, compared with more conventional societal EROI measures (i.e., at the final stage and without the additional components considered here), are novel and shed light on the importance of conducting a more comprehensive societal analysis. Indeed, while the final stage EROI declined considerably in the time range considered, measuring it at the useful stage with all of the introduced improvements provides a very different picture of the historical path of energy use in Portugal. Our results show how the production of new energy-converting capital, together with increasing final-to-useful efficiencies, compensates for the effect of variable EROIs of different energy sources at the final stage. From this perspective, the current increasing electrification of the energy system may have an overall positive feedback on EROI.
These considerations lead to important policy implications. If final-to-useful efficiency can increase, in order to maintain a stable value of EROI (as demonstrated by our results), the focus can then shift to provision of energy services, thereby looking for strategies for saving resources without causing a decrease of EROI or a reduction of services themselves. Indeed, through a tight coupling of the type of the obtained useful energy and the service we wish to provide, energy and material savings are still possible. Policies based on capital sharing, the minimisation of energy conversion stages and the use of local sources would meet that aim.
Thus, in order to build effective policies, comparative studies on different solutions devoted to rationalising energy use (i.e., sharing, recycling, etc.) must be carried out with the inclusion of energy services. Moreover, environmental measures of EROI including the energy investments required to mitigate detrimental environmental effects might be of interest, in order to provide a wider view in which technological solutions are actually preferable.
A limitation of our study is that it was carried out for a single country, and so the results could be affected by specificities in the historical development of Portugal. The impossibility of associating any energy flow related to the production of energy converting capital to its specific energy source narrowed the scope of this study. While an overall value for the efficiency of energy production and use could be provided, its connection to every specific energy source was lost.
In compensation, this paper, by testing the different assumptions during the calculation process, ensures quite robust results and it is the first to advance the EROI methodology to include capital at the useful stage, the role of muscle work, and the influence of imported and exported energy. Therefore, future research should first focus on broadening such calculations to a wider pool of countries.
Supplementary Materials
The following supporting information can be downloaded at: https://0-www-mdpi-com.brum.beds.ac.uk/article/10.3390/en15103549/s1, Table S1: Calculation of the gross ratio of EROIf from inputs and outputs, Table S2: Calculation of gross ratio of EROIx from inputs and outputs, Table S3: Monetary data on Investment in the Energy sector and useful energy intensity (in terms of exergy) of the Machinery production sector, Table S4: Calculation of the effect of energy imports and exports on EROI. EROI of imported primary and imported and exported secondary fuels is provided. Table S5: Classification of primary and secondary fuels according to IEA used for calculation of the effect of imports and exports of energy on EROI.
Author Contributions
M.V.E., J.S., P.E.B. and T.D. co-designed the study and wrote the paper. M.V.E. and J.S. performed the extended energy sector and extended-societal EROI calculations. P.E.B. and T.D. checked and verified the energy analysis calculations. All authors have read and agreed to the published version of the manuscript.
Funding
This work was funded by the FCT/MCTES (PIDDAC) through project LARSyS—FCT Pluriannual funding 2020–2023 (UIDB/50009/2020). M.V.E’s work is supported by the Fundação para a Ciência e Tecnologia (FCT) through the PhD Studentship contract PD/BD/128168/2016, attributed under the MIT Portugal Sustainable Energy Systems doctoral program. We acknowledge support for P.E.B. under EPSRC Fellowship award EP/R024251/1, J.S.’ work is supported by Instituto Superior Técnico, University of Lisbon, under project DIADES–EAPA_18/2018.
Institutional Review Board Statement
Not applicable.
Informed Consent Statement
Not applicable.
Data Availability Statement
The IEA data used for energy calculations about imports and exports (World Energy Extended Balances 2018) is not publicly available; the user needs to access IEA data through a valid license. Economic data from AMECO, BP and OECD are all freely available on-line.
Conflicts of Interest
The authors declare no conflict of interest. The funders had no role in the design of the study; in the collection, analyses, or interpretation of data; in the writing of the manuscript, or in the decision to publish the results.
Appendix A

Table A1.
Reclassification of the final consumption of households (COICOP). (Adapted from [36]).
Table A1.
Reclassification of the final consumption of households (COICOP). (Adapted from [36]).
| Divisions | Groups | Class | ||||
|---|---|---|---|---|---|---|
| Code | Definition | Code | Definition | CNE | CE | IE |
| 01 | Food and non-alcoholic beverages | 01.1 | Food | 100% | ||
| 01.2 | Non-alcoholic beverages | 100% | ||||
| 02 | Alcoholic beverages, tobacco, and narcotics | 02.1 | Alcoholic beverages | 100% | ||
| 02.2 | Tobacco | 100% | ||||
| 02.3 | Narcotics | 100% | ||||
| 03 | Clothing and footwear | 03.1 | Clothing | 100% | ||
| 03.2 | Footwear | 100% | ||||
| 04 | Housing, water, electricity, gas, and other fuels | 04.1 | Actual rental for housing | 100% | ||
| 04.2 | Imputed rental for housing | 100% | ||||
| 04.3 | Maintenance and repair of the dwelling | 100% | ||||
| 04.4 | Water supply and miscellaneous services relating to the dwelling | 100% | ||||
| 04.5 | Electricity, gas and other fuels | 100% | ||||
| 05 | Furnishings, household equipment and routine household maintenance | 05.1 | Furniture and furnishings, carpets, and other floor coverings | 50% | 50% | |
| 05.2 | Household textiles | 100% | ||||
| 05.3 | Household appliances | 50% | 50% | |||
| 05.4 | Glassware, tableware and household utensils | 100% | ||||
| 05.5 | Tools and equipment for house and garden | 50% | 50% | |||
| 05.6 | Goods and services for routine household maintenance | 100% | ||||
| 06 | Health | 06.1 | Medical products, appliances, and equipment | 50% | 50% | |
| 06.2 | Outpatient services | 100% | ||||
| 06.3 | Hospital services | 100% | ||||
| 07 | Transport | 07.1 | Purchase of vehicles | 100% | ||
| 07.2 | Operation of personal transport equipment | 100% | ||||
| 07.3 | Transport services | 100% | ||||
| 08 | Communication | 08.1 | Postal services | 100% | ||
| 08.2 | Telephone and telefax equipment | 100% | ||||
| 08.3 | Telephone and telefax services | 100% | ||||
| 09 | Recreation and culture | 09.1 | Audio-visual, photographic, and information processing equipment | 50% | 50% | |
| 09.2 | Other major durables for recreation and culture | 50% | 50% | |||
| 09.3 | Other recreational items and equipment, gardens, and pets | 100% | ||||
| 09.4 | Recreational and cultural services | 100% | ||||
| 09.5 | Newspapers, books and stationery | 100% | ||||
| 09.6 | Package holidays | 100% | ||||
| 10 | Education | 10.1 | Pre-primary and primary education | 100% | ||
| 10.2 | Secondary education | 100% | ||||
| 10.3 | Post-secondary non-tertiary education | 100% | ||||
| 10.4 | Tertiary education | 100% | ||||
| 10.5 | Education not definable by level | 100% | ||||
| 11 | Restaurants and hotels | 11.1 | Catering services | 100% | ||
| 11.2 | Accommodation services | 100% | ||||
| 12 | Miscellaneous goods and services | 12.1 | Personal care | 50% | 50% | |
| 12.2 | Prostitution | 100% | ||||
| 12.3 | Personal effects N.E.C. | 100% | ||||
| 12.4 | Social protection | 100% | ||||
| 12.5 | Insurance | 100% | ||||
| 12.6 | Financial services N.E.C. | 100% | ||||
| 12.7 | Other services N.E.C. | 100% | ||||
Table A2.
Reclassification of the final consumption of government (COFOG). (Adapted from [36]).
Table A2.
Reclassification of the final consumption of government (COFOG). (Adapted from [36]).
| Divisions | Groups | Class | ||||
|---|---|---|---|---|---|---|
| Code | Definition | Code | Definition | CNE | CE | IE |
| 01 | General public services | 01.1 | Executive and legislative organs, financial and fiscal affairs, external affairs | 100% | ||
| 01.2 | Foreign economic aid | 100% | ||||
| 01.3 | General services | 100% | ||||
| 01.4 | Basic research | 100% | ||||
| 01.5 | R&D general public services | 100% | ||||
| 01.6 | General public services N.E.C. | 100% | ||||
| 01.7 | Public debt transactions | 100% | ||||
| 01.8 | Transfers of a general character between different levels of government | 100% | ||||
| 02 | Defence | 02.1 | Military defence | 100% | ||
| 02.2 | Civil defence | 100% | ||||
| 02.3 | Foreign military aid | 100% | ||||
| 02.4 | R&D defence | 100% | ||||
| 02.5 | Defence N.E.C. | 100% | ||||
| 03 | Public order and safety | 03.1 | Police services | 100% | ||
| 03.2 | Fire-protection services | 100% | ||||
| 03.3 | Law courts | 100% | ||||
| 03.4 | Prisons | 100% | ||||
| 03.5 | R&D public order and safety | 100% | ||||
| 03.6 | Public order and safety N.E.C. | 100% | ||||
| 04 | Economic affairs | 04.1 | General economic, commercial, and labour affairs | 100% | ||
| 04.2 | Agriculture, forestry, fishing, and hunting | 100% | ||||
| 04.3 | Fuel and energy | 100% | ||||
| 04.4 | Mining, manufacturing, and construction | 100% | ||||
| 04.5 | Transport | 50% | 50% | |||
| 04.6 | Communication | 50% | 50% | |||
| 04.7 | Other industries | 100% | ||||
| 04.8 | R&D economic affairs | 100% | ||||
| 04.9 | Economic affairs N.E.C. | 100% | ||||
| 05 | Environmental protection | 05.1 | Waste management | 100% | ||
| 05.2 | Wastewater management | 100% | ||||
| 05.3 | Pollution abatement | 100% | ||||
| 05.4 | Protection of biodiversity and landscape | 100% | ||||
| 05.5 | R&D environmental protection | 100% | ||||
| 05.6 | Environmental protection N.E.C. | 100% | ||||
| 06 | Housing and community amenities | 06.1 | Housing development | 100% | ||
| 06.2 | Community development | 100% | ||||
| 06.3 | Water supply | 100% | ||||
| 06.4 | Street lighting | 50% | 50% | |||
| 06.5 | R&D housing and community amenities | 100% | ||||
| 06.6 | Housing and community amenities N.E.C. | 100% | ||||
| 07 | Health | 07.1 | Medical products, appliances, and equipment | 50% | 50% | |
| 07.2 | Outpatient services | 100% | ||||
| 07.3 | Hospital services | 100% | ||||
| 07.4 | Public health services | 100% | ||||
| 07.5 | R&D Health services | 100% | ||||
| 07.6 | Health N.E.C. | 100% | ||||
| 08 | Recreation culture and religion | 08.1 | Recreational and sporting services | 100% | ||
| 08.2 | Cultural services | 100% | ||||
| 08.3 | Broadcasting and publishing services | 100% | ||||
| 08.4 | Religious and other community services | 100% | ||||
| 08.5 | R&D recreation, culture, and religion | 100% | ||||
| 08.6 | Recreation, culture, and religion N.E.C. | 100% | ||||
| 09 | Education | 09.1 | Pre-primary and primary education | 100% | ||
| 09.2 | Secondary education | 100% | ||||
| 09.3 | Post-secondary non-tertiary education | 100% | ||||
| 09.4 | Tertiary education | 100% | ||||
| 09.5 | Education not definable by level | 100% | ||||
| 09.6 | Subsidiary services to education | 100% | ||||
| 09.7 | R&D education | 100% | ||||
| 09.8 | Education N.E.C. | 100% | ||||
| 10 | Social protection | 10.1 | Sickness and disabilities | 100% | ||
| 10.2 | Old age | 100% | ||||
| 10.3 | Survivors | 100% | ||||
Table A3.
Reclassification of the GFCF. (Adapted from [36]).
Table A3.
Reclassification of the GFCF. (Adapted from [36]).
| Investment Category | Category | IE | INE | |
|---|---|---|---|---|
| GFCF (Gross Fixed Capital Formation) | Total construction | 100% | ||
| Machinery and equipment | Transport | 100% | ||
| Machinery | 50% | 50% | ||
| Other investments | 50% | 50% | ||
References
- Hall, C.A.S.; Balogh, S.; Murphy, D.J.R. What Is the Minimum EROI That a Sustainable Society Must Have? Energies 2009, 2, 25–47. [Google Scholar] [CrossRef]
- Fizaine, F.; Court, V. Energy Expenditure, Economic Growth, and the Minimum EROI of Society. Energy Policy 2016, 95, 172–186. [Google Scholar] [CrossRef]
- Cleveland, C.J. Net Energy from the Extraction of Oil and Gas in the United States. Energy 2005, 30, 769–782. [Google Scholar] [CrossRef]
- Gagnon, N.; Hall, C.A.S.; Brinker, L. A Preliminary Investigation of Energy Return on Investment for Global Oil and Gas Production. Energies 2009, 2, 490–503. [Google Scholar] [CrossRef]
- Grandell, L.; Hall, C.A.S.; Höök, M. Energy Return on Investment for Norwegian Oil and Gas from 1991 to 2008. Sustainability 2011, 3, 2050–2070. [Google Scholar] [CrossRef] [Green Version]
- Court, V.; Fizaine, F. Long-Term Estimates of the Energy-Return-on-Investment (EROI) of Coal, Oil and Gas Global Productions. Ecol. Econ. 2017, 138, 145–159. [Google Scholar] [CrossRef]
- Hall, C.A.S.; Lambert, J.G.; Balogh, S.B. EROI of Different Fuels and the Implications for Society. Energy Policy 2014, 64, 141–152. [Google Scholar] [CrossRef] [Green Version]
- Murphy, D.J. The Implications of the Declining Energy Return on Investment of Oil Production. Phil. Trans. R. Soc. A 2014, 373, 20130126. [Google Scholar] [CrossRef]
- Brockway, P.E.; Owen, A.; Brand-Correa, L.I.; Hardt, L. Estimation of Global Final-Stage Energy-Return-on-Investment for Fossil Fuels with Comparison to Renewable Energy Sources. Nat. Energy 2019, 4, 612–621. [Google Scholar] [CrossRef] [Green Version]
- Raugei, M.; Leccisi, E. A Comprehensive Assessment of the Energy Performance of the Full Range of Electricity Generation Technologies Deployed in the United Kingdom. Energy Policy 2016, 90, 46–59. [Google Scholar] [CrossRef] [Green Version]
- King, L.C.; van der Bergh, J.C.J.M. Implications of Net Energy-Return-on-Investment for a Low-Carbon Energy Transition. Nat. Energy 2018, 3, 334–340. [Google Scholar] [CrossRef] [Green Version]
- Rana, R.L.; Lombardi, M.; Giungato, P.; Tricase, C. Trends in Scientific Literature on Energy Return Ratio of Renewable Energy Sources for Supporting Policymakers. Adm. Sci. 2020, 10, 21. [Google Scholar] [CrossRef] [Green Version]
- Kubiszewski, I.; Cleveland, C.J.; Endres, P.K. Meta-Analysis of Net Energy Return for Wind Power Systems. Renew. Energy 2010, 35, 218–225. [Google Scholar] [CrossRef]
- Pickard, W.F. A Simple Lower Bound on the EROI of Photovoltaic Electricity Generation. Energy Policy 2017, 107, 488–490. [Google Scholar] [CrossRef]
- Steffen, B.; Hischier, D.; Schmidt, T.S. Historical and Projected Improvements in Net Energy Performance of Power Generation Technologies. Energy Environ. Sci. 2018, 11, 3524–3530. [Google Scholar] [CrossRef]
- Dupont, E.; Koppelaar, R.; Jeanmart, H. Global Available Solar Energy under Physical and Energy Return on Investment Constraints. Appl. Energy 2020, 257, 113968. [Google Scholar] [CrossRef]
- de Castro, C.; Capellán-Pérez, I. Standard, Point of Use, and Extended Energy Return on Energy Invested (EROI) from Comprehensive Material Requirements of Present Global Wind, Solar, and Hydro Power Technologies. Energies 2020, 13, 3036. [Google Scholar] [CrossRef]
- Weißbach, D.; Ruprecht, G.; Huke, A.; Czerski, K.; Gottlieb, S.; Hussein, A. Energy Intensities, EROIs (Energy Returned on Invested), and Energy Payback Times of Electricity Generating Power Plants. Energy 2013, 52, 210–221. [Google Scholar] [CrossRef]
- Raugei, M. Comments on “Energy Intensities, EROIs (Energy Returned on Invested), and Energy Payback Times of Electricity Generating Power Plants”-Making Clear of Quite Some Confusion. Energy 2013, 59, 781–782. [Google Scholar] [CrossRef]
- Carbajales-Dale, M.; Raugei, M.; Fthenakis, V.; Barnhart, C. Energy Return on Investment of Solar PV: An Attempt at Reconciliation. Proc. IEEE 2015, 103, 995–999. [Google Scholar] [CrossRef]
- Raugei, M. Energy Return on Investment: Setting the Record Straight. Joule 2019, 3, 1810–1811. [Google Scholar] [CrossRef]
- Fabre, A. Evolution of EROIs of Electricity Until 2050: Estimation and Implications on Prices. Ecol. Econ. 2019, 164, 106351. [Google Scholar] [CrossRef]
- Trainer, T. Estimating the EROI of Whole Systems for 100% Renewable Electricity Supply Capable of Dealing with Intermittency. Energy Policy 2018, 119, 648–653. [Google Scholar] [CrossRef]
- Kurland, S.D.; Benson, S.M. The Energetic Implications of Introducing Lithium-Ion Batteries into Distributed Photovoltaic Systems. Sustain. Energy Fuels 2019, 3, 1182–1190. [Google Scholar] [CrossRef] [Green Version]
- Diesendorf, M.; Wiedmann, T. Implications of Trends in Energy Return on Energy Invested (EROI) for Transitioning to Renewable Electricity. Ecol. Econ. 2020, 176, 106726. [Google Scholar] [CrossRef]
- Sers, M.R.; Victor, P.A. The Energy-Emissions Trap. Ecol. Econ. 2018, 151, 10–21. [Google Scholar] [CrossRef]
- Lambert, J.G.; Hall, C.A.S.; Balogh, S.; Gupta, A.; Arnold, M. Energy, EROI and Quality of Life. Energy Policy 2014, 64, 153–167. [Google Scholar] [CrossRef] [Green Version]
- Brand-Correa, L.I.; Brockway, P.E.; Copeland, C.L.; Foxon, T.J.; Owen, A.; Taylor, P.G. Developing an Input-Output Based Method to Estimate a National-Level Energy Return on Investment (EROI). Energies 2017, 10, 534. [Google Scholar] [CrossRef] [Green Version]
- Feng, J.; Feng, L.; Wang, J.; King, C.W. Modeling the Point of Use EROI and Its Implications for Economic Growth in China. Energy 2018, 144, 232–242. [Google Scholar] [CrossRef]
- Capellán-Pérez, I.; de Castro, C.; Miguel Gozález, L.J. Dynamic Energy Return on Energy Investment (EROI) and Material Requirements in Scenarios of Global Transition to Renewable Energies. Energy Strategy Rev. 2019, 26, 100399. [Google Scholar] [CrossRef]
- Dupont, E.; Germain, M.; Jeanmart, H. Estimate of the Societal Energy Return on Investment (EROI). Biophys. Econ. Sustain. 2021, 6, 2. [Google Scholar] [CrossRef]
- Ayres, R.U.; Warr, B. Accounting for Growth: The Role of Physical Work. Struct. Chang. Econ. Dyn. 2005, 16, 181–209. [Google Scholar] [CrossRef]
- Warr, B.S.; Ayres, R.U. Evidence of Causality between the Quantity and Quality of Energy Consumption and Economic Growth. Energy 2010, 35, 1688–1693. [Google Scholar] [CrossRef]
- Santos, J.; Domingos, T.; Sousa, T.; Aubyn, M.S. Useful Exergy Is Key in Obtaining Plausible Aggregate Production Functions and Recognizing the Role of Energy in Economic Growth: Portugal 1960–2009. Ecol. Econ. 2018, 148, 103–120. [Google Scholar] [CrossRef]
- Serrenho, A.; Warr, B.; Ayres, R.U.; Sousa, T.; Domingos, T. Structure and Dynamics of Useful Work along the Agriculture-Industry-Service Transition: Portugal from 1856 to 2009. Struct. Change Econ. Dyn. 2016, 36, 1–21. [Google Scholar] [CrossRef]
- Santos, J.; Domingos, T.; Sousa, T.; Serrenho, A. Development of a Two-Sector Model with an Extended Energy Sector and Application to Portugal (1960–2014). MPRA 2018. Available online: https://ideas.repec.org/p/pra/mprapa/89175.html (accessed on 29 March 2022).
- Murphy, D.J.; Hall, C.A.S.; Cleveland, C.; Dale, M. Order from Chaos: A Preliminary Protocol for Determining the EROI of Fuels. Sustainability 2011, 3, 1888–1907. [Google Scholar] [CrossRef] [Green Version]
- White, E.; Kramer, G.J. The Changing Meaning of Energy Return on Investment and the Implications for the Prospects of Post-Fossil Civilization. One Earth 2019, 1, 416–422. [Google Scholar] [CrossRef]
- Cleveland, C.J. Energy Quality and Energy Surplus in the Extraction of Fossil Fuels in the U.S. Ecol. Econ. 1992, 6, 139–162. [Google Scholar] [CrossRef]
- Cleveland, C.J.; Kaufmann, R.K.; Stern, D.I. Aggregation and the Role of Energy in the Economy. Ecol. Econ. 2000, 32, 301–317. [Google Scholar] [CrossRef]
- Chen, Y.; Feng, L.; Wang, J.; Höök, M. Emergy-Based Energy Return on Investment Method for Evaluating Energy Exploitation. Energy 2017, 128, 540–549. [Google Scholar] [CrossRef]
- Cleveland, C.J.; Herendeen, R. Solar Parabolic Collectors; Successive Generations Are Better Net Energy and Exergy Producers. Energy Syst. Policy 1989, 13, 63–77. [Google Scholar]
- Ayres, R.U.; Warr, B. The Economic Growth Engine: How Energy and Work Drive Material Prosperity; Edward Elgar Publishing: Cheltenham, UK, 2009. [Google Scholar]
- Warr, B.; Ayres, R.U.; Eisenmenger, N.; Krausmann, F.; Schandl, H. Energy Use and Economic Development: A Comparative Analysis of Useful Work Supply in Austria, Japan, the United Kingdom and the US during 100 Years of Economic Growth. Ecol. Econ. 2010, 69, 1904–1917. [Google Scholar] [CrossRef]
- Warr, B.; Schandl, H.; Ayres, R.U. Long Term Trends in Resource Exergy Consumption and Useful Work Supplies in the UK, 1900 to 2000. Ecol. Econ. 2008, 68, 126–140. [Google Scholar] [CrossRef]
- Santos, J.; Borges, A.S.; Domingos, T. Exploring the Links between Total Factor Productivity and Energy Efficiency: Portugal, 1960–2014. Energy Econ. 2021, 101, 105407. [Google Scholar] [CrossRef]
- Sakai, M.; Brockway, P.E.; Barrett, J.R.; Taylor, P.G. Thermodynamic Efficiency Gains and their Role as a Key “Engine of Economic Growth”. Energies 2019, 12, 110. [Google Scholar] [CrossRef] [Green Version]
- Lucas, A.; Geneiatakis, D.; Soupionis, Y.; Nai-Fovino, I.; Kotsakis, E. Blockchain Technology Applied to Energy Demand Response Service Tracking and Data Sharing. Energies 2021, 14, 1881. [Google Scholar] [CrossRef]
- Sani Yahaya, A.; Javaid, N.; Alzahrani, F.A.; Rehman, A.; Ullah, I.; Shahid, A.; Shafiq, M. Blockchain Based Sustainable Local Energy Trading Considering Home Energy Management and Demurrage Mechanism. Sustainability 2020, 12, 3385. [Google Scholar] [CrossRef] [Green Version]
- INE. Classificação Portuguesa das Actividades Económicas Rev.3. Available online: https://www.ine.pt/ine_novidades/semin/cae/CAE_REV_3.pdf (accessed on 25 June 2020).
- International Standard Industrial Classification of All Economic Activities Revision 4; United Nations, Department of Economic and Social Affairs; Available online: https://unstats.un.org/unsd/publication/seriesm/seriesm_4rev4e.pdf (accessed on 14 July 2018).
- Felício, L. Portugal Societal Exergy Accounting—Past and Future. Master’s Thesis, Instituto Superior Técnico, Lisbon, Portugal, 2017. [Google Scholar]
- Henriques, S. Energy Transitions, Economic Growth and Structural Change: Portugal in a Long-Run Comparative Perspective. Ph.D. Thesis, Lund University, Lund, Sweden, 2011. [Google Scholar]
- Felício, L.; Henriques, S.; Serrenho, A.; Domingos, T.; Sousa, T. Insights from Past Trends in Exergy Efficiency and Carbon Intensity of Electricity: Portugal, 1900–2014. Energies 2019, 12, 534. [Google Scholar] [CrossRef] [Green Version]
- AMECO Database. Available online: https://dashboard.tech.ec.europa.eu/qs_digit_dashboard_mt/public/sense/app/667e9fba-eea7-4d17-abf0-ef20f6994336/sheet/f38b3b42-402c-44a8-9264-9d422233add2/state/analysis/ (accessed on 10 June 2019).
- Banco de Portugal Series Longas Para a Economia Portuguesa-Pos II Guerra Mundial. Available online: https://www.bportugal.pt/publicacao/series-longas-para-economia-portuguesa-pos-ii-guerra-mundi?mlid=1342 (accessed on 12 August 2020).
- OECD Statistics. Available online: https://stats.oecd.org/ (accessed on 17 August 2018).
- da Silva, E.G.; Lains, P. Capital Formation and Long-Run Growth: Evidence from Portuguese Data, 1910–2011; IBEROMETRICS VI.; Facultad de Economía y Empresa, Universidad de Zaragoza: Zaragoza, Spain, 2013. [Google Scholar]
- OECD Measuring Capital: OECD Manual. Available online: https://www.oecd.org/sdd/productivity-stats/43734711.pdf (accessed on 26 May 2020).
- Pereira, A.S.; Lains, P. From an Agrarian Society to a Knowledge Economy: Portugal, 1950–2010; IFCS-Working Papers in Economic History. WP 10-09; Universidad Carlos III, Instituto Figuerola: Madrid, Spain, 2010. [Google Scholar]
- Rocha, E. Crescimento Económico Em Portugal Nos Anos de 1960-73: Alteração Estrutural e Ajustamento Da Oferta à Procura de Trabalho. Análise Soc. 1984, 20, 621–644. [Google Scholar]
- Ivanova, D.; Barrett, J.; Wiedenhofer, D.; Macura, B.; Callaghan, M.; Creutzig, F. Quantifying the potential for climate change mitigation of consumption options. Environ. Res. Lett. 2020, 15, 093001. [Google Scholar] [CrossRef]
- Creutzig, F.; Niamir, L.; Bai, X.; Callaghan, M.; Cullen, J.; Díaz-José, J.; Figueroa, M.; Grubler, A.; Lamb, W.F.; Leip, A.; et al. Demand-side solutions to climate change mitigation consistent with high levels of well-being. Nat. Clim. Chang. 2022, 12, 36–46. [Google Scholar] [CrossRef]
Figure 1.
Boundaries of EROI calculations. EROIs: standard, primary stage; EROIf: final stage; EROIx: comprehensive measure introduced by this study, useful stage. Authors’ own scheme.
Figure 1.
Boundaries of EROI calculations. EROIs: standard, primary stage; EROIf: final stage; EROIx: comprehensive measure introduced by this study, useful stage. Authors’ own scheme.

Figure 2.
Scheme of the boundaries, flows, and transformation sectors considered for different EROI calculations. (a) EROIs: standard, primary stage; EROIf: final stage; (b) EROIx: comprehensive measure introduced by this study, useful stage. Authors’ own scheme.
Figure 2.
Scheme of the boundaries, flows, and transformation sectors considered for different EROI calculations. (a) EROIs: standard, primary stage; EROIf: final stage; (b) EROIx: comprehensive measure introduced by this study, useful stage. Authors’ own scheme.

Figure 3.
EROI estimates for Portugal between 1960 and 2014 (5 year moving averages; gross ratios). EROIf: final stage; EROIfi: final stage EROI considering costs related to energy imports; EROIui: useful stage EROI considering costs related to energy imports; EROIuic: useful stage EROI considering costs related to energy imports and capital investment; EROIx: useful stage EROI considering costs related to energy imports, capital investment and muscle work; EROImin_gross: minimum gross EROI ratio. Authors’ own calculations.

Figure 4.
Extended-societal EROI results. (a) Gross EROIx ratio estimate for Portugal between 1960 and 2014 and the minimum gross EROI ratio. (b) Share of the energy inputs of the EROI. Authors’ own calculations. Full time series of EROIx is given in the Supplementary Materials file together with the series of inputs and outputs necessary for EROI calculation.

Table 1.
Main industrial subsectors, directly or indirectly involved in the production of energy converting machines, considered for the calculation of the energy intensity of the machinery sector ([50,51]).
| Industrial Subsector Denomination | Portuguese Classification (CAE) | International Classification (ISIC Rev. 4) |
|---|---|---|
| Basic metals | 37 | 24 |
| Fabricated metal products | 38 | 25 |
| Computers, electronics | 38 | 26 |
| Electrical equipment | 38 | 27 |
| Machinery and equipment | 38 | 28 |
| Motor vehicles, trailers and semi-trailers | 38 | 29 |
| Other transport equipment | 38 | 30 |
Table 2.
Average life for each type of asset invested in the extended energy sector ([58] and own assumptions).
Table 2.
Average life for each type of asset invested in the extended energy sector ([58] and own assumptions).
| Type of Asset | Average Lifetime [Years] | Reference |
|---|---|---|
| Machinery | 15 | [58] |
| Transport equipment | 18 | [58] |
| Other investments | 10 | [58] |
| Investments reclassified from household’s final consumption | 10 | Own assumption |
| Investments reclassified from government final consumption | 10 | Own assumption |
Table 3.
The shares and absolute values of the inputs and outputs for each different EROI calculation (Authors’ own calculations).
Table 3.
The shares and absolute values of the inputs and outputs for each different EROI calculation (Authors’ own calculations).
| Shares | EROIf | EROIfi | EROIui | EROIuic | EROIx | ||||||
| 1960 | 1970 | 1960 | 1970 | 1960 | 1970 | 1960 | 1970 | 1960 | 1970 | ||
| Outputs | Energy | 100% | 100% | 100% | 100% | 100% | 100% | 100% | 100% | 86.10% | 93.35% |
| Muscle work | - | - | - | - | - | - | - | - | 13.90% | 6.65% | |
| Inputs | Direct Energy | * 76.92% | * 76.92% | 61.54% | 62.19% | 62.31% | 61.68% | 22.03% | 35.42% | 8.61% | 19.00% |
| Indirect | * 23.08% | * 23.08% | 18.46% | 18.66% | 18.69% | 18.50% | 6.61% | 10.63% | 16.30% | 16.22% | |
| Direct Food and Feed | - | - | - | - | - | - | - | - | 45.74% | 35.08% | |
| Imports | - | - | 19.99% | 19.15% | 19.00% | 19.82% | 6.72% | 11.38% | 2.63% | 6.11% | |
| Capital | - | - | - | - | - | - | 64.65% | 42.57% | 26.72% | 23.60% | |
| Absolute Value [TJ] | EROIf | EROIfi | EROIui | EROIuic | EROIx | ||||||
| 1960 | 1970 | 1960 | 1970 | 1960 | 1970 | 1960 | 1970 | 1960 | 1970 | ||
| Outputs | Energy | 193131 | 265107 | 193131 | 265107 | 26722 | 46311 | 26722 | 46311 | 26722 | 46311 |
| Muscle work | - | - | - | - | - | - | - | - | 4315 | 3302 | |
| Total | 193131 | 265107 | 193131 | 265107 | 26722 | 46311 | 26722 | 46311 | 31037 | 49613 | |
| Inputs | Direct Energy | 5563 | 17318 | 5563 | 17318 | 1012 | 3283 | 1012 | 3283 | 1012 | 3283 |
| Indirect | 1669 | 5196 | 1669 | 5196 | 304 | 985 | 304 | 985 | 1915 | 2803 | |
| Direct Food and Feed | - | - | - | - | - | - | - | - | 5373 | 6061 | |
| Imports | - | - | 1807 | 5333 | 309 | 1055 | 309 | 1055 | 309 | 1055 | |
| Capital | - | - | - | - | - | - | 2970 | 3946 | 3139 | 4077 | |
| Total | 7232 | 22514 | 9039 | 27847 | 1624 | 5323 | 4594 | 9269 | 11748 | 17280 | |
* These shares do not change because of our own assumption that indirect inputs are a certain percentage of direct ones.
Publisher’s Note: MDPI stays neutral with regard to jurisdictional claims in published maps and institutional affiliations. |
© 2022 by the authors. Licensee MDPI, Basel, Switzerland. This article is an open access article distributed under the terms and conditions of the Creative Commons Attribution (CC BY) license (https://creativecommons.org/licenses/by/4.0/).
Share and Cite
MDPI and ACS Style
Ecclesia, M.V.; Santos, J.; Brockway, P.E.; Domingos, T. A Comprehensive Societal Energy Return on Investment Study of Portugal Reveals a Low but Stable Value. Energies 2022, 15, 3549. https://0-doi-org.brum.beds.ac.uk/10.3390/en15103549
AMA Style
Ecclesia MV, Santos J, Brockway PE, Domingos T. A Comprehensive Societal Energy Return on Investment Study of Portugal Reveals a Low but Stable Value. Energies. 2022; 15(10):3549. https://0-doi-org.brum.beds.ac.uk/10.3390/en15103549
Chicago/Turabian StyleEcclesia, Marco Vittorio, João Santos, Paul E. Brockway, and Tiago Domingos. 2022. "A Comprehensive Societal Energy Return on Investment Study of Portugal Reveals a Low but Stable Value" Energies 15, no. 10: 3549. https://0-doi-org.brum.beds.ac.uk/10.3390/en15103549
Note that from the first issue of 2016, this journal uses article numbers instead of page numbers. See further details here.