
Evaluation of the Hydropower Potential of the Torysa River and Its Energy Use in the Process of Reducing Energy Poverty of Local Communities


Institute of Earth Sources, Faculty of Mining, Ecology, Process Technologies and Geotechnology, Technical University of Košice, Letná 9, 042 00 Košice, Slovakia
*
Author to whom correspondence should be addressed.
Energies 2022, 15(10), 3584; https://0-doi-org.brum.beds.ac.uk/10.3390/en15103584
Submission received: 1 April 2022
/
Revised: 11 May 2022
/
Accepted: 11 May 2022
/
Published: 13 May 2022
(This article belongs to the Special Issue A New Water-Energy Nexus: The Transition to Sustainable Energy Ⅱ)
Abstract
:The presented paper deals with the evaluation of hydropower potential in a selected section of the Torysa river in the eastern part of the Slovak Republic. This part of the country was chosen based on the existence of a significant risk of increasing energy poverty in local marginalized communities. Small hydropower plants in the form of mini and micro installations are an ecological and economical way to secure electricity and suppress indicators of energy poverty. The essential part of work focuses on the quantification of the gross (theoretical), technical, and economic hydropower potential of the Torysa river using elevation data obtained by GIS tools and hydrological data provided by The Slovak Hydrometeorological Institute. The next step identified concrete locations with a suitable head and volumetric flow rate. In the last part, the assessed section of the Torysa river was analyzed in terms of geographical collisions with NATURA 2000 areas, historical heritage elements in the country, and natural water bodies without hydropower potential (i.e., lakes, ponds, etc.). The resulting technical hydropower potential of selected part of Torysa river is 5425 kW and the economic potential is 1533 kW.
1. Introduction
Climate change poses a significant threat to the way of life of modern society as we know it. Its negative impact is reflected not only in the environmental field, but also in the economic and social aspects of society. The vast majority of modern and developed countries recognize the fundamental impact of human activity on climate change, which can be characterized by a wide range of impacts, from rising long-term average temperatures [1,2] to changing global ocean levels [3,4,5,6], increasing numbers of extreme weather events [7,8] reduction of environmental biodiversity [9,10,11,12], reduction of fertility and yield from agricultural production [13,14], and changes in glacial areas [15]. To reduce the negative effects of climate change, a scientific consensus is generally accepted in the form of reducing the use of fossil fuels [16].
As a member of the European Union, the Slovak Republic is committed to the European climate plans arising from the Fit for 55 agenda. Under this legislative package, the Member States of the European Union have set a target of reducing CO2 emissions by 55% by 2030 compared to 1990 and increasing the share of renewable energy sources (hereinafter RES) in total primary consumption to 40%. According to the set trajectories of development, the European Union should achieve carbon neutrality by 2050. The sub-targets for individual countries are set by the Integrated National Energy and Climate Plan (NECP) [17].
The Slovak Republic has so far declared a target for RES at 19.2% by 2030, but an updated target should be published in the second quarter of 2023, considering the Fit for 55 agenda. The current share of RES in primary energy consumption is 17.6%. The current targets envisage a significant increase in new RES installations, especially in wind farms and photovoltaic power plants, but no less important component of the energy mix will be the use of hydroelectric power plants (hereinafter HPP).
The use of HPP from the “small hydro” category (with installed capacity under 10 MW) brings several ecological advantages over the construction of large HPP, which have a significant impact on the surrounding environment. With sensitively and purposefully built small hydroelectric power plants (hereinafter SHPP), there is no overall change in the nature of the river flow, it eliminates erosive activity, and the precipitation regime is not affected by evaporation from a large reservoir [18].
At present, the total installed capacity of HPP in Slovakia is 2528 MW, which produce approximately 4500 GWh of electricity per year [17]. However, if we focus only on the issue of SHPP, the installed capacity will drop dramatically to only 79.71 MW, and these power plants produced approximately 320 GWh of electricity. Summary information, numbers of power plants, and their size distribution are shown in Table 1.
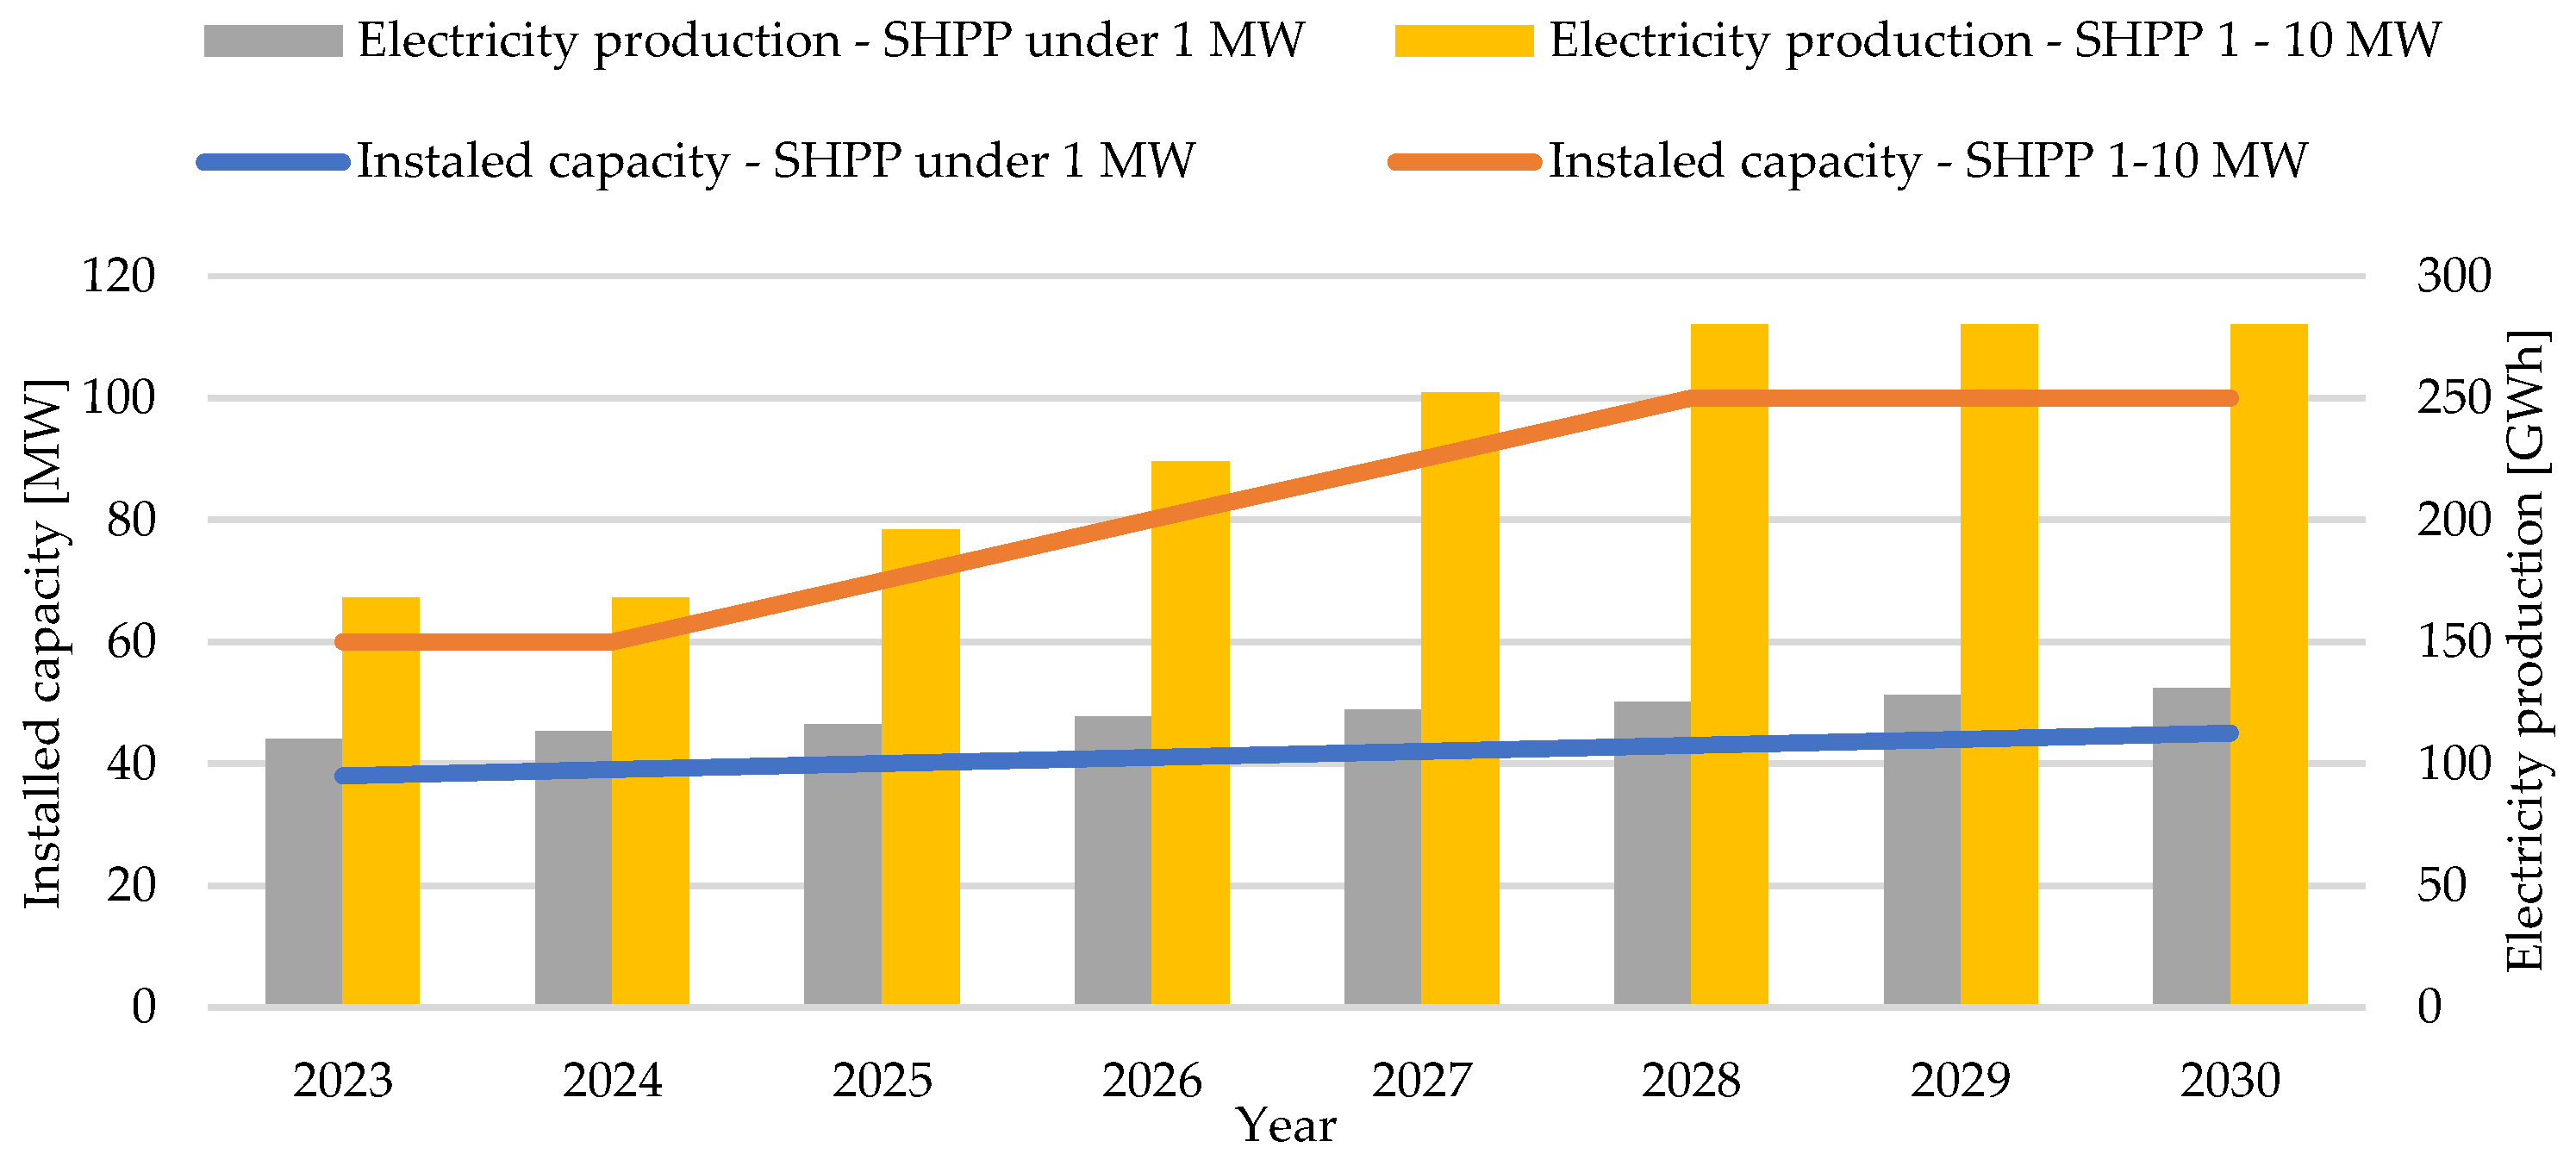
The proposed increase in the use of SHPP in the years 2023 to 2030 according to the actual NECP concept [17] is illustrated in Figure 1, which summarizes the increase in installed capacity and expected energy production broken down for sources up to 1 MW and 1 to 10 MW. Energy production is calculated only based on the gross (theoretical) hydropower potential, and the presented concept does not define specific river profiles (locations) and river kilometres enabling the construction of SHPP.
The energy mix of the Slovak Republic is currently going through a turbulent period, which is characterized by the transition to low-carbon sources of electricity by decommissioning and replacement of lignite thermal power plants and by the increase in installed capacity of two nuclear reactors. In the near future, RES should also make a significant impact in the efforts to decarbonize electricity production, and there is already a significant legislative improvement in this part of the energy sector as well as a proposal for economic support schemes.
In the environment of the Slovak Republic, RES bring, in addition to obvious environmental benefits, a benefit in the form of reducing energy dependence on imports of fossil fuels (especially natural gas) and mineral fuels (fuel for nuclear power plants). The turbulent political situation often contributes to an extreme rise in the price of fossil fuels, which will ultimately be reflected in the prices of electricity or heat for the final consumer. Residents from lower social and economic classes are particularly at risk of rising prices when they are subsequently unable to meet basic energy requirements. This phenomenon is also referred to as energy poverty. According to international studies, for example [19], Slovakia is a country that is significantly threatened by energy poverty.
Energy poverty can be defined in different ways. It is sometimes referred to as the inability to heat a house to an adequate (safe and comfortable) temperature due to low income and inadequate (energy inefficient) housing. Energy poverty can also be broadly defined as the inability of a household to achieve or afford energy services in a socially and materially necessary level. A wide range of indicators is used to assess the population’s risk to energy poverty. One of the most used is the LIHC indicator, i.e., low income, high costs. The definition of this indicator is that a household is in a state of energy poverty if its share of energy costs is above average (above the national median level), and if the household were to spend this amount, its residual income would fall below the official poverty line.
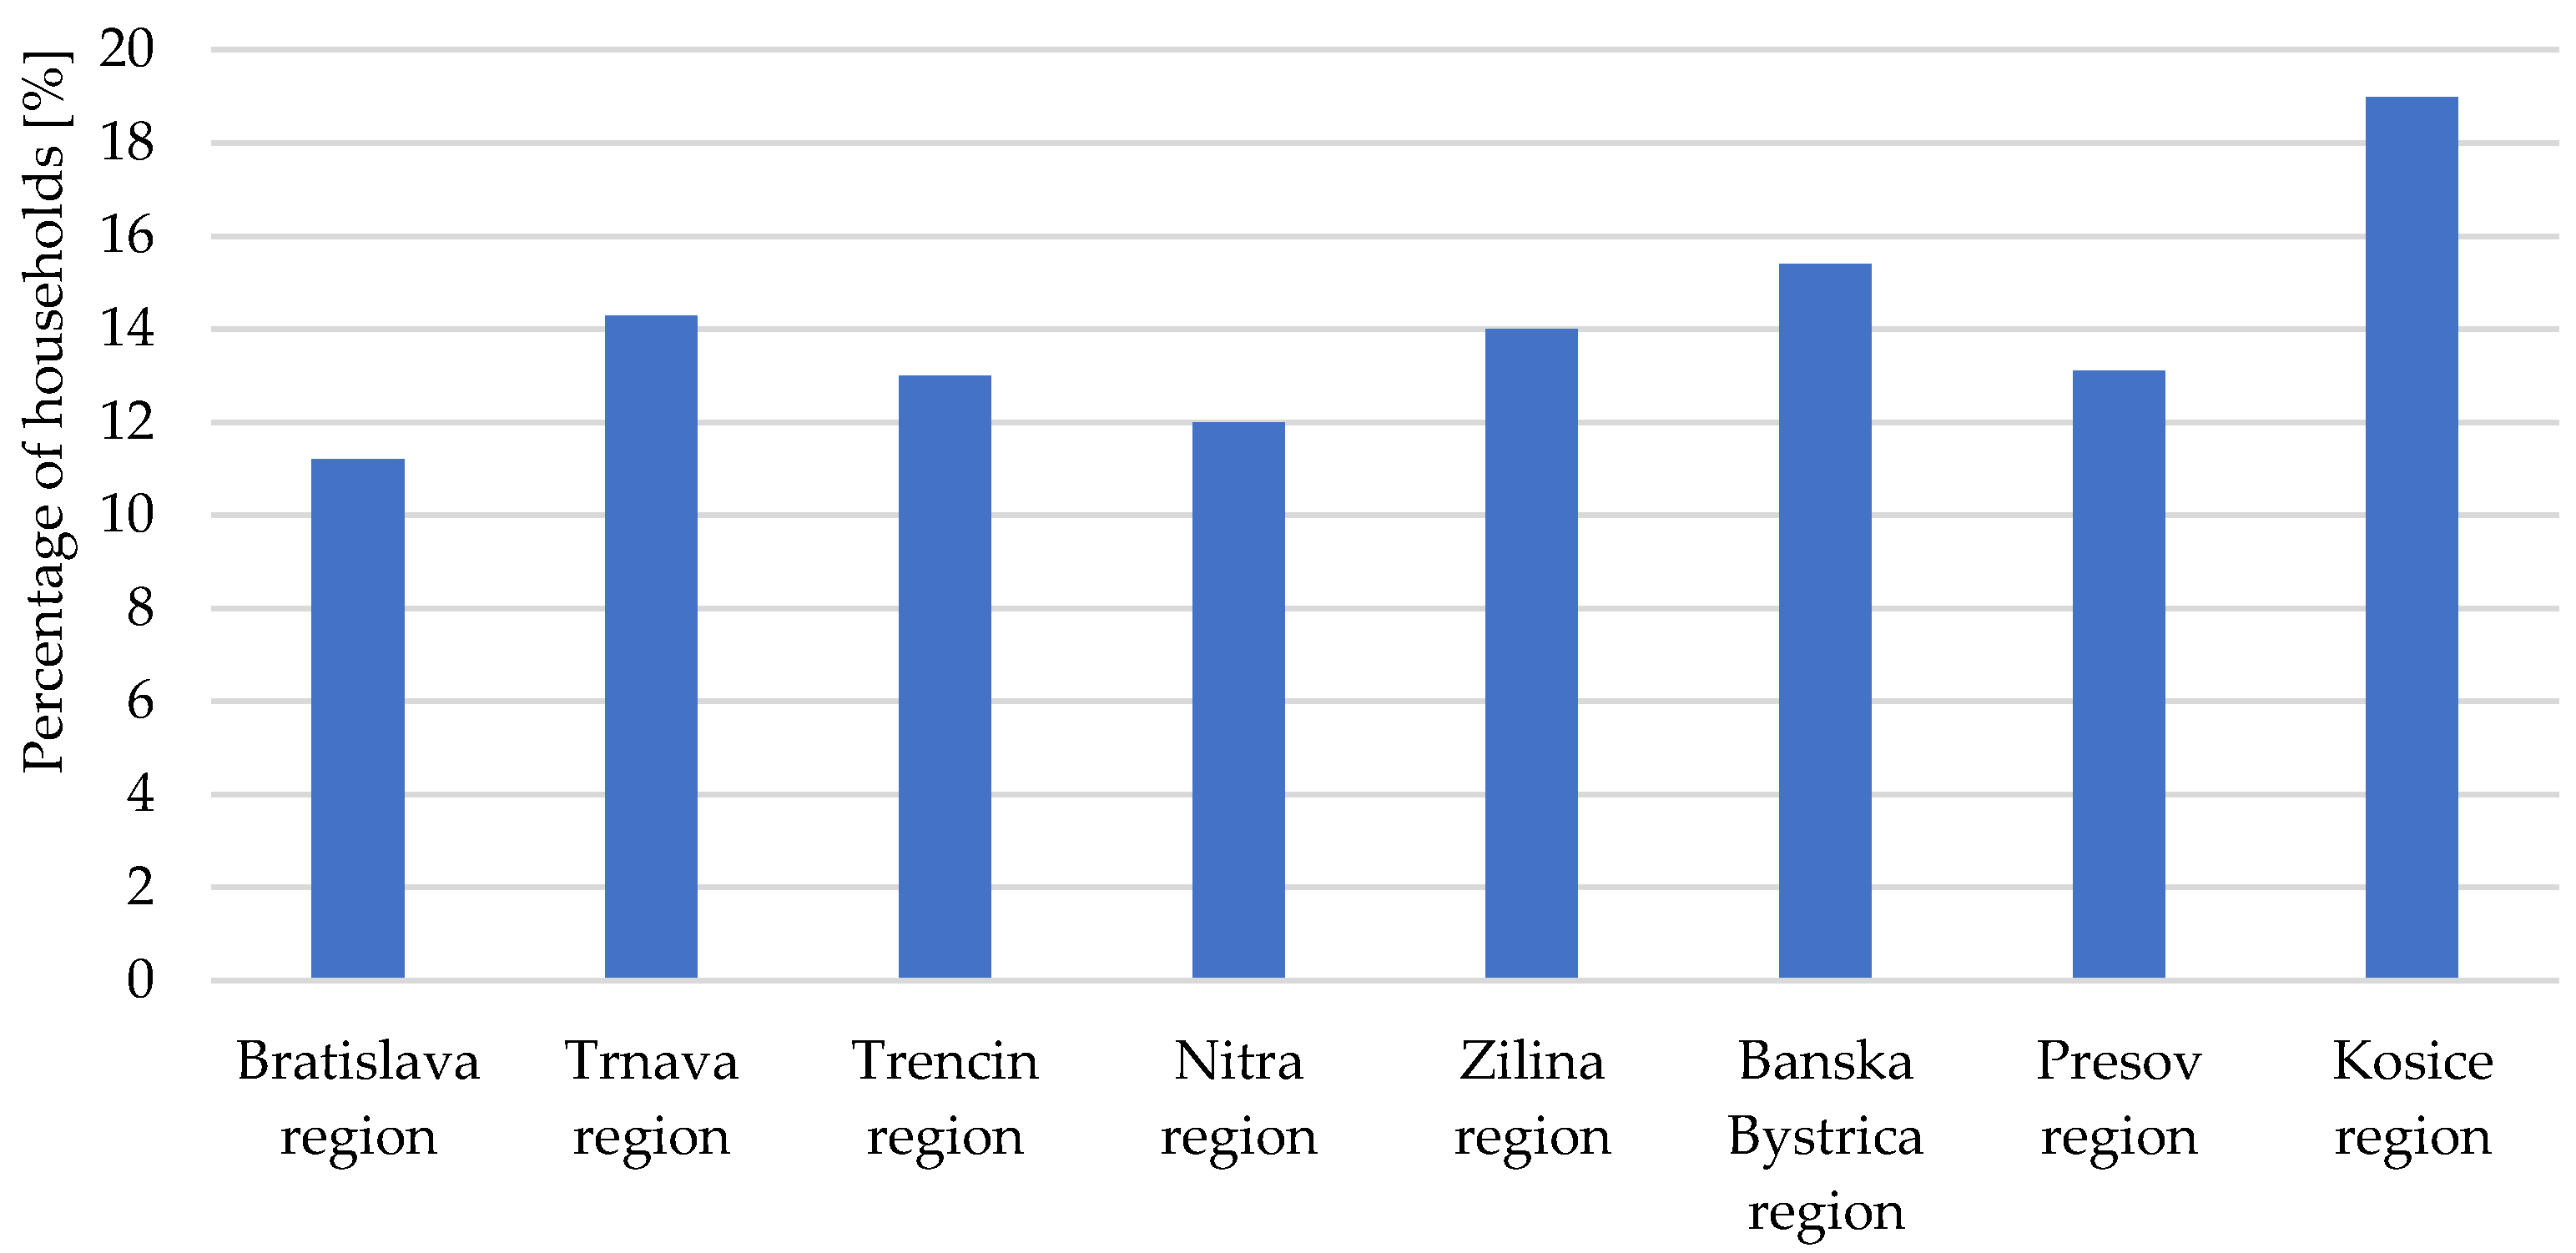
The issue of energy poverty in Slovakia is addressed in a study prepared for the Slovak Climate Initiative [20]. Considering the above definition, 10% of households in Slovakia would be affected by energy poverty. However, this approach disadvantages some households and, conversely, there are households that are incorrectly included in the group of poor households. These are mainly large households and houses with large areas. Therefore, it is customary to consider the size of the living space and the number of household members, by recalculating the index per square meter of living space and per capita. Energy poverty, defined as “LIHC per m2”, threatens 14.5% of the population. The most affected region would be the Kosice region with 19% of households in energy poverty. It is followed by the Banska Bystrica region (15.4% of households), the Trnava region (14.3% of households), and the Presov region (13.1% of households). A graphical representation of the share of households at risk of energy poverty in relation to the region is shown in Figure 2.
At the national level, the reduction of energy poverty is currently being implemented by appropriate compensatory economic measures for at-risk groups of the population, which, however, only address impacts. Tackling the specific causes of energy poverty requires more complicated solutions that need to be implemented over a longer period. The most significant problem is alleviating the lack of heat for heating. In this case, it is possible to consider several levels of activities that reduce energy poverty. The most important activity in this direction is to increase energy efficiency by improving the thermal properties of the building envelope using a direct subsidy to the property owner for the necessary construction work (in this case it is most often the overall insulation of the building envelope and modification of the heat distribution system). The next step is to increase the efficiency of the currently used energy source by replacing it with a more modern type (most often the replacement of conventional boilers with condensing boilers), which works with higher efficiency in converting fuel energy into useful energy in the form of heat for heating.
From the point of view of solving the problem of energy poverty in the long term, a frequent and relatively successful solution is to change the energy base, where fossil fuels are abandoned, and RES are used [21,22]. In this case, there are frequent installations of heat pumps, which are complemented by a micro photovoltaic system that improves the parameters of electricity consumption. An equally important activity is electrification, or wider use of electricity, which is produced using RES. In this case, the price of the energy system must be significantly subsidized, thus ensuring that the resulting price for the consumed electricity is lower than in the case of consumption from the public electricity system, as stated by Patro et al. [23]. In these activities, electricity then plays a role even where it has not been used before; a characteristic example is the replacement of a gas boiler for heating with electric heating. The production of electricity using RES can be solved directly by the owners of the house, but more advantageous is the wider introduction of RES at the regional level, in the so-called smaller regional energy clusters or community energy centers. Here it is possible to produce electricity with the use of photovoltaic panels, smaller wind turbines, and cogeneration units that use biogas, or SHPP, if the locality has the appropriate hydropower potential.
The subject of accurate quantification of the energy potential of RES is currently very topical. Dhaubanjar et al. [24] assessed the theoretical, technical, economic, and sustainable energy potential of hydropower in the upper part of the Indus River. The authors developed a systematic framework for the basin-scale assessment of the sustainable hydropower potential by integrating considerations of the water-energy-food nexus, disaster risk, climate change, environmental protection, and socio-economic preferences. The authors concluded that sustainable hydropower potential in complex basins such as the Indus goes far beyond the hydrological boundary conditions. Kenfack et al. [25] addressed ways to reduce the low availability of electricity for the people of Cameroon. Based on the analysis of the obtained data, the authors declared the perspective in the construction of not only large HPP but also SHPP, whose potential is currently fulfilled only in one-tenth of a percent. Arthur et al. [26] also focused their research on the African environment. The assessment of hydropower potential was carried out at the bottom of the Pra river basin in Ghana. The authors identified ten potential sites and proposed a cascade system of hydropower plants in the site. Flow duration curves and power duration curves were constructed as part of the potential quantification. The work of Eshra et al. [27] deals with the use of mini and micro hydropower plants. The authors used GIS tools to assess Egypt’s hydropower potential. Based on a multi-criteria analysis, they selected eight potentially suitable sites for the construction of mini and micro hydropower plants. The GIS tools have also been used in the work of Kwartnik-Pruc and Mączyńska [28], where the most interesting element of their work is the use of spatial data with a high resolution acquired from unmanned aerial vehicle in search for locations for the construction of SHPP and assessment of their usefulness. This method can significantly improve the location of new SHPP in the country in the future. Torrefranca et al. [29] focused on risk assessment of the location of small hydropower plants in the country, evaluating the risk associated with surface processes and environmental factors, based on which divided the potential sites for SHPP into five levels. Liszka et al. [30] dealt with the topic of using SHPP from the point of view of the economy and reducing investment costs. The authors proposed solutions concerning simplifying the turbine’s and generator’s integration by installing them in dedicated prefabricated concrete modules; the authors also proposed cheap semi-Kaplan type of turbines with a non-classical spiral inflow.
The presented paper deals with the quantification of the hydropower potential of the selected part of Torysa river in the area prone to an increase in energy poverty. The other goal is the determination of specific river profiles (locations) that are suitable for building mini and micro HPPP, considering the river elevation profile and geographical and legislative constraints. The novelty and innovativeness of the presented paper can be characterized by quantifying the specific hydropower potential of the selected river in connection with the solution of socio-economic problems arising from the increased risk of energy poverty. Photovoltaic power plants and biomass-burning plants are currently used to solve energy poverty using RES. The presented article shows that the system of mini and micro hydroelectric power plants can also provide a constant power supply. From the point of view of innovation, the presented contribution not only provides an insight into the possibility of solving the problem of energy poverty with the use of hydropower, but it also brings new knowledge concerning the hydropower potential of a significant part of the Slovak Republic. These data can be used by other authors who are dealing with the potential of RES or tackling the topic of energy poverty, as this topic is becoming critical at this time, considering the sharp rise in the price of energy resources.
2. Materials and Methods
This paper evaluates the theoretical (gross), technical, and economic hydropower potential of a selected section of the Torysa River, which flows through parts of the Košice and Prešov regions, which are significantly endangered by energy poverty. Near the Torysa river exist numerous marginalized communities, where it would be possible to utilize the institute of local energy clusters, which would enable the production of cheap and affordable electricity using financial incentives from the state administration especially in the construction process.
The suitability of the location for the implementation of a SHPP is influenced primarily by the size of the hydropower potential of the river, which is characterized by the volumetric flow rate and the elevation profile of the river. The assessment of the potential of SHPP was performed using GIS methods with spatial data analysis and multi-criteria analysis, which assessed environmental constraints. Before the multicriteria analysis in the GIS tool, it was necessary to evaluate all available trends for selection of a suitable SHPP location. After evaluating the trends, the factors that directly affect the selection of location were identified. These were mainly flow conditions, the occurrence of protected areas, and altitude conditions presented through an elevation model.
All considered aspects were processed into vector and raster representation in the GIS tool. These representations were subsequently used to create maps assessing the suitability of the area for the location of a SHPP. The main element in assessing the suitability of the location was data obtained from available hydrometric stations directly located on the Torysa river. For the needs of the research, the data layers were obtained by the process of digitization of the underlying maps in the ArcGIS 9.3 software. The sources of some documents were obtained from the official websites of state administration bodies. To create an elevation profile, the digital elevation model method was applied, which represents a topological description of the area (real landscape in the GRID raster presentations) via the SRTM DEM tool, created in the national coordinate system. The model is built only on points that represent altitude.
Quantification of hydropower potential was performed using commonly available and extensively used methodology, e.g., in [31,32,33] based on head and mean flow parameters. The selected part of the Torysa river was segmented into elementary sections in which the hydropower potential was assessed. These sections were divided based on the existence of an intersection between an elevation grid and the trajectory of the river stream itself. The resulting hydropower potential was determined by the sum of the partial potentials. The determination of gross (theoretical) hydropower potential of elementary section, PG,i is based on Equation (1).
where Qi is the volumetric flow of the ith elementary section of the river stream expressed as the arithmetic mean flow over a longer period [m3/s], Δhi is the difference in altitude of the ith elementary section of the river stream, i.e., head [m], and g is gravitational acceleration [m/s2].
The total gross (theoretical) hydropower potential is then determined by Equation (2), where n is the number of elementary sections on the assessed stream.
However, in the particular use of the hydropower potential, it is necessary to consider the efficiency of all the technological equipment, which affects the overall achievable performance of the hydropower plant. For indicative calculations of the technical hydropower potential, PT,i of a SHPP, Equation (3) applies, where ηP is overall efficiency of SHPP:
For the purposes of designing a SHPP, it is generally possible to consider an overall efficiency of 80%; we can then rewrite Equation (3) in the form
The total technical potential of the flow is then given by Equation (5), where n is the number of elementary sections on the assessed flow:
As not all technically feasible solutions are economically advantageous, it was necessary to evaluate the economic potential of the flow in terms of the Slovak Republic, which considered the maximum length of the penstock to the turbine to 100 m. The 100 m long penstock is considered in the Slovak Republic as the maximum limit for economically usable HPP according to [34,35]. Based on this length, the elementary head Δhi/100 on the given elementary sections were subsequently determined and used in calculation of economic hydropower potential in Equations (6) and (7):
From the entire length of the assessed Torysa river, a section between 79.6 and 13.0 river kilometres (rkm) was chosen. This limitation was due to the absence of available data of the water flow rate outside these river kilometres. Hydrological data from three measuring stations operated by the Slovak Hydrometeorological Institute were available in the selected section.
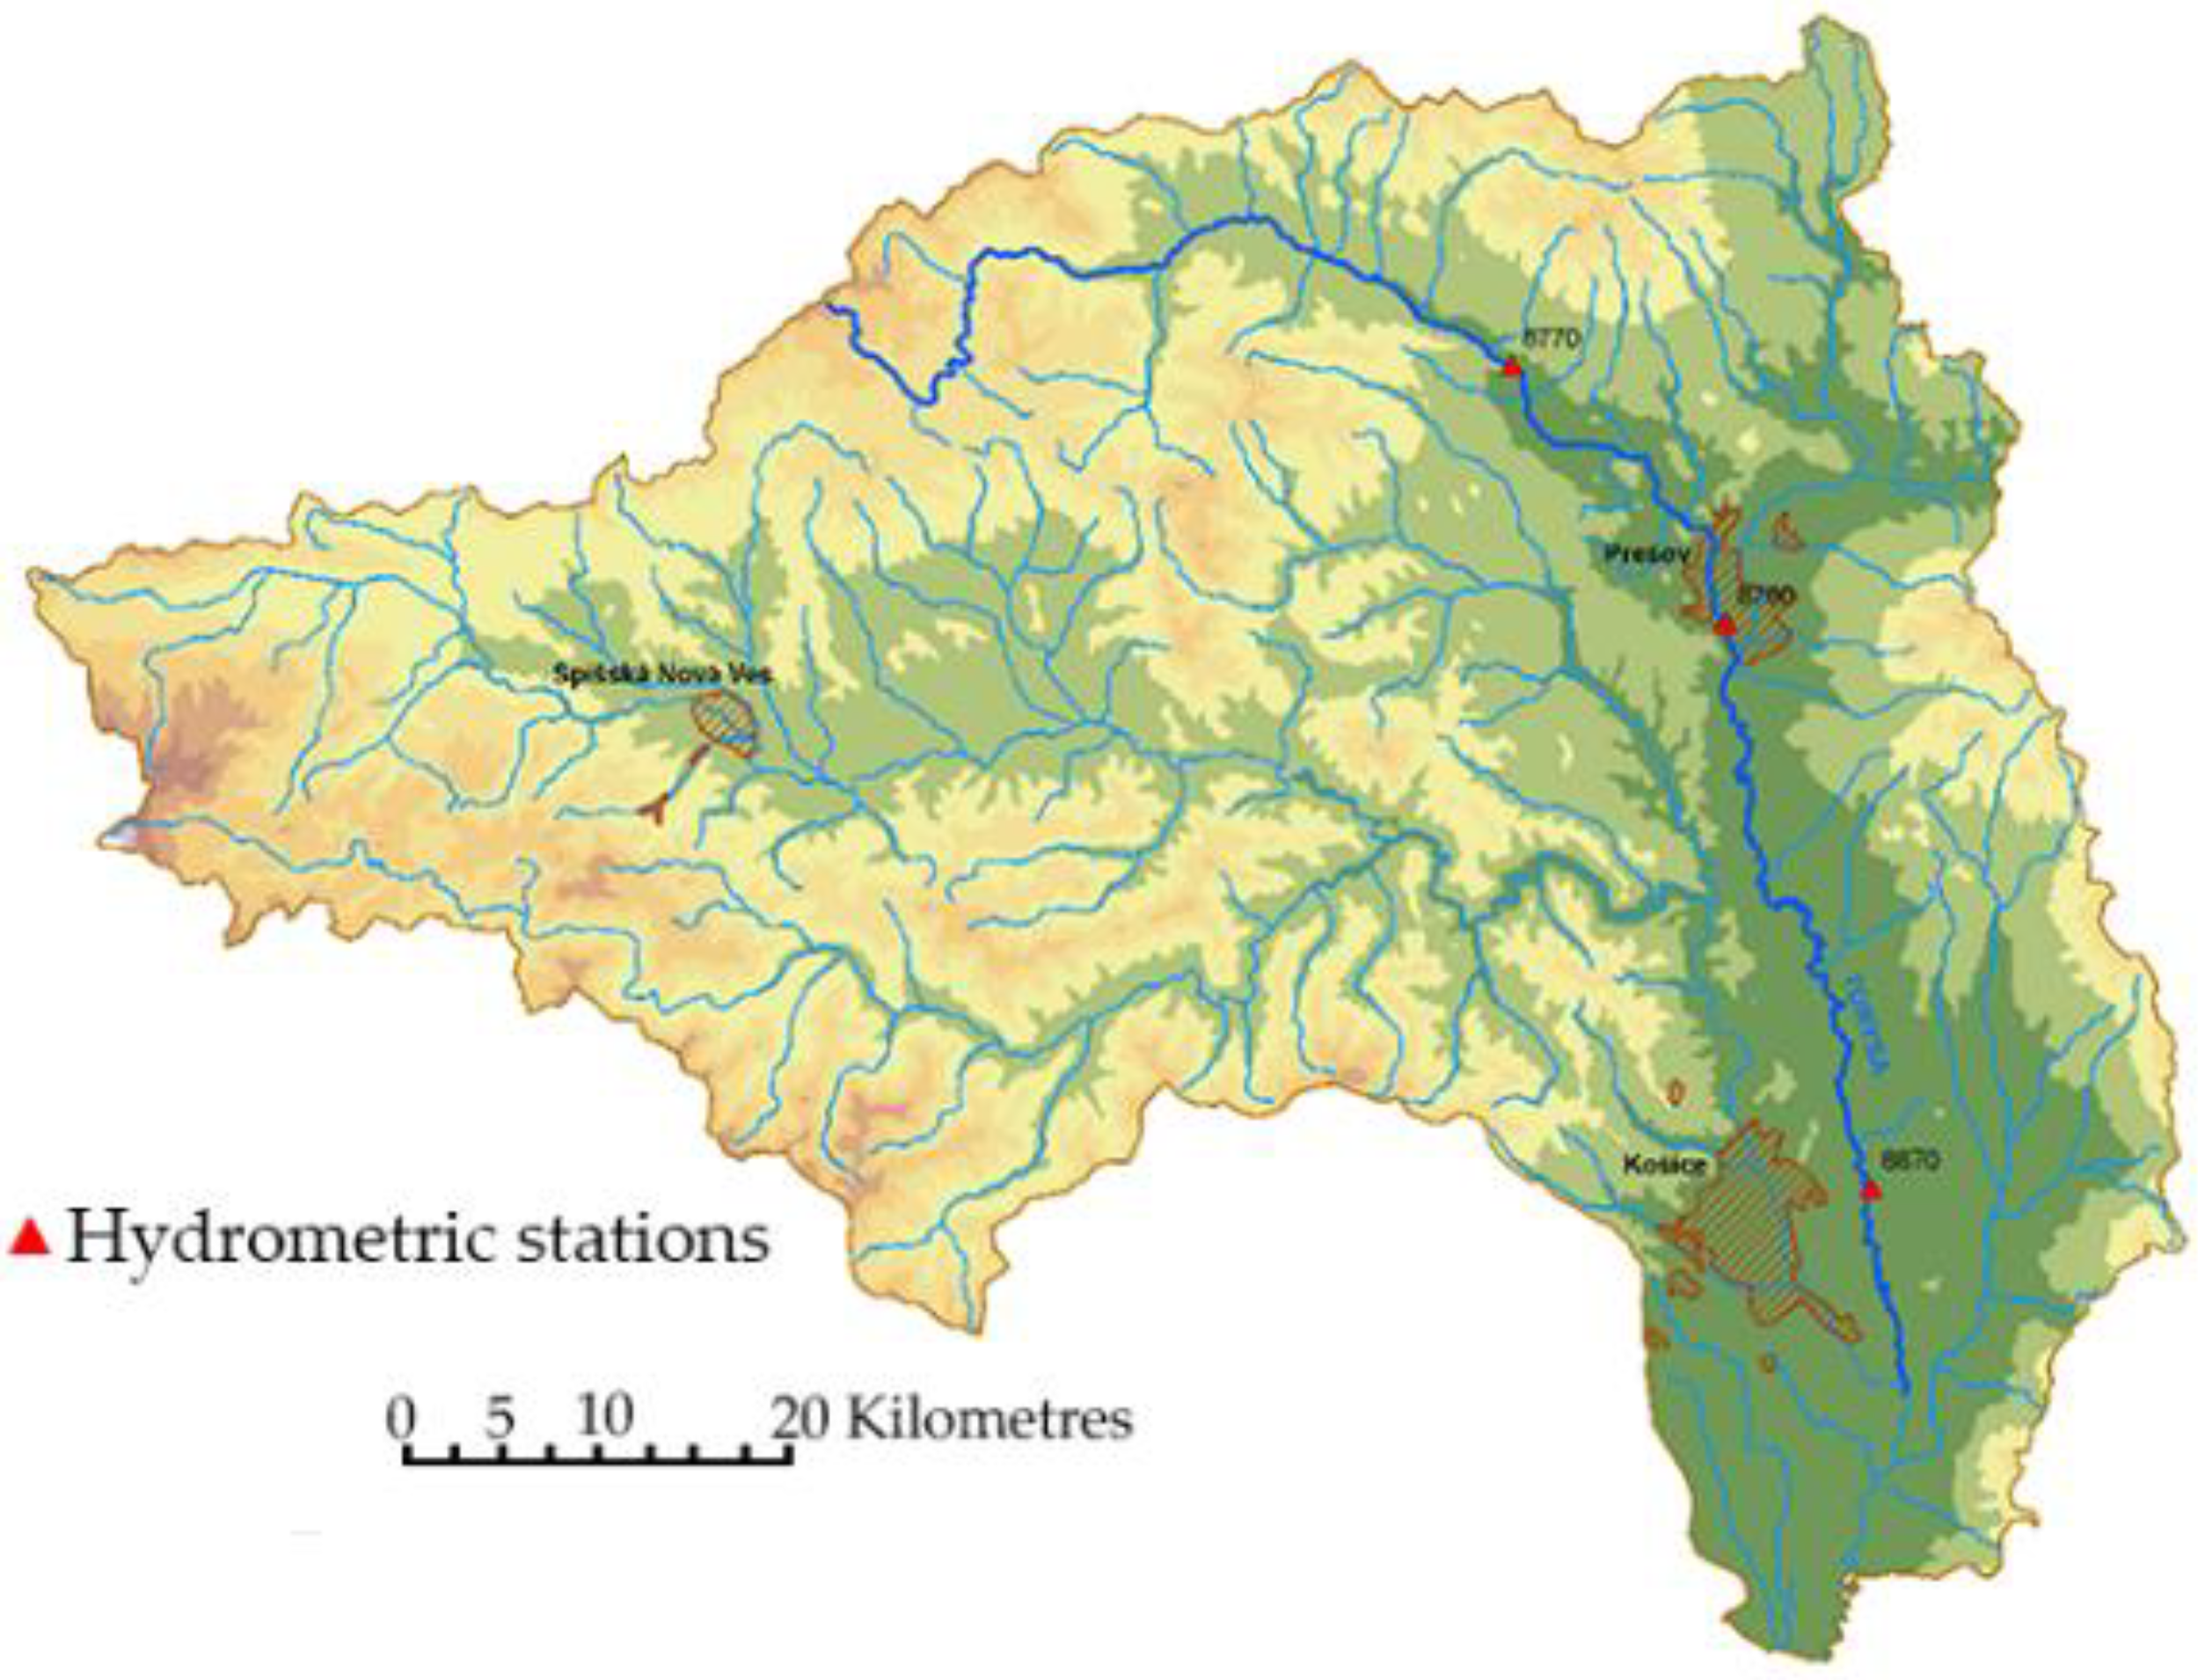
The first hydrological station (no. 8770) is located in the town of Sabinov at 79.6 rkm, the second (no. 8780) in the town of Prešov at 58.3 rkm, and the third (no. 8870) in the village of Košické Oľšany at 13 rkm. The location of the Torysa river within the Slovak Republic and the border of its basin area is shown in Figure 3.
3. Results and Discussion
The Torysa river drains a 1349 km² basin, is 129 km long, and is a highland-lowland type of river. The distribution of water flow rate in the year is characterized by the time change of average monthly discharges. The Torysa basin is characterized by a runoff regime with maximum average monthly discharges in the spring and with the lowest average monthly discharges in the autumn. The average monthly discharges as well as the average discharges for the years 2015–2019 recorded by the measuring hydrological stations are shown in Table 2, Table 3 and Table 4.
Another important parameter that can characterize evaluated river is the so-called high-water regime, which expresses the maximum water flow during a flood wave. The statistical significance of a flood is assessed by the average time during which the relevant maximum flow can be expected to be reached or exceeded. Sizes of N-year maximum discharges in the hydrometric station no. 8770 are shown in Table 5.
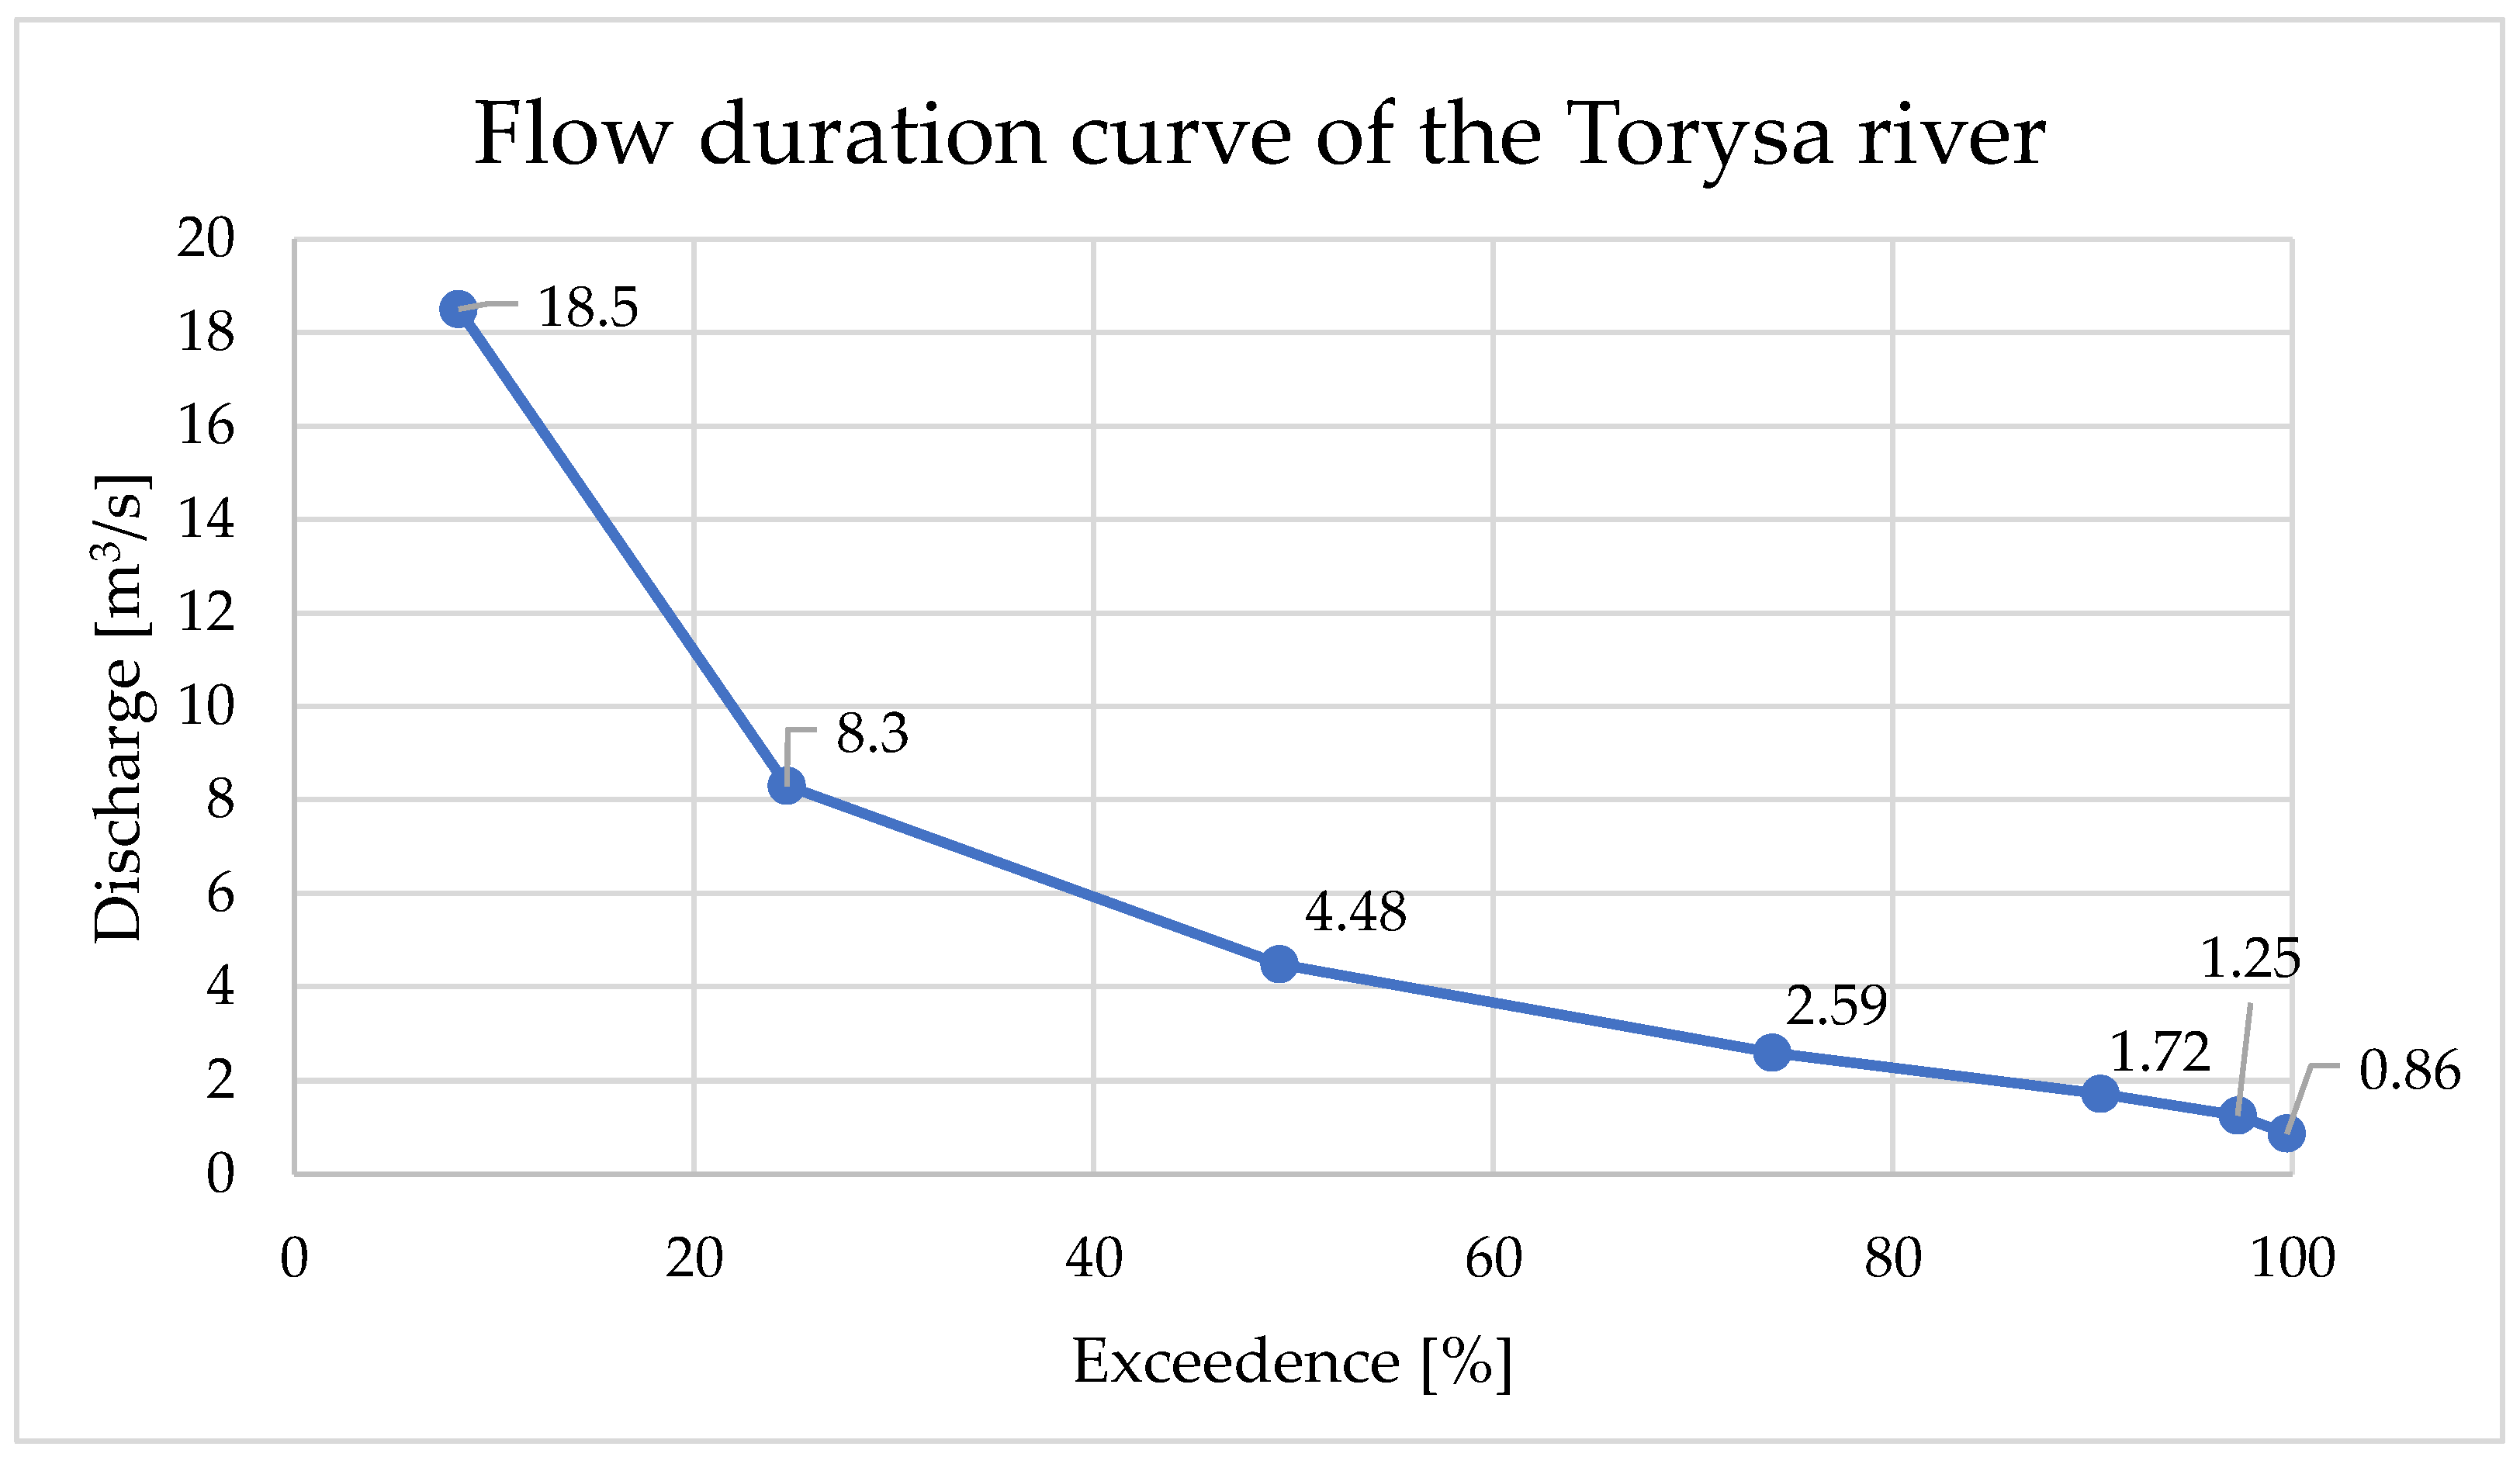
One of the most important parameters for quantifying the hydrological potential of a river is the mean flow. Mean annual flow is the average flow for the individual year or multi-year period of interest, in this case it was calculated for a 5-year period. Mean annual flow is obtained by dividing the sum of all the individual daily flows by the number of daily flows recorded for the year. The assessed part of the Torysa river reached the mean flow in the three above-mentioned hydrological stations at the level of 3.72 m3/s (no. 8770), 4.86 m3/s (no. 8780), and 8.55 m3/s (no. 8870). The flow duration curve for the Kosicke Olsany hydrological station is shown in Figure 4.
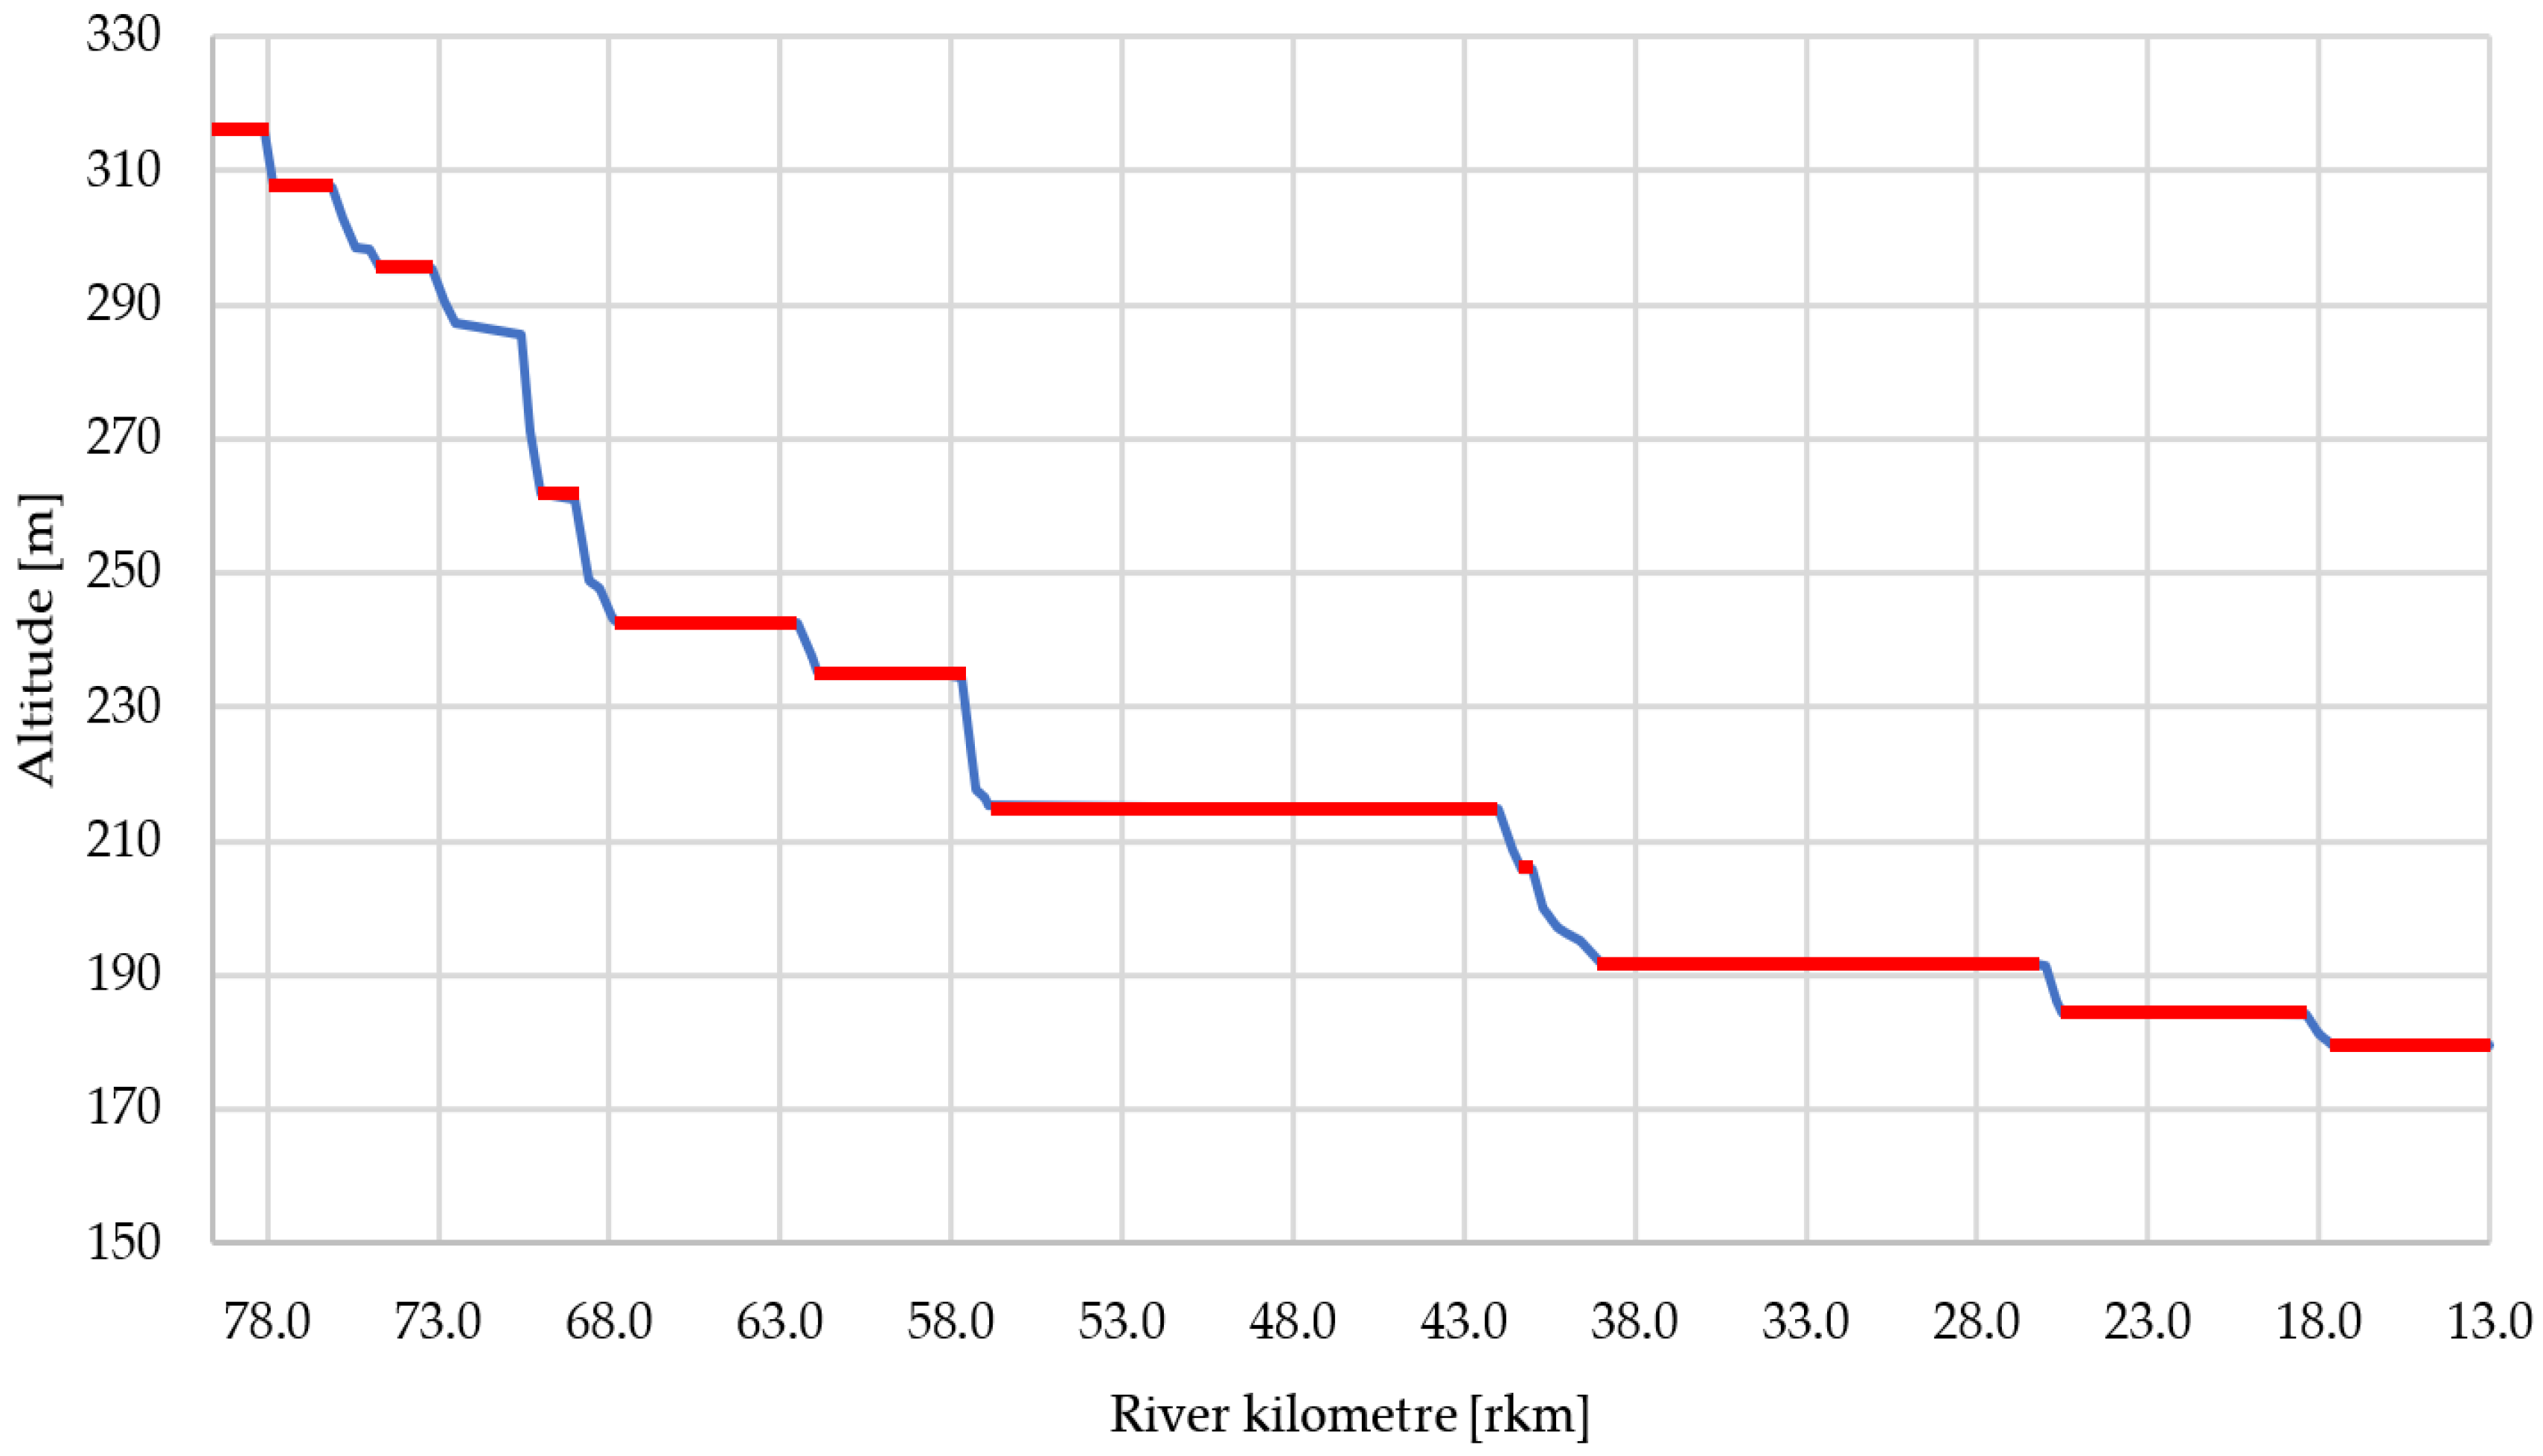
The altitudes at the individual points of the evaluated part of the Torysa river were obtained using a DEM model, the defined points forming the basis for determining the head of the individual elementary sections. The assessed part of the Torysa river is bounded by the altitude h1 = 316.4 m at the location of the river kilometre 79.6 km and the height h3 = 179.6 m at the location of the river kilometre 13.0 km, which also correspond to the border hydrological stations. The hydrological station located in the middle section on the 58.3 river kilometre is located at an altitude of h2 = 235.0 m.
Due to the relatively low density of hydrological stations on the assessed part of Torysa river, the parameters of flow rate were divided into two sections for the purposes of assessing the hydropower potential. The first section was located between the stations no. 8770 and no. 8780, the second section between stations no. 8780 and no. 8870. The average flow in these two sections was determined as the arithmetic average of the annual average flows recorded at the given hydrological stations. A value of 4.29 m3/s was used for the first section and 6.70 m3/s for the second section.
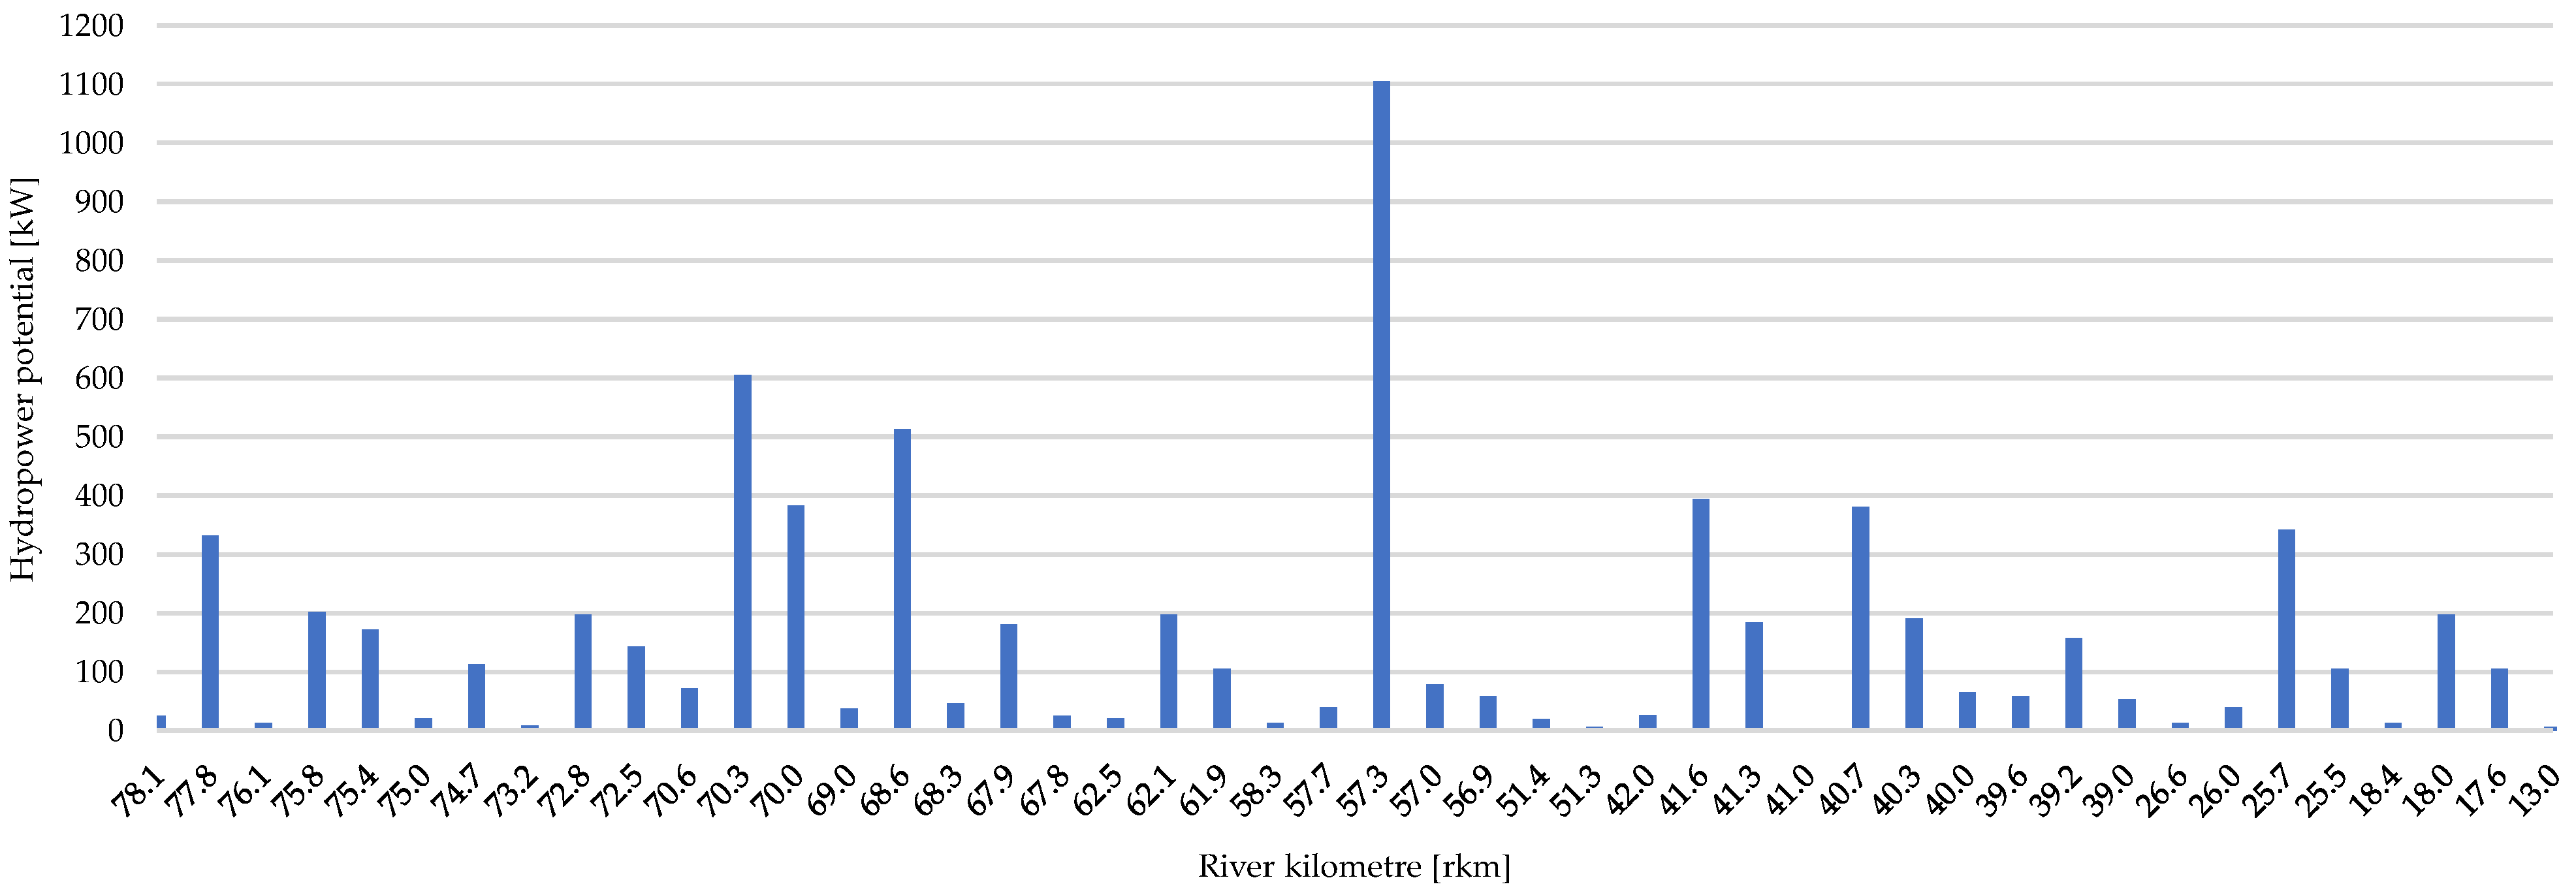
The resulting values of gross (theoretical), technical, and economic hydropower potential for a concrete location determined by the relevant river kilometre that were calculated based on Equations (1)–(7) are summarized in Table 6. Looking at the obtained data, it is possible to quantify the gross (theoretical) hydropower potential of a selected part of the Torysa river at the level of 7074 kW. However, when taking a closer look at the elevation profile of the evaluated river part, it is necessary to identify localities in which the head parameter of the elementary sections does not reach a height of 0.6 m. Under this value, it is not economically efficient to build mini or micro HPP in the conditions of the Slovak Republic. Localities on the assessed river section that do not meet this condition are shown graphically in Figure 5 by a red line.
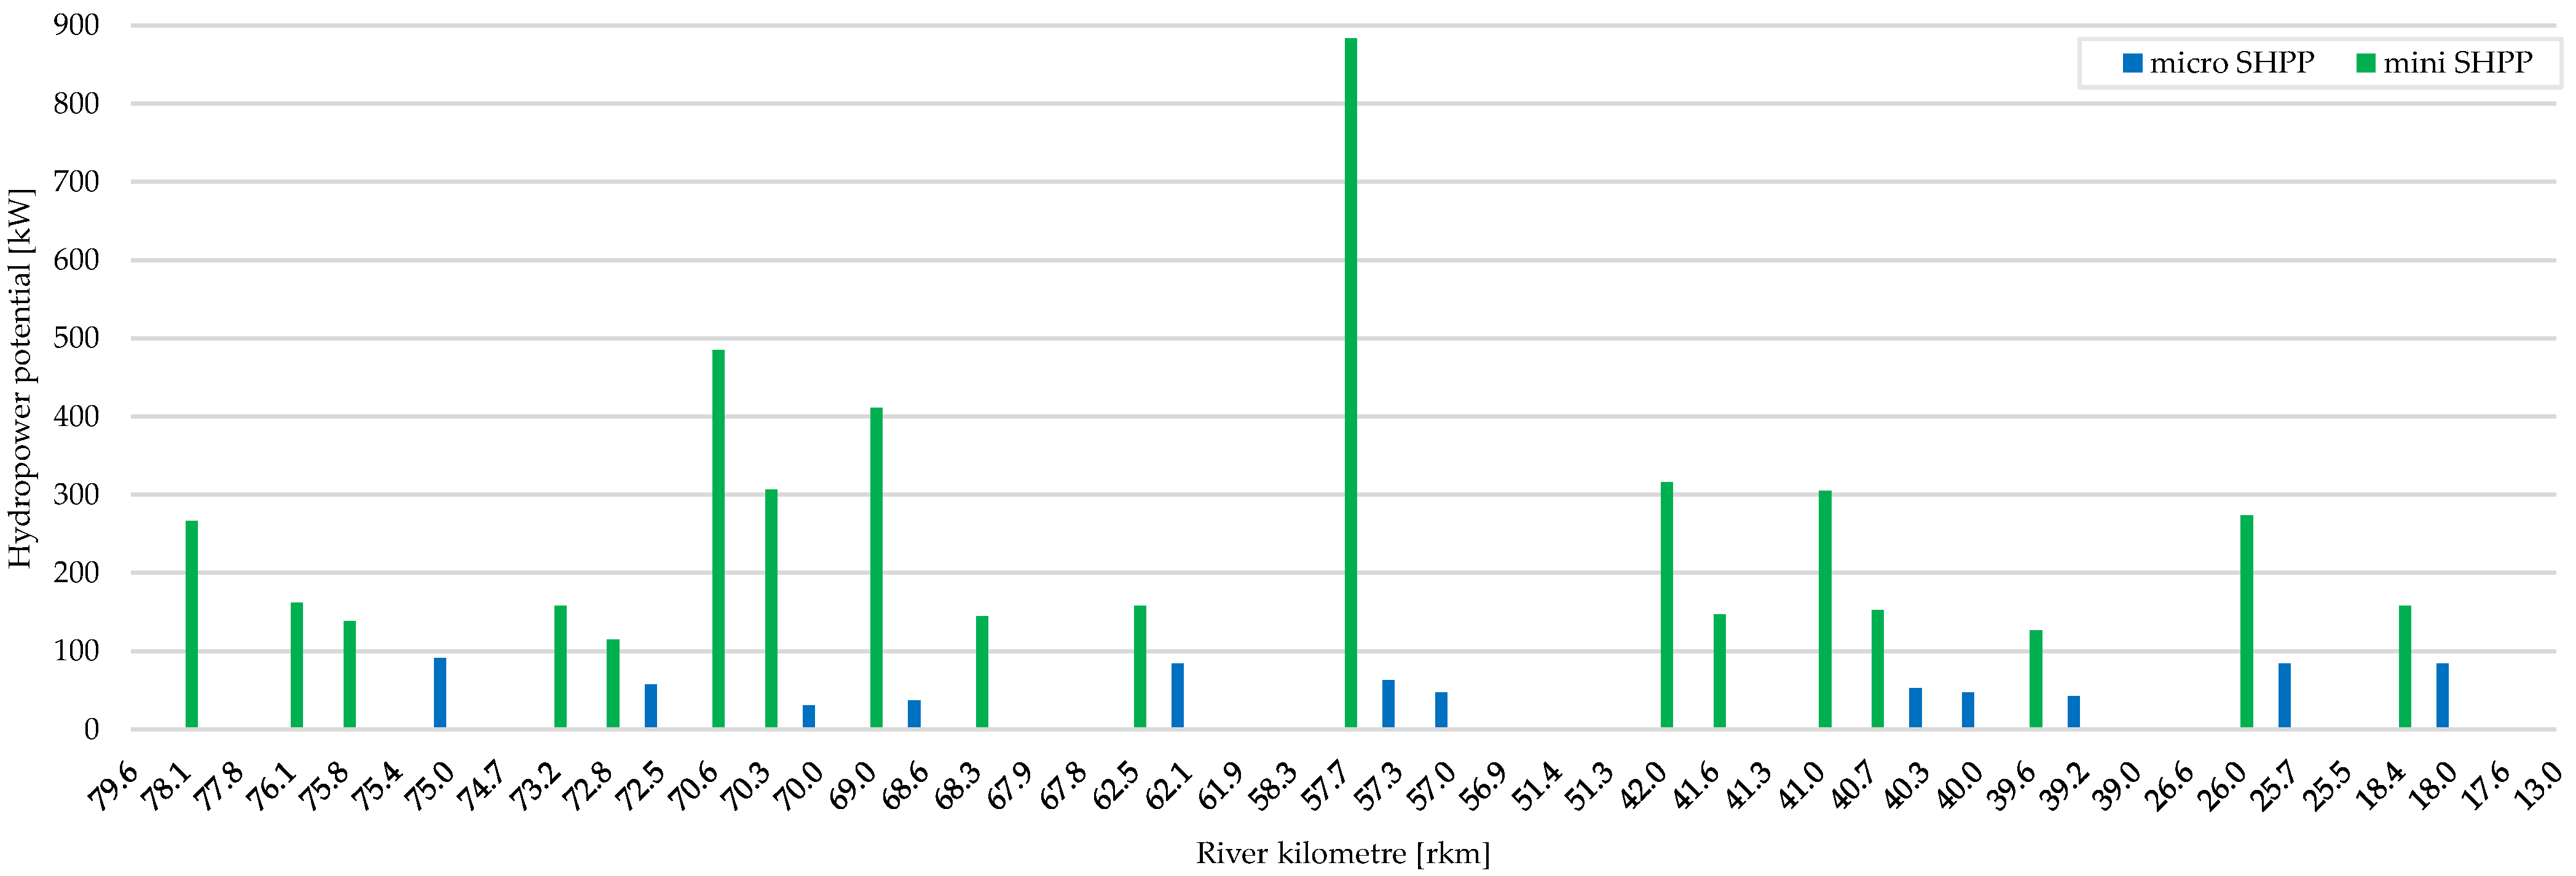
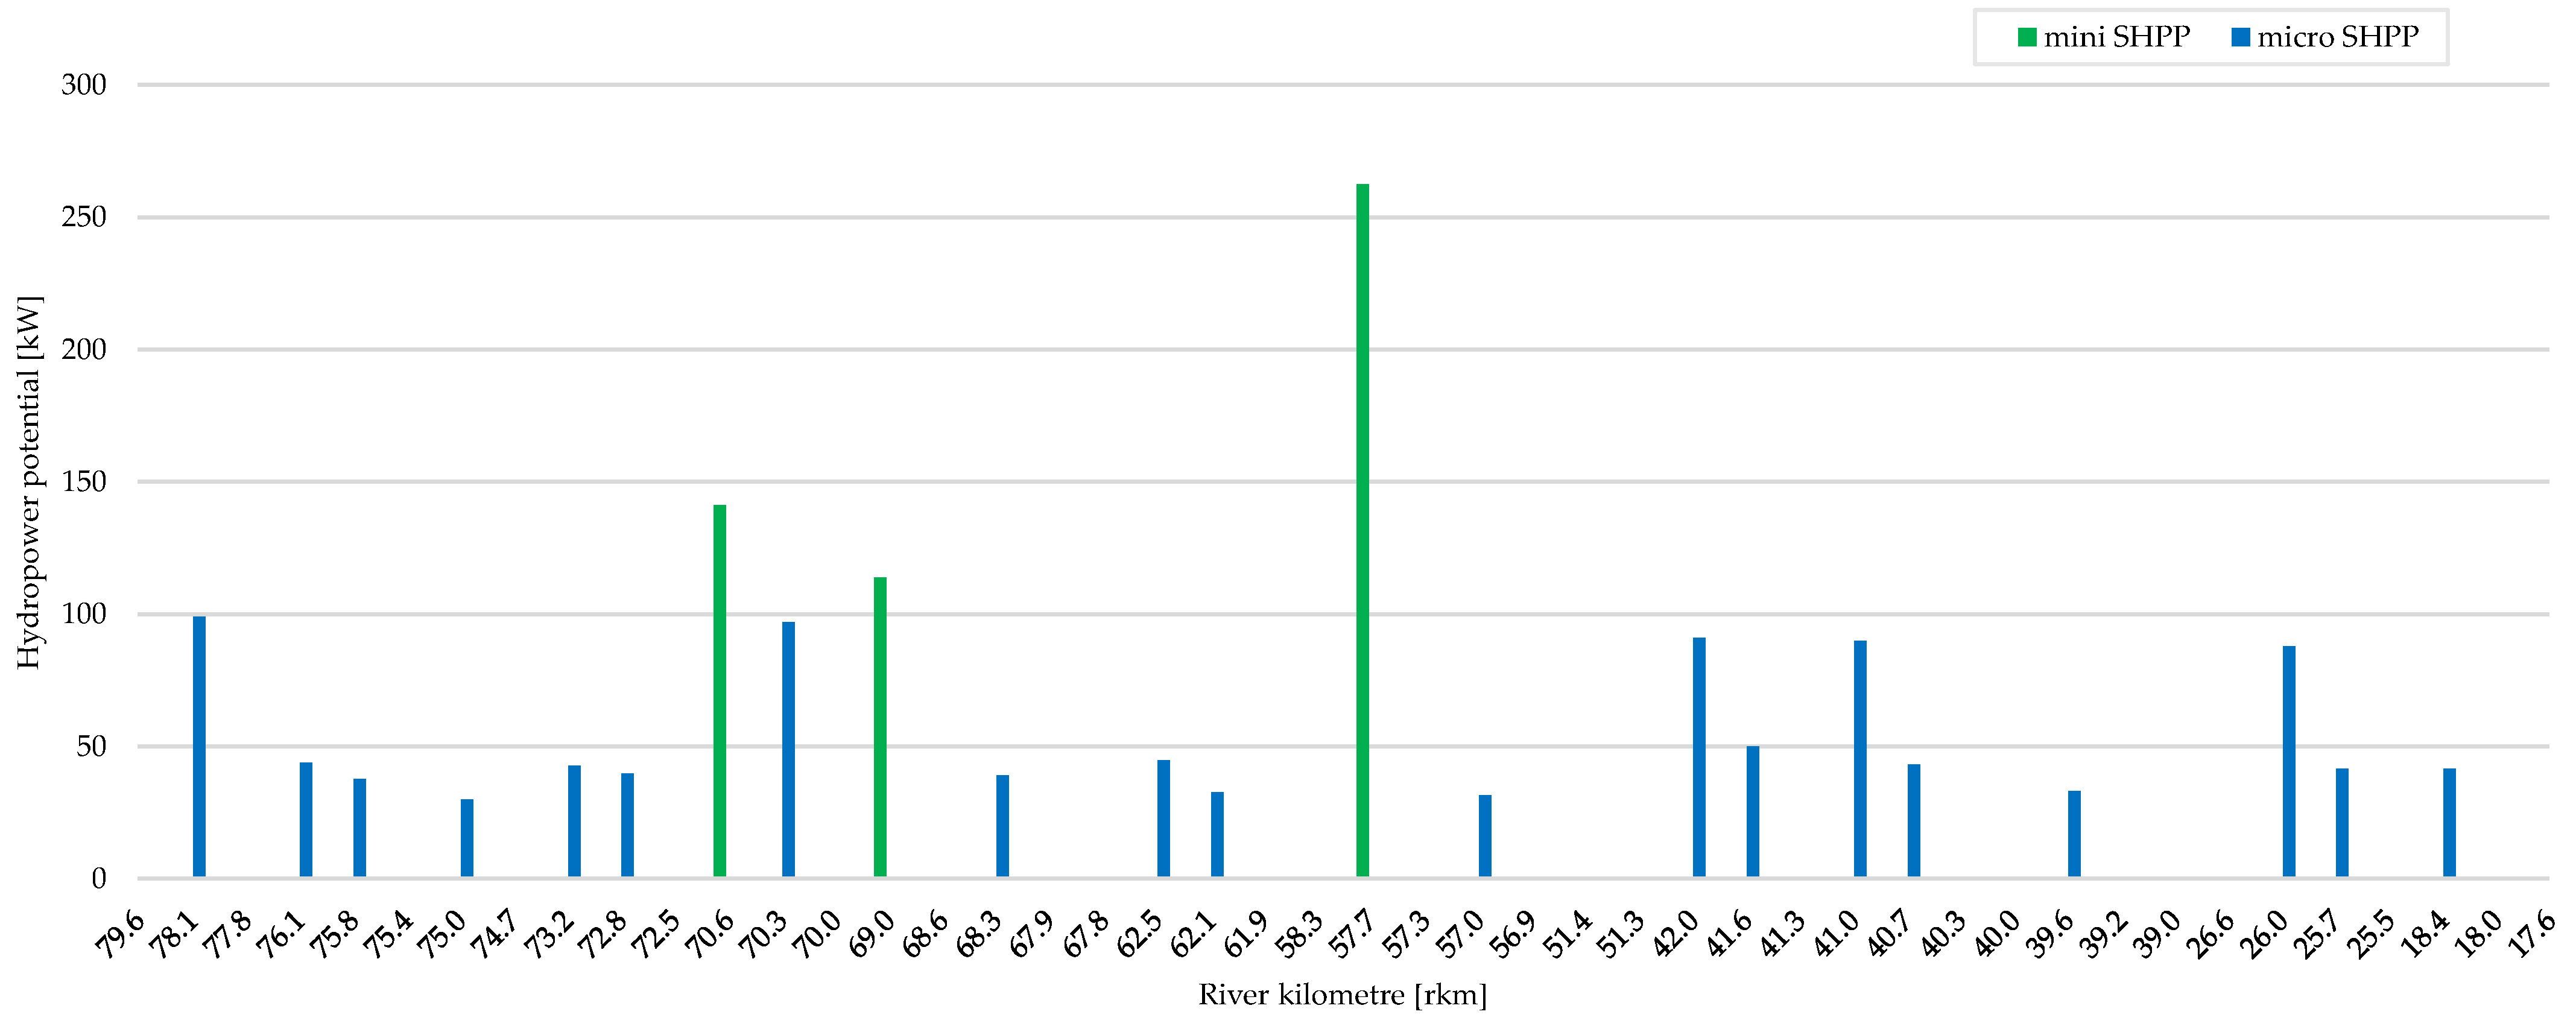
Based on this condition, unusable elementary sections of the river, which do not reach the required value of the head in the case of technical hydropower potential, or the value of the specific head in the case of the assessment of economic hydropower potential, were filtered out. Considering the data, it is then possible to quantify the technical hydropower potential of the selected part of the Torysa river at the level of 5425 kW and the economic hydropower potential at the level of 1533 kW. Table 6 shows the technical and economic potential as well as suitable locations within river kilometres marked with bolt font.
From the point of view of the classification of SHPP according to the installed capacity, it would be possible to consider the location of 18 mini hydropower plants with an output of over 100 kW and 12 micro hydropower plants with an output of up to 100 kW when assessing the technical potential. In this case, it would be possible to consider an output of 4705 kW in mini hydropower plants and an output of 720 kW in micro hydropower plants. If we consider the economic potential of the evaluated river section, these numbers will fall to 3 mini hydropower plants and 19 micro hydropower plants, in which case the mini hydropower plants would have an output of 517 kW and the micro hydropower plants 1016 kW. The concrete potential, type, and location depending on the river kilometre are shown in Figure 6, Figure 7 and Figure 8.
The selected part of the Torysa river has the most significant potential in the area of approximately 57 rkm; it also reaches significant potential values in the areas of approximately 70 rkm, 42 to 10 rkm, and 25 rkm. It can be stated that the first half of the evaluated part of the Torysa river has a significant potential for the use of hydropower, which is due mainly to the significant height segmentation of the river stream profile as well as sufficient flow parameters.
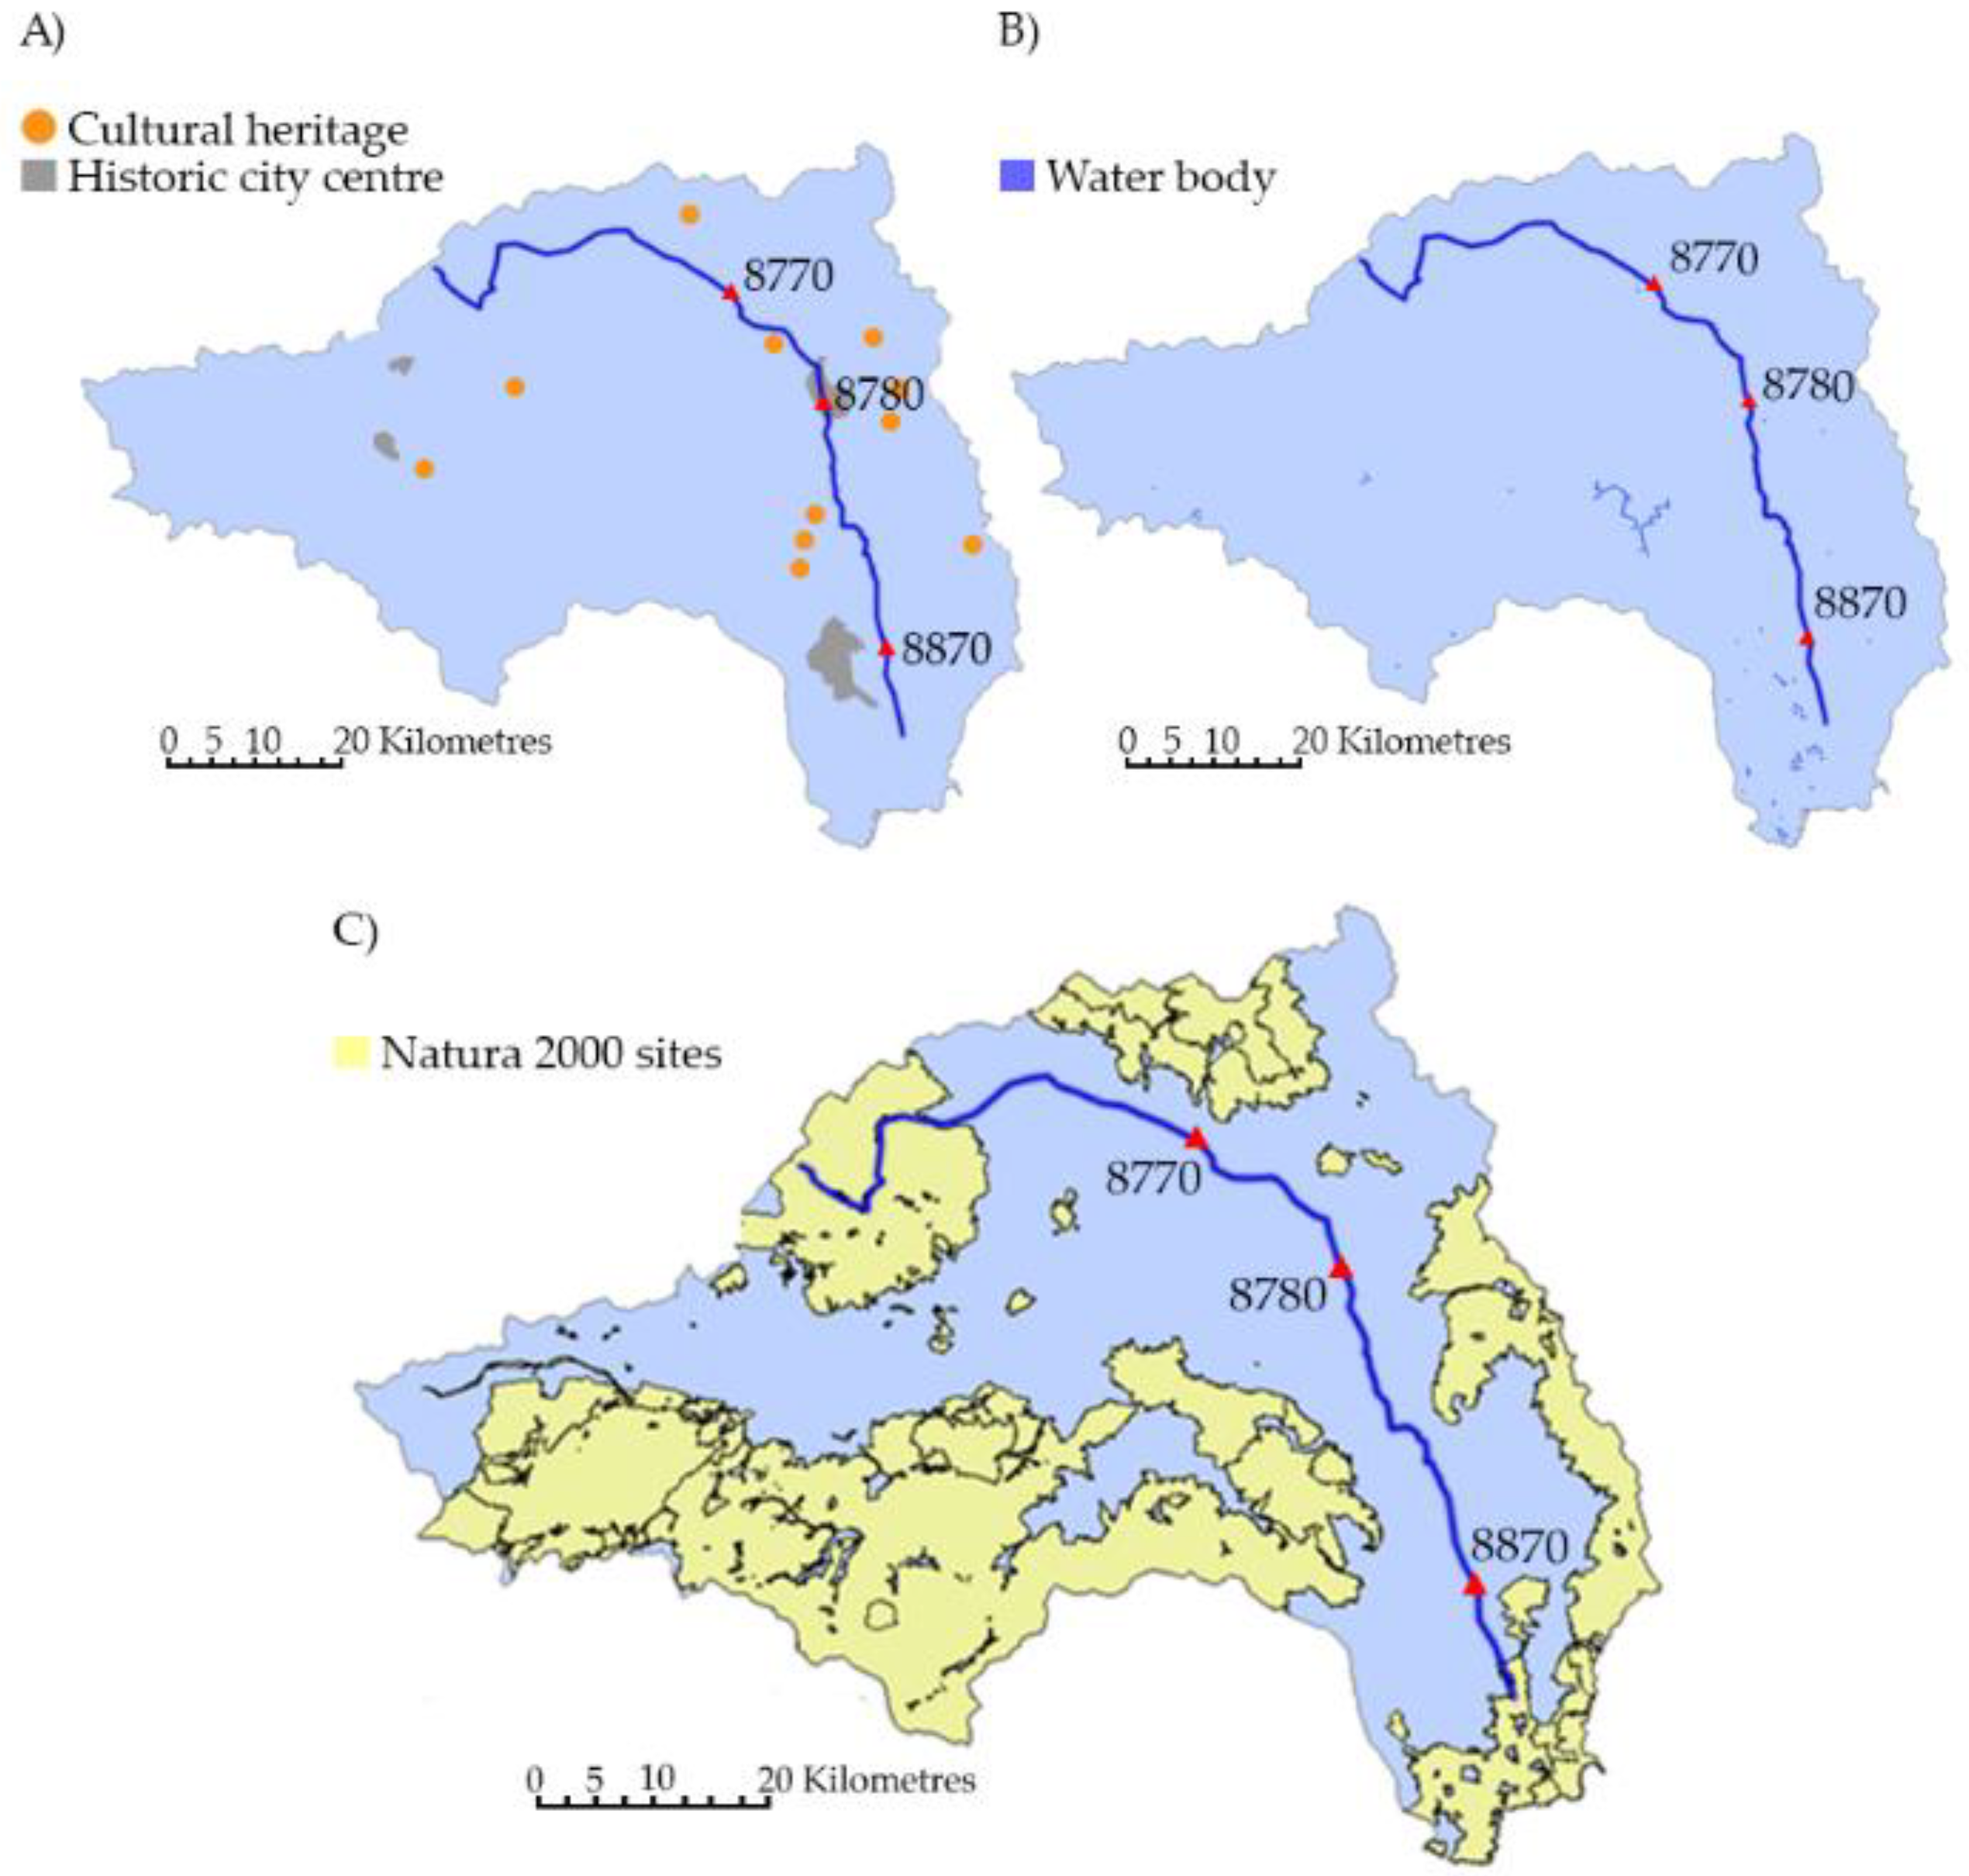
The last step in assessing the suitability of locations in terms of construction of SHPP is evaluation of their geographical collision with natural protected sites, other water structures, and historical monuments, which form significant obstacles under current legislation in the Slovak Republic. Figure 9 depicts a map composite of local constraints created in the GIS tool. The first Figure 9A shows the location of the selected part of the Torysa river and the surrounding cultural monuments and important urban centres; the second Figure 9B shows locations of water bodies of artificial or natural character; and the third Figure 9C shows locations of NATURA 2000 protection sites.
The map data presented above show that the assessed section between the displayed hydrological stations does not interfere with natural areas protected within the NATURA 2000 agenda. The selected river section also does not interfere with existing natural water bodies without hydropower potential (i.e., lakes, ponds, etc.). From the point of view of the proximity of historical buildings, only the area around the station no. 8780 was identified. However, this location has no significant hydropower potential and therefore does not represent a significant barrier of energy utilization of Torysa river.
Based on quantified output and identified sites suitable for the construction of mini and micro hydropower plants, it can be argued that the presented power plant would increase the availability of cheap and ecological energy for the population near the Torysa river. When evaluating the energy production of SHPP in terms of time, it is possible to use the capacity factor parameter, which determines the ratio of power utilization of the power plant. According to the IRENA study [36], a wide range of capacity factors, from 0.18 to 0.72, can be considered for SHPP installations located in Europe, with a weighted average of 0.5. This means that SHPP could achieve an installed capacity of 50%. When analysing the economic benefits arising from the use of RES, it is possible to use levelized cost of electricity (LCOE), which is defined as the price at which the generated electricity should be sold for the system to break even at the end of its lifetime. Based on the presented data [37], in EU conditions, the price of electricity produced from SHPP is 62 €/MWh, compared to 72 €/MWh for nuclear energy and 90 €/MWh for coal-fired power plants. From this comparison the use of mini- and micro-hydropower plants will improve the availability of energy resources (electricity) and reduce the critical parameters affecting energy poverty in the region.
4. Conclusions
The quality of life and the availability of basic energy inputs in the form of heat and electricity are, to a large extent, interconnected. In the absence of them, living standards fall dramatically and these is a threat to the population due to energy poverty. One of the ways to fight energy poverty is the extensive support of RES, which produce ecological and, with the right government support, cheap energy. The presented paper deals with the possibility of using the hydropower potential of a selected section of the Torysa river, which flows through an area that is at-risk in terms of the increase in energy poverty. In assessing the suitability for the construction of SHPP, the gross (theoretical), technical, and economic potential was quantified based on flow rate data and the height profile; specific localities were also identified where the specific head parameter allows one to build an economically efficient power plant. Within the evaluation of the area, mutual geographical collisions of the selected part of the Torysa river and critical areas were assessed from the point of view of nature protection (NATURA 2000), existence of natural water bodies without hydropower potential (i.e., lakes, ponds, etc.), or the proximity of cultural and historical monuments. Considering the technical potential, it would be possible to install 18 mini and 12 micro hydropower plants with an output of 4705 and 720 kW on the assessed part of the river. If a stricter criterion of the economic efficiency of the penstock length was considered, it would be possible to place 3 mini hydropower plants and 19 micro hydropower plants with an output of 517 kW and 1016 kW. Based on the assessment of the capacity factor of SHPP and LCOE of SHPP, it is possible to assume a significant reduction in the threat to the population of energy poverty in the region after the construction of particular power plants.
Author Contributions
Conceptualization, P.T. and M.B.; methodology, P.T.; formal analysis, P.T. and M.B.; resources, P.T.; data curation, M.B.; writing—original draft preparation, P.T. and M.B.; writing—review and editing, P.T. and M.B.; visualization, M.B.; funding acquisition, M.B. All authors have read and agreed to the published version of the manuscript.
Funding
This paper was created in connection with project VEGA 1/0290/21 Study of the behavior of heterogeneous structures based on PCM and metal foams as heat accumulators with application potential in technologies for obtaining and processing of the earth resources. This research was funded by the Scientific Grant Agency of the Ministry of Education, Science, Research and Sport of the Slovak Republic.
Institutional Review Board Statement
Not applicable.
Informed Consent Statement
Not applicable.
Data Availability Statement
Not applicable.
Conflicts of Interest
The authors declare no conflict of interest.
References
- Yaduvanshi, A.; Nkemelang, T.; Bendapudi, R.; New, M. Temperature and rainfall extremes change under current and future global warming levels across Indian climate zones. Weather Clim. Extrem. 2021, 31, 100291. [Google Scholar] [CrossRef]
- Vaughan, A. Global warming will drive extreme wet weather in summer. N. Sci. 2019, 243, 9. [Google Scholar] [CrossRef]
- Robert, R.; Schleyer-Lindenmann, A. How ready are we to cope with climate change? Extent of adaptation to sea level rise and coastal risks in local planning documents of southern France. Land Use Policy 2021, 104, 105354. [Google Scholar] [CrossRef]
- Tehrani, M.J.; Helfer, F.; Jenkins, G. Impacts of climate change and sea level rise on catchment management: A multi-model ensemble analysis of the Nerang River catchment, Australia. Sci. Total Environ. 2021, 777, 146223. [Google Scholar]
- Ranjbar, M.H.; Etemad-Shahidi, A.; Kamranzad, B. Modeling the combined impact of climate change and sea-level rise on general circulation and residence time in a semi-enclosed sea. Sci. Total Environ. 2020, 740, 140073. [Google Scholar] [CrossRef] [PubMed]
- Mallin, M.A.F. From sea-level rise to seabed grabbing: The political economy of climate change in Kiribati. Mar. Policy 2018, 97, 244–252. [Google Scholar] [CrossRef] [Green Version]
- Pastor-Paz, J.; Noy, I.; Sin, I.; Sood, A.; Fleming-Munoz, D.; Owen, S. Projecting the effect of climate change on residential property damages caused by extreme weather events. J. Environ. Manag. 2020, 276, 111012. [Google Scholar] [CrossRef]
- Calheiros, T.; Pereira, M.G.; Nunes, J.P. Assessing impacts of future climate change on extreme fire weather and pyro-regions in Iberian Peninsula. Sci. Total Environ. 2021, 754, 142233. [Google Scholar] [CrossRef]
- Gauthier, S.; May, B.; Vasseur, L. Ecosystem-Based Adaptation to Protect Avian Species in Coastal Communities in the Greater Niagara Region, Canada. Climate 2021, 9, 91. [Google Scholar] [CrossRef]
- Lazic, D.; Hipp, A.L.; Carlson, J.E.; Gailing, O. Use of Genomic Resources to Assess Adaptive Divergence and Introgression in Oaks. Forests 2021, 12, 690. [Google Scholar] [CrossRef]
- Łubek, A.; Kukwa, M.; Jaroszewicz, B.; Czortek, P. Shifts in Lichen Species and Functional Diversity in a Primeval Forest Ecosystem as a Response to Environmental Changes. Forests 2021, 12, 686. [Google Scholar] [CrossRef]
- Melamed, Y.; Kislev, M.; Weiss, E.; Simchoni, O. Extinction of water plants in the Hula Valley: Evidence for climate change. J. Hum. Evol. 2011, 60, 320–327. [Google Scholar] [CrossRef] [PubMed]
- Khanal, U.; Wilson, C.; Rahman, S.; Lee, B.L.; Hoang, V.N. Smallholder farmers’ adaptation to climate change and its potential contribution to UN’s sustainable development goals of zero hunger and no poverty. J. Clean. Prod. 2021, 281, 124999. [Google Scholar] [CrossRef]
- Woodward, A.; Porter, J.R. Food, hunger, health, and climate change. Lancet 2016, 387, 1886–1887. [Google Scholar] [CrossRef]
- Escanilla-Minchel, R.; Alcayaga, H.; Soto-Alvarez, M.; Kinnard, C.; Urrutia, R. Evaluation of the Impact of Climate Change on Runoff Generation in an Andean Glacier Watershed. Water 2020, 12, 3547. [Google Scholar] [CrossRef]
- Liddle, B.; Sadorsky, P. How much does increasing non-fossil fuels in electricity generation reduce carbon dioxide emissions? Appl. Energy 2017, 197, 212–221. [Google Scholar] [CrossRef]
- Slovak Ministry of Economy. Integrated National Energy and Climate Plan (2021–2030). 2019. Available online: https://ec.europa.eu/energy/sites/ener/files/sk_final_necp_main_en.pdf (accessed on 14 February 2021).
- Rahman, A.; Farrok, O.; Haque, M. Environmental impact of renewable energy source based electrical power plants: Solar, wind, hydroelectric, biomass, geothermal, tidal, ocean, and osmotic. Renew. Sustain. Energy Rev. 2022, 161, 112279. [Google Scholar] [CrossRef]
- European Commission. Energy Poverty May Affect Nearly 11% of the EU Population. Available online: https://ec.europa.eu/energy/en/news/energy-poverty-may-affect-nearly-11-eu-population (accessed on 5 February 2022).
- Slovak Climate Initiative. Energy poverty in Slovak Republic. 2020. Available online: https://klimatickainiciativa.sk/energeticka-chudoba-na-slovensku/ (accessed on 15 February 2021).
- Senova, A.; Skvarekova, E.; Wittenberger, G.; Rybarova, J. The Use of Geothermal Energy for Heating Buildings as an Option for Sustainable Urban Development in Slovakia. Processes 2022, 10, 289. [Google Scholar] [CrossRef]
- Zelenak, S.; Skvarekova, E.; Senova, A.; Wittenberger, G. The Usage of UCG Technology as Alternative to Reach Low-Carbon Energy. Energies 2021, 14, 3718. [Google Scholar] [CrossRef]
- Patro, E.R.; Kishore, T.S.; Haghighi, A.T. Levelized Cost of Electricity Generation by Small Hydropower Projects under Clean Development Mechanism in India. Energies 2022, 15, 1473. [Google Scholar] [CrossRef]
- Dhaubanjar, S.; Lutz, A.F.; Gernaat, D.; Nepal, S.; Smolenaars, W.; Pradhananga, S.; Biemans, H.; Ludwig, F.; Shrestha, A.B.; Immerzeel, W.W. A systematic framework for the assessment of sustainable hydropower potential in a river basin—The case of the upper Indus. Sci. Total Environ. 2021, 786, 147142. [Google Scholar] [CrossRef] [PubMed]
- Kenfack, J.; Nzotcha, U.; Voufo, J.; Ngohe-Ekam, P.S.; Nsangou, J.C.; Bignom, B. Cameroon’s hydropower potential and development under the vision of Central Africa power pool (CAPP): A review. Renew. Sustain. Energy Rev. 2021, 151, 111596. [Google Scholar] [CrossRef]
- Arthur, E.; Anyemedu, F.O.K.; Gyamfi, C.; Asantewaa-Tannor, P.; Adjei, K.A.; Anornu, G.K.; Odai, S.N. Potential for small hydropower development in the Lower Pra River Basin, Ghana. J. Hydrol. Reg. Stud. 2020, 32, 100757. [Google Scholar] [CrossRef]
- Eshra, N.M.; Zobaa, A.F.; Abdel Aleem, S. Assessment of mini and micro hydropower potential in Egypt: Multi-criteria analysis. Energy Rep. 2021, 7, 2352–4847. [Google Scholar] [CrossRef]
- Kwartnik-Pruc, A.; Mączyńska, A. Assessing Validity of Employing Surveying Methods to Capture Data on Topography to Determine Hydrological and Topographic Parameters Essential for Selecting Locations for the Construction of Small Hydropower Plants. Energies 2022, 15, 1527. [Google Scholar] [CrossRef]
- Torrefranca, I.; Otadoy, R.E.; Tongco, A. Incorporating Landscape Dynamics in Small-Scale Hydropower Site Location Using a GIS and Spatial Analysis Tool: The Case of Bohol, Central Philippines. Energies 2022, 15, 1130. [Google Scholar] [CrossRef]
- Liszka, D.; Krzemianowski, Z.; Węgiel, T.; Borkowski, D.; Polniak, A.; Wawrzykowski, K.; Cebula, A. Alternative Solutions for Small Hydropower Plants. Energies 2022, 15, 1275. [Google Scholar] [CrossRef]
- Zhou, Y.; Hejazi, M.; Smith, S.; Edmonds, J.; Li, H.; Clarke, L.; Calvin, K.; Thomson, A. A comprehensive view of global potential for hydro-generated electricity. Energy Environ. Sci. 2015, 8, 2622–2633. [Google Scholar] [CrossRef]
- Ehrbar, D.; Schmocker, L.; Vetsch, D.F.; Boes, R.M. Hydropower Potential in the Periglacial Environment of Switzerland under Climate Change. Sustainability 2018, 10, 2794. [Google Scholar] [CrossRef] [Green Version]
- Korkovelos, A.; Mentis, D.; Siyal, S.H.; Arderne, C.; Rogner, H.; Bazilian, M.; Howells, M.; Beck, H.; de Roo, A. A Geospatial Assessment of Small-Scale Hydropower Potential in Sub-Saharan Africa. Energies 2018, 11, 3100. [Google Scholar] [CrossRef] [Green Version]
- Dusicka, P.; Gabriel, P.; Hodák, T.; Čihák, F.; Šulek, P. Small Hydroelectric Power Plant; Jaga: Prague, Czech Republic, 2003; pp. 154–196. [Google Scholar]
- Dusicka, P.; Šulek, P. Semi-Peak Operation of the Regulating Canal Hydroelectric Power Plant; Slovak Technical University: Bratislava, Slovakia, 2009; pp. 80–91. [Google Scholar]
- International Renewable Agency. Renewable Power Generation Costs in 2014. Available online: https://www.irena.org/-/media/Files/IRENA/Agency/Publication/2015/IRENA_RE_Power_Costs/IRENA_RE_Power_Costs_2014_report_chapter7.pdf (accessed on 5 February 2022).
- European Commission. Final Report, Cost of Energy (LCOE). Available online: https://op.europa.eu/o/opportal-service/download-handler?identifier=e2783d72-1752-11eb-b57e-01aa75ed71a1&format=pdf (accessed on 5 February 2022).
Figure 1.
The proposed increase in the use of SHPP in the years 2023 to 2030 [17].
Figure 1.
The proposed increase in the use of SHPP in the years 2023 to 2030 [17].

Figure 2.
Households at risk of energy poverty according to the LIHC/m2 indicator in relation to the regions [20].
Figure 2.
Households at risk of energy poverty according to the LIHC/m2 indicator in relation to the regions [20].

Figure 3.
Location of the watercourse and representation of altitude data from the DEM model for the selected area of the watercourse Torysa.
Figure 3.
Location of the watercourse and representation of altitude data from the DEM model for the selected area of the watercourse Torysa.

Figure 4.
Flow duration curve of the Torysa river at hydrometric station Kosicke Olsany (8870).

Figure 5.
Elevation profile of a selected part of the Torysa River and marking of sections with an insufficient head.
Figure 5.
Elevation profile of a selected part of the Torysa River and marking of sections with an insufficient head.

Figure 6.
Gross (theoretical) hydropower potential of the Torysa river.

Figure 7.
Technical hydropower potential of the Torysa river.

Figure 8.
Economic hydropower potential of the Torysa river.

Figure 9.
Summary of possible geographical collisions with localities unsuitable for small hydro-electricity power plants ((A)—Locations of the cultural heritage sites, (B)—Locations of other water bodies, (C)—Locations of NATURA 2000 protected areas).
Figure 9.
Summary of possible geographical collisions with localities unsuitable for small hydro-electricity power plants ((A)—Locations of the cultural heritage sites, (B)—Locations of other water bodies, (C)—Locations of NATURA 2000 protected areas).


Table 1.
Numbers of SHPP, energy production, and size distributions in the Slovak Republic (2021) [17].
Table 1.
Numbers of SHPP, energy production, and size distributions in the Slovak Republic (2021) [17].
| Number of Power Plants | Installed Capacity [MW] | Produced Electric Energy [GWh] | |
|---|---|---|---|
| Total SHPP | 222 | 79.71 | 319.65 |
| SHPP 1–10 MW | 24 | 44.52 | 173.18 |
| SHPP 0.1–1 MW | 72 | 30.48 | 127.58 |
| SHPP under 0.1 MW | 126 | 4.71 | 18.90 |
Table 2.
Average flow rates of the Torysa river in the Sabinov hydrological station (8770).
| Year | Monthly Average Flow [m3/s] | ||||||||||||
|---|---|---|---|---|---|---|---|---|---|---|---|---|---|
| 1 | 2 | 3 | 4 | 5 | 6 | 7 | 8 | 9 | 10 | 11 | 12 | Average | |
| 2015 | 4.15 | 3.27 | 4.36 | 7.32 | 14.67 | 22.45 | 4.42 | 4.71 | 6.12 | 2.62 | 2.86 | 7.1 | 7.00 |
| 2016 | 4.95 | 2.62 | 3.41 | 2.95 | 5.02 | 2.22 | 6.39 | 3.71 | 1.10 | 0.98 | 0.70 | 0.73 | 2.66 |
| 2017 | 0.76 | 0.90 | 2.89 | 2.48 | 1.82 | 2.37 | 2.21 | 1.48 | 0.67 | 0.82 | 1.25 | 0.85 | 1.54 |
| 2018 | 1.16 | 1.80 | 7.70 | 11.72 | 3.57 | 5.56 | 2.87 | 0.88 | 0.93 | 0.90 | 2.62 | 1.32 | 3.41 |
| 2019 | 1.83 | 3.72 | 3.48 | 3.52 | 12.77 | 3.10 | 6.34 | 3.40 | 2.26 | 3.40 | 2.24 | 1.75 | 3.98 |
| Average | 2.57 | 2.45 | 4.37 | 5.54 | 6.97 | 7.14 | 4.45 | 2.84 | 2.21 | 1.74 | 1.93 | 2.35 | 3.72 |
| Discharge (%) | 5.87 | 5.09 | 9.98 | 12.25 | 15.91 | 15.78 | 10.15 | 6.47 | 4.89 | 3.98 | 4.27 | 5.36 | 100 |
| Minimum average | 0.76 | 0.90 | 2.89 | 2.48 | 1.82 | 2.22 | 2.21 | 0.88 | 0.67 | 0.82 | 0.70 | 0.73 | 1.54 |
| Maximum average | 4.95 | 3.72 | 7.70 | 11.71 | 14.67 | 22.45 | 6.39 | 4.71 | 6.12 | 3.40 | 2.86 | 7.10 | 7.00 |
Table 3.
Average flow rates of the Torysa river in the Presov hydrological station (8780).
| Year | Monthly Average Flow [m3/s] | ||||||||||||
|---|---|---|---|---|---|---|---|---|---|---|---|---|---|
| 1 | 2 | 3 | 4 | 5 | 6 | 7 | 8 | 9 | 10 | 11 | 12 | Average | |
| 2015 | 5.49 | 4.14 | 5.79 | 9.33 | 17.88 | 29.38 | 5.71 | 6.21 | 7.59 | 3.36 | 3.69 | 9.51 | 9.01 |
| 2016 | 6.48 | 3.56 | 4.54 | 3.81 | 2.52 | 2.77 | 7.85 | 4.50 | 1.45 | 1.41 | 0.99 | 1.06 | 3.46 |
| 2017 | 1.02 | 1.13 | 4.03 | 3.21 | 2.36 | 3.25 | 3.00 | 1.85 | 0.85 | 1.07 | 1.65 | 1.06 | 2.04 |
| 2018 | 1.65 | 2.49 | 10.79 | 15.74 | 4.91 | 7.80 | 3.90 | 1.18 | 1.27 | 1.17 | 3.53 | 1.72 | 4.67 |
| 2019 | 2.28 | 4.89 | 4.51 | 3.95 | 17.31 | 3.67 | 8.15 | 4.35 | 2.89 | 4.49 | 2.96 | 2.22 | 5.16 |
| Average | 3.46 | 3.23 | 5.93 | 7.21 | 8.99 | 9.37 | 5.72 | 3.62 | 2.81 | 2.29 | 2.57 | 3.11 | 4.86 |
| Discharge (%) | 6.03 | 5.12 | 10.35 | 12.17 | 15.69 | 15.83 | 9.98 | 6.32 | 4.74 | 4.01 | 4.33 | 5.43 | 100 |
| Minimum average | 1.02 | 1.13 | 4.03 | 3.21 | 2.36 | 2.77 | 3.00 | 1.18 | 0.85 | 1.07 | 0.99 | 1.06 | 2.04 |
| Maximum average | 6.84 | 4.89 | 10.79 | 15.74 | 17.88 | 29.38 | 8.15 | 6.21 | 7.59 | 4.49 | 3.69 | 9.51 | 9.01 |
Table 4.
Average flow rates of the Torysa river in the Kosicke Olsany hydrological station (8870).
| Year | Monthly Average Flow [m3/s] | ||||||||||||
|---|---|---|---|---|---|---|---|---|---|---|---|---|---|
| 1 | 2 | 3 | 4 | 5 | 6 | 7 | 8 | 9 | 10 | 11 | 12 | Average | |
| 2015 | 9.21 | 9.13 | 11.19 | 14.71 | 32.76 | 52.04 | 10.25 | 9.98 | 11.21 | 5.41 | 7.21 | 18.24 | 15.94 |
| 2016 | 12.80 | 6.56 | 9.65 | 7.14 | 4.49 | 4.16 | 11.68 | 8.34 | 2.43 | 2.42 | 1.96 | 2.22 | 6.20 |
| 2017 | 2.26 | 2.08 | 6.82 | 5.89 | 4.27 | 5.91 | 4.91 | 2.48 | 1.45 | 2.04 | 3.26 | 2.39 | 3.63 |
| 2018 | 4.09 | 6.49 | 22.12 | 26.78 | 8.42 | 13.74 | 6.48 | 2.10 | 2.28 | 2.05 | 5.76 | 3.02 | 8.59 |
| 2019 | 4.36 | 8.79 | 7.15 | 6.31 | 27.09 | 5.17 | 12.71 | 7.10 | 4.27 | 8.95 | 4.89 | 3.81 | 8.41 |
| Average | 6.49 | 6.58 | 11.39 | 12.17 | 15.47 | 16.21 | 9.21 | 5.99 | 4.33 | 4.17 | 4.62 | 5.94 | 8.55 |
| Discharge (%) | 6.45 | 5.94 | 11.30 | 11.69 | 15.35 | 15.57 | 9.14 | 5.94 | 4.16 | 4.41 | 4.43 | 5.89 | 100 |
| Minimum average | 2.03 | 2.08 | 6.83 | 5.89 | 4.26 | 4.16 | 4.91 | 2.10 | 1.45 | 2.04 | 1.96 | 2.22 | 3.63 |
| Maximum average | 12.80 | 9.13 | 22.12 | 26.78 | 32.67 | 52.04 | 12.71 | 9.98 | 11.21 | 8.95 | 7.20 | 18.24 | 15.94 |
Table 5.
The N-year maximum discharges of the Torysa river in the Kosicke Olsany hydrological station (8870).
Table 5.
The N-year maximum discharges of the Torysa river in the Kosicke Olsany hydrological station (8870).
| Number of Years | ||||||
|---|---|---|---|---|---|---|
| 1 | 2 | 5 | 10 | 20 | 50 | 100 |
| Flow [m3/s] | ||||||
| 89 | 127 | 180 | 218 | 260 | 315 | 360 |
Table 6.
Summary of gross (theoretical), technical, and economic hydropower potentials.
| River Kilometre | Length of Subsection | Elevation | Head | Specific Head | Gross Potential | Technical Potential | Economic Potential |
|---|---|---|---|---|---|---|---|
| [km] | [km] | [m] | [m] | [m/100 m] | [kW] | [kW] | [kW] |
| 79.6 | - | 316.4 | - | - | - | - | - |
| 78.1 | 1.5 | 315.8 | 0.6 | 0.05 | 25.3 | 0.0 | 0.0 |
| 77.8 | 0.3 | 307.9 | 7.9 | 2.94 | 332.5 | 266.0 | 99.0 |
| 76.1 | 1.7 | 307.6 | 0.3 | 0.02 | 12.6 | 0.0 | 0.0 |
| 75.8 | 0.3 | 302.8 | 4.8 | 1.3 | 202.0 | 161.6 | 43.8 |
| 75.4 | 0.4 | 298.7 | 4.1 | 1.12 | 172.5 | 138.1 | 37.7 |
| 75.0 | 0.4 | 298.2 | 0.5 | 0.14 | 21.0 | 0.0 | 0.0 |
| 74.7 | 0.3 | 295.5 | 2.7 | 0.89 | 113.6 | 90.9 | 30.0 |
| 73.2 | 1.5 | 295.3 | 0.2 | 0.02 | 8.4 | 0.0 | 0.0 |
| 72.8 | 0.4 | 290.6 | 4.7 | 1.27 | 197.8 | 158.3 | 42.8 |
| 72.5 | 0.3 | 287.2 | 3.4 | 1.18 | 143.1 | 114.5 | 39.7 |
| 70.6 | 1.9 | 285.5 | 1.7 | 0.09 | 71.5 | 57.3 | 0.0 |
| 70.3 | 0.3 | 271.1 | 14.4 | 4.19 | 606.0 | 484.9 | 141.1 |
| 70.0 | 0.3 | 262 | 9.1 | 2.88 | 383.0 | 306.5 | 97.0 |
| 69.0 | 1 | 261.1 | 0.9 | 0.09 | 37.9 | 30.3 | 0.0 |
| 68.6 | 0.4 | 248.9 | 12.2 | 3.38 | 513.4 | 410.9 | 113.8 |
| 68.3 | 0.3 | 247.8 | 1.1 | 0.31 | 46.3 | 37.0 | 0.0 |
| 67.9 | 0.4 | 243.5 | 4.3 | 1.16 | 181.0 | 144.8 | 39.1 |
| 67.8 | 0.1 | 242.9 | 0.6 | 0.5 | 25.3 | 0.0 | 0.0 |
| 62.5 | 5.3 | 242.4 | 0.5 | 0.01 | 21.0 | 0.0 | 0.0 |
| 62.1 | 0.4 | 237.7 | 4.7 | 1.33 | 197.8 | 158.3 | 44.8 |
| 61.9 | 0.2 | 235.2 | 2.5 | 0.97 | 105.2 | 84.2 | 32.7 |
| 58.3 | 3.6 | 235 | 0.2 | 0 | 13.2 | 0.0 | 0.0 |
| 57.7 | 0.6 | 234.4 | 0.6 | 0.1 | 39.5 | 0.0 | 0.0 |
| 57.3 | 0.4 | 217.6 | 16.8 | 4.99 | 1105.0 | 883.6 | 262.4 |
| 57.0 | 0.3 | 216.4 | 1.2 | 0.39 | 78.9 | 63.1 | 0.0 |
| 56.9 | 0.1 | 215.5 | 0.9 | 0.6 | 59.2 | 47.3 | 31.6 |
| 51.4 | 5.5 | 215.2 | 0.3 | 0.01 | 19.7 | 0.0 | 0.0 |
| 51.3 | 0.1 | 215.1 | 0.1 | 0.12 | 6.6 | 0.0 | 0.0 |
| 42.0 | 9.3 | 214.7 | 0.4 | 0 | 26.3 | 0.0 | 0.0 |
| 41.6 | 0.4 | 208.7 | 6 | 1.73 | 394.7 | 315.6 | 91.0 |
| 41.3 | 0.3 | 205.9 | 2.8 | 0.95 | 184.2 | 147.3 | 50.0 |
| 41.0 | 0.3 | 205.9 | 0 | 0 | 0.0 | 0.0 | 0.0 |
| 40.7 | 0.3 | 200.1 | 5.8 | 1.71 | 381.5 | 305.1 | 89.9 |
| 40.3 | 0.4 | 197.2 | 2.9 | 0.82 | 190.8 | 152.5 | 43.1 |
| 40.0 | 0.3 | 196.2 | 1 | 0.31 | 65.8 | 52.6 | 0.0 |
| 39.6 | 0.4 | 195.3 | 0.9 | 0.22 | 59.2 | 47.3 | 0.0 |
| 39.2 | 0.4 | 192.9 | 2.4 | 0.63 | 157.9 | 126.2 | 33.1 |
| 39.0 | 0.2 | 192.1 | 0.8 | 0.34 | 52.6 | 42.1 | 0.0 |
| 26.6 | 12.4 | 191.9 | 0.2 | 0 | 13.2 | 0.0 | 0.0 |
| 26.0 | 0.6 | 191.3 | 0.6 | 0.11 | 39.5 | 0.0 | 0.0 |
| 25.7 | 0.3 | 186.1 | 5.2 | 1.67 | 342.0 | 273.5 | 87.8 |
| 25.5 | 0.2 | 184.5 | 1.6 | 0.79 | 105.2 | 84.2 | 41.6 |
| 18.4 | 7.1 | 184.3 | 0.2 | 0 | 13.2 | 0.0 | 0.0 |
| 18.0 | 0.4 | 181.3 | 3 | 0.79 | 197.3 | 157.8 | 41.6 |
| 17.6 | 0.4 | 179.7 | 1.6 | 0.42 | 105.2 | 84.2 | 0.0 |
| 13.0 | 4.6 | 179.6 | 0.1 | 0 | 6.6 | 0.0 | 0.0 |
Publisher’s Note: MDPI stays neutral with regard to jurisdictional claims in published maps and institutional affiliations. |
© 2022 by the authors. Licensee MDPI, Basel, Switzerland. This article is an open access article distributed under the terms and conditions of the Creative Commons Attribution (CC BY) license (https://creativecommons.org/licenses/by/4.0/).
Share and Cite
MDPI and ACS Style
Tauš, P.; Beer, M. Evaluation of the Hydropower Potential of the Torysa River and Its Energy Use in the Process of Reducing Energy Poverty of Local Communities. Energies 2022, 15, 3584. https://0-doi-org.brum.beds.ac.uk/10.3390/en15103584
AMA Style
Tauš P, Beer M. Evaluation of the Hydropower Potential of the Torysa River and Its Energy Use in the Process of Reducing Energy Poverty of Local Communities. Energies. 2022; 15(10):3584. https://0-doi-org.brum.beds.ac.uk/10.3390/en15103584
Chicago/Turabian StyleTauš, Peter, and Martin Beer. 2022. "Evaluation of the Hydropower Potential of the Torysa River and Its Energy Use in the Process of Reducing Energy Poverty of Local Communities" Energies 15, no. 10: 3584. https://0-doi-org.brum.beds.ac.uk/10.3390/en15103584
Note that from the first issue of 2016, this journal uses article numbers instead of page numbers. See further details here.