
Research on Prediction Method of Volcanic Rock Shear Wave Velocity Based on Improved Xu–White Model


1
Institute of Geophysical and Geochemical Exploration, China Geological Survey, Langfang 065000, China
2
College of Information Science and Engineering, Henan University of Technology, Zhengzhou 450001, China
3
College of Geo-Exploration Science and Technology, Jilin University, Changchun 130021, China
*
Author to whom correspondence should be addressed.
Energies 2022, 15(10), 3611; https://0-doi-org.brum.beds.ac.uk/10.3390/en15103611
Submission received: 14 April 2022
/
Revised: 10 May 2022
/
Accepted: 13 May 2022
/
Published: 15 May 2022
(This article belongs to the Special Issue AI Technologies in Oil and Gas Geological Engineering)
Abstract
:Volcanic rock reservoirs have received extensive attention from scholars all over the world because of their geothermal, mineral, and oil and gas resources. Shear wave velocity is the essential information for AVO (amplitude variation with offset) analysis and the reservoir description of volcanic rocks. However, due to factors such as cost, technical reasons, and so on, shear wave velocity is not provided in many logging data. This paper proposes a shear wave velocity prediction method suitable for the conventional logging of volcanic rocks. Firstly, the Xu–White model is improved. The probability distributions formed by the prior information of the logging area are used to initialize the key petrophysical parameters in the model instead of the fixed parameter value to establish the statistical petrophysical model between the logging curve and shear wave velocity. Then, based on the Bayesian inversion method, the simulated P-wave velocity is matched with the actual P-wave logging data to calculate the key petrophysical parameters, and is then used for S-wave velocity prediction. The method is applied to the actual logging data of the No. 5 structure in Nanpu Sag, eastern China. The prediction effect of shear wave velocity is better than that of the conventional method, indicating the feasibility and effectiveness of this method. This study will provide more accurate shear wave velocity data for the exploration and development of volcanic reservoirs.
1. Introduction
Volcanic reservoirs contain a variety of resources, including subsurface thermal energy, mineral resources, groundwater, and oil and gas deposits. As the degree of exploration and development continues, the volcanic reservoir has attracted much attention as a special type of oil and gas reservoir. Since the discovery of the world’s first volcanic oil and gas reservoir in California, Russia, Cuba, Argentina, Japan, and other countries have successively discovered high-yield volcanic oil and gas reservoirs [1,2,3,4]. Since the 1970s, volcanic oil and gas reservoirs have been found in the Bohai Bay Basin, the Junggar Basin in Xinjiang, the Erlian Basin in Inner Mongolia, the Jianghan Basin, the Subei Basin, and the Tarim Basin in China [5,6,7,8]. The research methods of volcanic reservoirs mainly include geophysical methods (seismic information identification, magnetotelluric measurement, high-precision gravity and magnetic exploration, time domain field sounding, frequency domain continuous electromagnetic profile, and geophysical logging), volcanic chronology research methods, volcanic lithofacies, petrology and petrochemistry research methods, and volcanic reservoir and diagenesis research methods, as well as the conditions and mechanisms of volcanic reservoir accumulation and types of volcanic reservoirs. With the continuous discovery of volcanic reservoirs, reservoir evaluation technology has entered a new stage of development. More attention has been paid to the application of geophysical methods such as logging and seismic. The lithology identification, reservoir description, and fracture properties of volcanic rocks have become the core content of the study.
S-wave velocity plays a key role in seismic pre-stack inversion and reservoir attribute analysis, and it is also an important parameter for petrophysical property inversion, reservoir lithology, and fracture fluid identification. However, in actual production, due to limitations in well location, logging technology, and acquisition cost, shear wave velocity information is usually scarce in logging data, making volcanic rock shear wave velocity prediction an important issue that needs to be addressed. A number of empirical formulas and petrophysical models have been proposed to establish the link between logging information and shear wave velocity. Castagna et al. [9] proposed the “mudstone line” formula and revealed the empirical relationship between P-wave and S-wave velocities. Han et al. [10] considered the influence of porosity and clay content on velocity, and then gave us the linear regression equation between P-wave velocity and S-wave velocity under different pressures. Qingzhong Li [11] proposed the nonlinear relationship between the P-wave velocity and S-wave velocity of water-saturated sandstone. Greenberg et al. [12] proposed empirical formulas for the water-saturated P-wave and S-wave velocities of various mineral components. Yan et al. [13] improved Han’s empirical formula by considering the influence of pore aspect ratio on velocity. Vernik et al. [14] proposed a mixing method based on the Greenberg–Castagna theory, and then they considered the influence of kerogen on shear wave velocity. Sohail and Hawkes [15] evaluated different empirical and petrophysical models for shear wave velocity prediction and considered the modified Xu–White model the best choice available at present.
The prediction of shear wave velocity by an empirical formula is based on the fitting relationship between the actual shear wave velocity and other logging curve data. However, because the physical mechanism of rock is not considered, the accuracy of prediction results is insufficient. The petrophysical model describes the influence of microstructure on the overall properties of rock and connects the micro characteristics of rock, such as porosity and pore structure, with macro characteristics such as elastic modulus and velocity. Berryman [16] proposed an equivalent medium self-compatible approximation (SCA) model, assuming that rocks are composed of ellipsoidal bodies with different pore aspect ratios. Xu and White [17,18] proposed an equivalent medium model for muddy sandstone reservoirs, considering the pore geometry of the reservoir. Keys and Xu [19] introduced an approximate equation for the dry rock modulus to improve the Xu–White model. Lee [20] improved the pride model to calculate the consolidation coefficient of compacted dry sandstone, followed by calculating the shear wave velocity. Ruiz and Dvorkin [21] proposed a differential equivalent medium model (DEM) to predict shear wave velocity with a fixed pore aspect ratio. Bai et al. [22] improved the Xu–White model with a variable pore aspect ratio. Bing Zhang et al. [23] established a statistical rock model suitable for anisotropic shale reservoir parameter inversion, which provides a reference for shear wave velocity prediction.
Volcanic reservoirs are characterized by irregular pore structures, diverse mineral compositions, and physical anisotropy [24,25,26]. Pan et al. [24] developed a petrophysical model of volcanic rocks using QAPM (Q (quartz), A (alkali feldspar), P (plagioclase), and M (magnesian iron)) and porosity based on a classification scheme, but the influence of tuffs was not considered in this model. Zhao et al. [8] developed a binary petrophysical model based on the equivalent medium self-compatible approximation (SCA) model, treating acidic volcanic rocks as matrix minerals, and medium–basic volcanic rocks as infill minerals. Wang et al. [27] applied the Greenberg–Castagna theory to volcanic reservoirs and directly used empirical formulas to predict the shear wave velocity of the reservoir. Xu et al. [28] proposed an improved model suitable for volcanic reservoirs by combining the Xu–White model and the differential equivalent medium model (DEM). In a follow-up study, Xu et al. [29] proposed an isotropic volcanic rock model and incorporated the effects of multiple minerals and pore structures.
Combining the existing research and the characteristics of volcanic rock reservoirs, this paper will propose a regional shear wave velocity prediction method based on the improved Xu–White model for the conventional logging of volcanic rock. Due to the limited data provided by conventional logging, we first analyze the key petrophysical parameters affecting velocity in the Xu–White model and fully collect the prior information to form the prior distributions for model parameter initialization. Use of the prior distribution to initialize the Xu–White model and construct a statistical petrophysical model can overcome the shortcomings of insufficient conventional logging data. Then, combined with a statistical model and Bayesian inversion method, the key petrophysical parameters are calculated and the shear wave velocity curve is predicted by matching the simulated P-wave velocity with the P-wave velocity in the actual logging. The effectiveness of the method is verified by testing the conventional logging data on actual volcanic rocks.
2. Fundamental Principles
2.1. Geological Characteristics of Volcanic Reservoir
When magma in the deep crust overflows or erupts through cracks, it solidifies rapidly in the air to form volcanic rock. Due to the special diagenetic mechanism, the volcanic reservoir has diverse mineral components, a complex pore structure, and strong heterogeneity. The mineral composition of volcanic rock is complex and diverse, mainly composed of silicates of magnesium, iron, aluminium, potassium, calcium, sodium, and oxides of magnesium and iron. The most important minerals are quartz, feldspar, pyroxene, hornblende, mica, and olivine. Volcanic reservoirs are fractured reservoirs with various types of reservoir spaces. The lithology, clastic particles, tectonics, and epigenetic diagenesis of volcanic rocks all influence the development of reservoir spaces, mainly including pores, fractures, dissolution pores, and the mutual coupling between them in the form of fractures/pores, fractures/dissolution pores, and dissolution pores/fractures. The development phase of reservoir pore space and the combination of different reservoir spaces led to great differences in the reservoir capacity of volcanic reservoirs. Accurate velocity information allows us to effectively analyze the lithology, physical properties, fluid properties, and other characteristics of volcanic rock stratum, which can be used for fracture attribute identification, fluid property analysis, and formation pressure prediction, whereafter we then judge the storage and seepage performance of the volcanic rock reservoir and detect the trapping of oil and gas in the reservoir.
2.2. Shear Wave Prediction Method Based on Han’s Empirical Formula
The basis of using the empirical formula to predict shear wave velocity is the relationship among different rock attributes established by actual data. This method directly establishes the relationship between target parameters and the logging curve; it is simple to calculate and is widely used in practical shear wave velocity prediction. Han et al. [10] gave us the linear regression equation between P-wave velocity and S-wave velocity by measuring rock samples under different pressures and considering the effects of porosity and clay content in argillaceous sandstone. For water-saturated rock under 40 MPa pressure, the equations are as follows:
is the P-wave velocity, is the S-wave velocity, is the porosity, and is the clay content.
Although the empirical formula proposed by Han is a simple method, it is widely used in practical production, and the accuracy of the predictions is acceptable.
2.3. Shear Wave Prediction Method Based on the Xu–White Model
The petrophysical model connects the microstructure and composition of rock with the overall attributes and describes the influence of the internal attributes of rock on external elastic attributes. Due to the particularity of the diagenetic mechanism of volcanic rocks, the pore types are complex and diverse, in which tuffaceous minerals are similar to clay. Considering the large proportion of tuffaceous minerals, it cannot be ignored in the construction of the volcanic rock petrophysical model. The Xu–White model can be used to build a volcanic rock petrophysical model to predict shear wave velocity.
Xu and White [17,18] proposed the Xu–White model based on the Gassmann fluid substitution equation, K-T equation, and differential equivalent medium theory (DEM), taking into account porosity, matrix properties, fluids, and pore aspect ratios. The matrix in the model consists of sand and clay, and the pores are divided into sand-related pores with a large pore aspect ratio and clay-related pores with a small pore aspect ratio. The equations are expressed as follows:
In order to avoid the excessive amount of iterative calculation in DEM differential calculation, Keys and Xu [19] improved the Xu–White model and determined the elastic modulus of a rock skeleton by solving the first-order linear ordinary differential equations. The formula for the elastic modulus of an argillaceous sandstone dry rock skeleton is as follows:
In Equations (1)–(8), , , and are total porosity, sand-related porosity, and clay-related porosity, respectively. and are the volume fraction of sand and clay, + = 1 − . , and are the bulk moduli of the rock skeleton, rock mineral matrix, and pore fluid, respectively. , and are the shear modulus of the rock skeleton, rock mineral matrix, and pore fluid, respectively. For dry rock, and are zero, are functions of the pore aspect ratio α, and and are geometric factors.
The equations for and are as follows:
is the volume fraction of the relevant mineral components.
Berryman [16] proposed an n-phase mixture self-compatibility approximation model (SCA) to estimate the equivalent elastic modulus of multiphase media and revealed the scalars required to calculate and
Some parameters in the above formula are calculated by the following formula:
In the equation, and are the bulk modulus and shear modulus of each mineral component, respectively. and are the bulk modulus and shear modulus of the mineral matrix, respectively.
The Gassmann fluid substitution equation [30] allows for one fluid-saturated rock velocity to predict another fluid-saturated rock velocity, and likewise the rock skeleton velocity can be used to predict fluid-saturated rock velocity. The relationship and formulas are as follows:
In the equation, and are the fluid-saturated rock bulk modulus and shear modulus.
Hill’s average formula [31] can calculate the modulus of mineral matrix without considering the mineral geometry.
In the equation, i is a mineral in the matrix, Mi is the modulus corresponding to the mineral, is the volume fraction corresponding to the mineral, and is the Hill effective modulus.
The Wood formula [32] can calculate the equivalent modulus of the pore fluid mixture. The formula is as follows:
In the formula, and are the volume fraction and bulk modulus of fluid components, respectively.
When seismic waves are in a homogeneous, isotropic elastic medium, the wave velocity can be expressed by the rock bulk modulus, shear modulus, and density. The formulas are as follows:
In the formula, is the fluid-saturated rock density, and and are the P-wave and S-wave velocities of the fluid-saturated rock.
The equations for the density of fluid-saturated rock are as follows:
In the equation, and are the density of the mineral matrix and the density of the saturated fluid, respectively. is the water saturation. , , and are the densities of sand, clay, gas, and water, respectively.
When given the volume fraction, density, and intrinsic modulus of sand, clay, and pores, the aspect ratio of sand-related pore space and clay-related pore space, the mineral matrix modulus is first calculated using Hill’s average (Equation (26)), and the skeletal modulus of the rock is calculated through the Xu–White model (Equations (9) and (10)). The pore fluid modulus is then calculated using Wood’s formula (Equation (27)), and the elastic modulus of fluid-saturated rock is calculated via the Gassmann fluid substitution equation (Equations (24) and (25)). Finally, the S-wave velocity and P-wave velocity are calculated by using the velocity equation (Equations (28) and (29)).
2.4. Shear Wave Prediction Method Based on the Improved Xu–White Model
The prediction of shear wave velocity based on the empirical formula is obtained by directly establishing the relationship between logging curve and shear wave velocity. The Xu–White model is usually simplified to Shear wave velocity by assuming that the properties of the sand, clay, and pore fluids in the model do not vary in depth and that their physical parameters are constants derived from experimentation or experience. However, the properties of the mineral matrix, pore fluid, porosity, and pore aspect ratio in rocks vary greatly in depth and are variables considered to have a significant impact on the accuracy of shear wave velocity prediction. According to previous research results [33,34,35], the velocity of sand in the matrix, porosity, and the aspect ratio of clay-related pore space have, among the above parameters, the greatest influence on the shear wave prediction results, and the values of these parameters need to be determined after inversion calculations and then used to calculate the shear wave velocity.
When conventional methods are used to predict shear wave velocities, certain rock physical parameters are constants obtained by transforming the prior information. The prior information refers to actual data, experience, results data, etc. However, prior information will exhibit specific statistical characteristics, and it is a variable rather than a constant. In the process of shear wave velocity prediction, the statistical characteristics of the prior information are integrated into the petrophysical model, which can improve the accuracy of prediction results. The statistical petrophysical method solves the problem of using the above prior information [36,37]. In these studies, the prior information is used to establish the distribution of key physical parameters and to apply it to the parameter inversion process. This method has been applied to the description of reservoir characteristics, which not only obtains good inversion results, but also provides some statistical information.
This paper presents a prediction method of shear wave velocity based on an improved Xu–White model. The method is based on the Xu–White model and uses parameters that severely affect rock velocity and cannot be obtained from conventional logging data as key petrophysical parameters, combining the prior information to form a distribution of key petrophysical parameters. Conventional logging data only provide some logging curves, such as density, velocity, porosity, clay content, and water saturation. However, in the Xu–White model, the P-wave velocity and S-wave velocity of sand and the aspect ratio of sand-related pores and clay-related pores are the key parameters affecting rock velocity, but they cannot be obtained from conventional logging. Pillar et al. [38] gave us the relative pore aspect ratio of sand () calculation formula:
Thus, the pore aspect ratio curve related to sand in the well can be estimated, but other parameters need to be determined via inversion calculation.
The P-wave and S-wave velocities of sand can be calculated by the time average formula [17,18]. The formula are as follows:
In the equations, , and are the P-waves propagation times for matrix, sand, and clay, respectively. , and are the shear wave propagation times for matrix, sand, and clay, respectively, where the propagation time is the reciprocal of the velocity. is the normalised clay volume fraction.
The prior information is necessary to establish the distribution of key petrophysical parameters. Actual logging information is limited by well conditions, acquisition techniques, and acquisition costs, and there are only a few wells or sections of wells in the target area that have accurate and complete logging and mineral fraction information. The information from these high-quality wells or sections is used as reference information. The reference information is rich in data, including S-wave velocity and P-wave velocity, mineral information, density, and porosity. The aspect ratio of sand-related pores and the velocity of the sand in the reference information can be found in the above Formulas (33) to (39), and the aspect ratio of clay-related pores () is calculated using the following equation:
In the formula, and are the P-wave and S-wave velocities simulated by the Xu–White model.
The reference information provides the numerical data of the P-wave velocity and S-wave velocity of sand, and the aspect ratio parameters of clay-related pores. These data can obtain the prior distribution of key parameters after statistics. The prior distributions and the P-wave velocities of the target wells are used to invert the S-wave velocity and P-wave velocity of the sand, as well as the aspect ratios of the clay-related pores in the target wells. The Bayesian inversion method [39] allows for the prior distribution to be incorporated into this inversion process, and its objective function is as follows:
In these equations, is a vector consisting of the three parameters and . P (⋅) is the probability function. N (⋅) is the probability of a normal distribution. is the variance of the noise in . is the covariance matrix, and E is the vector composed of the expectation values of the three parameters.
The simulated annealing particle swarm optimization (SA–PSO) is a global optimization algorithm that solves the nonlinear objective function solution problem in inversion. This algorithm is based on the idea of simulated annealing and can improve the local optimization ability of the particle swarm optimization algorithm. It has been applied to the nonlinear inversion of reservoir characterization [40,41]. It is applied to solving the objective function to maximise the posterior distribution by searching for the optimal solution of the parameter .
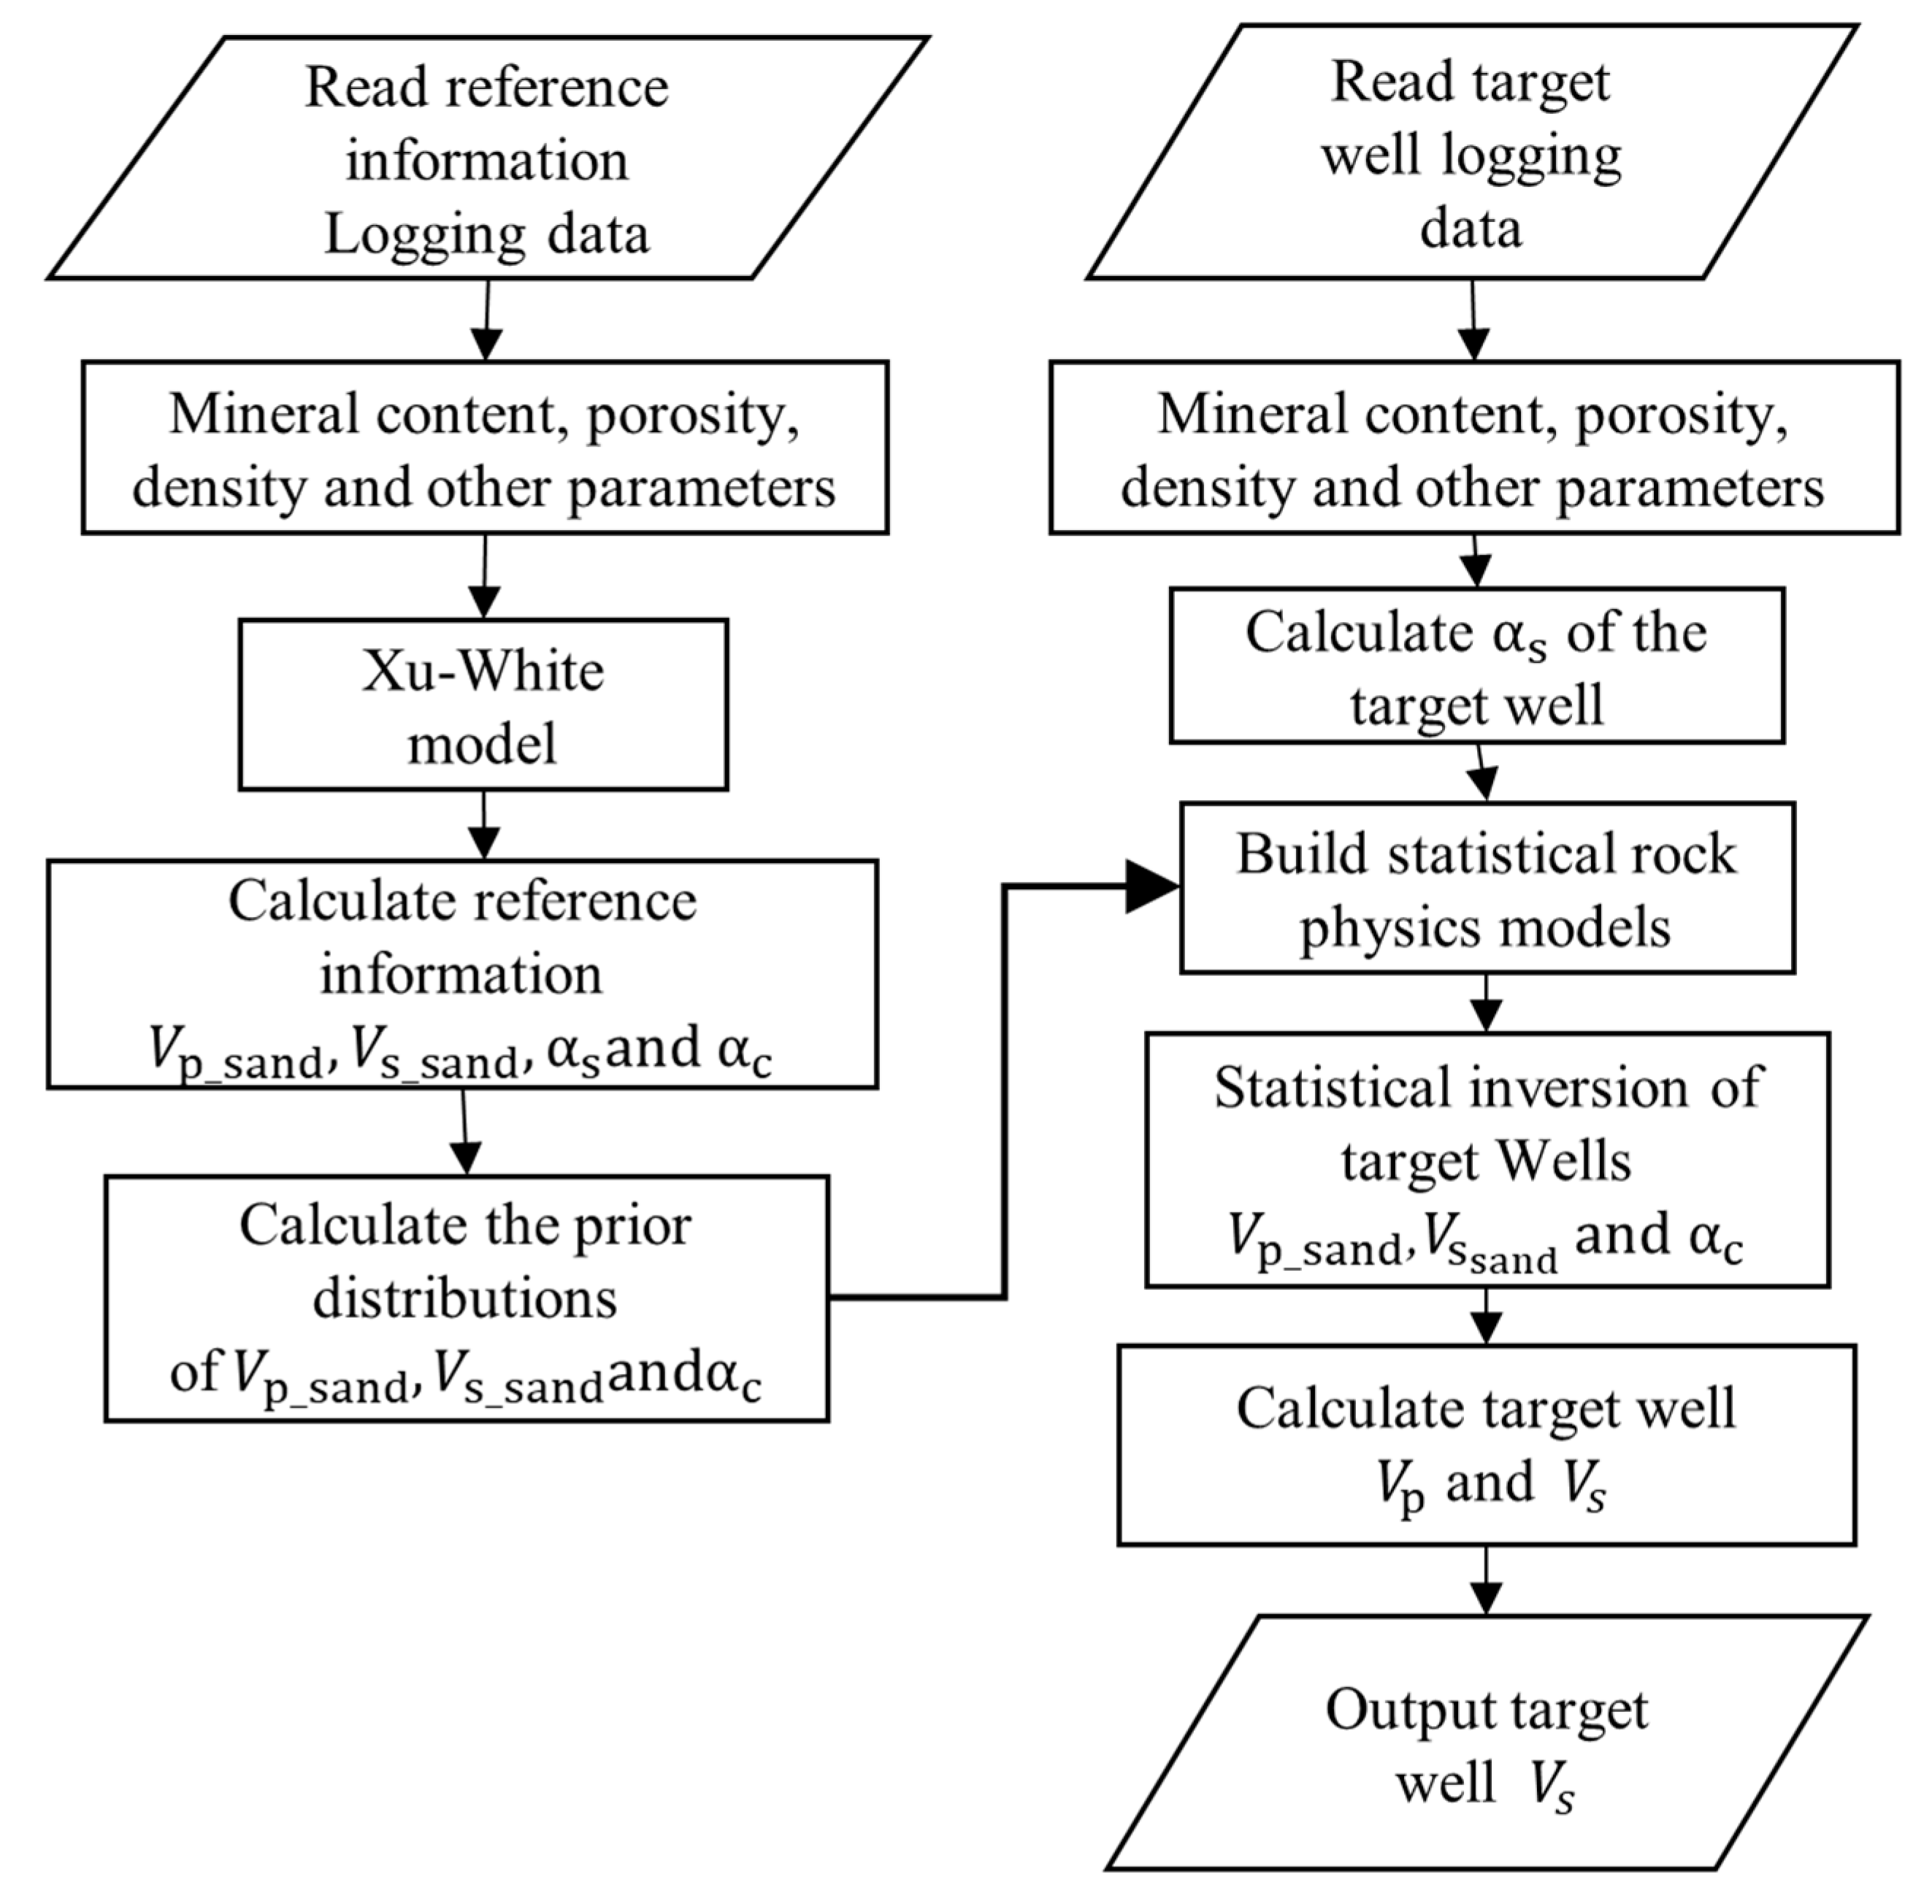
Figure 1 shows the workflow of shear wave velocity prediction based on the improved Xu–White model. First, the prior information of three key petrophysical parameters is calculated by reference logging data, and the prior distribution is obtained. The Xu–White model is then initialized with prior distributions and the statistical petrophysical model is built. Finally, the Bayesian inversion method is used to match the simulated p-wave velocity with the actual p-wave velocity in order to calculate the key petrophysical parameters and predict the s-wave velocity of the target well. In this workflow, the use of prior information makes the prediction of the shear wave velocity of the target well more accurate.
3. Prediction of Shear Wave Velocities in Actual Volcanic Reservoirs
3.1. Field Well Log Data
In this paper, the actual logging data of a well location in the No. 5 structure of Nanpu Sag in eastern China are selected for research. The study area is located in the downthrow wall of the XinanZhuang Fault in the Nanpu Sag in the northern part of the Huanghua Depression in the Bohai Bay Basin. It is in the northwest of the Nanpu No. 1 structure and is a subduction zone of dextral tectonics developed on a Middle and Palaeozoic bedrock nappe tectonic setting, controlled by the Xinanzhuang fault and its derivative faults. The main reservoir is the volcanic rocks of the Lower Tertiary Shahejie Formation, which has a wide distribution and thickness and develops a variety of stratigraphic lithological traps related to the volcanic rocks or stratigraphic overburden. The volcanic rocks are mainly volcanic lava, but some unequal thicknesses of volcaniclastic rock are also trapped in the volcanic rocks [42].
The lower half of the Nanpu well 1 is a key exploration well section with more complete logging information, and it is used as the reference well section. The mineral component information of the reference well section is shown in Figure 2, the information is derived from logging data and core data, and the modulus and density of minerals and pore fluids are shown in Table 1. The matrix minerals constitute the framework of the petrophysical model, and the mineral components directly affect the physical parameters of the petrophysical model. Silicate melt inclusions (SMI) are silicate droplets wrapped by mineral phenocrysts under a high temperature and high pressure environment, and they are widely developed in volcanic rock (especially mafic rocks) phenocrysts. Through literature research [27], it was found that the main component of silicate melt inclusions in the Nanpu 1 well is feldspar, and its modulus and density are similar to feldspar. In this paper, the silicate melt inclusions are approximated to feldspar for model construction. There are conventional logging curves such as S-wave velocity, P-wave velocity, density, clay content, water saturation, and the porosity curve in the upper half of Nanpu well 1, as shown in Figure 3. This section can be used as a target well section to predict its shear wave velocity. The validity of the method in this paper can be verified via the actual shear wave velocity curve.
3.2. Shear Wave Velocity Prediction Process
Firstly, the velocity of the sand was calculated in the Xu–White model according to the mineral composition information in the logging data of the reference well section. The results are shown in Figure 4, which shows the statistics for the reference well section, and then the aspect ratio () of the clay-related pore space in the reference well section is calculated, which is used as the key petrophysical parameter to establish the prior distribution for the next process. Then, the aspect ratio () of the sand-related pore space in the target well section is calculated. Finally, a statistical petrophysical model based on the Xu–White model is developed. This model is initialized using three prior distributions of three key parameters, and then it is combined with known logging information to calculate the shear wave velocity of the target well section.
3.3. Results and Discussion
In order to verify the accuracy of the method, this paper uses Han’s empirical formula and the traditional Xu–White model to predict the shear wave velocity. Its results are compared to the inversion results of the statistical petrophysical model based on the Xu–White model and quantitatively evaluated by the mean square error (MSE) and correlation coefficient (r). The evaluation formulas are as follows:
In the equation, is the depth point location, and are the predicted and actual velocities, is the total number of depth points, is the covariance, and is the standard deviation of the velocities.
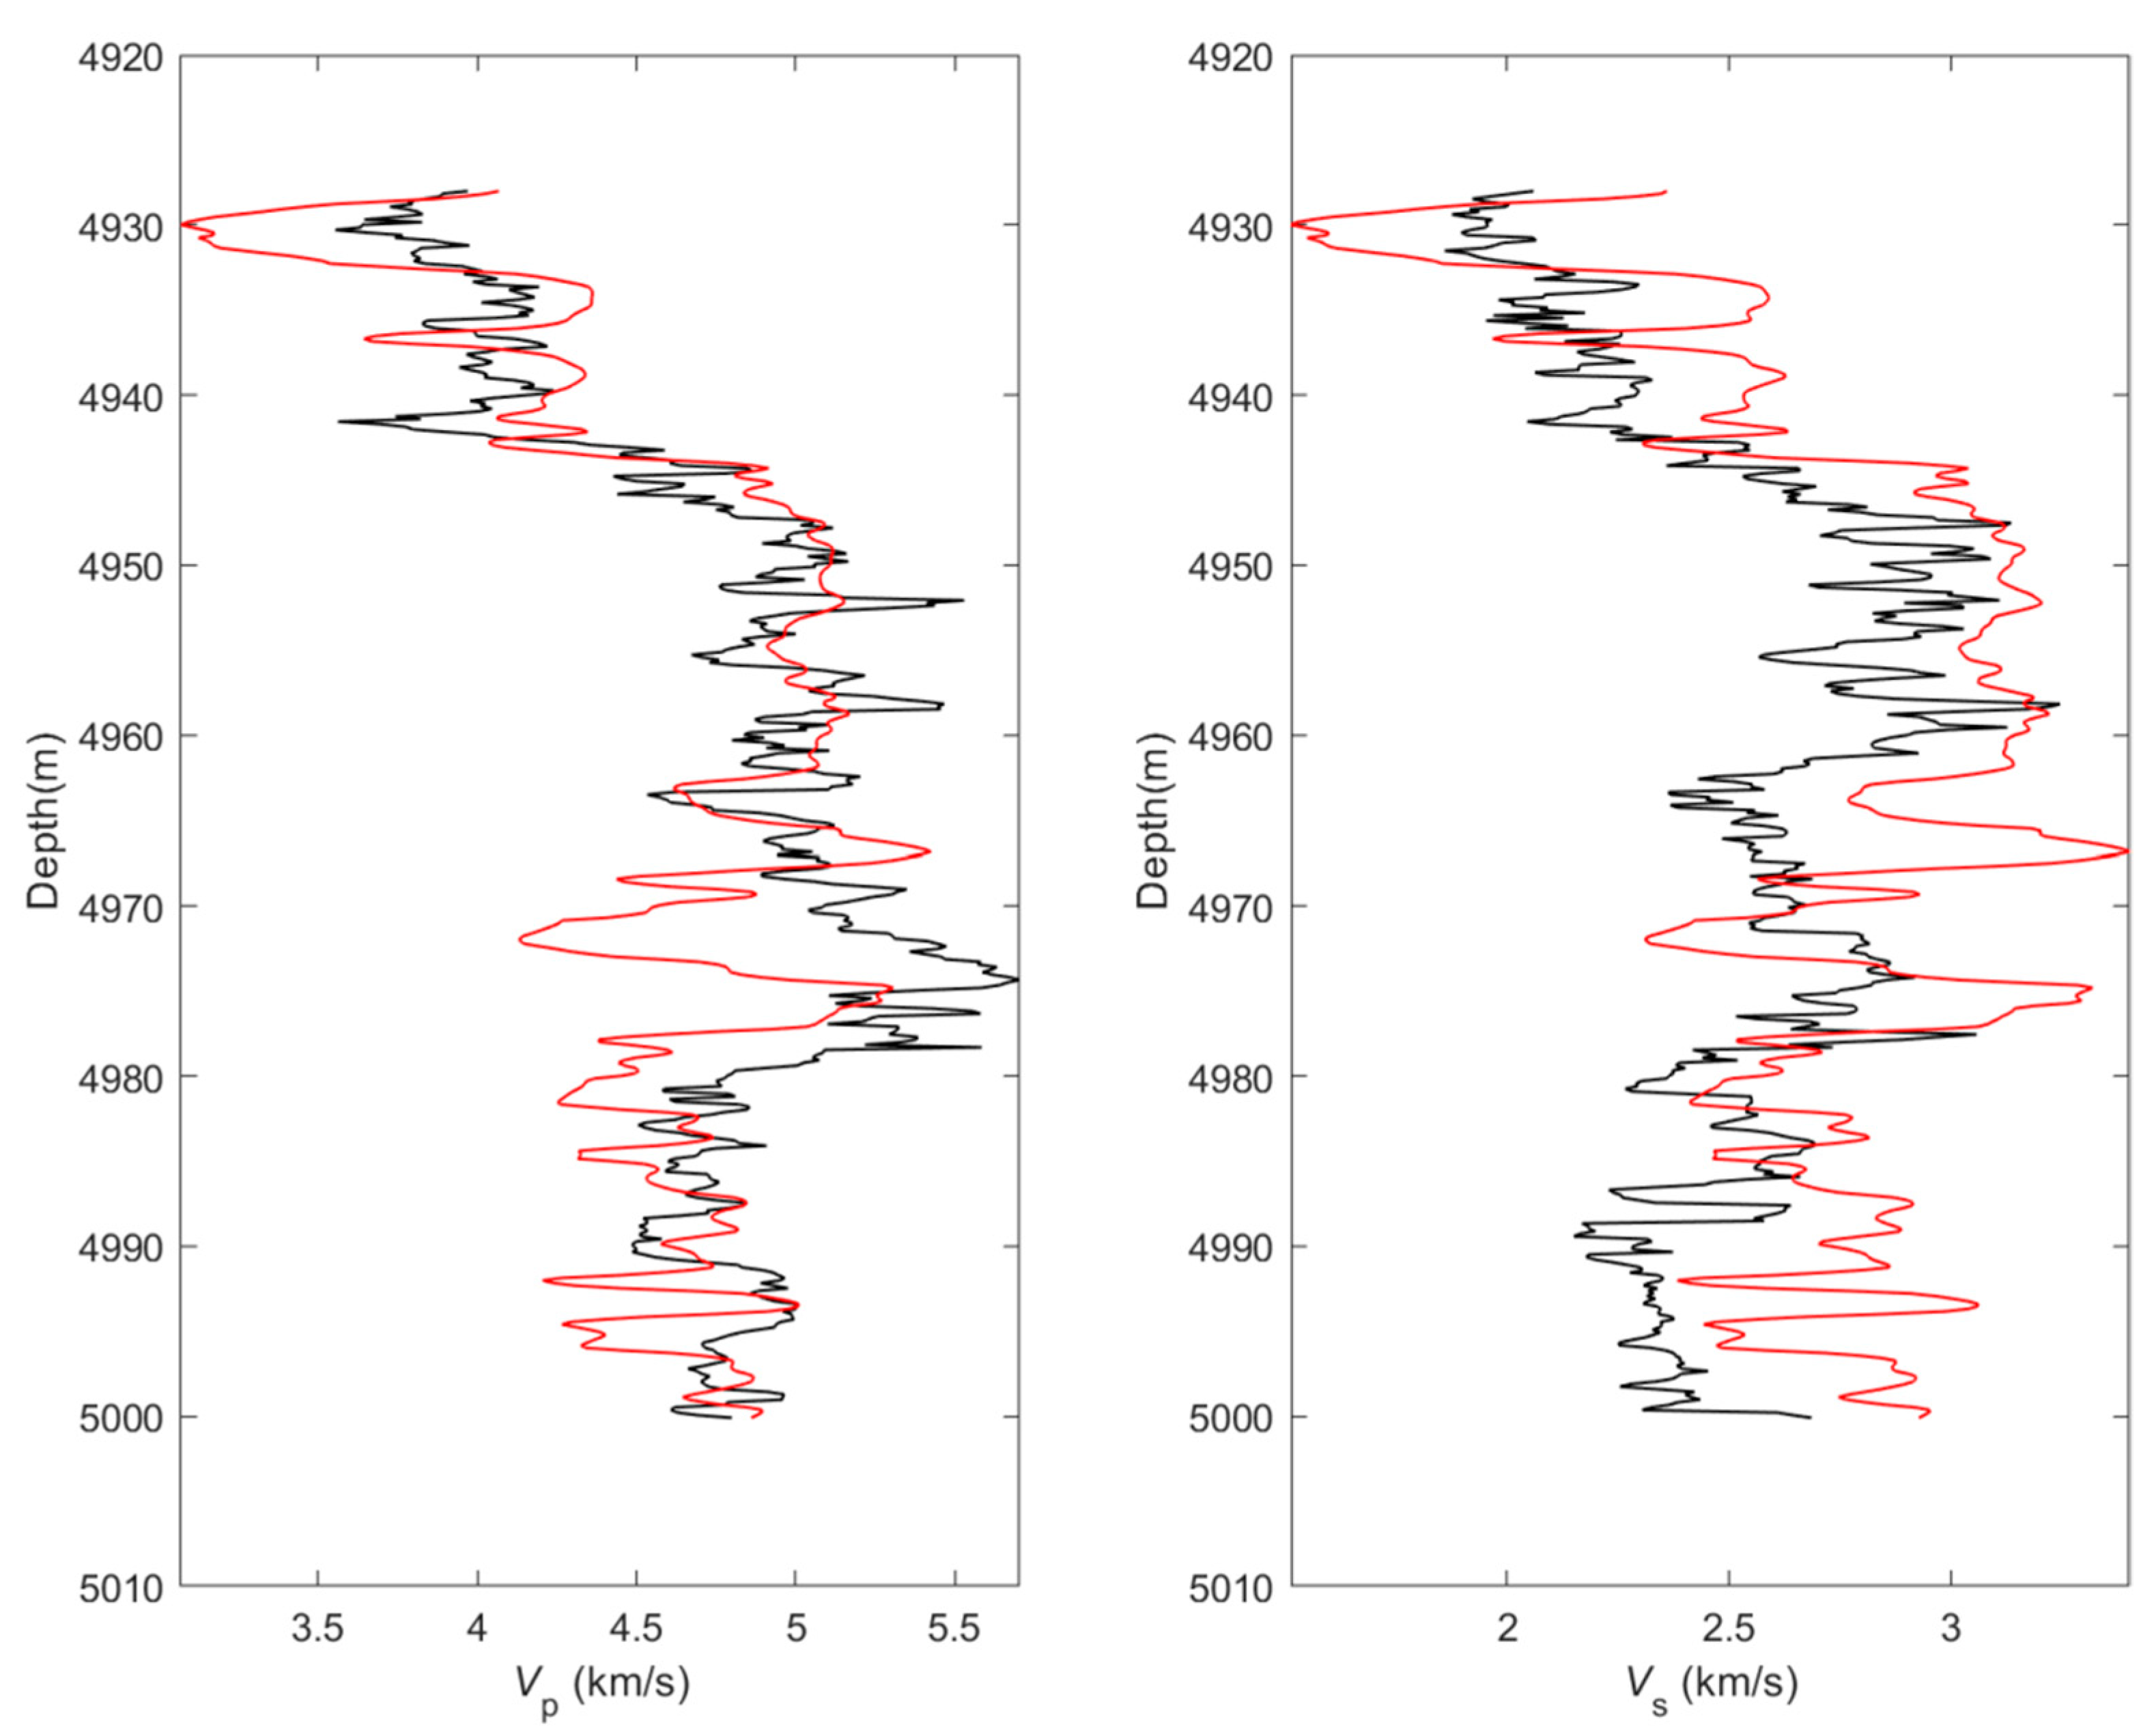
The prediction results of the three methods for the target well section are shown in Figure 5, Figure 6 and Figure 7, and their error evaluations are shown in Table 2.
Comparing the above results, the validity of the method in this paper applied to the prediction of shear wave velocity in the logging area of volcanic reservoirs is verified. The prediction results based on the Han empirical formula are shown in Figure 5. This method is based on the statistical fitting of a large number of S-waves and P-waves, densities information. The prediction results based on Han’s empirical formula have a good correlation and small global error. However, there are large local errors in the 4930–4940 m and 4960–4980 m sections of the well. The prediction of shear wave velocity based on Han’s empirical formula is worse than the other two methods. The mean square error of the predicting P-wave velocity is less than that of the predicting P-wave velocity based on the Xu–White model. The prediction results based on the Xu–White model are shown in Figure 6. The method uses the constant parameter initialization model. The correlation of prediction results based on the Xu–White model is greatly improved compared to the Han empirical formula method, and the prediction results of shear wave velocity are also improved. Because the influence of rock properties changing with formation pressure is not considered, and the mineral composition in silicate melt inclusion is difficult to determine, there is a deviation in the prior information of sand velocity provided in the reference well section. Because the sand velocity in the target well section is the mean value of the sand velocity in the reference well section, the global error of predicting P-wave velocity is large. The statistical petrophysical modelling method based on the improved Xu–White model gives us the best prediction results. As shown in Figure 7, the prediction results fit the measured data well, the correlation has been further improved, the global and local errors are small, and the accuracy of the predicted S-wave velocity and P-wave velocity has been significantly improved compared to the traditional Xu–White model method. The results of actual data calculation verify the accuracy and effectiveness of the statistical petrophysical model based on the improved Xu–White model for predicting shear wave velocity.
4. Conclusions
This paper presents a prediction method of shear wave velocity in the conventional logging area of a volcanic reservoir based on an improved Xu–White model and introduces the characteristics of a volcanic reservoir, the establishment steps of the improved Xu–White model, and the workflow of shear wave velocity calculation. The method utilizes prior distributions of key petrophysical parameters to initialize the Xu–White model and constructs a statistical petrophysical model which improves the accuracy of the results when applied to conventional logging. The accuracy of prior information depends on the richness of the logging data from the reference well, as well as the core data. In addition, the similar rock properties of the target and reference sections can also ensure the accuracy of prior information. In the framework of the Bayesian inversion, combined with these key petrophysical parameters and statistical petrophysical models, the shear wave velocity information of a volcanic reservoir is predicted, improving the accuracy of prediction results and solving the problem of excessive logging data and core data being required by traditional methods. Compared to the prediction results of traditional methods, the effectiveness of the proposed method is proved. This method effectively improves the accuracy of shear wave velocity prediction in the conventional logging of volcanic rocks. The accurate S-wave velocity information provided by this method can provide important parameters for subsequent volcanic reservoir fluid attribute identification, reservoir characteristic evaluation, fracture distribution identification, pre-stack seismic inversion, and AVO analysis.
Author Contributions
Conceptualization, H.Q. and B.Z.; methodology, B.Z.; resources C.L.; writing—original draft preparation, H.Q.; writing—review and editing, B.Z.; project administration, H.Q.; funding acquisition, H.Q. All authors have read and agreed to the published version of the manuscript.
Funding
This research was funded by China Geological Survey Project (DD20221638) and Scientific and Technological Breakthrough Foundation of Henan Province (222102320270).
Data Availability Statement
The original contributions presented in the study are included in the article, further inquiries can be directed to the corresponding authors.
Conflicts of Interest
The authors declare no conflict of interest.
References
- Hunter, B.E.; Davies, D.K. Distribution of volcanic sediments in the Golf coastal Province-significance to petroleum geology. Gcags Trans. 1979, 29, 147–155. [Google Scholar]
- Hawlader, H.M. Diagenesis and reservoir potential of volcanogenic sandstones—Cretaceous of the Surat Basin, Australia. Sediment. Geol. 1990, 66, 181–195. [Google Scholar] [CrossRef]
- Mathisen, M.E.; Mcpherson, J.G. Volcaniclastic deposits: Implications for hydrocarbon exploration. Sediment. Volcan. Settings Soc. Sediment. Geol. 1991, 45, 20–27. [Google Scholar]
- Zimmermann, G.; Burkhardt, H.; Melchert, M. Estimation of porosity in crystalline rock by a multivariate statistical approach. Sci. Drill. Geophys. Geochem. Technol. 1992, 3, 27–35. [Google Scholar]
- Chunde, Y.; Huilong, Y.; Fangquan, Y.; Gianfu, W. Pores Development and Reservoir Properties of Volcanic Rocks in Jianghan Basin. J. Jianghan Pet. Inst. 1996, 18, 1–6. [Google Scholar]
- Jinglan, L.; Zhihao, Q.; Wei, S.; Fazhan, S. The relations between lithofacies, reservoir lithology and oil and gas of volcanic rocks in Fenghuadian area. Acta Pet. Sin. 1996, 17, 32–39. [Google Scholar]
- Li, Y.H. Diabase and Hydrocarbon Reservoir Formation on the Northern Slope of Gaoyou Sag. J. Geomech. 2000, 6, 17–22. [Google Scholar]
- Zhao, H.; Cheng, D.; Li, L. Rock physics analysis of deep volcanic rocks in Daqing oilfield. In Proceedings of the Beijing 2009 International Geophysical Conference and Exposition, Beijing, China, 24–27 April 2009; Society of Exploration Geophysicists: Housten, TX, USA, 2009; p. 196. [Google Scholar]
- Castagna, J.P.; Batzle, M.L.; Eastwood, R.L. Relationships between compressional-wave and shear-wave velocities in clastic silicate rocks. Geophysics 1985, 50, 571–581. [Google Scholar] [CrossRef]
- Han, D.H. Effects of porosity and clay content on wave velocities in sandstones. Geophysics 1986, 51, 2093. [Google Scholar] [CrossRef]
- Li, Q. Velocity regularities of P and S-waves in formations. Oil Geophys. Prospect. 1992, 27, 1–12+154. (In Chinese) [Google Scholar]
- Greenberg, M.L.; Castagna, J.P. Shear-wave velocity estimation in porous rocks—Theoretical formulation, preliminary verification and applications. Geophys. Prospect. 1992, 40, 195–209. [Google Scholar] [CrossRef]
- Yan, J.; Li, X.Y.; Enru, L. Effects of pore aspect ratios on velocity prediction from well-log data. Geophys. Prospect. 2002, 50, 289–300. [Google Scholar] [CrossRef]
- Vernik, L.; Castagna, J.; Omovie, S.J. S-wave velocity prediction in unconventional shale reservoirs. Geophysics 2018, 83, MR35–MR45. [Google Scholar] [CrossRef]
- Sohail, G.M.; Hawkes, C.D. An evaluation of empirical and rock physics models to estimate shear wave velocity in a potential shale gas reservoir using wireline logs. J. Pet. Sci. Eng. 2019, 185, 106666. [Google Scholar] [CrossRef]
- Berryman, J.G. Long-wavelength propagation in composite elastic media. J. Acoust. Soc. Am. 1980, 68, 1820–1831. [Google Scholar] [CrossRef]
- Xu, S.; White, R.E. A new velocity model for clay-sand mixtures. Geophys. Prospect. 1995, 43, 91–118. [Google Scholar] [CrossRef]
- Xu, S.; White, R.E. A physical model for shear-wave velocity prediction. Geophys. Prospect. 1996, 44, 687–717. [Google Scholar] [CrossRef]
- Keys, R.G.; Xu, S. An approximation for the Xu-White velocity model. Geophysics 2002, 67, 1406–1414. [Google Scholar] [CrossRef]
- Lee, M.W. A simple method of predicting S-wave velocity. Geophysics 2006, 71, F161–F164. [Google Scholar] [CrossRef]
- Ruiz, F.; Dvorkin, J. Predicting elasticity in nonclastic rocks with a differential effective medium model. Geophysics 2010, 75, E41–E53. [Google Scholar] [CrossRef]
- Bai, J.Y.; Song, Z.X.; Su, L.; Yang, W.G.; Zhu, L.Y.; Li, S.J. Error analysis of shear-velocity prediction by the Xu-White model. Chin. J. Geophys. 2012, 55, 589–595. (In Chinese) [Google Scholar]
- Zhang, B.; Liu, C.; Zhiqi, G.; Liu, X.; Liu, Y. Probabilistic reservoir parameters inversion for anisotropic shale using a statistical rock physics model. Chin. J. Geophys. 2018, 61, 2601–2617. (In Chinese) [Google Scholar]
- Pan, B.; Xue, L.; Huang, B.; Yan, G.; Zhang, L. Evaluation of volcanic reservoirs with the “QAPM mineral model” using a genetic algorithm. Appl. Geophys. 2008, 5, 1–8. [Google Scholar] [CrossRef]
- Lihua, Z. Study on Methods of Evaluating Igneous Reservoir by Logging. Ph.D. Thesis, Jinlin University, Changchun, China, 2009. [Google Scholar]
- Zhang, L.H.; Pan, B.Z.; Shan, G.Y.; Lin, F.W.; Liu, D.F. Volcanic Alteration of Nanpu-5 Structure in Bohai Bay Basin Effects on the Physical Property of Reservoir and Lower Limits of Physical Property. Geol. Resour. 2020, 29, 351–356. [Google Scholar]
- Jianwei, W.; Jingxia, D.; Yongchao, Z.; Quanli, W.; Shu’E, Z. The geological conditions, resource potential and exploration direction in Nanpu Sag of Jidong Depression, Bohai Bay Basin. Mar. Orig. Pet. Geol. 2019, 24, 8. [Google Scholar]
- Xu, M.; Yin, X.; Zong, Z.; Li, H. Rock-Physics Model of Volcanic Rocks, an Example from Junggar Basin of China. In Proceedings of the 80th EAGE Conference and Exhibition 2018, Copenhagen, Denmark, 11–14 June 2018. [Google Scholar]
- Xu, M.; Yin, X.; Zong, Z.; Li, H. Rock-Physics Model of Volcanic Rocks, an Example from Junggar Basin of China. J. Pet. Sci. Eng. 2020, 195, 107003. [Google Scholar] [CrossRef]
- Gassmann, F. Elastic waves through a packing of spheres. Geophysics 1951, 16, 673–685. [Google Scholar] [CrossRef]
- Hill, R. The Elastic Behaviour of a Crystalline Aggregate. Proc. Phys. Soc. 1952, 65, 349–354. [Google Scholar] [CrossRef]
- Wood, A.B.; Lindsay, R.B. A textbook of sound. Phys. Today 1956, 9, 37. [Google Scholar] [CrossRef]
- Grana, D.; Della Rossa, E. Probabilistic petrophysical-properties estimation integrating statistical rock physics with seismic inversion. Geophysics 2010, 75, O21–O37. [Google Scholar] [CrossRef]
- Bai, J.Y.; Yue, C.Q.; Liang, Y.Q.; Song, Z.X.; Ling, S.; Zhang, Y.; Wu, W. Variable aspect ratio method in the Xu-White model for shear-wave velocity estimation. J. Geophys. Eng. 2013, 10, 035008. [Google Scholar] [CrossRef]
- Zhang, B.; Jin, S.; Liu, C.; Guo, Z.; Liu, X. Prediction of shear wave velocity based on a statistical rock-physics model and Bayesian theory. J. Pet. Sci. Eng. 2020, 195, 107710. [Google Scholar] [CrossRef]
- Bachrach, R. Joint Estimation of Porosity and Saturation Using Stochastic Rock Physics Modeling. Geophysics 2006, 71, O53–O63. [Google Scholar] [CrossRef]
- Yuan, C.; Li, J.; Chen, X.; Rao, Y. Quantitative uncertainty evaluation of seismic facies classification: A case study from northeast China. Geophysics 2016, 81, B87–B99. [Google Scholar] [CrossRef]
- Pillar, N.; Yan, J.; Lubbe, R. Variable Aspect Ratio Method in the Xu-White Model for AVO. In Proceedings of the 69th EAGE Conference and Exhibition Incorporating SPE EUROPEC; European Association of Geoscientists & Engineers: London, UK, 2007; p. cp-27. [Google Scholar]
- Mollajan, A.; Memarian, H.; Quintal, B. Imperialist Competitive Algorithm (ICA) optimization method for nonlinear AVA inversion. Geophysics 2019, 84, N81–N92. [Google Scholar] [CrossRef]
- Liu, C.; Qiao, H.Q.; Guo, Z.Q.; Zhang, B.; Liu, X.W. Shale pore structure inversion and shear wave velocity prediction based on particle swarm optimization (pso) algorithm. Prog. Geophys. 2017, 32, 689–695. [Google Scholar]
- Qiao, H.Q. Shear Wave Velocity Prediction Method Based on Improved Particle Swarm Algorithm; Jilin University: Changchun, China, 2017. [Google Scholar]
- Zhu, X.J. Research on Logging Identification and Evaluation of Deep Volcanic Reservoirs in Nanpu 5th Structure; School of Geosciences China University of Petroleum (East China): Qingdao, China, 2011. [Google Scholar]
- Mavko, G.; Mukerji, T.; Dvorkin, J. The Rock Physics Handbook: Tools for Seismic Analysis of Porous Media, 2nd ed.; Cambridge University Press: Cambridgeshire, UK, 2009; p. 339. [Google Scholar]
Figure 1.
Work flow of the shear wave velocity prediction based on the improved Xu–White model.

Figure 2.
The logging curve and mineral composition information of the reference well section.

Figure 3.
The logging curve of the target well section.

Figure 4.
Prior information of statistical sand velocity in the reference section.

Figure 5.
The prediction of P-wave and S-wave velocities based on Han’s empirical formula (red is the predicted velocity, black is the actual velocity).
Figure 5.
The prediction of P-wave and S-wave velocities based on Han’s empirical formula (red is the predicted velocity, black is the actual velocity).

Figure 6.
The prediction results of P-wave and S-wave velocities based on the Xu–White model (red is forecast speed, black is actual speed).
Figure 6.
The prediction results of P-wave and S-wave velocities based on the Xu–White model (red is forecast speed, black is actual speed).

Figure 7.
The prediction results of P-wave and S-wave velocities based on the improved Xu–White model (red is forecast speed, black is actual speed).
Figure 7.
The prediction results of P-wave and S-wave velocities based on the improved Xu–White model (red is forecast speed, black is actual speed).


Table 1.
The modulus and density of mineral and pore fluids [43].
Table 1.
The modulus and density of mineral and pore fluids [43].
| Bulk Modulus (GPa) | Shear Modulus (GPa) | Density (g/cm3) | |
|---|---|---|---|
| Quartz | 37.9 | 44.3 | 2.65 |
| SMI | 37.5 | 15 | 2.62 |
| Clay | 25 | 9 | 2.55 |
| Gas | 0.336 | – | 0.34 |
| Water | 2.2 | – | 1.4 |
Table 2.
The mean square error (MSE) and correlation coefficient (r) of Vp and Vs predicted by different models.
Table 2.
The mean square error (MSE) and correlation coefficient (r) of Vp and Vs predicted by different models.
| Model | MSE of Vp | MSE of Vs | r of Vp | r of Vs |
|---|---|---|---|---|
| Han Model | 0.060199 | 0.12804 | 0.70823 | 0.70995 |
| Xu–White Model | 0.21499 | 0.11607 | 0.80821 | 0.73465 |
| Improved Xu–White Model | 0.05241 | 0.061259 | 0.84713 | 0.74737 |
Publisher’s Note: MDPI stays neutral with regard to jurisdictional claims in published maps and institutional affiliations. |
© 2022 by the authors. Licensee MDPI, Basel, Switzerland. This article is an open access article distributed under the terms and conditions of the Creative Commons Attribution (CC BY) license (https://creativecommons.org/licenses/by/4.0/).
Share and Cite
MDPI and ACS Style
Qiao, H.; Zhang, B.; Liu, C. Research on Prediction Method of Volcanic Rock Shear Wave Velocity Based on Improved Xu–White Model. Energies 2022, 15, 3611. https://0-doi-org.brum.beds.ac.uk/10.3390/en15103611
AMA Style
Qiao H, Zhang B, Liu C. Research on Prediction Method of Volcanic Rock Shear Wave Velocity Based on Improved Xu–White Model. Energies. 2022; 15(10):3611. https://0-doi-org.brum.beds.ac.uk/10.3390/en15103611
Chicago/Turabian StyleQiao, Hanqing, Bing Zhang, and Cai Liu. 2022. "Research on Prediction Method of Volcanic Rock Shear Wave Velocity Based on Improved Xu–White Model" Energies 15, no. 10: 3611. https://0-doi-org.brum.beds.ac.uk/10.3390/en15103611
Note that from the first issue of 2016, this journal uses article numbers instead of page numbers. See further details here.