
Prediction of Charging Demand of Electric City Buses of Helsinki, Finland by Random Forest


1
School of Engineering, University of Warwick, Coventry CV4 7AL, UK
2
School of Computing, University of Eastern Finland, 70211 Kuopio, Finland
*
Author to whom correspondence should be addressed.
Energies 2022, 15(10), 3679; https://0-doi-org.brum.beds.ac.uk/10.3390/en15103679
Submission received: 14 January 2022
/
Revised: 12 February 2022
/
Accepted: 25 February 2022
/
Published: 17 May 2022
(This article belongs to the Special Issue Developments in Electric Vehicle Charging Station Infrastructure)
Abstract
:Climate change, global warming, pollution, and energy crisis are the major growing concerns of this era, which have initiated the electrification of transport. The electrification of roadway transport has the potential to drastically reduce pollution and the growing demand for energy and to increase the load demand of the power grid, thereby giving a rise to technological and commercial challenges. Thus, charging load prediction is a crucial and demanding issue for maintaining the security and stability of power systems. During recent years, random forest has gained a lot of popularity as a powerful machine learning technique for classification as well as regression analysis. This work develops a random forest (RF)-based approach for predicting charging demand. The proposed method is validated for the prediction of public e-bus charging demand in the city of Helsinki, Finland. The simulation results demonstrate the effectiveness of our scheme.
1. Introduction
Climate change, global warming, pollution, and energy crisis are the major growing concerns of this era that have initiated the electrification of transport. Vehicles act as the major emitters of air pollutants ranging from nitrogen oxides (NOx) to the particulate matters (PM) affecting human health as well as the environment [1,2,3,4]. It is estimated by European Environmental Agency that road transport contributes about 70% of NO2 and 30% of PM [1]. The electrification of transport has received much attention in recent years as a means to control the global concerns regarding pollution and growing energy demand, as well as climate change. It is obvious that the electrification of transport will increase the load demand drastically. The electrification of transport in an unplanned and uncoordinated manner may have a serious impact on the power grid, such as voltage profile deterioration, harmonics, degraded reliability indices, and transformer overloading [5,6,7,8,9,10,11,12]. However, the negative impacts of electric vehicle (EV) charging can be drastically reduced by a suitable energy management strategy. Thus, EV charging load prediction is an important issue for maintaining the smooth and hassle-free operation of the power distribution network.
In recent years, the accurate prediction and forecasting of the EV charging load has received a lot of research focus. Table 1 presents a systematic review of the existing research work on this arena. In [13], a wavelet-decomposition-based approach was used for charging demand prediction of central road, which is an urban area of Sri Lanka. In [14], a Markov chain and graph-theory-based approach was applied for predicting the charging demand of the private EVs operating in Seoul, South Korea. In [15], the authors used different machine learning techniques, e.g., gradient boosting and support vector machine (SVM), for the charging demand prediction of Nebraska, USA. Furthermore, the performances of gradient boosting and SVM on the charging demand prediction were compared based on the mean square error (MSE) and root mean square error (RMSE). In [16], a probabilistic approach based on the normal distribution was employed for the charging demand prediction of Copenhagen, Denmark. In [17], a two-layer data-driven approach and neural network were used for predicting the charging demand of Guangzhou, China. In [18], the authors applied the Monte Carlo method for predicting the charging demand of taxis, buses, and official EVs of Shenzhen, China. In [19], authors used the Monte Carlo technique for simulating the EV arrival rate and hidden Markov model (HMM) for predicting the charging demand of a standard IEEE 53 bus network in the dumb and smart charging scenario. In [20], the authors proposed a queuing theory and Monte-Carlo-based model for charging demand prediction. The model was validated on a 33 node road network. In [21], the authors developed an adaptive neuro fuzzy inference system (ANFIS) and teaching-learning-based optimization (TLBO) model for predicting the state of charge (SOC) of private EVs. The proposed scheme was validated on experimental datasets from the Prognostics Center of Excellence at NASA. In [22], a support vector machine (SVM)- and wolf pack algorithm (WPA)-based approach was used for the short-term load forecasting of e-bus charging stations. In [23], the authors proposed a hybrid fuzzy inference and Monte-Carlo-based approach for private EV charging demand prediction. In [24], the authors developed a Q-learning-based model for EV charging demand prediction considering different scenarios, such as uncoordinated charging, coordinated charging, and smart charging. In [25], the authors studied a Markov-model-based tool named bCharge for charging demand prediction and the scheduling of e-buses. The model was validated for the real time e-bus fleet of Shenzhen, China. In [26], the authors modelled an ideal city that had e-taxis for public transport and proposed a Monte-Carlo-based approach for the prediction of the e-taxi charging demand. In [27] a velocity and state of charge (SOC) prediction model for e-buses was proposed by using a genetic algorithm (GA)- and dynamic programming (DP)-based approach. In [28], the authors used the elastic coefficient method to predict private EV charging demand in Chengdu, China. In [29], a reinforcement-learning-based approach was applied for predicting the charging demand of e-buses in a smart grid environment. In [30], a moving horizon optimization (MHO)-based scheme was proposed for energy consumption estimation in the case of e-buses.
Figure 1 presents a quantitative analysis of the reported research work. From Figure 1, it is observed that there is relatively less work that investigates the charging demand prediction for buses as compared to private EVs. However, during recent years, many countries, such as China, USA, Norway, Finland, Germany, India, Russia, and Sweden [31,32,33,34,35,36], have placed emphasis on electrifying bus routes. The electrification of bus routes will drastically increase the load demand of the power grid, thereby giving rise to technological and commercial challenges. Driven by the aforementioned factors, the present work focuses on the prediction of e-bus charging demand. This work proposes a novel random-forest-based approach for the prediction of e-bus charging demand. Random forest is a flexible supervised machine learning algorithm that can be used for both classification and regression problems [37,38]. Moreover, random forest reduces overfitting and can be used for both categorical and continuous values, which automates missing data. The applications of random forest algorithm are found in diverse areas, e.g., feature selection [39], remote sensing [40], forest carbon mapping [41], hail forecasting [42], android malware detection [43], image classification [44], and air quality classification [45]. Hence, inspired by the superior performances of the random forest algorithm in dealing with such a wide range of real-life problems, our work uses a random-forest-based approach for charging demand prediction. The model was validated for Helsinki, Finland. Helsinki Regional Transport (HSL) has plans to make one in every three buses operating in Helsinki electric by 2025 [46]. Moreover, the EV developer Linkker has loaned several e-buses to HSL for pilot projects [46]. Therefore, it is expected that Helsinki is a good test case for the validation of the proposed approach. In comparison to the existing results, the key contributions of our research work are:
- A novel random-forest-based approach for the prediction of e-bus charging demand;
- Comparison of the random forest algorithm with other state-of-the-art methods of coping with the charging demand prediction problem;
- Guide for bus electrification of Helsinki, Finland.
2. Random Forest Algorithm
As previously mentioned, random forest is a supervised machine learning technique that can be used for handling both classification and regression problems [38]. The random forest is based on ensemble learning, combining multiple classifiers for solving an intricate problem. Random forest contains a number of decision trees on different subsets of the datasets. It takes the mean to improve the overall prediction accuracy of the given datasets [38,39]. Random forest takes the prediction from each tree, and based on the majority votes of predictions, it can predict the final output [38]. The accuracy of the random forest is directly proportional to the number of trees used. The working principle of random forest is shown in Figure 2.
Some of the advantages of random forest are as follows:
- It reduces overfitting and helps to improve accuracy;
- It is flexible and can be used for classification as well as regression problems;
- It works well with both categorical and continuous values;
- It automates missing values present in the data;
- Normalizing the data is not required, as it uses a rule-based approach.
3. Methodology
3.1. Dataset Generation
A dataset needs to be fed to the random forest model for training and testing. In this work, a historical dataset is built for a one-year period. The transition from conventional vehicles to EVs is still in a nascent stage. Therefore, real time data for charging demand prediction is not always available. However, the authors would like to state that the synthetic data was generated based on the real-world data of bus timetables.
The algorithm used for generating the historical dataset is given in Figure 3. In our approach, the charging datasets were created separately for all the charging centers (only depot charging was considered). The energy consumed and charging time of the e-buses depended on the arrival time and the state of charge (SOC) of the buses. The SOC was dependent on the distances travelled by the buses [47].
3.2. Charging Demand Prediction
The charging demand prediction made by the random forest model is elaborated in Section 2. The random forest is based on ensemble learning, which combines multiple classifiers for dealing with an intricate problem. A random forest contains a number of decision trees on different subsets of the datasets. It takes the mean to improve overall prediction accuracy of the given dataset [38,39]. A random forest takes the prediction from each tree and, based on the majority votes of the predictions, it can predict the final output [38]. The prediction accuracy of the random forest is directly proportional to the number of trees. Our step-by-step approach for the charging demand prediction is shown in Figure 4.
4. Numerical Analysis
4.1. Bus Network and Charging Dataset
The proposed prediction model was validated for a selected bus line of Helsinki, Finland. The line 11 operating from Tapiola to Friisilä in Espoo was chosen for validation of the model [48]. The details of the buses operating in that route are given in Table 2. The specifications of the e-buses considered in the analysis are in Table 3. The trip details computed based on the bus timetable and e-bus specifications are presented in Table 4. This work considers that only depot charging is sufficient for the e-buses. Thus, the charging prediction is performed for the following locations:
- Matinkylä (M);
- Teekkarikylä;
- Hyljeveneentie;
- Munkkiranta;
- Tuomarilankallio;
- Alakaupunki;
- Leppävaaran asema.

Table 2.
Timetable of buses in Route 11 [49].
Table 2.
Timetable of buses in Route 11 [49].
| Bus No. | Start Point | End Point | No. of Stops | Trip Duration | Trip Distance | Operating Time | Frequency |
|---|---|---|---|---|---|---|---|
| 111 up | Teekkarikylä | Hyljeveneentie | 45 | 42 min | 16 km | 5:53 a.m.–11:24 p.m. | Every 20 min |
| 111 down | Hyljeveneentie | Teekkarikylä | 43 | 42 min | 16.34 km | 5:53 a.m.–11:24 p.m. | Every 20 min |
| 143 up | Matinkylä (M) | Munkkiranta | 22 | 18 min | 8.03 km | 4:55 a.m.–11:06 p.m. | Every 35 min |
| 143 down | Munkkiranta | Matinkylä (M) | 23 | 18 min | 7.96 km | 4:55 a.m.–11:06 p.m. | Every 35 min |
| 134 up | Matinkylä (M) | Tuomarilankallio | 22 | 27 min | 12.36 km | 4:48 a.m.–11:07 p.m. | Every 10 min |
| 134 down | Tuomarilankallio | Matinkylä (M) | 23 | 27 min | 12.29 km | 4:48 a.m.–11:07 p.m. | Every 10 min |
| 146 up | Matinkylä (M) | Alakaupunki | 13 | 17 min | 8.6 km | 6:11 a.m.–11:51 p.m. | Every 30 min |
| 146 down | Alakaupunki | Matinkylä (M) | 13 | 17 min | 7.48 km | 6:11 a.m.–11:51 p.m. | Every 30 min |
| 544 up | Leppävaaran asema | Alakaupunki | 26 | 50 min | 19.04 km | 5:25 a.m.–10:10 p.m. | Every 20 min |
| 544 down | Alakaupunki | Leppävaaran asema | 26 | 50 min | 19.25 km | 5:25 a.m.–10:10 p.m. | Every 20 min |
Table 3.
e-bus specifications [50].
Table 3.
e-bus specifications [50].
| Driving range | 150 km |
| Charging type | Pantograph charging at depot |
| Charging time | 3 min–6 min |
| Charging load | 150 kW |
Table 4.
Trip Details.
| Bus No. | No. of Round Trips before Charging Demand | No. of Round Trips on Weekdays | No. of Round Trips on Weekends |
|---|---|---|---|
| 111 | 4 | 10 | 8 |
| 143 | 9 | 10 | 8 |
| 134 | 6 | 10 | 8 |
| 146 | 9 | 8 | 6 |
| 544 | 3 | 10 | 8 |
The charging dataset was prepared based on the methodology shown in Figure 2.
4.2. Charging Demand Prediction
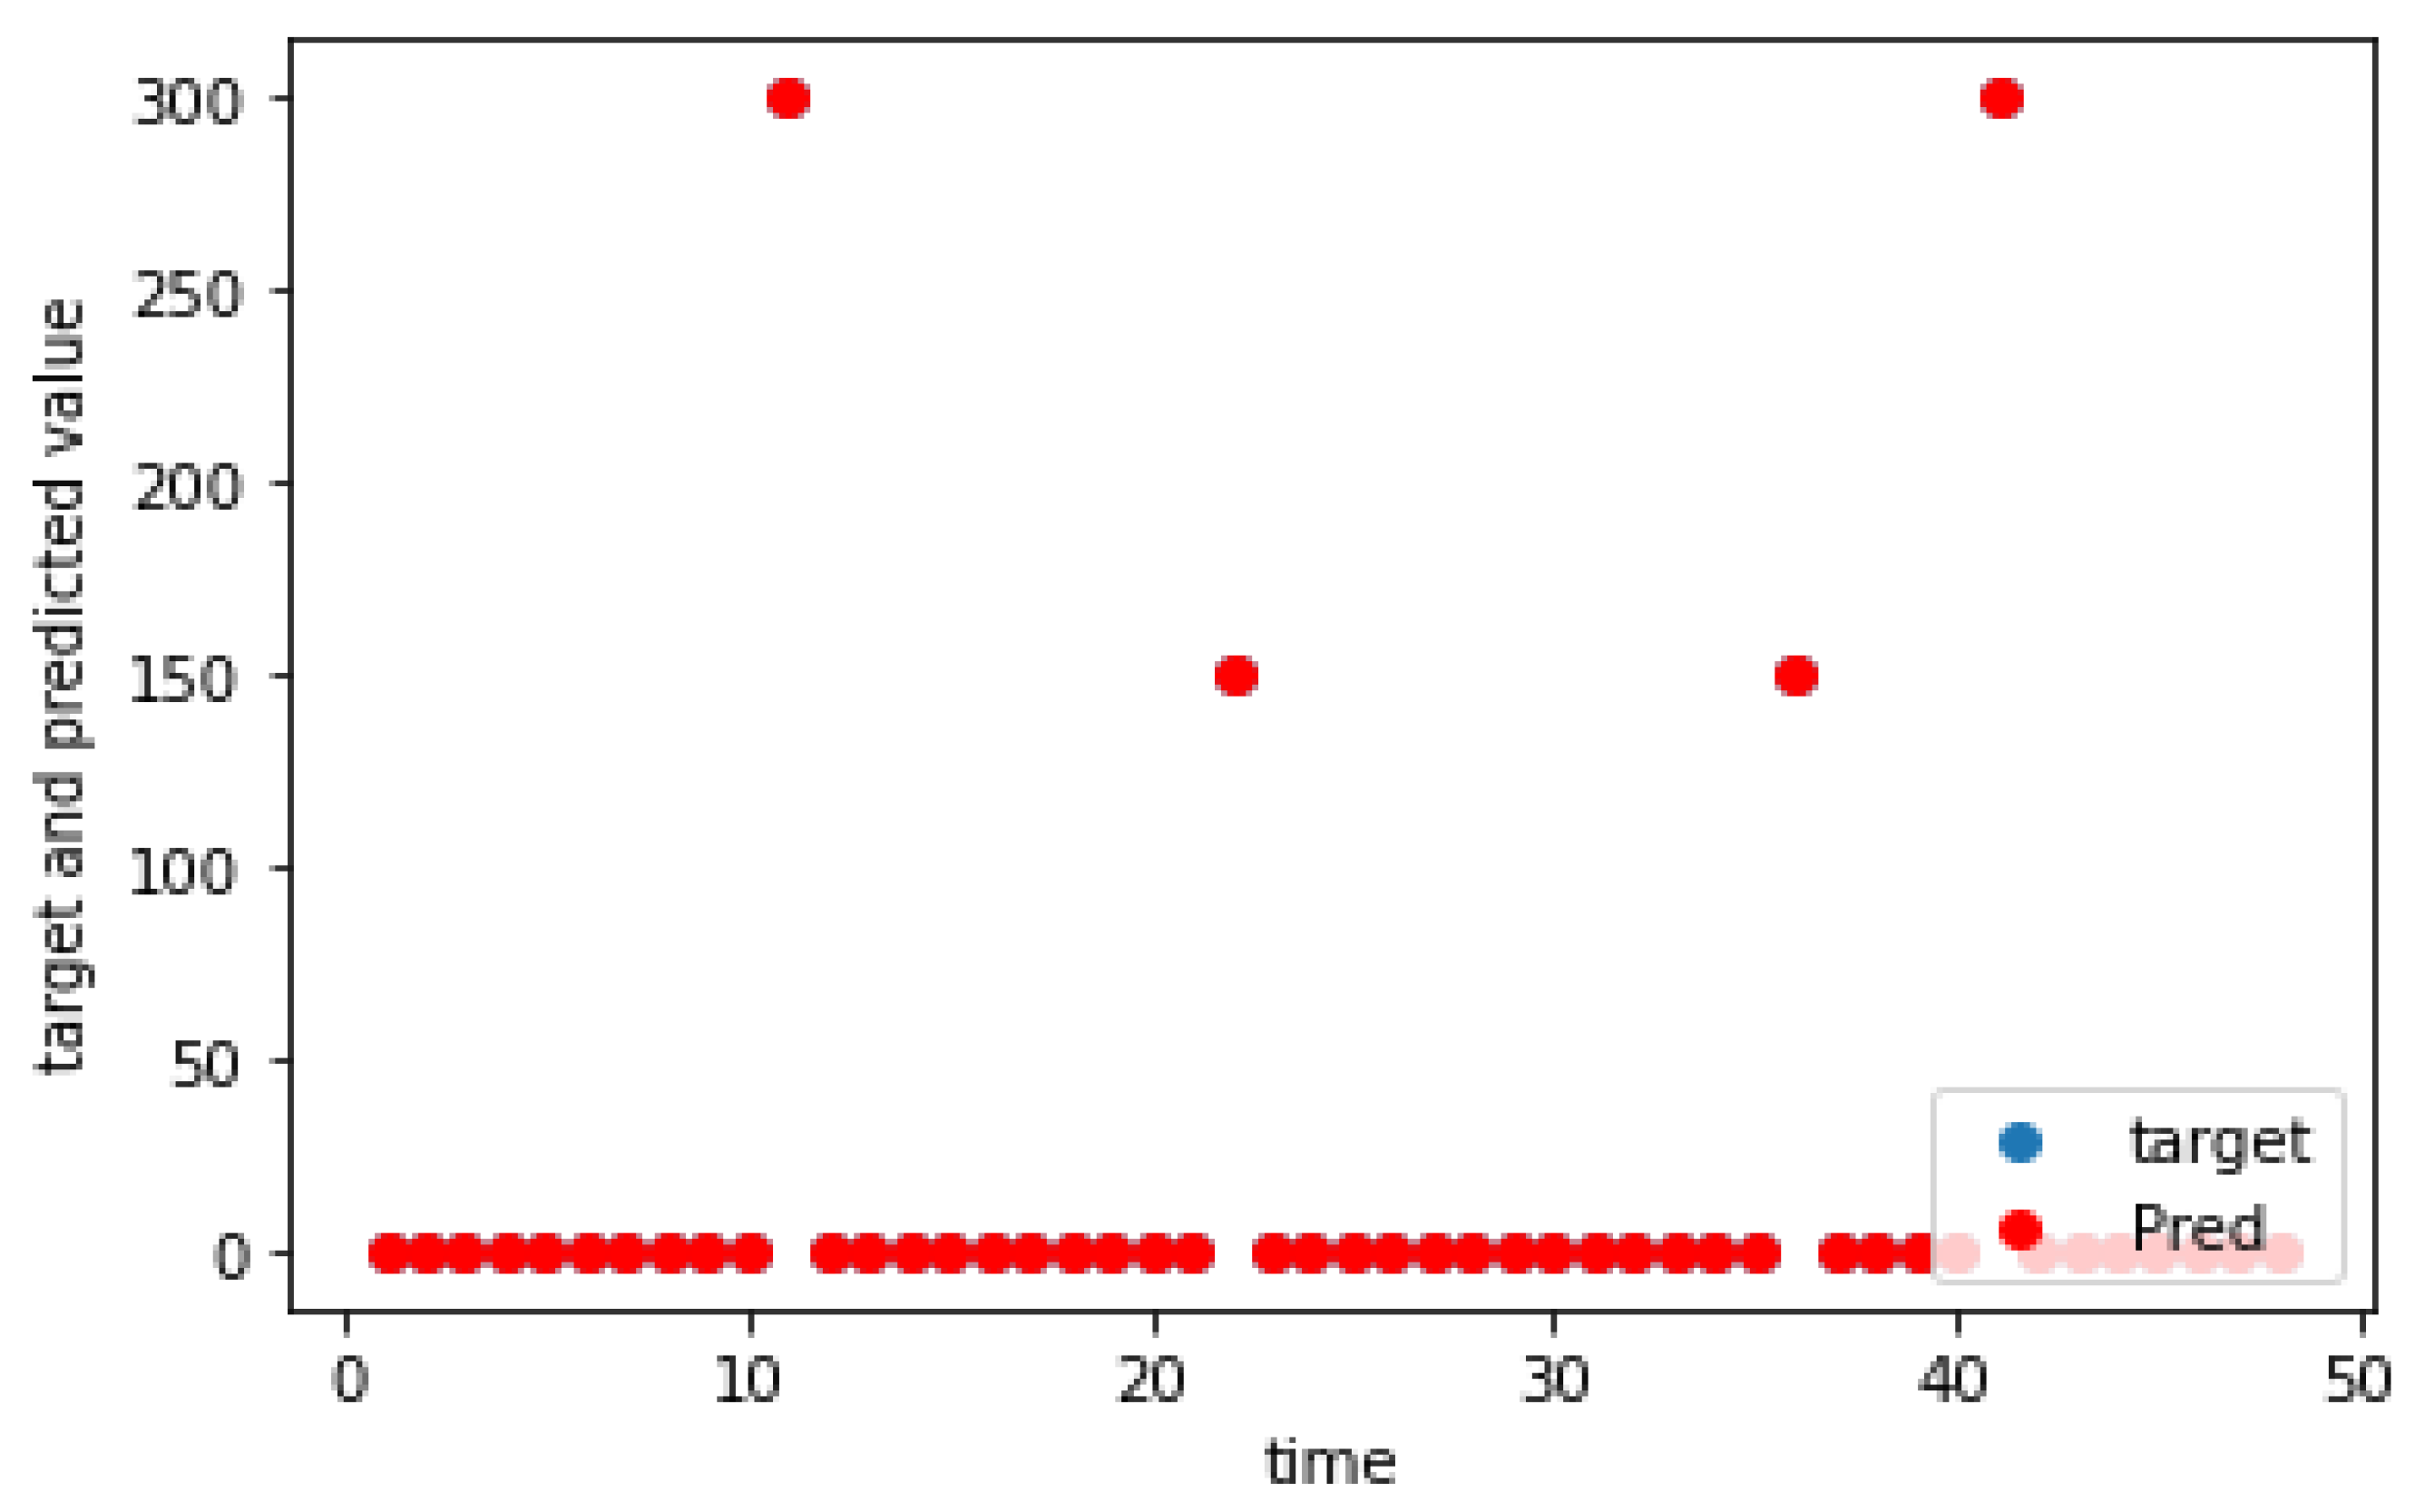
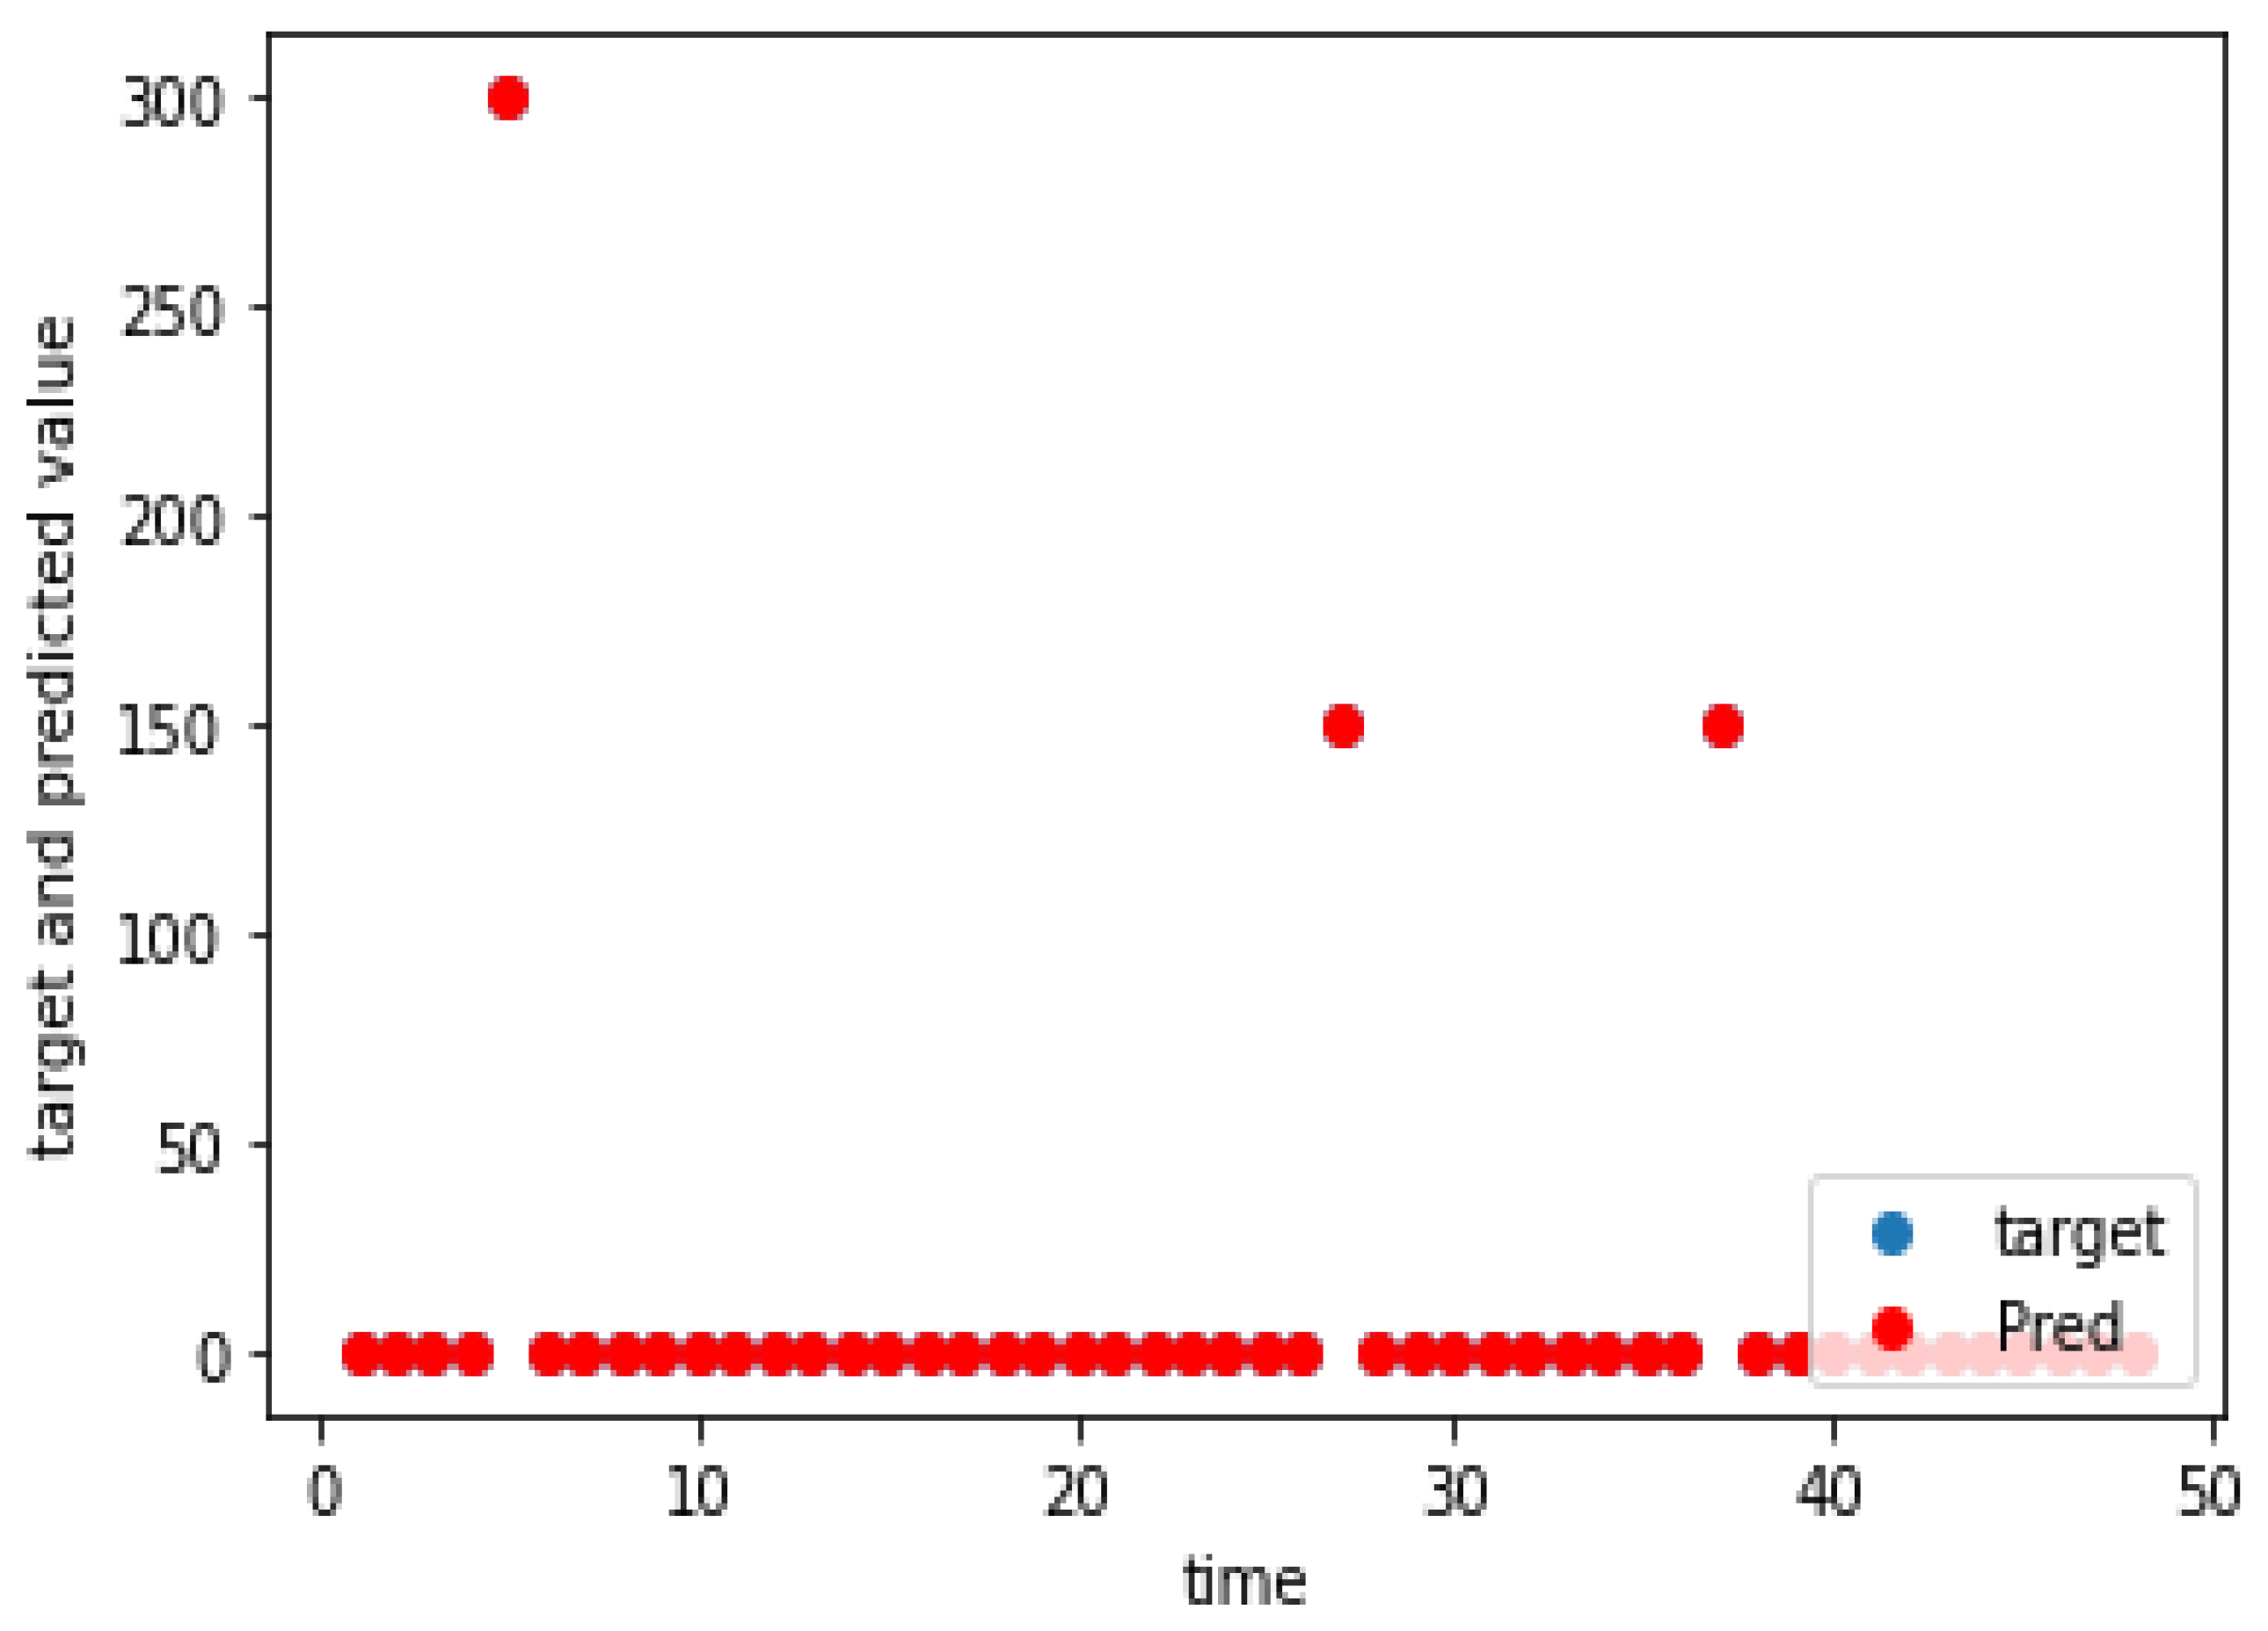
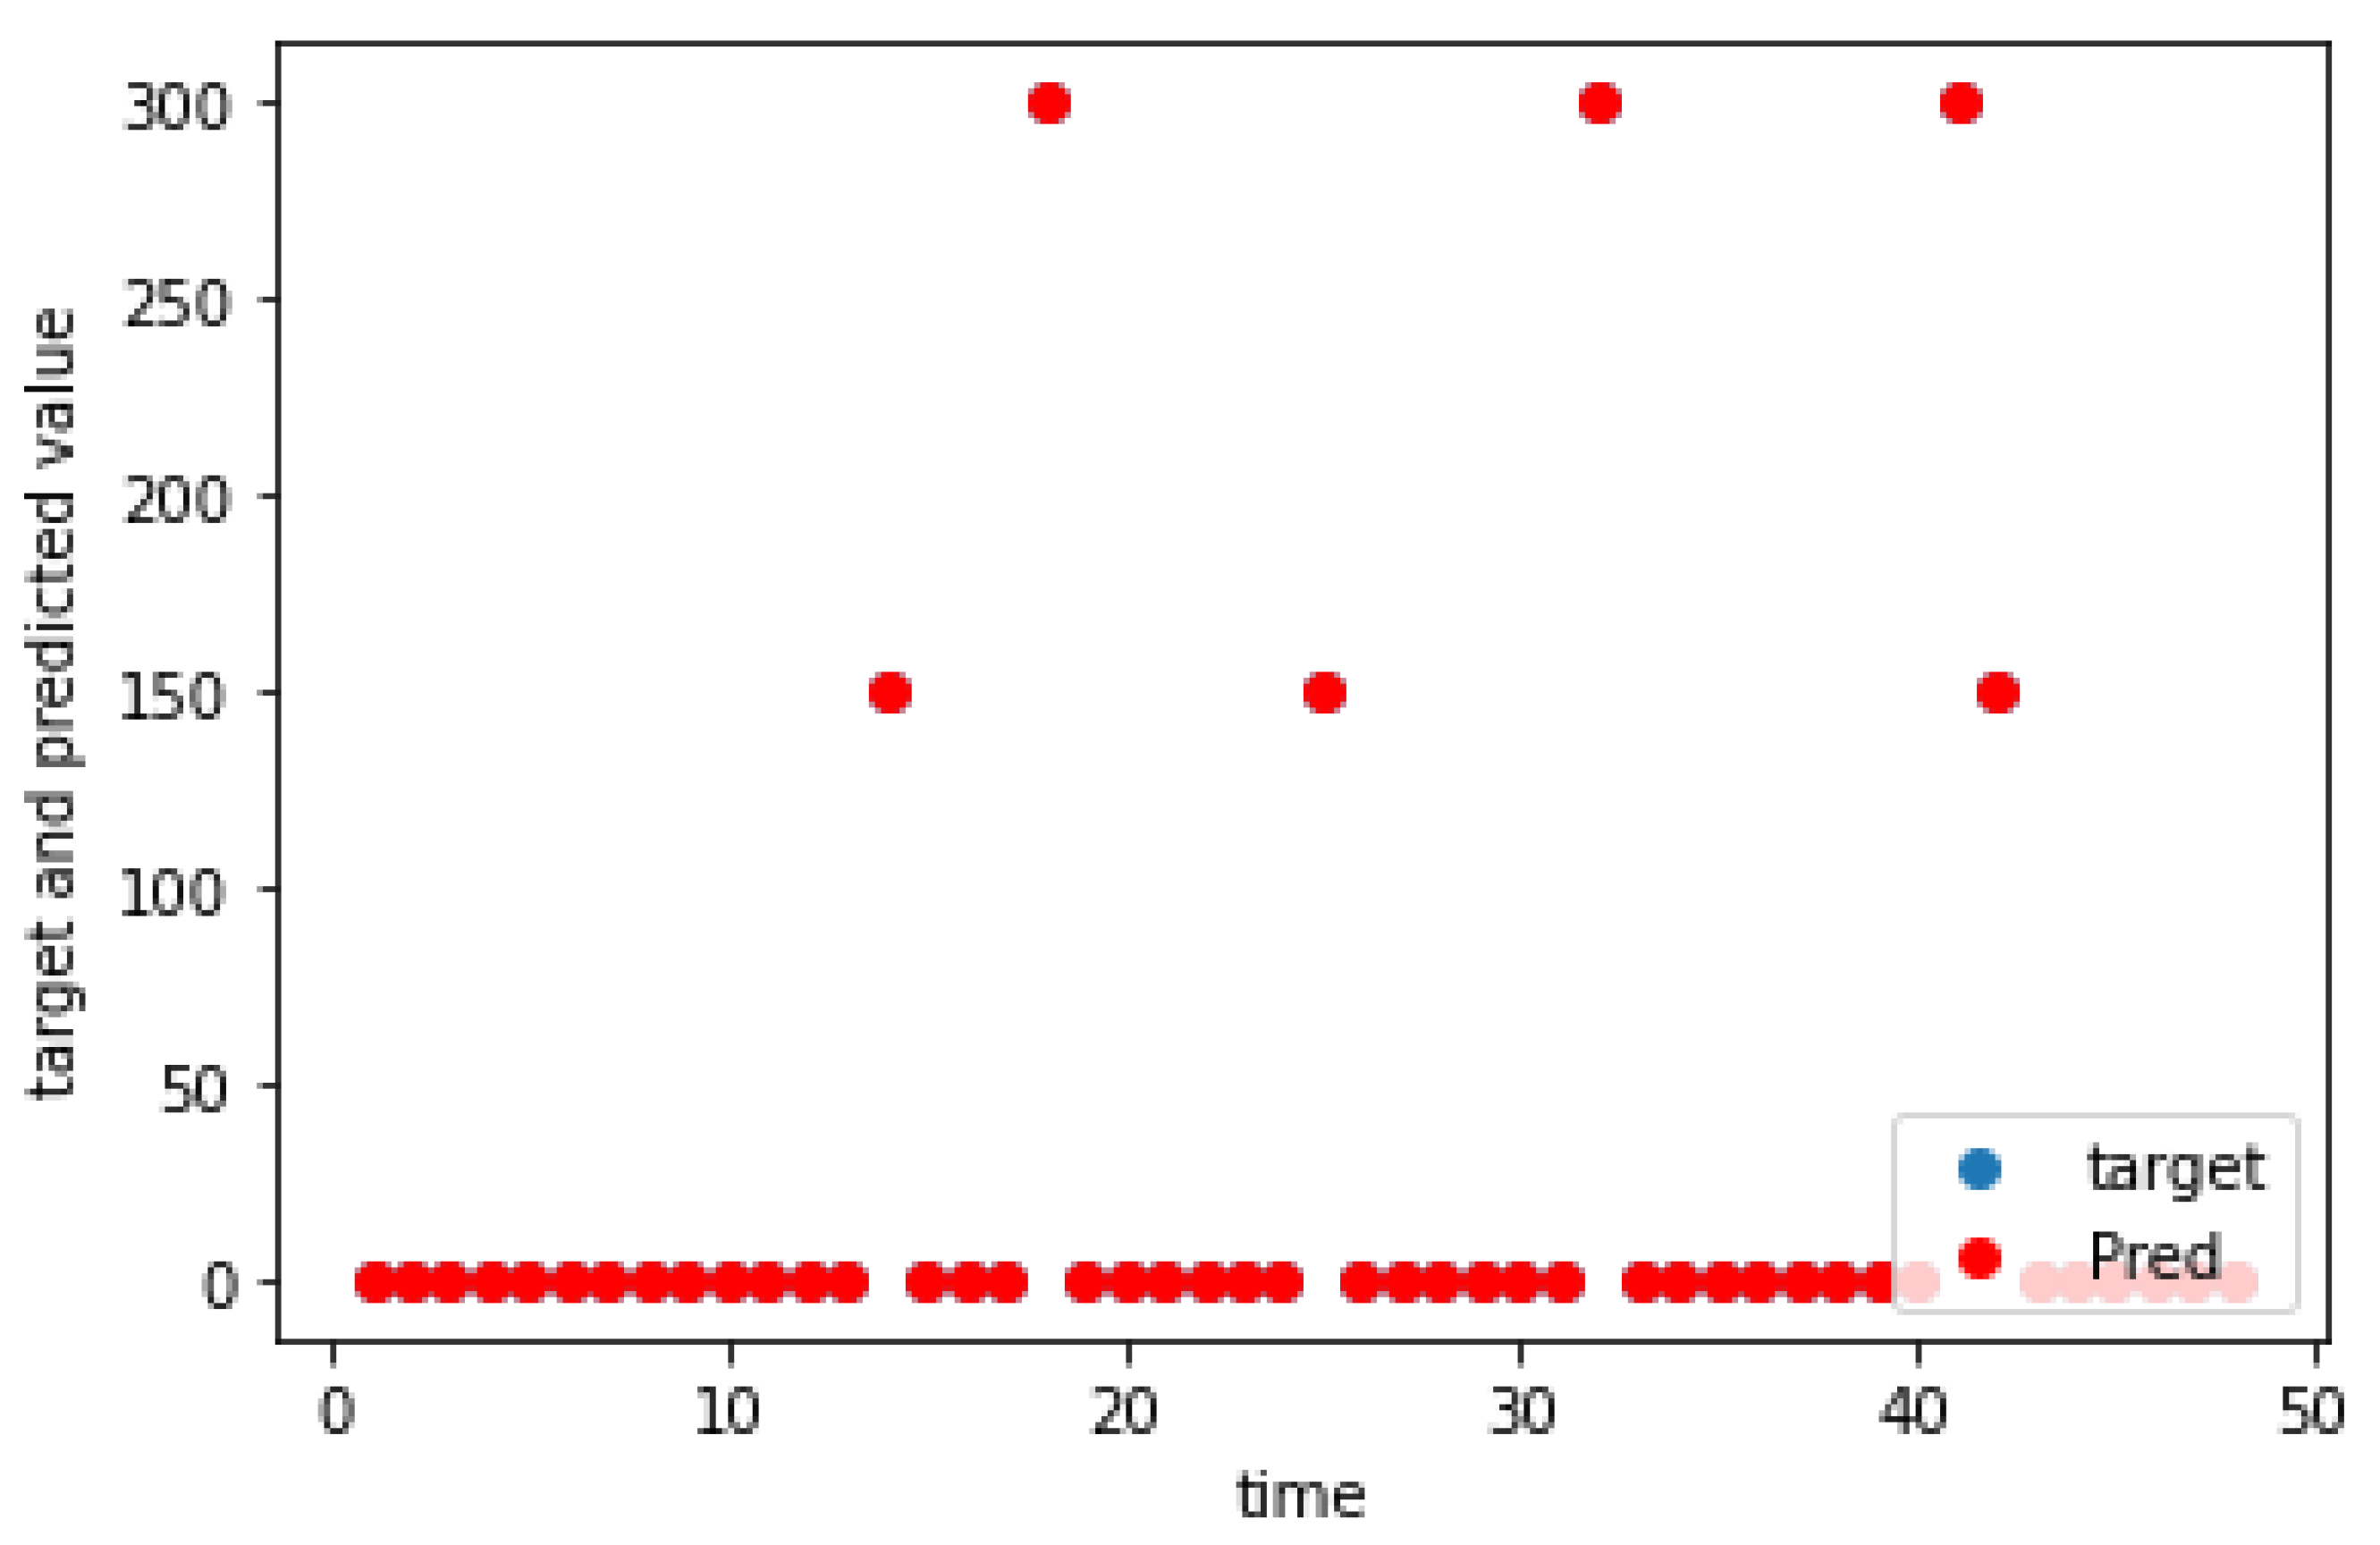
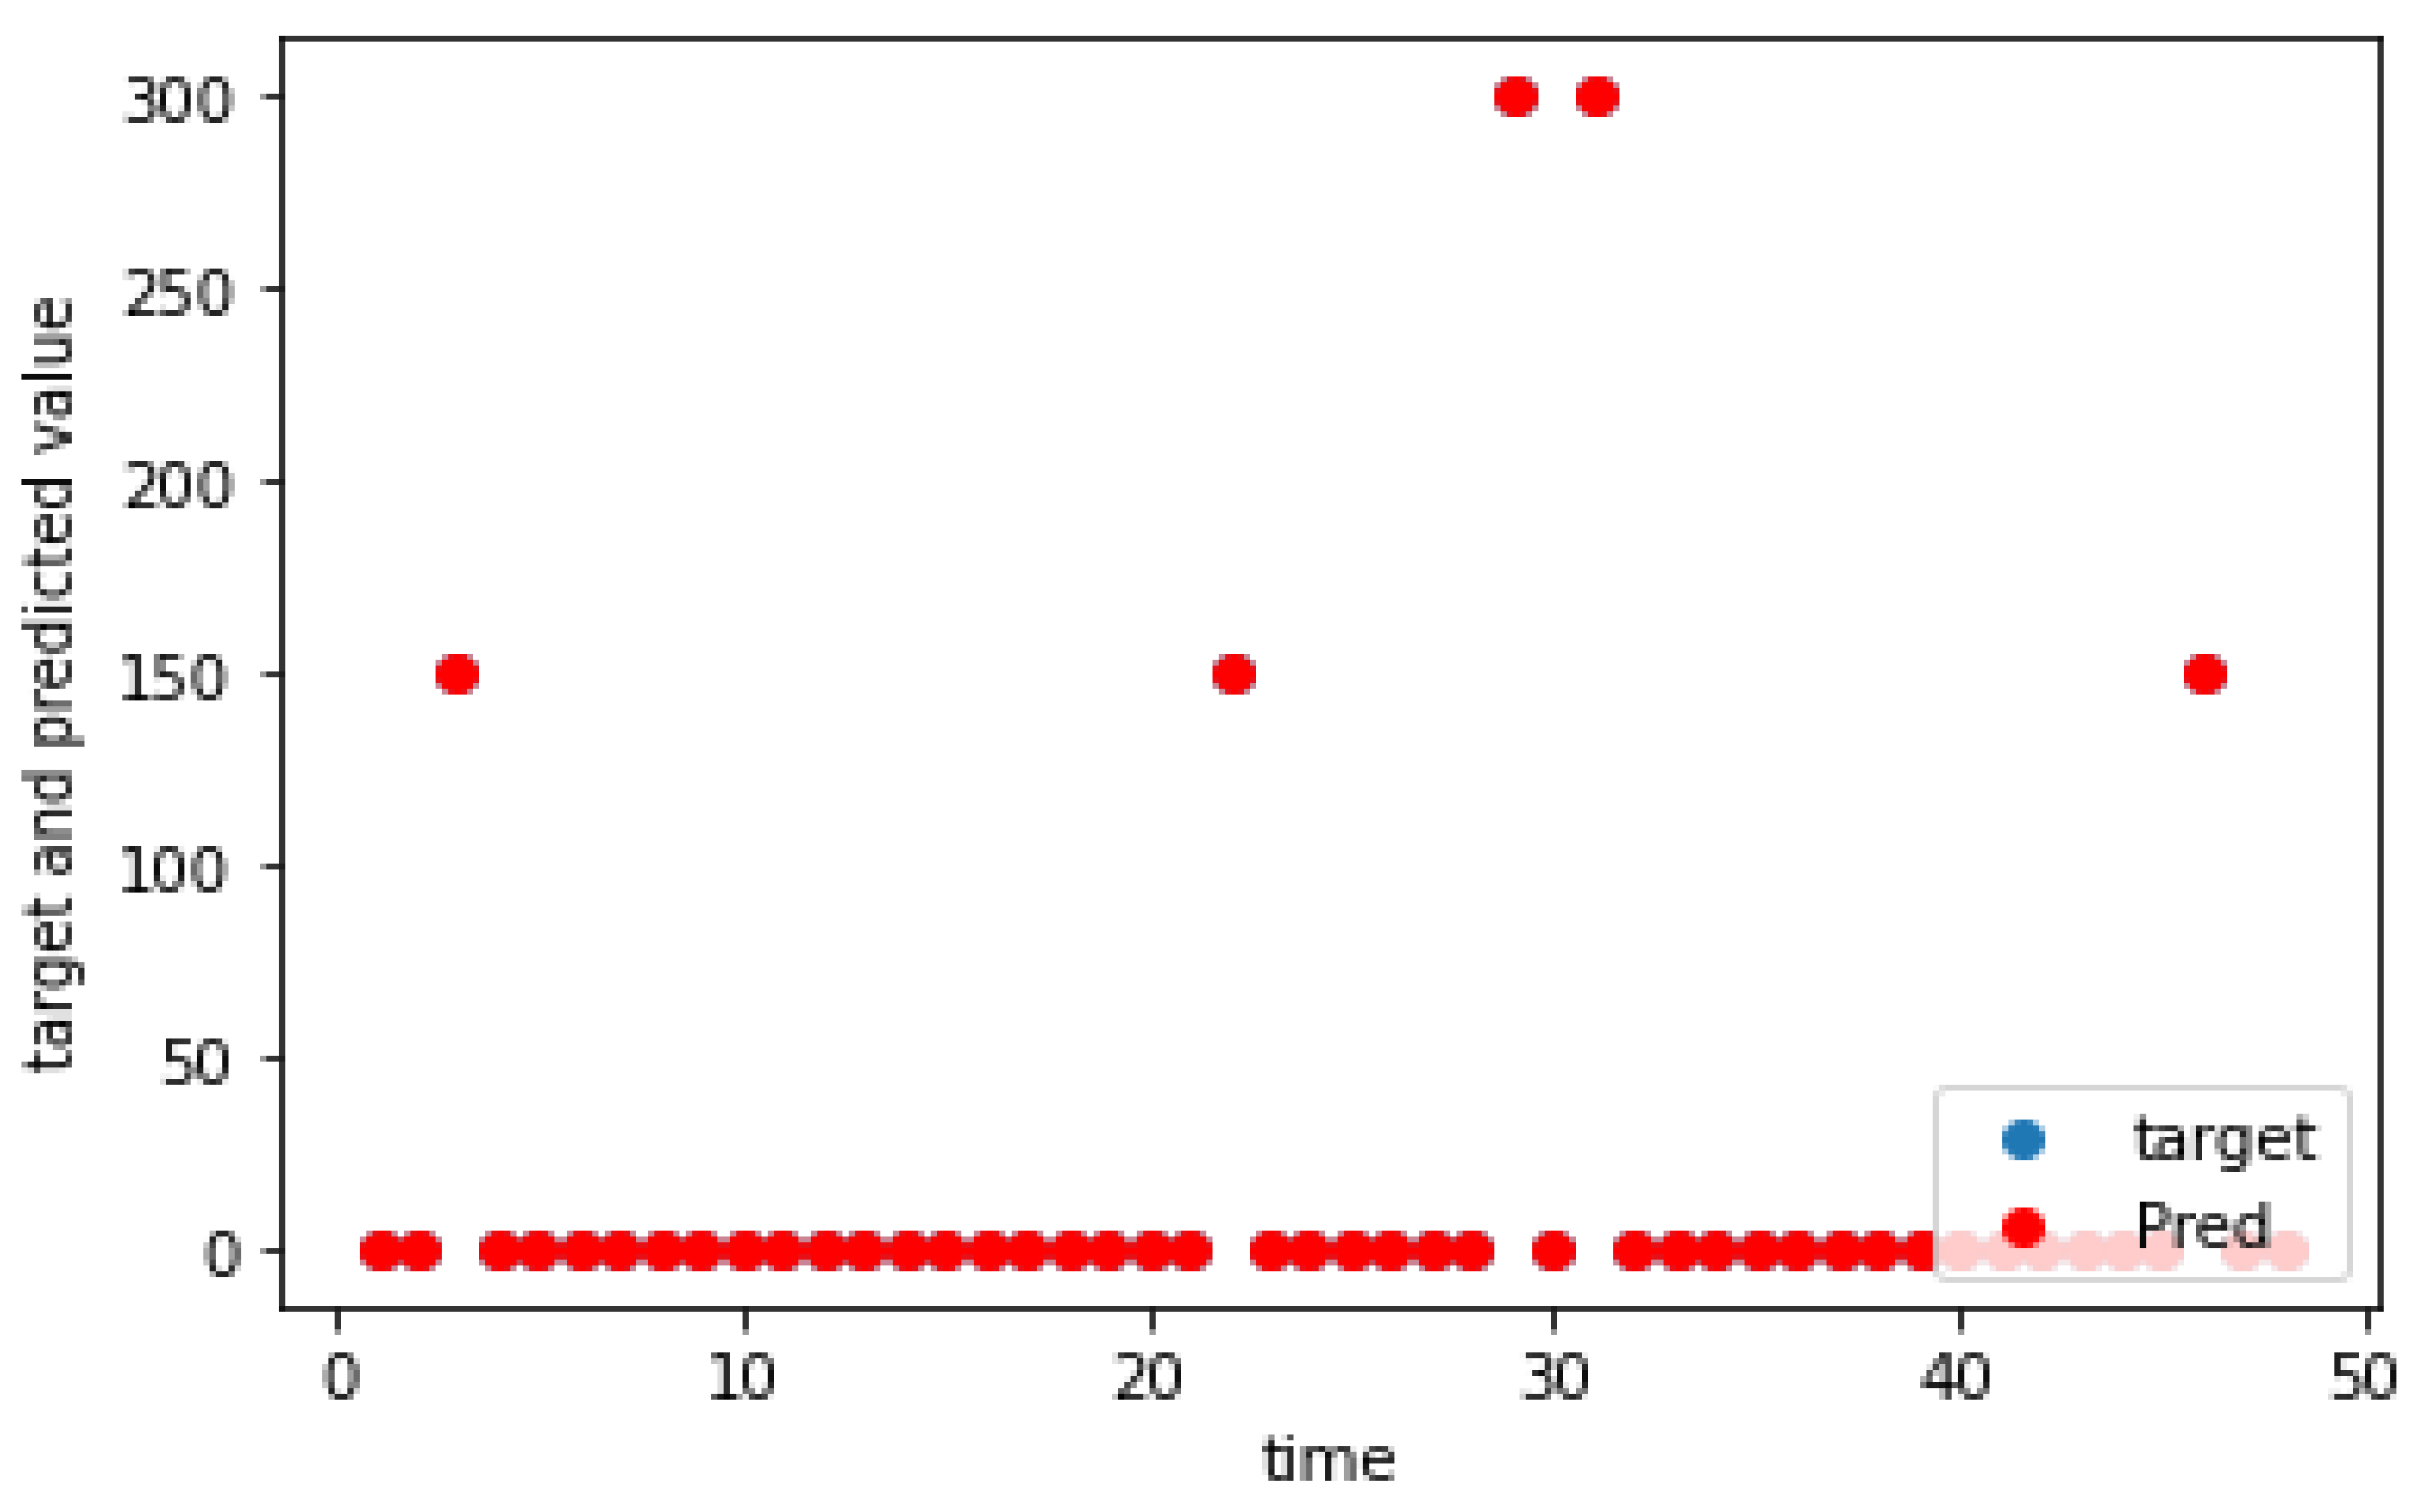
The charging demand prediction was performed for the seven charging locations of the e-buses by the methodology in Section 3. The actual and predicted charging demands for the seven charging locations for weekdays, as well as weekends, are shown graphically in Figure 5, Figure 6, Figure 7, Figure 8, Figure 9, Figure 10, Figure 11, Figure 12, Figure 13, Figure 14, Figure 15, Figure 16, Figure 17 and Figure 18, respectively. It was observed that the charging load of weekdays was more than weekends for all the charging locations. This was due to the fact that buses are less frequent on weekends. The figures also indicate the effectiveness of the random forest in predicting the charging load.
4.3. Sensitivity Analysis
The impact of different parameters of the random forest model on its performance is explored in this section. The performance comparison was conducted by comparing performance indices, such as the accuracy, r score, MSE, MAE, and RMSE. The impacts of n_estimators and random_state, which are hyperparameters of the model, on the performance of the random forest were investigated. Table 5 reports the impact of n_estimators on the performance of random forest with random_state = 0 for the seven charging datasets. It was observed for dataset 1, dataset 4, and dataset 7 that the model performed best when n_estimators = 100. In addition, for dataset 2, dataset 3, dataset 5, and dataset 6, the model performed the best when n_estimators = 150. Table 6 gives the impact of random_state on the performance of random forest with n_estimators = 100 for the seven charging datasets. It can be discovered that the model performed the best when random_state = 0 for all the datasets except for dataset 6. For dataset 6, the model performed the best when random_state = 5.
4.4. Performance Comparison
The performance of the random forest model in coping with the charging demand prediction problem is compared with the SVM. Table 7 reports the MSE, MAE, and RMSE values computed by the SVM, as well as RF, for the seven charging datasets. It is apparent that the values of MSE, MAE, and RMSE are much less by the RF for all the datasets as compared to the SVM, thereby indicating the superior performances of the RF.
5. Conclusions
Global warming, crisis of energy, and a degraded air quality index have compelled electrification of the transport sector. Public e-buses are the first candidates for electrification since the majority of public transport is dependent on them. Electrification of the public e-buses will increase the load demand of the power grid, thus creating technological and commercial challenges. Indeed, prediction of the e-bus charging load is a crucial issue for maintaining the smooth and hassle-free operation of the power system. The present work proposes a random-forest-based model for the prediction of e-bus charging demand for the city of Helsinki, Finland. The model was validated for seven charging datasets for route 11 of Helsinki city. The simulation results show that the proposed approach is very capable of predicting the charging demand accurately for all the datasets. Furthermore, the effect of different parameters of random forest on its performance were tested for all the datasets, and the optimal values of n_estimators and random_state were obtained. The performance of the random forest was also compared with that of SVM for all seven charging datasets. The computed values of MSE, RMSE, and MAE indicate the superiority of random forest over SVM. Our approach can be used by charging station operators to effectively predict the charging demand and to manage the charging load. The EV load was predicted in this work for the public e-buses of Helsinki, which can be called categorical to some extent. The EV load demand prediction for the non-categorical EV (both buses and private EVs) will be considered in our future work, which mainly focuses on the following issues:
- The use of more sophisticated machine learning techniques for charging demand prediction;
- Charging demand prediction for private electric vehicles;
- Use of the gene expression programming method for charging demand prediction.
Author Contributions
S.D.: conceptualization, numerical analysis, and writing; X.-Z.G.: Review and Editing. All authors have read and agreed to the published version of the manuscript.
Funding
This research received no external funding.
Institutional Review Board Statement
Not applicable.
Informed Consent Statement
Not applicable.
Acknowledgments
The first author would like to thank ERCIM and EUTOPIA.
Conflicts of Interest
The authors declare no conflict of interest.
References
- Transport & Environment. Road Vehicles and Air Quality. Available online: Transportenvironment.org (accessed on 29 April 2021).
- US EPA. Carbon Pollution from Transportation. Available online: https://www.epa.gov/transportation-air-pollution-and-climate-change/carbon-pollution-transportation (accessed on 5 May 2021).
- Xue, Y.; Cao, X.; Ai, Y.; Xu, K.; Zhang, Y. Primary air pollutants emissions variation characteristics and future control strategies for transportation sector in Beijing, China. Sustainability 2020, 12, 4111. [Google Scholar] [CrossRef]
- Askariyeh, M.H.; Venugopal, M.; Khreis, H.; Birt, A.; Zietsman, J. Near-road traffic-related air pollution: Resuspended PM 2. 5 from highways and arterials. Int. J. Environ. Res. Public Health 2020, 17, 2851. [Google Scholar] [CrossRef] [PubMed]
- Deb, S.; Tammi, K.; Kalita, K.; Mahanta, P. Impact of electric vehicle charging station load on distribution network. Energies 2018, 11, 178. [Google Scholar] [CrossRef] [Green Version]
- Deb, S.; Kalita, K.; Mahanta, P. Review of impact of electric vehicle charging station on the power grid. In Proceedings of the 2017 International Conference on Technological Advancements in Power and Energy (TAP Energy), Kollam, India, 21–23 December 2017. [Google Scholar]
- Nour, M.; Chaves-Ávila, J.P.; Magdy, G.; Sánchez-Miralles, Á. Review of positive and negative impacts of electric vehicles charging on electric power systems. Energies 2020, 13, 4675. [Google Scholar] [CrossRef]
- Zagrajek, K.; Paska, J.; Kłos, M.; Pawlak, K.; Marchel, P.; Bartecka, M.; Michalski, L.; Terlikowski, P. Impact of electric bus charging on distribution substation and local grid in Warsaw. Energies 2020, 13, 1210. [Google Scholar] [CrossRef] [Green Version]
- Skok, S.; Havaš, L.; Radosevic, V.; Cvitanovic, M. Impact of Electromobility to the Power Distribution System. In Proceedings of the 2020 IEEE PES/IAS PowerAfrica, Nairobi, Kenya, 25–28 August 2020. [Google Scholar]
- Deb, S.; Sachan, S. Proposed Power Systems Planning in Indian Scenario for Integrating EV Charging Infrastructure. In Developing Charging Infrastructure and Technologies for Electric Vehicles; IGI Global: Hershey, PA, USA, 2022; pp. 25–37. [Google Scholar]
- Deb, S.; Kalita, K.; Mahanta, P. Distribution network planning considering the impact of electric vehicle charging station load. In Smart Power Distribution Systems; Academic Press: Cambridge, MA, USA, 2020; pp. 529–553. [Google Scholar]
- Ashfaq, M.; Butt, O.; Selvaraj, J.; Rahim, N. Assessment of electric vehicle charging infrastructure and its impact on the electric grid: A review. Int. J. Green Energy 2021, 18, 657–686. [Google Scholar] [CrossRef]
- Imara, M.N.F.; Liyanage, K.M. Electrical vehicle charging demand prediction using wavelet based analysis. In Proceedings of the 2017 IEEE International Conference on Industrial and Information Systems (ICIIS), Peradeniya, Sri Lanka, 15–16 December 2017. [Google Scholar]
- Arias, M.B.; Kim, M.; Bae, S. Prediction of electric vehicle charging-power demand in realistic urban traffic networks. Appl. Energy 2021, 195, 738–753. [Google Scholar] [CrossRef]
- Almaghrebi, A.; Aljuheshi, F.; Rafaie, M.; James, K.; Alahmad, M. Data-Driven Charging Demand Prediction at Public Charging Stations Using Supervised Machine Learning Regression Methods. Energies 2020, 13, 4231. [Google Scholar] [CrossRef]
- Gjelaj, M.; Hashemi, S.; Andersen, P.B.; Traeholt, C. Optimal infrastructure planning for EV fast-charging stations based on prediction of user behaviour. IET Electr. Syst. Transp. 2019, 10, 1–12. [Google Scholar] [CrossRef] [Green Version]
- Zhao, Y.; Wang, Z.; Shen, Z.J.M.; Sun, F. Data-driven framework for large-scale prediction of charging energy in electric vehicles. Appl. Energy 2021, 282, 116175. [Google Scholar] [CrossRef]
- Zheng, Y.; Shao, Z.; Zhang, Y.; Jian, L. A systematic methodology for mid-and-long term electric vehicle charging load forecasting: The case study of Shenzhen, China. Sustain. Cities Soc. 2020, 56, 102084. [Google Scholar] [CrossRef]
- Sun, S.; Yang, Q.; Yan, W. A novel Markov-based temporal-SoC analysis for characterizing PEV charging demand. IEEE Trans. Ind. Inform. 2017, 14, 156–166. [Google Scholar] [CrossRef]
- Su, S.; Zhao, H.; Zhang, H.; Lin, X.; Yang, F.; Li, Z. Forecast of electric vehicle charging demand based on traffic flow model and optimal path planning. In Proceedings of the 2017 19th International Conference on Intelligent System Application to Power Systems (ISAP), San Antonio, TX, USA, 17–20 September 2017. [Google Scholar]
- Rahbari, O.; Omar, N.; Firouz, Y.; Rosen, M.A.; Goutam, S.; Van Den Bossche, P.; Van Mierlo, J. A novel state of charge and capacity estimation technique for electric vehicles connected to a smart grid based on inverse theory and a metaheuristic algorithm. Energy 2018, 155, 1047–1058. [Google Scholar] [CrossRef]
- Zhang, X. Short-term load forecasting for electric bus charging stations based on fuzzy clustering and least squares support vector machine optimized by Wolf pack algorithm. Energies 2018, 11, 1449. [Google Scholar] [CrossRef] [Green Version]
- Wan, Y.; Cao, W.; Wang, L. A Prediction Method for EV Charging Load Based on Fuzzy Inference Algorithm. In Proceedings of the 2019 Chinese Control Conference (CCC), Guangzhou, China, 17 October 2019; pp. 2803–2808. [Google Scholar]
- Dabbaghjamanesh, M.; Moeini, A.; Kavousi-Fard, A. Reinforcement learning-based load forecasting of electric vehicle charging station using q-learningtechnique. IEEE Trans. Ind. Inform. 2020, 17, 4229–4237. [Google Scholar] [CrossRef]
- Wang, G.; Xie, X.; Zhang, F.; Liu, Y.; Zhang, D. bCharge: Data-driven real-time charging scheduling for large-scale electric bus fleets. In Proceedings of the 2018 IEEE Real-Time Systems Symposium (RTSS), Nashville, TN, USA, 11–14 December 2018. [Google Scholar]
- He, Z.; Cheng, Y.; Hu, Z. Multi-time simulation of electric taxicabs’ charging demand based on residents’ travel characteristics. In Proceedings of the 2017 IEEE Conference on Energy Internet and Energy System Integration (EI2), Beijing, China, 26–28 November 2017. [Google Scholar]
- Zhang, Z.; He, H.; Guo, J.; Han, R. Velocity prediction and profile optimization based real-time energy management strategy for Plug-in hybrid electric buses. Appl. Energy 2020, 280, 116001. [Google Scholar] [CrossRef]
- Yun, C.; Wanquan, Z.; Wei, Y.; Pan, M. Prediction on the charging demand for electric vehicles in Chengdu. IOP Conf. Ser. Mater. Sci. Eng. 2018, 324, 012080. [Google Scholar] [CrossRef]
- Chen, W.; Zhuang, P.; Liang, H. Reinforcement learning for smart charging of electric buses in smart grid. In Proceedings of the 2019 IEEE Global Communications Conference (GLOBECOM), Waikoloa, HI, USA, 9–13 December 2019. [Google Scholar]
- Liu, Y.; Liang, H. An MHO approach for electric bus charging scheme optimization based on energy consumption estimation. In Proceedings of the 2018 IEEE Power & Energy Society General Meeting (PESGM), Portland, OR, USA, 5–10 August 2018. [Google Scholar]
- Pagliaro, M.; Meneguzzo, F. Electric bus: A critical overview on the dawn of its widespread uptake. Adv. Sustain. Syst. 2019, 3, 1800151. [Google Scholar] [CrossRef]
- Zhang, R.; Fujimori, S. The role of transport electrification in global climate change mitigation scenarios. Environ. Res. Lett. 2020, 15, 034019. [Google Scholar] [CrossRef]
- Xylia, M.; Leduc, S.; Laurent, A.B.; Patrizio, P.; Van Der Meer, Y.; Kraxner, F.; Silveira, S. Impact of bus electrification on carbon emissions: The case of Stockholm. J. Clean. Prod. 2019, 209, 74–87. [Google Scholar] [CrossRef] [Green Version]
- Lie, K.W.; Synnevåg, T.A.; Lamb, J.J.; Lien, K.M. The Carbon Footprint of Electrified City Buses: A Case Study in Trondheim, Norway. Energies 2021, 14, 770. [Google Scholar] [CrossRef]
- Sasidharan, C.; Ray, A.; Das, S. Selection of Charging Technology for Electric Bus Fleets in Intra-city Public Transport in India. In Proceedings of the 2019 Global Conference for Advancement in Technology (GCAT), Bangalore, India, 18–20 October 2019. [Google Scholar]
- Roskilde is 1st City in Denmark to Convert Bus Fleet to Electric. Available online: https://www.cleantechnica.com (accessed on 30 April 2021).
- Liu, Y.; Wang, Y.; Zhang, J. New machine learning algorithm: Random forest. In International Conference on Information Computing and Applications; Springer: Berlin/Heidelberg, Germany, 2012; pp. 246–252. [Google Scholar]
- Built In. The Random Forest Algorithm: A Complete Guide. Available online: https://builtin.com/data-science/random-forest-algorithm (accessed on 10 May 2021).
- Jaiswal, J.K.; Samikannu, R. Application of random forest algorithm on feature subset selection and classification and regression. In Proceedings of the 2017 World Congress on Computing and Communication Technologies (WCCCT), Tiruchirappalli, India, 2–4 February 2017. [Google Scholar]
- Belgiu, M.; Drăguţ, L. Random forest in remote sensing: A review of applications and future directions. ISPRS J. Photogramm. Remote Sens. 2016, 114, 24–31. [Google Scholar] [CrossRef]
- Mascaro, J.; Asner, G.P.; Knapp, D.E.; Kennedy-Bowdoin, T.; Martin, R.E.; Anderson, C.; Higgins, M.; Chadwick, K.D. A tale of two “forests”: Random Forest machine learning aids tropical forest carbon mapping. PLoS ONE 2014, 9, e85993. [Google Scholar] [CrossRef] [PubMed]
- Yao, H.; Li, X.; Pang, H.; Sheng, L.; Wang, W. Application of random forest algorithm in hail forecasting over Shandong Peninsula. Atmos. Res. 2020, 244, 105093. [Google Scholar] [CrossRef]
- Alam, M.S.; Vuong, S.T. Random forest classification for detecting android malware. In Proceedings of the 2013 IEEE International Conference on Green Computing and Communications and IEEE Internet of Things and IEEE Cyber, Physical and Social Computing, Beijing, China, 20–23 August 2013; pp. 663–669. [Google Scholar]
- Horning, N. Random Forests: An algorithm for image classification and generation of continuous fields data sets. In Proceedings of the International Conference on Geoinformatics for Spatial Infrastructure Development in Earth and Allied Sciences, Osaka, Japan, 9 December 2010; Volume 911. [Google Scholar]
- Yi, H.; Xiong, Q.; Zou, Q.; Xu, R.; Wang, K.; Gao, M. A Novel Random Forest and its Application on Classification of Air Quality. In Proceedings of the 2019 8th International Congress on Advanced Applied Informatics (IIAI-AAI), Toyama, Japan, 7–11 July 2019; pp. 35–38. [Google Scholar]
- The Mayor.eu. Helsinki Goes all in on Electric. Available online: https://www.themayor.eu/fr/a/view/helsinki-goes-all-in-on-electric-3182?trans=en-US (accessed on 30 April 2021).
- Sachan, S.; Deb, S.; Singh, S.N. Different charging infrastructures along with smart charging strategies for electric vehicles. Sustain. Cities Soc. 2020, 60, 102238. [Google Scholar] [CrossRef]
- Ranta, M.; Karvonen, V.; Potter, J.J.; Pasonen, R.; Pursiheimo, E.; Halmeaho, T.; Ponomarev, P.; Pihlatie, M. Method including power grid model and route simulation to aid planning and operation of an electric bus fleet. In Proceedings of the 2016 IEEE Vehicle Power and Propulsion Conference (VPPC), Hangzhou, China, 17–20 October 2016. [Google Scholar]
- HSL. Open Data Platform of HSL. Available online: http://dev.hsl.fi/ (accessed on 12 April 2021).
- Available online: https://movelatam.org/wp-content/uploads/2017/12/ABB_Complete-offer-ebus_FINAL_X3.pdf (accessed on 15 April 2021).
Figure 1.
Quantitative analysis of reported research works on charging demand prediction.

Figure 2.
Working principle of random forest.

Figure 3.
Flowchart of charging dataset generation for e-buses.

Figure 4.
Charging demand prediction by random forest.

Figure 5.
Charging demand prediction of a weekday for Matinkylä (M).

Figure 6.
Charging demand prediction of a weekend for Matinkylä (M).

Figure 7.
Charging demand prediction of a weekday for Teekkarikylä.

Figure 8.
Charging demand prediction of a weekend for Teekkarikylä.

Figure 9.
Charging demand prediction of a weekday for Hyljeveneentie.

Figure 10.
Charging demand prediction of a weekend for Hyljeveneentie.

Figure 11.
Charging demand prediction of a weekday for Munkkiranta.

Figure 12.
Charging demand prediction of a weekend for Munkkiranta.

Figure 13.
Charging demand prediction of a weekday for Tuomarilankallio.

Figure 14.
Charging demand prediction of a weekend for Tuomarilankallio.

Figure 15.
Charging demand prediction of a weekday for Alakaupunki.

Figure 16.
Charging demand prediction of a weekend for Alakaupunki.

Figure 17.
Charging demand prediction of a weekday for Leppävaaran asema.

Figure 18.
Charging demand prediction of a weekend for Leppävaaran asema.

Table 1.
Review of research works on the prediction of charging demand.
| Ref | Year | Vehicle Category | Methodology | Test Network |
|---|---|---|---|---|
| [13] | 2017 | Private EV | Wavelet decomposition | Urban area of Sri Lanka |
| [14] | 2017 | Private EV | Markov chain and graph theory | Seoul, South Korea |
| [15] | 2021 | Private EV | Gradient Boosting and SVM | Nebraska, USA |
| [16] | 2019 | Private EV | Probabilistic approach based on normal distribution | Copenhagen, Denmark |
| [17] | 2021 | Private EV | Data-driven two-layer approach and neural network | Guangzhou, China |
| [18] | 2020 | Taxi, E bus, and official EV | Monte Carlo | Shenzhen, China |
| [19] | 2017 | Private EV | Monte Carlo and HMM | IEEE 53 bus system |
| [20] | 2017 | Private EV | Queuing theory and Monte Carlo | 33 node road network |
| [21] | 2018 | Private EV | TLBO and ANFIS | Experimental data from the Prognostics Center of Excellence at NASA |
| [22] | 2018 | E bus | SVM and WPA | Baoding, China |
| [23] | 2019 | Private EV | Fuzzy logic and Monte Carlo | NHTS dataset |
| [24] | 2020 | Private EV | Reinforcement learning | Generated dataset considering different EV penetration rate |
| [25] | 2018 | E bus | Markov model | Shenzhen, China |
| [26] | 2017 | E taxi | Monte Carlo | Ideal city with E taxi |
| [27] | 2020 | E bus | GA and DP | Ideal city with E bus |
| [28] | 2018 | Private EV | Elastic coefficient method | Chengdu, China |
| [29] | 2019 | E bus | Reinforcement learning | St. Albert Transit, AB, Canada |
| [30] | 2018 | E bus | MHO | Edmonton Transit Service (ETS) |
Table 5.
Impact of n_estimators on the performance of the random forest with random_state = 0.
| Dataset | n_Estimators | Accuracy (%) | r2_Score | MSE | MAE | RMSE |
|---|---|---|---|---|---|---|
| 1 | 10 | 95.8 | 0.7904484386038507 | 0.08515482695810565 | 0.055783242258652097 | 0.29181299998 |
| 50 | 97.65 | 0.8800961654043424 | 0.048724954462659384 | 0.031876138433515486 | 0.22073729739 | |
| 100 | 97.68 | 0.8842984025981154 | 0.04701730418943534 | 0.031079234972677595 | 0.21683473935 | |
| 150 | 97.60 | 0.8823373585743547 | 0.04781420765027322 | 0.031876138433515486 | 0.21866460081 | |
| 2 | 10 | 99.70 | 0.9871291417051332 | 0.0036429872495446266 | 0.0031876138433515485 | 0.06035716402 |
| 50 | 99.95 | 0.9983911427131417 | 0.0004553734061930783 | 0.0004553734061930783 | 0.02133947998 | |
| 100 | 99.86 | 0.995173428139425 | 0.001366120218579235 | 0.001366120218579235 | 0.03696106354 | |
| 150 | 99.93 | 0.9975867140697124 | 0.0006830601092896175 | 0.0006830601092896175 | 0.02613541867 | |
| 3 | 10 | 99.62 | 0.9699892251273617 | 0.00819672131147541 | 0.005236794171220401 | 0.09053574604 |
| 50 | 99.97 | 0.9991663673646489 | 0.00022768670309653916 | 0.00022768670309653916 | 0.015089291 | |
| 100 | 99.90 | 0.9954150205055692 | 0.0012522768670309653 | 0.0010245901639344263 | 0.03538752417 | |
| 150 | 99.95 | 0.9983327347292978 | 0.0004553734061930783 | 0.0004553734061930783 | 0.02133947998 | |
| 4 | 10 | 99.96 | 0.9944342959897658 | 0.00034153005464480874 | 0.00034153005464480874 | 0.01848053177 |
| 50 | 100 | 1 | 0 | 0 | 0 | |
| 100 | 100 | 1 | 0 | 0 | 0 | |
| 150 | 100 | 1 | 0 | 0 | 0 | |
| 5 | 10 | 99.32 | 0.945617411485014 | 0.01354735883424408 | 0.008993624772313297 | 0.11639312193 |
| 50 | 99.88 | 0.9926880553257161 | 0.0018214936247723133 | 0.001366120218579235 | 0.04267895997 | |
| 100 | 99.94 | 0.9977150172892864 | 0.000569216757741348 | 0.000569216757741348 | 0.02385826392 | |
| 150 | 99.95 | 0.9981720138314291 | 0.0004553734061930783 | 0.0004553734061930783 | 0.02133947998 | |
| 6 | 10 | 98.13 | 0.9220482176028851 | 0.033925318761384333 | 0.023451730418943533 | 0.18418826988 |
| 50 | 99.28 | 0.9639015235879133 | 0.015710382513661202 | 0.009562841530054645 | 0.12534106475 | |
| 100 | 99.06 | 0.9518686981172176 | 0.020947176684881604 | 0.012522768670309653 | 0.14473139495 | |
| 150 | 99.55 | 0.9777654311954538 | 0.009676684881602914 | 0.005806010928961749 | 0.09837014222 | |
| 7 | 10 | 99.54 | 0.9741018004614654 | 0.007969034608378871 | 0.005692167577413479 | 0.08926944946 |
| 50 | 99.78 | 0.9863109516724888 | 0.0042122040072859745 | 0.0028460837887067394 | 0.06490149464 | |
| 100 | 99.85 | 0.9896407201845862 | 0.0031876138433515485 | 0.0020491803278688526 | 0.05645895715 | |
| 150 | 99.80 | 0.9881608230680985 | 0.0036429872495446266 | 0.0025045537340619307 | 0.06035716402 |
Table 6.
Impact of random_state on the performance of the random forest with n_estimators = 100.
| Dataset | Random_State | Accuracy (%) | r2_Score | MSE | MAE | RMSE |
|---|---|---|---|---|---|---|
| 1 | 0 | 97.68 | 0.8842984025981154 | 0.04701730418943534 | 0.031079234972677595 | 0.21683473935 |
| 5 | 97.30 | 0.8574062176955074 | 0.05874316939890711 | 0.03756830601092896 | 0.242369902 | |
| 10 | 97.02 | 0.8452892618028056 | 0.06386612021857924 | 0.04109744990892532 | 0.25271747113 | |
| 2 | 0 | 99.86 | 0.995173428139425 | 0.001366120218579235 | 0.001366120218579235 | 0.03696106354 |
| 5 | 99.88 | 0.9956386807903104 | 0.001138433515482696 | 0.001138433515482696 | 0.03374068042 | |
| 10 | 99.92 | 0.9970207118380334 | 0.0007969034608378871 | 0.0007969034608378871 | 0.02822947857 | |
| 3 | 0 | 99.90 | 0.9954150205055692 | 0.0012522768670309653 | 0.0010245901639344263 | 0.03538752417 |
| 5 | 99.79 | 0.9918073542716146 | 0.0020491803278688526 | 0.0020491803278688526 | 0.04526787302 | |
| 10 | 99.89 | 0.9960259002160932 | 0.0010245901639344263 | 0.0010245901639344263 | 0.03200921998 | |
| 4 | 0 | 100 | 1 | 0 | 0 | 0 |
| 5 | 100 | 1 | 0 | 0 | 0 | |
| 10 | 100 | 1 | 0 | 0 | 0 | |
| 5 | 0 | 99.94 | 0.9977150172892864 | 0.000569216757741348 | 0.000569216757741348 | 0.02385826392 |
| 5 | 99.85 | 0.9917225022647111 | 0.002163023679417122 | 0.0017076502732240437 | 0.04650831838 | |
| 10 | 99.27 | 0.9927559523306366 | 0.0018214936247723133 | 0.001138433515482696 | 0.04267895997 | |
| 6 | 0 | 99.06 | 0.9518686981172176 | 0.020947176684881604 | 0.012522768670309653 | 0.14473139495 |
| 5 | 99.60 | 0.9862847266479384 | 0.005578324225865209 | 0.004439890710382513 | 0.07468817996 | |
| 10 | 99.18 | 0.9625448791489143 | 0.01616575591985428 | 0.010245901639344262 | 0.12714462599 | |
| 7 | 0 | 99.85 | 0.9896407201845862 | 0.0031876138433515485 | 0.0020491803278688526 | 0.05645895715 |
| 5 | 99.76 | 0.9820208888963748 | 0.00546448087431694 | 0.0034153005464480873 | 0.07392212709 | |
| 10 | 99.81 | 0.9875294439508934 | 0.003870673952641166 | 0.0025045537340619307 | 0.06221474063 |
Table 7.
Comparison of the RF model with the SVM model.
| Dataset | Algorithm | MSE | MAE | RMSE |
|---|---|---|---|---|
| 1 | SVM | 0.26855646630236796 | 0.2114071038251366 | 0.51822433974 |
| RF | 0.04701730418943534 | 0.031079234972677595 | 0.21683473935 | |
| 2 | SVM | 0.16666666666666666 | 0.13387978142076504 | 0.40824829046 |
| RF | 0.001366120218579235 | 0.001366120218579235 | 0.03696106354 | |
| 3 | SVM | 0.20081967213114754 | 0.14685792349726776 | 0.44812907976 |
| RF | 0.0012522768670309653 | 0.0010245901639344263 | 0.03538752417 | |
| 4 | SVM | 0.07172131147540983 | 0.0598816029143898 | 0.2678083484 |
| RF | 0 | 0 | 0 | |
| 5 | SVM | 0.15710382513661203 | 0.13979963570127504 | 0.39636324897 |
| RF | 0.000569216757741348 | 0.000569216757741348 | 0.02385826392 | |
| 6 | SVM | 0.18055555555555555 | 0.15186703096539161 | 0.42491829279 |
| RF | 0.020947176684881604 | 0.012522768670309653 | 0.14473139495 | |
| 7 | SVM | 0.14993169398907105 | 0.13718123861566484 | 0.38721014189 |
| RF | 0.0031876138433515485 | 0.0020491803278688526 | 0.05645895715 |
Publisher’s Note: MDPI stays neutral with regard to jurisdictional claims in published maps and institutional affiliations. |
© 2022 by the authors. Licensee MDPI, Basel, Switzerland. This article is an open access article distributed under the terms and conditions of the Creative Commons Attribution (CC BY) license (https://creativecommons.org/licenses/by/4.0/).
Share and Cite
MDPI and ACS Style
Deb, S.; Gao, X.-Z. Prediction of Charging Demand of Electric City Buses of Helsinki, Finland by Random Forest. Energies 2022, 15, 3679. https://0-doi-org.brum.beds.ac.uk/10.3390/en15103679
AMA Style
Deb S, Gao X-Z. Prediction of Charging Demand of Electric City Buses of Helsinki, Finland by Random Forest. Energies. 2022; 15(10):3679. https://0-doi-org.brum.beds.ac.uk/10.3390/en15103679
Chicago/Turabian StyleDeb, Sanchari, and Xiao-Zhi Gao. 2022. "Prediction of Charging Demand of Electric City Buses of Helsinki, Finland by Random Forest" Energies 15, no. 10: 3679. https://0-doi-org.brum.beds.ac.uk/10.3390/en15103679
Note that from the first issue of 2016, this journal uses article numbers instead of page numbers. See further details here.