
Experimental Study and Modeling of the Effect of ESDD/NSDD on AC Flashover of SiR Outdoor Insulators


1
Advanced High Voltage Engineering Centre, School of Engineering, Cardiff University, Queen’s Buildings, The Parade, Cardiff CF24 3AA, UK
2
Department of Electrical and Computer Engineering, Faculty of Engineering, Elmergib University, Khoms P.O. Box 40414, Libya
*
Author to whom correspondence should be addressed.
Energies 2022, 15(10), 3782; https://0-doi-org.brum.beds.ac.uk/10.3390/en15103782
Submission received: 12 April 2022
/
Revised: 10 May 2022
/
Accepted: 13 May 2022
/
Published: 20 May 2022
(This article belongs to the Special Issue Testing, Monitoring and Diagnostic of High Voltage Equipment)
Abstract
:Pollution flashover occurs when soluble and nonsoluble materials cover the surface of an insulator, and this may ultimately cause a reduction in its performance. In this paper, the common type of sodium chloride (NaCl) was used as a soluble pollutant (ESDD) and kaolin as a nonsoluble pollutant (NSDD). Samples of silicone rubber (SiR) insulators were selected for this study and fabricated at the Advanced High Voltage Engineering Research Centre (AHIVEC) at Cardiff University. The samples were preconditioned and polluted according to standard specifications. Additionally, the AC voltage ramp technique was used to achieve flashover (FOV) voltage with different pollution levels. The aim of this work was to investigate the effect of nonsoluble materials on flashover characteristics to understand their interaction with dry-band arcs by using FOV electrical equations and experimental data. The test results show that the FOV voltage of the silicone rubber insulator substantially decreased with the increase in both ESDD and NSDD values. It was also identified from these results that the dry-band arcs were considerably influenced by both ESDD and NSDD levels. This impact can be quantified by determining the variation of discharge parameters (N, n). Based on the FOV equations and experimental data, a mathematical model was suggested, taking into account the effect of both ESDD and NSDD.
1. Introduction
One of the major problems facing HV electrical grid engineers is the disturbance generated by insulator arcing due to pollution flashover (FOV), especially in harsh environments [1,2]. Pollution FOV of insulators is a complex phenomenon and has become a significant aspect in the design of HV overhead lines and substations [2,3]. This phenomenon can be affected by many parameters such as insulator material, insulator profile, pollution level, and atmospheric conditions (air pressure, temperature, humidity, fog, rain, snow, ice, etc.) [1,3,4,5,6].
The chemical constitution of the pollution layer is one of the key factors affecting the FOV characteristics and performance of insulators [7,8]. Sodium chloride (NaCl) is commonly utilized as the key reference indicator for conductive pollution materials [9,10]. The pollution degree is defined by the equivalent salt deposit density (ESDD) and represents the concentration of NaCl that, when dissolved in demineralized water, gives the same volumetric conductivity as that of the natural deposit removed from a given surface of the insulator divided by the area of the surface, generally expressed in mg/cm2. However, in the real field, the pollution constitution depends on the local environment where NaCl is not the predominant salt, as established by many researchers [7,8,11,12,13,14,15]. On the other hand, the pollution layer contains insoluble materials consisting mainly of ferrite, silica, and alumina [4,9,13,15,16,17,18]. The pollution index for insoluble or nonsoluble materials is defined as nonsoluble deposit density (NSDD) and represents the amount of nonsoluble residue removed from a given surface of the insulator, divided by the area of the surface, expressed in mg/cm2 [9]. Several studies have been performed to understand the effect of NSDD on the FOV performance of ceramic, glass, and polymeric insulators in artificial pollution tests, and the general conclusion is that FOV voltage decreases when NSDD increases for the same ESDD [14,16,17]. In the case of polymeric insulators, it has been reported that NSDD decreases hydrophobic performance and FOV voltage [19,20,21,22].
From a modeling point of view, it has been established that the variation of pollution FOV voltage with ESDD can be described as [4]
where coefficients α and β depend on the test conditions, and β < 0.
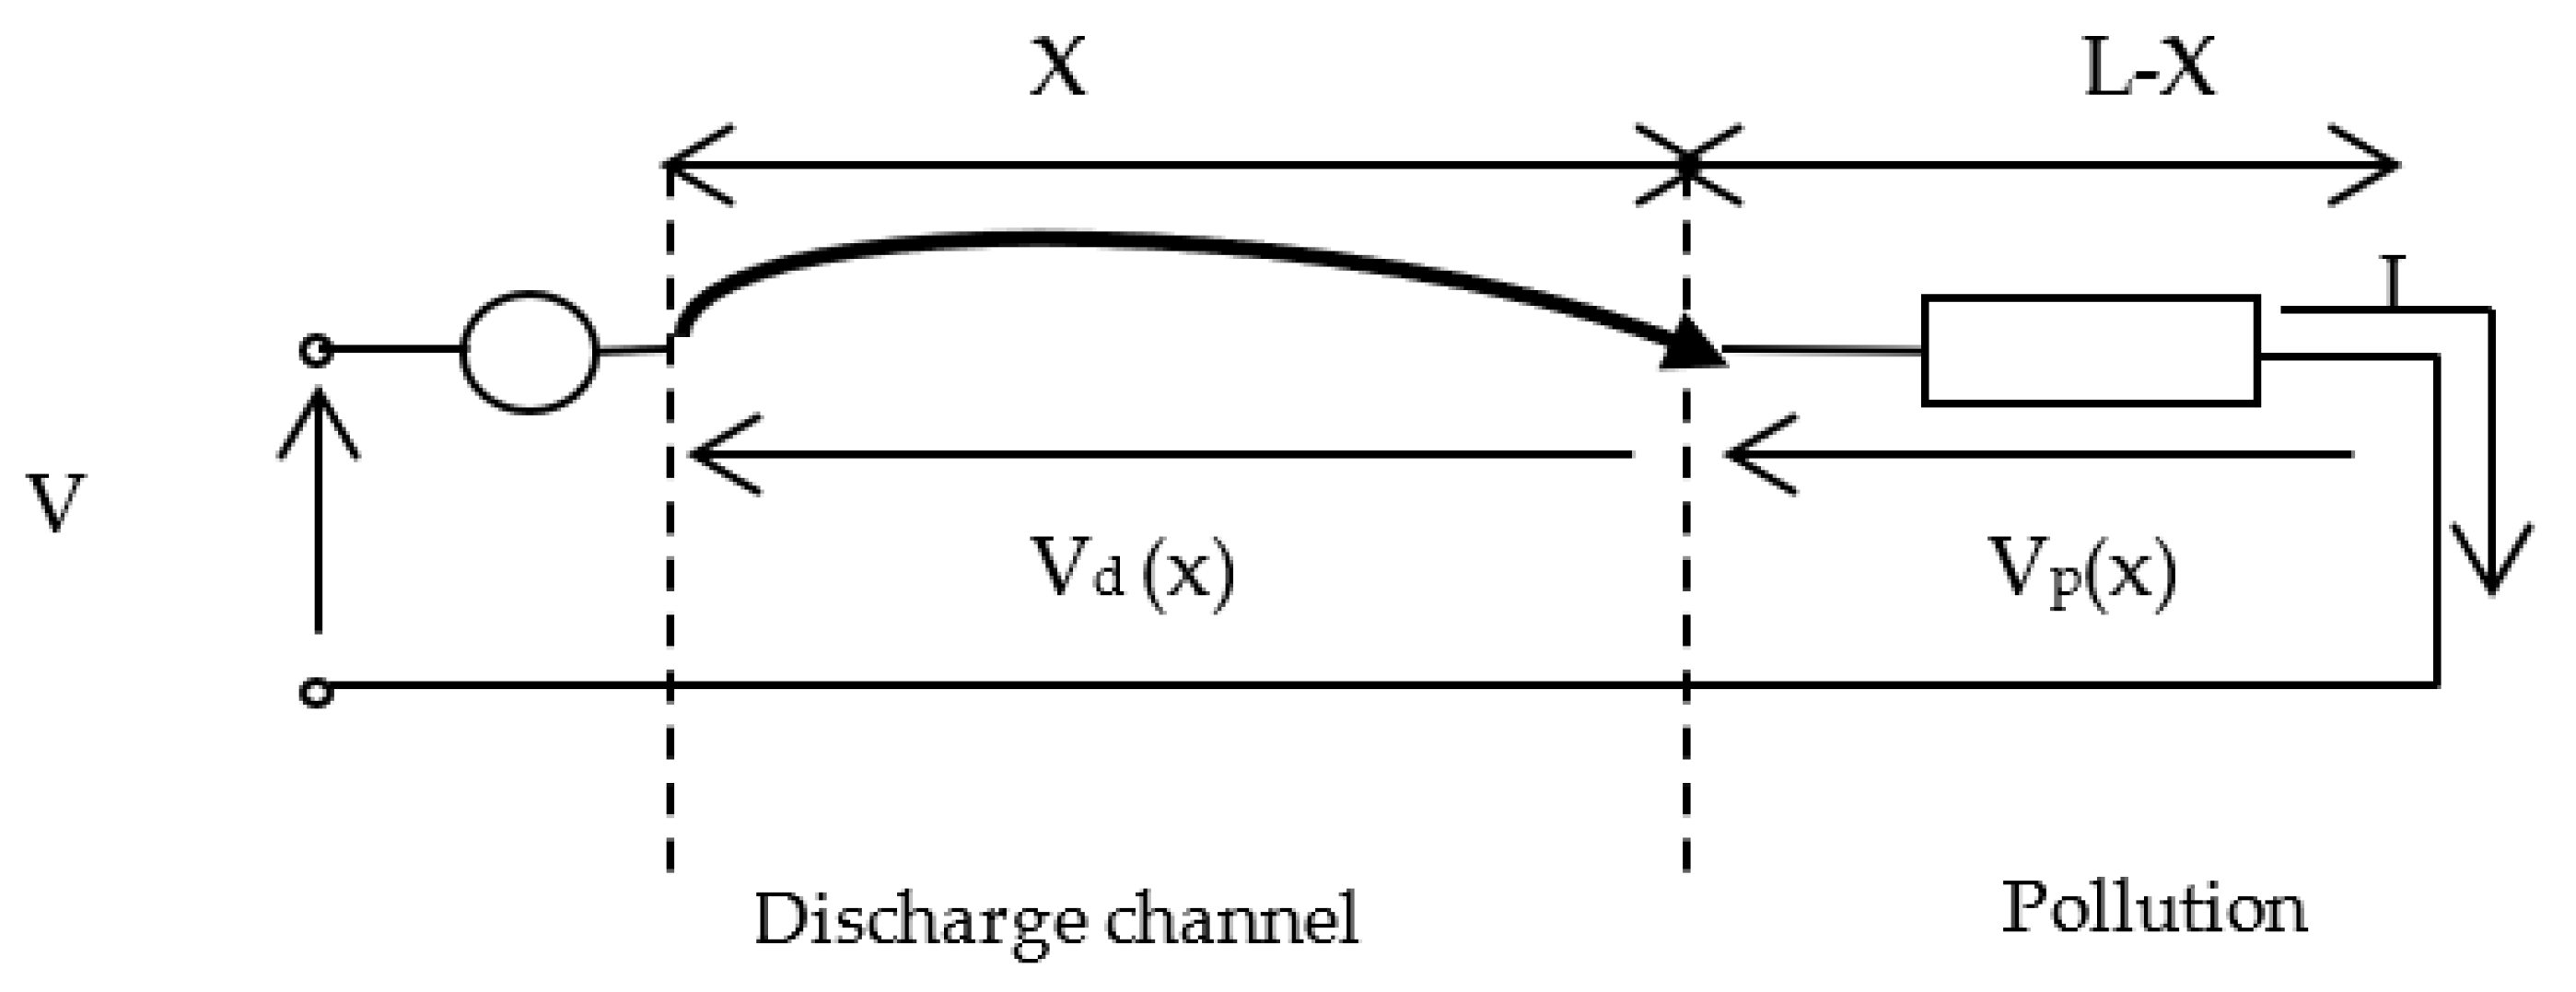
On the other hand, the flashover equation is based on the Obenaus model [23,24]. The model consists of a cylindrical discharge (partial arc) of axial length X in series with a linear resistance rp representing the pollution layer, supplied by a voltage V (Figure 1) and expressed as follows
where I is the leakage current flowing across the pollution layer, rp represents the linear resistance of the unabridged part of the pollution, and L is the total leakage length of the insulator. N and n are discharge characteristic parameters. Usually, the values of N and n are considered depending upon the experimental conditions in which the discharge burns. For example, Hampton [25] considers that the discharge burns in an environment rich in water vapor, while Wilkins [26] proposes that the discharge burns in a dry-air medium. Slama et al. [27] demonstrated that the parameters N and n are not constant and depend on the electrical equivalent circuit consisting of the polluted insulator, the discharge, and the thermal parameters of the discharge.
The critical flashover voltage is
In this study, the relationship between the variation of FOV voltage, the coefficients α and β, the parameters N and n, and the amount of NSDD was investigated. For this purpose, AC clean fog tests were carried out on artificially polluted silicone rubber (SiR) insulators. The soluble pollutant was simulated by NaCl, and different amounts of NSDD (kaolin) levels were applied. The influence of NSDD values on FOV characteristics was investigated to establish a mathematical model of the influence of both ESDD/NSDD on FOV voltage. This study aims to improve the understanding of polluted FOV insulators to enable better selection of outdoor insulation used in high-voltage systems.
2. Experimental Arrangements
2.1. Insulator Preparation
Four-shed insulators were used in this investigation, which were fabricated at the AHIVEC by using the following facilities: room-temperature vulcanized (RTV-2), two-component SiR (herein referred to as x-A/B), a fiberglass core with metallic end fittings at both ends, a 3D-printed mold, and an oven. The details of the used facilities are well described in [28,29,30]. The electrical and mechanical properties of the liquid SiR used in this study are given in Table 1, and the fabrication process is the same as that used in [28,29,30]. Table 2 gives the geometrical parameters of the insulators. Figure 2 illustrates an example of the SiR insulator fabricated and used for the purpose of this study.
2.2. Experimental Setup
The experimental setup consists of a fog chamber where the polluted insulators are suspended and wetted with fog generated. High voltage is supplied with the Hipotronics AC Dielectric test (150 kVA, 75 kV, 50 Hz, 2 A). The applied voltage is controlled manually or by using a program to follow a predetermined voltage pattern with the panel by adjusting the primary voltage (0–840 V). A digital display control panel allows reading the RMS applied voltage, and an RC divider (10,000:1) records the voltage waveform. The measurement is realized through a shunt that is connected to a data acquisition system (DAQ). The DAQ is connected to a personal computer with an IEEE interface to monitor and record the voltage and leakage current signals using a developed LabVIEW program. Postprocessing software is used for data analysis. More details about the experimental setup are given in [28,29,30,31,32].
2.3. Artificial Pollution of Insulators
The pollutant was prepared according to the IEC 60507 solid-layer method [9], consisting of a Triton X-100 wetting agent (1 g), tap water (1 L), kaolin (40 g), and an adequate concentration of sodium chloride (NaCl) to achieve the volume conductivity value needed. The volume conductivity was selected to represent different salt deposit density (ESDD) levels. In this investigation, the ESDD values are 0.12 mg/cm2, 0.38 mg/cm2 and 1.0 mg/cm2, and the nonsoluble (NSDD) values of kaolin are 0.11 mg/cm2, 0.23 mg/cm2, and 0.52 mg/cm2.
Before the test, all insulators were carefully cleaned and allowed to dry naturally indoors to avoid any pollution or dust. Then, before application of the pollutant, the insulator was preconditioned with brushed dry kaolin according to the recommendations of Cigré WG C4.303 [33] and left for at least 1 h. This step is used to reduce the hydrophobicity of the silicone rubber. The insulator was then polluted by spraying the pollutant on the insulator surface, ensuring application to all parts of the insulator surface, and then the insulator was left to dry for 24 h. Next, the insulator was mounted in the fog chamber. The polluted insulator was wetted with a fog flow rate of 3 L/h, which is sufficient to achieve maximum conductance of the pollution layer within 10–40 min from the instant the fog is applied depending on the used ESDD [31].
2.4. Flashover Ramp Test Method
The used test technique, a high-voltage ramp, is the same as that proposed in previous work [28,29] with a predetermined voltage ramp of 6.5 kV/min. This rate allows exciting the FOV event within a 5 to 10 min time gap. Fog generation is applied at the same time as the applied voltage and kept running until the end of the test. When FOV occurs, the protection interrupts the voltage supply. The tested insulator is then left to cool naturally for 5 min, and then a new ramp test is started until the required number of FOVs is realized (5 tests). During the test, video and infrared cameras are used to monitor the flashover event and discharge activity on the insulator surface.
3. Experimental Results, Analysis, and Discussion
3.1. Flashover Test Results
Figure 2 illustrates the variation of VFOV vs. ESDD for a different NSDD. According to this figure, for the same ESDD, VFOV decreases with the increase in NSDD. The relationship between VFOV and ESDD was fitted to determine the values of the coefficients α and β for each NSDD. Table 3 illustrates the values of α and β and shows that these coefficients vary with the amount of NSDD: α decreases while β increases.
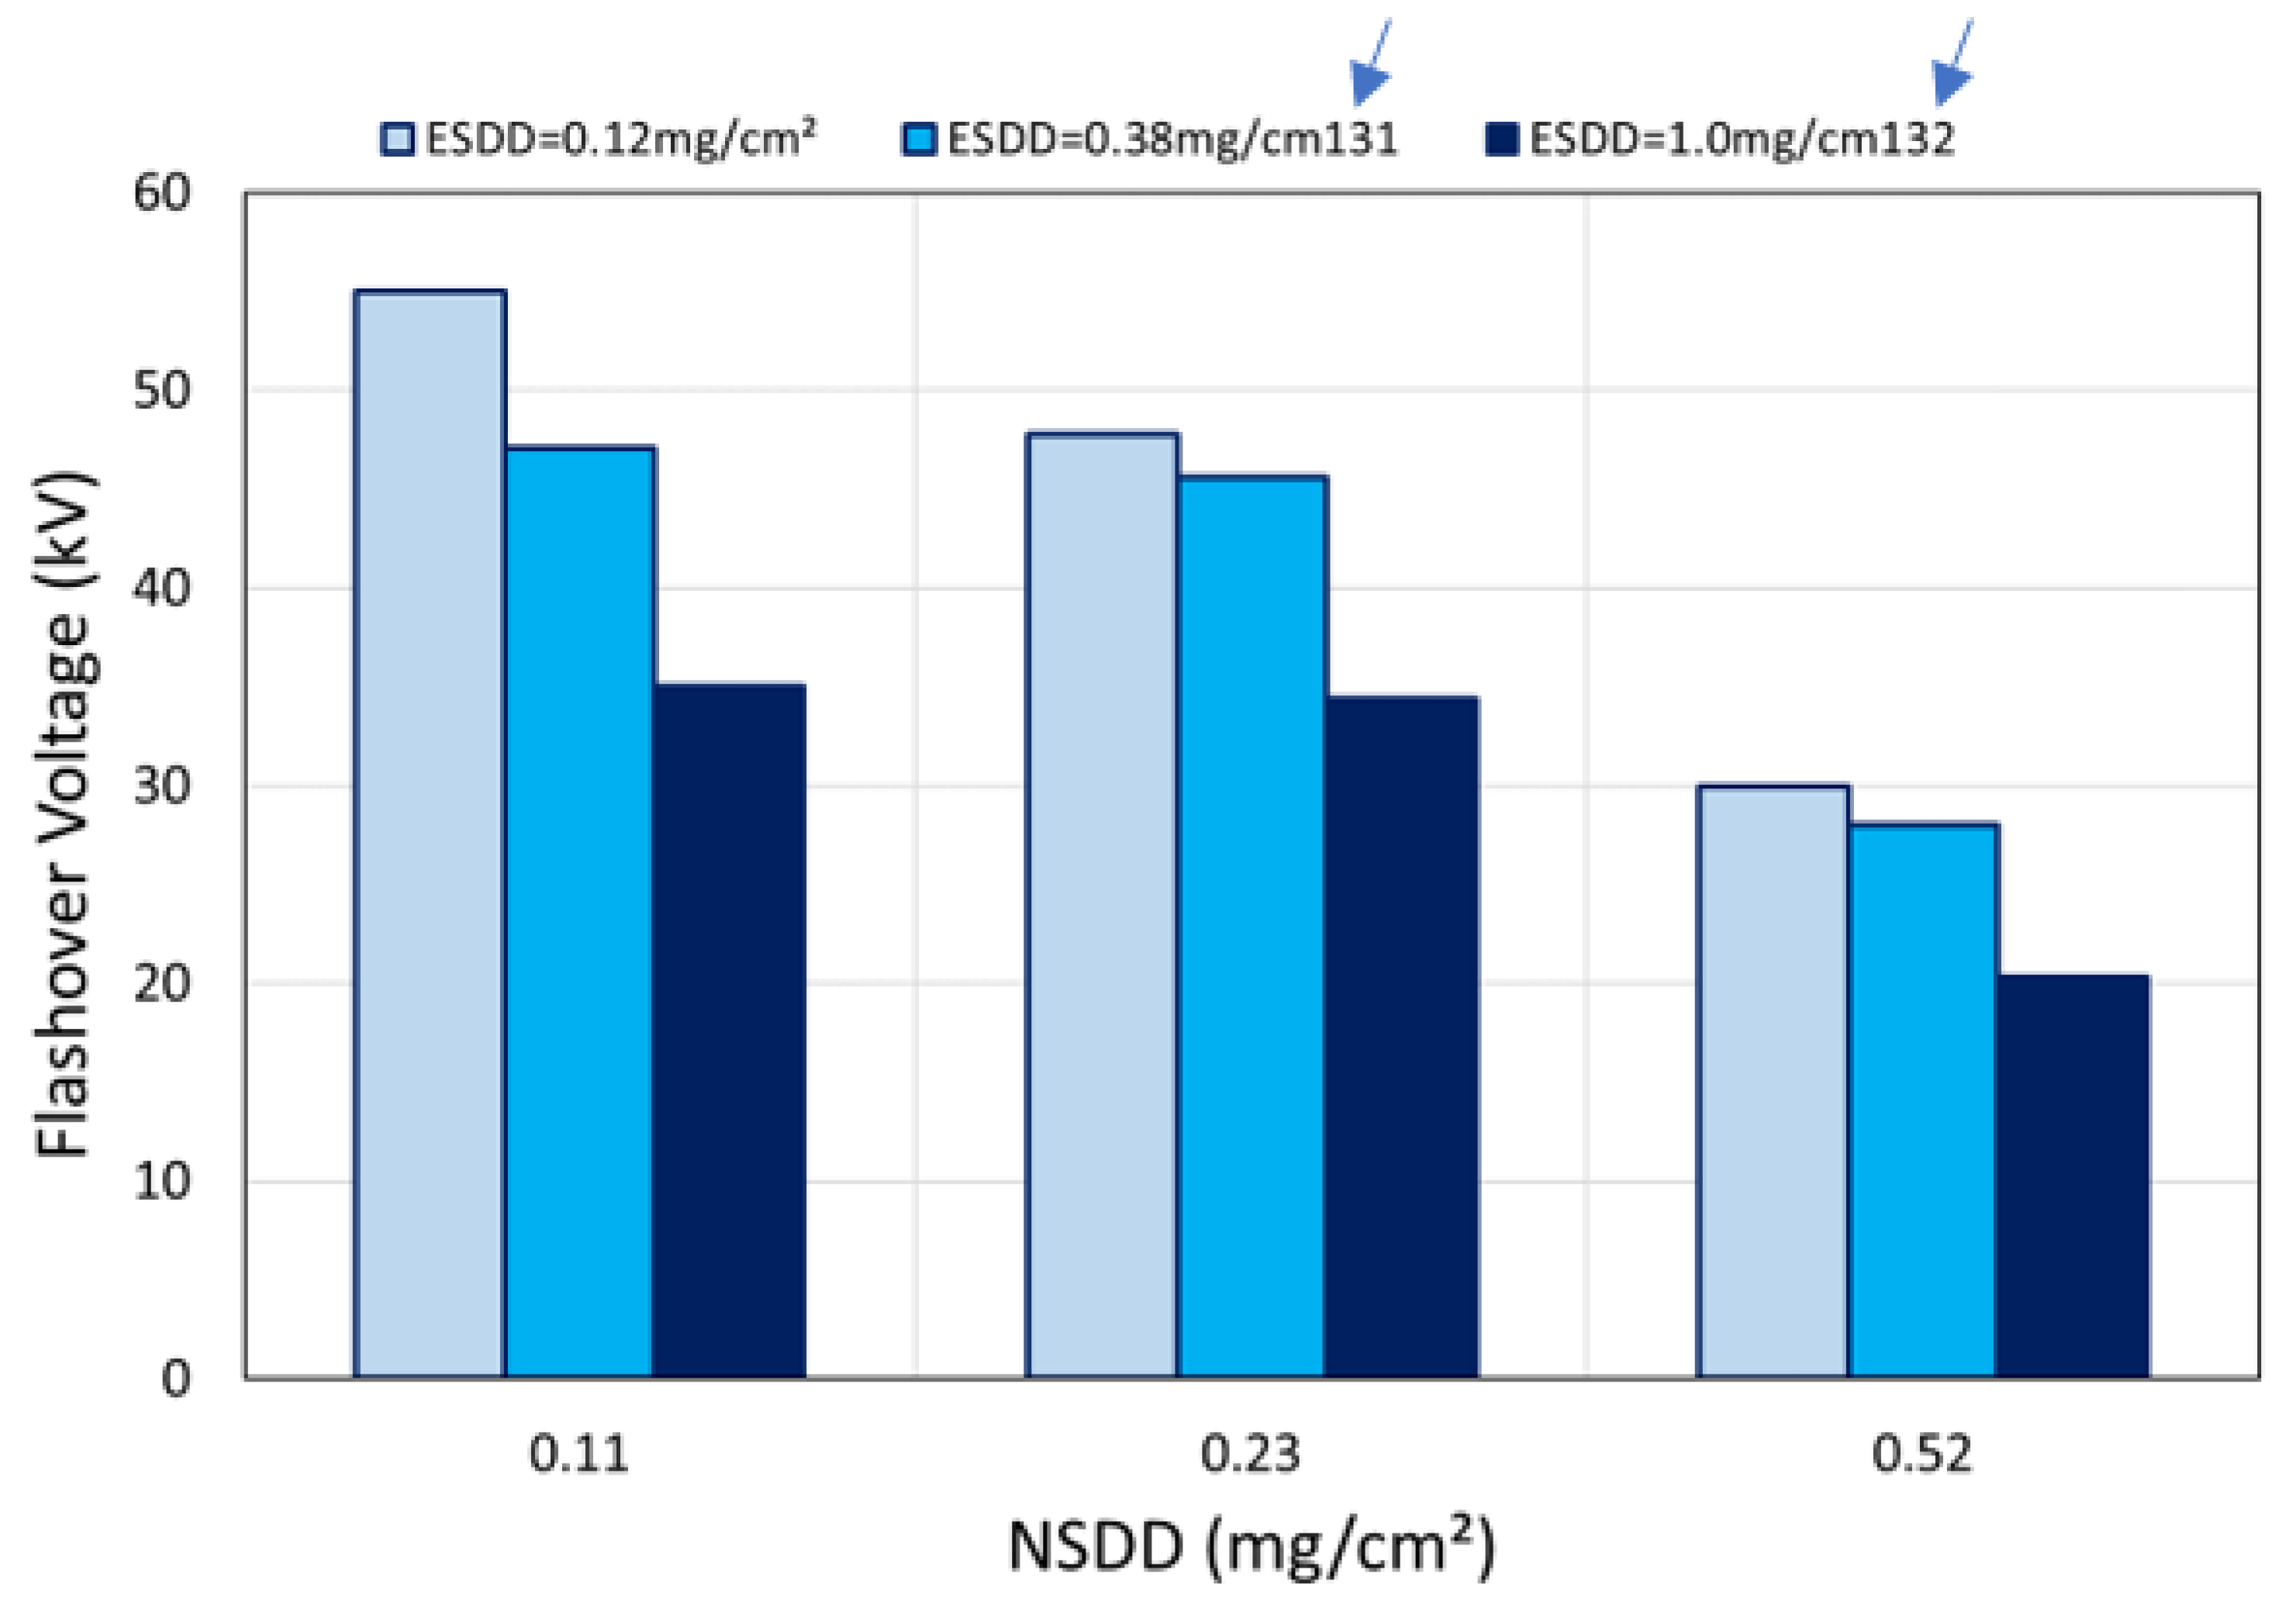
In Figure 3, VFOV is plotted as a function of NSDD for a different ESDD. According to this figure, NSDD drastically impacts VFOV where the VFOV ratio corresponding to the minimum and maximum NSDD (0.11 mg/cm2 and 0.52 mg/cm2) for each ESDD level is, respectively, 1.83 and 1.7.
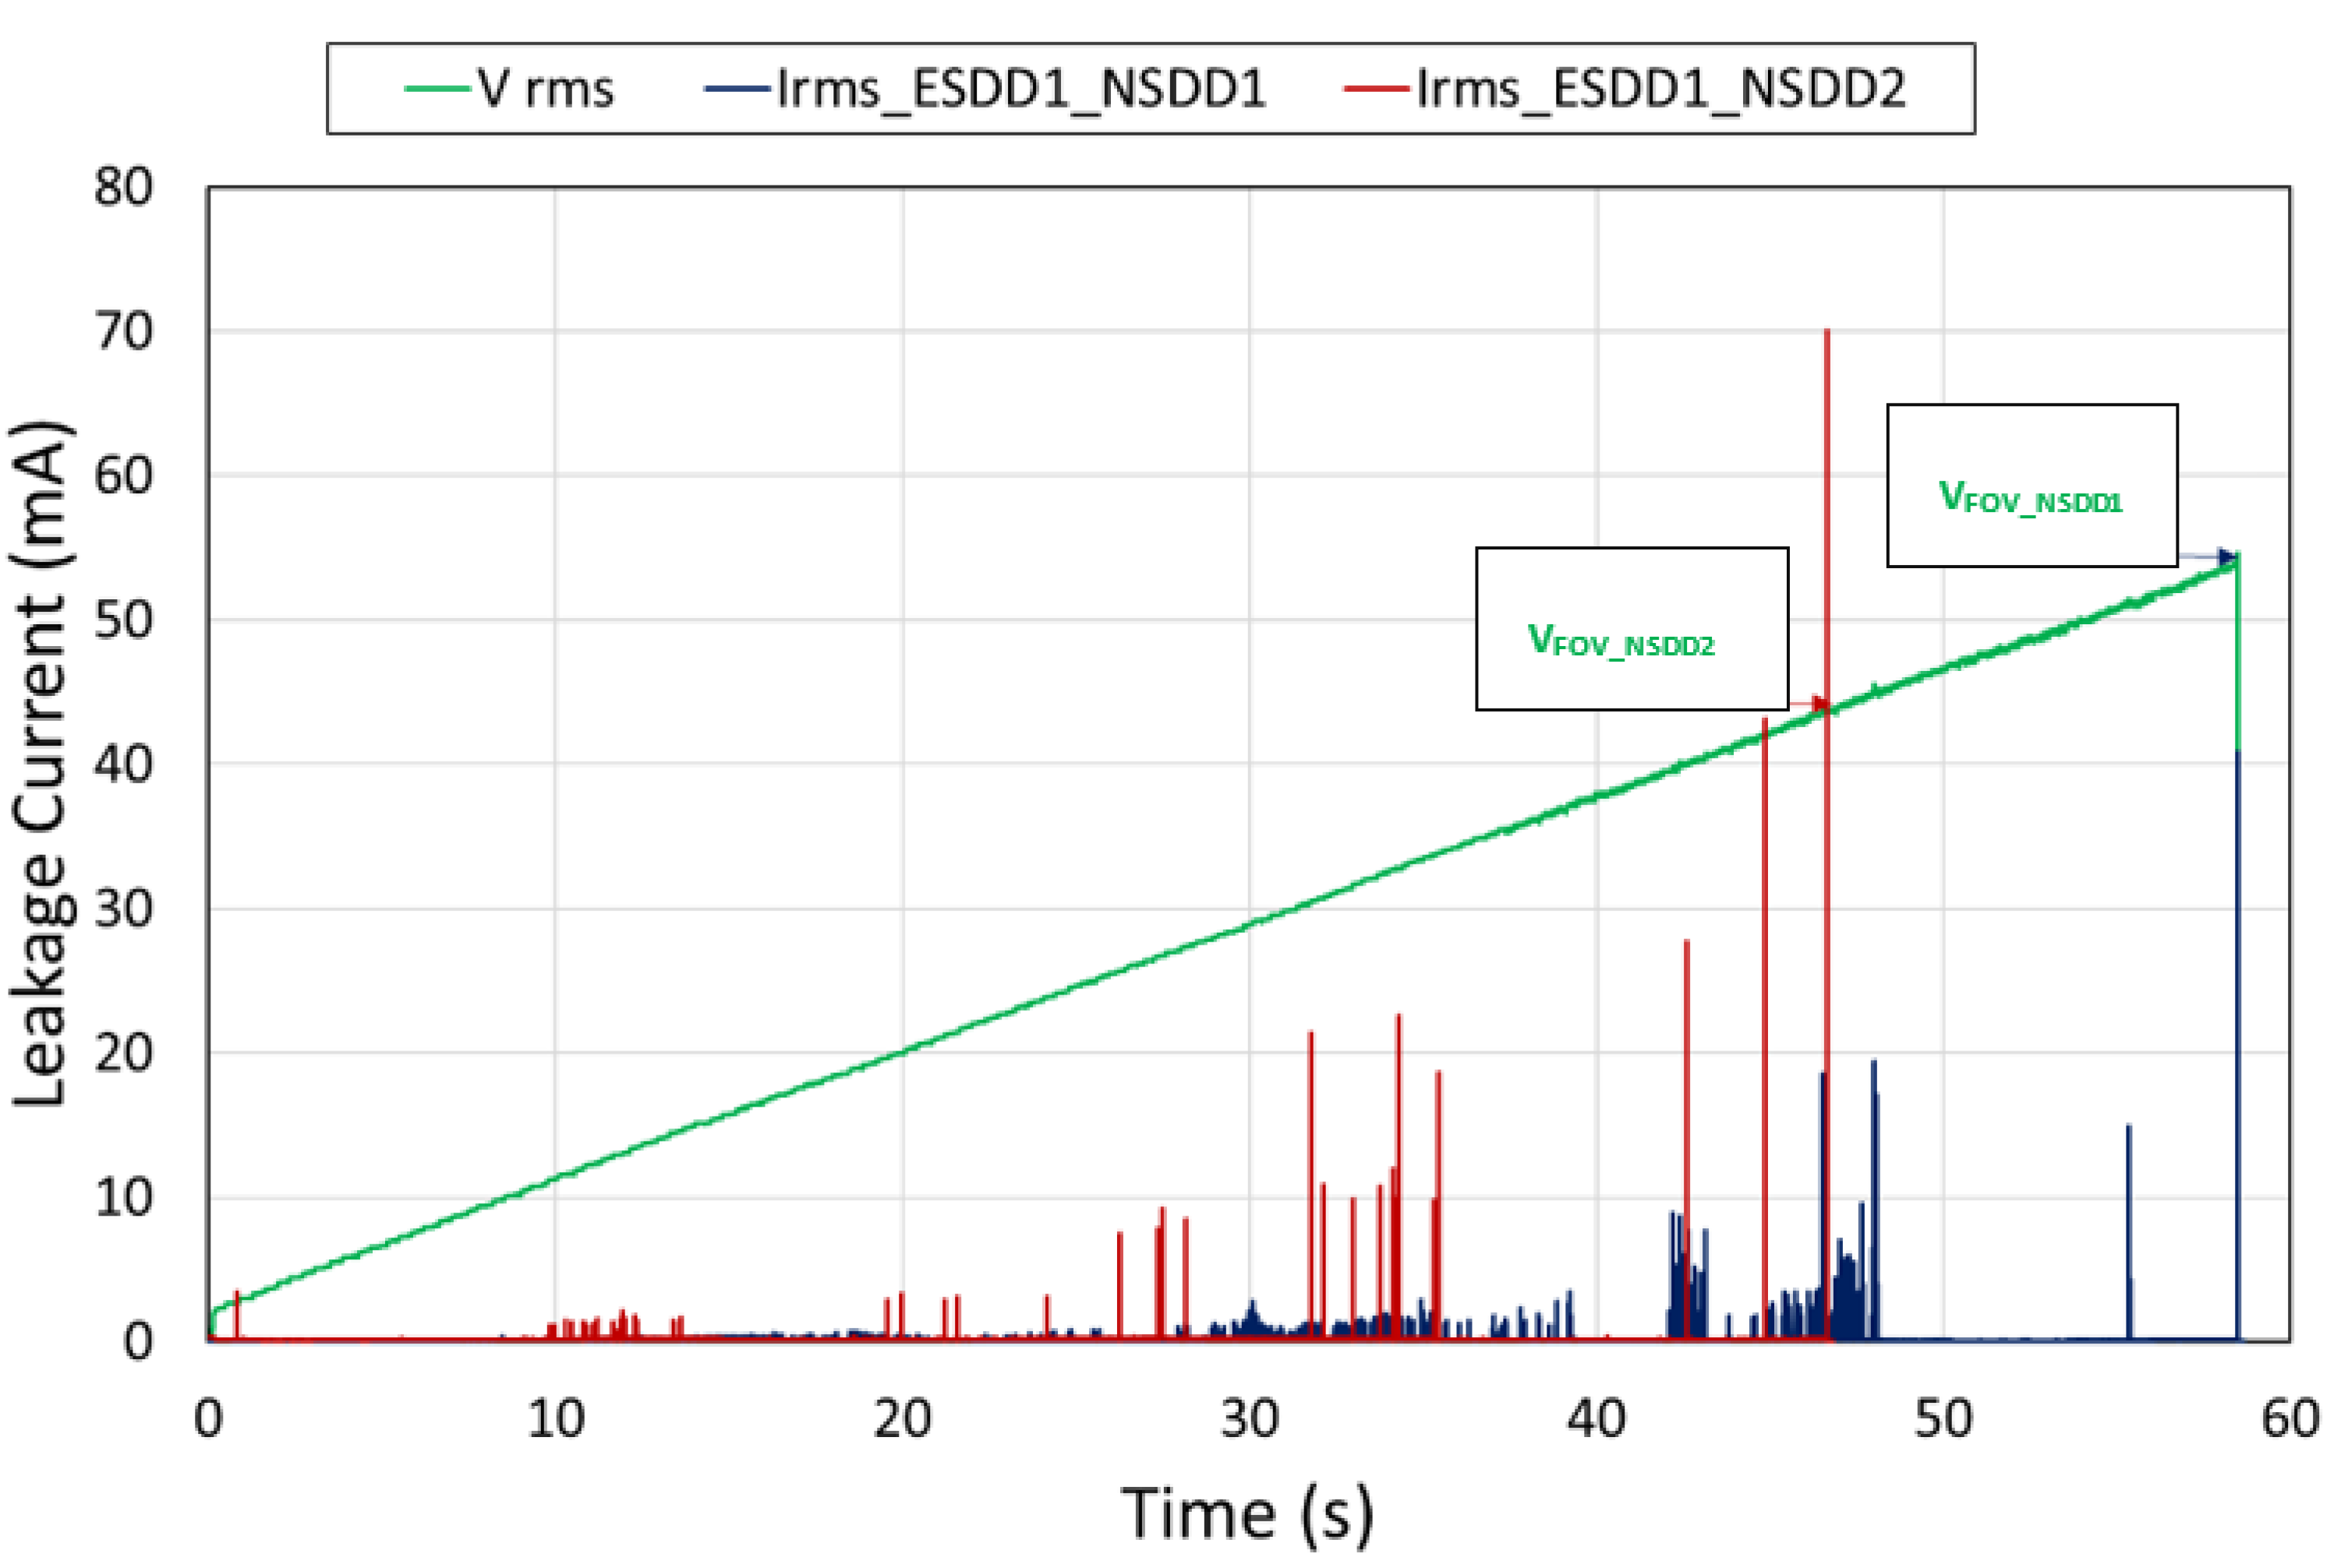
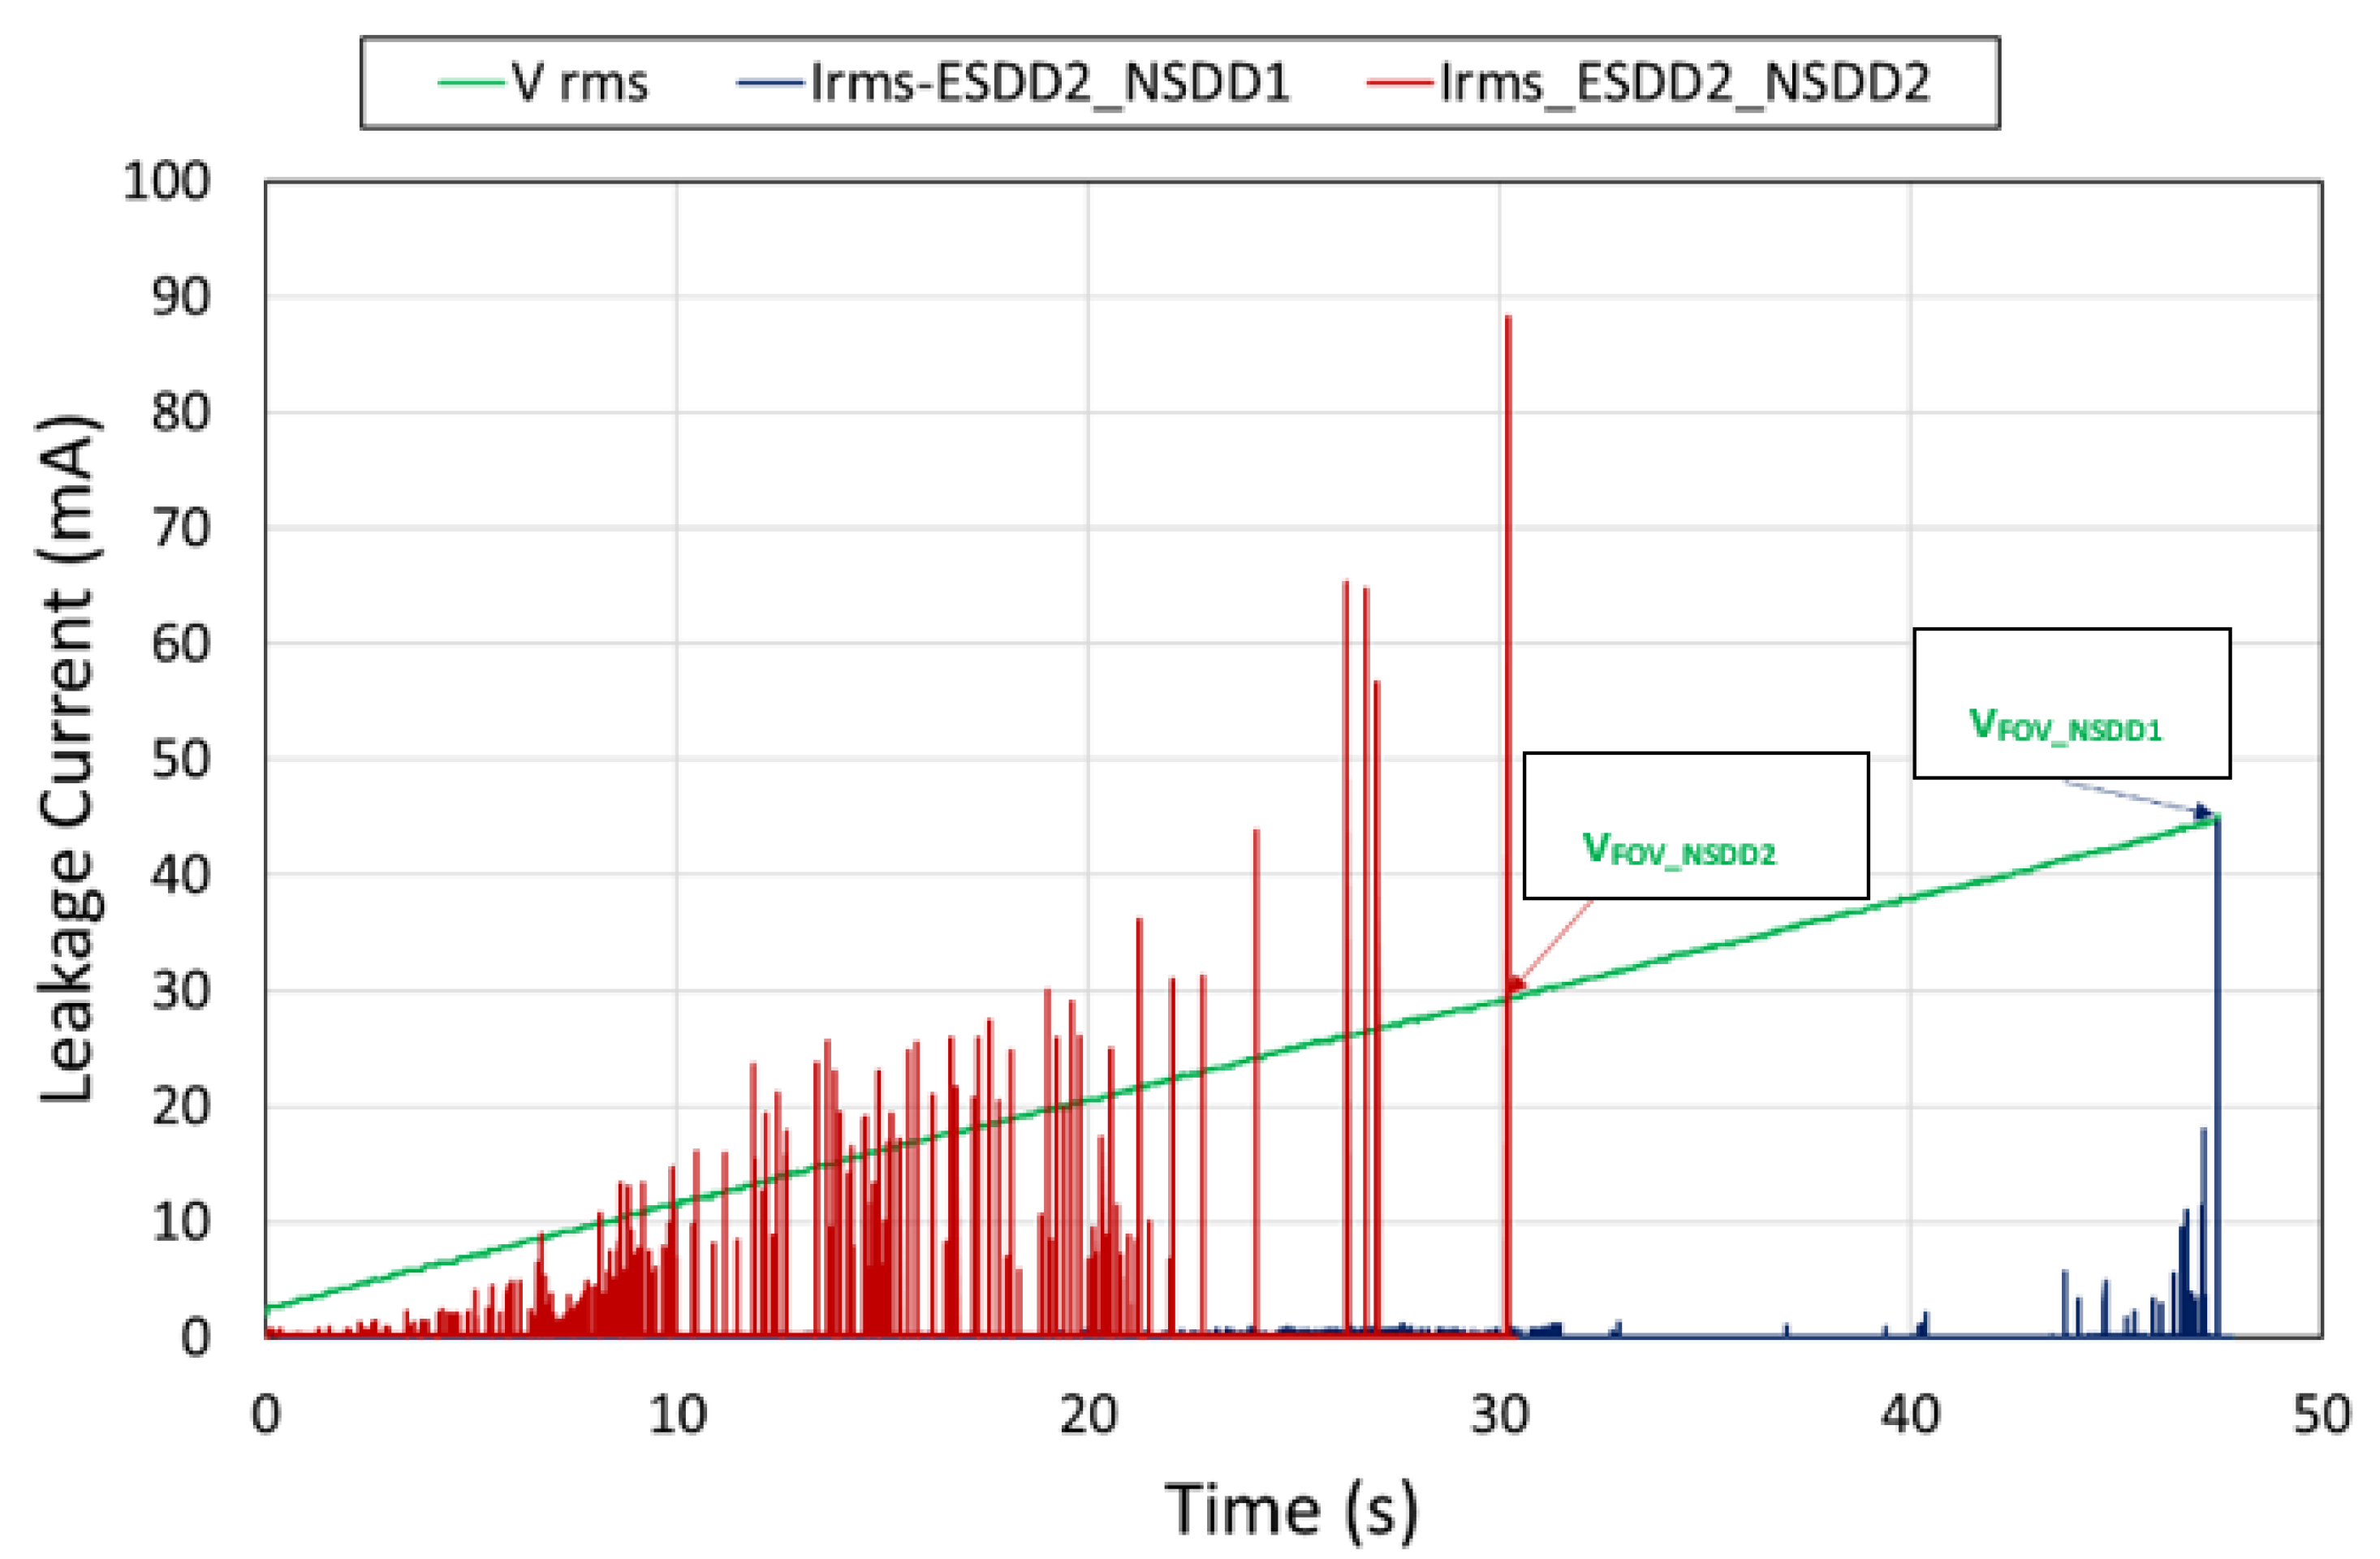
Figure 4 and Figure 5 illustrate examples of the instantaneous leakage current and voltage during the FOV test for two pollution levels (ESDD1 = 0.12 mg/cm2 and ESDD2 = 0.23 mg/cm2) and two NSDD levels (NSDD1 = 0.11 mg/cm2 and NSDD2 = 0.52 mg/cm2). The current and VFOV related to NSDD1 are lower than those corresponding to NSDD2, whatever the ESDD. This can be explained by the fact that the greater the amount of insoluble materials, the greater the moisture absorption, and the greater the pollution conductive layer.
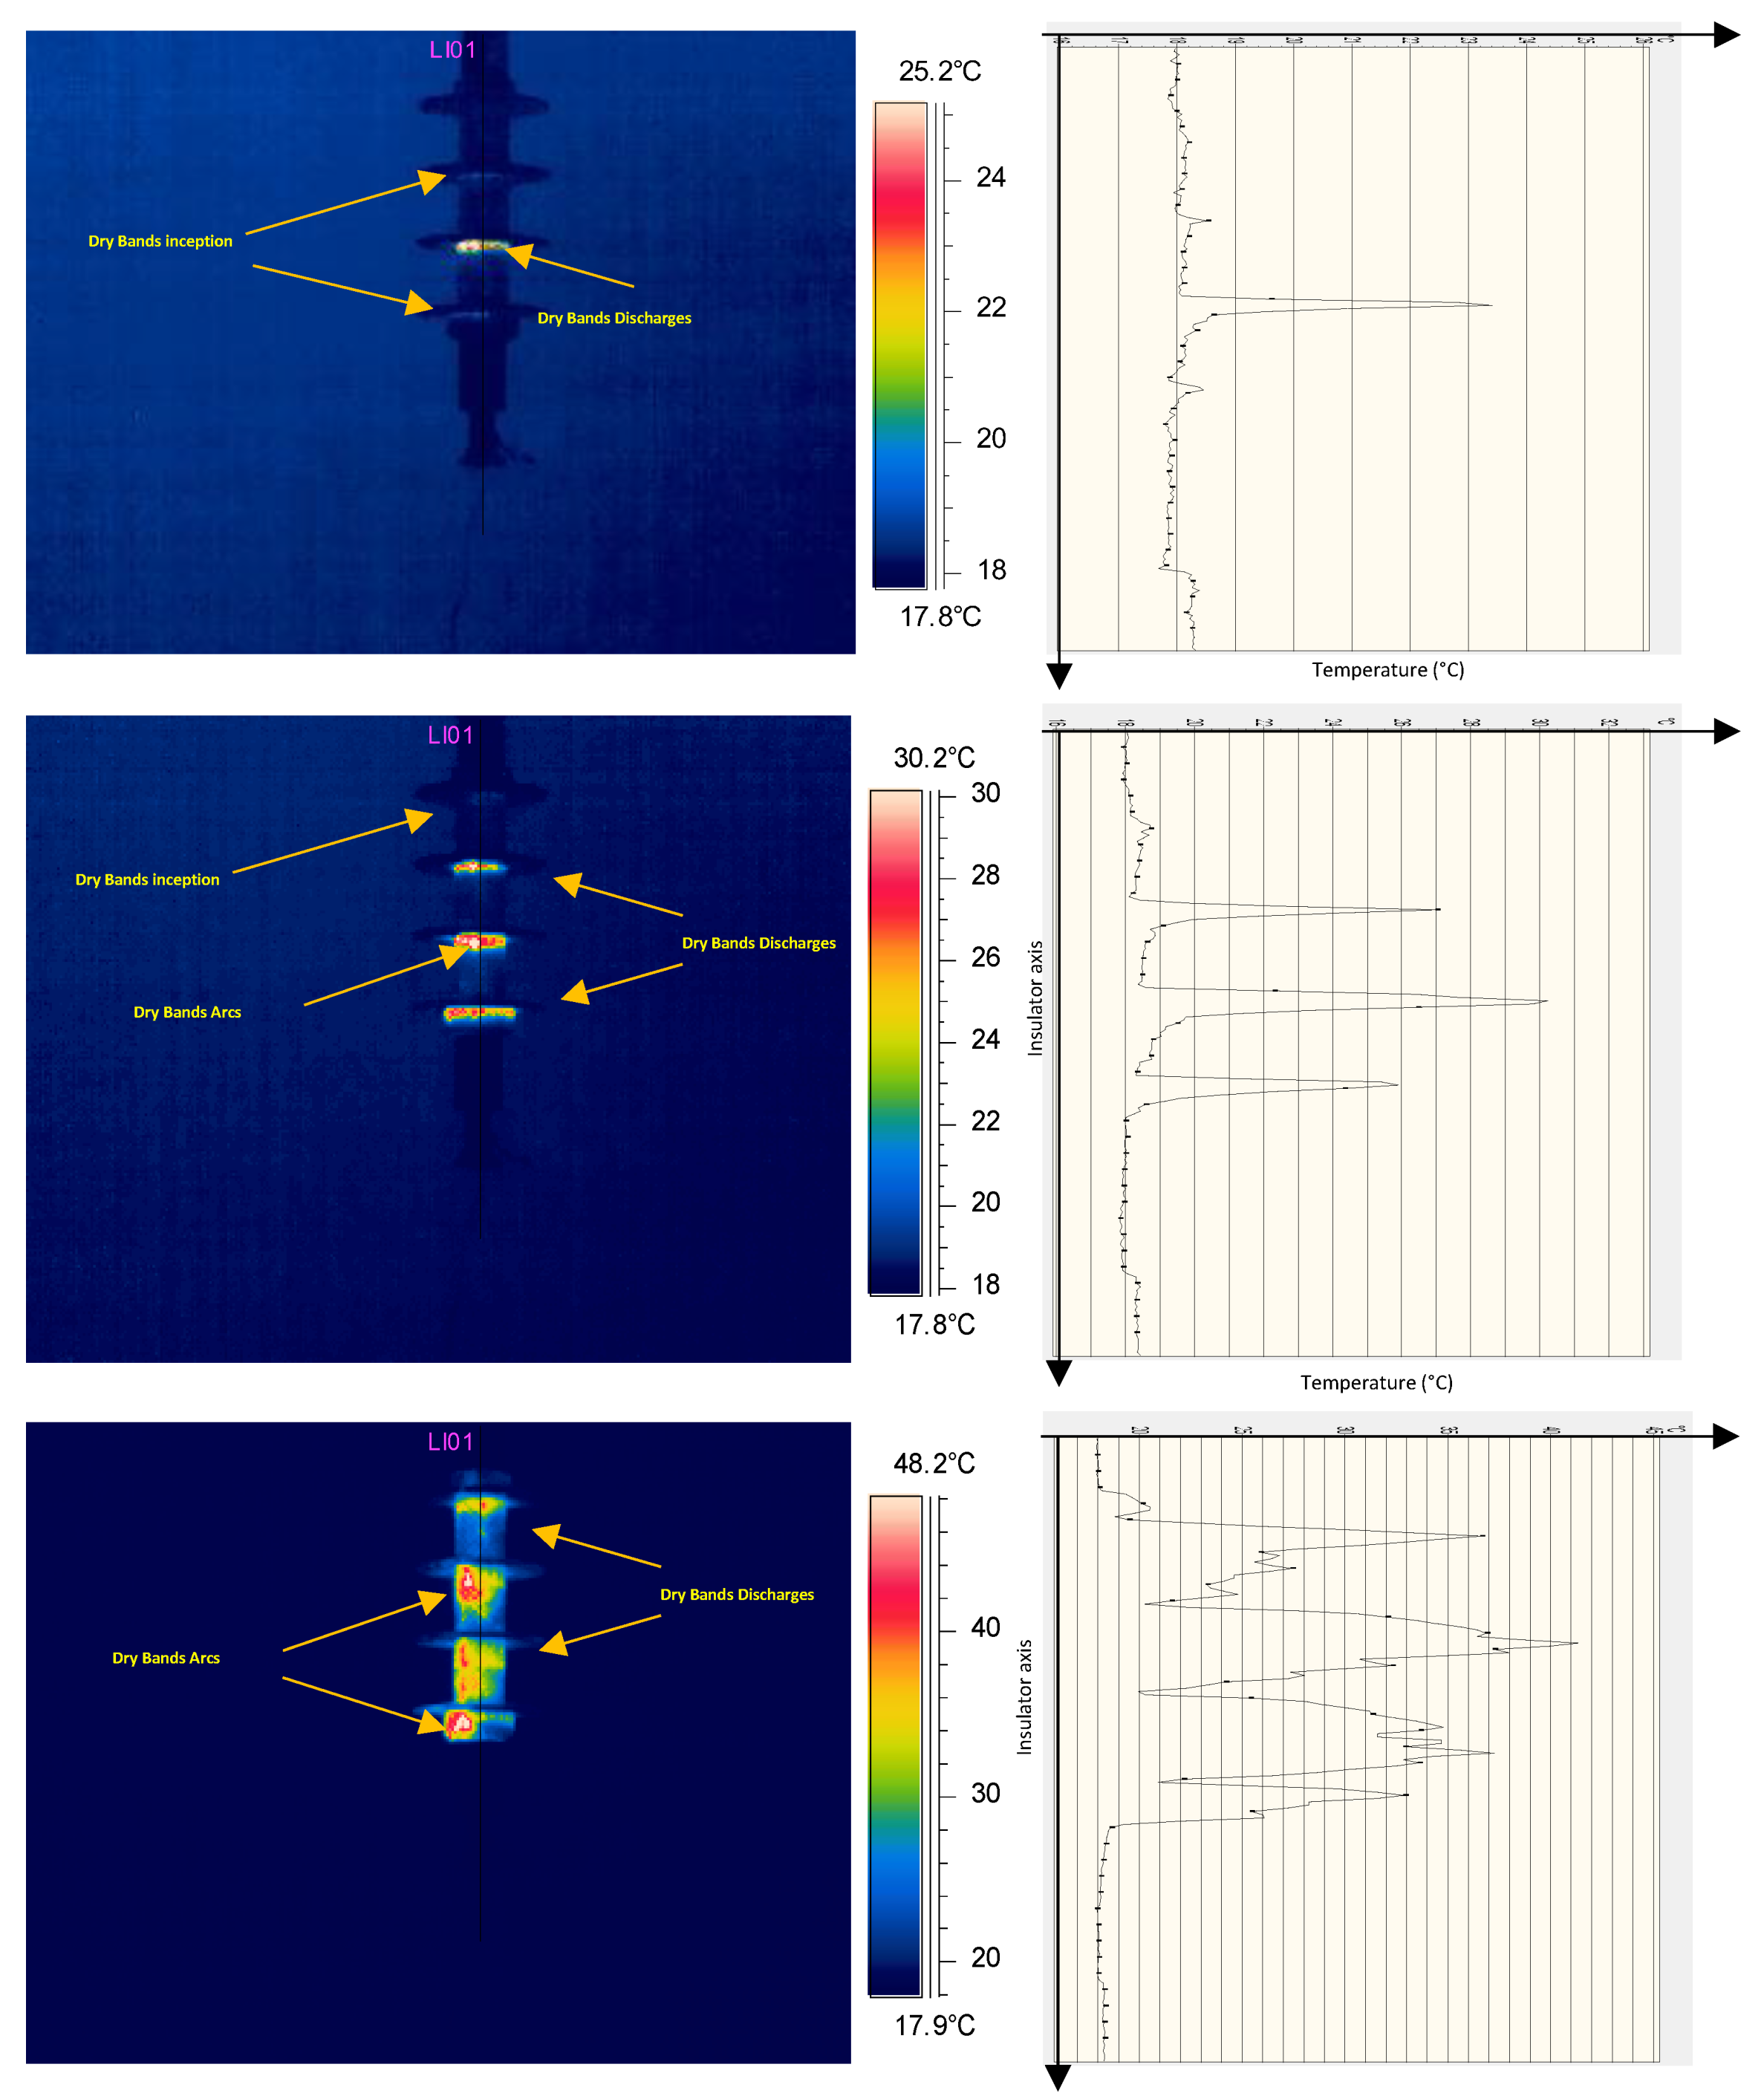
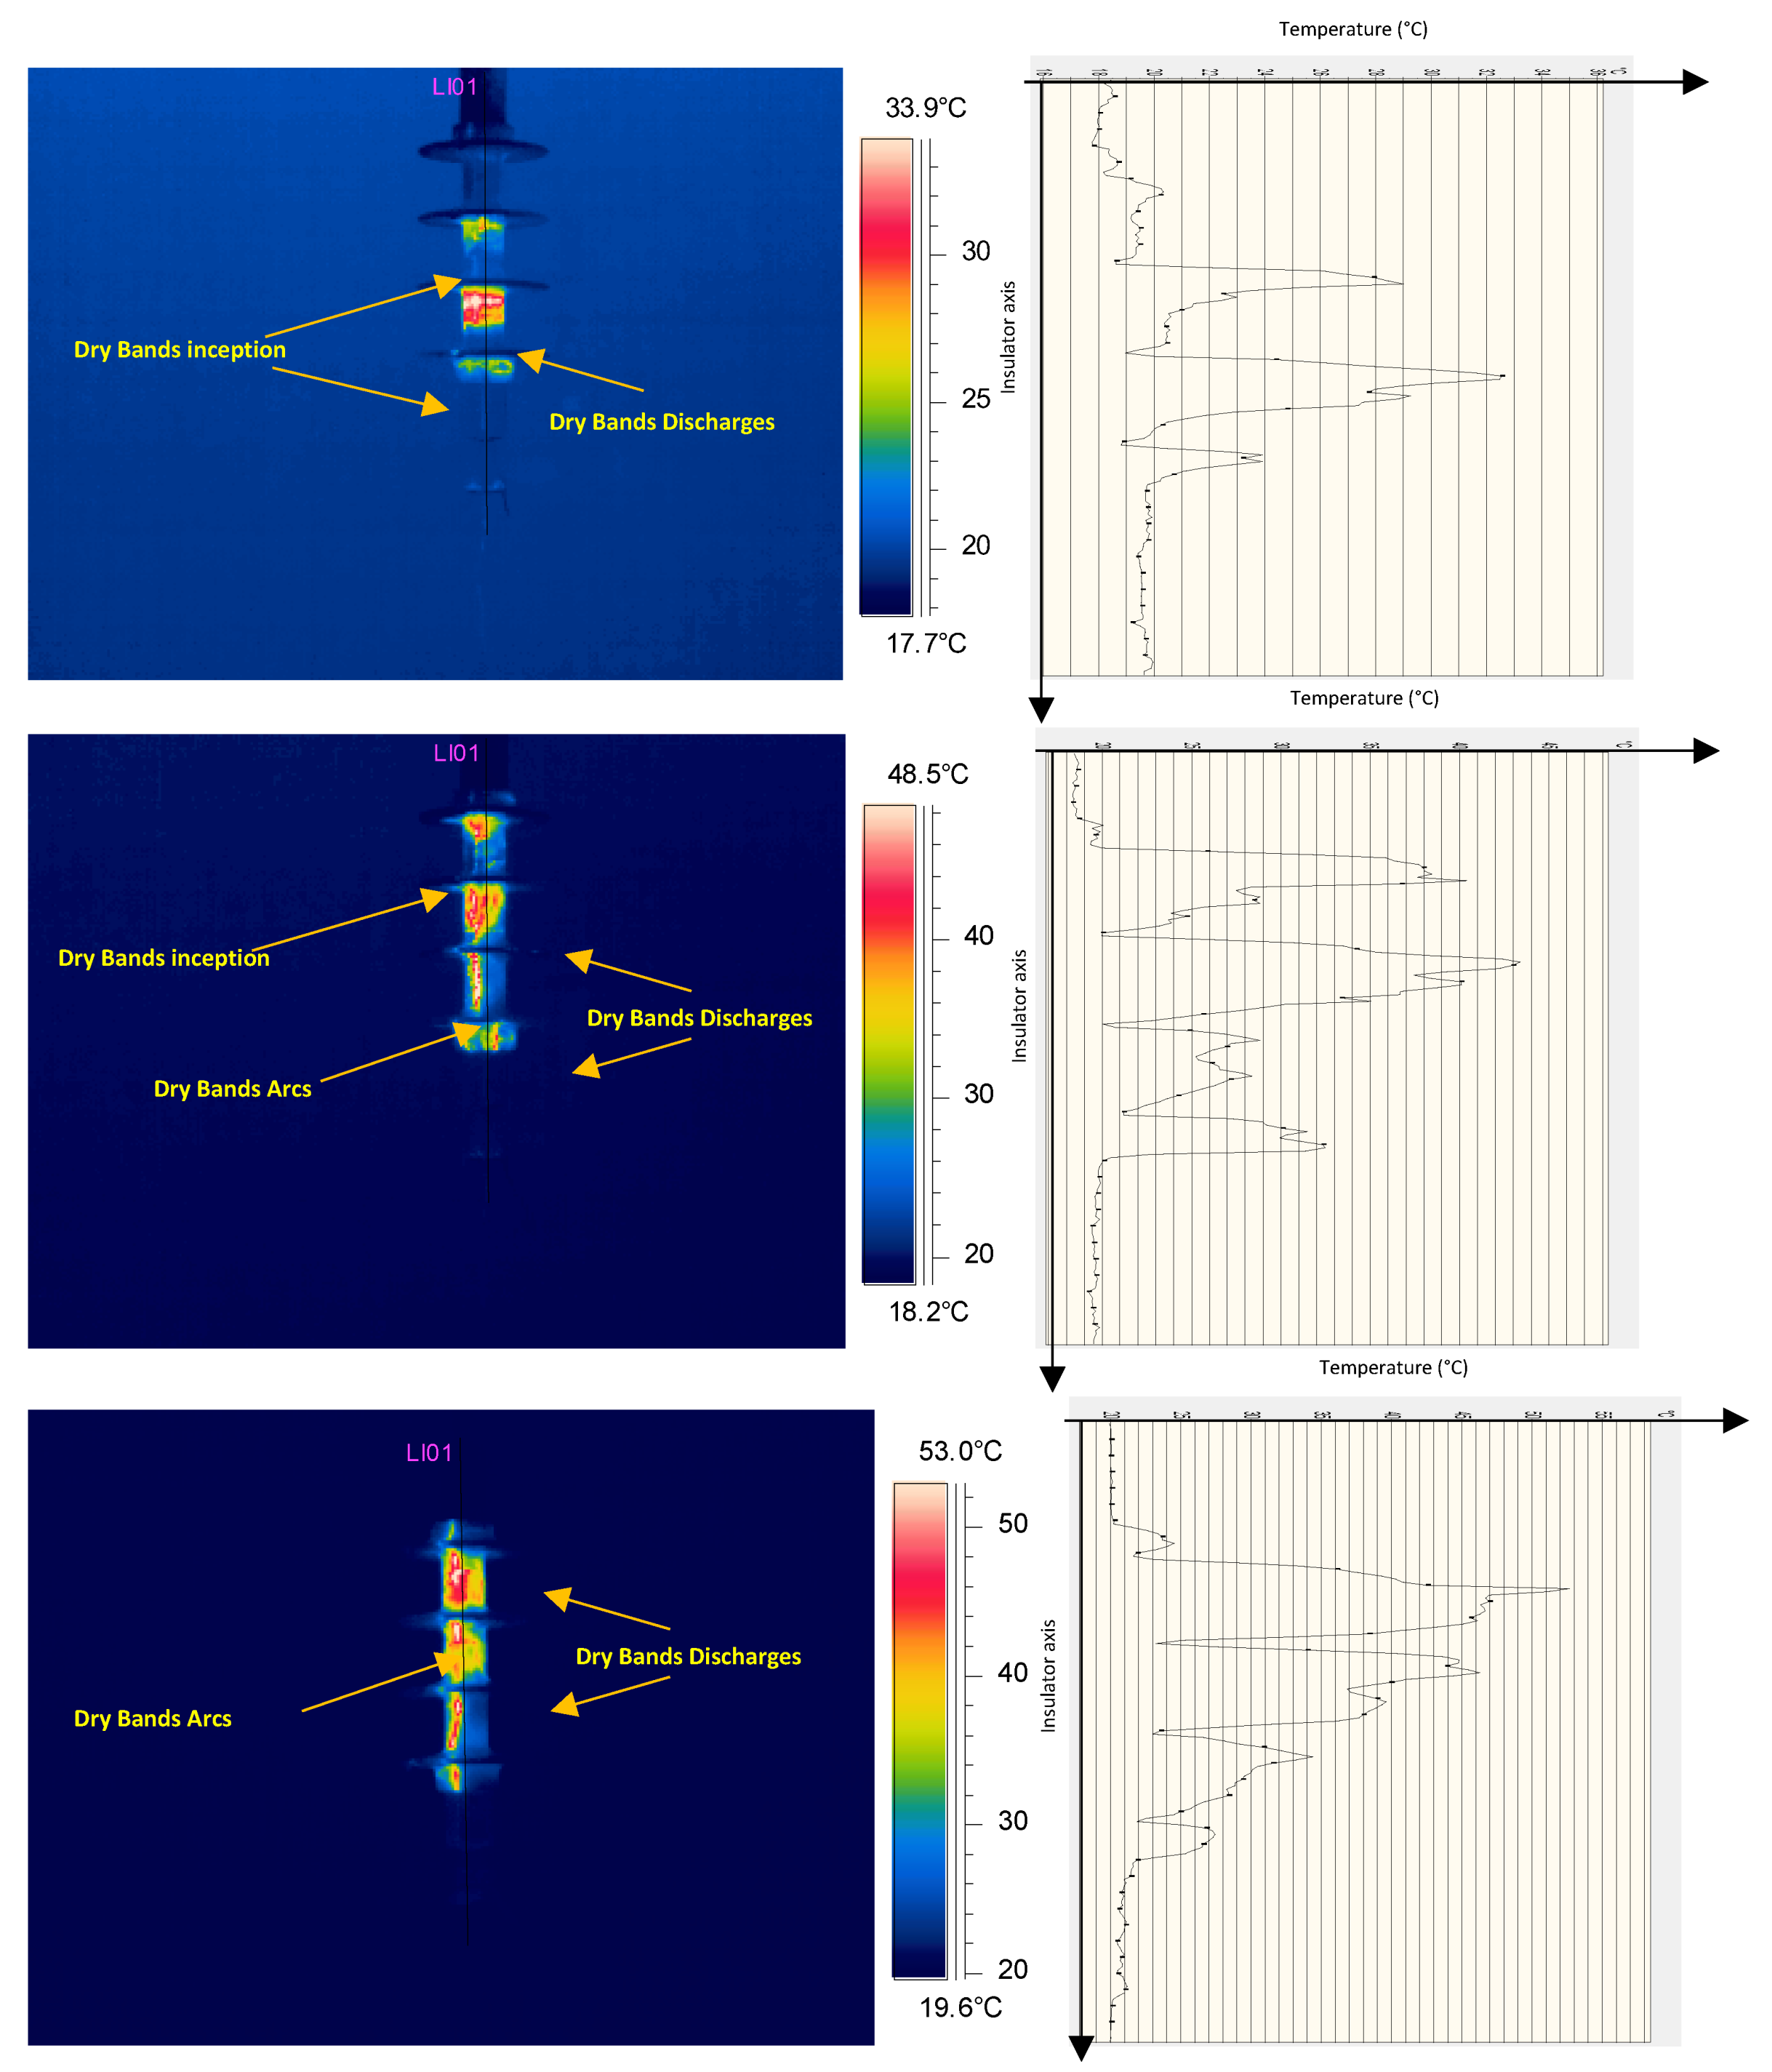
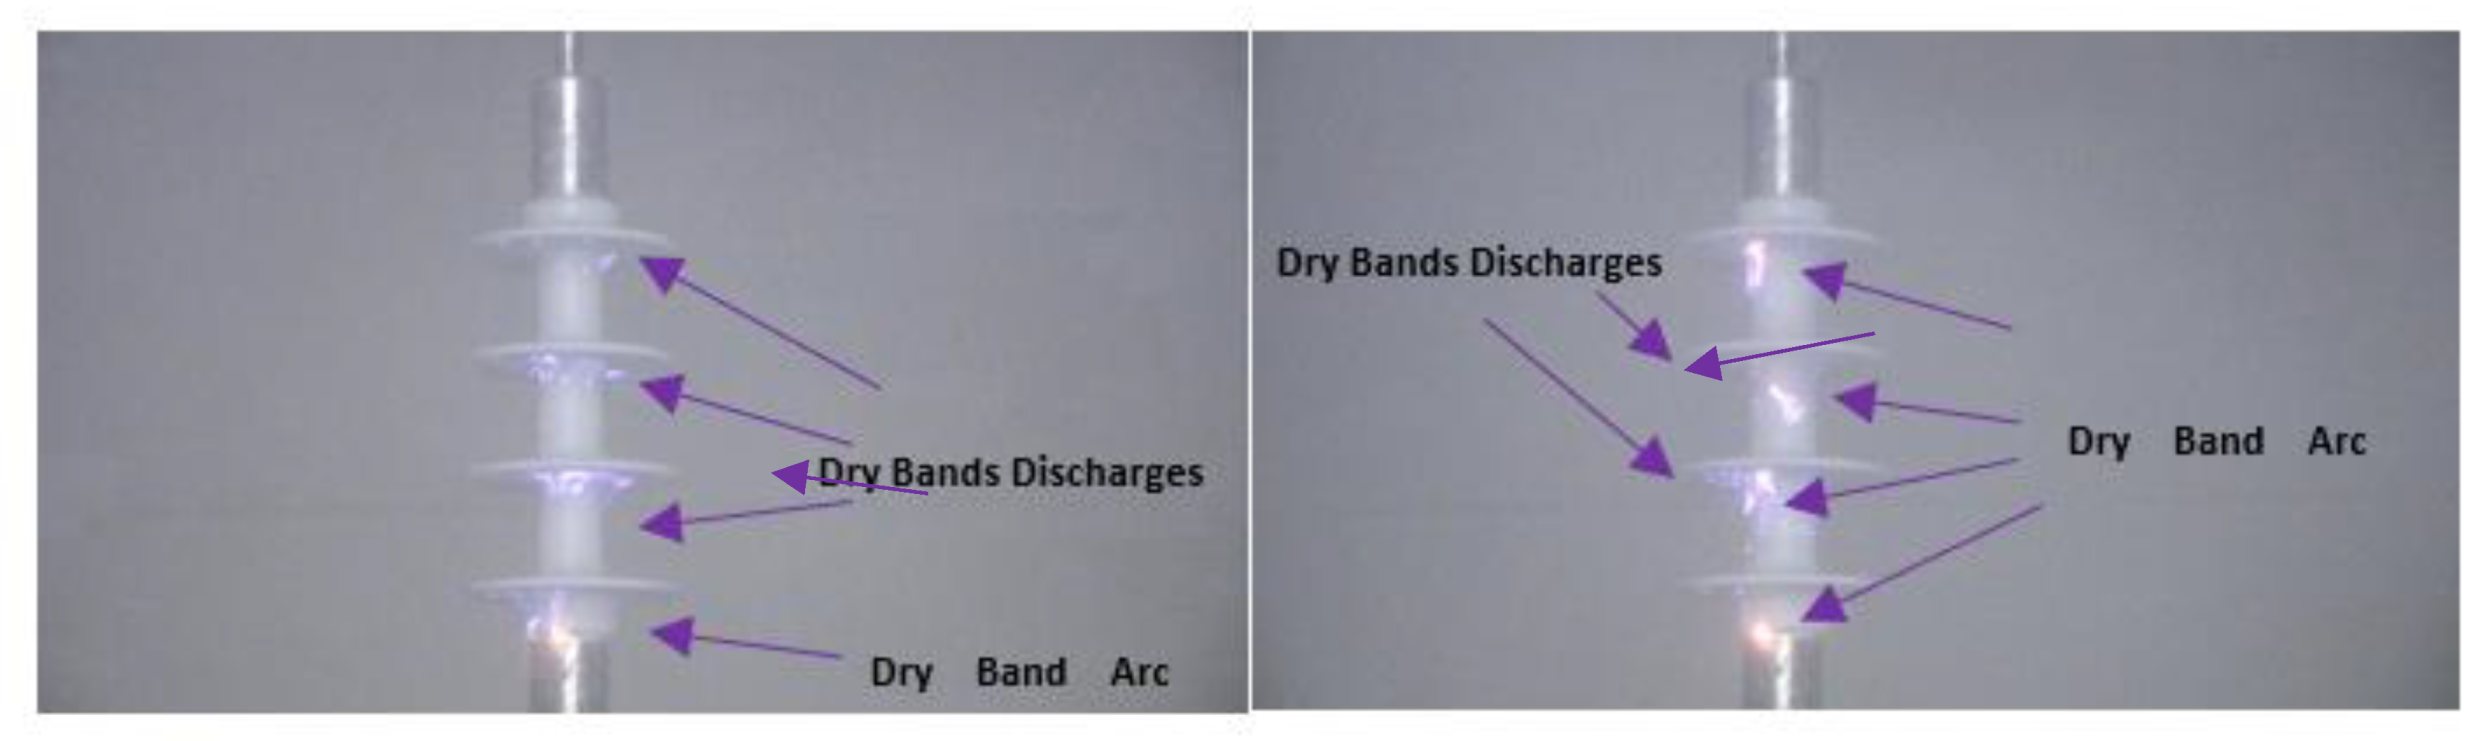
Figure 6 and Figure 7 illustrate the infrared and thermal recording during the FOV tests related to Figure 4. The first observation is that the dry bands (DBs) appear at the region between the shed and the trunk. Next, dry-band discharges (DbDs) and dry-band arcs (DBAs) developed and elongated along the trunk and the sheds. The inception of DBs is not the same, and the ESDD is kept constant. In Figure 6, the DBs are incepted at the trunk region and are followed, after a certain time, by DbDs and DBAs. In Figure 7, DbDs and DBAs appear quickly just after the inception of DBs at the trunk. This is clearly observed in Figure 8 and Figure 9, which show the visual DbD and DBA activity at the polluted insulator with ESDD1, NSDD1, and NSDD2.
Based on these observations, one can deduce that NSDD considerably affects the resistance of the pollution layer and can be considered a key parameter for the calculation of FOV voltage.
3.2. Effect of NSDD on the Leakage Resistance and Surface Resistivity
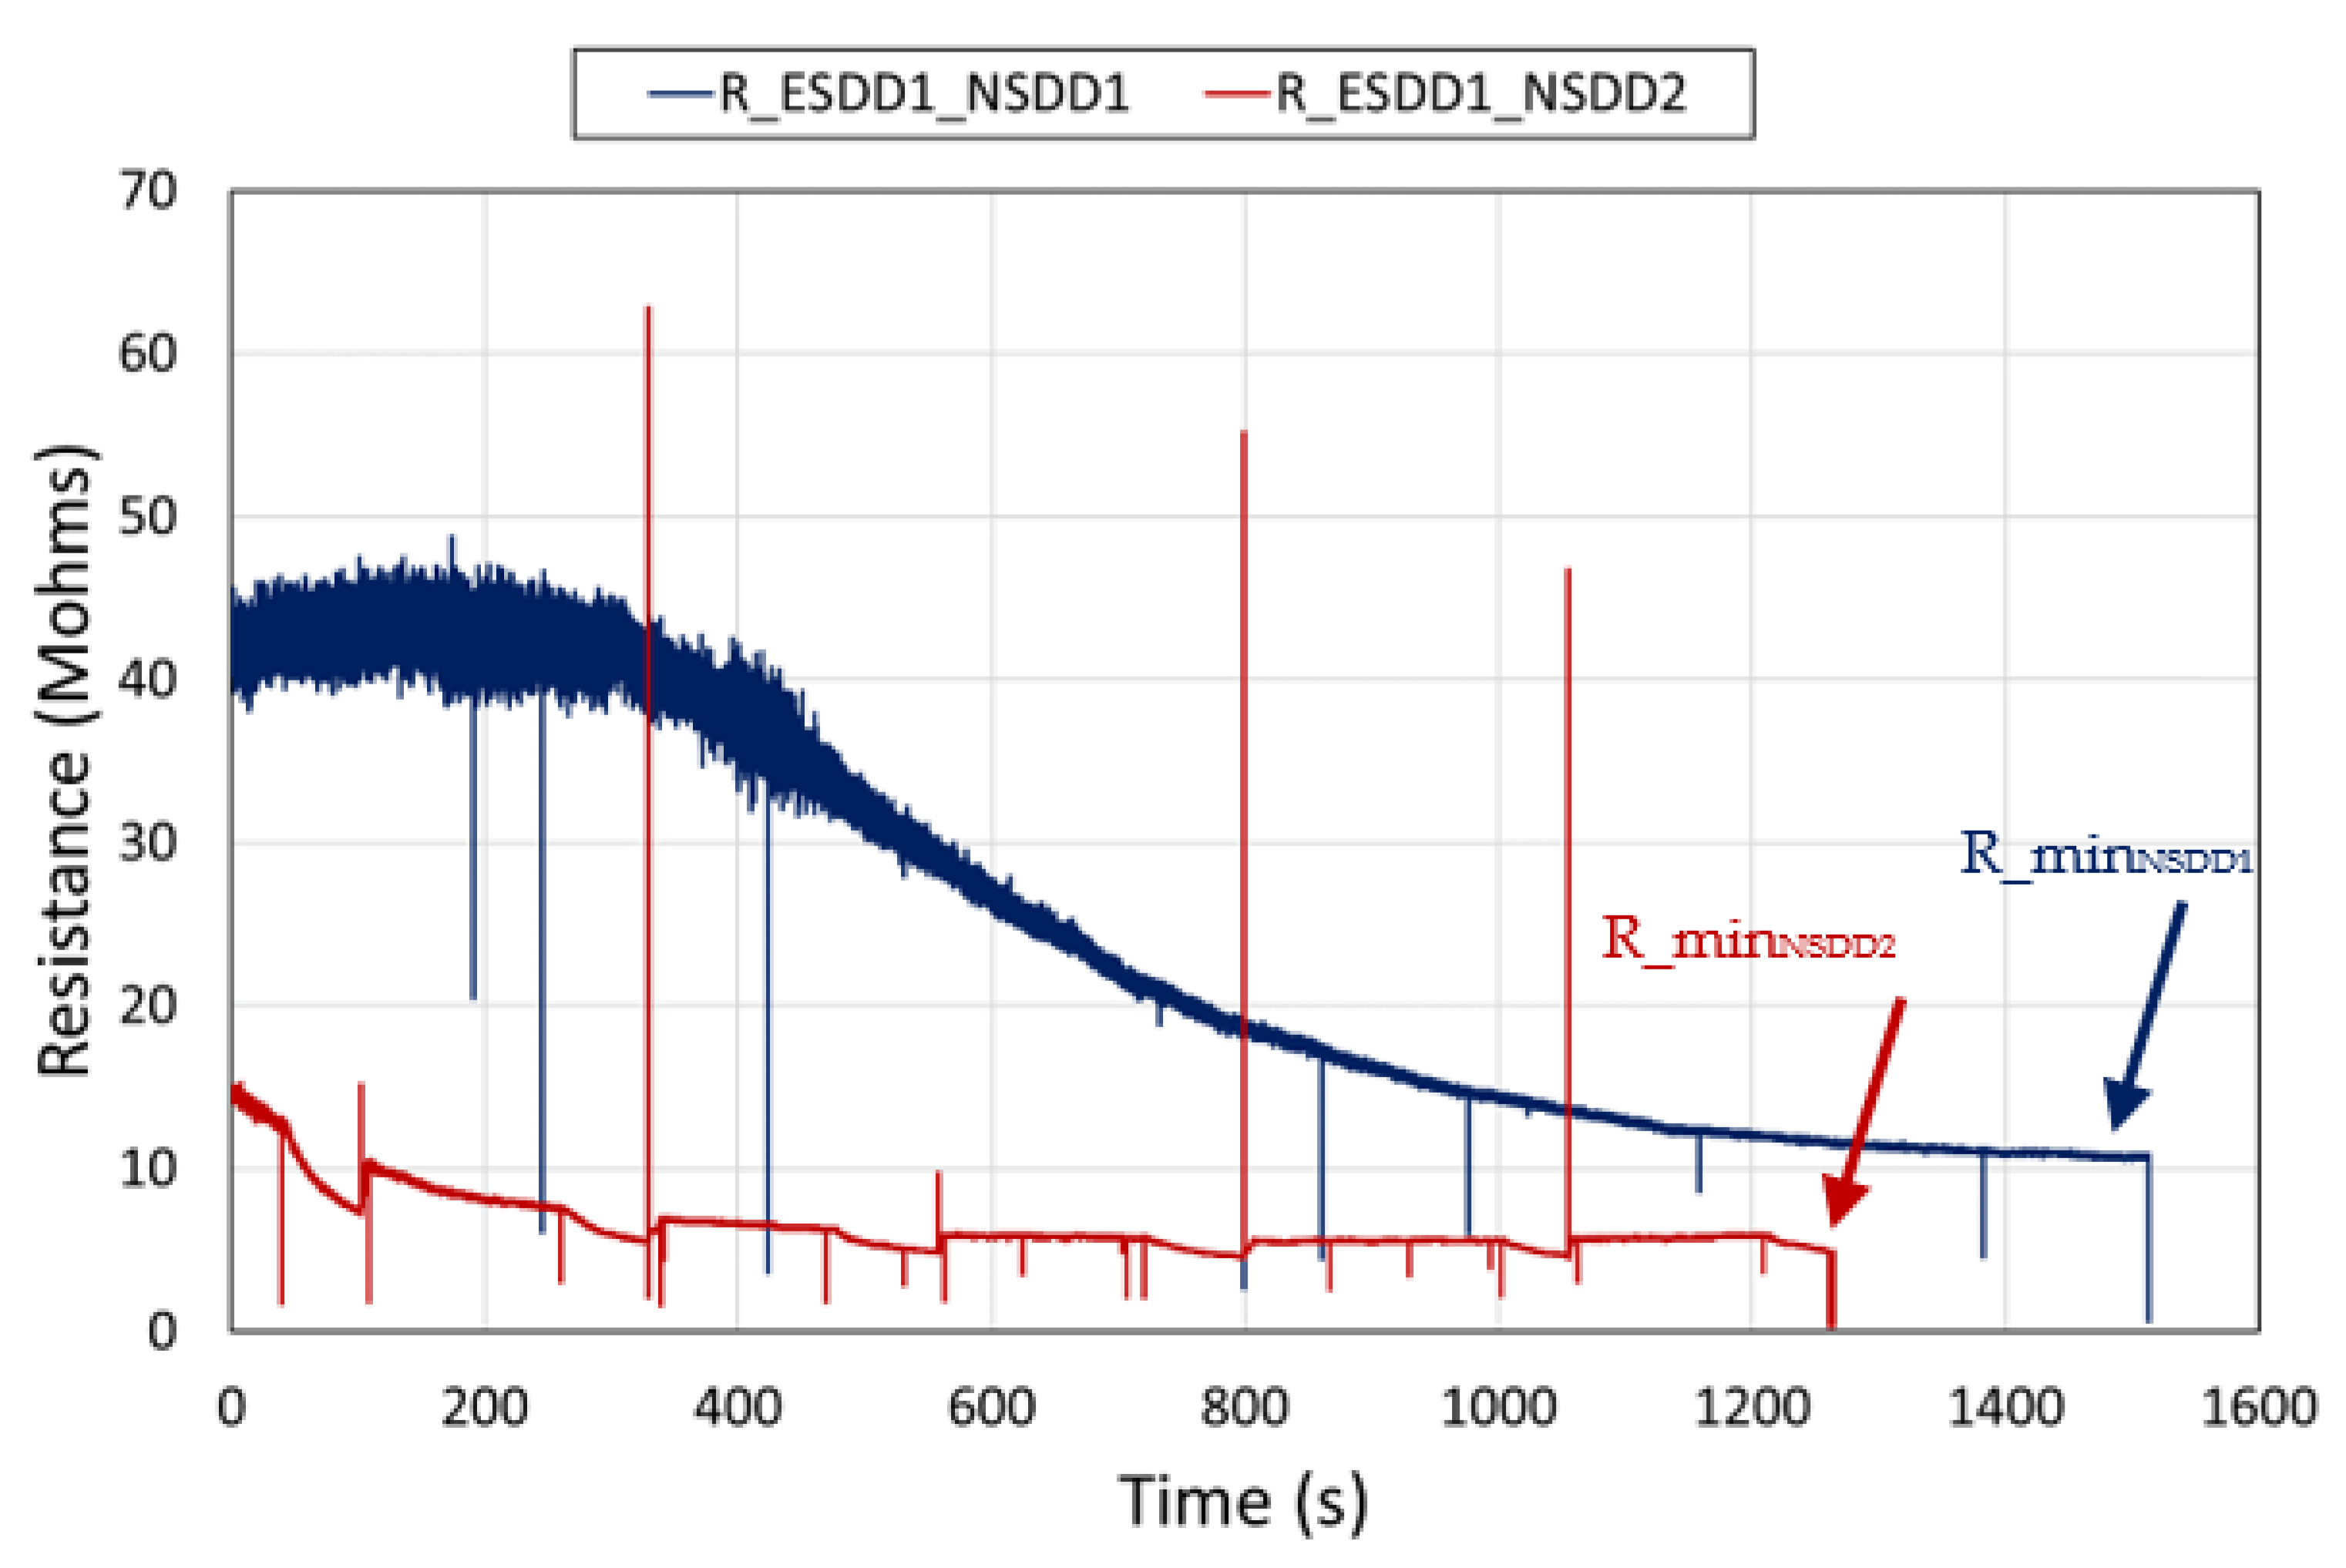
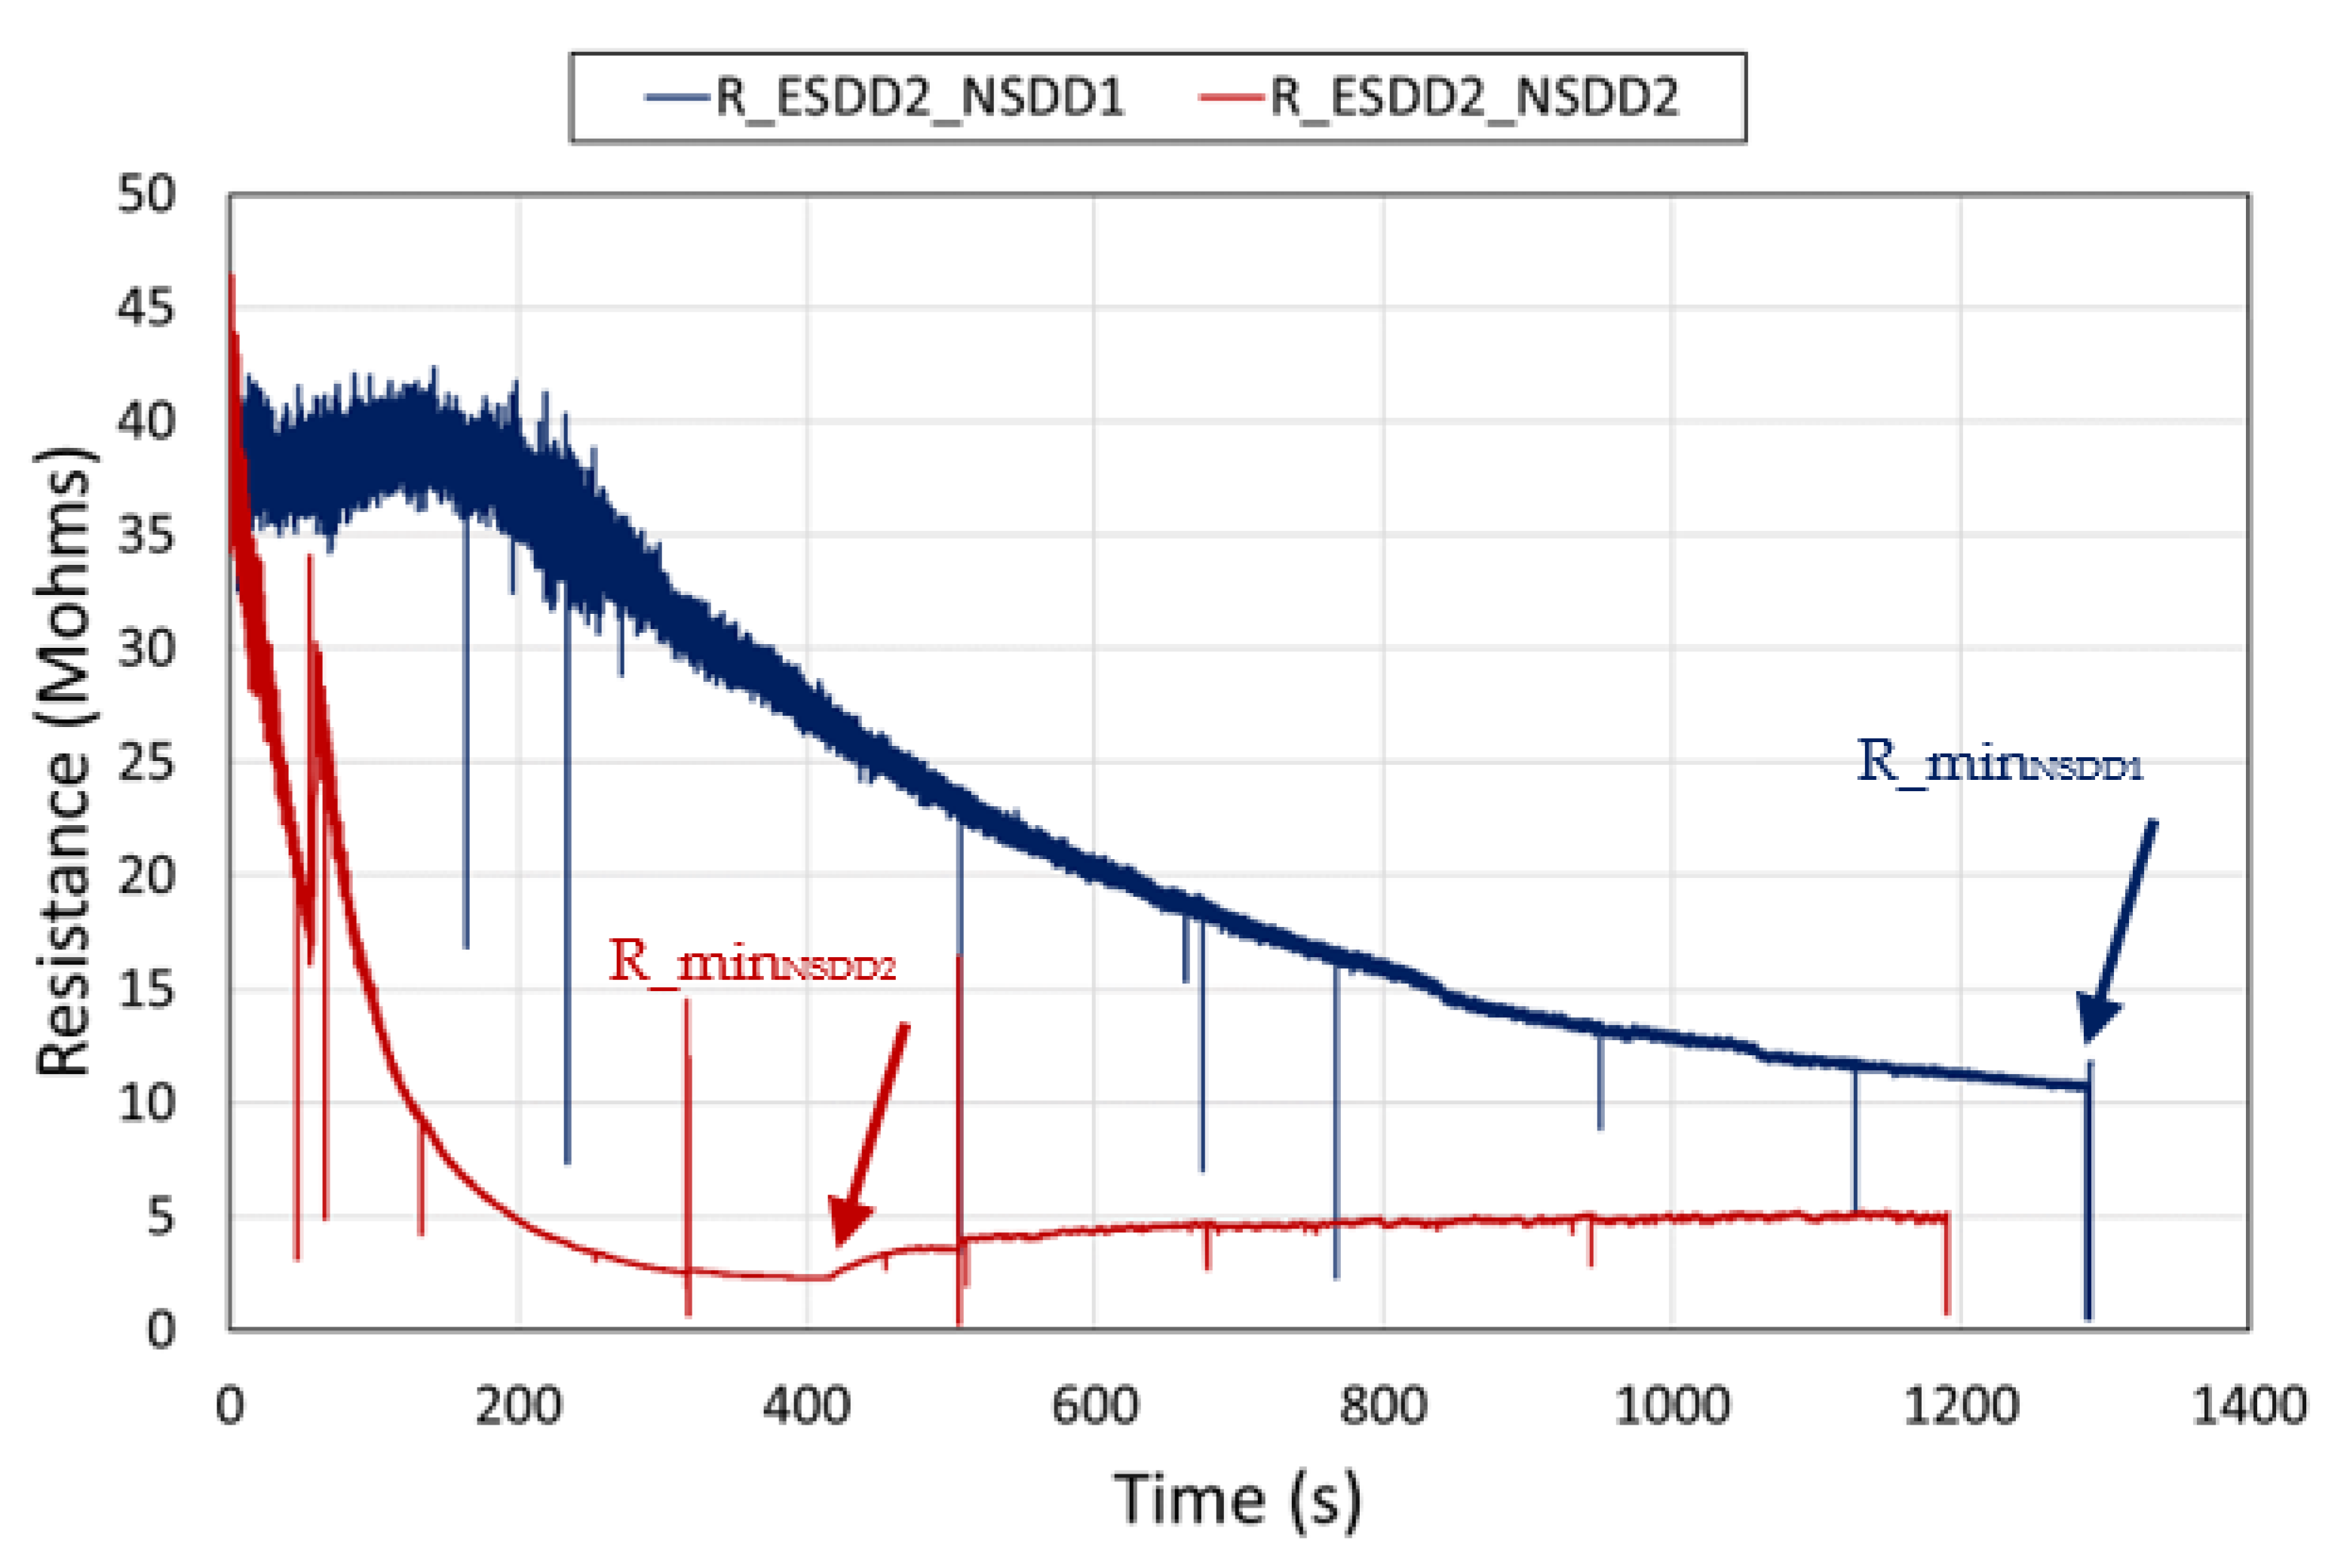
Based on the conclusion of the previous section, special attention is paid to the low-voltage leakage resistance of the different polluted insulators before DB creation related to the FOV tests. Figure 10 and Figure 11 illustrate the corresponding instantaneous low-voltage leakage resistance before the FOV tests of the examples in Figure 4 and Figure 5. The leakage resistances are different and depend on the NSDD level, even though the ESDD level is the same. For ESDD1 = 0.12 mg/cm2, the minimum resistances are: R_Min-NSDD1 = 10.75 MΩ and R_Min-NSDD2 = 4.77 MΩ. For ESDD2 = 0.38 mg/cm2, R_Min-NSDD1 = 10.63 MΩ, R_Min-NSDD2 = 2.325 MΩ. These examples show that the minimum leakage resistance is greatly influenced by NSDD, and this influence increases with both ESDD and NSDD. Indeed, the ratio of the leakage resistance corresponding to NSDD1 and NSDD2 is 1.01 for ESDD1, while it is 2.05 for ESDD2.
Table 4 gives the average minimum resistance corresponding to each NSDD for the used ESDD. According to this table, the surface resistance depends on the amount of insoluble matter density in the pollution layer, even though the ESDD is the same. This can be related to the influence of the porosity of the layer that changes with the kaolin density. The greater the density, the greater the humidity absorption. The direct effect is that the resistance decreases with the increase in the moisture contained (trapped) in the pollution layer. On the other hand, the results of Table 4 show that the variation of the minimum resistance is clearly observable at the extremes: ESDD1 = 0.12 mg/cm2 and ESDD3 = 1.0 mg/cm2.
By considering that the pollution layer is uniform and continuous at the insulator surface, the resistance can be expressed as [9]
where rs is the surface resistivity, D(x) is the partial diameter until the path dx, and Kf is the form factor. Then, the surface resistivity can be deduced from Equation (4).
Table 5 gives the average minimum surface resistivity deduced from Equation (4) corresponding to each ESDD with a different NSDD.
Based on the values in Table 5, the variation of the surface resistivity with ESDD can be approximated with a power function
The values suggest that parameters A and B depend on the amount of NSDD and can be approximated with the following equations
3.3. Modeling
The pollution resistance covering the insulator is an important parameter for the calculation of flashover parameters. In the case of long-rod insulators, an approximation of the form factor can be made by considering the insulator’s equivalent diameter. Then, Equation (1) can be rewritten as
The form factor will be
Equations (7) and (8) indicate that the insulator can be reduced to an equivalent cylinder with a length L and an equivalent diameter Deq.
One can deduce that the per-unit resistance is
By combining (3) and (9)
Equation (10) gives the flashover voltage as a function of the pollution surface resistivity and form factor.
By combining (5) and (10), it yields
Equation (11) shows that the flashover voltage depends on the pollution level, form factor, NSDD amount, and arc characteristics.
By comparing (11) and (1), one deduces
According to Equation (12), α depends on the geometrical characteristics of the insulator, the discharge parameters N and n, and the amount of NSDD, while β depends on parameter n and the amount of NSDD.
For the estimation of the variation of the discharge parameters N and n with NSDD, Equation (12) should be rewritten as a function of A, B, α, and β
Equation (13) shows that the discharge parameters are closely related to the NSDD amount.
3.4. Estimation of Discharge Parameters
Based on Equations (12) and (13), the discharge parameters N and n are deduced and summarized in Table 6 for each used NSDD.
Based on Table 6, discharge parameters N and n vary with the insoluble amount: both N and n decrease with NSDD. The results are in accordance with the results observed in [8,34] and confirmed by [11,17]. This can be related to the effect of the pollution constituent on the discharge temperature, as proposed in [8,27].
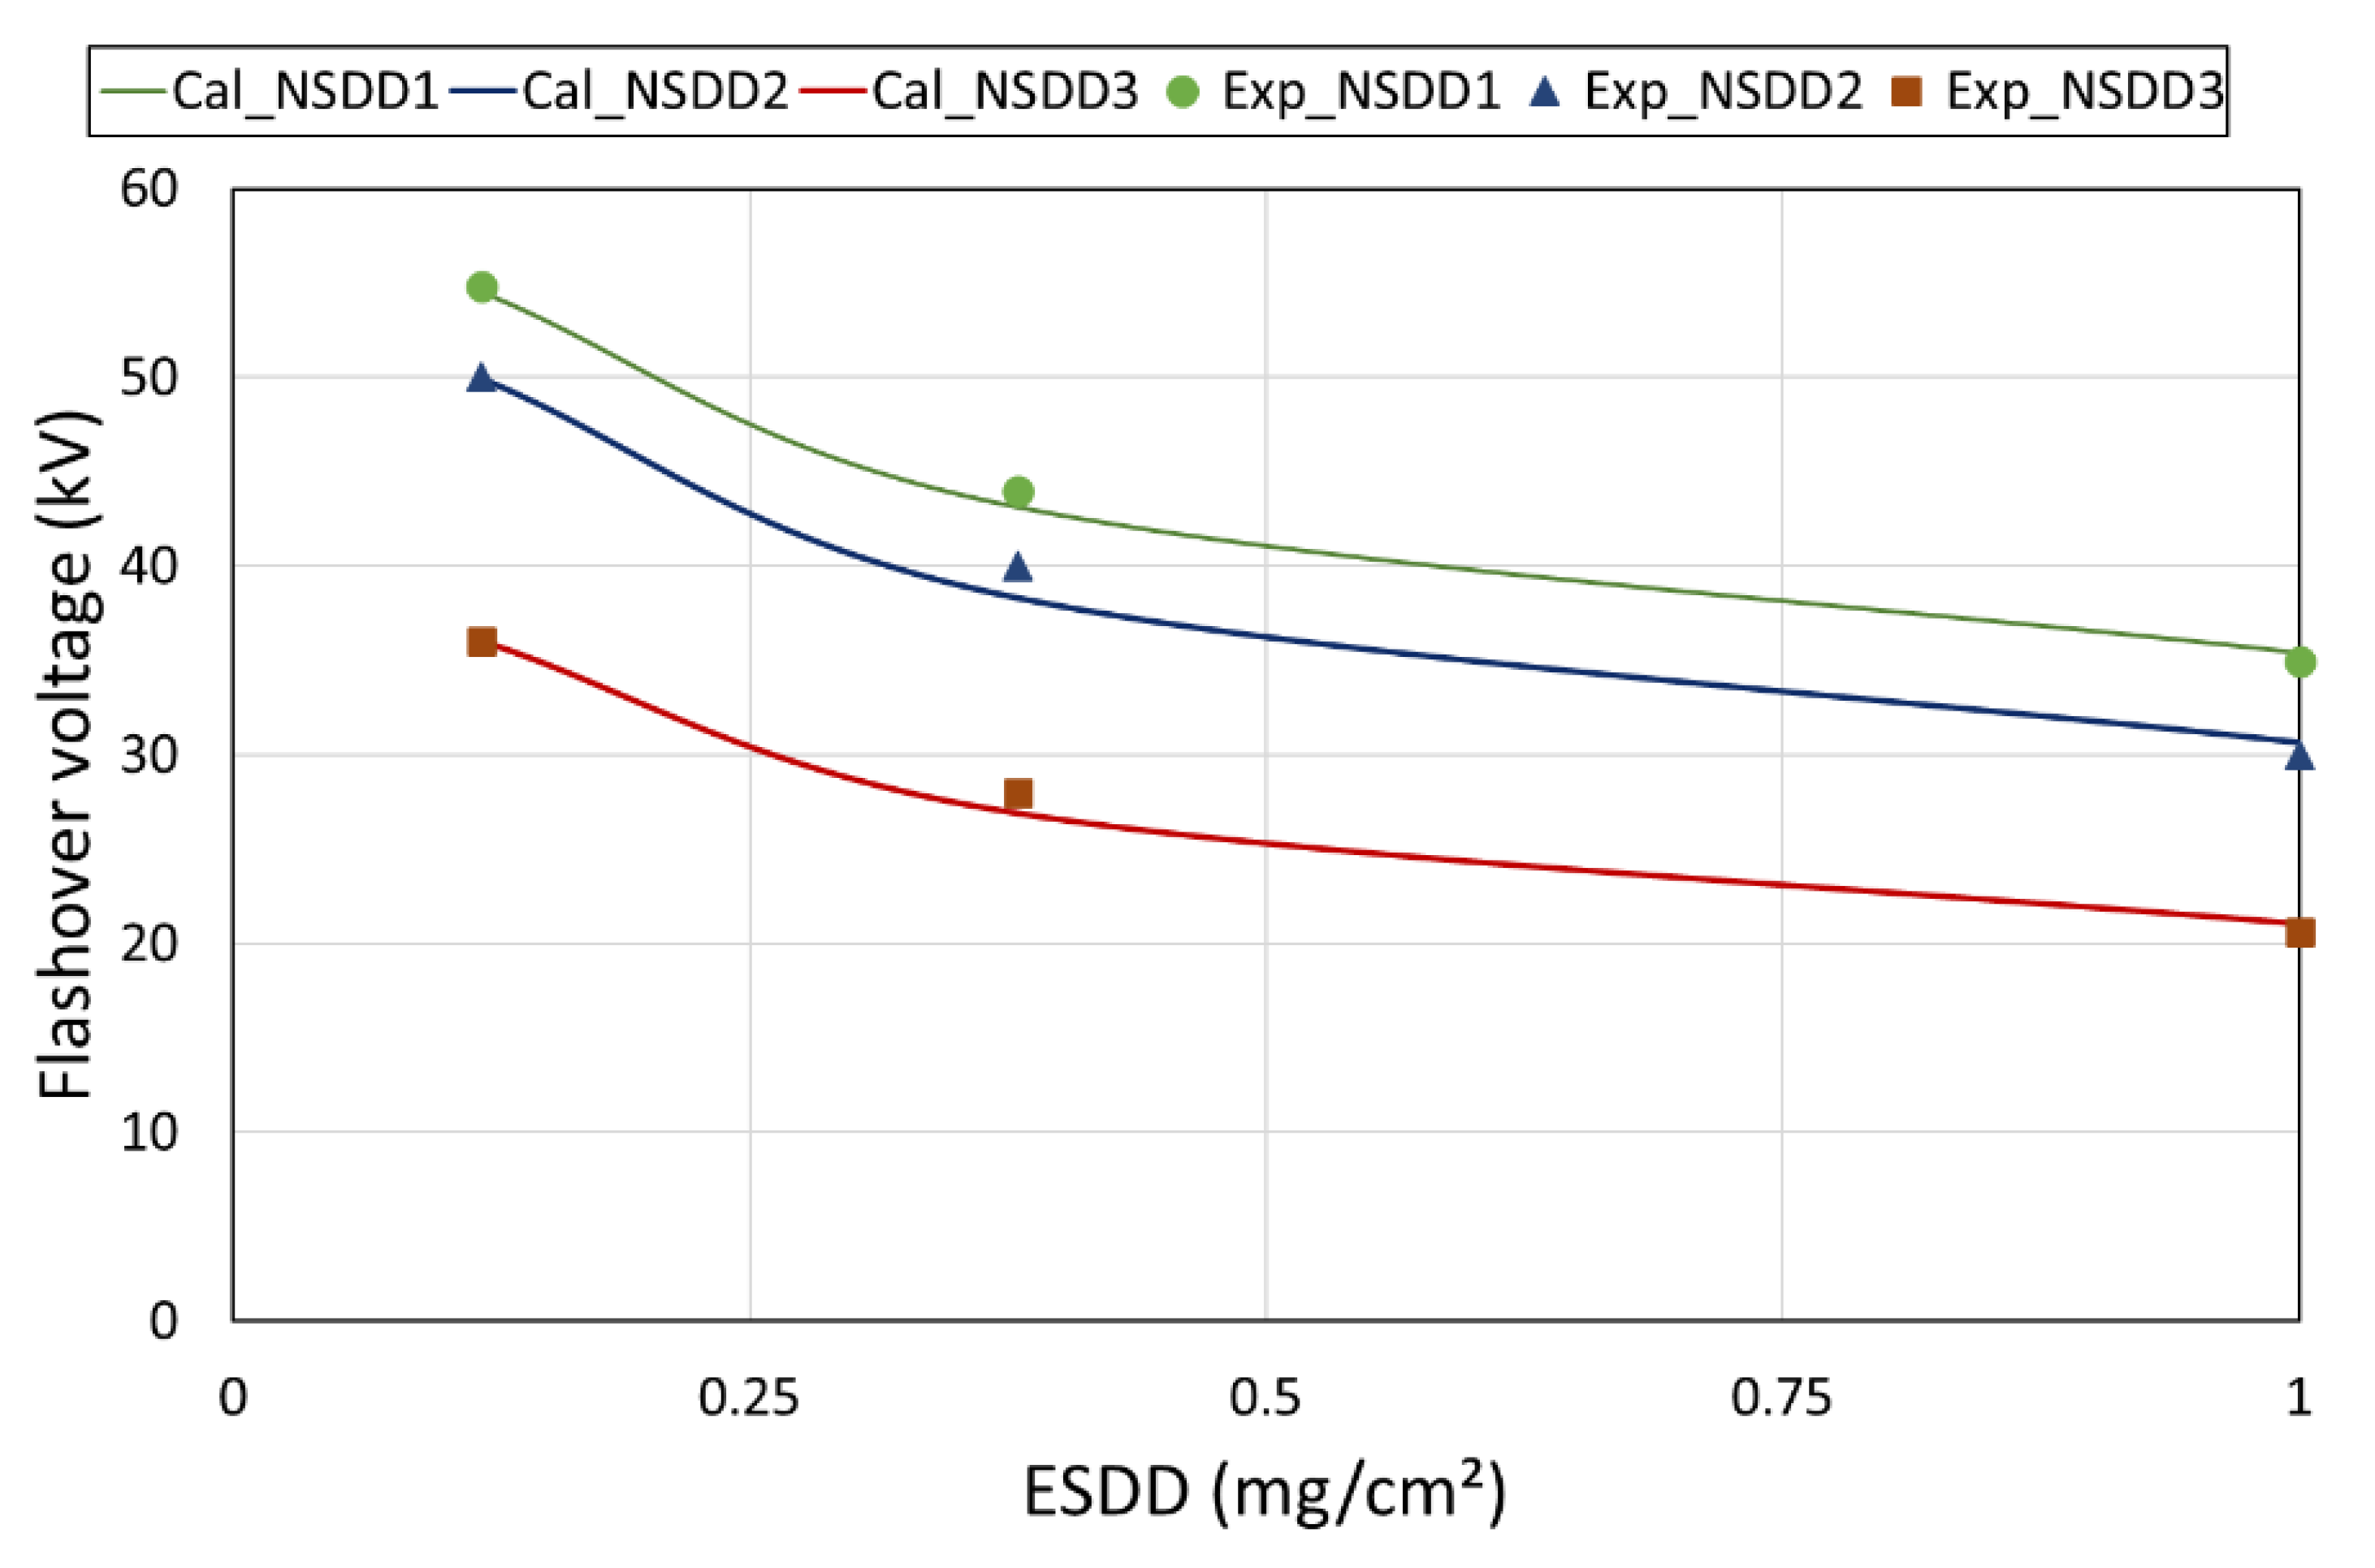
Figure 12 illustrates the comparison between the measured average flashover voltages and the calculated flashover voltages based on Equation (11). The calculated values are close to the experimental values.
4. Conclusions
This paper was aimed at the experimental study of the effect of NSDD on the FOV performance of SiR insulators to establish a mathematical model of FOV voltage, taking into account the effect of both ESDD and NSDD. The experimental results showed that for the same ESDD, VFOV decreases with the increase in NSDD. By plotting VFOV and ESDD, it was found that coefficients α and β vary with the amount of NSDD.
The infrared and thermal recording during FOV tests showed that DBs appear at the region between the shed and the trunk. Next, the DbDs and the DBAs developed and elongated along the trunk and the sheds. The inception of DBs and the development of DbDs and DBAs are closely related to the NSDD amount.
The surface resistance depends on the amount of insoluble matter density in the pollution layer, even though the ESDD is the same. Then, the variation of the surface resistivity with ESDD and NSDD was proposed.
The link between FOV voltage equations based on the Obenaus model and the empirical equations based on ESDD was established. The equivalence between the discharge parameters N and n and the coefficients α and β was proposed. Based on the model and the experimental results, it was deduced that N and n are not constant and depend on the NSDD amount.
Author Contributions
Conceptualization, M.E.A.S. and A.K.; methodology, M.E.A.S. and A.K.; A.K.; validation, M.E.A.S., A.K., M.A., and A.M.H.; formal analysis, M.E.A.S. and A.K.; investigation, A.K.; resources, A.M.H.; data curation, M.E.A.S. and A.K.; writing—original draft preparation, M.E.A.S. and A.K.; writing—review and editing, M.E.A.S., A.K., M.A., and A.M.H.; visualization, M.E.A.S., A.K., M.A., and A.M.H. All authors have read and agreed to the published version of the manuscript.
Funding
This research received no external funding.
Institutional Review Board Statement
Not applicable.
Informed Consent Statement
Not applicable.
Data Availability Statement
Not applicable.
Conflicts of Interest
The authors declare no conflict of interest.
References
- Haddad, A.; Warne, D. Advanced in High Voltage Engineering; IET Edition: London, UK, 2004. [Google Scholar]
- Slama, M.E.; Hadi, H.; Flazi, S. Study on Influence of the Non-Uniformity of Pollution at the Surface of HVAC Lines Insulators on Flashover Probability. In Proceedings of the Conference on Electrical Insulation and Dielectric Phenomena CEIDP 2007, Vancouver, BC, Canada, 14–17 October 2007; pp. 562–566. [Google Scholar]
- Looms, J.S.T. Insulators for High Voltages; Peter Pergrinus Ltd.: London, UK, 1988; no. 7. [Google Scholar]
- Farzaneh, M.; Farokhi, S.; Chisholm, W.A. Electrical Design of Overhead Power Transmission Lines, 1st ed.; McGraw-Hill Professional: New York, NY, USA, 2013. [Google Scholar]
- Rizk, F.M.; Rezazada, A.Q. Modeling of Altitude Effects on Ac Flashover of Polluted High Voltage Insulators. IEEE Trans. Power Deliv. 1997, 12, 810–822. [Google Scholar] [CrossRef]
- Saleem, M.Z.; Akbar, M. Review of the Performance of High-Voltage Composite Insulators. Polymers 2022, 14, 431. [Google Scholar] [CrossRef] [PubMed]
- Yang, Z.; Jiang, X.; Han, X.; Zhang, Z.; Hu, J. Influence of pollution chemical components on AC flashover performance of various types of insulators. High Volt. 2019, 4, 105–112. [Google Scholar] [CrossRef]
- Slama, M.E.; Beroual, A.; Hadi, H. Influence of Pollution Constituents on DC Flashover of High Voltage Insulators. IEEE Trans. Dielectr. Electr. Insul. 2013, 20, 401–408. [Google Scholar] [CrossRef]
- International Electrotechnical Commission. Selection and Dimensioning of High-Voltage Insulators Intended for Use in Polluted Conditions—Part 1. IEC Technical Specification IEC/TS 60815-1; IEC: Geneva, Switzerland, 2008. [Google Scholar]
- IEC 60507:1991. Artificial Pollution Tests on High-Voltage Insulators to Be Used on A.C. Systems; IEC: Geneva, Switzerland, 2014. [Google Scholar]
- Zhang, D.; Zhang, Z.; Jiang, X.; Yang, Z.; Zhao, J.; Li, Y. Study on Insulator Flashover Voltage Gradient Correction Considering Soluble Pollution Constituents. Energies 2016, 9, 954. [Google Scholar] [CrossRef] [Green Version]
- Zhang, Z.; Zhang, D.; Jiang, X.; Liu, X. Effects of pollution materials on the AC flashover performance of suspension insulators. IEEE Trans. Dielectr. Electr. Insul. 2015, 22, 1000–1008. [Google Scholar] [CrossRef]
- Ramos, N.G.; Campillo RM, T.; Naito, K. A study on the characteristics of various conductive contaminants accumulated on high voltage insulators. IEEE Trans. Power Deliv. 1993, 8, 1842–1850. [Google Scholar] [CrossRef]
- Zhang, D.; Zhang, Z.; Jiang, X.; Yang, Z.; Liu, Y. Study on the Flashover Performance of Various Types of Insulators Polluted by Nitrates. IEEE Trans. Dielectr. Electr. Insul. 2017, 24, 167–174. [Google Scholar] [CrossRef]
- Akbar, M.; Zedan, F. Performances of HV transmission line insulators on desert conditions—Part 3: Pollution measurement at a coastal site in the eastern region of Saudi Arabia. IEEE Trans. Power Deliv. 1991, 6, 429–438. [Google Scholar] [CrossRef]
- Matsuoka, R.; Kondo, K.; Nako, K.; Ishii, M. Influence of Non-soluble Contaminants on the Flashover Voltages of Artificially Contaminated Insulators. IEEE Trans. Power Deliv. 1996, 11, 420–430. [Google Scholar] [CrossRef]
- Lshii, M.; Komatsubara, M.; Matsuoka, R.; Matsumoto, T.; Kurokawa, M.; Naito, K. Behavior of Insoluble Materials in Artificial Contamination Tests. IEEE Trans. Dielectr. Electr. Insul. 1996, 3, 438. [Google Scholar]
- Flazi, M.E.S.S.; Hadi, H.; Flazi, S.; Tchouar, N. Belakadi Etude du dépôt de pollution responsable du contournement des isolateurs des lignes aériennes du réseau électrique THT national. Rev. Sci. Technol. B 2007, 43–50. (In French). Available online: https://www.asjp.cerist.dz/en/downArticle/407/0/25/58337 (accessed on 11 April 2022).
- Jiang, X.; Yuan, J.; Zhang, Z.; Hu, J.; Sun, C. Study on AC Artificial-Contaminated Flashover Performance of Various Types of Insulators. IEEE Trans. Power Deliv. 2007, 22, 2567–2574. [Google Scholar] [CrossRef]
- Sundhar, S. Influence of non-soluble contaminants on flashover performance of artificially contaminated polymer insulators. In Proceedings of the IEEE Conference on Electrical Insulation and Dielectric Phenomena—(CEIDP’94), Arlington, TX, USA, 23–26 October 1994; pp. 657–662. [Google Scholar]
- Papailiou, K.O.; Schmuck, F. Silicone Composite Insulators: Materials, Design, Applications; Springer: Berlin/Heidelberg, Germany, 2013. [Google Scholar]
- Swift, D.A.; Spellman, C.; Haddad, A. Hydrophobicity Transfer from Silicone Rubber to Adhering Pollutants and its Effect on Insulator Performance. IEEE Trans. Dielectr. Electr. Insul. 2006, 13, 820–829. [Google Scholar] [CrossRef]
- Obenaus, F. Fremdschichtüberschlag und Kriechweglänge. Deutsch. Electrotech. 1958, 4, 135–136. [Google Scholar]
- Rizk, F.A.M. Mathematical Models for Pollution Flashover. Electra 1981, 78, 71–103. [Google Scholar]
- Hampton, B.F. Flashover Mechanism of Polluted Insulation. Proc. Inst. Electr. Eng. 1964, 111, 985–990. [Google Scholar] [CrossRef]
- Wilkins, R. Flashover Voltage of HV Insulators with Uniform Surface Pollution Films. Proc. Inst. Electr. Eng. 1969, 116, 457–465. [Google Scholar] [CrossRef]
- Slama, M.E.; Beroual, A.; Hadi, H. Analytical Computation of Discharge Characteristic Constants and Critical Parameters of Flashover of Polluted Insulators. IEEE Trans. Dielectr. Electr. Insul. 2010, 17, 1764–1771. [Google Scholar] [CrossRef]
- Charalampidis, P.; Albano, M.; Griffiths, H.; Haddad, A.; Waters, R.T. Silicone rubber insulators for polluted environments, part 1: Enhanced artificial pollution tests. IEEE Trans. Dielectr. Electr. Insul. 2014, 21, 740–748. [Google Scholar] [CrossRef]
- Albano, M.; Charalampidis, P.; Griffiths, H.; Haddad, A.; Waters, R.T. Silicone rubber insulators for polluted environents, part 2: Textured insulators. IEEE Trans. Dielectr. Electr. Insul. 2014, 21, 749–757. [Google Scholar] [CrossRef]
- Krzma, A.; Albano, M.; Haddad, A. Comparative characterization of conventional and textured 11 kV insulators using the rotating wheel dip test. IET High Volt. 2020, 5, 739–746. [Google Scholar] [CrossRef]
- Slama, M.E.A.; Albano, M.; Haddad, A.M.; Waters, R.T.; Cwikowski, O.; Iddrissu, I.; Knapper, J.; Scopes, O. Monitoring of dry bands and discharge activities at the surface of textured insulators with AC clean fog test conditions. Energies 2021, 14, 2914. [Google Scholar] [CrossRef]
- Albano, M.; Waters, R.T.; Charalampidis, P.; Griffiths, H.; Haddad, A. Infrared Analysis of Dry-band FOV of Silicone Rubber Insulators. IEEE Trans. Dielectr. Electr. Insul. 2016, 23, 304–310. [Google Scholar] [CrossRef]
- Working Group C4.303. Artificial Pollution Test for Polymer Insulators. Results of Round Robin Test; Cigré: Paris, France, 2013. [Google Scholar]
- Slama, M.E.A.; Hadi, H.; Flazi, S. Investigation on influence of salts mixture on the determination of flashover discharge constant. Part I: A preliminary study. In Proceedings of the Annual Report—Conference on Electrical Insulation and Dielectric Phenomena, Quebec City, QC, Canada, 26–29 October 2008; pp. 674–677. [Google Scholar]
Figure 1.
Equivalent electrical circuit based on Obenaus model. V: applied voltage, Vd(X): discharge voltage, Vp(X): pollution voltage, I: leakage current, X: discharge length, L-X: nonshunted insulator creepage length.
Figure 1.
Equivalent electrical circuit based on Obenaus model. V: applied voltage, Vd(X): discharge voltage, Vp(X): pollution voltage, I: leakage current, X: discharge length, L-X: nonshunted insulator creepage length.

Figure 2.
Variation of average flashover voltage vs. ESDD for different NSDD levels.

Figure 3.
Effect of NSDD level on the averaged flashover voltage of the conventional insulator with different ESDD values.
Figure 3.
Effect of NSDD level on the averaged flashover voltage of the conventional insulator with different ESDD values.

Figure 4.
Leakage current and voltage during the FOV test with ESDD1, NSDD1, and NSDD2.

Figure 5.
Leakage current and voltage during the FOV test with ESDD2, NSDD1, and NSDD2.

Figure 6.
Infrared recording and thermal activity during the FOV test with ESDD1 = 0.12 mg/cm2 and NSDD1 = 0.11 mg/cm2.
Figure 6.
Infrared recording and thermal activity during the FOV test with ESDD1 = 0.12 mg/cm2 and NSDD1 = 0.11 mg/cm2.

Figure 7.
Infrared recording and thermal activity during the FOV test with ESDD1 = 0.12 mg/cm2 and NSDD2 = 0.23 mg/cm2.
Figure 7.
Infrared recording and thermal activity during the FOV test with ESDD1 = 0.12 mg/cm2 and NSDD2 = 0.23 mg/cm2.

Figure 8.
Visual observation of DbDs and DBAs activity with ESDD1 = 0.12 mg/cm2 and NSDD2 = 0.11 mg/cm2.
Figure 8.
Visual observation of DbDs and DBAs activity with ESDD1 = 0.12 mg/cm2 and NSDD2 = 0.11 mg/cm2.

Figure 9.
Visual observation of DbDs and DBAs activity with ESDD1 = 0.12 mg/cm2 and NSDD2 = 0.23 mg/cm2.
Figure 9.
Visual observation of DbDs and DBAs activity with ESDD1 = 0.12 mg/cm2 and NSDD2 = 0.23 mg/cm2.

Figure 10.
Leakage resistance during the low-voltage (840 V) test with ESDD1.

Figure 11.
Leakage resistance during the low-voltage (840 V) test with ESDD2.

Figure 12.
Comparison between calculated and measured flashover voltages vs. ESDD for various NSDD.


Table 1.
Characteristics of x-A/B bicomponent SiR materials.
| Property | Inspection Method | x-A/B |
|---|---|---|
| Permittivity | IEC 60250 | 2.9 |
| Dielectric strength (kV/mm) | IEC 60243 | 23 |
| Tracking resistance | IEC 60587 | 1 A 3.5 |
| Dissipation factor | IEC 60250 | |
| Tensile strength (N/mm2) | ISO 37 | 6.50 |
| Hardness shore | ISO 868 | 30 |
| Tear strength (N/mm) | ASTM D 624 B | 20 |
| Elongation at break | ISO 37 | 500 |
| Volume resistivity | IEC 60093 | 1015 |
Table 2.
Dimensions of tested insulators.
| Parameters | Dimensions (mm) |
|---|---|
| Creepage distance | 375 |
| Fitting separation | 175 |
| Shed diameter | 90 |
| Shed separation | 46 |
| Trunk diameter | 28 |
| Inner core diameter | 18 |
| Form factor | 2.7 |
Table 3.
Values of parameters α and β.
| NSDD | α | β |
|---|---|---|
| 0.11 | 35.308 | −0.211 |
| 0.23 | 30.598 | −0.239 |
| 0.52 | 20.992 | −0.262 |
Table 4.
Average minimum resistance corresponding to each NSDD for the used ESDD.
| ESDD (mg/cm2) | R_minNSDD1 (MΩ) | R_minNSDD2 (MΩ) | R_minNSDD3 (MΩ) |
|---|---|---|---|
| 0.12 | 1.62 | 1.03 | 0.73 |
| 0.38 | 1.57 | 0.88 | 0.57 |
| 1.00 | 1.20 | 0.60 | 0.20 |
Table 5.
Average minimum surface resistivity corresponding to each ESDD for various NSDD.
| ESDD (mg/cm2) | Average Minimum Surface Resistivity (MΩ) | ||
|---|---|---|---|
| NSDD1 (mg/cm2) | NSDD2 (mg/cm2) | NSDD3 (mg/cm2) | |
| 0.12 | 4.07 | 2.59 | 2.10 |
| 0.38 | 3.60 | 2.22 | 1.30 |
| 1.00 | 3.04 | 1.52 | 0.40 |
Table 6.
Values of parameters n and N for fog rate 3 l/h.
| NSDD | N | n |
|---|---|---|
| 0.11 | 149.45 | 0.214 |
| 0.23 | 133.60 | 0.211 |
| 0.52 | 83.61 | 0.173 |
Publisher’s Note: MDPI stays neutral with regard to jurisdictional claims in published maps and institutional affiliations. |
© 2022 by the authors. Licensee MDPI, Basel, Switzerland. This article is an open access article distributed under the terms and conditions of the Creative Commons Attribution (CC BY) license (https://creativecommons.org/licenses/by/4.0/).
Share and Cite
MDPI and ACS Style
Slama, M.E.A.; Krzma, A.; Albano, M.; Haddad, A.M. Experimental Study and Modeling of the Effect of ESDD/NSDD on AC Flashover of SiR Outdoor Insulators. Energies 2022, 15, 3782. https://0-doi-org.brum.beds.ac.uk/10.3390/en15103782
AMA Style
Slama MEA, Krzma A, Albano M, Haddad AM. Experimental Study and Modeling of the Effect of ESDD/NSDD on AC Flashover of SiR Outdoor Insulators. Energies. 2022; 15(10):3782. https://0-doi-org.brum.beds.ac.uk/10.3390/en15103782
Chicago/Turabian StyleSlama, Mohammed El Amine, Adnan Krzma, Maurizio Albano, and Abderrahmane Manu Haddad. 2022. "Experimental Study and Modeling of the Effect of ESDD/NSDD on AC Flashover of SiR Outdoor Insulators" Energies 15, no. 10: 3782. https://0-doi-org.brum.beds.ac.uk/10.3390/en15103782
Note that from the first issue of 2016, this journal uses article numbers instead of page numbers. See further details here.