
Analytics for Recovery and Reuse of Solid Wastes from Refineries


Istituto di Scienze e Tecnologie per l’Energia e la Mobilità Sostenibili, STEMS-CNR, P.le Tecchio 80, 80125 Napoli, Italy
*
Author to whom correspondence should be addressed.
Energies 2022, 15(11), 4026; https://0-doi-org.brum.beds.ac.uk/10.3390/en15114026
Submission received: 22 April 2022
/
Revised: 16 May 2022
/
Accepted: 24 May 2022
/
Published: 30 May 2022
(This article belongs to the Special Issue Advances in Solid Fuels Conversion to Enable the Global Energy Transitions)
Abstract
:Heavy fractions of petroleum have for long time been bypassed in favour of lighter fractions. Nowadays, in the framework of the “circular economy”, there is a growing interest in residual petroleum heavy fractions. The present work briefly reviews the use and characterization at laboratory scale of some low valuable solid or semi-solid products of the oil refinery industry: asphaltenes (bitumen/asphalt), pet-coke and pitch for use as fuels. The use of solid and semi-solid refinery residues, in particular, of coke as a coal substitute in thermochemical processes and of pitch and asphaltenes as material precursors, requires careful analysis, and an understanding of their structure at the molecular level is mandatory for the development of processing technology. Techniques for the characterization of typical petroleum heavy fractions such as pitches, asphaltenes and cokes are reviewed. An experimental protocol for investigating at the laboratory scale the thermochemical conversion behavior of solid and semi-solid refinery wastes is proposed.
1. Introduction
The present contribution deals with the possible use of low valuable products obtained from the oil refinery industry, in particular asphaltenes, pet-coke and, more in general, petroleum pitch.
In the world there are currently over 500 refineries in operation, each with its own scheme. Figure 1 reports, as mere a example, one possible oil refinery scheme. It can be observed that in the delayed coker [1] the residues of the vacuum distillation units are cracked into lighter hydrocarbons, producing coker gas oil, but also a solid carbonaceous byproduct which is called “pet-coke”. Besides carbon, pet-coke may contain also sulfur and metals like Ni, V etc., depending on the composition of the original oil. In Figure 1 it is also possible to see another outlet stream from the vacuum distillation unit, indicated as “asphalt” in the US or “bitumen” elsewhere.
This is a highly viscous, black, sticky material, it remains liquid as long as it is transported hot, but solidifies otherwise. Its insoluble fraction in n-heptane is called asphaltene, which thus represents the heaviest fraction of crude oil. Highly viscous or semi-solid materials are produced also in other units, for example in catalytic and hydro-catalytic ones, and sometimes are enriched in metals (e.g., Mo, V, Ni). The more general term of “petroleum pitch” is often used for such heavy refinery products.
The interest in a profitable and sustainable utilization of solid and semi-solid refinery products has risen over the last decade in spite of the advent of renewable sources and the decreasing appeal of fossil fuels [2,3]. Bitumen is utilized preferably as construction material, especially in road paving, and secondly as fuel. The main applications of pet-coke depend on its quality: low grade, sulfur-rich pet-coke is mainly used as a coal substitute in power generation, cement and the steel industry [4,5,6,7], while better quality products with low sulfur content can be calcined and used as a raw material for the production of aluminum and steel. Their use is clearly advantageous in comparison to coal extraction from the environmental point of view, so much so that the term “green coke” is used. The demand of green coke for construction, ceramics and electronics is expected to boost over the next years. China is a major supplier of pet-coke in Asia, but a large increase in production of solid and semi-solid refinery residues occurred also in Northern America over the last decades, due to the exploitation of tar sands in US and Canada. In order to obtain marketable fuels from tar sands, it is indeed necessary to increase the H/C molar content of the hydrocarbon molecules, which unavoidably generates carbon enriched byproducts such as bitumen and pet-coke. In fact, the export of US pet-coke has increased from 50,000,000 barrels/y in 1985 to approximately 200,000,000 in 2019 [8] and the main destinations of this product currently are India, China, Mexico, and Turkey. The trade of bitumen or asphalt from the US also increased over the last years, reaching approximately 10,000,000 barrel/y in 2019.
2. New Perspectives for Low Valuable Products of the Oil Refinery Industry
The use of solid and semi-solid refinery residues as combustibles and in particular of pet-coke as a coal substitute in thermochemical processes is interesting thanks to the high heating value (>35 KJ/g) and generally low ash content of these materials. Several works report on the combustion behavior of solid refinery residues at lab and full scale [9,10,11,12,13,14,15,16].
As shown by Fermoso et al. [17] a first issue for the utilization of these fuels is their reactivity. Indeed, pet-coke’s reactivity is low compared to that of medium rank coals. However, the main technological challenges to be faced [18] in exploitation of such fuels arise from the presence of metals and sulfur.
Some papers addressed the particular effects that metals present in solid refinery residues can have on combustion behavior [12,19,20,21,22,23]. Banik and Pisupati [19] and Li et al. [20] showed that V and Ni present in pet-coke cause erosion problems, fouling and clogging, especially under fluidized bed conditions and under CO2 atmosphere. As for the sulfur content, the exploitation of low grade pet-coke in combustion [24,25,26] requires the application of desulfurization techniques. Otherwise, for high sulfur samples a good alternative is gasification, eventually followed by the Fischer–Tropsch synthesis. The advantage of gasification for high sulfur fuels is that the inherent S can thus be converted into H2S and recovered by the Claus process [27]. Co-gasification with natural gas [28] or with coal [29] gives good results in terms of GHG emissions and energy efficiency.
It must be considered that the urgency for solutions against global warming is changing the paradigm of solid fuels utilization in favor of gasification or capture ready combustion coupled with CO2 utilization and sequestration (CCS). Among the new CCS technologies one, chemical looping combustion (CLC) is particularly promising for use of pet-coke [30,31] and in particular of metal rich refinery residues, because in CLC the detrimental role of metals might be overcome and even turned into an advantage. CLC fuels do not burn in air, as in conventional combustion processes, but take oxygen from a metal oxide, which acts as an oxygen carrier while being cycled between two interconnected reactors: a reducer and an oxidizer. The advantage is the production of a nearly pure CO2 effluent, thus reducing the economic penalty for CO2 capture. CLC of liquid and gaseous fuels has reached a TRL level of 6, but CLC of solid fuels, such as coal, is more complex, due to the difficulty of realizing the contact between a solid metal oxygen carrier and a solid fuel. So far, different strategies have been proposed: one strategy consists in preceding chemical looping by a pyrolysis and gasification stage. Another option, proposed under the name of CarboLoop [30], is to exploit the capacity of solid carbons to form at mild temperature (300 °C) relatively stable carbon-oxygen complexes, which do evolve and desorb as CO and CO2, but only at higher temperature (600–700 °C) [32,33]. In CarboLoop the solid carbon assumes the double role of oxygen carrier and fuel. It is evident that the concept, though for coal, is particularly suitable to pet-coke and metal rich carbonaceous materials, because the metals within the sample should coadiuvate chemical looping, acting as inherent metal oxygen carriers. Figure 2 reports the stepwise combustion obtained by a pet-coke upon reiterated oxidation and desorption cycles, offering a proof of concept for CLC of pet-coke.
Within the new paradigm of waste utilization, there is also an increased interest in the production of advanced materials. Apicella et al. [34] carried out preliminary work on the thermochemical upgrade of pitch for production of carbon nanomaterials suitable, for example, for batteries and electrodes.
The pitch was preliminary characterized then subjected to thermal treatment under inert conditions up to temperatures of 1800 °C. When very fast heating was applied by using a special heated grid reactor, a spongy, porous material was obtained, with a good degree of nanostructural order, yet easy to mill and deposit on electrodes (Figure 3).
Low grade refinery products are also rich in aromatic molecules that represent the core constituents of the newcomers of carbon nanomaterials: carbon dots (CDs). CDs, highly fluorescent carbon nanomaterials, are characterized by complicated structures [35] inside particles of nanometric sizes. Their optical features are intriguing and vary greatly depending on the synthesis conditions; thus they must be carefully analysed. A detailed optical characterization of pitch has already shown the presence within these complex mixtures of aromatic compounds of highly fluorescent components [36]. Moreover, pitch [37] and asphaltenes [38] have shown to be promising sources of CDs after suitable post treatments.
In addition, ultra-fast techniques such as laser heating, recently studied as a way for improving properties of carbon materials [39], and especially effective when the nanostructure is amorphous-like, can be potentially applied to heavy petroleum fractions as the short timescales involved in pulsed laser heating can cause transformations toward more organized nanostructure. Even though the work in this field is still immature, research is going on and in the next years may lead to new advantageous routes for exploitation of refinery residues as materials for energy storage and electronics. However, all the applications that can be envisioned for these refinery products necessarily go through their detailed characterization in order to optimize their final usage in both the energy production or materials synthesis fields. In this work, some of the most common analytical techniques particularly suitable for the characterization of petroleum fractions as pitches, asphaltenes and cokes are reviewed. Moreover, an experimental method for probing the thermochemical conversion behaviour of solid and semi-solid refinery wastes at laboratory scale is presented.
3. Methods for Chemico-Physical Characterization
The detailed and complete analysis of heavy petroleum fractions requires the use of many different analytical tools because of their chemical complexity and low volatility. However, the molecular weight (MW), the aromaticity and, in general, the chemical functionalities, are the key properties to determine for guiding their processing technology development. In particular, size exclusion chromatography (SEC) and mass spectrometry (MS) are the most eligible techniques for MW determination, while Raman and Fourier Transform Infrared (FTIR) spectroscopy can provide information on aromaticity and chemical functionalities, respectively.
In the next paragraphs, examples of applications of these techniques for the characterization of typical petroleum heavy fractions have been briefly reviewed. Beside them, solvent fractionations sometimes used before the application of these analytical techniques, or as an alternative to them, are also illustrated in the following, being used themselves as a method of characterization.
3.1. Terminology for Refinery Residues
Before starting with the description of the diagnostics, it is necessary to give some clarifications as regards the definition of asphaltenes, petroleum pitches and pet-coke.
The source of the crude oil affects in a variable way the content and characteristics of asphaltenes, which constitute its most refractory (or the heaviest) fraction [40]. Asphaltenes provides very low economic value and causes adverse effects to the oil industry.
They are known to be complex mixtures of species having aromatic moieties substituted with heteroatoms (e.g., N-, O-, S-) or linked with aliphatic bridges [41].
Even if carbon and hydrogen are the most abundant elements (>90 wt.%) [42], there are some metallic elements in asphaltenes, usually present in the form of metalloporphyrins [43], which are distributed in the range of 0–4000 ppm (nickel and vanadium are the most abundant). Asphaltenes are operationally defined as compounds which are insoluble in aliphatic hydrocarbons (n-pentane or n-heptane), and soluble in aromatics (toluene and benzene) [44]. Asphaltenes are dark-brown-to-black friable solids without a definite melting point, and usually foam and swell upon heating, leaving a carbonaceous residue [41].
Apart from elemental composition, all asphaltenes chemical properties had been the subject of a debate; for example, their MW had been estimated distributing in a range from hundreds to millions of mass units [45], leading to speculation about self-aggregation [46].
Asphaltenes are critical to all aspects of petroleum use, hindering its production, transportation and refining. For all these reasons, they have been defined as the “cholesterol of petroleum” [47]. Such hindrances on production and processing have made asphaltenes one of the most focused materials in petroleum research. Asphaltenes are also valuable products from oil refineries to be used as paving materials on roads, shingles for roofs, and waterproof coatings. Thus, the ultimate goal is to either separate asphaltenes from the petroleum liquids before entering the refining processes or “upgrade” it to a less refractory (or lighter) fraction. For both cases, it is mandatory to understand the fundamental chemistry of asphaltenes.
A general consensus has been reached on asphaltenes molecular structure by using different diagnostic techniques, converging on aromatic systems having on average 4–20 fused rings. By contrast, the debate on asphaltene MW has not been resolved. On the basis of different hypotheses on MW, two different molecular structures involved in asphaltenes self-aggregation have been proposed: the “archipelago” or alternatively the “island” structure [46,48,49].
Petroleum pitches are carbonaceous materials derived from organic precursors by relatively low temperature processes (for example distillation at <700 K). They contain a large range of molecular types and masses. In particular, petroleum pitches are residues from heat treatment and distillation of heavy petroleum fractions. They are generally considered consisting of oligomers of alkylated polycyclic aromatic hydrocarbons (PAHs), with the overall MW ranging from approximately m/z 200 to 2000 [50,51,52].
After heating, pitches generally melt giving an isotropic fluid. As heating is continued above 660 K, alignment of lamellar molecules occurs, leading to the formation of nematic discotic liquid crystals (mesophase) [53]. Indeed, pitch falls into the category of glass-forming materials, which have no defined melting point, but pass through a temperature region, “the glass transition region”, before forming a viscous liquid. This temperature is strictly dependent on the process and the conditions used for producing petroleum pitches and it is a key factor in determining almost all of the physical properties of a pitch. In particular, longer times and higher temperatures result in more aromatic pitches with higher anisotropic contents and, in general, higher “glass transition temperatures”.
Pitches derived from petroleum are used as precursors in the manufacture of important industrial products, as electrodes and carbon fibers and the matrix phase of carbon–carbon composites [54,55]. The accurate description of the structural composition of pitches is thus fundamental in the optimization of pitch processing to high-value products.
The presence of a very large number of compounds makes difficult pitch characterization. Their separation into fractions is therefore required before characterization.
Pet-coke is a carbonization product of high boiling carbon fractions obtained in petroleum processing. When the carbonization temperature is below 900 K, the coke is named “green coke”. The heat treatment of “green coke” to about 1600 K forms the “calcinated coke”, which has a mass fraction of hydrogen less than 0.1 wt.%. From petroleum pitches in delayed coker two commercial grades cokes are produced: “regular coke” (or sponge coke, anisotropic) for use in anode manufacture (filler for electrodes); “needle coke” for electrode production (oriented, with high graphitizability) [53]. Thus, the nature of the parent material being carbonized and the carbonization conditions affect the properties of coke.
3.2. Solubility as a Characterization Technique
In order to sharpen and simplify the composition analysis of petroleum residues and also for the evaluation of their quality for industrial use [56], solvent fractionation was often employed [36,56]. Solvent solubility is also used as an operational criterion for separating and defining the different petroleum heavy fractions, as illustrated in the following. An important advantage with respect to other characterization techniques is that solvent fractionation is amenable to be applied at larger scales.
Therefore, solvent fractionation can be considered as a method of characterization for petroleum bottom fractions and, in the case of pitches, it has been effectively used as a method of modifying the chemical structure prior to and during the processing of fibers [53]. The elimination of volatile pitch fraction for gathering the insoluble fraction, which is more prone to form mesophase carbon materials, has also been pursued by solvent fractionation. However, it was early established that solubility and mesophase formation are unconnected phenomena [57] and mesophase properties are related to the nature of the precursor and to the preparation procedure [58].
Unfortunately, petroleum industries have tended to use different solvents and nomenclature, but considering the different approaches, in the following, the most widely applied extraction/solubilisation scheme for heavy petroleum fractions will be resumed.
The scheme is reported in Figure 4. It uses quinoline (standard ASTM D2318 or ASTM D7280 test methods) and toluene (standard ASTM D4312 or ASTM D4072 test methods), even if pyridine is also employed.
Recently, quinoline was substituted by N-methyl pyrrolydone (NMP), which is cheaper and less toxic and separates similar percentage of insolubles [52]. Successive extractions with n-heptane, petroleum ether or n-hexane have been used to separate the lighter pitch components, in order to allow the characterization of the higher MW aromatic species, concentrated in the toluene-insoluble fraction [50,53]. The relative proportions of quinoline-insoluble and toluene-insoluble fractions determine the pitches softening and coking properties, which in turn are important for their applicability in various manufacturing processes [56].
As observable in Figure 4, asphaltenes are the compounds insoluble in aliphatic hydrocarbons such as n-pentane or n-heptane, and soluble in aromatics such as toluene and benzene [44]. Their solubility has up to now been used for defining them operationally, as already described before. By contrast, coke is generally insoluble in the most used organic solvents.
3.3. Mass Spectrometry (MS)
A mass spectrometer generates ions from either organic or inorganic compounds by many different methods and separates them on the basis of their mass-to-charge ratio (m/z) for the qualitative and quantitative detection by their respective m/z and abundance [59]. Advances in MS and, in particular, in the ionization and injection techniques of liquid and solid samples [60,61], made this analytical technique a promising tool for the analysis of a complex matrix of heavy aromatic tarry species.
Laser desorption-mass spectrometry (LD-MS) also with matrix, i.e., Matrix-Assisted Laser Desorption/Ionisation Mass Spectrometry (MALDI-MS), Fourier Transform Ion Cyclotron Resonance Mass Spectrometry (FT-ICR MS) and atmospheric pressure mass spectrometry (APPI-MS), have been successfully applied to heavy carbonaceous materials. Laser Desorption/Ionization (LDI) techniques were first developed in the early seventies [62] but only in the late eighties [63], with the introduction of MALDI, they became an established method for the MS of macromolecular compounds. The role of matrix is to absorb UV laser radiation and to give the energy to the analyte, often not absorbing in UV region, for ionizing it in a softer way. However, many polycondensed systems, especially with aromatic moieties and, therefore, strong UV absorption, have the so-called “to be self-matrix” property [64,65], which means the capability of the sample (or a part of it) to act as matrix by itself, without the necessity of an external matrix addition.
FT-ICR MS, introduced in 1974, is a high resolution mass analyzer based on the cyclotron frequency of the ions in a fixed magnetic field. The excitation field, after ions excitation, is removed, and the ions are rotating at their cyclotron frequency in phase (as a “packet” of ions). These ions induce a charge on a pair of electrodes as the packets of ions pass close to them. A Fourier transform is employed for extracting the resulting signal from the data, giving a mass spectrum. FT-ICR MS is the only mass-analysis method capable of resolving the chemical constituents of petroleum [66].
APPI-MS is a relatively new soft ionization technique [67]. With APPI-MS system, a liquid solution of a sample is directly introduced into the mass analyzer. A discharge Kr lamp generates photons in a narrow range of ionization energies. If the ionization energy (IE) of a molecule is lower than the photon energy, a direct ionization occurs, whereas if the molecule has a higher IE values, it is necessary the addition in the analyte solution of a dopant, i.e., a molecule with a high IE, which can promote the ionization.
With its continuous technological development, MS has represented the tool at the basis of an intense debate on the chemical properties and molecular composition of asphaltenes [45,48].
MS applied to asphaltenes has three main concerns: fragmentation, gas-phase aggregation, and the inability to volatilize the heaviest asphaltene fraction [68]. These concerns explain the reason why the true MW range of asphaltenes is still an object of high-pitched debate [45,49]. The controversy has not been resolved by studies employing MS with a soft ionization source like LDI. Indeed, different groups have reported mean MW spanning two orders of magnitude for similar LDI setups and asphaltene samples [69,70,71,72]. However, the variation of some experimental parameters, such as laser pulse energy [73] and sample concentration, can heavily affect the measured mass spectrum. In general, heavier measured masses are observed if a higher pulse energy or concentration are employed, even if a too high energy can even cause fragmentation and it is necessary to choose a good compromise [69]. This result has been explained in different ways. The supporters of the only presence of low-mass range in asphaltenes hypothesize that, with higher pulse energy or concentration, aggregation of asphaltenes is promoted in the plasma plume produced in LDI and therefore the large masses are only artifacts [46,74,75].
On the opposite, the supporters of high masses range [48,69,72] asserted that relatively low laser pulse energy is insufficient to volatilize or ionize the heaviest components of asphaltenes.
Mullins and coworkers [76] developed a method for overcoming the experimental condition dependence of LDI ionization. The method is named two-step laser mass spectrometry (L2MS). This is a two-color technique in which the laser desorption and laser ionization steps are spatially and temporally separated. In this way, laser desorption forms a plume of neutral molecules, bypassing the problem of aggregation in plume. The obtained L2MS data support the hypothesis that LDI asphaltenes mass spectra peaking at high MW masses result from aggregation in the LDI plasma plume.
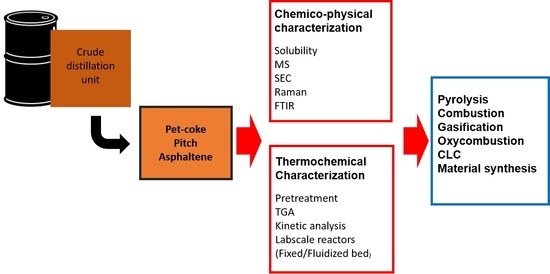
By using FT-ICRMS, asphaltenes structure were hypothesized to be not an extension of maltene (n-heptane solubles, see Figure 4) compositional space to a higher and higher carbon number but an extension to higher degrees of aromaticity. These results suggest that asphaltenes may be composed primarily of small molecules (less than ~2 kDa) with highly condensed aromatic ring systems [77]. In order to investigate deeply the effects of ionization source and mass analyzer, some authors [73,78,79] compared Laser Desorption/Ionization-Time of Flight mass spectrometry (LDI-TOFMS) with APPI-MS for asphaltenes analysis. Both the MS spectra (reported in Figure 5 and Figure 6) of asphaltenes, obtained with the two techniques, present similar MW range with a broad structure extending in the range m/z 300–1100 (the peaks around m/z 200, in the case of APPI-MS spectrum, are due to toluene) with peaks periodicities of 1 (peaks at every nominal mass), 2 and 14 units, indicating the presence of homologues with different unsaturation degrees [65].
The very good agreement between LDI-MS and APPI-MS, even if using APPI ionization, the fragmentation should be reduced, suggests that the masses detected are representative of the true MW of the sample. The mass range found, between m/z 300–1100 with a maximum at m/z 500–600, is in very good agreement with previous works [65,80,81], whereas the eventual presence of higher masses (>100,000 u), as found by other authors [82,83], cannot be investigated by APPI-MS because the mass limit of the ion trap MS is about 3000–4000 u for single-ionized analytes. Adding mathematical tools for mass spectra interpretation, such as Fourier transform (FFT) and double bond equivalent (DBE) number analysis, also with the support of other techniques such as X-ray diffraction (XRD) and Size exclusion chromatography, the occurrence of aryl-linked core structures [84] was hypothesized to feature asphaltenes, along with island and archipelago structures [73].
As regards petroleum pitches, they are often difficult to be analyzed via MS for a number of reasons, which include low solubility, low volatility, broad MW range, and high molecular mass components. To overcome these challenges and the effect that they have on traditional ionization approaches, some authors [85,86] applied solid state MALDI-MS and found that petroleum pitches have a polymeric nature. Indeed, monomers, dimers and trimers could be identified. Moreover, MALDI results indicated that monomer pitch fraction was dominated by methylated derivatives of 4–5 rings PAH, whereas the dimer pitch fraction had the most prevalent species consistent with condensation reactions of the most common monomer species with an accompanying loss of 4–6 hydrogens.
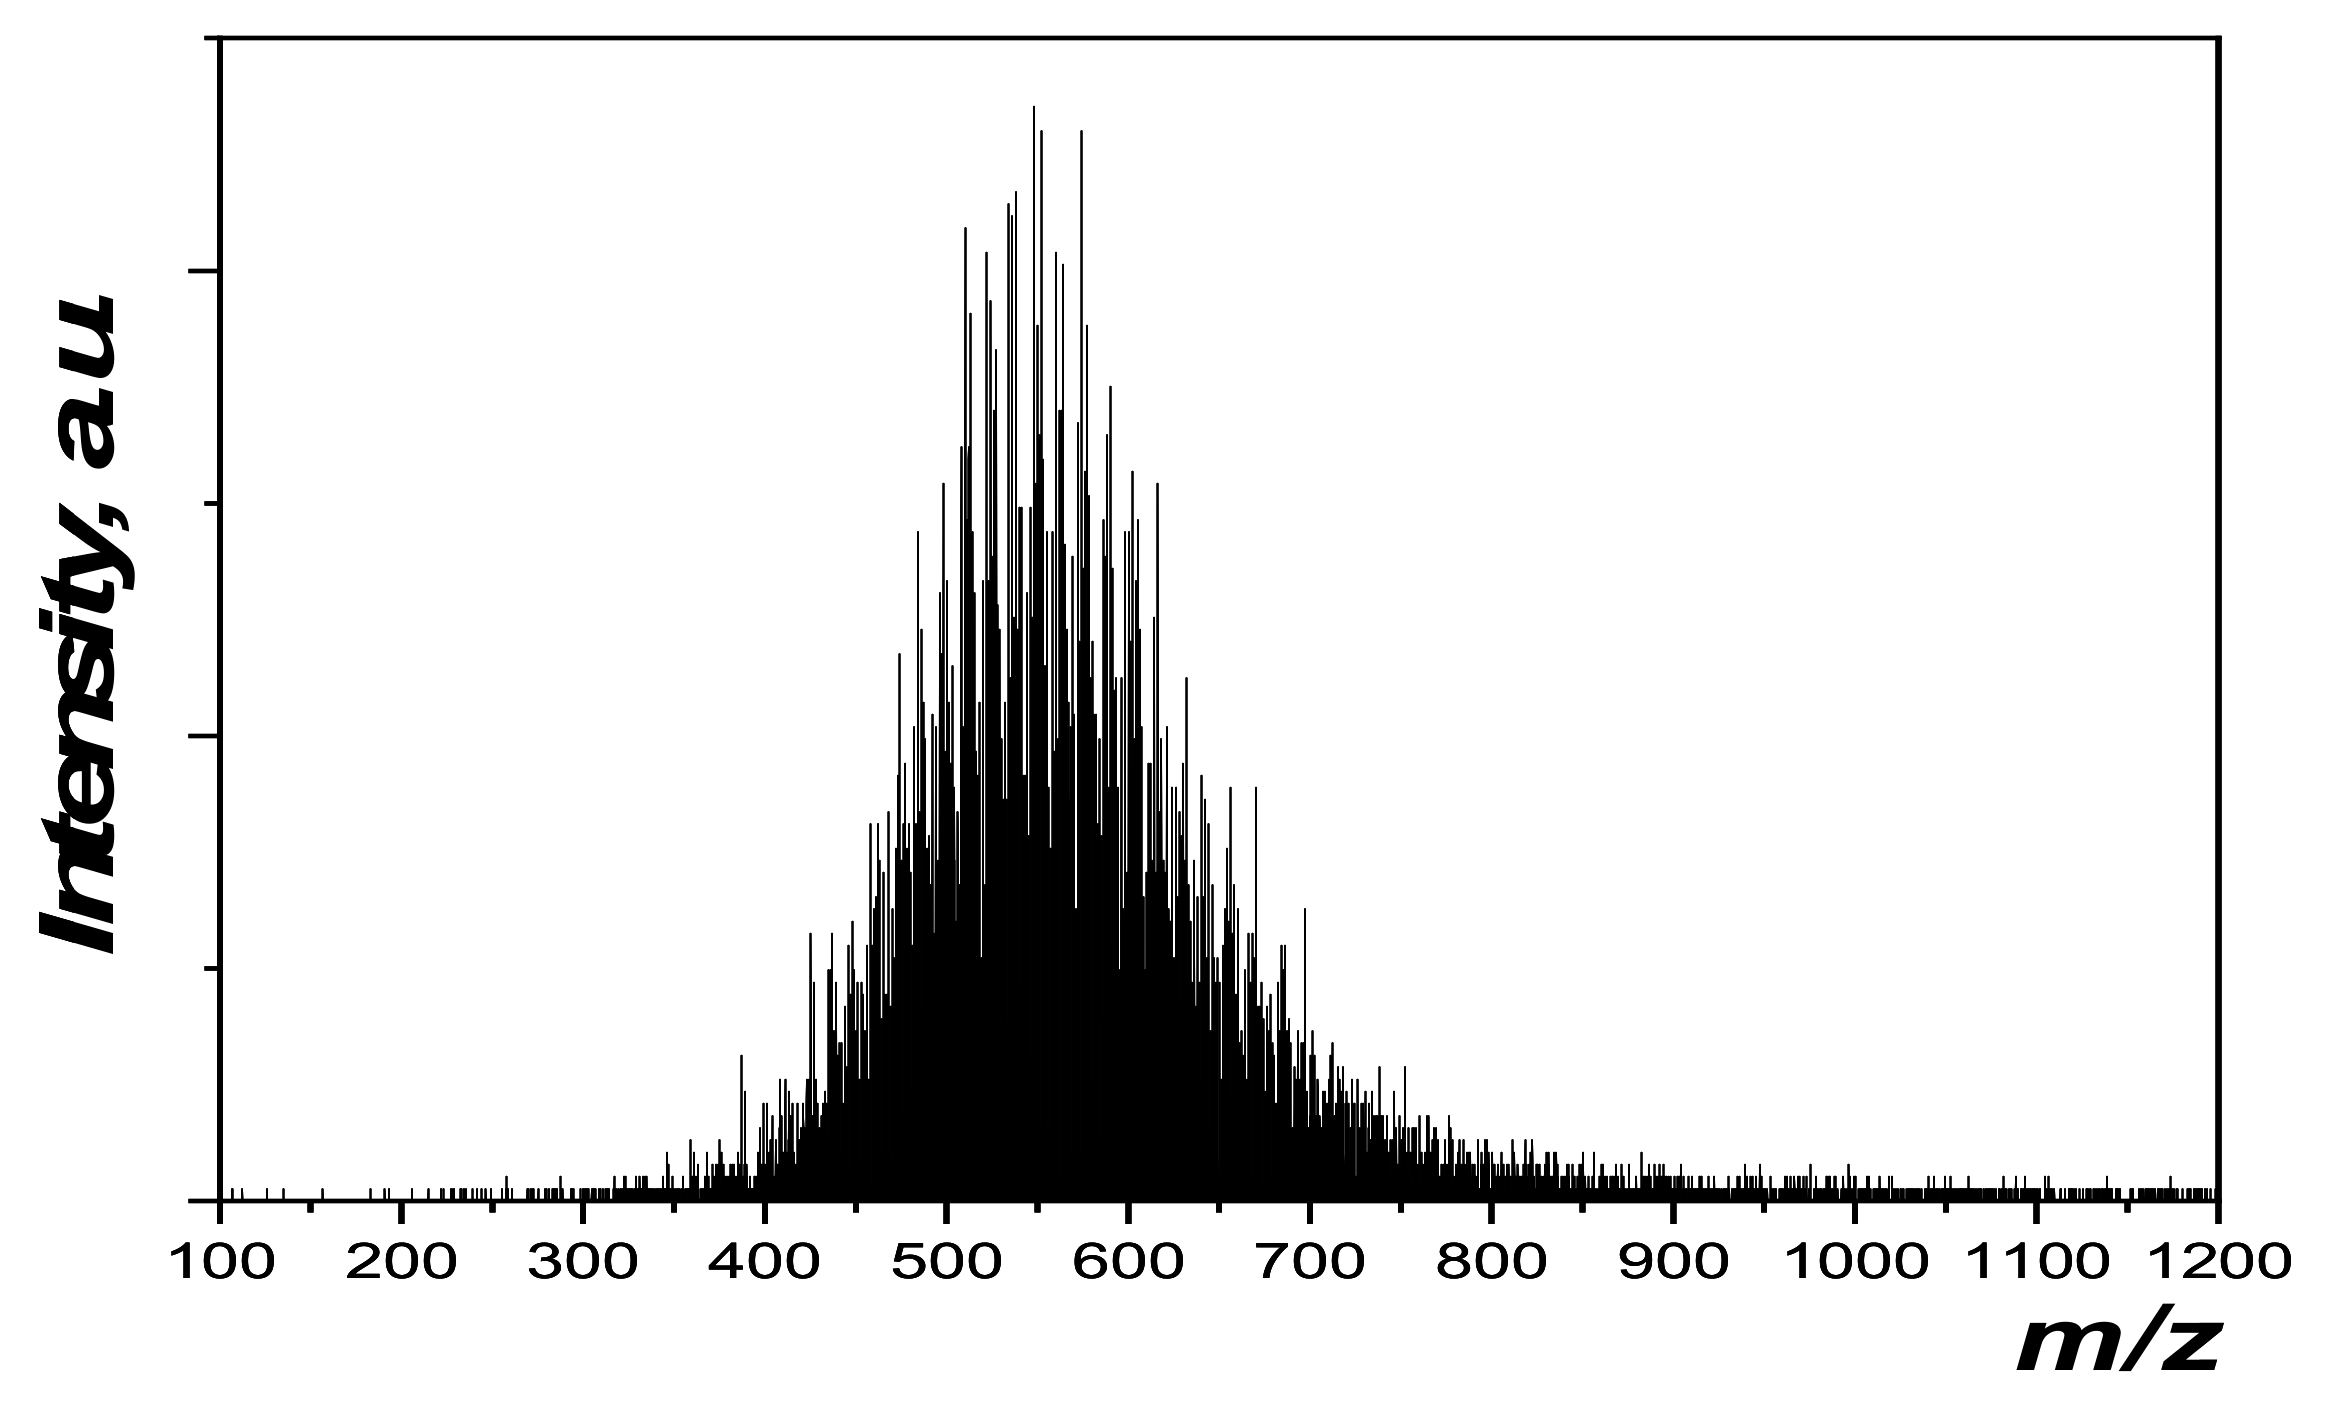
Other authors [49] by using tandem MS/MS option of the APPI-MS apparatus inferred the occurrence of functional groups on the aromatic components of pitches [59]. In particular, for the petroleum pitch investigated, both the first (MS2) and the second (MS3) fragmentation occur with the loss of fragments at m/z = 15 (methyl-) and the MS2 also with the loss of m/z = 14 and 29 fragments (ethyl-), allowing the identification of the parent peak as an alkyl-substituted PAH. In order to deepen the analysis of pitches on the whole sample, LDI-TOFMS was also applied, since the APPI mass spectral analysis was limited to the pitch fraction which is soluble in toluene. Consistently with the APPI spectra, the LDI-TOFMS spectra, reported in Figure 7, show a peak continuum without specific regular sequences peaked around m/z 250 and 500, respectively, suggesting the presence of monomeric and dimeric species as already found in special petroleum pitches by MALDI [85,86].
Zhang et al. used MALDI−TOF MS to characterize and compare petroleum and coal tar pitch using a solvent-free sample preparation [87]. In agreement with the other cited studies, they hypothesized for the petroleum pitch sample the presence of a wider array of large PAHs with short aliphatic side chains.
3.4. Size Exclusion Chromatography (SEC)
Size exclusion chromatography (SEC) is surely the most used method for determining the MW of a polymer. SEC separates polymers on the basis of molecular hydrodynamic volume or size. For performing SEC analysis, polymers are dissolved in an appropriate solvent and injected into a column packed with porous particles. The SEC mobile phase is generally the same solvent used to dissolve the polymer. As the polymer elutes through the column, molecules that are too large to penetrate the pores of the packing elute in the interstitial or void volume of the column. Smaller polymer molecules can penetrate into the pores and access greater pore volume and, therefore, elute at a later time. Thus, high MW material elutes first from a SEC column, followed by low MW components. Since SEC is a relative and not an absolute MW technique, columns must be calibrated with polymer standards of known MW or an on line light scattering detector must be used [88]. Other detectors based on a single wavelength absorption, or Diode array UV-visible absorption or fluorescence, can be also employed, according to the properties of the sample.
For calibrating the system, it is necessary to use a calibrant structurally quite similar to the analyte, in order to present the same relation between molecular size and molecular mass. For pitches and asphaltene components with masses greater than 500 u, this presents difficulties because the molecular structures are not generally known.
SEC, in contrast to MS, is not limited by volatility considerations, but it is limited by sample solubility in the chosen solvent. Most of the SEC work uses NMP as solvent and eluent for petroleum-derived liquids, like pitches and asphaltenes [89]. Asphaltenes present SEC chromatograms, using NMP as eluent, with bimodal distributions [73,90,91], with an early eluting peak, in correspondence of column porosity exclusion, and a later eluting peak in the range resolved by the column. On the basis of calibration performed by using polystyrene and PAHs, the excluded peak normally corresponds to apparent masses in excess of 20,000 u, whereas the low MW peak corresponds to masses of about 1000 u (Figure 8). This bimodal distribution is a standard feature of SEC using NMP and raises two important questions: (1) if the early peak is formed by very large molecules or by aggregates of small polar molecules (2) the significance of the valley between the two peaks [89]. Aggregation in asphaltenes is another hot topic in research. Some authors used the SEC in NMP system with various approaches to determine whether aggregation has a significant influence on mass estimates. In all these studies, reviewed in [89], no evidence could be found for aggregation. Other authors, instead, by using mainly time-resolved fluorescence depolarization [46], Nuclear Magnetic Resonance [38] and MS [71] confirmed the low MW of asphaltenes and the occurrence of aggregation, claiming that NMP not only aggregates asphaltenes, but also flocculates a significant fraction of asphaltene.
As regards pitches, most of the literature on SEC regards coal pitches [36,89,92,93] and reports MW distributions with a dominant peak at around 1000 Da and another smaller peak around 30,000 Da. Similar bimodal MW distributions, even if with the lower MW peak slightly shifted toward higher MW range, were found for petroleum pitches, as shown in Figure 9 [53].
3.5. Raman Spectroscopy
Raman spectroscopy is a particularly appropriated technique for carbon material characterization. An accurate multi-wavelength Raman scattering study of carbon materials is able to give information on the structure of disordered carbons in terms of sp2 bonds configuration (aromatic rings or chains) of the number of aromatic rings fused in a graphitic cluster [95,96].
A graphite crystal has one Raman mode, centered at 1580 cm−1 and labelled G band [97]. This band is associated with the in plane bond stretching of sp2 carbon atoms. Thus, this mode is not necessarily activated by the presence of aromatic rings and is always located in the range 1500–1630 cm−1 in aromatic and olefinic molecules. The Raman spectrum of micro-crystalline graphite shows an additional peak at 1350 cm−1, the so-called D peak, that arises due to the disappearance of in plane long range symmetry. These two peaks, D and G, with different widths, positions, and relative intensity dominate the Raman spectrum of whichever carbonaceous material [98].
The D peak is correlated to the breathing mode of sp2 aromatic carbon; therefore, its activation strictly requires the presence of aromatic rings. Tuinstra and Koenig [97] showed that the ratio between the D mode intensity, I(D), and the G mode intensity, I(G), increases as the size of graphite crystals, La, decreases. Starting from a purely aromatic network of infinite size as graphite crystal, as the disorder is generated, the D peak is activated and I(D)/I(G) will start to increase as the degree of disorder rises. However, with the growth of defect numbers and the shortening of aromatic layer size at about 2–3 nm, the Tuinstra and Koening relationship can no longer be applied. Indeed, for very disordered carbons, aromatic carbon content decreases and aromatic layers become smaller and more tortuous in favour of a rise of odd-member rings and chains structure. Thus, in amorphous carbons with La smaller than 2 nm the rise of the D peak indicates ordering and its strength is proportional to the probability of finding sixfold rings. The non monomodal relation between I(D)/I(G) ratio and the size of aromatic cluster is often neglected in literature leading to uncorrected interpretation of the results.
A detailed analysis of Raman spectra requires deconvolution procedures. The simplest fit consists of two functions to deconvolute the two main Raman features, D and G peaks. More complex deconvolution approaches can be adopted according with the spectrum complexity. Indeed, in particular conditions minor contributions can arise on the sides of the G and D peaks and a multi-peak fit is necessary [99,100]. In spite of the great efforts devoted to the interpretation of the different modes that populate the Raman spectra of carbonaceous materials, there is presently no consensus concerning the attribution and the physical activation mechanism of several of them [101,102,103]. Thus, a fitting cannot be adopted a priori, especially for disordered carbons as asphaltenes and pitch, and it has to be adapted to the spectral features of the sample. The choice of the fitting procedure, including the number of components and the type of function to use, cannot be arbitrary and the goodness of a deconvolution has to be estimated also on its ability to build spectral parameters having physical meaning and able to be related to the samples properties.
Raman spectroscopy so far has been largely employed to characterize carbonaceous material nanostructure. However, Raman spectroscopy can provide useful information also on molecular structures featuring complex mixtures of organic compounds. The exploitation of this technique for this class of compounds is particularly recommended also in consideration of the fact that it can provide also information on the hydrogen content. Indeed, in the Raman spectra of hydrogenated compounds, a relevant background due to photoluminescence phenomena superimposed upon the Raman scattering signal is present, in very hydrogenated samples this photoluminescence is so strong that the spectrum appears featureless. As an example in Figure 10, the Raman spectrum of a petroleum pitch (see PP118 in [52]) is reported. The hydrogen content of PP118 is so high (H/C 0.77) that Raman peaks cannot be detected. An experimental strategy to perform Raman spectroscopy of so fluorescent carbon is to anneal the sample in an inert atmosphere in order to volatilize the lighter part, being usually the more hydrogenated. Figure 10 reports the Raman spectrum of the same petroleum pitch after annealing in N2 in thermogravimetric apparatus to remove the most fluorescent part. This operation makes it possible to measure the spectrum and to deconvolve it to derive parameters useful to the structural characterization of the most aromatic part of the sample as the I(D)/I(G) ratio.
Empirical equations have been proposed to relate the H/C atomic ratio to the ratio between the intensity of the photoluminescence signal, measured by deriving the background slope fitted with a straight line, and the intensity of the G peak [104,105]. In particular, for the petroleum pitch annealed at 450 °C in N2 reported in Figure 10, a I(D)/I(G) ratio of 0.46 was evaluated corresponding to an aromatic size of 0.85 nm, typical of aromatic molecules with about eight aromatic rings. However, the Raman-derived H/C ratio is estimated to be 0.73 or 0.55 according with the formulas proposed in [104,105], respectively. This high hydrogen content suggested the presence of some aliphatic carbon.
Asphaltenes were analysed by Raman spectroscopy confirming the size of 4–20 fused aromatic rings on which other different diagnostic techniques have converged [99,106]. Raman spectroscopy has been also widely used to characterized pitch and pitch-derived materials such as carbon fibers and foams to evaluate their disorder degree. Raman spectroscopy has also been demonstrated to be a powerful technique for coke microstructural properties analysis [107,108] and for following their structural modification after proper treatments to improve their properties for application purpose [109].
3.6. FTIR Spectroscopy
FTIR spectroscopy detects the vibrational motions characteristic of chemical functional groups in a specimen. Almost independently from the neighboring molecular structure, a chemical functional group absorbs infrared radiation in a specific wavenumber range, being the energy of light absorbed distinctive only of the chemical bond, whatever the sample. The interaction with the infrared radiation allows chemical bonds to stretch, contract, twist and bend in plane or out of plane. The infrared spectra of carbonaceous materials are characterized by three main absorption regions. In Figure 11 the infrared spectra of a petroleum pitch and an asphaltene are reported, showing in grey the most significant spectral regions for studying them. The bands peaked around 3000 cm−1 due to the stretching of the C–H bonds, being hydrogen bonded both to aromatic or aliphatic carbon. In the medium-frequency range, between 1600 and 1000 cm−1, mainly the absorption of the carbon skeleton occurs, resulting in a broad combination of peaks. A third group of bands is located between 600 and 1000 cm−1 and they are due to the aromatic C-H out of plane (OPLA) bending modes and to the long chain methyl C–H rock.
Important information on the structure and composition of organic carbons can be derived by a deep analysis of their C–H vibrational modes in the high frequency region, where methyl, methylene and methine stretches arise together with aromatic stretch, allowing to discriminate the presence of these different bonds [110]. The OPLA peaks occur at decreasing wavenumbers as the number of adjacent hydrogens located at the edge of polyaromatic systems increases [111]. A deep analysis of these peaks can give important information on the degree of substitution and condensation of aromatic systems.
FTIR spectroscopy is one among the most used techniques to identify the constituent compounds of petroleum heavy fractions. It has been used to evaluate the aromatic and aliphatic hydrogen content of asphaltenes [112] and also to evaluate the asphaltene content in petroleum crude oil [113,114]. It was also extensively used to determine the composition of pitches [115] and of their relative fractions or to follow changes in the pitch composition when, for instance, they were heated, treated with solvents [36,52,93,116,117] or oxidated [118]. FTIR spectroscopy has also provided useful insights in the characterization of compositional properties of complex materials such as coke, furnishing information on the distribution of the aliphatic functionalities [119]. Being the intensity of the signal proportional to the concentration of the absorber, i.e., the functional group, infrared spectroscopy can be used for some quantitative analyses.
Elemental analysis can directly measure the total hydrogen content in a specimen. However, more details on its structure can be derived quantifying the amount of aromatic and aliphatic hydrogen.
In this regard, each C-H stretching peak is characterized by different absorption strength. Ristein et al. [120] deconvoluted the C-H bond stretching region into its different absorption peaks and multiplied each of them by the relative absorption strength, derived from standard molecules. However, it was found that the absorption strength and position of methyl group depended even in simple molecules on the hybridization state of adjacent carbon atoms [120,121] not allowing the quantification of the hydrogen content.
Later on, Russo et al. [122] performed a systematic study of functional groups absorption features of several standard molecules, in terms of peak shape, position, width, intensity, and electronic configuration of their surrounding atoms. This allowed a method to develop for discriminating and quantifying the different kinds of aliphatic and aromatic hydrogen and also for evaluating aliphatic and aromatic carbon in complex carbonaceous materials as soot, pitch and asphaltene [36,52,93,123]. A detailed quantification and speciation of hydrogen content of the asphaltene and petroleum pitch, whose infrared spectra are showed in Figure 11, is reported elsewhere (see PP250 in [52,122] for asphaltene). It has been calculated that aliphatic hydrogen is 3.18 wt.% and 6.27 wt.% and aromatic hydrogen is 2.79 wt.% and 0.79 wt.% in the petroleum pitch and in the asphaltene sample, respectively.
It can be noticed that, in spite of the predominance in the spectra of aliphatic hydrogen (peaked at 2925 cm−1), aromatic hydrogen content contribute is not negligible. This is due to the much higher calibration factor (low response) of aromatic hydrogen in comparison to the different kind of aliphatic hydrogens.
4. Experimental Method for Investigating Thermochemical Conversion
An experimental method for investigating thermochemical conversion of solid and semi-solid refinery wastes is proposed based on the use of a thermobalance and lab scale reactors. The method is taken after Senneca et al. [22] and Urciuolo et al. [23] and consists of three activities described in Section 4.1–Section 4.3
4.1. Pretreatment and Physico-Chemical Characterization of the Solid
Prior to thermal processes a chemico-physical or mechanical pretreatment is necessary. When the sample is semi-solid and is stored in bottles, denser material deposits at the bottom. Prior to any analysis it is recommended to heat up the sample to the point that it becomes fluid enough to be stirred and homogenized. It is also recommended to soak samples in organic solvents or else to treat them under vacuum or at temperatures up to 150 °C in order to remove any deposited oily matter.
Char samples can be prepared in lab scale reactors of the fixed or fluidized bed type at temperature in the order of 600–800 °C under inert conditions. Ashes are produced after complete combustion in similar reactors generally above 800 °C.
- The fuel, char and the ash samples are analysed by proximate and ultimate analysis, Scanning Electron Microscope- Energy Dispersive X-Ray (SEM-EDX), Inductively coupled plasma (ICP), X-ray diffraction (XRD), in some cases also porosimetric analysis.
- In case of metal rich samples, it is interesting to understand the stability of these metals throughout thermochemical processes. It is useful to calculate partitioning factors according to the formula: , where and . are the concentration of the metal in the examined sample and in the raw material, while and . are the concentration of a reference tracer metal. In particular, Ni can be used as a tracer thanks to its good thermal stability. Partitioning factors below unity indicate a release of the given metals with volatile products, while partitioning factors close to unity indicate that the metal is retained in the solid.
4.2. Thermogravimetric Analysis (TGA)
TGA is the most popular lab scale technique used to study of pyrolysis, combustion and gasification of solid fuels. The potential of TGA is considerably enhanced when it is coupled with Differential Scanning Calorimetry (DSC) and with on line analysis of gas by FTIR and MS.
TGA measures the mass changes throughout an assigned heating program in a given atmosphere, and allows performing proximate analysis and kinetic studies. Evolved gas analysis (EGA) informs on the chemical composition of the gaseous products and DSC gives information on the endothermic/exothermic nature of the processes and reveals state and phase transitions within mineral matter and metals. The technique is not as simple as it may seem: heat and mass transfer limitations must be carefully avoided. To this end, it is recommended to use small amounts of sample (10–50 mg in a sample holder of 5 mm diameter) and small particle diameter (possibly in the order of 100 µm). An upward flow of gas in the order of 100–200 mL/min is suitable for most commercial equipments.
The proposed set of experiments includes pyrolysis under inert conditions; oxidative pyrolysis; char combustion and char gasification with CO2 and with H2O.
As far as the heating program is concerned, experiments can be of the isothermal (I-TG) and of non-isothermal (NI-TG) type. In pyrolysis experiments non isothermal approaches are to be preferred. In this case, after a dehumidification stage at 110 °C for 5–10 min, the sample is heated at a constant heating rate up to 800–900 °C and then held for 30 min in inert atmospheres (N2, He, Ar). In oxidative pyrolysis mixtures with 1–5% of oxygen are used. Heating rates should be limited to 1–10 K/min.
The mass versus time/temperature data are worked out to plot:
- TG curves, reporting the mass loss as a function of time/temperature,
- derivative thermogravimetry (DTG) curves, reporting derivative of the mass loss with respect to time,
- DSC profiles,
- Profiles of the main gaseous products evolved (by MS or FTIR).
Notably for a kinetic analysis campaign several tests at different heating rates are necessary. Assuming typical power law kinetic expressions, the kinetic parameters can be derived applying consolidated methods [124].
In experiments of char combustion or gasification both non isothermal and isothermal heating programs are commonly applied. The char sample is generally prepared in advance under inert conditions in an external reactor or in the TGA itself.
In isothermal thermogravimetric campaigns char is heated up to the desired reaction temperature in an inert gas flow with heating rate as fast as possible. When the desired reaction temperature is stably reached, the gas is switched from inert to reactive atmosphere (i.e., O2/N2, CO2/N2, H2O/N2 mixtures) and isothermal reaction takes place till a stable residual weight is obtained. In non- isothermal tests the char sample is heated up to typically 800–900 °C at constant heating rate (best between 1–10 K/min) in reactive atmosphere. In order to avoid mass and heat transfer limitation, besides keeping the particle size small enough, the heating rate or the reaction temperature must be kept low, using respectively non isothermal or isothermal methods.
The mass versus time data are worked out to calculate:
- the carbon conversion degree f = (mo − m)/(mo − m∞) where mo and m∞ are the sample’s mass at the beginning and at the end of the test (the residual ash) and m is the mass at any given time.
- the instantaneous rate of carbon conversion, df/dt, versus f,
- the reaction rate averaged over a given interval of conversion (often 50%) Rav,
- Arrhenius plots of ln(Rav) as a function of 1/T for a fixed value of reactant concentration,
- Plots of ln(Rav) as a function of ln(pg), where pg is the value of the partial pressure of the reactant (O2, CO2, or H2O).
These elaborations allow performing a standard kinetic analysis based on a simple power law expression of the type:
where E is the activation energy, R the gas law constant, T the temperature (expressed in K), n the reaction order with respect to the reactant concentration.
The function A(f) describes how reactivity evolves upon progressive consumption of the solid matrix and determines the trend of the instantaneous rate of carbo conversion, df/dt, versus f.
Different expressions for A(f) have been proposed in well known kinetic models [31,125,126,127,128,129], in particular:
A(f) = (1 − f) in the homogenous or Avrami model
A(f) = (1 − f)1−ψln(1 − f) in the Random Pore model (ψ being a parameter linked to the porous structure)
A(f) = (1 − f)2/3 in the Shrinking Core model
A(f) = (1 − f)m in the Hybrid model.
The experimental df/dt, versus f curve can be fitted by assuming any of the above functionalities for A(f), as done in A. Korus et al. [31] for Pet-Coke combustion and gasification, or else an empirical polynomial fit can be employed.
The values of E and preexponential factor can be obtained from linear regression over the Arrhenius plot. The reaction order is obtained from linear regression over the plot of ln(Rav) as a function of ln(pg).
Notably, kinetic analysis for char combustion and gasification by isothermal techniques requires a large number of experiments at different reactant concentration and different reaction temperatures.
Non isothermal thermogravimetric experiments are often used to obtain a rough estimate of the activation energy and preexponential factor of char combustion or gasification from one single experiment. In this case it is assumed A(f) = 1 − f, and n = 1 and the data points of mass loss are worked out to obtain an Arrhenius plot of ln(df/dt/((1 − f)/pg) as a function of 1/T.
Exemplary results of TGA analysis carried out on a PP, on a pet-coke and on a metal rich refinery residue are reported in Figure 12, Figure 13 and Figure 14 respectively.
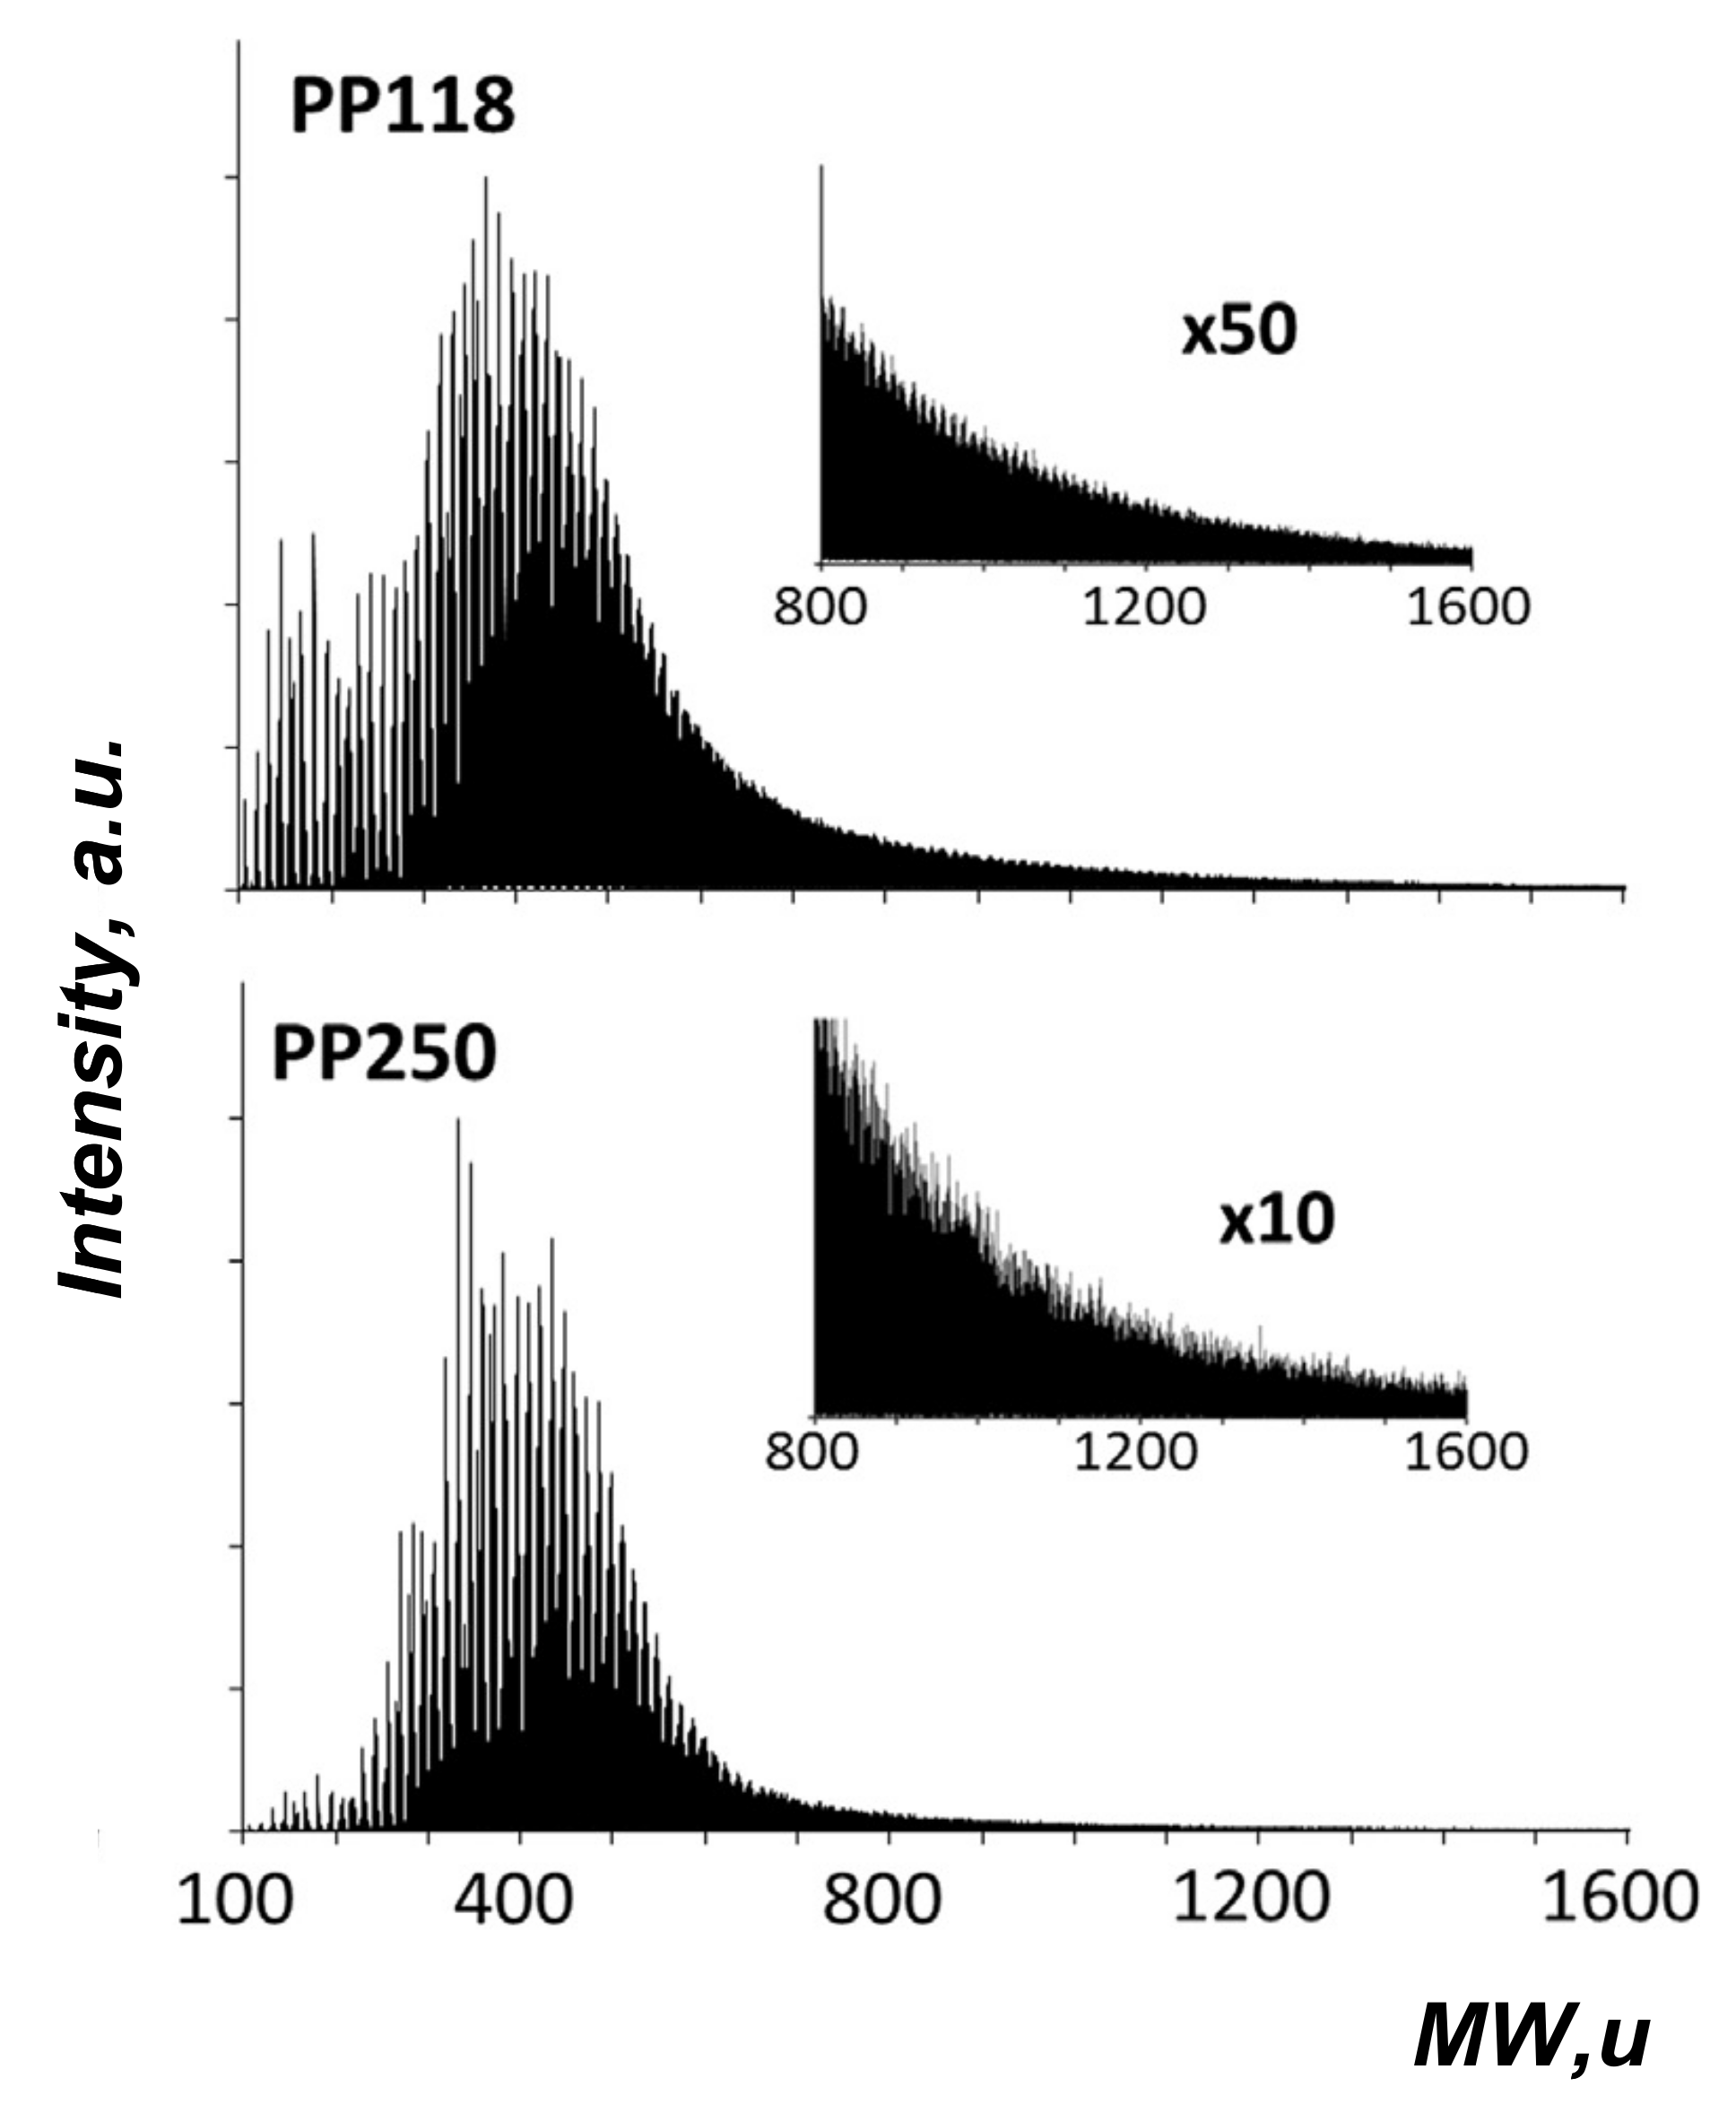
In the case of petroleum pitch (Figure 12) the NI-TG technique has been applied. Tests have been carried out in a Pyris TGA thermogravimetric analyzer, in either nitrogen, or air at constant heating rate (10 K/min in the example of Figure 12). It can be seen that in nitrogen petroleum pitch loses about 40% of its mass by pyrolysis between 200–500 °C (with a pronounced DTG pyrolysis peak at 300 °C circa) and an additional 10% at higher temperature. When petroleum pitch is heated up in air the same TG and DTG pattern is obtained up to 300 °C as in nitrogen, but a different behavior is observed at higher temperatures: between 300 and 500 °C the weight loss in air is lower than in nitrogen, suggesting that secondary pyrolysis is partly counterbalanced by oxygen uptake, due, for instance, to oxidation of metals and impurities present in the sample. Above 500 °C in air char combustion takes off, resulting in a marked combustion peak at 650 °C circa and in complete sample burn-off below 750 °C. It is possible to put the data points of the char combustion stage to obtain an Arrhenius plot. In the Arrhenius plot of Figure 12C, it has been assumed that the char combustion reaction is of first order with respect of oxygen concentration and that A(f) = 1 − f. In spite of these simplifications, the Arrhenius plot turns out to be linear and kinetic parameters can be estimated from its slope and intercept.
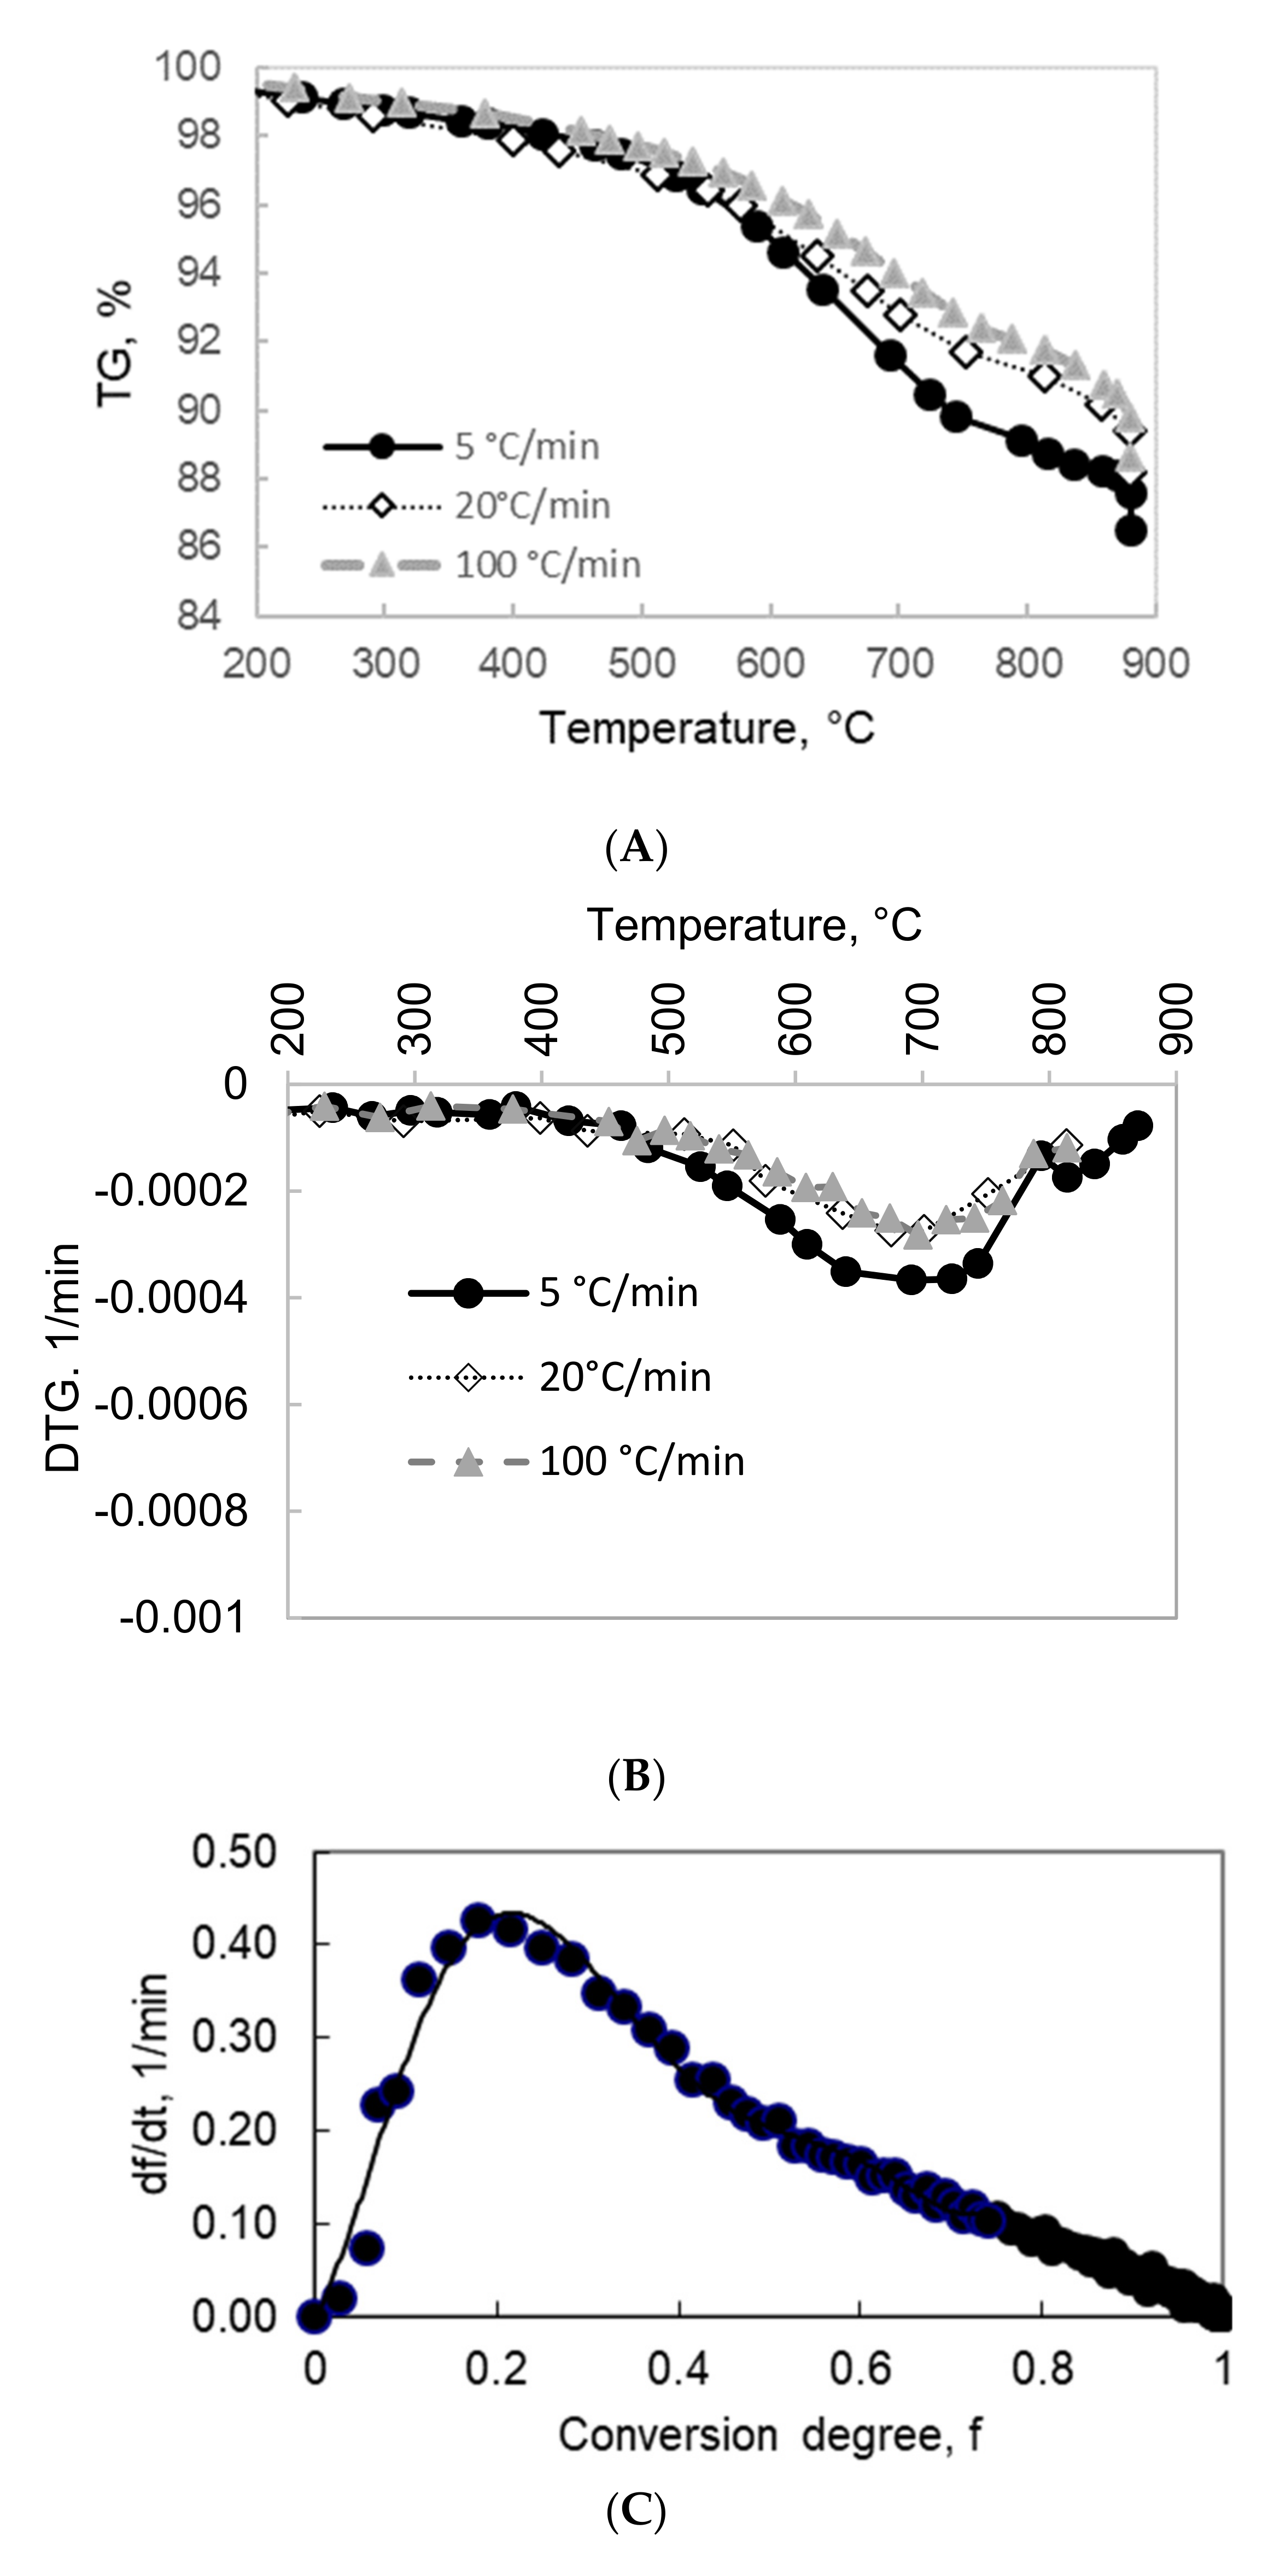
In the case of pet-coke (Figure 13), another experimental approach has been followed: NI-TG analysis was used to study pyrolysis in nitrogen, with heating rates between 5–100 K/min, while char combustion was investigated by I-TG tests in air at temperatures between 450 and 550 °C, after a pre-pyrolysis step in an external tubular furnace. All thermogravimetric tests were carried out in a Netzsch STA 409 CD TG/DSC apparatus. The TG and DTG curves of pet-coke pyrolysis in nitrogen are reported in Figure 13A and B, respectively, and show that pet-coke releases approximately 15 wt.% of volatile matter between 450 and 850 °C with a DTG pyrolysis peak at 700 °C circa. It can be noted also that the amount and the rate of volatile matter release from pet-coke are low compared to petroleum pitch (in Figure 12) as well as to medium rank coals, where DTG curves generally peak around 600 °C. The combustion reactivity of the pet-coke char is also low compared to chars from medium rank coals, while the trends of reactivity with burn-off are similar. Figure 13C reports, as an example, the isothermal conversion rate curve of pet-coke char in air at 530 °C, showing how also, for this sample, the very typical bell shape curve of coal chars’ combustion is obtained, with a maximum at conversion degree f = 0.3. The function A(f) has been obtained by regression of the curve using a polynomial fit (of 5th order in the example).
The last example, reported in Figure 14, concerns inert and oxidative pyrolysis of a solid byproduct of a hydro-catalytic cracker, particularly rich in Mo and V, which was thoroughly investigated by Senneca et al. [19]. A Netzsch STA 409 CD TG/DSC equipped with a special Skimmer device and a quadrupole MS Balzers QMG422 (0–300 u) was used for these experiments, with heating rate of 5 K/min in flows of He or O2/He mixtures.
Differences can be observed between TG curves (Figure 14) in inert and oxidative atmospheres: in the early stages of reaction the weight loss was more rapid in inert conditions than in presence of few percentages of oxygen, because the mass loss caused by devolatilization was partly compensated by the mass gain due to metals oxidation. Results of EGA during pyrolysis are also shown in Figure 14. The MS curves suggested a two-stage pyrolysis mechanism: at low temperature (150–300 °C) high MW species (M/e 81–180) were released together with alkanes and butene; in the second stage (350–800 °C) high MW disappear while hydrogen production is observed, due to dehydrogenation/aromatization and breakage of long chains.
4.3. Pyrolysis in Lab Scale Reactors
Fixed bed (horizontal or vertical) tubular reactors heated externally by electric furnaces can be used to perform experiments of inert and oxidative pyrolysis. Both non isothermal and nearly isothermal conditions can be pursued. In the first case the sample is placed inside the reactor and heated at relatively low heating rate (typically 5–50 K/min). In the second case the sample is fed into the reactor after this has reached the desired temperature (typically 600–900 °C). The appropriate inert or reactive gas flows throughout the experiment.
Notably fixed bed tubular reactor experiments are particularly valuable to estimate the yield in gas, liquid and solids upon pyrolysis and oxy-pyrolysis and to produce samples of char and ash. The outlet gas stream flows through a series of two or more bubblers held at low temperature to allow tar condensations (for example at 0 °C and −12 °C), while the gas is sent to on line analyzers, for example a micro-GC. This procedure allows estimating the composition of the gaseous products as a function of time/temperature. The tar cumulatively produced during the test and the solid residue recovered after cooling can be analysed off-line.
Other lab scale reactors, such as drop tube reactors, fluidized beds, wire mesh reactors, are used for fast pyrolysis experiments, but in these cases an accurate closure of mass balances, including solid, gaseous and liquid products is more complex than using fixed bed reactors, sometimes impossible.
Since solid refinery residues, in particular pet-coke, are often used as combustible in fluidized bed reactors, it is recommended to scrutinize the behaviour of the material under fluidization conditions using lab scale fluidized bed (FB) reactor of few cm diameters. In such experimental setups, single or few particles with size ranging from few mm to 1 cm are fed from the top of the reactor at a fixed temperature (500–900 °C). The reactor bed is typically constituted of inert material (e.g., Quarzite sand between 300–400 µm) and is fluidized by an upward flow of gas (O2/N2, CO2/N2 and H2O/N2 mixtures). The profiles of evolved gaseous products are acquired on line to monitor the progress of the reactions by FTIR, micro-GC, etc., while the solid product is collected at the end of the experiment.
The profiles of reaction products in the evolved gas allow monitoring the progress of the reaction. In Senneca et al. [22] the profiles of CO and CO2 evolved as a function of time have been worked out to evaluate average char combustion rate according to the following expressions:
where f is the carbon conversion degree [-], tR the reaction time [s], to the time when oxygen feed started [s], cCO, cCO2 the concentration of CO e CO2 [moL/L], Q the gas flow rate [L/s] and nCO the moles of carbon fed with the solid fuel [moL].
An example of the proposed experimental approach can be found in the papers of Senneca et al. [22] and Urciuolo et al. [23] where the authors investigated the possible utilization in fluidized bed combustion of a solid byproduct of a hydro-catalytic cracker particularly rich in Mo and V. A selection of the most interesting results obtained will be reported in the following paragraphs.
The refinery waste (RW) object of the investigation had a high value of fixed carbon (79%) and the High Heating Value (HHV) of 38 kJ/g was solid at room temperature but softened and melted upon mild heating and was very odorous, due to impregnation with heavy volatile matter (which could be partly removed by pentane leaching.) The char obtained by pyrolysis in a horizontal tubular reactor at 600 °C (Figure 15) appeared bright and swollen and the reactor walls covered by a reddish sticky material.
The ICP analysis of the samples of raw RW, of char and ash samples allowed inferring the fate of metals during pyrolysis and combustion. Upon pyrolysis up to 600 °C, Mo and V remained in the solid, in contrast to other metals such as Na, P, Zn and P which were partly released with volatiles. Under combustion conditions Mo was completely removed and lost with volatiles, and V is only partly retained in the ash.
Fluidized bed pyrolysis and combustion tests have been carried out between of 600–850 °C with nearly flat- square particles of RW. Single particles were loaded to the bed from the top. The profiles of gaseous products showed a first fast pyrolysis stage followed by relatively slow combustion. In fact, the heavy/tarry species formed in early pyrolysis stage and the metals contributed to the formation of large carbon-sand aggregates, hollow inside (Figure 16), and, as a consequence, the combustion rate in the fluidized bed resulted unexpectedly slow.
5. Conclusions
Turning crude oil into valuable products such as petroleum gases and transportation fuels such as gasoline and diesel involves a petroleum refining process, which unavoidably generates carbon enriched byproducts. These low-values byproducts generated from crude oil exploitation and production have been briefly described along with the most convenient analytical and experimental methods to characterize them in terms of structure and thermochemical value. The waste-to-energy concept has been introduced also in the refinery world to produce energy and valuable products from refinery byproducts.
Indeed, new usages of wastes from oil refinery have been envisioned to convert them into value-added materials/fuels; thus pet-coke, asphaltenes and pitch are now appealing raw materials for innovative exploration. The main aim of this brief review was to consider petroleum as a whole as a chemical feedstock, whose components can all be valorized.
As material precursors, a detailed structural analysis of these heavy petroleum fractions is fundamental to infer their chemical complexity and to control the properties of the desired final products. Molecular weight, aromaticity and chemical functionalities of pet-coke, asphaltenes and pitch have been shown to be key properties for guiding their processing toward value-added materials. In this review, mass spectrometry and size exclusion chromatography have been proposed as the most eligible techniques for their molecular weight determination, while Raman and FTIR spectroscopy have been described as particularly suitable to give information on aromaticity and chemical functionalities, respectively. As regards the molecular structure of asphaltenes, it can be concluded that on the basis of the different analytical techniques results, asphaltenes present a mass range between m/z 300–1100 with a maximum at m/z 500–600, compatible with a mixed aliphatic/aromatic nature. Their structure is constituted of relatively small aromatic moieties (4–20 fused aromatic rings), linked and/or substituted by aliphatic chains. The presence of an additional structure, so-called aryl-linked core structure, recently postulated, was demonstrated along with the “island” structure. The “archipelago” structure and the presence of a very high MW range (>20,000 u) cannot be excluded, even if it is not clear yet if these structures are aggregates of small polar molecules or very large molecules, as indicated also by SEC analysis. For the petroleum pitch sample, the presence of a wide array of large PAHs (with about eight aromatic rings) with short aliphatic side chains is hypothesized, as suggested by high hydrogen content. The MW range is a peak continuum without specific regular sequences peaked around m/z 250 and 500, respectively, suggesting the presence of monomeric and dimeric species. Moreover, for petroleum pitches, the presence of a high MW range, made of aggregate or macromolecules, cannot be ruled out, as indicated also in this case by SEC analysis. For coke, a solid and complex, hard-to-solubilized refinery waste product a detailed molecular characterization is not easy to perform.
Due to its higher heating value, carbon content, and low ash, pet-coke is considered a promising fuel in the energy sector. The need to investigate the thermochemical conversion behaviour of these new challenging fuels has been also stressed, presenting an experimental method for investigating solid and semi-solid wastes at the laboratory scale, with particular attention to the effects of residual metals, which are often abundant in refinery residues.
Author Contributions
The authors (B.A., C.R. and O.S.) have shared conceptualization, methodology, formal analysis, investigation, resources, writing—original draft preparation, writing—review and editing. All authors have read and agreed to the published version of the manuscript.
Funding
This research received no external funding.
Institutional Review Board Statement
Not applicable.
Informed Consent Statement
Not applicable.
Data Availability Statement
Not applicable.
Conflicts of Interest
The authors declare no conflict of interest.
References
- Demirbas, A.; Acar, S.; Horasan, B.Y.; Alalayah, W.M. Analysis of petcoke from low grade oily sludge of refinery. Pet. Sci. Technol. 2018, 36, 904–909. [Google Scholar] [CrossRef]
- Yankovsky, S.A.; Kuznetsov, G.V.; Tolokolnikov, A.A.; Cherednik, I.V.; Ivanov, A.A. Experimental study of the processes of reducing the formation of sulfur oxides during the co-combustion of particles of metalignitous coal and wood processing waste. Fuel 2021, 291, 120233. [Google Scholar] [CrossRef]
- Yankovsky, S.A.; Kuznetsov, G.V. Physicochemical Transformations of Mixed Fuels Based on Typical Coals and Wood upon Heating. Solid Fuel Chem. 2019, 53, 22–28. [Google Scholar] [CrossRef]
- Georgiopoulou, M.; Lyberatos, G. Life cycle assessment of the use of alternative fuels in cement kilns: A case study. J. Environ. Manag. 2018, 216, 224–234. [Google Scholar] [CrossRef]
- Oggioni, G.; Riccardi, R.; Toninelli, R. Eco-efficiency of the world cement industry: A data envelopment analysis. Energy Policy 2011, 39, 2842–2854. [Google Scholar] [CrossRef]
- Sarma, B.; Cramb, A.W.; Fruehan, R.J. Reduction of FeO in smelting slags by solid carbon: Experimental results. Metall. Mater. Trans. B 1996, 27, 717–730. [Google Scholar] [CrossRef]
- Zabaniotou, A.; Theofilou, C. Green energy at cement kiln in cyprus-use of sewage sludge as a conventional fuel substitute. Renew. Sustain. Energy Rev. 2008, 12, 531–541. [Google Scholar] [CrossRef]
- U.S. Energy Information Administration (EIA). Available online: https://www.eia.gov/dnav/pet/hist/LeafHandler.ashx?n=PET&s=MCKEXUS1&f=M (accessed on 2 April 2022).
- Ren, H.F.; Jin, B.S.; Zhong, Z.P.; Yang, Y.P.; Cai, S. Experimental research on combustion of petroleum coke mixed with coal powder. Ranshao Kexue Yu Jishu/J. Combust. Sci. Technol. 2004, 10, 554–558. [Google Scholar]
- Wang, J.; Anthony, E.J.; Abanades, J.C. Clean and efficient use of petroleum coke for combustion and power generation. Fuel 2004, 83, 1341–1348. [Google Scholar] [CrossRef]
- Mi, T.; Wu, Z.S.; Shen, B.X.; Chen, H.P.; Liu, D.C. An experimental study of combustion characteristics of petroleum coke. Dev. Chem. Eng. Miner. Processing 2002, 10, 601–614. [Google Scholar] [CrossRef]
- Shpirt, M.Y.; Goryunova, N.P.; Zekel, L.A.; Golovin, G.S.; Kovil, R.Z. Vanadium compounds in petroleum coke and coke gasification and combustion products. Khimiya Tverdogo Topliva 1998, 2, 87–92. [Google Scholar]
- Legros, R.; Lim, C.J.; Brereton, C.M.H.; Grace, J.R. Circulating fluidized bed combustion of pitches derived from heavy oil upgrading. Fuel 1991, 70, 1465–1471. [Google Scholar] [CrossRef]
- Murugan, P.; Mahinpey, N.; Mani, T. Thermal cracking and combustion kinetics of asphaltenes derived from Fosterton oil. Fuel Process. Technol. 2009, 90, 1286–1291. [Google Scholar] [CrossRef]
- Benbouzid, M.; Hafsia, S. Thermal and kinetic analyses of pure and oxidized bitumens. Fuel 2008, 87, 1585–1590. [Google Scholar] [CrossRef]
- Yang, X.; Gates, I.D. Combustion Kinetics of Athabasca Bitumen from 1D Combustion Tube Experiments. J. Nat. Resour. Res. 2009, 18, 193–211. [Google Scholar] [CrossRef]
- Fermoso, J.; Arias, B.; Plaza, M.G.; Pevida, C.; Rubiera, F.; Pis, J.J.; Garcia-Pena, F.; Casero, P. High-pressure co-gasification of coal with biomass and petcoke. Fuel Process. Technol. 2009, 90, 926–932. [Google Scholar] [CrossRef] [Green Version]
- Moreno, T.; Querol, X.; Alastuey, A.; de la Rosa, J.; Sánchez de la Campa, A.M.; Minguillón, M.; Gibbons, W. Variations in vanadium, nickel and lanthanoid element concentrations in urban air. Sci. Total Environ. 2010, 408, 4569–4579. [Google Scholar] [CrossRef]
- Banik, S.; Pisupati, S.V. Effects of pressure and CO concentration on vanadium, nickel and iron phase transformations for petcoke slag viscosity correlation development. Fuel 2019, 253, 238–248. [Google Scholar] [CrossRef]
- Li, W.; Wang, B.; Nie, J.; Yang, W.; Xu, L.; Sun, L. Migration and transformation of vanadium and nickel in high sulfur petcoke during gasification processes. Energies 2018, 11, 2158. [Google Scholar] [CrossRef] [Green Version]
- Jaygopal, J.; Palappan, K.G.; Lakshminarasimhan, M.; Rajavel, M.; Suresh, S. Experimental investigations of vanadium and nickel distribution while firing petcoke in a circulating fluidised bed test facility. Int. J. Oil Gas Coal Technol. 2019, 20, 81–96. [Google Scholar] [CrossRef]
- Senneca, O.; Chirone, R.; Cortese, L.; Salatino, P. Pyrolysis and combustion of a solid refinery waste. Fuel 2020, 267, 117258. [Google Scholar] [CrossRef]
- Urciuolo, M.; Solimene, R.; Ammendola, P.; Krusch, S.; Scherer, P.; Chirone, R.; Senneca, O. On the agglomeration tendency of carbonaceous fuels in fluidized beds. Fuel 2020, 277, 118187. [Google Scholar] [CrossRef]
- Tripathi, N.; Singh, R.S.; Hills, C.D. Microbial removal of sulphur from petcoke (petcoke). Fuel 2019, 235, 1501–1505. [Google Scholar] [CrossRef]
- Agarwal, P.; Sharma, D.K. Studies on the Desulfurization of Petcoke by Organorefining and Other Chemical and Biochemical Techniques under Milder Ambient Pressure Conditions. Pet. Sci. Technol. 2011, 29, 1482–1493. [Google Scholar] [CrossRef]
- Al-Haj-Ibrahim, H.; Morsi, B.I. Desulfurization of Petcoke: A Review. Ind. Eng. Chem. Res. 1992, 31, 1835–1840. [Google Scholar] [CrossRef]
- Ba, Z.; Zhao, J.; Li, C.; Huang, J.; Fang, Y.; Zhang, L.; Wang, Q. Developing efficient gasification technology for high-sulfur petcoke to hydrogen-rich syngas production. Fuel 2020, 267, 117170. [Google Scholar] [CrossRef]
- Okeke, I.J.; Adams, T.A. Combining petcoke and natural gas for efficient liquid fuels production. Energy 2018, 163, 426–442. [Google Scholar] [CrossRef]
- Al-Zareer, M.; Dincer, I.; Rosen, M.A. Production of hydrogen-rich syngas from novel processes for gasification of petcokes and coals. Int. J. Hydrogen Energy 2020, 45, 1577–11592. [Google Scholar] [CrossRef]
- Salatino, P.; Senneca, O. Plant and Process for the Looping Combustion of Solid Carbon Containing. Fuels. Patent WO 2010/026259, 11 March 2010. [Google Scholar]
- Korus, A.; Klimanek, A.; Sładek, S.; Szlęk, A.; Tilland, A.; Bertholin, S.; Haugen, N.E.L. Kinetic parameters of petroleum coke gasification for modelling chemical-looping combustion systems. Energy 2021, 232, 120935. [Google Scholar] [CrossRef]
- Cerciello, F.; Coppola, A.; Lacovig, P.; Senneca, O.; Salatino, P. Characterization of surface-oxides on char under periodically changing oxidation/desorption conditions. Renew. Sustain. Energy Rev. 2021, 137, 110453. [Google Scholar] [CrossRef]
- Cerciello, F.; Senneca, O.; Coppola, A.; Lacovig, P.; Salatino, P. The influence of temperature on the nature and stability of surface-oxides formed by oxidation of char. Renew. Sustain. Energy Rev. 2021, 137, 110595. [Google Scholar] [CrossRef]
- Apicella, B.; Russo, C.; Di Blasi, A.; Mennella, V.; Senneca, O.; Cerciello, F.; Ciajolo, A. Nano-restructuration of carbon materials under high temperature heat treatment for environmental application and energy storage. Chem. Eng. Trans. 2019, 73, 91–96. [Google Scholar]
- Fu, M.; Ehrat, F.; Wang, Y.; Milowska, K.Z.; Reckmeier, C.; Rogach, A.L.; Stolarczyk, J.K.; Urban, A.S.; Feldmann, J. Carbon Dots: A Unique Fluorescent Cocktail of Polycyclic Aromatic Hydrocarbons. Nano Lett. 2015, 15, 6030–6035. [Google Scholar] [CrossRef]
- Gargiulo, V.; Apicella, B.; Stanzione, F.; Tregrossi, A.; Millan, M.; Ciajolo, A.; Russo, C. Structural Characterization of Large Polycyclic Aromatic Hydrocarbons. Part 2: Solvent-Separated Fractions of Coal Tar Pitch and Naphthalene-Derived Pitch. Energy Fuels 2016, 30, 2574–2583. [Google Scholar] [CrossRef]
- Li, Y.; Shi, Y.; Song, X.; Zhao, Z.; Zhang, N.; Hao, C. Pitch-derived carbon quantum dots as fluorescent probe for selective and sensitive detection of ferric ions and bioimaging. J. Photochem. Photobiol. A Chem. 2021, 412, 113253. [Google Scholar] [CrossRef]
- Zhao, P.; Yang, M.; Fan, W.; Wang, X.; Tang, F.; Yang, C.; Dou, X.; Li, S.; Wang, Y.; Cao, Y. Facile One-Pot Conversion of Petroleum Asphaltene to High Quality Green Fluorescent Graphene Quantum Dots and Their Application in Cell Imaging. Part. Part. Syst. Charact. 2016, 33, 635–644. [Google Scholar] [CrossRef]
- Apicella, B.; Pré, P.; Rouzaud, J.N.; Abrahamson, J.; Vander Wal, R.L.; Ciajolo, A.; Tregrossi, A.; Russo, C. Laser-induced structural modifications of differently aged soot investigated by HRTEM. Combust. Flame 2019, 204, 13–22. [Google Scholar] [CrossRef]
- Wen, C.S.; Chilingarian, G.; Yen, T.F. Properties and structure of bitumens. In Bitumens, Asphalts and Tar Sands; Elsevier: Amsterdam, The Netherlands, 1978; Volume 7, pp. 155–190. [Google Scholar]
- Mullins, O.C.; Sheu, E.Y. (Eds.) Structures and Dynamics of Asphaltenes; Springer Science & Business Media: New York, NY, USA, 2013. [Google Scholar]
- Mullins, O.C.; Sheu, E.Y.; Hammami, A.; Marshall, A.G. Asphaltenes, Heavy Oils, and Petroleomics; Springer Science and Business Media: New York, NY, USA, 2007. [Google Scholar]
- Yen, T.F.; Chilingarian, G.V. Asphaltenes and Asphalts, 2: Part B; Elsevier: Amsterdam, The Netherlands, 2000. [Google Scholar]
- Speight, J.G. Petroleum Asphaltenes—Part 1: Asphaltenes, Resins and the Structure of Petroleum. Oil Gas Sci. Technol. 2004, 59, 467–477. [Google Scholar] [CrossRef] [Green Version]
- Mullins, O.C.; Martinez-Haya, B.; Marshall, A.G. Contrasting perspective on asphaltene molecular weight. Energy Fuels 2008, 22, 1765–1773. [Google Scholar] [CrossRef]
- Badre, S.; Carla Goncalves, C.; Norinaga, K.; Gustavson, G.; Mullins, O.C. Molecular size and weight of asphaltene and asphaltene solubility fractions fromcoals, crude oils and bitumen. Fuel 2006, 85, 1–11. [Google Scholar] [CrossRef]
- Kokal, S.L.; Selim, G.S. Asphaltenes: The Cholesterol of Petroleum. In Proceedings of the Middle East Oil Show, Manama, Bahrain, 11–14 March 1995. [Google Scholar] [CrossRef]
- Herod, A.A.; Bartle, K.D.; Kandiyoti, R. Comment on a paper by Mullins, Martinez-Haya and Marshall “Contrasting perspective on asphaltene molecular weight. This comment vs the overview of Herod, A.A., Bartle, K.D. and Kandiyoti, R”. Energy Fuels 2008, 22, 4312–4317. [Google Scholar] [CrossRef]
- Schuler, B.; Zhang, Y.; Liu, F.; Pomerantz, A.E.; Andrews, A.B.; Gross, L.; Pauchard, V.; Banerjee, S.; Mullins, O.C. Overview of asphaltene nanostructures and thermodynamic applications. Energy Fuels 2020, 34, 15082–15105. [Google Scholar] [CrossRef]
- Greinke, R.A. Kinetics of petroleum pitch polymerization by gel permeation chromatography. Carbon 1986, 24, 677–686. [Google Scholar] [CrossRef]
- Edwards, W.F.; Jin, L.; Thies, M.C. MALDI-TOF mass spectrometry: Obtaining reliable mass spectra for insoluble carbonaceous pitches. Carbon 2003, 41, 2761–2768. [Google Scholar] [CrossRef]
- Russo, C.; Ciajolo, A.; Stanzione, F.; Tregrossi, A.; Oliano, M.M.; Carpentieri, A.; Apicella, B. Investigation on chemical and structural properties of coal- and petroleum-derived pitches and implications on physico-chemical properties (solubility, softening and coking). Fuel 2019, 245, 478–487. [Google Scholar] [CrossRef]
- Marsh, H.; Cornford, C. Mesophase: The precursor to graphitizable carbon. In Petroleum Derived Carbons; American Chemical Society: Colombia, WA, USA, 1976; pp. 266–280. [Google Scholar]
- Edie, D.D. The effect of processing on the structure and properties of carbon fibers. Carbon 1998, 36, 345–362. [Google Scholar] [CrossRef]
- Beauharnois, M.E.; Edie, D.D.; Thies, M.C. Carbon fibers from mixtures of AR and supercritically extracted mesophases. Carbon 2001, 39, 2101–2111. [Google Scholar] [CrossRef]
- Wagner, M.H.; Jäger, H.; Letizia, I.; Wilhelmi, G. Quality assessment of binder pitches for carbon and graphite electrodes. Fuel 1988, 67, 792–797. [Google Scholar] [CrossRef]
- Ozel, M.Z.; Bartle, K.D. Production of Mesophase Pitch from Coal Tar and Petroleum Pitches using Supercritical Fluid Extraction. Turk. J. Chem. 2002, 26, 417–424. [Google Scholar]
- Chwastiak, S.; Lewis, I.C. Solubility of Mesophase Pitch. Carbon 1978, 16, 156–157. [Google Scholar] [CrossRef]
- Gross, J.H. Mass Spectrometry: A Textbook; Springer Science & Business Media: Berlin/Heidelberg, Germany, 2006. [Google Scholar]
- Cotter, R.J. Time-of-Flight Mass Spectrometry; ACS Professional Reference Books; American Chemical Society: Colombia, WA, USA, 1997. [Google Scholar]
- Awad, H.; Khamis, M.M.; El-Aneed, A. Mass spectrometry, review of the basics: Ionization. Appl. Spectrosc. Rev. 2015, 50, 158–175. [Google Scholar] [CrossRef]
- Vastola, F.J.; Mumma, R.O.; Pirone, A.J. Analysis of organic salts by laser ionization. Org. Mass Spectrom. 1979, 3, 101–104. [Google Scholar] [CrossRef]
- Karas, M.; Hillenkamp, F. Laser desorption ionization of proteins with molecular masses exceeding 10,000 daltons. Anal. Chem. 1988, 60, 2299–2301. [Google Scholar] [CrossRef]
- Apicella, B.; Carpentieri, A.; Alfè, M.; Barbella, R.; Tregrossi, A.; Pucci, P.; Ciajolo, A. Mass spectrometric analysis of large PAH in a fuel-rich ethylene flame. Proc. Combust. Inst. 2007, 31, 547–553. [Google Scholar] [CrossRef]
- Rizzi, A.; Cosmina, P.; Flego, C.; Montanari, L.; Seraglia, R.; Traldi, P. Laser desorption/ionization techniques in the characterization of high molecular weight oil fractions Part 1. Asphaltenes. J. Mass Spectrom. 2006, 41, 1232–1237. [Google Scholar] [CrossRef]
- Comisarow, M.B.; Marshall, A.G. Fourier Transform Ion Cyclotron Resonance Spectroscopy. Chem. Phys. Lett. 1974, 25, 282–283. [Google Scholar] [CrossRef]
- Robb, D.B.; Covey, T.R.; Bruins, A.P. Atmospheric pressure photoionization: An ionization method for liquid chromatography-mass spectrometry. Anal. Chem. 2000, 72, 3653–3659. [Google Scholar] [CrossRef] [PubMed]
- Mullins, O.C. The Asphaltenes. Annu. Rev. Anal. Chem. 2011, 4, 393–418. [Google Scholar] [CrossRef] [PubMed]
- Acevedo, S.; Gutierrez, L.B.; Negrin, G.; Pereira, J.C.; Mendez, B.; Delolme, F.; Dessalces, G.; Broseta, D. Molecular weight of petroleum asphaltenes: A comparison between mass spectrometry and vapor pressure osmometry. Energy Fuels 2005, 19, 1548–1560. [Google Scholar] [CrossRef]
- Al-Muhareb, E.; Morgan, T.J.; Herod, A.A.; Kandiyoti, R. Characterization of petroleum asphaltenes by size exclusion chromatography, UV-fluorescence and mass spectrometry. Pet. Sci. Technol. 2007, 25, 81–91. [Google Scholar] [CrossRef]
- Hortal, A.R.; Martinez-Haya, B.; Lobato, M.D.; Pedrosa, J.M.; Lago, S. On the determination of molecular weight distributions of asphaltenes and their aggregates in laser desorption ionization experiments. J. Mass Spectrom. 2006, 41, 960–968. [Google Scholar] [CrossRef] [PubMed]
- Tanaka, R.; Sato, S.; Takanohashi, T.; Hunt, J.E.; Winans, R.E. Analysis of the molecular weight distribution of petroleum asphaltenes using laser desorption-mass spectrometry. Energy Fuels 2004, 18, 1405–1413. [Google Scholar] [CrossRef]
- Apicella, B.; Ciajolo, A.; Carpentieri, A.; Popa, C.; Russo, C. Characterization Techniques Coupled with Mathematical Tools for Deepening Asphaltene Structure. Fuels 2022, 3, 75–84. [Google Scholar] [CrossRef]
- Groenzin, H.; Mullins, O.C. Asphaltenes molecular size and structure. J. Phys. Chem. A 1999, 103, 11237. [Google Scholar] [CrossRef]
- Groenzin, H.; Mullins, O.C. Molecular size and structure of asphaltenes from various sources. Energy Fuels 2000, 14, 677–684. [Google Scholar] [CrossRef]
- Pomerantz, A.E.; Hammond, M.R.; Morrow, A.L.; Mullins, O.C.; Zare, R.N. Two-step laser mass spectrometry of asphaltenes. J. Am. Chem. Soc. 2008, 130, 7216. [Google Scholar] [CrossRef] [PubMed]
- McKenna, A.M.; Marshall, A.G.; Rodgers, R.P. Heavy Petroleum Composition. 4. Asphaltene Compositional Space. Energy Fuels 2013, 27, 1257–1267. [Google Scholar] [CrossRef]
- Apicella, B.; Alfè, M.; Ciajolo, A. Mass Spectrometric Advances in the Analysis of Large Aromatic Fractions of Heavy Fuel Oils and Carbon Particulates. Combust. Sci. Technol. 2010, 182, 640–652. [Google Scholar] [CrossRef]
- Apicella, B.; Alfè, M.; Amoresano, A.; Galano, E.; Ciajolo, A. Advantages and limitations of Laser desorption/ionization Mass Spectrometric techniques in the chemical characterization of complex carbonaceous materials. Int. J. Mass Spectrom. 2010, 295, 98–102. [Google Scholar] [CrossRef]
- Hortal, A.R.; Hurtado, P.; Martinez-Haya, B.M.; Mullins, O.C. Molecular-weight distributions of coal and petroleum asphaltenes from laser desorption/ionization experiments. Energy Fuels 2007, 21, 2863–2868. [Google Scholar] [CrossRef]
- Merdrignac, I.; Espinat, D. Physicochemical characterization of petroleum fractions: The state of the art. Oil Gas Sci. Technol.–Rev. IFP 2007, 62, 7–32. [Google Scholar] [CrossRef]
- Islas, C.A.; Suelves, I.; Millan, M.; Apicella, B.; Herod, A.A.; Kandiyoti, R. Matching average masses of pitch fractions of narrow polydispersity, derived from matrix-assisted laser desorption ionisation time-of-flight mass spectrometry, with the polystyrene calibration of SEC. J. Sep. Sci. 2003, 26, 1422–1428. [Google Scholar] [CrossRef]
- Karaka, F.; Islas, C.A.; Millan, M.; Behrouzi, M.; Morgan, T.J.; Herod, A.A.; Kandiyoti, R. The calibration of size exclusion chromatography columns: Molecular mass distributions of heavy hydrocarbon liquids. Energy Fuels 2004, 18, 778–788. [Google Scholar] [CrossRef]
- Schuler, B.; Meyer, G.; Peña, D.; Mullins, O.C.; Gross, L. Unraveling the Molecular Structures of Asphaltenes by Atomic Force Microscopy. J. Am. Chem. Soc. 2015, 137, 9870–9876. [Google Scholar] [CrossRef]
- Cristadoro, A.; Kulkarni, S.U.; Burgess, W.A.; Cervo, E.G.; Räder, H.J.; Müllen, K.; Bruce, D.A.; Thies, M.C. Structural characterization of the oligomeric constituents of petroleum pitches. Carbon 2009, 47, 2358–2370. [Google Scholar] [CrossRef]
- Burgess, W.A.; Pittman, J.J.; Marcus, R.K.; Thies, M.C. Structural identification of the monomeric constituents of petroleum pitch. Energy Fuels 2010, 24, 4301–4311. [Google Scholar] [CrossRef]
- Zhang, W.; Andersson, J.T.; Rader, H.J.; Mullen, K. Molecular characterization of large polycyclic aromatic hydrocarbons in solid petroleum pitch and coal tar pitch by high resolution MALDI ToF MS and insights from ion mobility separation. Carbon 2015, 95, 672–680. [Google Scholar] [CrossRef]
- Sadao, M.; Barth, H.G. Size Exclusion Chromatography; Springer Science & Business Media: Berlin/Heidelberg, Germany, 2013. [Google Scholar]
- Kandiyoti, R.; Herod, A.; Bartle, K.D.; Morgan, T.J. Solid Fuels and Heavy Hydrocarbon Liquids: Thermal Characterization and Analysis; Elsevier: Amsterdam, The Netherlands, 2016. [Google Scholar]
- Herod, A.A.; Bartle, K.D.; Kandiyoti, R. Characterization of heavy hydrocarbons by chromatographic and mass spectrometric methods: An overview. Energy Fuels 2007, 21, 2176–2203. [Google Scholar] [CrossRef]
- Morgan, T.J.; Georg, A.; Alvarez, P.; Herod, A.A.; Millan, M.; Kandiyoti, R. Isolation of size exclusion chromatography elution-fractions of coal and petroleum-derived samples and analysis by laser desorption mass spectrometry. Energy Fuels 2009, 23, 6003–6014. [Google Scholar] [CrossRef]
- Karaca, F.; Morgan, T.J.; George, A.; Bull, I.D.; Herod, A.A.; Millan, M.; Kandiyoti, R. Molecular mass ranges of coal tar pitch fractions by mass spectrometry and size-exclusion chromatography. Rapid Commun. Mass Spectrom. 2009, 23, 2087–2098. [Google Scholar] [CrossRef]
- Gargiulo, V.; Apicella, B.; Alfè, M.; Russo, C.; Stanzione, F.; Tregrossi, A.; Amoresano, A.; Millan, M.; Ciajolo, A. Structural Characterization of Large Polycyclic Aromatic Hydrocarbons. Part 1: The Case of Coal Tar Pitch and Naphthalene-Derived Pitch. Energy Fuels 2015, 29, 5714–5722. [Google Scholar] [CrossRef]
- Apicella, B.; Barbella, R.; Ciajolo, A.; Tregrossi, A. Comparative analysis of the structure of carbon materials relevant in combustion. Chemosphere 2003, 51, 1063–1069. [Google Scholar] [CrossRef]
- Ferrari, A.C.; Robertson, J. Interpretation of Raman spectra of disordered and amorphous carbon. Phys. Rev. B 2000, 61, 14095. [Google Scholar] [CrossRef] [Green Version]
- Ferrari, A.C.; Robertson, J. Resonant Raman spectroscopy of disordered, amorphous, and diamondlike carbon. Phys. Rev. B 2001, 64, 075414. [Google Scholar] [CrossRef] [Green Version]
- Tuinstra, F.; Koenig, J.L. Raman Spectrum of Graphite. J. Chem. Phys. 1970, 53, 1126. [Google Scholar] [CrossRef] [Green Version]
- Robertson, J. Diamond-like amorphous carbon. Mater. Sci. Eng. R 2002, 37, 129–281. [Google Scholar] [CrossRef] [Green Version]
- Bouhadda, Y.; Bormann, D.; Sheu, E.; Bendedouch, D.; Krallafa, A.; Daaou, M. Characterization of Algerian Hassi-Messaoud asphaltene structure using Raman spectrometry and X-ray diffraction. Fuel 2007, 86, 1855–1864. [Google Scholar] [CrossRef]
- Dumont, M.; Chollon, G.; Dourges, M.A.; Pailler, R.; Bourrat, X.; Naslain, R.; Bruneel, J.L.; Couzi, M. Chemical, microstructural and thermal analyses of a naphthalene-derived mesophase pitch. Carbon 2002, 40, 1475–1486. [Google Scholar] [CrossRef]
- Ferrari, A.C.; Robertson, J. Origin of the 1150−cm−1 Raman mode in nanocrystalline diamond. Phys. Rev. B 2001, 63, 121405. [Google Scholar] [CrossRef]
- Mallet-Ladeira, P.; Puech, P.; Weisbecker, P.; Vignoles, G.L.; Monthioux, M. Behavior of Raman D band for pyrocarbons with crystallite size in the 2–5 nm range. Appl. Phys. A 2014, 114, 759–763. [Google Scholar] [CrossRef]
- Puech, P.; Plewa, J.M.; Mallet-Ladeira, P.; Monthioux, M. Spatial confinement model applied to phonons in disordered graphene-based carbons. Carbon 2016, 105, 275–281. [Google Scholar] [CrossRef]
- Casiraghi, C.; Piazza, F.; Ferrari, A.C.; Grambole, D.; Robertson, J. Bonding in hydrogenated diamond-like carbon by Raman spectroscopy. Diam. Relat. Mater. 2005, 14, 1098–1102. [Google Scholar] [CrossRef]
- Buijnsters, J.G.; Gago, R.; Jiḿnez, I.; Camero, M.; Agulló-Rueda, F.; Gómez-Aleixandre, C. Hydrogen quantification in hydrogenated amorphous carbon films by infrared, Raman, and X-ray absorption near edge spectroscopies. J. Appl. Phys. 2009, 105, 093510. [Google Scholar] [CrossRef] [Green Version]
- Riedeman, J.S.; Kadasala, N.R.; Wei, A.; Kenttämaa, H.I. Characterization of Asphaltene Deposits by Using Mass Spectrometry and Raman Spectroscopy. Energy Fuels 2016, 30, 805–809. [Google Scholar] [CrossRef]
- Öner, F.O.; Yürüm, A.; Yürüma, Y. Structural characterization of semicokes produced from the pyrolysis of petroleum pitches. J. Anal. Appl. Pyrolysis 2015, 111, 15–26. [Google Scholar] [CrossRef] [Green Version]
- Chen, K.; Zhang, H.; Ibrahim, U.K.; Xue, W.; Liu, H.; Guo, A. The quantitative assessment of coke morphology based on the Raman spectroscopic characterization of serial petcokes. Fuel 2019, 246, 60–68. [Google Scholar] [CrossRef]
- Kostecki, R.; Tran, T.; Song, X.; Kinoshita, K.; McLarnon, F. Raman Spectroscopy and Electron Microscopy of Heat-Treated Petcokes for Lithium-Intercalation Electrodes. J. Electrochem. Soc. 1997, 144, 3111. [Google Scholar] [CrossRef]
- Dischler, B.; Bubenzer, A.; Koidl, P. Bonding in hydrogenated hard carbon studied by optical spectroscopy. Solid State Comun. 1983, 48, 105–108. [Google Scholar] [CrossRef]
- Centrone, A.; Brambilla, L.; Renouard, T.; Gherghel, L.; Mathis, C.; Mullen, K.; Zerbi, G. Structure of new carbonaceous material. The role of vibrational spectroscopy. Carbon 2005, 43, 1593–1609. [Google Scholar] [CrossRef]
- Calemma, V.; Iwanski, P.; Nali, M.; Scotti, R.; Montanari, L. Structural Characterization of Asphaltenes of Different Origins. Energy Fuels 1995, 9, 225–230. [Google Scholar] [CrossRef]
- Wilt, B.K.; Welch, W.T. Determination of Asphaltenes in Petroleum Crude Oils by Fourier Transform Infrared Spectroscopy. Energy Fuels 1998, 12, 1008–1012. [Google Scholar] [CrossRef]
- Aske, N.; Kallevik, H.; Sjoblom, J. Determination of Saturate, Aromatic, Resin, and Asphaltenic (SARA) Components in Crude Oils by Means of Infrared and Near-Infrared Spectroscopy. Energy Fuels 2001, 15, 1304–1312. [Google Scholar] [CrossRef]
- Guillén, M.D.; Iglesias, M.J.; Domínguez, A.; Blanco, C.G. Fourier transform infrared study of coal tar pitches. Fuel 1995, 74, 1595–1598. [Google Scholar] [CrossRef]
- Guillén, M.D.; Iglesias, M.J.; Domínguez, A.; Blanco, C.G. Semiquantitative FTIR Analysis of a Coal Tar Pitch and Its Extracts and Residues in Several Organic Solvents. Energy Fuels 1992, 6, 518–525. [Google Scholar] [CrossRef]
- Alcañiz-Monge, J.; Cazorla-Amorós, D.; Linares-Solano, A. Characterisation of coal tar pitches by thermal analysis, infrared spectroscopy and solvent fractionation. Fuel 2001, 80, 41–48. [Google Scholar] [CrossRef]
- Tzeng, S.S.; Pan, J.H. Oxidative stabilization of petroleum pitch at high pressure and its effects on the microstructure and carbon yield after carbonization/graphitization. Mater. Chem. Phys. 2002, 74, 214–221. [Google Scholar] [CrossRef]
- Menendez, J.A.; Pis, J.J.; Alvarez, R.; Barriocanal, C.; Canga, C.S.; Diez, M.A. Characterization of Petcoke as an Additive in Metallurgical Cokemaking. Influence on Metallurgical Coke Quality. Energy Fuels 1997, 11, 379–384. [Google Scholar] [CrossRef]
- Ristein, J.; Stief, R.T.; Ley, L.; Beyer, W. A comparative analysis of a-C:H by infrared spectroscopy and mass selected thermal effusion. J. Appl. Phys. 1998, 84, 3836–3847. [Google Scholar] [CrossRef]
- Jacob, W.; Unger, M. Experimental determination of the absorption strength of C–H vibrations for infrared analysis of hydrogenated carbon films. Appl. Phys. Lett. 1996, 68, 475–477. [Google Scholar] [CrossRef]
- Russo, C.; Stanzione, F.; Tregrossi, A.; Ciajolo, A. Infrared spectroscopy of some carbon based materials relevant in combustion: Qualitative and quantitative analysis of hydrogen. Carbon 2014, 74, 127–138. [Google Scholar] [CrossRef]
- Russo, C.; Tregrossi, A.; Ciajolo, A. Dehydrogenation and growth of soot in premixed flames. Proc. Comb. Inst. 2015, 35, 1803–1809. [Google Scholar] [CrossRef]
- Vyazovkin, S.; Burnham, A.K.; Criado, J.M.; Pérez-Maqueda, L.A.; Popescu, C.; Sbirrazzuoli, N. ICTAC Kinetics Committee recommendations for performing kinetic computations on thermal analysis data. Thermochim. Acta 2011, 520, 1–19. [Google Scholar] [CrossRef]
- Gartner, J.K.; Garcia-Perez, M.; Van Wie, B.J. Investigation of biomass char gasification kinetic parameters using a novel miniaturized educational system. BioResources 2019, 14, 3594–3614. [Google Scholar]
- Everson, R.C.; Neomagus, H.W.J.P.; Kaitano, R. The random pore model with intraparticle diffusion for the description of combustion of char particles derived from mineral- and inertinite rich coal. Fuel 2011, 90, 2347–2352. [Google Scholar] [CrossRef]
- Trommer, D.; Noembrini, F.; Fasciana, M.; Rodriguez, D.; Morales, A.; Romero, M.; Steinfeld, A. Hydrogen production by steam-gasification of petroleum coke using concentrated solar power—I. Thermodynamic and kinetic analyses. Int. J. Hydrogen Energy 2005, 30, 605–618. [Google Scholar] [CrossRef]
- Wang, J.; Jiang, M.; Yao, Y.; Zhang, Y.; Cao, J. Steam gasification of coal char catalyzed by K2CO3 for enhanced production of hydrogen without formation of methane. Fuel 2009, 88, 1572–1579. [Google Scholar] [CrossRef]
- Afrooz, I.E.; Ching, D.L.C. A modified model for kinetic analysis of petroleum coke. Int. J. Chem. Eng. 2019, 2019, 2034983. [Google Scholar]
Figure 1.
From Wikimedia Commons, the free media repository https://commons.wikimedia.org/wiki/File:RefineryFlow.png (accessed on 2 April 2022). Permission is granted to copy, distribute and/or modify this document under the terms of the GNU Free Documentation License, Version 1.2 or any later version published by the Free Software Foundation.

Figure 2.
Proof of concept of CarboLoop pet-coke (From [30]): (A): Temperature profile, (B): Mass profiles.
Figure 2.
Proof of concept of CarboLoop pet-coke (From [30]): (A): Temperature profile, (B): Mass profiles.

Figure 3.
Nanostructured carbon material produced from Pitch pyrolysis at 1800 °C. (a): SEM images and, in the indent, morphology of produced char; (b) Raman spectra (from [34]).
Figure 3.
Nanostructured carbon material produced from Pitch pyrolysis at 1800 °C. (a): SEM images and, in the indent, morphology of produced char; (b) Raman spectra (from [34]).

Figure 4.
Extraction/solubilisation scheme.

Figure 5.
Mass spectrum of asphaltenes acquired by APPI-MS adapted from [78].
Figure 5.
Mass spectrum of asphaltenes acquired by APPI-MS adapted from [78].

Figure 6.
Mass spectrum of Asphaltenes acquired by LDI-MS, adapted from [73].
Figure 6.
Mass spectrum of Asphaltenes acquired by LDI-MS, adapted from [73].

Figure 7.
Spectra of two different petroleum pitches with different softening points (PP118, Tsoftening = 118 °C and PP250, Tsoftening = 250 °C), acquired by LDI-TOF MS adapted from [52] with permission.
Figure 7.
Spectra of two different petroleum pitches with different softening points (PP118, Tsoftening = 118 °C and PP250, Tsoftening = 250 °C), acquired by LDI-TOF MS adapted from [52] with permission.

Figure 8.
SEC chromatogram of asphaltenes, adapted from [94].
Figure 8.
SEC chromatogram of asphaltenes, adapted from [94].

Figure 9.
SEC chromatogram of two petroleum pitches with different softening points (PP118, Tsoftening = 118 °C and PP250, Tsoftening = 250 °C) adapted from [52].
Figure 9.
SEC chromatogram of two petroleum pitches with different softening points (PP118, Tsoftening = 118 °C and PP250, Tsoftening = 250 °C) adapted from [52].

Figure 10.
Raman spectra of a petroleum pitch (PP raw) and of the same petroleum pitch after annealing at 450 °C (PP N2 450 °C) in nitrogen.
Figure 10.
Raman spectra of a petroleum pitch (PP raw) and of the same petroleum pitch after annealing at 450 °C (PP N2 450 °C) in nitrogen.

Figure 11.
Infrared spectra of a petroleum pitch and an asphaltene sample.

Figure 12.
A:TG (A) and DTG (B) curves of a petroleum pitch (see PP118 in [52]) in Nitrogen and in air at constant heating rate of 10 K/min. (C): Arrhenius plot of the combustion stage from Pitch NI-TGA in air.
Figure 12.
A:TG (A) and DTG (B) curves of a petroleum pitch (see PP118 in [52]) in Nitrogen and in air at constant heating rate of 10 K/min. (C): Arrhenius plot of the combustion stage from Pitch NI-TGA in air.

Figure 13.
(A):TG and (B): DTG curves of Pet-coke pyrolysis in nitrogen at different heating rates. (C): Instantaneous rate of carbon conversion, df/dt, versus f of pet-coke char at 530 °C in air (char prepared in a fixed bed tubular reactor at 650 °C under inert conditions).
Figure 13.
(A):TG and (B): DTG curves of Pet-coke pyrolysis in nitrogen at different heating rates. (C): Instantaneous rate of carbon conversion, df/dt, versus f of pet-coke char at 530 °C in air (char prepared in a fixed bed tubular reactor at 650 °C under inert conditions).

Figure 14.
(A): TG–MS results of NI–TG analysis of RW in He (MS spectra at 200 °C and at 600 °C are shown); (B):TG–DSC results of NI-TG analysis of RW in He, in 0.1% O2 in He and with 21% O2 in He (adapted from [22] with permission).
Figure 14.
(A): TG–MS results of NI–TG analysis of RW in He (MS spectra at 200 °C and at 600 °C are shown); (B):TG–DSC results of NI-TG analysis of RW in He, in 0.1% O2 in He and with 21% O2 in He (adapted from [22] with permission).

Figure 15.
Quartz boat and reactor tube after pyrolysis of RW in tubular reactor at 600 °C.

Figure 16.
Formation of carbon-sand aggregates with RW in fluidized bed (from [23] with permission).
Figure 16.
Formation of carbon-sand aggregates with RW in fluidized bed (from [23] with permission).

Publisher’s Note: MDPI stays neutral with regard to jurisdictional claims in published maps and institutional affiliations. |
© 2022 by the authors. Licensee MDPI, Basel, Switzerland. This article is an open access article distributed under the terms and conditions of the Creative Commons Attribution (CC BY) license (https://creativecommons.org/licenses/by/4.0/).
Share and Cite
MDPI and ACS Style
Apicella, B.; Russo, C.; Senneca, O. Analytics for Recovery and Reuse of Solid Wastes from Refineries. Energies 2022, 15, 4026. https://0-doi-org.brum.beds.ac.uk/10.3390/en15114026
AMA Style
Apicella B, Russo C, Senneca O. Analytics for Recovery and Reuse of Solid Wastes from Refineries. Energies. 2022; 15(11):4026. https://0-doi-org.brum.beds.ac.uk/10.3390/en15114026
Chicago/Turabian StyleApicella, Barbara, Carmela Russo, and Osvalda Senneca. 2022. "Analytics for Recovery and Reuse of Solid Wastes from Refineries" Energies 15, no. 11: 4026. https://0-doi-org.brum.beds.ac.uk/10.3390/en15114026
Note that from the first issue of 2016, this journal uses article numbers instead of page numbers. See further details here.