
Study on Support Mechanisms for Renewable Energy Sources in Poland
by
 , , , and
Agnieszka Mazurek-Czarnecka
1 ,
,
Ksymena Rosiek
1,
Marcin Salamaga
2,
Krzysztof Wąsowicz
1 and
Renata Żaba-Nieroda
1,* 1
Department of Sustainable Development Finance, Cracow University of Economics, 31-510 Krakow, Poland
2
Department of Statistics, Cracow University of Economics, 31-510 Krakow, Poland
*
Author to whom correspondence should be addressed.
Energies 2022, 15(12), 4196; https://0-doi-org.brum.beds.ac.uk/10.3390/en15124196
Submission received: 8 May 2022
/
Revised: 29 May 2022
/
Accepted: 31 May 2022
/
Published: 7 June 2022
(This article belongs to the Special Issue Managing Energy Sector Enterprises: Challenges, Methods and Research Trends)
Abstract
:Poland, as a member of the European Union (EU), has to fulfill the obligations resulting from its membership in it. It is necessary to comply with numerous directives and other legal provisions adopted by the European Commission in the field of the energy market and production. Meeting the demands of the European Green Deal, as well as the solutions presented in the Fit for 55 package, is very difficult. In Poland, coal is still used in over 67% of electricity production. This article presents an attempt to join the multi-threaded discussion on renewable energy sources (RES) and the possibility of increasing their share in Poland’s energy mix. This article defines the RES support mechanisms in Poland, presents the support systems and instruments functioning within them, and also provides a statistical prediction of trends in energy production from RES for upcoming years. Research utilized the Brown, Holt, and Winters models and the cause-and-effect model. The research conducted in this article shows that Poland must make significant efforts to decarbonize the economy; in addition, the too quickly changing RES support system is not conducive to the development of these sources.
1. Introduction
Civilizational development is associated with an increase in energy consumption for developing economic sectors and with growing social needs of the population. The demand for energy is continuously increasing, a trend that will not diminish in the coming years, and which will lead to ever greater changes in the energy sector.
For decades, energy policy was based on ensuring national energy security, and this approach was dominant in most countries, including Poland. Only recently did the objectives of contemporary climate policy begin to force significant changes in energy policy priorities. On the other hand, since joining the EU, Poland has been implementing numerous mechanisms to support renewable energy sources (RES), but it should be underscored that the actions taken are unstable.
Poland is a country whose electricity production sector is based on fossil fuels. Hard coal and lignite are the main energy fuels. Many generating units in coal-fired power plants are already obsolete and have low efficiency. The energy transmission network also needs to be modernized. The Polish electricity production sector is highly emission-intensive and the possibility of achieving the adopted emission targets is in question.
Since joining the EU, Poland has been obliged to follow and implement appropriate policies, including climate-oriented ones. To this end, it is necessary to support capital-intensive technologies for generating energy from RES. Nevertheless, the volatility of Polish legal regulations and implemented support instruments contributes to uncertainty among business and individual investors (prosumers).
There are two notable recent examples of unfavorable legislative changes introduced by the Polish government. In 2016, the 10H rule was introduced, which effectively blocked the development of onshore wind energy generation. In turn, the change introduced in 2021 from a net metering system to a net billing system will cause a significant decrease in the interest among potential energy prosumers in generating renewable energy.
Such changes should be announced and implemented in the long term. Currently, there are nearly 20 instruments of various types in Poland, addressed to various stakeholder groups. All this means that the RES support system is non-transparent, difficult to manage, and the possibilities of estimating the dynamics of the increase in RES production are a challenge. It is also difficult to estimate the effectiveness of individual instruments, as some of them are mutually competitive. In the literature on the subject, there is a gap in the identification of support mechanisms and there is a lack of characteristics of RES support systems and instruments. These circumstances have made the identification of RES support mechanisms in Poland not only a challenge, but also an attractive research area in itself.
The aim of the article is to identify, characterize and classify mechanisms supporting the implementation of RES in Poland and to assess the results so far. The article also attempts to predict for the next several years the increase in installed RES capacity, following current trends, which will make it possible to assess the possibility of implementing Poland’s climate protection commitments. The article ranks and presents mechanisms the individual impact of which (mechanisms and even of instruments used within them) is impossible to precisely determine. This is due to mechanism complexity and constant fluctuations resulting from legislation changes in this domain. Therefore, the authors decided to use forecasting methods utilizing real data from previous years, which are a hard and reliable verifier of the effectiveness levels of the analyzed mechanisms.
In order to achieve this goal, the literature on energy and climate policy in Poland and the EU was reviewed (Section 2). In the Section 3 (Materials and Methods), an analysis of the current state of RES production was carried out and the existing support mechanisms were identified, which allowed for the creation of an original proposal for their division. This part also described the structure of research and prediction, in which forecasting methods used in electricity production sector analyses were applied (Brown, Holt, and Winters models and the cause-and-effect model). The same three-stage structure was maintained in the fourth chapter presenting the results of the research. At the outset, this chapter discussed the trends in the development of RES in Poland, the assumptions of which were used for further modeling, and then on the basis of the previously created division of mechanisms, specific instruments for supporting RES in Poland were identified. Finally, the chapter presented the modeling, which was carried out in an attempt to answer the question whether the currently existing RES support system can ensure the achievement of the assumed reduction targets. The research plan constructed in this way allowed for the discussion of achieved results and inference later in the article.
2. Policy Background and Identification of the RES Support Mechanism in Poland
2.1. Short Review of Climate and Energy Policy
Climate change requires coherent and coordinated actions [1]. Many sectors need to take action to reduce emissions, such as industry, energy, agriculture, and transport. The state and supranational institutions, as well as international agreements, play an important role in setting trends and development goals [2,3,4]. Research has been carried out for many years on the benefits and costs of adaptation to climate change [5,6,7,8], climate risks for individual sectors or geographical areas [9,10,11,12], and the impact of climate change on cities [13,14,15,16]. In each of these considerations, energy occupies an important place. Moving away from emissions-intensive fuels, especially coal, increasing energy efficiency and reducing the energy intensity of the economy are the most important goals of the new climate and energy policy worldwide.
The EU wants to be a leader in programming and implementing changes towards a zero-emissions economy. The need for legal regulation with regard to the impact on climate change was noticed as early as the 1980s, initially in the context of reducing greenhouse gas emissions [17,18,19]. Three main stages in the development of the EU climate policy can be distinguished (Table 1). They are obviously in line with the directions set by international conferences and agreements (Table 2).
Poland is also facing the challenge of changing the structure of its electricity production system, which is a particularly difficult task, because a significant part of the energy mix comes from fossil fuels. In this context, the historical conditions for the development of the Polish electricity production sector should be considered. After the Second World War, coal-based power generation was developed. During the 1980s, in the peak production period, Poland extracted annually over 200 million tons of this raw material. In recent decades, programs have been introduced to reform and phase out mining [32,33]. This is one of the barriers to faster decarbonization of the Polish economy. Efforts are being made to apply innovative solutions to reduce emissions from coal combustion [34].
It can be argued that Polish energy policy was not fully independent and was subject to confinement in the Comecon (Council for Mutual Economic Assistance) [35]. The Polish Act of 1990 created the basis for ownership transformations in the electricity production sector, aimed at separating production and distribution [36] and initiated the preparation of new legislation and a new energy policy. In 1997, a new Energy Law was adopted [35,36,37]. The next documents shaping Poland’s energy policy were: the first Assumptions of the Energy Policy of the Republic of Poland for the years 1990 to 2010, published in 1990, but the document under this title was adopted by the Council of Ministers only in 1995 [38,39]. Another document of this type, with a horizon to 2020, was adopted in 2000. It was quickly amended by the Energy Policy until 2025, adopted in 2005 just after Poland’s accession to the EU [40]. Since then, two more versions of this strategy have been adopted, one in 2009 with a 2030 perspective [41] and the current energy policy with a 2040 perspective, adopted in 2021 [42], which sets new directions for the development of this sector. It can be said that until about 2000, there was an atomization of the Polish energy sector, followed by a shift towards re-consolidation, in order to provide greater capital capacity for the necessary investments.
The electricity production sector will face fundamental challenges in the near future. On the one hand, there is a rapidly growing demand for energy; on the other hand, it is subject to pressures from climate and environmental policies. The statutory goal of the state’s energy policy is energy security (according to the Energy Law, energy security means the state of the economy enabling the fulfilment of current and prospective demand from consumers for fuels and energy in a technically and economically justified way, while maintaining the requirements of environmental protection) [35,41,42], while ensuring the competitiveness of the economy, energy efficiency and reducing the environmental impact of the energy sector. The aim of state electricity production policy is therefore energy security, while ensuring the competitiveness of the economy, energy efficiency and reducing the impact of the energy sector on the environment, with optimal use of its own energy resources [42,43,44].
Electricity in the modern world is a fundamental factor influencing economic growth. The increase in electricity consumption is related in a cause-and-effect sense to industrialization, urbanization, an increase in living standards, and the continued growth of the world’s population. This is confirmed among others by Gurgul and Lach, who proved the correlation between GDP and electricity consumption in Poland [45]. Research on this interdependence was also carried out by Bildirici and Kayikci. The results of their research for nine European countries confirm the two-way relationship between electricity consumption and GDP. The authors also emphasized that the greater the interdependence, the greater the value of economic growth [46]. Similar conclusions were reached in the research by, among others, Ciarreta, Bayra [47] and Khobai [48]. Stable access to cheap and effective energy sources is a basic component of economic growth.
The energy industry is a key sector of the economy that deals with the acquisition, processing, storage and use of all forms and available energy carriers. The Polish energy sector is largely based on the use of hard coal and lignite for energy production. Currently, sustainable energy development is becoming the main goal of many countries. To become carbon-neutral by 2050, action must be taken to: save energy on the demand side; improve the efficiency of energy production; and phase out fossil fuels in favor of RES [49].
The use of energy from renewable sources is one of the most important elements of the development of sustainable energy, which brings real benefits, both ecological and energy. Increasing the share of renewable energy sources in the global energy balance contributes to the improvement of the state of the environment and to the reduction in the degradation of natural resources. Supporting the development of renewable energy sources improves energy security and the development of individual national economies [50]. Therefore, Poland faces the need to take radical measures to obtain energy from renewable sources. It is necessary not only to quickly implement appropriate administrative and legal solutions but also infrastructure, which is associated with the necessity to incur large financial outlays in this direction. The development of renewable sources in Poland depends on the support system [51].
2.2. Identification of Support Mechanisms for RES in Poland
In the literature on this subject, RES support mechanisms, also known as support systems, are a set of legal and administrative instruments, as well as systemic solutions, that are designed to affect the development of the use of RES.
The OECD divides incentives that are designed to stimulate investor interest in undertaking investments in RES and distinguishes them as: regulatory incentives, financial incentives, market-based incentives, tax or fiscal incentives [68].
Financial mechanisms are a set of instruments whose task is to compensate for market imperfections and reduce transaction costs associated with investing in RES. Financial mechanisms include instruments such as preferential loans, grants, bonuses and guarantees. The resources spent under the support mechanisms come from the EU general budget and the EU Structural Funds managed from the level of the individual regional operational programs. Additional financial support for the development of RES is provided by the European Investment Bank (loans, credit lines), the European Bank for Reconstruction and Development and, in Poland, Bank Gospodarstwa Krajowego—BGK (this is the Polish development bank, which provides support such as the Biznesmax guarantee).
Market-based mechanisms are instruments whose main task is to encourage producers of renewable energy to produce it. The purchase of a given amount of energy from RES is guaranteed in advance, while its prices are shaped by market mechanisms. In Poland, market mechanisms include the system of green certificates and the RES auction system.
Tax mechanisms are instruments of an incentive nature for electricity producers, who also include prosumers. Tax credits are tax exemptions for renewable energy generation activities, which may relate to exemptions from turnover, income, agricultural tax, as well as VAT and excise duty.
Regulatory mechanisms are instruments or systems regulated by relevant legislation, the application of which is intended to encourage investment in RES. The system of guaranteed feed-in tariffs (FIT) and the FIP market price subsidy system are to affect the production of the desired amount of energy. In turn, the net-metering system and the net-billing system regulate the situation of electricity prosumers. The relationship between producers of electricity from RES is regulated by agreements such as PPAs (Figure 1).
In Poland, many RES support mechanisms have been introduced. Currently, some are being abandoned and others are being introduced. This research identified the mechanisms occurring in the country and divided them (Figure 1) and their characteristics, taking into account the beneficiaries and the possible amount of support (Table 3).
For entrepreneurs, financial mechanisms are provided for the construction of installations for the production of energy from RES in the form of investment subsidies (grants), bank guarantees and preferential loans, which are loans granted for the implementation of projects in the area of installations generating energy from RES (their interest rate ranges from 0.25 to 0.5% per annum) [69]. For households, in turn, a subsidy from the “My Electricity” program is dedicated—a support system for increasing electricity production by photovoltaic micro-installations (micro-PI). Beneficiaries are reimbursed for the costs incurred for the purchase and installation of a photovoltaic installation (PI) to be used for existing residential buildings [70]. The next, fourth edition, of the “My Electricity” program is to start in the first quarter of 2022. The scope of the program will be extended to include elements such as intelligent energy management systems at home, charging points (chargers for electric cars), electricity storage and heat and cold storage [70]. The “Clean Air Program” is another type of support provided under financial mechanisms, for private persons who are owners of residential buildings, who can apply for co-financing for the replacement of old furnaces and boilers for solid fuel with new, greener ones, including heat pumps and PV [71]. The program is implemented at the level of voivodships (ad-ministrative regions) by individual Funds for Environmental Protection and Water Management (FEP&WM). These are special-purpose funds that are part of the environmental protection financing system in Poland [72,73,74,75]. Through such a special purpose fund at the national level—the National FEP&WM—another program is implemented for entrepreneurs, “Energy Plus”, which allows them to take a subsidy or preferential loans for investments related to the improvement of air quality, energy efficiency and RES [76,77]. Another instrument is the thermo-modernization bonus [78,79] that is granted by BGK. Its main purpose is to reimburse the costs incurred in the thermal modernization of buildings, also including photo-voltaic installations. The bonus can only be used if you take out a loan to complete the investment. The Biznesmax Guarantee is a bank guarantee program operated by BGK and consists of securing loans for investments in ecological innovations, including photo-voltaic installations. The bank’s support also includes an interest subsidy, which significantly contributes to reducing the cost of credit [79]. “Agroenergy” is a program aimed at increasing the production of energy from RES in the agricultural sector and is granted in the form of grants from the NFEP&WM or a loan from the funds of NFEP&WM [80].
Another mechanism is the market mechanism, under which energy prices are set on the market while, thanks to these systems, the amount of energy from RES is guaranteed in advance. In Poland, market mechanisms include the green certificate system and the RES auction system (Table 3. In 2015, the Polish RES Act was adopted [81], introducing the RES auction system, which is more competitive than the green certificate system that will continue to operate until 2031, but only for entities that joined it before 2016. The implementation of the auction support system for the production of electricity from RES has significantly increased the competitiveness of entities that join the auctions. The RES auction is announced and carried out by the President of the Energy Regulatory Office (market regulator). The first auction took place on 30 December 2016. Within a given basket of energy producers, the auction is won by those entities that offer the lowest selling price for energy [82]. Tax mechanisms are instruments used by prosumers of electricity who produce it in their own home installations. These include reliefs in income tax, agricultural tax, VAT, and excise duty. In Poland, all these reliefs operate (Table 3 [83,84]. Regulatory mechanisms are legal regulations, as well as systemic instruments, that encourage business and individual investors (households) to invest in RES. As part of the 2018 amendment to the RES Act, new forms of support for the production of electricity from RES were introduced, i.e., the so-called feed-in-tariff system and the feed-in premium system [85,86,87] The system of discounts for prosumers, otherwise known as the net metering system, can be considered another regulatory instrument, which in the last two years has significantly contributed to the increase in the number of prosumers. However, according to the proposals contained in the next amendment to the RES Act, a system of discounts in this form will operate until the end of March 2022. From 1 April 2022, a new system of prosumer settlements—net billing—will come into force, where prosumers will sell surplus energy introduced into the grid, while they will pay for the energy consumed in the same way as other electricity consumers. This entails an additional fee [88] According to the proposed regulations, all prosumers who have received permission to connect micro-installations to the network on previous terms and have received permission to connect to the network will be settled on the current discounted rules for 15 years [89].
A power purchase agreement (PPA) is a type introduced only by the RED II Directive, according to which a “renewable electricity purchase agreement” means a contract under which a natural or legal person agrees to purchase renewable electricity directly from an electricity producer [52]. In Poland, different models of PPAs are possible and acceptable (Table 3) [90,91].
3. Materials and Methods
3.1. The Conceptual Background and Hypotheses Development
The concept of backstop technology emerged as an extension of Hotelling’s analysis and is based on the assumptions of this model. In simple terms, it can be pointed out that there is a technology substitution to the commonly used one, but it is more expensive, which is a barrier to entry [92,93,94,95,96,97,98]. RES can be considered such a substitute for conventional energy production. There exist a range of important barriers limiting the development of various RES sources. In relation to onshore wind farms, the main challenge is the distance criterion, i.e., the 10 h rule. In the case of photovoltaics, the main challenge takes the form of infrastructure limitations related to the possibility of access to connection capacities. For small hydropower plants, barriers take the form of a long, complicated and expensive process of preparing investments for implementation (especially in the area of environmental procedures), high capital expenditures and operating costs resulting from the need to adapt hydropower plants to increasingly stringent environmental requirements. Hydropower is also limited by the high costs of fees and services incurred by the owners of hydroelectric power plants and related to the management of water resources and problems with investor access to water dams. A notable challenge is the period of support for installations lasting 15 years, which does not match the lifecycle of hydroelectric power plants (60–70 years) and the lack of profitability of hydroelectric power plants when selling energy on the wholesale market after the end of the support period. Dams are also limited by the unpredictability of legal regulations and a high degree of dependence on a regulated market. For offshore wind farms, the main limitation is the failure to finalize work on the Spatial Development Plan for Polish Maritime Areas. For installations for the thermal treatment of waste, barriers come in the form of an obligation to operate a video system for the continuous control of the location where the storage of waste occurs, as well as the obligation to secure claims for environmental damage. Geothermal energy is limited by the lack of support instruments dedicated directly to these installations, and the temperature of geothermal deposits in Poland (45–75 °C), making them inappropriate for the production of electricity and useful only for the production of thermal energy. Moreover, there is a lack of current research that provides information on the possibility of the effective utilization of this energy type.
Both the EU and its individual Member States implement various support instruments for increasing the share of RES in energy production. The EU provides countries with considerable freedom in their choice of instruments to achieve the objectives set out in the Europe 2020 strategy [24] and the European Green Deal [27]. Many such instruments have been implemented in Poland since the country joined the EU in 2004. One of the research goals pursued in this article was their review and systematization. In Poland, there was quite a lot of variability in the approach to RES, and the assumptions of the energy policy should be considered as key to its development through the forms of support adopted [52,65,99]. However, there are also other factors to be taken into account when assessing the implementation of the effectiveness of support instruments. Their identification was the second research goal. The third objective was to attempt a short-term extrapolation of the installed RES capacity in Poland, in order to examine the trend and assess whether the current support mechanisms for the RES sector allow for achieving the assumed goals.
An expression of the adopted research methodology is the research hypothesis, formulated as follows: H1: The currently used RES support mechanisms in Poland are insufficient to achieve the objectives of the energy and climate policy set by the EU. This hypothesis was verified in the course of the literature search and empirical research.
In order to verify the indicated hypothesis, the figure below presents a block diagram presenting the individual stages of the research procedure (Figure 2). The methods that were used in the research process were: desk research, data analysis (raw statistical data), statistical extrapolations, forecasting and assessing.
The article ranks and presents mechanisms whose complexity and constant changes resulting from changes in legislation in this area make impossible a fully reliable assessment of the impact of individual mechanisms (and even instruments used within them) in Poland. Therefore, the authors decided to use forecasting methods using real data from previous years, which are actually a hard and reliable verifier of the level of effectiveness of the analyzed mechanisms.
3.2. RES in Poland
After the initial decline in electricity production associated with the re-structuring of the economy after the transformations of 1990, and especially of the energy-intensive industries, there occurred a systematic increase in electricity production in Poland. The primary energy intensity of GDP with climate correction decreased in the years 2010–2019 from 0.318 to 0.249 kg/Euro (in constant prices from 2005 [100]); however, energy productivity is significantly lower than in the EU, although it increased from EUR 3.56 per kilogram of oil equivalent (KGOE) in 2010 to EUR 4.70 per KGOE in 2019 and EUR 4.72 per KGOE in 2020, with the EU average being 6.84, 8.37 and 8.57, respectively [101]. Figure 3 shows the acceleration of GDP growth after 2004—that is, after the accession of the Poland to the EU.
The most important terms used in further analysis are defined as follows: energy production—the amount of electricity generated for market purposes and supplied to the power grid, including production in auxiliary-emergency generators excluding ship-based power plants [102,103].
Poland still produces about 45% of its energy from hard coal and about 24% from lignite. In 2019, Poland ranked first in the EU in terms of hard coal mining, third in terms of lignite mining and seventh in terms of the amount of electricity produced.
RES are those whose resources used for the production of electricity, heat or mechanical energy do not decrease, or their renewal, as in the case of biomass, takes place in a relatively short time. An unambiguous definition of individual types of RES based on their differentiation is not easy. In Poland, Article 2(22) of the Act of 20 February 2015 on RES considers non-fossil energy sources as renewable, encompassing wind energy, solar radiation, aerothermal energy, geothermal energy, hydrothermal energy, hydropower, wave, tidal and tidal energy, energy obtained from biomass, biogas, agricultural biogas and bioliquids.
According to the Central Statistical Office, in Polish conditions, energy from renewable sources includes energy from solar radiation, water, wind, geothermal resources, energy produced from solid biofuels, biogas and liquid biofuels, as well as ambient energy obtained by heat pumps.
According to statistical information on electricity, which is prepared by the Energy Market Agency S.A. in Poland (ARE), the electricity capacity installed in RES includes installations such as hydroelectric power plants, wind power plants, biogas power plants, biomass and photovoltaic power plants.
In this article, the capacities installed in RES include installations using biogas, biomass, solar radiation energy, wind energy, hydropower, as well as capacities installed in professional hydropower plants. The capacities installed in individual types of RES were used in the article as explanatory variables, which were selected due to the availability of collected data according to the systematics and studies of the Polish National Statistical Office (Statistics Poland—SP). The explanatory variables classified as economic variables were chosen because of the close relationship between GDP growth and energy generation growth. Due to the high restrictions on environmental protection imposed by the EU, it is necessary to incur sizeable expenditures on environmental protection. If they were abandoned, the production of energy from conventional sources would not be possible due to non-compliance with emission standards. Explanatory variables classified as environmental variables were selected due to their significance, e.g., from the point of view of environmental nuisance, which is one of the determinants of the need to use environmentally neutral RES. Explanatory variables classified as industry variables were selected for their significance. Due to the need to refer to the objectives set by the EU, those related to the production of electricity in Poland in general (including in professional and industrial power plants) and electricity consumption in Poland were considered to be important explanatory variables included in the industry variables.
In Poland, the share of RES in total primary energy (%) in 2019 reached 19.7%, with the EU-28 average being 32.8%, with solid biomass dominating as a source of RES (in Poland 66%, in the EU 40%) (Figure 4). On the other hand, the share of energy from RES in the final total energy consumption in Poland was 11.6% in 2019, with the EU-28 average being 10.2%.
The indicators reported for the achievement of the objectives of the Europe 2020 strategy show, in turn, the share of RES in gross final consumption.
The share of RES in Poland’s gross final consumption has been increasing since 2005, reaching in 2020 the level of 16%. In 2017–2018, a decrease in this share was recorded despite the increase in nominal values due to a significant increase in total electricity energy consumption in Poland during these years (Figure 5). The share of RES in gross final electricity energy consumption was only 6.9% in 2005 against the EU average of 9.3%, and increased in Poland to 16.1% in 2020, with an increase in the EU average to 18.9% (Figure 6).
Poland’s progress in the use of new technologies and opportunities in the field of energy generation from RES is noticeable, among others, in the amount of installed capacity for innovative, modern types of RES. In 2005, the total installed capacity (excluding hydroelectric plants) was 1157.5 MW and the dominant form was hydropower, while in 2020 the installed capacity was 9979.1 MW, with a dominance of wind energy (Figure 7 and Figure 8). What is worth emphasizing is the increase in the power and share of solar energy, which was achieved mainly thanks to incentives for private residents to install photovoltaics. Unfortunately, these favorable regulations were changed recently.
The aims of the current State Energy Policy 2040 (PEP2040) are quite detailed and cover the entire energy supply chain—from the acquisition of raw materials, through the production and supply of energy (transmission and distribution), to the way it is sold and used [104]. Each of the eight specific objectives of PEP2040 contributes to the three elements of the state’s energy policy objective and serves Poland’s energy transition. The following indicators have been taken as a global measure of the achievement of the PEP2040 target:
- no more than 56% of coal in electricity generation in 2030;
- at least 23% of RES in gross final electricity energy consumption in 2030;
- implementation of nuclear energy in 2033;
- a 30% reduction in GHGo emissions by 2030 (compared to 1990);
- a 23% reduction in primary energy consumption by 2030 (compared to PRIMES projections from 2007).
PEP2040 is a response to the most important challenges facing the Polish energy sector in the coming decades and sets the directions for the development of the electricity production sector, taking into account the tasks necessary for implementation in the short term. Since the Polish power industry is based on coal, support mechanisms are particularly important.
In accordance with Directive 2009/28/EC [105], as amended by Directive 2018/2001 [106], on the promotion of the use of energy from RES, as of 2020 the EU Member States are required to ensure a specific share of RES in the gross final consumption of energy. Compulsory national goals contribute to the planned 20% share of RES in the EU’s energy gross final consumption. For Poland, this target was set at 15%. Another target set for Poland is a 32% share of RES by 2030, therefore, already in 2024, Poland should achieve nearly 22% (value based on estimates using linear interpolation) of the share of energy produced from RES. Assuming forecasted values (developed later in the article), this is impossible.
3.3. Factors Determining the Production of Electricity Using RES
With a high level of unpredictability, a key issue becomes the analysis of individual trends, because they set the sustainable direction of energy development. In this study, the implementation of research goals related to forecasting the value of energy produced from RES in Poland began with the specification, classification, presentation of concepts and an attempt to determine their mutual relations that affect the studied phenomenon.
Electrical power generation is a field that has a significant impact on the natural environment, hence the recognition of this phenomenon as fundamental for the use of RES. This impact can be considered in two aspects: the consumption of energy fossil-based raw materials and environmental pollution with gases such as NOx, SO2, dust and other combustion process waste.
From the point of view of the scale of impact, CO2 is the most important greenhouse gas in the structure of Polish greenhouse gas emissions. CO2 emissions are an objective result of the production and distribution, especially of electricity production. Therefore, in the analysis of the determinants of RES development, it was assumed that Polish economic growth (expressed by GDP) will be accompanied by an increase in energy demand, with a correction for improving energy efficiency. The increase in the sum of gross value added of individual institutional sectors, enhanced by taxes on products and reduced by subsidies on products that are not allocated to sectors, is one of the main factors determining future energy demand, although the increase in the main balancing position of the total economy production account (GDP) and the increase in energy productivity are to some extent offsetting. Ensuring a steady decrease in CO2 emissions in the conditions of an increase in the sum of final consumption and gross accumulation, increased by exports and reduced by imports of goods and services (GDP), is an extremely difficult task from the point of view of the actions taken by the energy sector. Ways to adapt to the requirements for reducing CO2 emissions include alternative methods of electricity generation (RES). The competitiveness of various generation technologies, especially those with high variable costs, is strongly dependent on fuel prices and CO2 emissions allowances.
The increase in greenhouse gas emissions by the energy industry reduces the average installed capacity of power plants. At this stage, it is not justified to develop conventional energy sources based on hard coal and lignite. One of the ways to adapt to the environmental objectives set by the EU is to switch off existing coal-based generation sources and look for alternative sources of energy generation.
According to the conducted analyses, energy based on fossil fuels requires high investment outlays, and thus moving away from coal allows power plants, among other things, to produce energy emitting fewer pollutants, including pollutants in the form of greenhouse gas emissions, but also nitrogen oxides, sulfur and dust. This is another substrate constituting the development of RES in Poland. In this study, capital expenditures are understood as financial or material outlays, the purpose of which is to create new fixed assets or improvement (reconstruction, extension, reconstruction, adaptation or modernization) of existing fixed asset facilities, as well as expenditures on initial investment equipment [107]. Expenditures on fixed assets for environmental protection include expenditures incurred in the improvement of fixed assets related to environmental protection and research and development activities. The structure of expenditures on fixed assets for environmental protection in Poland is dominated by alternating expenditures on sewage management and water protection, as well as on the protection of atmosphere and climate. Investments related to the protection of atmosphere and climate include installations of purification and deodorizing devices (dedusting, reducing, counteracting and neutralizing gaseous pollutants). Additionally included are installations using chemical transformation reactions for substances less burdensome for the environment, together with complete equipment accompanied by necessary auxiliary equipment to ensure the proper operation of the installation, as well as equipment and apparatus ensuring the reduction in the amount or concentrations of emerging or emitted pollutants, tasks related to the equipment for air pollution control and measurement equipment. Furthermore, these investments include: new techniques and technologies for the combustion of fuels; modernization of boiler rooms and heating plants in order to reduce pollutants excreted into the air arising in the combustion process; unconventional energy sources (e.g., wind farms, use of geothermal waters); adaptation of internal combustion engines to gaseous fuel, as well as the construction of a hydrocracking unit [108].
The current Polish Act of 20 May 2016 on Investments in Wind Farms [109] introduced one of the most restrictive distance rules in Europe—the so-called 10H rule, i.e., ten times the height of a wind farm as the minimum distance of a new investment from existing residential buildings and forms of nature protection. This was a response to public dissatisfaction in some areas of the country related to the rapid development of wind farms, especially in places where work was carried out without extensive consultation regarding the project. The effect of introducing this principle was limiting the possibility of locating new wind farms and initiating new wind farm projects, as well as blocking the development of residential construction in the vicinity of existing power plants.
The selection of highlighted and briefly described factors determining the production of RES resulted from the author’s verification of their importance at the level of installed capacity and the universality of their use in economic and industry-specific literature. The criteria for the selection of variables were dictated by their direct or indirect impact on the forecasted values divided into economic, environmental and industry variables.
3.4. Forecasting the Structure of Energy Production from RES in Poland
The dynamic development of energy generation from RES results in the creation of various ways to develop predictive methods and tools. Among many researchers [1,110,111,112,113] there is a view that the forecasting process requires the development of methodologically coherent tools that will enable the study of the traditionally functioning energy sector, taking into account new trends. Many years of creating and improving new tools have not completed this process. In general, methods dedicated to forecasting RES energy can be divided into two basic groups presenting different ways of approaching the problem. The first leans towards a statistical approach to forecasting issues and is usually dedicated to holistic analyses for the energy sector. Historical data related to the factors determining energy production and consumption are used, and then various compounds are sought to predict the share of energy generated from RES on the basis of historical relations and predictions of specific factors having a specific impact on this phenomenon [2,3,114,115,116,117]. The second group of methods represents not only a statistical approach but mainly a physical one and concerns the forecasting of power generated by RES (such as solar power plants, wind farms, etc.) in short and ultra-short time horizons and involves the need to ensure the security of electricity supply and safe operation of the power system. Short-term models are about the most accurate representation of physical conditions to which the object is subjected, in order to use the appropriate predictive tool only in the final phase. Within this approach, further methods are created, hybrid models and complex systems are created using, for example, artificial intelligence, the final effect of which is to be the most accurate forecast for individual types of installations [118,119,120,121,122,123,124].
While there have been many studies presenting the concepts of systems for forecasting ultra-short-term power generated in RES for individual installations in recent years, there are no current reliable scientific studies in the field of general forecasting of energy production from RES for individual countries. Meanwhile, such forecasts have a significant impact on all economic decisions in the energy sector. Few studies present the use of methods that include artificial neural networks [50] or selected methods of machine and deep learning [125]. At this point, it is also worth recalling the forecasting tool presented as part of the EUCALC Explore Sustainable European Futures project, which created a multifunctional calculator. It allows for calculating electricity production in Poland (as well as in the EU and its Member States) by 2050 [126]. In this article, four categories of models were used (Brown, Holt, Winters and cause-and-effect models) [127,128,129,130] for forecasting installed capacity by RES types for the years 2021–2024: capacity installed including in professional power plants hydroelectric power plants (Y1) in GW, installations using biogas (Y2) in MW, installations using biomass (Y3) in MW, installations using solar radiation energy (Y4) in MW, installations using wind energy (Y5) in MW, installations using hydropower (Y6) in MW, and the share of RES in the final consumption of gross energy (Y7) in MWh. The Brown, Holt, and Winters models belong to the group of adaptive models. Their advantage is the speed of adaptation even to small changes in the environment, farm conditions, etc. In turn, causative-descriptive regression models allow one to take into account the impact of significant explanatory variables on the formation of the prognostic variable (representing the existing power according to the types of RES). The advantage of the cause-and-effect models is the possibility of calculating errors of ex ante forecasts, i.e., assessing the inaccuracies of the calculated forecasts (ex ante forecast errors cannot be calculated for forecasts obtained with adaptive models). These forecasting methods, due to their proven effectiveness, are used in energy market research of various economies and regions. These methods have been used, among other things, in forecasting energy consumption in India [131]. In turn, Holt–Winter adaptation methods were used by Taylor [132] in forecasting energy demand in Great Britain and France. Electricity consumption in the USA was predicted with adaptive models by Rahman A. and Ahmar A. S. [133]. In Spain, electricity demand during Easter was forecasted using similar models [134]. Similar forecasting methods were applied to study the demand for electricity in Colombian quarries and incinerators [135]. Abovementioned studies confirmed the high efficiency of adaptive models in forecasting issues related to the demand and production of electricity. Therefore, using them to forecast variables (in the form of time series) representing the installed capacity according to RES types seemed appropriate.
The next stage of the research procedure was the process of validating the built models, selecting the best models for individual forecast variables, building forecasts for them and assessing their accuracy.
3.5. Test Procedure
The study adopts the following cause-and-effect model:
where:
- Yt—dependent variable,
- Xt1, Xt2, …, Xtk—explanatory variables,
- εt—random component.
The explanatory variables in linear cause-and-effect models for individual predictor variables Yt were selected by the reverse step regression method (the output explanatory variables are described in Table 4), in which further irrelevant variables were removed from the model, and only those predictors remained that actually “improved” the constructed model in the sense of the coefficient of determination R2. The explanatory variables used in these models generally showed clear development trends, allowing for their relatively simple extrapolation, which allows the use of cause-and-effect models to forecast installed capacity by RES types. The advantage of cause-and-effect models is the possibility of taking into account the impact of various macroeconomic variables that significantly shape the amount of installed capacity by type of RES and the possibility of calculating ex ante forecast errors [129]. Extrapolation of explanatory variables included in each of the cause-and-effect models was performed on the basis of individually selected trend functions. For extrapolated values of explanatory variables (the figures used are included in the annex to this article), based on the cause-and-effect models in question, forecasts of variables representing installed capacity by RES types for the years 2021–2024 were built.
The article takes the following form of Brown’s exponential smoothing model:
where:
- —smoothed values over period t, α—smoothing constant (.
Forecasts for period T were calculated from the formula where h represents real time advance forecasts and .
In turn, the Holt model used has the form:
for t > 1, where:
- Ct—smoothed value of the increase in trend value assessments in period t,
- α, β—smoothing constants (.
Forecasts for the period T in this model were calculated from the formula .
In contrast, the Winters model with additive seasonal fluctuations has the form:
where:
- dt—assessment of the seasonality index in period t,
- m—number of phases in the cycle,
- α, β, γ—smoothing constants (
Forecasts in this model were calculated from the formula:
The Brown, Holt and Winters models belong to the group of adaptive models [136,137], which do not require the fulfillment of rigorous assumptions about constancy during the course of the analytical trend function or the stability of the parameters occurring in it. In addition, adaptive models tend to provide greater flexibility and timeliness of forecasts compared to classic trend models [138]. The optimal values of anti-aliasing parameters in the following models: Brown without seasonal fluctuations (with anti-aliasing constant α), Holt without seasonal fluctuations (with α smoothing constants, β), and Winters with additive seasonal fluctuations (with α smoothing constants, β, γ), were dynamically selected using the Solver package in Excel, minimizing the root mean square error (RMSE) calculated based on forecasts expired ex post.
The next stage of the research procedure was the process of validating the constructed models, selecting the best models for individual forecast variables, building forecasts for them and assessing their accuracy. Full validation of the resulting models was carried out using the following measures: mean absolute percentage error (MAPE), root mean square error (RMSE), and root mean squared percentage error (RMSPE). The values of these measures were calculated for all models on the datasets of individual variables Y1–Y7 covering annual data in the adopted research period. The final selection of one of the considered prognostic models (Brown, Holt, Winters or cause-and-effect model) for each explanatory variable was based on the calculated model validation measures, which are listed in Table 5.
Table 5 shows that for the explanatory variables Y2, Y4, Y7, the smallest values of all three measures, i.e., MAPE, RMSE, and RMSPE, achieved linear cause-and-effect models. These models also performed best in terms of validation with MAPE and RMSE measures for variable Y1 and in terms of validation with RMSE and RMSPE measures for variables Y3 and Y5. In contrast, the Brown exponential smoothing model had the smallest MAPE and RMSE measure values for the variable Y6. Holt’s model performed best in the light of MAPE values for the Y3 and Y5 variables, and the Winters model had the best RMSPE validation results for the Y1 variable. In addition, to confirm the validation strength of the compared models, correlation coefficients between the values of expired forecasts and the empirical values of the predicted variable during the considered research period were calculated. The results are given in Table 6.
The strongest and most statistically significant linear correlations on validation data sets for the variables Y2, Y3, Y5, Y6, Y7 were obtained for the cause-and-effect model. For the variable Y2, it was the Holt model, and for the variable Y4, it was the Winters model. It is worth emphasizing that a similar value of the correlation coefficient for the variable Y6 was obtained in the cause-and-effect model and in the Brown model. In principle, therefore, the high position of cause-and-effect models at the stage of validation of forecasting tools is confirmed.
Taking into account the above validation results included in Table 5 and Table 6, we decided to use cause-and-effect models to forecast the variables Y1, Y2, Y3, Y4, Y5, Y7, and in the case of the variable Y6 (Installations using hydropower), the Brown exponential smoothing model. The indicated models performed best in terms of most (or all) validation meters for individual Yi variables.
Therefore, the prognoses of the relevant variables Y representing the installed capacities by RES types for the years 2021–2024 will be calculated using the forecasting models selected here. The choice of the 4-year forecast horizon resulted from the relatively short time series (which the authors had at their disposal) and on the basis of which extrapolation was made, as well as the relatively large lability of variables over time. The adoption of a longer forecast horizon could also be unjustified due to the high dynamics of changes in the RES market, also in terms of legal regulations, changing geopolitical situation forcing the diversification of energy sources, etc. Table 7 and Table 8 present assessments of the parameters of the estimated forecasting models (explanatory variables for each model were selected individually using the backward stepwise regression model).
4. Results
4.1. Trends in Energy Use in Poland
In the Polish economy, no new investments in hydropower are being undertaken, which is confirmed by the results of analyses carried out in this area. The use of electricity energy from the power of water was popular in the post-war years of the last century, and today, hydroelectric power plants are still used, but no new large investments are planned in this area. In addition, it can be noted that wind energy is not used to a large extent; in fact, it is not used as intensively as the weather conditions in Poland would permit. The limitations result primarily from legislative changes in this area, and this is another group of factors determining the production of energy from RES. The necessary high capital expenditures cause a lack of interest on the part of investors who cannot count on support in any form. Thus, new windmills on land are not being built. According to the assumptions of the Polish Energy Policy, the possibility of obtaining wind energy from offshore farms is to be developed by 2040, but this is definitely a more expensive undertaking.
It should be noted that RES are becoming competitive in the conditions of rising prices of CO2 emission allowances and a significant reduction in technology costs. Rising energy prices depend on the prices of CO2 emission allowances. One of the forms and possibilities of adapting to the Union’s targets for the use of RES is a new form of classification of these sources. The European Commission has proposed classifying nuclear energy and natural gas as green energy sources under the EU system to help financial markets decide what is a sustainable investment [139]. According to the EC proposal, as part of the sustainable finance classification, the way will be opened for the next 20 years to invest in nuclear power plants, and at least for 10 years in natural gas. The classification system, which will cover industries that produce around 80% of all greenhouse gas emissions, is the first attempt by a major global regulator to determine what should be considered a truly sustainable economic activity and to counteract so-called greenwashing in the financial sector. Thus, along with the depletion of already exploited lignite deposits and the decrease in the relative profitability of power plants utilizing it with an increase in the prices of emission allowances, the role of this fuel in the Polish energy balance will also be reduced. The place of lignite will be taken primarily by nuclear fuel, for which demand will arise as a result of the implementation of the government’s nuclear energy development program. However, this study did not analyze the use of this method of energy production.
A significant contribution to reducing the demand of households and the service sector for electricity, and thus for primary energy carriers, will be made through the increase in the efficiency of household appliances, electronics and lighting, brought by the implementation of increasingly demanding efficiency standards at the level of the entire EU. The various general actions aimed at improving air quality are as follows: the development of district heating (4-fold increase in the number of efficient district heating systems by 2030), a low-carbon direction of transformation of individual sources (heat pumps, electric heating), moving away from burning coal in households in cities, increasing the energy efficiency of buildings, the development of low-emission transport, in particular striving for zero-emission public transport to 2030 in cities with more than 100,000 inhabitants, and a reduction in the phenomenon of household energy poverty.
4.2. Modeling/Forecasting
When analyzing the assessment of the parameters of descriptive models, it should be stated that Polish GDP has a positive impact on variables such as: capacity installed including hydropower plants in professional power plants (GW), installations using biogas (MW), installations using biomass (MW), installations using solar energy (MW), and installations using wind energy (MW). Additionally, the increase in total electricity production in Poland determines the development of installations using biogas (MW) and installations using biomass (MW), while it lowers the capacity of installations using solar energy (MW) ceteris paribus. The increase in sulfur oxide emissions SOx by the power industry on average increases the capacity installed in power plants of direct power plants, including water power (GW) and increases RES in gross final energy consumption. The increase in expenditure on fixed assets to protect the atmosphere and climate and the increase in emissions of NOx by the power industry limits, on average, the installed capacity of installations using biogas (MW), installations using biomass (MW), and installations using wind energy (MW), ceteris paribus. The increase in greenhouse gas emissions emitted by the power industry reduces the average installed capacity of installations using biogas (MW) and installations using biomass (MW). The increase in electricity production, including by professional power plants, supports the installed capacity of installations using wind energy (MW) and limits RES in gross final energy (MW).
On the basis of the selected models, forecasts were calculated for individual variables Y representing the installed capacity by types of RES. The results are presented in Table 9.
Figure 9 shows sparklines of the actual values of the Yt forecast variables and the values of calculated Yt_F forecasts (including expired forecasts).
The presented prediction results indicate that in the case of variables Y2, Y3, Y5 and Y4 (from 2022), we are dealing with a permanent increase in the forecasted capacity of installed RES. On the other hand, the forecasts of installed capacity for the variables Y1, Y7 show a clear downward trend. The most labile (with alternating increases and decreases) are the forecasts calculated for the variable Y6. Cause-and-effect models make it possible to assess the accuracy of ex ante forecasts. Table 10 summarizes the average and relative prediction errors for the forecasts calculated with the models concerned. They allow us to assess the inaccuracies of previously calculated forecasts.
Table 10 shows that the most accurate ex ante projections were obtained for the variables Y5, Y2 and Y3 (ex ante prediction errors below 3%). The least accurate forecasts were obtained for the variables Y4 and Y7. In general, most of the calculated forecast errors indicate an inaccuracy of the calculated forecasts at a level of no more than 10%, which means that the calculated forecasts should not differ from the actual sizes of the forecasted variables by more than 10%. This should be considered a satisfactory result, and the forecasts as quite reliable. Of course, the inaccuracy of forecasts generally increases with the extension of the forecast horizon, but this is normal, because the uncertainty of the forecast phenomenon increases if it is a forecast for a more distant moment of time. A major limitation of the forecasting tools used is the risk of not taking into account variables that may significantly affect forecasted variables in the future (applies to cause-and-effect models), as well as the possibility of outdated models as a result of the inflow of new data with varying volatility. Therefore, the initially assumed form structure of the model used for the forecast may be inadequate after some time and will require re-estimation of the models and their re-validation.
5. Discussion
In its pursuit of energy transformation, Poland is in a worse starting position in relation to many countries, also due to many years of attachment to assets with the best geo-graphical rent (coal), which cause today’s Polish power industry to be based on coal to a greater extent than if it had previously decided on undertaking intensive decarbonization. In addition, although increasing, energy productivity is still significantly lower than the EU average. The taxonomy proposed by the EU is a solution that allows some EU countries to achieve the goals of climate neutrality. However, to this end, it would be necessary to redefine not so much RES but energy sources considered to be zero-emission (green). The conducted predictions did not include nuclear energy and natural gas as RES.
It should be noted that energy sector regulatory politics primarily consist of a range of directives, laws, regulations, policies in terms of limiting the impact of the power generation sector on the natural environment and in terms of improving the competitiveness of various forms of producers using the best available technologies that do not cause excessive impact on the environment. Energy necessary in everyday functioning, in terms of its production in a conventional manner, to a large extent has a negative environmental impact, which is why its production is subject to numerous restrictions, regulated by environmental norms and standards. These regulations also concern to a large extent the way energy is produced, the necessity to decarbonize the sector and to use more efficient, environmentally acceptable ways of obtaining energy. Preventing pollution through modifications, modernization of technological processes and increasing the efficiency of energy use is one of the ways to adapt to ecological standards. Actions taken in this area include the purchase of new technologies, devices and equipment to reduce pollutant emissions in power plants, investment and implementation of “cleaner” technologies in power plants. The power industry has undertaken construction and modernization works, mainly the construction of flue gas desulphurization installations, modernization and replacement of dedusting installations and flue gas denitrification installations using primary methods. Existing protective technologies allow for reducing the emission of particulate matter, SO2 and NOx pollutants. The results of the conducted research show a satisfactory effect related to the reduction in pollution. However, it has not been possible to develop a cost-effective method for reducing CO2 emissions. Reducing the emissions of this gas is only possible by reducing the consumption of high-carbon fuels. In addition, growing environmental awareness plays an important role in reshaping the energy sector, promoting the use of RES. Subsidies granted under programs such as Poland’s “My Electricity” and “Clean Air”, as well as the possibility of tax deductions for this type of investment as part of the thermo-modernization relief, have contributed in the last two years to an increase in interest in investments of this type. At the end of December 2021, the Polish capacity installed in prosumer micro-PV amounted to 5.9 thousand MW of installed photovoltaic capacity, of which a quarter was co-financed under the “My Electricity” program. Further development of RES could accelerate, provided that there is a liberalization of the possibility of building windmills at a closer distance from buildings (the current, prohibitive distance is 10 h, i.e., ten times the height of the wind turbine with blades) and if changes are not introduced in the “My Electricity” program which make the installation of photovoltaics less attractive for prosumers.
In Poland, there are a large number of instruments (within four main mechanisms) used to support RES (Table 3) that are dedicated to various stakeholders. Currently, some of them are being phased out. The instability of the law and frequent changes in detailed priorities (e.g., limiting the creation of new onshore wind installations by changing the provisions of the so-called Act 10H, changing the regulations on micro-PV to be unfavorable for prosumers, changing the regulations limiting the effectiveness of green certificates) cause an increase in uncertainty for RES investors, producers and prosumers.
Currently, there are difficulties with connecting new installations to the power network due to the lack of connection capacity. This significantly limits the investments that could be successfully made by private investors.
This instability of the legal framework and networks technical difficulties causes, on the one hand, greater uncertainty among investors and, on the other hand, difficulties in assessing the effectiveness of individual instruments. However, it is necessary to make an attempt to assess whether the currently used brunch of support instruments can achieve the required emission targets and RES share in production.
Analyzing individual sources of energy generation from RES from the perspective of their development in the coming years, we should expect their continued growth. An increase in installed power is predicted, which may not always be synonymous with an increase in electricity generation from weather-dependent sources. New technical and technological solutions are being introduced in the field of the production of panels for power generation, which will not be based on the production of energy based on sunlight, but rather daylight will be enough to produce energy. Development in the area of RES is supported by the implemented EU energy and climate policy and its integration into national policies, including Poland’s Energy Policy until 2040. Additionally, natural conditions (geographical, climatic) offer opportunities for the development of weather pendent sources of energy generation.
In Poland, one can see the diversity of forms and types of installations recognized as RES. This energy is obtained, among others, from primary solid biofuels (biomass) and gaseous biofuels (thermal biofuels in this analysis were omitted due to the relatively negligible amount of energy produced in Poland). We observe and forecast a dynamic in-crease in the production of energy from these sources (Figure 9B,C). Among the influence of many factors on the production of fuel resulting from biomass processing, a special role is played by agriculture that, after Poland’s entry into the EU, is professionalizing and constantly developing. Stimulation of this area significantly improves the volume of energy generated from RES. In turn, the production of energy from biogases and renewable municipal waste is associated with the development of new technologies mainly in the field of waste disposal and current legislative activities regarding the need for waste segregation. The implementation of a circular economy, growing environmental awareness, creating the idea of sustainable development and pro-environmentalism of the modern economy stimulate the development of this sector. Additionally, in this area one should look for large reserves, which, with the use of appropriate economic incentives, can cause an increase in the energy produced.
In recent years, the level of energy produced from wind has increased. Forecasts for wind energy production are positive (Figure 9E), especially in the field of off-shore wind energy, despite the high investments necessary for its implementation. This is the effect of investments and favorable natural environmental conditions in part of Po-land. It is also worth paying attention to the fact that energy from wind is currently the cheapest in terms of the unit cost of its production. A dynamic development is also noticeable in the area of the use of solar thermal and photovoltaic electricity (very dynamic growth), which provides a contribution to defining this form of energy production from RES as prospective (Figure 9D). The tax and regulatory mechanisms (system of discounts) of support for RES identified in the article, available as part of the energy and climate politics activities of the Polish and the EU, influenced the development of this method of obtaining energy.
As a result of the analyses carried out, the most pessimistic assessment should be made regarding the prospects for the development of energy production generated in pumped-storage plants (Figure 9A) and in installations using hydropower (Figure 9F). The problem of deteriorating hydrological conditions and the high cost intensity of this type of investment have a negative impact on the prediction of energy production from water. Increasingly large areas of the country, especially in the central part of Poland, are threatened by drought. Unless a change in the amount of precipitation is forecast, its nature changes to more short-but-intense, as does the period and variability of its occurrence (lack of precipitation in the typically wet spring months, prolonging rainless periods, reduction in snow cover in winter months) [140].
The analysis and forecasting of the total value of energy produced from RES (Figure 9G) and its correlation with the total energy consumption in Poland lead to the conclusion that its share will not increase significantly in the coming years, unless decisive actions are taken using the support mechanisms discussed in this article. Simultaneously, it is necessary to incur investments in power transmission networks, especially in their expansion and modernization. There is already a noticeable problem with connecting new installations to the network (power grid). Such a seemingly simple problem may limit the development of RES. It is also important to educate about and encourage green lifestyles that promote the choice of green energy that has a positive impact on climate change.
The analysis carried out in this article, based on the originally selected methodology, and the obtained results support the process of expanding knowledge about the structure of renewable energy generation in Poland. The results of the forecasts calculated in this article, in view of the numerous studies on this subject currently being prepared, are a valuable source of searching for the value of electricity demand in Poland. The presented research suggests requirements regarding the potential of energy production from renewable sources to achieve the required shares of energy from RES in gross final energy consumption set by the European Commission. In 2020, Polish electricity imports from the Czech Republic, Sweden, Germany, Slovakia and Ukraine increased to a record level of 13.1 TWh net, which cost about PLN 3 billion [141]. Therefore, there are capacities to be replenished based on domestic production, and renewable energy can be the basic factor creating a positive balance. Due to the competitive costs of green energy production and significant environmental and social benefits, Poland in the coming years must strive to increase energy production from RES, and the presented forecasts should be a source of inspiration and an alarm signal for individual decision-makers. The changing macroeconomic, political and legislative situation in the international and domestic area are huge sources of uncertainty. The conducted research was based on publicly available data and a basic methodology was used, bearing in mind the complexity of risk factors related to the development of RES. The multithreading and complexity of this issue means that scientific methods may turn out to be unreliable and all forecasts will turn out to be defective, because they do not take into account elements that in the near future are difficult or even impossible to determine.
6. Conclusions
In Poland, when taking into account the goals set by the European Commission, it is necessary to accelerate the changes towards RES already introduced in energy and climate policy. The development of RES in Poland will depend to a large extent on taking quick action to expand the current, outdated energy infrastructure in the field of energy distribution and transmission. The popularity of the use of RES has contributed to the increase in the attractiveness of this type of investment for both business and individual investors. At the same time, the high rate of return on capital invested in green technologies causes greater interest in them. New technological solutions are also being introduced all the time in the field of production of photovoltaic panels, wind turbines, energy storage, etc. On the other hand, legal instability increases investor uncertainty.
In Polish conditions, the development of RES is possible only through the implementation of appropriate RES support mechanisms—the legal and administrative instruments and systemic solutions that will stimulate the interest of (especially private) investors in investments in this sector. The development of RES is impossible without external support due to the still high costs of this type of investment. Such support must also cover groups of electricity producers (system producers, business producers and prosumers). It is therefore necessary to properly stimulate and support their actions in this direction.
The innovativeness of this article centers on providing an original systematization of the support mechanisms used in the development of RES. In addition, to verify the effectiveness of these mechanisms, original forecasting methods were used in terms of predicting the amount of energy produced from RES.
The aim of the analysis presented in this article was to build forecasts of the production and consumption of electricity from RES in Poland using four categories of models: Brown, Holt, Winters and the cause-and-effect model. The final selection of one of the considered forecasting models for each predictor variable was carried out on the basis of the calculated values of the roots of the mean square error prediction (RMSE). On the basis of the selected models, forecasts were calculated for individual variables selected by the authors representing the installed capacity according to RES types and the aggregate value constituting their sum. The predictions obtained were acceptable. The methods used have been shown to have adequate predictive capacity. Forecasts were obtained, characterized by minor errors. As expected, the relatively short prediction horizon guarantees the accuracy of forecasts and the stability of results. The originality and additional value of the methods used lies in determining in the cause-and-effect model the impact of explanatory variables selected by the authors on the explanatory variables. As a result of the conducted research, the research hypothesis was adopted. The forecasts may be an advisory voice in the implementation of energy and climate policy in Poland.
The research results presented in the article show that there are many omissions in Poland in the field of RES development. The forecasts, despite the expected increases in energy production from RES, are pessimistic and, without decisive actions, the expected share of this energy will be difficult to achieve, as assumed in the plans at the level of 18.4% in 2025. Compared to other European countries, Poland is not doing well in delivering upon its commitments. For the further development of this sector in Poland, decisive systemic solutions are required that will enable the best use of support mechanisms for RES, but these activities must be carried out simultaneously with actions to improve the power transmission infrastructure. However, this is an expensive and time-consuming process.
The results of the conducted research can be summarized as follows:
- Poland, as a country with an electricity production sector based on coal and imported gas, must make significant efforts to decarbonize its economy;
- Significant volatility of Polish regulations related to the promotion of RES increases uncertainty for producers, prosumers and RES investors;
- In Poland, many instruments supporting RES are used, with some being phased out and new ones being introduced, which makes the support system opaque and inconsistent, and also results in difficulties in assessing the effectiveness and efficiency of individual instruments;
- The volume of Polish energy production from RES and the amount of capacity installed in Poland will increase (with the exception of hydropower), but to a level inadequate to ensure the implementation of climate policy goals;
- The conducted prediction indicates that the rich and diversified set of currently used RES support instruments will not ensure the fulfilment of the requirements of RES share in energy production and the expected reduction in GHG emissions, NO2 and NOx or dust.
The most important activities that can contribute to the development of RES are those related to investments in energy transmission infrastructure. It is necessary to modernize it and build new transmission lines that will give the opportunity to connect new RES capacities to them. This involves the need for additional financial support from the state in this area, and thus legislative support, which would accelerate the construction of new networks. The introduction of new technological solutions (including increasing the efficiency of photovoltaic panels and the introduction of hybrid solutions) increases the efficiency of energy electricity production, which enhances its competitiveness [142,143]. It is also necessary to conduct further research on the factors that influence the development of RES—especially towards better cooperation between the electricity generation system and the heat generation system. This would contribute to a better use of excess electricity—solar in the summer months—and redirecting it to the heating system (heating utility water). The solution could be energy storage, which will allow energy to be stored for a longer period of time. Because of their high cost, it is necessary to support the state in financing their purchase.
A very important element, although very often overlooked when discussing RES development barriers, is dialogue with society. Therefore, social campaigns promoting RES (wind farms and photovoltaic farms) are necessary. The lack of public awareness led to the pushing through the 10H rule, which significantly limited the possibility of building wind farms and houses and buildings in their vicinity. Expanding public awareness of the advantages and disadvantages of particular types, especially large RES installations, can significantly prevent unjustified public protests in the future.
To sum up, in order to raise public awareness and broaden knowledge in the field of RES, scientific research similar to that contained in this article is necessary. This study attempts to create knowledge that should be used to create climate policy in Poland.
Author Contributions
Conceptualization: M.S., K.W., A.M.-C., R.Ż.-N., K.R.; Methodology: M.S., K.W., A.M.-C., R.Ż.-N., Formal Analysis: M.S., K.W., A.M.-C., R.Ż.-N., K.R.; Investigation: A.M.-C., R.Ż.-N., K.W.; Resources: A.M.-C., R.Ż.-N., K.W., K.R.; Data Curation: R.Ż.-N., K.W.; Data Analysys: M.S., K.W.; Writing—Original Draft Preparation: M.S., A.M.-C., R.Ż.-N., K.W., K.R.; Writing—Review and Editing, K.R., K.W.; Visualization: K.W.; Supervision: K.R.; Project Administration: K.R.; Funding Acquisition: K.R. All authors have read and agreed to the published version of the manuscript.
Funding
This publication was financed by the subsidy granted to the Cracow University of Economics—Contract nr 23/EFE/2021/POT.
Institutional Review Board Statement
Not applicable.
Informed Consent Statement
Not applicable.
Data Availability Statement
Not applicable.
Acknowledgments
We would like to thank to the anonymous reviewers for their constructive comments, which have led to meaningful improvements in the paper.
Conflicts of Interest
The authors declare no conflict of interest.
References
- Masson-Delmotte, V.; Zhai, P.; Pirani, A.; Connors, S.L.; Péan, C.; Berger, S.; Zhou, B. Red Climate Change 2021: The Physical Science Basis. Contribution of Working Group I to the Sixth Assessment Report of the Intergovernmental Panel on Climate Change; Cambridge University Press: Cambridge, UK, 2021. [Google Scholar]
- United Nations Framework Convention on Climate Change. The Paris Agreement. Available online: https://unfccc.int/process-and-meetings/the-paris-agreement/the-paris-agreement (accessed on 14 September 2019).
- UN Climate Change Conference. (COP26) at the SEC—Glasgow 2021, UN Climate Change Conference at the SEC—Glasgow. 2021. Available online: https://ukcop26.org/ (accessed on 2 February 2022).
- COP 21|UNFCCC. Available online: https://unfccc.int/process-and-meetings/conferences/past-conferences/paris-climate-change-conference-november-2015/cop-21 (accessed on 2 February 2022).
- Nestle, I. Evaluation of Risk in Cost-Benefit Analysis of Climate Change. In Economics and Management of Climate Change; Hansju, B., Antes, R., Eds.; Springer: Berlin/Heidelberg, Germany, 2008; pp. 23–35. Available online: https://link-1springer-1com-10fzxbuki00d5.han.uek.krakow.pl/chapter/10.1007/978-0-387-77353-7_3, (accessed on 2 November 2020).
- KLIMADA. Przyszłe Zmiany Klimatu, Scenariusze Klimatyczne Polski w XXI Wieku. Available online: http://klimada.mos.gov.pl/zmiany-klimatu-w-polsce/przyszle-zmiany-klimatu/ (accessed on 30 July 2021).
- State and Trends in Adaptation 2020. Global Center Adaptation. 2020. Available online: https://gca.org/reports/state-and-trends-in-adaptation-report-2020/ (accessed on 10 October 2021).
- FPFIS. Economic Analysis of Selected Climate Impacts, EU Science Hub—European Commission. Available online: https://ec.europa.eu/jrc/en/publication/economic-analysis-selected-climate-impacts (accessed on 8 June 2020).
- Ziervogel, G.; New, M.; van Garderen, E.A.; Midgley, G.; Taylor, A.; Hamann, R.; Stuart-Hill, S.; Myers, J.; Warburton, M. Climate change impacts and adaptation in South Africa. WIREs Clim. Chang. 2014, 5, 605–620. [Google Scholar] [CrossRef]
- Hellmuth, M.E. Climate Risk Management in Africa: Learning from Practice; International Research Institute for Climate and Society: New York, NY, USA, 2007. [Google Scholar]
- Mukherjee, A.; Rakshit, S.; Nag, A.; Ray, M.; Kharbikar, H.L.; Shubha, K.; Sarkar, S.; Paul, S.; Roy, S.; Maity, A.; et al. Climate Change Risk Perception, Adaptation and Mitigation Strategy: An Extension Outlook in Mountain Himalaya. In Conservation Agriculture; Springer: Singapore, 2016; pp. 257–292. [Google Scholar] [CrossRef]
- Nieto, M.J. Banks, climate risk and financial stability. J. Financ. Regul. Compliance 2019, 27, 243–262. [Google Scholar] [CrossRef]
- Plac, K. Climate as an area of strategic intervention in urban development. Bibl. Reg. 2020, 109–123. [Google Scholar] [CrossRef]
- Kazmierczak, A.; Europejska Agencja Środowiska. Urban Adaptation in Europe: How Cities and Towns Respond to Climate Change; Publications Office of the European Union: Luxembourg, 2020. Available online: https://data.europa.eu/doi/10.2800/324620 (accessed on 23 July 2021).
- Dickson, E.; Baker, J.L.; Hoornweg, D.; Asmita, T. Urban Risk Assessments: An Approach for Understanding Disaster and Climate Risk in Cities; World Bank Publications: Washington, DC, USA, 2012. [Google Scholar]
- European Environment Agency. Urban Adaptation in Europe: How Cities and Towns Respond to Climate Change. Publication. Available online: https://www.eea.europa.eu/publications/urban-adaptation-in-europe (accessed on 10 October 2021).
- Sokołowski, M.M. Artificial intelligence and climate-energy policies of the EU and Japan. In Regulating Artificial Intelligence in Industry; Bielicki, D., Ed.; Routledge: London, UK, 2021; pp. 138–155. [Google Scholar] [CrossRef]
- Council of the European Union. Council Resolution of 21 June 1989 on the Greenhouse Effect and the Community (89/C 183/03); Council of the European Union: Brussels, Belgium, 1989.
- Draft Council Resolution on the Greenhouse Effect and the Community Com 1998/656 Final. 1988. Available online: https://eur-lex.europa.eu/legal-content/PL/ALL/?uri=CELEX:51988PC0656&qid=1643809398380, (accessed on 2 February 2022).
- Boasson, E.L.; Wettestad, J. EU Climate Policy: Industry, Policy Interaction and External Environment; Routledge: London, UK, 2016. [Google Scholar]
- European Climate Change Programme. Available online: https://ec.europa.eu/clima/eu-action/european-climate-change-programme_pl (accessed on 2 February 2022).
- Climate & Energy Package. Available online: https://ec.europa.eu/clima/eu-action/climate-strategies-targets/2020-climate-energy-package_en (accessed on 2 February 2022).
- Wojtkowska-Łodej, G.; Nyga-Łukaszewska, H. Convergence or divergence of the European Union’s energy strategy in the Central European countries? CES Work. Pap. 2019, 11, 91–110. [Google Scholar]
- EUROPE 2020 A Strategy for Smart, Sustainable and Inclusive Growth. COM(2010) 2020 Final. 2010. Available online: https://eur-lex.europa.eu/legal-content/AUTO/?uri=CELEX:52010DC2020&qid=1643832215833&rid=1 (accessed on 2 February 2022).
- European Environment Agency. Trends and Projections in Europe 2016—Tracking Progress Towards Europe’s Climate and Energy Targets, EEA Raport 29; European Environment Agency: Copenhagen, Denmark, 2016.
- Kryk, B.; Guzowska, M. Implementation of Climate/Energy Targets of the Europe 2020 Strategy by the EU Member States. Energies 2021, 14, 2711. [Google Scholar] [CrossRef]
- The European Green Deal. 2019. Available online: http://ec.europa.eu/eurostat/web/european-statistical-system/legislation-in-force (accessed on 16 February 2017).
- Q&A: How ‘Fit for 55’ Reforms Will Help EU Meet Its Climate Goals. Carbon Brief. 29 July 2021. Available online: https://www.carbonbrief.org/qa-how-fit-for-55-reforms-will-help-eu-meet-its-climate-goals (accessed on 5 May 2022).
- United Nations Conference on Environment and Development, Rio de Janeiro, Brazil, 3–14 June 1992. United Nations. Available online: https://www.un.org/en/conferences/environment/rio1992 (accessed on 5 May 2022).
- Kyoto Protocol—Targets for the First Commitment Period|UNFCCC. Available online: https://unfccc.int/process-and-meetings/the-kyoto-protocol/what-is-the-kyoto-protocol/kyoto-protocol-targets-for-the-first-commitment-period (accessed on 5 May 2022).
- COP 24|UNFCCC. Available online: https://unfccc.int/process-and-meetings/conferences/past-conferences/katowice-climate-change-conference-december-2018/sessions-of-negotiating-bodies/cop-24 (accessed on 2 February 2022).
- Malec, M. The prospects for decarbonisation in the context of reported resources and energy policy goals: The case of Poland. Energy Policy 2021, 161, 112763. [Google Scholar] [CrossRef]
- Budzianowski, W.M. Target for national carbon intensity of energy by 2050: A case study of Poland’s energy system. Energy 2012, 46, 575–581. [Google Scholar] [CrossRef]
- Dzikuć, M.; Gorączkowska, J.; Piwowar, A.; Dzikuć, M.; Smoleński, R.; Kułyk, P. The analysis of the innovative potential of the energy sector and low-carbon development: A case study for Poland. Energy Strat. Rev. 2021, 38, 100769. [Google Scholar] [CrossRef]
- Ney, R. Niektóre uwarunkowania polskiej polityki energetycznej. Polityka Energetyczna 2009, 12, 5–17. Available online: http://yadda.icm.edu.pl/baztech/element/bwmeta1.element.baztech-article-BPB7-0019-0006 (accessed on 14 February 2022).
- Ustawa z Dnia 24 Lutego 1990 r. O Likwidacji Wspólnoty Węgla Kamiennego i Wspólnoty Energetyki i Węgla Brunatnego 1990. Available online: https://isap.sejm.gov.pl/isap.nsf/DocDetails.xsp?id=WDU19900140089 (accessed on 14 February 2022).
- Ustawa z Dnia 10 Kwietnia 1997 r.—Prawo Energetyczne. 1997. Available online: https://isap.sejm.gov.pl/isap.nsf/DocDetails.xsp?id=WDU19970540348 (accessed on 14 February 2022).
- Wohlgemuth, N.; Wojtkowska-Łodej, G. Policies for the promotion of renewable energy in Poland. Appl. Energy 2003, 76, 111–121. [Google Scholar] [CrossRef]
- Rosiek, K. Kształtowanie rynku energii w Polsce. Zesz. Nauk. Akad. Ekon. Krakowie 2005, 668, 35–44. [Google Scholar]
- Gabryś, H.L. Jak zmieniała się energetyka w Polsce w ciągu ostatnich dwudziestu kilku lat? (Niekoniecznie obiektywny, ale za to nieco emocjonalny osąd współkreatora i uczestnika tych zmian). Energetyka 2014, 7, 377–381. Available online: https://www.cire.pl/pliki/2/jakzmienialasieenergetykawpolscewciaguostatnichdwudziestukilkulat.pdf (accessed on 14 February 2022).
- Polityka Energetyczna Polski do 2030 Roku. Ministerstwo Gospodarki. 2009. Available online: https://www.gov.pl/web/aktywa-panstwowe/polityka-energetyczna-polski-do-2030-roku (accessed on 14 February 2022).
- Polityka Energetyczna Polski do 2040 r.—Ministerstwo Klimatu i Środowiska. 2021. Available online: https://www.gov.pl/web/klimat/polityka-energetyczna-polski (accessed on 14 February 2022).
- Wnioski z Analiz Prognostycznych na Potrzeby Polityki Energetycznej Polski Do 2050 Roku—Załącznik 2. Do Polityki Energetycznej Polski Do 2050 Roku; Ministerstwo Gospodarki: Warszawa, Poland, 2015. Available online: https://bip.mos.gov.pl/fileadmin/user_upload/bip/strategie_plany_programy/Polityka_energetyczna_Polski/zal._2_do_PEP2040_-_Wnioski_z_analiz_prognostycznych_2021-02-02.pdf (accessed on 2 February 2022).
- Krajowy Plan na Rzecz Energii i Klimatu na Lata 2021–2030: Cele i Zadania Oraz Polityki i Działania, Ministerstwo Energii RP. Available online: https://ec.europa.eu/energy/sites/ener/files/documents/poland_draftnecp_en.pdf (accessed on 2 February 2022).
- Gurgul, H.; Lach, Ł. The electricity consumption versus economic growth of the Polish economy. Energy Econ. 2012, 34, 500–510. [Google Scholar] [CrossRef] [Green Version]
- Bildirici, M.E.; Kayıkcı, F.; Kayikçi, F. Economic Growth and Electricity Consumption in Emerging Countries of Europa: An ARDL Analysis. Econ. Res.-Ekon. Istraživanja 2012, 25, 538–559. [Google Scholar] [CrossRef] [Green Version]
- Bayar, Y.; Özel, H.A. Electricity Consumption and Economic Growth in Emerging Economies. J. Knowl. Manag. Econ. Inf. Technol. 2014, 4, 1–18. Available online: https://ideas.repec.org/a/spp/jkmeit/1453.html (accessed on 5 May 2022).
- Khobai, H. Electricity Consumption and Economic Growth: A Panel Data Approach to BRICS Countries; Department of Economics, Nelson Mandela University: Gqeberha, South Africa, 2017; Volume 1707, Available online: https://ideas.repec.org/p/mnd/wpaper/1707.html (accessed on 5 May 2022).
- Engel, H.; Purta, M.; Speelman, E.; Szarek, G.; van der Pluijm, P. Neutralna Emisyjnie Polska 2050; McKinsey: Charlotte, NA, USA, 2020; Available online: https://www.mckinsey.com/pl/our-insights/carbon-neutral-poland-2050 (accessed on 5 May 2022).
- Mazurek-Czarnecka, A. Solar Energy is an Important Trend in the Development of the Energy Sector in Poland; Cordoba, Spain, 2021; pp. 4515–4522. Available online: https://ibima.org/accepted-paper/solar-energy-is-an-important-trend-in-the-development-of-the-energy-sector-in-poland/ (accessed on 2 February 2022).
- Mielczarski, W. Odnawialne Źródła Energii jako element Nowego Zielonego Ładu. ACADEMIA-Mag. Pol. Akad. Nauk. 2021, 1, 84–87. [Google Scholar]
- Jankowska, K.; Ancygier, A.; Solorio, I.; Jörgens, H. Poland at the renewable energy policy crossroads: An incongruent Europeanization? In A Guide to EU Renewable Energy Policy; Edward Elgar Publishing: Cheltenham, UK, 2017; pp. 183–203. [Google Scholar] [CrossRef]
- Skjærseth, J.B. Implementing EU climate and energy policies in Poland: Policy feedback and reform. Environ. Politics 2018, 27, 498–518. [Google Scholar] [CrossRef]
- Gawlik, L.; Mokrzycki, E. Changes in the Structure of Electricity Generation in Poland in View of the EU Climate Package. Energies 2019, 12, 3323. [Google Scholar] [CrossRef] [Green Version]
- Piwowar, A. Agricultural Biogas—An Important Element in the Circular and Low-Carbon Development in Poland. Energies 2020, 13, 1733. [Google Scholar] [CrossRef] [Green Version]
- Gnatowska, R.; Moryń-Kucharczyk, E. The Place of Photovoltaics in Poland’s Energy Mix. Energies 2021, 14, 1471. [Google Scholar] [CrossRef]
- Gnatowska, R.; Moryń-Kucharczyk, E. Current status of wind energy policy in Poland. Renew. Energy 2018, 135, 232–237. [Google Scholar] [CrossRef]
- Brodny, J.; Tutak, M.; Saki, S. Forecasting the Structure of Energy Production from Renewable Energy Sources and Biofuels in Poland. Energies 2020, 13, 2539. [Google Scholar] [CrossRef]
- Ziembicki, P.; Kozioł, J.; Bernasiński, J.; Nowogoński, I. Innovative System for Heat Recovery and Combustion Gas Cleaning. Energies 2019, 12, 4255. [Google Scholar] [CrossRef] [Green Version]
- Igliński, B.; Iglińska, A.; Koziński, G.; Skrzatek, M.; Buczkowski, R. Wind energy in Poland—History, current state, surveys, Renewable Energy Sources Act, SWOT analysis. Renew. Sustain. Energy Rev. 2016, 64, 19–33. [Google Scholar] [CrossRef]
- Piechota, G.; Igliński, B. Biomethane in Poland—Current Status, Potential, Perspective and Development. Energies 2021, 14, 1517. [Google Scholar] [CrossRef]
- Pietrzak, M.B.; Igliński, B.; Kujawski, W.; Iwański, P. Energy Transition in Poland—Assessment of the Renewable Energy Sector. Energies 2021, 14, 2046. [Google Scholar] [CrossRef]
- Paska, J.; Sałek, M.; Surma, T. Current status and perspectives of renewable energy sources in Poland. Renew. Sustain. Energy Rev. 2009, 13, 142–154. [Google Scholar] [CrossRef]
- Wagner, A.; Grobelski, T.; Harembski, M. Is energy policy a public issue? Nuclear power in Poland and implications for energy transitions in Central and East Europe. Energy Res. Soc. Sci. 2016, 13, 158–169. [Google Scholar] [CrossRef]
- Jankowska, B.; Staliński, A.; Trąpczyński, P. Public policy support and the competitiveness of the renewable energy sector—The case of Poland. Renew. Sustain. Energy Rev. 2021, 149, 111235. [Google Scholar] [CrossRef]
- Milanés-Montero, P.; Arroyo-Farrona, A.; Pérez-Calderón, E. Assessment of the Influence of Feed-In Tariffs on the Profitability of European Photovoltaic Companies. Sustainability 2018, 10, 3427. [Google Scholar] [CrossRef] [Green Version]
- Alolo, M.; Azevedo, A.; El Kalak, I. The effect of the feed-in-system policy on renewable energy investments: Evidence from the EU countries. Energy Econ. 2020, 92, 104998. [Google Scholar] [CrossRef]
- OECD. Renewable Energies in the Middle East and North Africa: Policies to Support Private Investment; Organisation for Economic Co-Operation and Development: Paris, France, 2013; Available online: https://0-www-oecd--ilibrary-org.brum.beds.ac.uk/finance-and-investment/renewable-energies-in-the-middle-east-and-north-africa_9789264183704-en (accessed on 11 February 2022).
- Pożyczka na Produkcję i Dystrybucję Energii ze Źródeł Odnawialnych. BGK. Available online: https://www.bgk.pl/podmioty-rynku-mieszkaniowego/efektywnosc-energetyczna-i-oze/pozyczka-na-produkcje-i-dystrybucje-energii-ze-zrodel-odnawialnych-z-projektu-inwestycje-innowacje-energetyka-dla-wojewodztwa-dolnoslaskiego/ (accessed on 23 February 2022).
- Mój Prąd. Available online: https://mojprad.gov.pl/ (accessed on 23 February 2022).
- GLOBEnergia. Znamy Budżet Programu Mój Prąd 4.0—Nowy Nabór Ruszy w I Kwartale 2022 Roku. Available online: https://globenergia.pl/znamy-budzet-programu-moj-prad-4-0-nowy-nabor-ruszy-w-i-kwartale-2022-roku/ (accessed on 23 February 2022).
- Dyduch, J.; Rosiek, K. Analiza wpływów i wydatków funduszy ekologicznych w latach 1997-2008. In Ocena Funduszy Ekologicznych w Świetle Ich Dalszego Funkcjonowania w Polsce; Górka, K., Małecki, P.P., Eds.; Uniwersytet Ekonomiczny w Krakowie: Kraków, Poland, 2011; pp. 59–118. [Google Scholar]
- Górka, K.; Rosiek, K. Zmiany roli funduszy ochrony środowiska i gospodarki wodnej w finansowaniu polityki ekologicznej w Polsce. Zesz. Nauk. Akad. Ekon. Krakowie 2007, 732, 51–74. [Google Scholar]
- Anderson, G.D.; Zylicz, T. The role of Polish environmental funds: Too generous or too restrictive? Environ. Dev. Econ. 1999, 4, 413–448. [Google Scholar] [CrossRef]
- Małecki, P.P. The Role of Ecological Fees in the Functioning of Polish Environmental Protection and Water Management Funds. Econ. Environ. Stud. 2010, 1, 136–148. [Google Scholar]
- Dofinansowanie w Nowej Wersji Programu Energia Plus. gramwzielone.pl. Available online: https://www.gramwzielone.pl/trendy/103903/dofinansowanie-w-nowej-wersji-programu-energia-plus (accessed on 23 February 2022).
- Energia Plus. WFOSiGW. Available online: http://wfosigw.olsztyn.pl/srodki-unijne/doradztwo-energetyczne-old/energia-plus/ (accessed on 23 February 2022).
- Dotacje OZE—Jakie Dofinansowanie w 2022? Enerad.pl. Available online: https://enerad.pl/aktualnosci/dotacje-oze/ (accessed on 23 February 2022).
- Premia Termomodernizacyjna z Funduszu Termomodernizacji i Remontów. BGK. Available online: https://www.bgk.pl/male-i-srednie-przedsiebiorstwa/modernizacja-i-rewitalizacja/premia-termomodernizacyjna-z-funduszu-termomodernizacji-i-remontow/ (accessed on 23 February 2022).
- Program Priorytetowy «AGROENERGIA»”, WFOŚiGW Poznań. Available online: https://www.wfosgw.poznan.pl/programy/program-priorytetowy-agroenergia/ (accessed on 23 February 2022).
- Dz. U. z 2018 r. poz. 2389, Ustawa z Dnia 20 Lutego 2015 r. O Odnawialnych Źródłach Energii. Available online: https://isap.sejm.gov.pl/isap.nsf/DocDetails.xsp?id=WDU20150000478 (accessed on 2 February 2022).
- Urząd Regulacji Energetyki. System Aukcyjny dla Odnawialnych Źródeł energii ma 5 lat. Urząd Regulacji Energetyki. Available online: https://www.ure.gov.pl/pl/urzad/informacje-ogolne/aktualnosci/8739,System-aukcyjny-dla-odnawialnych-zrodel-energii-ma-5-lat.html (accessed on 23 February 2022).
- Dz.U. 2018 poz. 2525, Rozporządzenie Ministra Finansów z Dnia 28 Grudnia 2018 r. w Sprawie Zwolnień od Podatku Akcyzowego. Available online: https://isap.sejm.gov.pl/isap.nsf/DocDetails.xsp?id=WDU20180002525, (accessed on 2 February 2022).
- IPPP1/4512-702/15-2/AW—Pismo Wydane Przez: Izba Skarbowa w Warszawie—OpenLEX. Available online: https://sip.lex.pl/orzeczenia-i-pisma-urzedowe/pisma-urzedowe/ippp1-4512-702-15-2-aw-pismo-wydane-przez-izba-skarbowa-w-184828489 (accessed on 23 February 2022).
- Dz.U. 2018 poz. 1276, Ustawa z Dnia 7 Czerwca 2018 r. O Zmianie Ustawy o Odnawialnych Źródłach Energii Oraz Niektórych Innych Ustaw. Available online: https://isap.sejm.gov.pl/isap.nsf/DocDetails.xsp?id=WDU20180001276, (accessed on 2 February 2022).
- Soliński, B. Support mechanisms for the promotion renewable energy sources—Feed in Tariff and Tradable Green Certifi-cates comparison. Energy Policy J. 2008, 11, 107–111. [Google Scholar]
- Urząd Regulacji Energetyki. Podstawowe Informacje i Wzory. Urząd Regulacji Energetyki. Available online: https://www.ure.gov.pl/pl/oze/systemy-fitfip/7634,Podstawowe-informacje-i-wzory.html (accessed on 23 February 2022).
- Zmiany w Systemie Opustów Prosumentów ma Zachęcić do Inwestycji w Magazyny Energii. Serwis Informacyjny Cire 24. Available online: https://www.cire.pl/artykuly/serwis-informacyjny-cire-24/sejm-komisja-chce-aby-system-opustow-dla-prosumentow-obowiazywal-do-31-marca-2022-r (accessed on 23 February 2022).
- System Opustów dla Prosumentów do 31 Marca 2022 r. wnp.pl. Available online: https://www.wnp.pl/energetyka/system-opustow-dla-prosumentow-do-31-marca-2022-r,502462.html (accessed on 23 July 2021).
- Umowy PPA w Polsce. Co Warto o Nich Wiedzieć? GRAMwZIELONE.pl. Available online: https://gramwzielone.pl/umowy-ppa-w-polsce-co-warto-o-nich-wiedziec (accessed on 23 February 2022).
- Skorupka, M.J.; Mikłaszewicz, B. Umowa PPA (Power Purchase Agreement) w Polsce”, KBPP, 10 Czerwiec 2021. Available online: https://kbpp.pl/pl/aktualnosci/umowa-ppa-power-purchase-agreement-w-polsce/ (accessed on 23 February 2022).
- Levy, A. From Hotelling to Backstop Technology. Faculty of Business—Economics Working Papers. 2000. Available online: https://ro.uow.edu.au/commwkpapers/25 (accessed on 2 February 2022).
- Hotelling, H. The Economics of Exhaustible Resources. J. Political Econ. 1931, 39, 137–175. [Google Scholar] [CrossRef]
- Devarajan, S.; Fisher, A.C. Hotelling’s «Economics of Exhaustible Resources»: Fifty Years Later. J. Econ. Lit. 1981, 19, 65–73. [Google Scholar]
- Fischer, C.; Salant, S. On Hotelling, Emissions Leakage, and Climate Policy Alternative. Resour. Future Discuss. Pap. 2010, 11–16. [Google Scholar]
- Graczyk, A.M. Gospodarowanie Odnawialnymi Zródłami Energii w Ekonomii Rozwoju Zrównoważonego: Teoria i Praktyka; PWN: Warszawa, Poland, 2019. [Google Scholar]
- Tahvonen, O. Fossil Fuels, Stock Externalities, and Backstop Technology. Can. J. Econ. 1997, 30, 855. [Google Scholar] [CrossRef]
- Fisher, A.C. Resource and Environmental Economics; CUP Archive: Cambridge, UK, 1981. [Google Scholar]
- Jankowska, K. Poland’s Clash Over Energy and Climate Policy: Green Economy or Grey Status Quo? In The European Union in International Climate Change Politics; Routledge: London, UK, 2016. [Google Scholar]
- PS. Energochłonność Pierwotna PKB z Korektą Klimatyczną (SDG_7.1A). Available online: https://sdg.gov.pl/ (accessed on 25 July 2021).
- Eurostat. Energy Productivity (SDG_07_30). Available online: https://ec.europa.eu/eurostat/databrowser/view/sdg_07_30/default/table?lang=en (accessed on 23 February 2022).
- PS. Zasady Metodyczne Sprawozdawczości Statystycznej z Zakresu Gospodarki Paliwami i Energią Oraz Definicje Stosowanych Pojęć. 2006. Available online: https://stat.gov.pl/obszary-tematyczne/srodowisko-energia/energia/zasady-metodyczne-sprawozdawczosci-statystycznej-z-zakresu-gospodarki-paliwami-i-energia-oraz-definicje-stosowanych-pojec,7,1.html (accessed on 1 March 2022).
- URE. Informacja nr 44/2016 Informacja Prezesa Urzędu Regulacji Energetyki w Sprawie Stosowania Pojęcia Mocy Zainstalowanej Elektrycznej; URE: Warszawa, Poland, 2016. [Google Scholar]
- Ministerstwo Aktywów Państwowych RP. Transformacja Sektora Elektroenergetycznego w Polsce. Wydzielenie Wytwórczych Aktywów Węglowych ze Spółek z Udziałem Skarbu Państwa. Available online: https://www.gov.pl/web/aktywa-panstwowe/program-transformacji-sektora-elektroenergetycznego (accessed on 2 February 2022).
- Directive 2009/28/EC of the European Parliament and of the Council of 23 April 2009 on the Promotion of the Use of Energy from Renewable Sources and Amending and Subsequently Repealing Directives 2001/77/EC and 2003/30/EC; Dz.U. L 140 z 5.6.2009, str. 16—62. 2009. Available online: http://data.europa.eu/eli/dir/2009/28/oj/eng, (accessed on 2 February 2022).
- Directive (EU) 2018/2001 of the European Parliament and of the Council of 11 December 2018 on the Promotion of the Use of Energy from Renewable Sources (Text with EEA Relevance.), t. 328. 2018. Available online: http://data.europa.eu/eli/dir/2018/2001/oj/eng, (accessed on 2 February 2022).
- PS. Ekonomiczne Aspekty Ochrony Środowiska 2020/Economic Aspects of Environmental Protection 2020. stat.gov.pl. 2021. Available online: https://stat.gov.pl/obszary-tematyczne/srodowisko-energia/srodowisko/ekonomiczne-aspekty-ochrony-srodowiska-2019,14,1.html (accessed on 11 February 2022).
- PS. Energia ze Źródeł Odnawialnych w 2019 Roku/Energy from Renewable Resources 2019. 2020. Available online: https://stat.gov.pl/obszary-tematyczne/srodowisko-energia/energia/energia-ze-zrodel-odnawialnych-w-2020-roku,10,4.html (accessed on 11 February 2022).
- Dz.U. 2016 poz. 961, Ustawa z Dnia 20 Maja 2016 r. O Inwestycjach w Zakresie Elektrowni Wiatrowych. 2016. Available online: https://isap.sejm.gov.pl/isap.nsf/DocDetails.xsp?id=WDU20160000961 (accessed on 2 February 2022).
- Księżopolski, K.; Maśloch, G. Time Delay Approach to Renewable Energy in the Visegrad Group. Energies 2021, 14, 1928. [Google Scholar] [CrossRef]
- Gianfreda, A.; Ravazzolo, F.; Rossini, L. Comparing the forecasting performances of linear models for electricity prices with high RES penetration. Int. J. Forecast. 2020, 36, 974–986. [Google Scholar] [CrossRef]
- Goncalves, C.; Pinson, P.; Bessa, R.J. Towards Data Markets in Renewable Energy Forecasting. IEEE Trans. Sustain. Energy 2020, 12, 533–542. [Google Scholar] [CrossRef]
- Sweeney, C.; Bessa, R.J.; Browell, J.; Pinson, P. The future of forecasting for renewable energy. WIREs Energy Environ. 2019, 9. [Google Scholar] [CrossRef]
- Brodny, J.; Tutak, M. Analyzing Similarities between the European Union Countries in Terms of the Structure and Volume of Energy Production from Renewable Energy Sources. Energies 2020, 13, 913. [Google Scholar] [CrossRef] [Green Version]
- Liu, T.; Xu, G.; Cai, P.; Tian, L.; Huang, Q. Development forecast of renewable energy power generation in China and its influence on the GHG control strategy of the country. Renew. Energy 2011, 36, 1284–1292. [Google Scholar] [CrossRef]
- Celiktas, M.S.; Kocar, G. From potential forecast to foresight of Turkey’s renewable energy with Delphi approach. Energy 2010, 35, 1973–1980. [Google Scholar] [CrossRef]
- Daim, T.; Harell, G.; Hogaboam, L. Forecasting renewable energy production in the US. Foresight 2012, 14, 225–241. [Google Scholar] [CrossRef]
- Mirosław, P. Prognozowanie ultrakrótkoterminowe mocy generowanej w odnawialnych źródłach energii z wykorzystaniem logiki rozmytej. Przegląd Elektrotech. 2014, 90, 265–268. [Google Scholar] [CrossRef]
- He, D.; Liu, R. Ultra-short-term wind power prediction using ANN ensemble based on PCA. In Proceedings of the 7th International Power Electronics and Motion Control Conference, Harbin, China, 2–5 June 2012; Volume 3, pp. 2108–2112. [Google Scholar] [CrossRef]
- Kang, C.; Yong, C.; Feng, X.; Chuanzhi, X.; Xiaofang, S.; Dongkuo, S.; Maosheng, D.; Jun, Z.; Li, X.; Jiafeng, S.; et al. Ultra-short-term wind power prediction and its application in early-warning system of power systems security and stability. In Proceedings of the 2011 4th International Conference on Electric Utility Deregulation and Restructuring and Power Technologies (DRPT), Weihai, China, 6–9 July 2011; pp. 682–687. [Google Scholar] [CrossRef]
- Potter, C.; Negnevitsky, M. Very Short-Term Wind Forecasting for Tasmanian Power Generation. IEEE Trans. Power Syst. 2006, 21, 965–972. [Google Scholar] [CrossRef]
- Khalid, M.; Savkin, A.V. A Method for Short-Term Wind Power Prediction with Multiple Observation Points. IEEE Trans. Power Syst. 2012, 27, 579–586. [Google Scholar] [CrossRef]
- Piotrowski, P. Analiza statystyczna danych do prognozowania ultrakrótkoterminowego produkcji energii elektrycznej w systemach fotowoltaicznych. Przeglad Elektrotech. 2014, 90, 1–4. [Google Scholar] [CrossRef]
- Baczyński, D.; Piotrowski, P. Prognozowanie Dobowej Produkcji Energii Elektrycznej Przez Turbinę Wiatrową z Horyzontem 1 Doby”, Przegląd Elektrotechniczny, nr R. 90, nr 9, s. 113–117. 2014. Available online: http://pe.org.pl/articles/2014/9/31.pdf, (accessed on 2 February 2022).
- Zielińska-Sitkiewicz, M.; Chrzanowska, M.; Furmańczyk, K.; Paczutkowski, K. Analysis of Electricity Consumption in Poland Using Prediction Models and Neural Networks. Energies 2021, 14, 6619. [Google Scholar] [CrossRef]
- EUCALC. European-Calculator. Available online: https://www.european-calculator.eu/ (accessed on 23 February 2022).
- Jónsson, T.; Pinson, P.; Nielsen, H.A.; Madsen, H. Exponential Smoothing Approaches for Prediction in Real-Time Electricity Markets. Energies 2014, 7, 3710–3732. [Google Scholar] [CrossRef] [Green Version]
- Garcia, D.; Puig, V.; Quevedo, J. Prognosis of Water Quality Sensors Using Advanced Data Analytics: Application to the Barcelona Drinking Water Network. Sensors 2020, 20, 1342. [Google Scholar] [CrossRef] [PubMed] [Green Version]
- Liu, D.-J.; Li, L. Application Study of Comprehensive Forecasting Model Based on Entropy Weighting Method on Trend of PM2.5 Concentration in Guangzhou, China. Int. J. Environ. Res. Public Health 2015, 12, 7085–7099. [Google Scholar] [CrossRef] [Green Version]
- Escobet, A.; Escobet, T.; Quevedo, J.; Molina, A. Sensor-Data-Driven Prognosis Approach of Liquefied Natural Gas Satellite Plant. Appl. Syst. Innov. 2020, 3, 34. [Google Scholar] [CrossRef]
- Rahman, H.; Selvarasan, I.; Begum A, J. Short-Term Forecasting of Total Energy Consumption for India-A Black Box Based Approach. Energies 2018, 11, 3442. [Google Scholar] [CrossRef] [Green Version]
- Taylor, J.W. Triple seasonal methods for short-term electricity demand forecasting. Eur. J. Oper. Res. 2010, 204, 139–152. [Google Scholar] [CrossRef] [Green Version]
- Rahman, A.; Ahmar, A.S. Forecasting of primary energy consumption data in the United States: A comparison between ARIMA and Holter-Winters models. AIP Conf. Proc 2017, 1885, 020163. [Google Scholar] [CrossRef] [Green Version]
- Trull, O.; García-Díaz, J.C.; Troncoso, A. Application of Discrete-Interval Moving Seasonalities to Spanish Electricity Demand Forecasting during Easter. Energies 2019, 12, 1083. [Google Scholar] [CrossRef] [Green Version]
- Mariño, M.D.; Arango, A.; Lotero, L.; Jimenez, M. Modelos de series temporales para pronóstico de la demanda eléctrica del sector de explotación de minas y canteras en Colombia. Rev. EIA 2021, 18, 77–99. [Google Scholar] [CrossRef]
- Papaioannou, G.P.; Dikaiakos, C.; Dramountanis, A.; Papaioannou, P.G. Analysis and Modeling for Short- to Medium-Term Load Forecasting Using a Hybrid Manifold Learning Principal Component Model and Comparison with Classical Statistical Models (SARIMAX, Exponential Smoothing) and Artificial Intelligence Models (ANN, SVM): The Case of Greek Electricity Market. Energies 2016, 9, 635. [Google Scholar] [CrossRef] [Green Version]
- Deng, C.; Zhang, X.; Huang, Y.; Bao, Y. Equipping Seasonal Exponential Smoothing Models with Particle Swarm Optimization Algorithm for Electricity Consumption Forecasting. Energies 2021, 14, 4036. [Google Scholar] [CrossRef]
- Akpinar, M.; Yumusak, N. Year Ahead Demand Forecast of City Natural Gas Using Seasonal Time Series Methods. Energies 2016, 9, 727. [Google Scholar] [CrossRef]
- Regulation (EU) 2020/852 of 18 June 2020 on the Establishment of a Framework to Facilitate Sustainable Investment, and Amending Regulation (EU) 2019/2088, t. 198. 2020. Available online: http://data.europa.eu/eli/reg/2020/852/oj/eng (accessed on 2 February 2022).
- Klimat Polski 2020; IMGW-PIB: Warszawa, Poland, 2021.
- Importujemy Coraz Więcej Prądu i… Ratujemy Sąsiadów Eksportem—WysokieNapiecie.pl. Available online: https://wysokienapiecie.pl/35185-importujemy-coraz-wiecej-pradu-ratujemy-sasiadow-eksportem/ (accessed on 23 February 2022).
- Chaurasiya, P.K.; Kumar, V.K.; Warudkar, V.; Ahmed, S. Evaluation of wind energy potential and estimation of wind turbine characteristics for two different sites. Int. J. Ambient Energy 2021, 42, 1409–1419. [Google Scholar] [CrossRef]
- Chaurasiya, P.K.; Rajak, U.; Singh, S.K.; Verma, T.N.; Sharma, V.K.; Kumar, A.; Shende, V. A review of techniques for increasing the productivity of passive solar stills. Sustain. Energy Technol. Assess. 2022, 52, 102033. [Google Scholar] [CrossRef]
Figure 1.
Mechanisms to support RES used in Poland. Source: own study.

Figure 2.
Diagram of the test procedure used to verify the hypothesis. Source: own study.

Figure 3.
Energy production and GDP in Poland (1990–2020). Source: Energy. Statistical Yearbook, SP.
Figure 3.
Energy production and GDP in Poland (1990–2020). Source: Energy. Statistical Yearbook, SP.

Figure 4.
Structure of primary electricity energy production from RES in 2019 in the EU and Poland. Source: SP, https://strateg.stat.gov.pl (accessed on 22 February 2022).
Figure 4.
Structure of primary electricity energy production from RES in 2019 in the EU and Poland. Source: SP, https://strateg.stat.gov.pl (accessed on 22 February 2022).

Figure 5.
Share of electricity energy from RES in gross final consumption of energy in Poland, 2005–2020 (%). Source: SP, https://strateg.stat.gov.pl (accessed on 22 February 2022).
Figure 5.
Share of electricity energy from RES in gross final consumption of energy in Poland, 2005–2020 (%). Source: SP, https://strateg.stat.gov.pl (accessed on 22 February 2022).

Figure 6.
Share of RES in final gross electricity energy consumption in the EU and Poland (%). * 2019 for EU. Source: Energy. Statistical Yearbook, SP.
Figure 6.
Share of RES in final gross electricity energy consumption in the EU and Poland (%). * 2019 for EU. Source: Energy. Statistical Yearbook, SP.

Figure 7.
Installed capacity by type of RES in Poland in the years 2005–2020 in (MW). Source: Renewable Energy Resources. Statistical Yearbook, SP.
Figure 7.
Installed capacity by type of RES in Poland in the years 2005–2020 in (MW). Source: Renewable Energy Resources. Statistical Yearbook, SP.

Figure 8.
Change in the structure of installed capacity by type of RES in Poland in the years 2005–2020 in (%). Source: Renewable Energy Resources. Statistical Yearbook, SP.
Figure 8.
Change in the structure of installed capacity by type of RES in Poland in the years 2005–2020 in (%). Source: Renewable Energy Resources. Statistical Yearbook, SP.

Figure 9.
Graphs presenting the actual values of the forecasted variables Yt and the values of the calculated Yt_F forecasts. Source: Own study.
Figure 9.
Graphs presenting the actual values of the forecasted variables Yt and the values of the calculated Yt_F forecasts. Source: Own study.


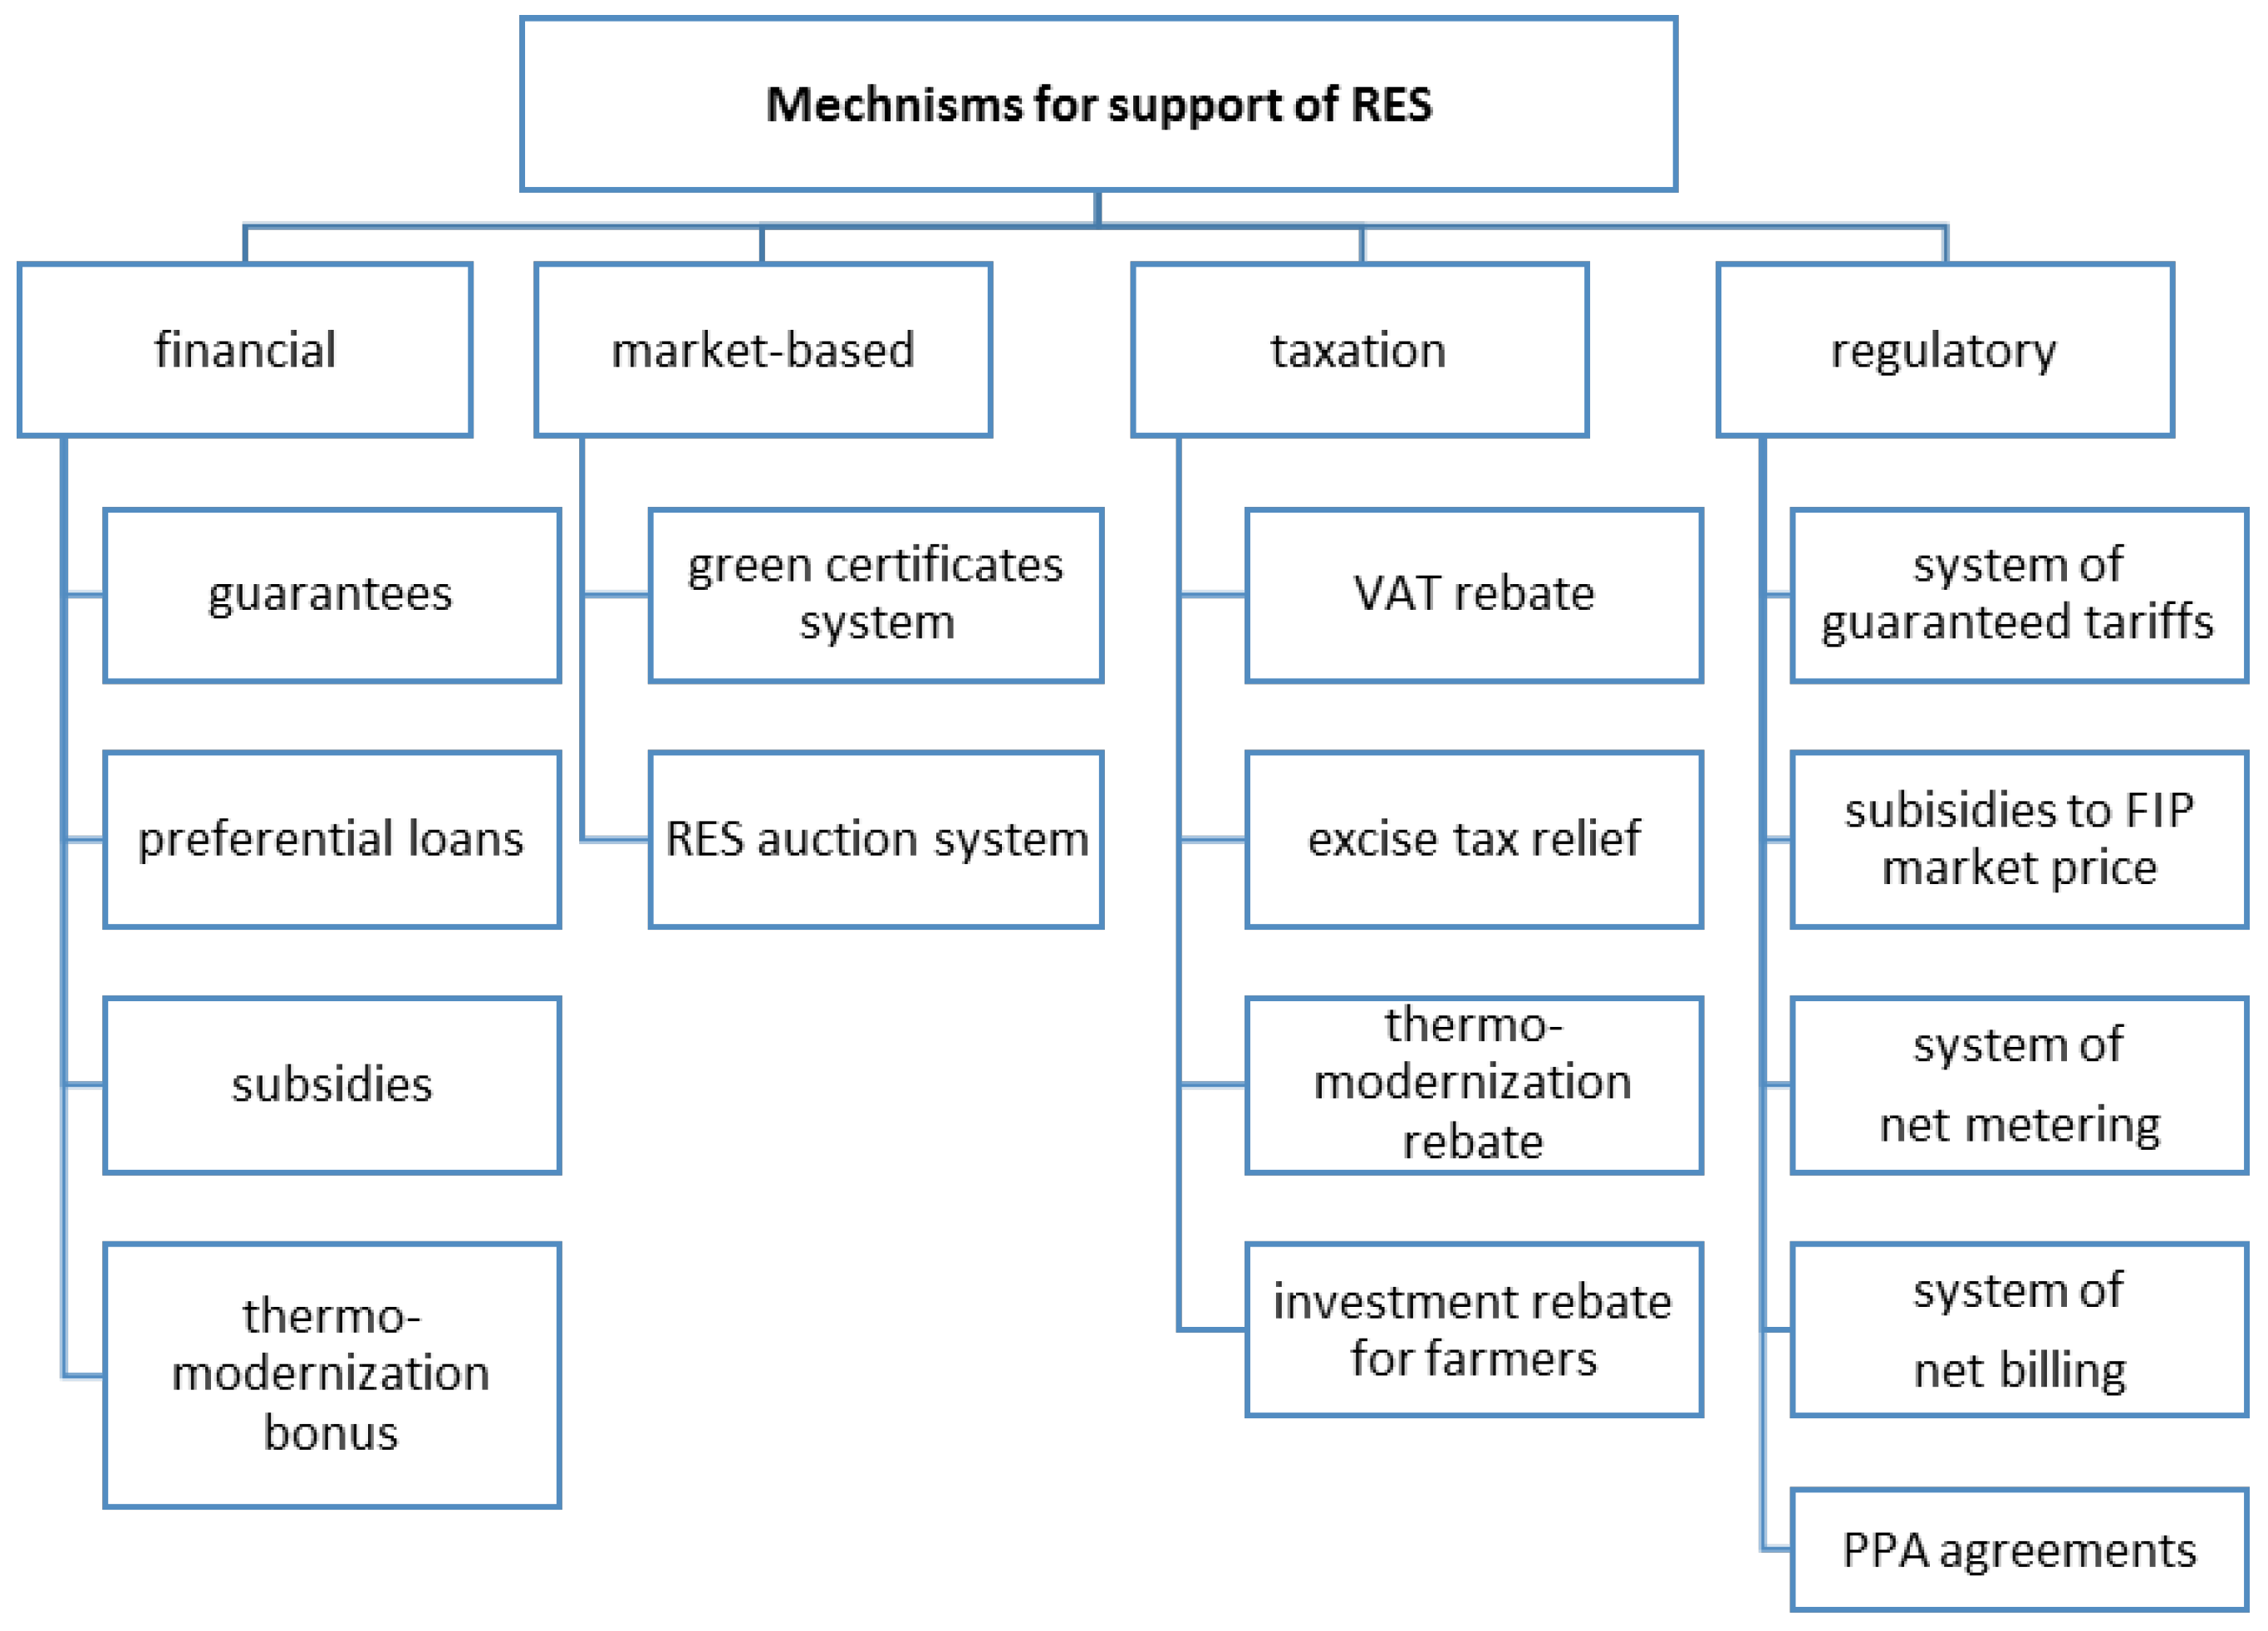
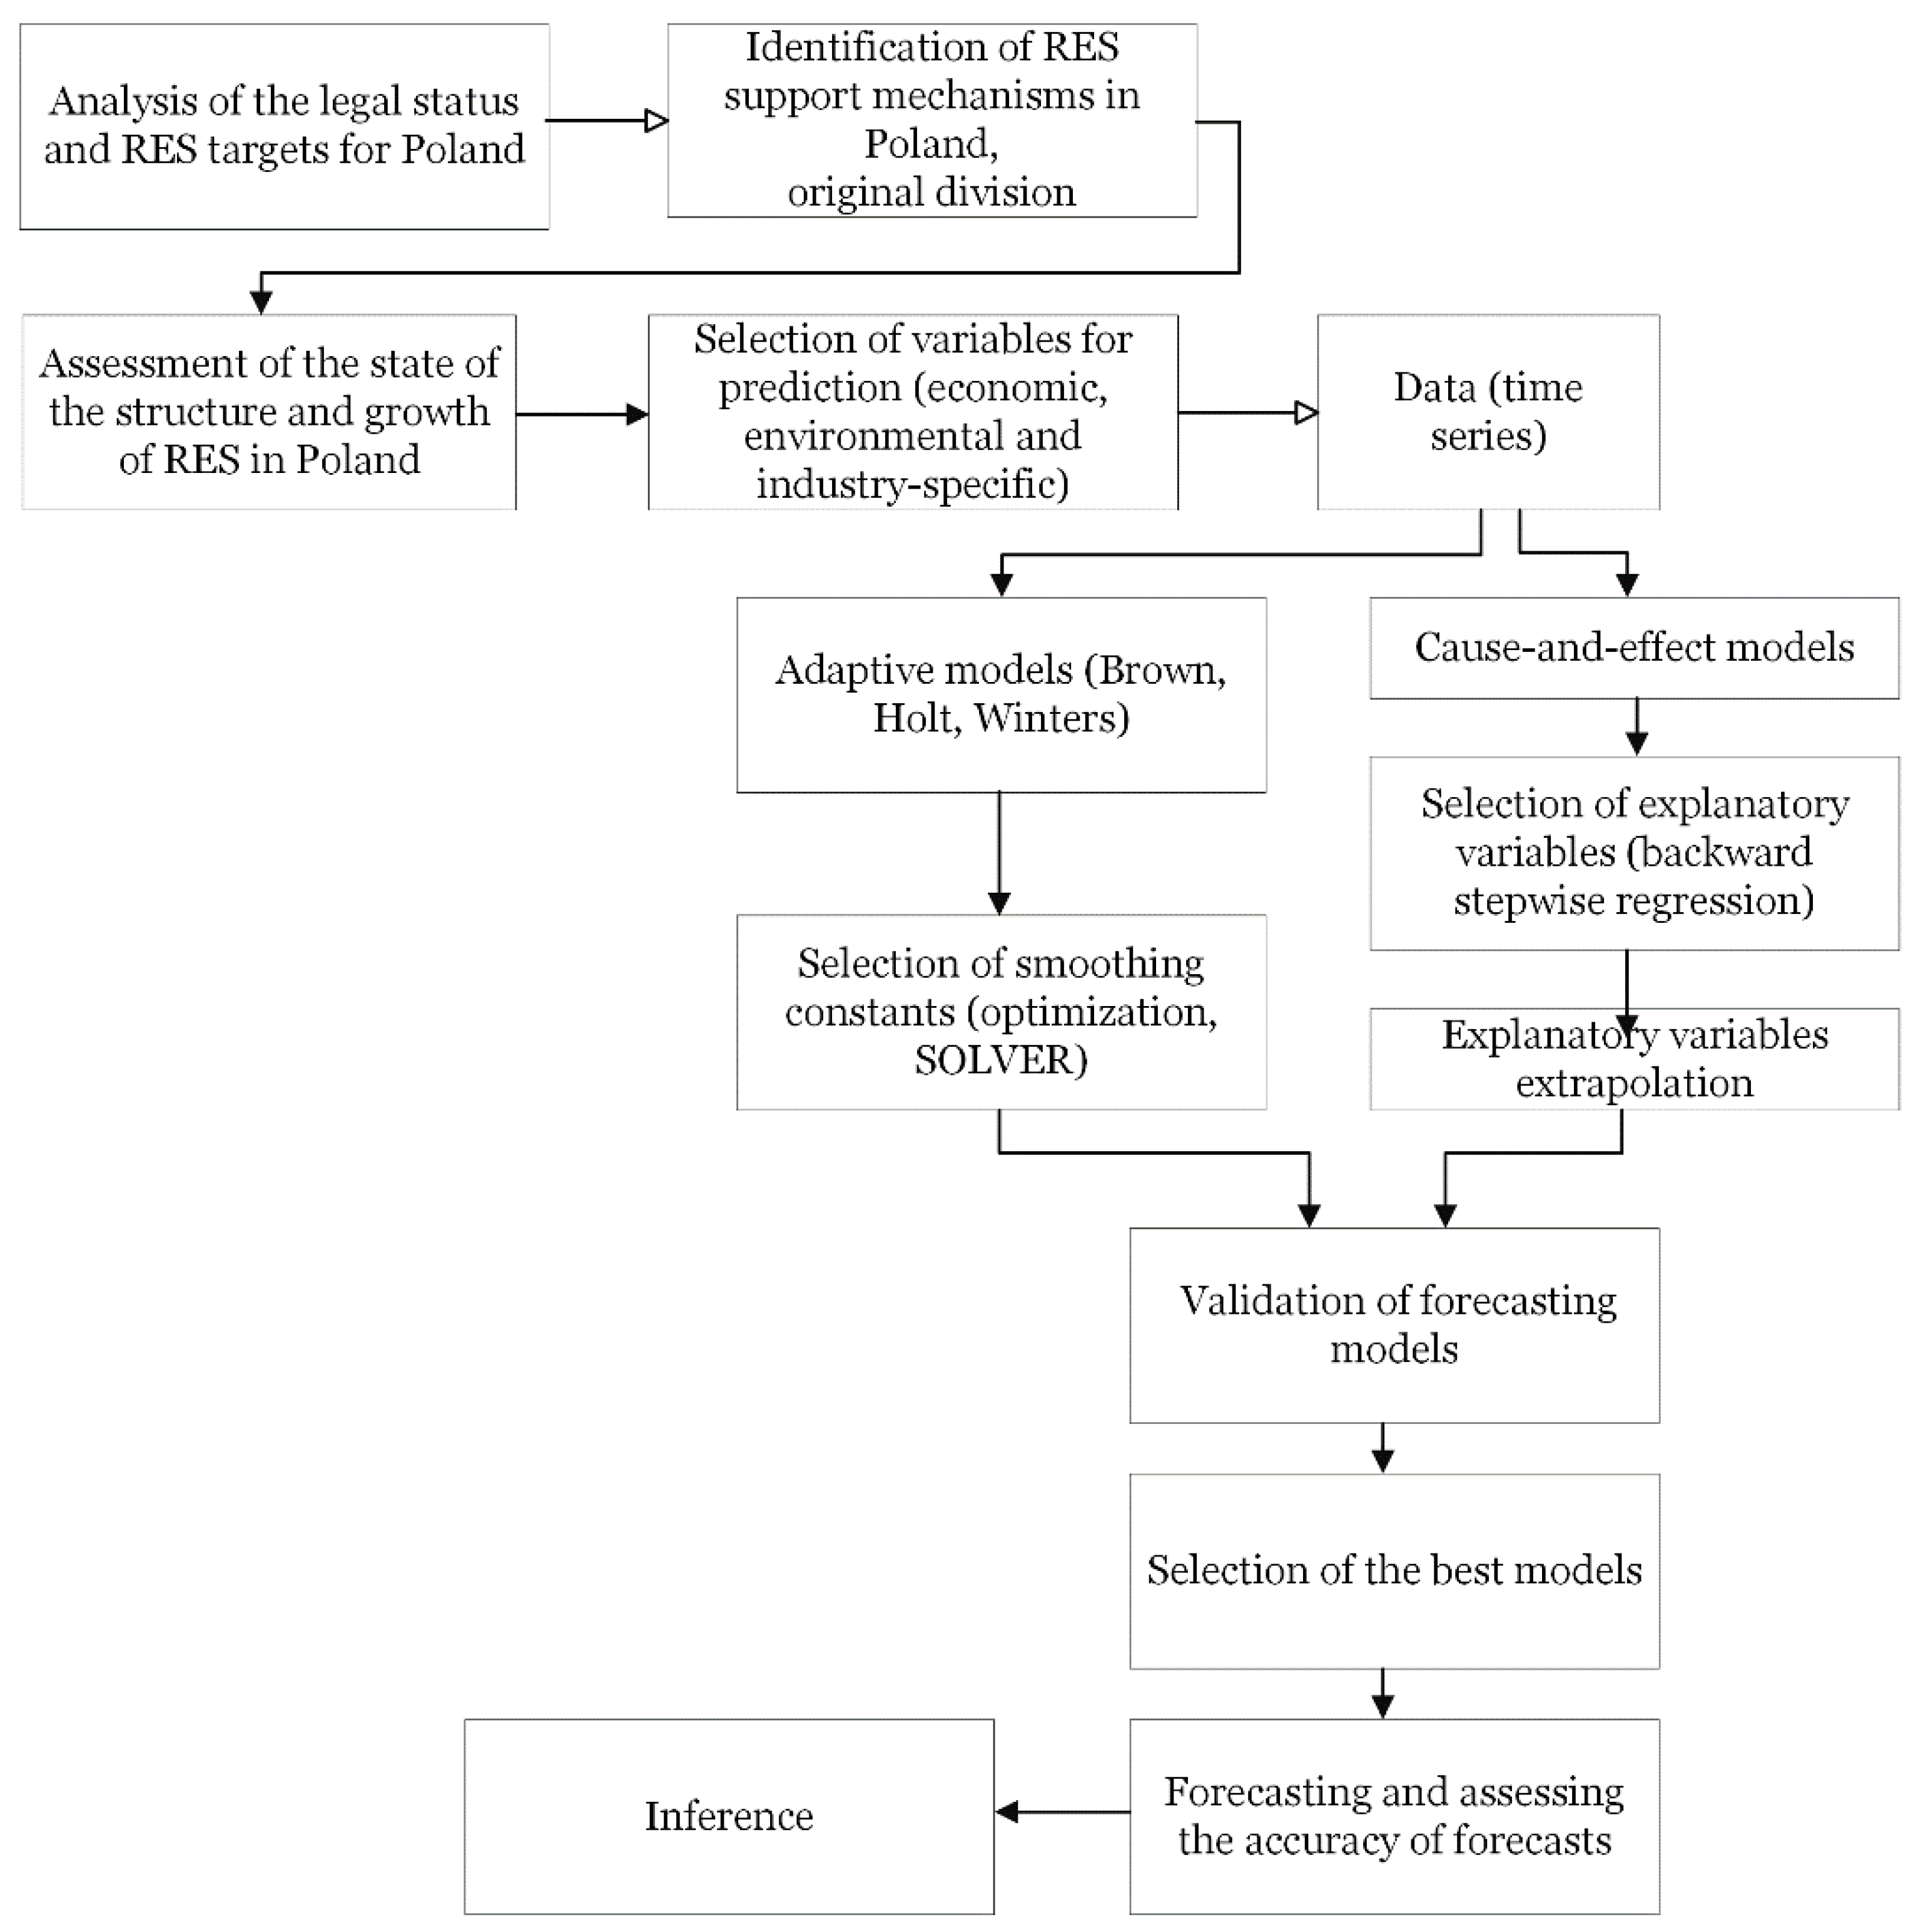
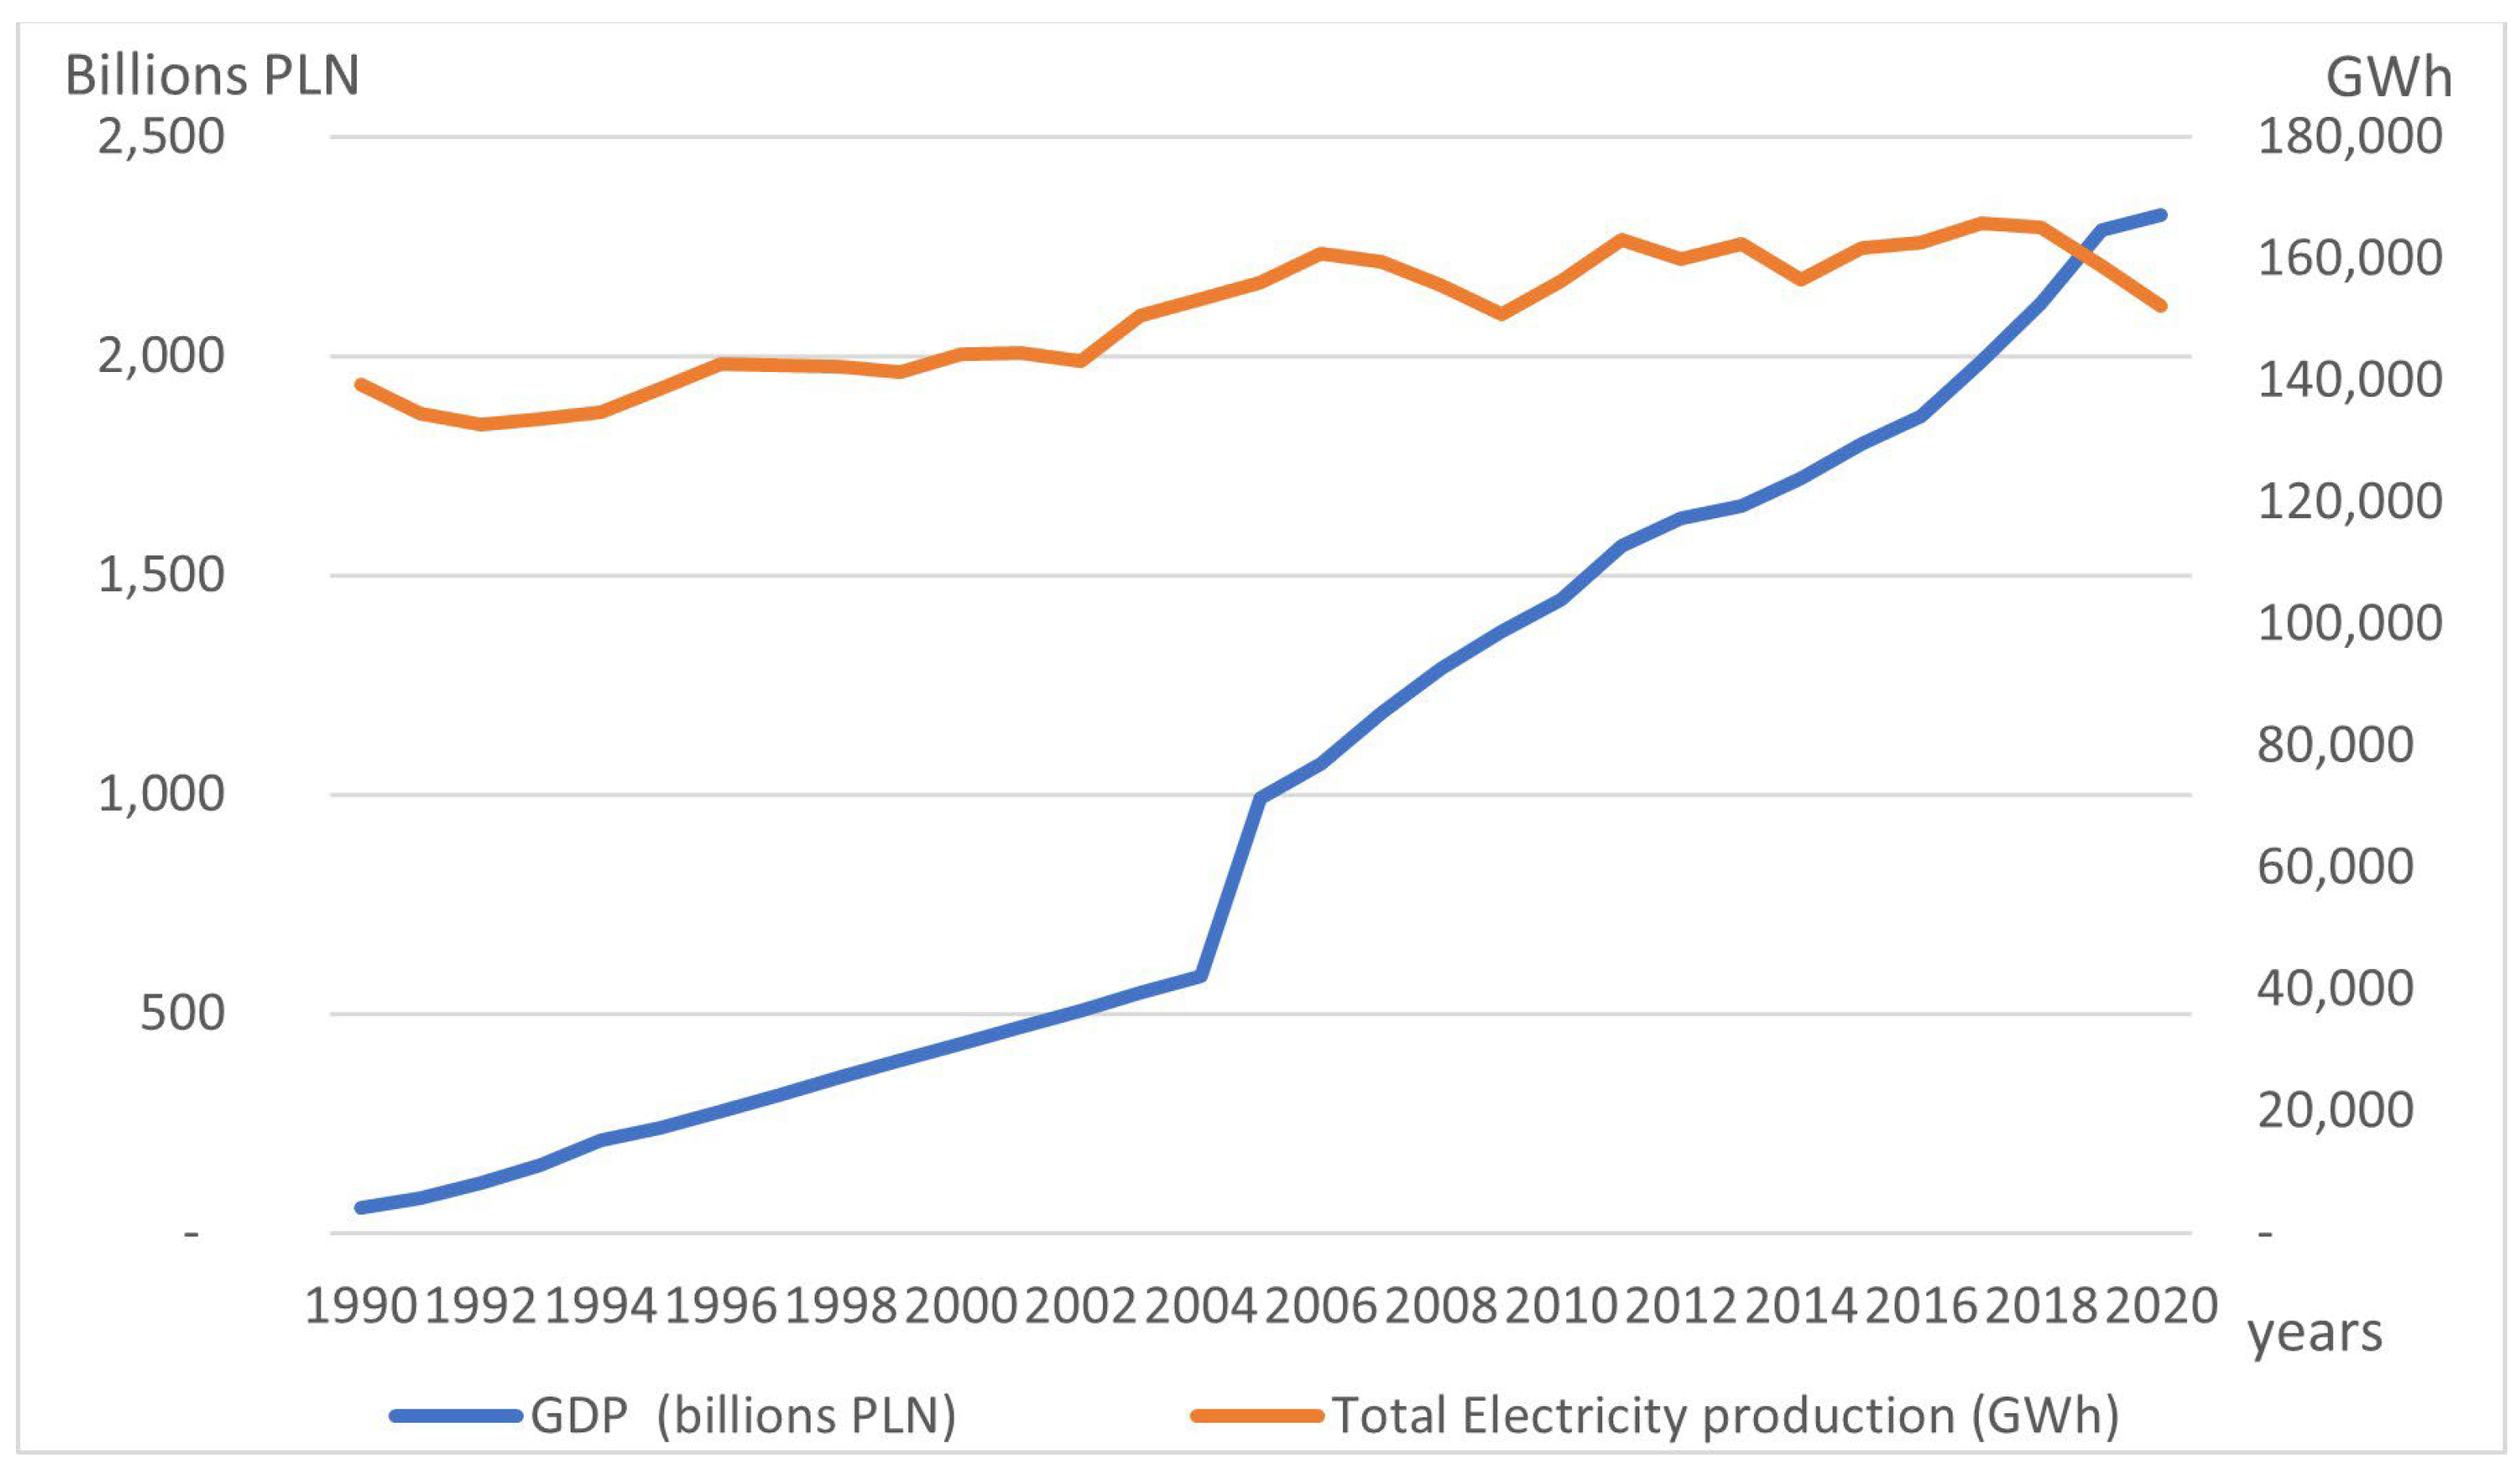
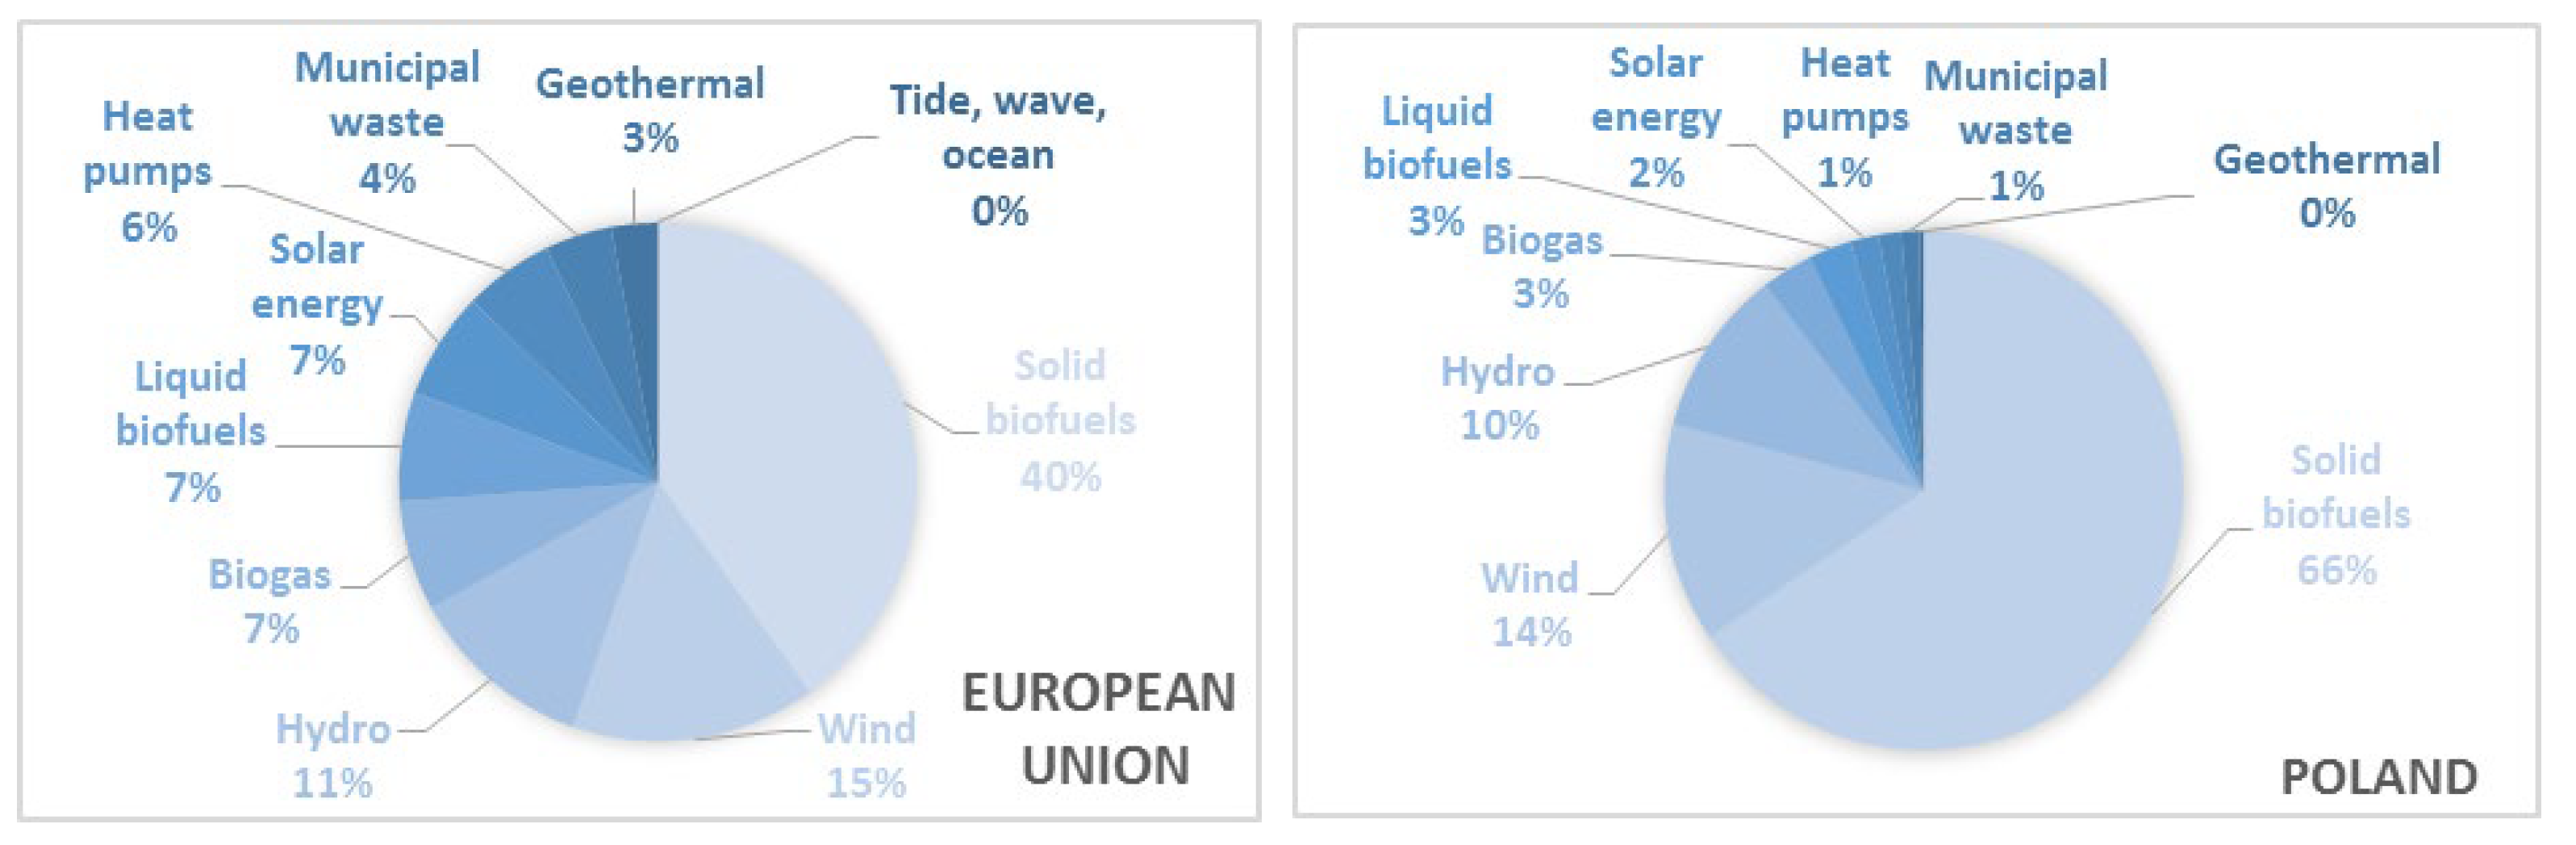
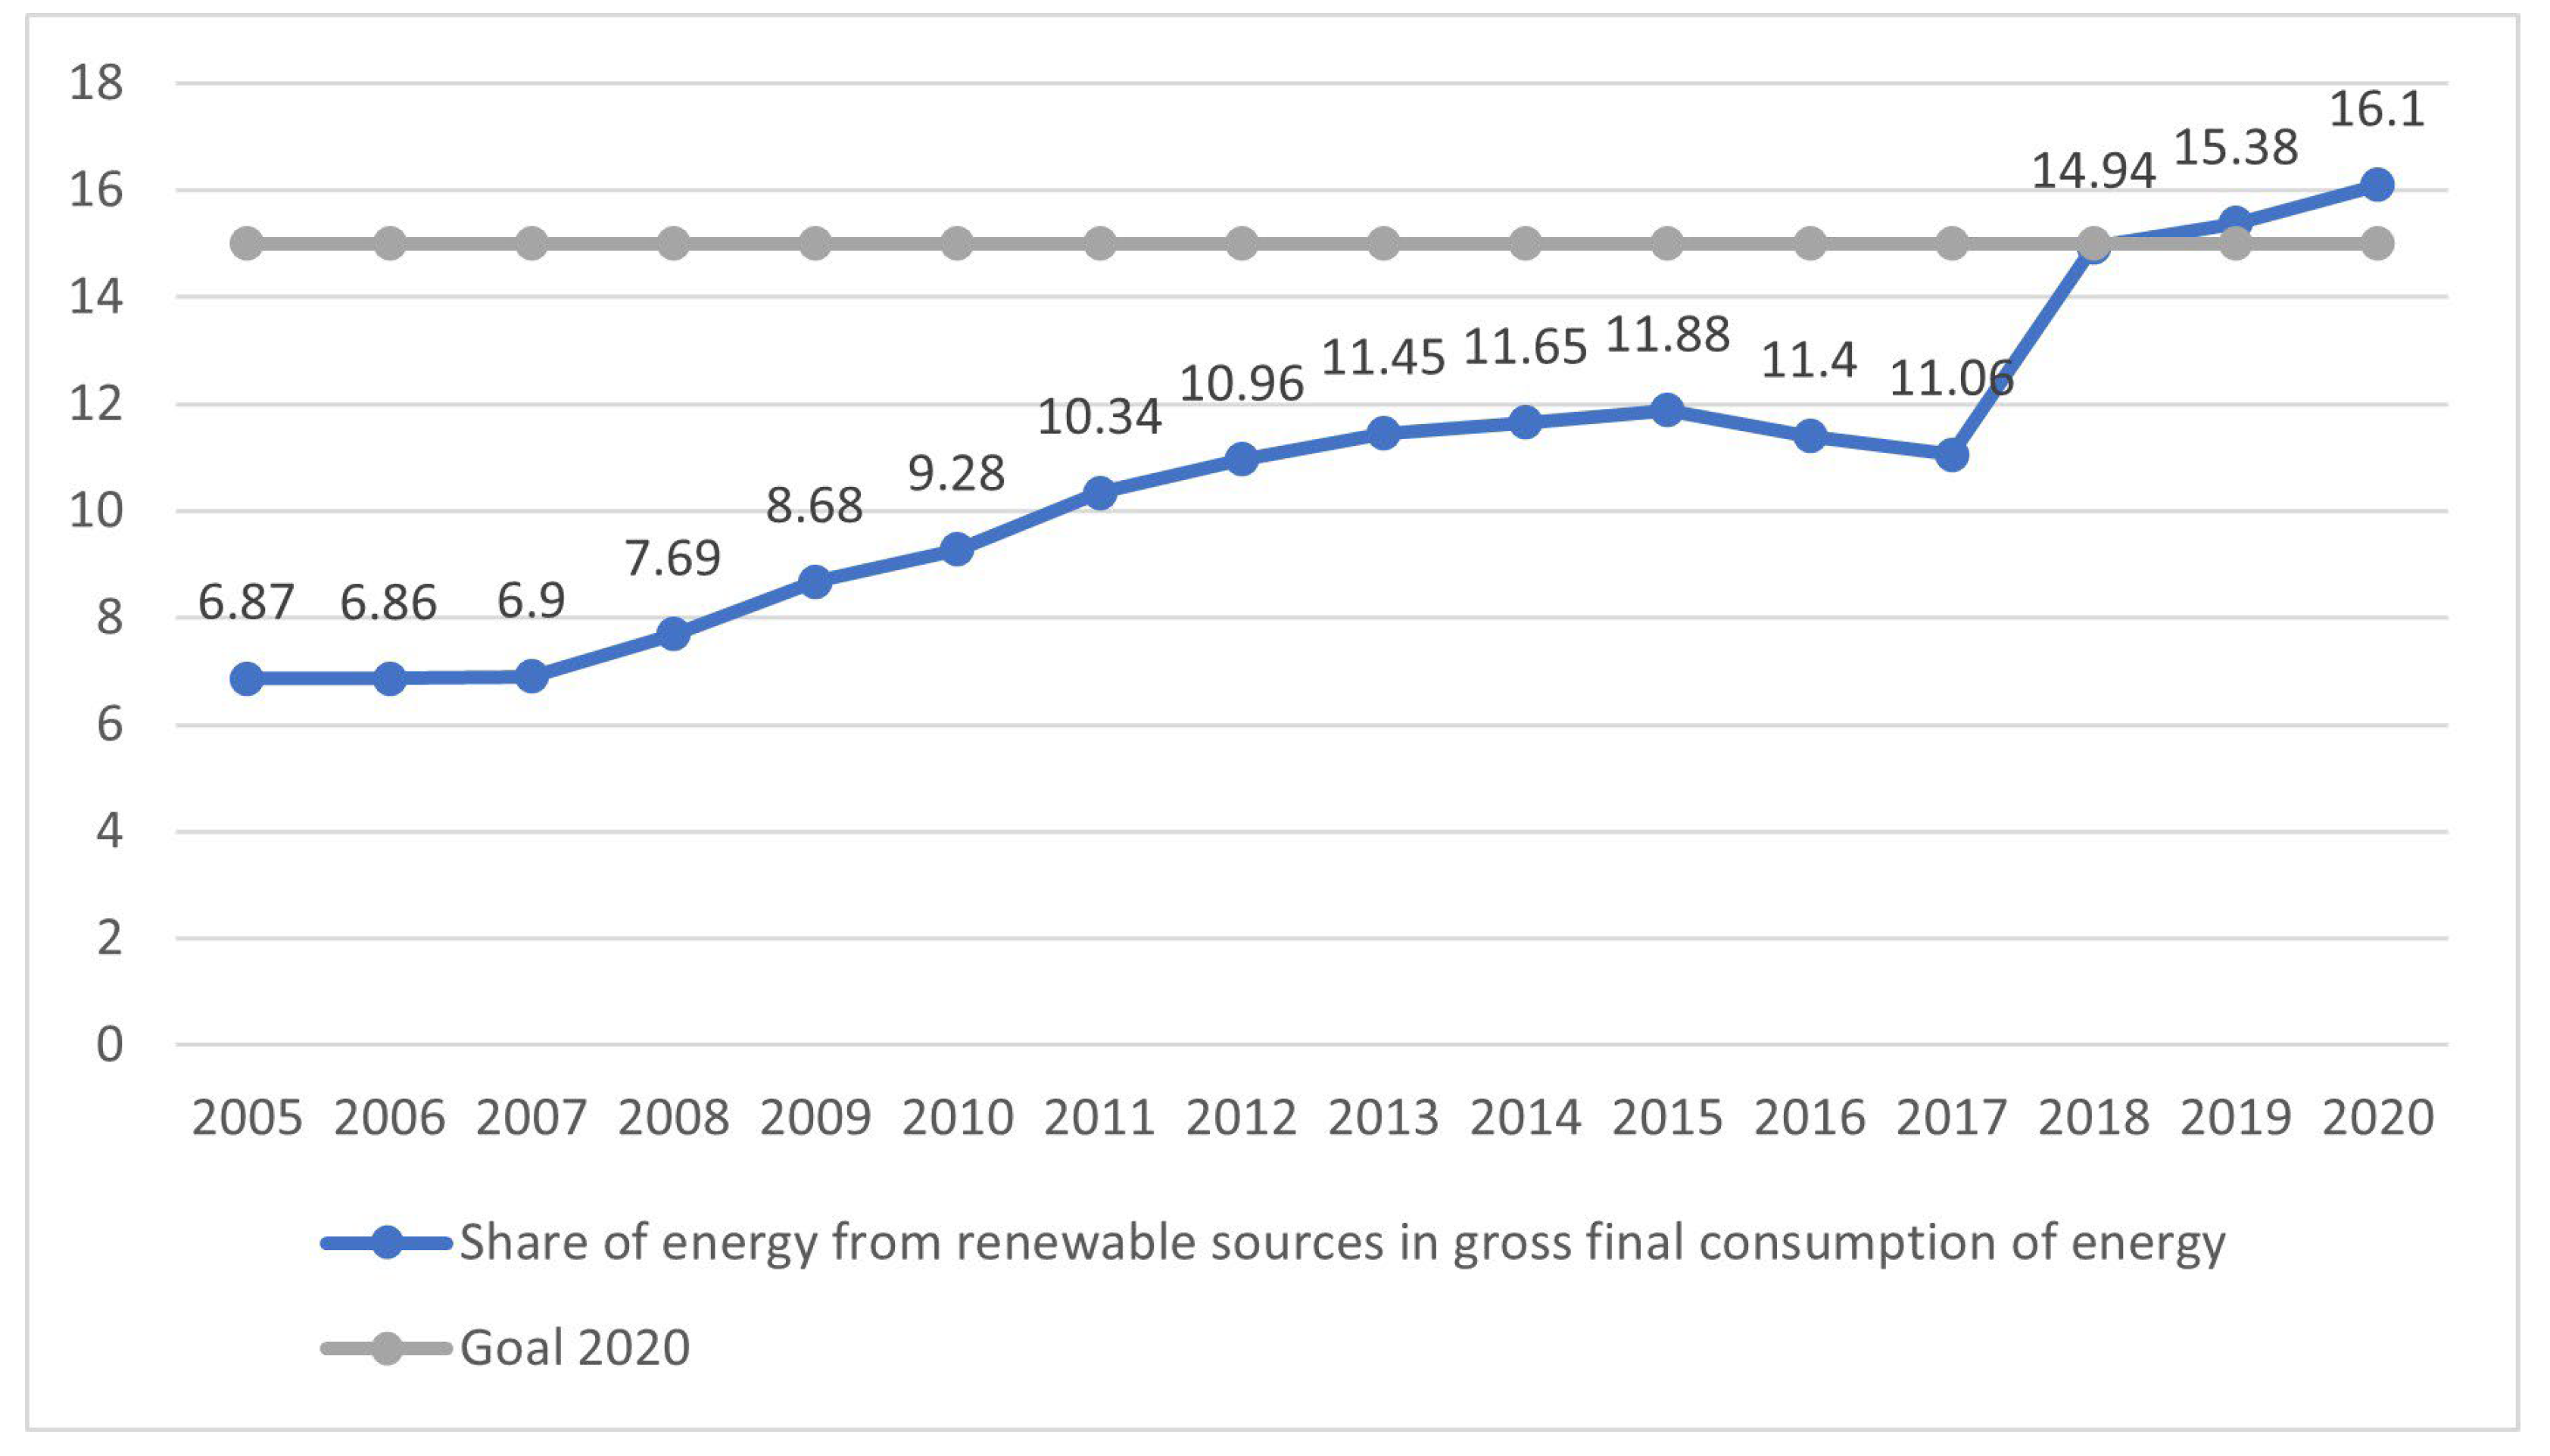
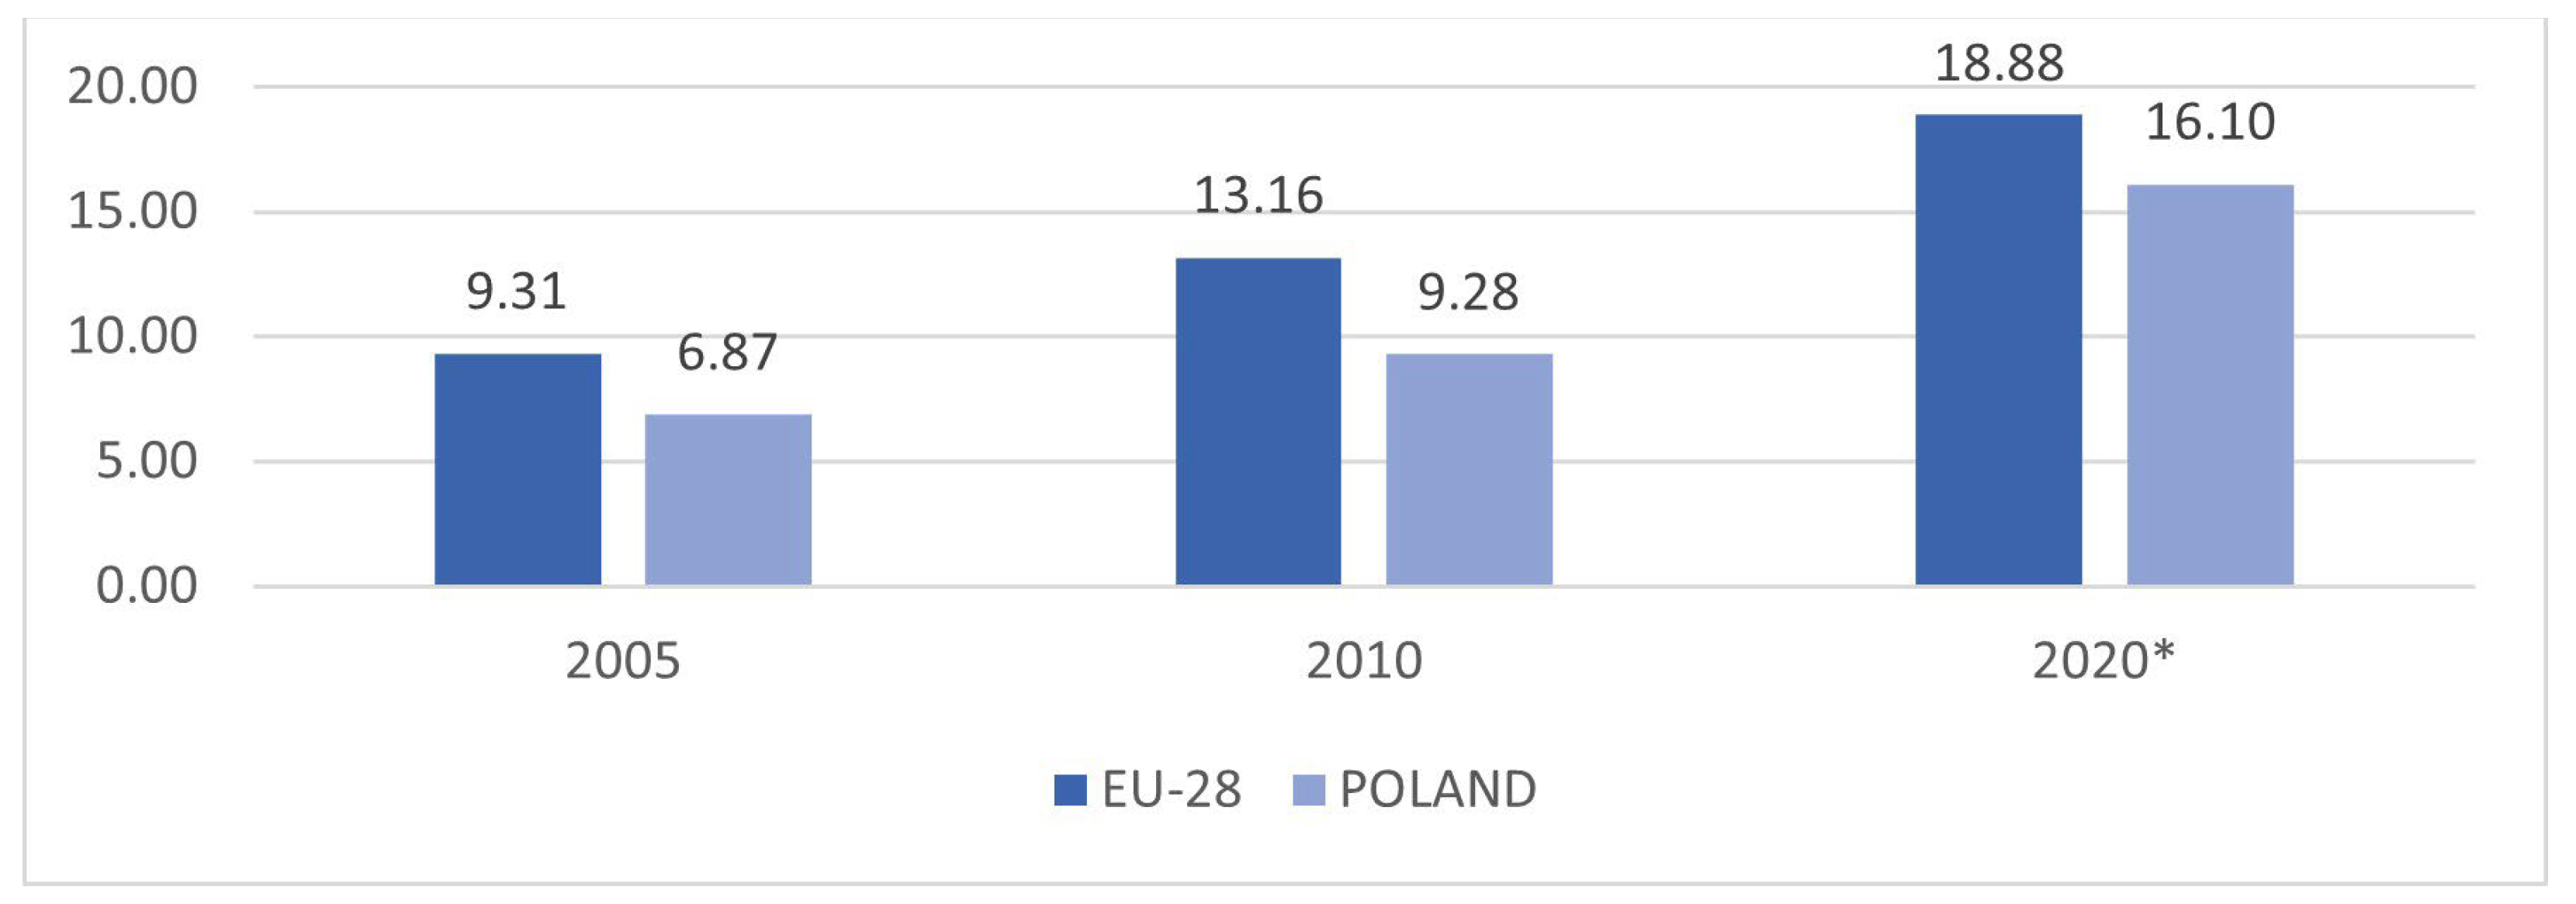
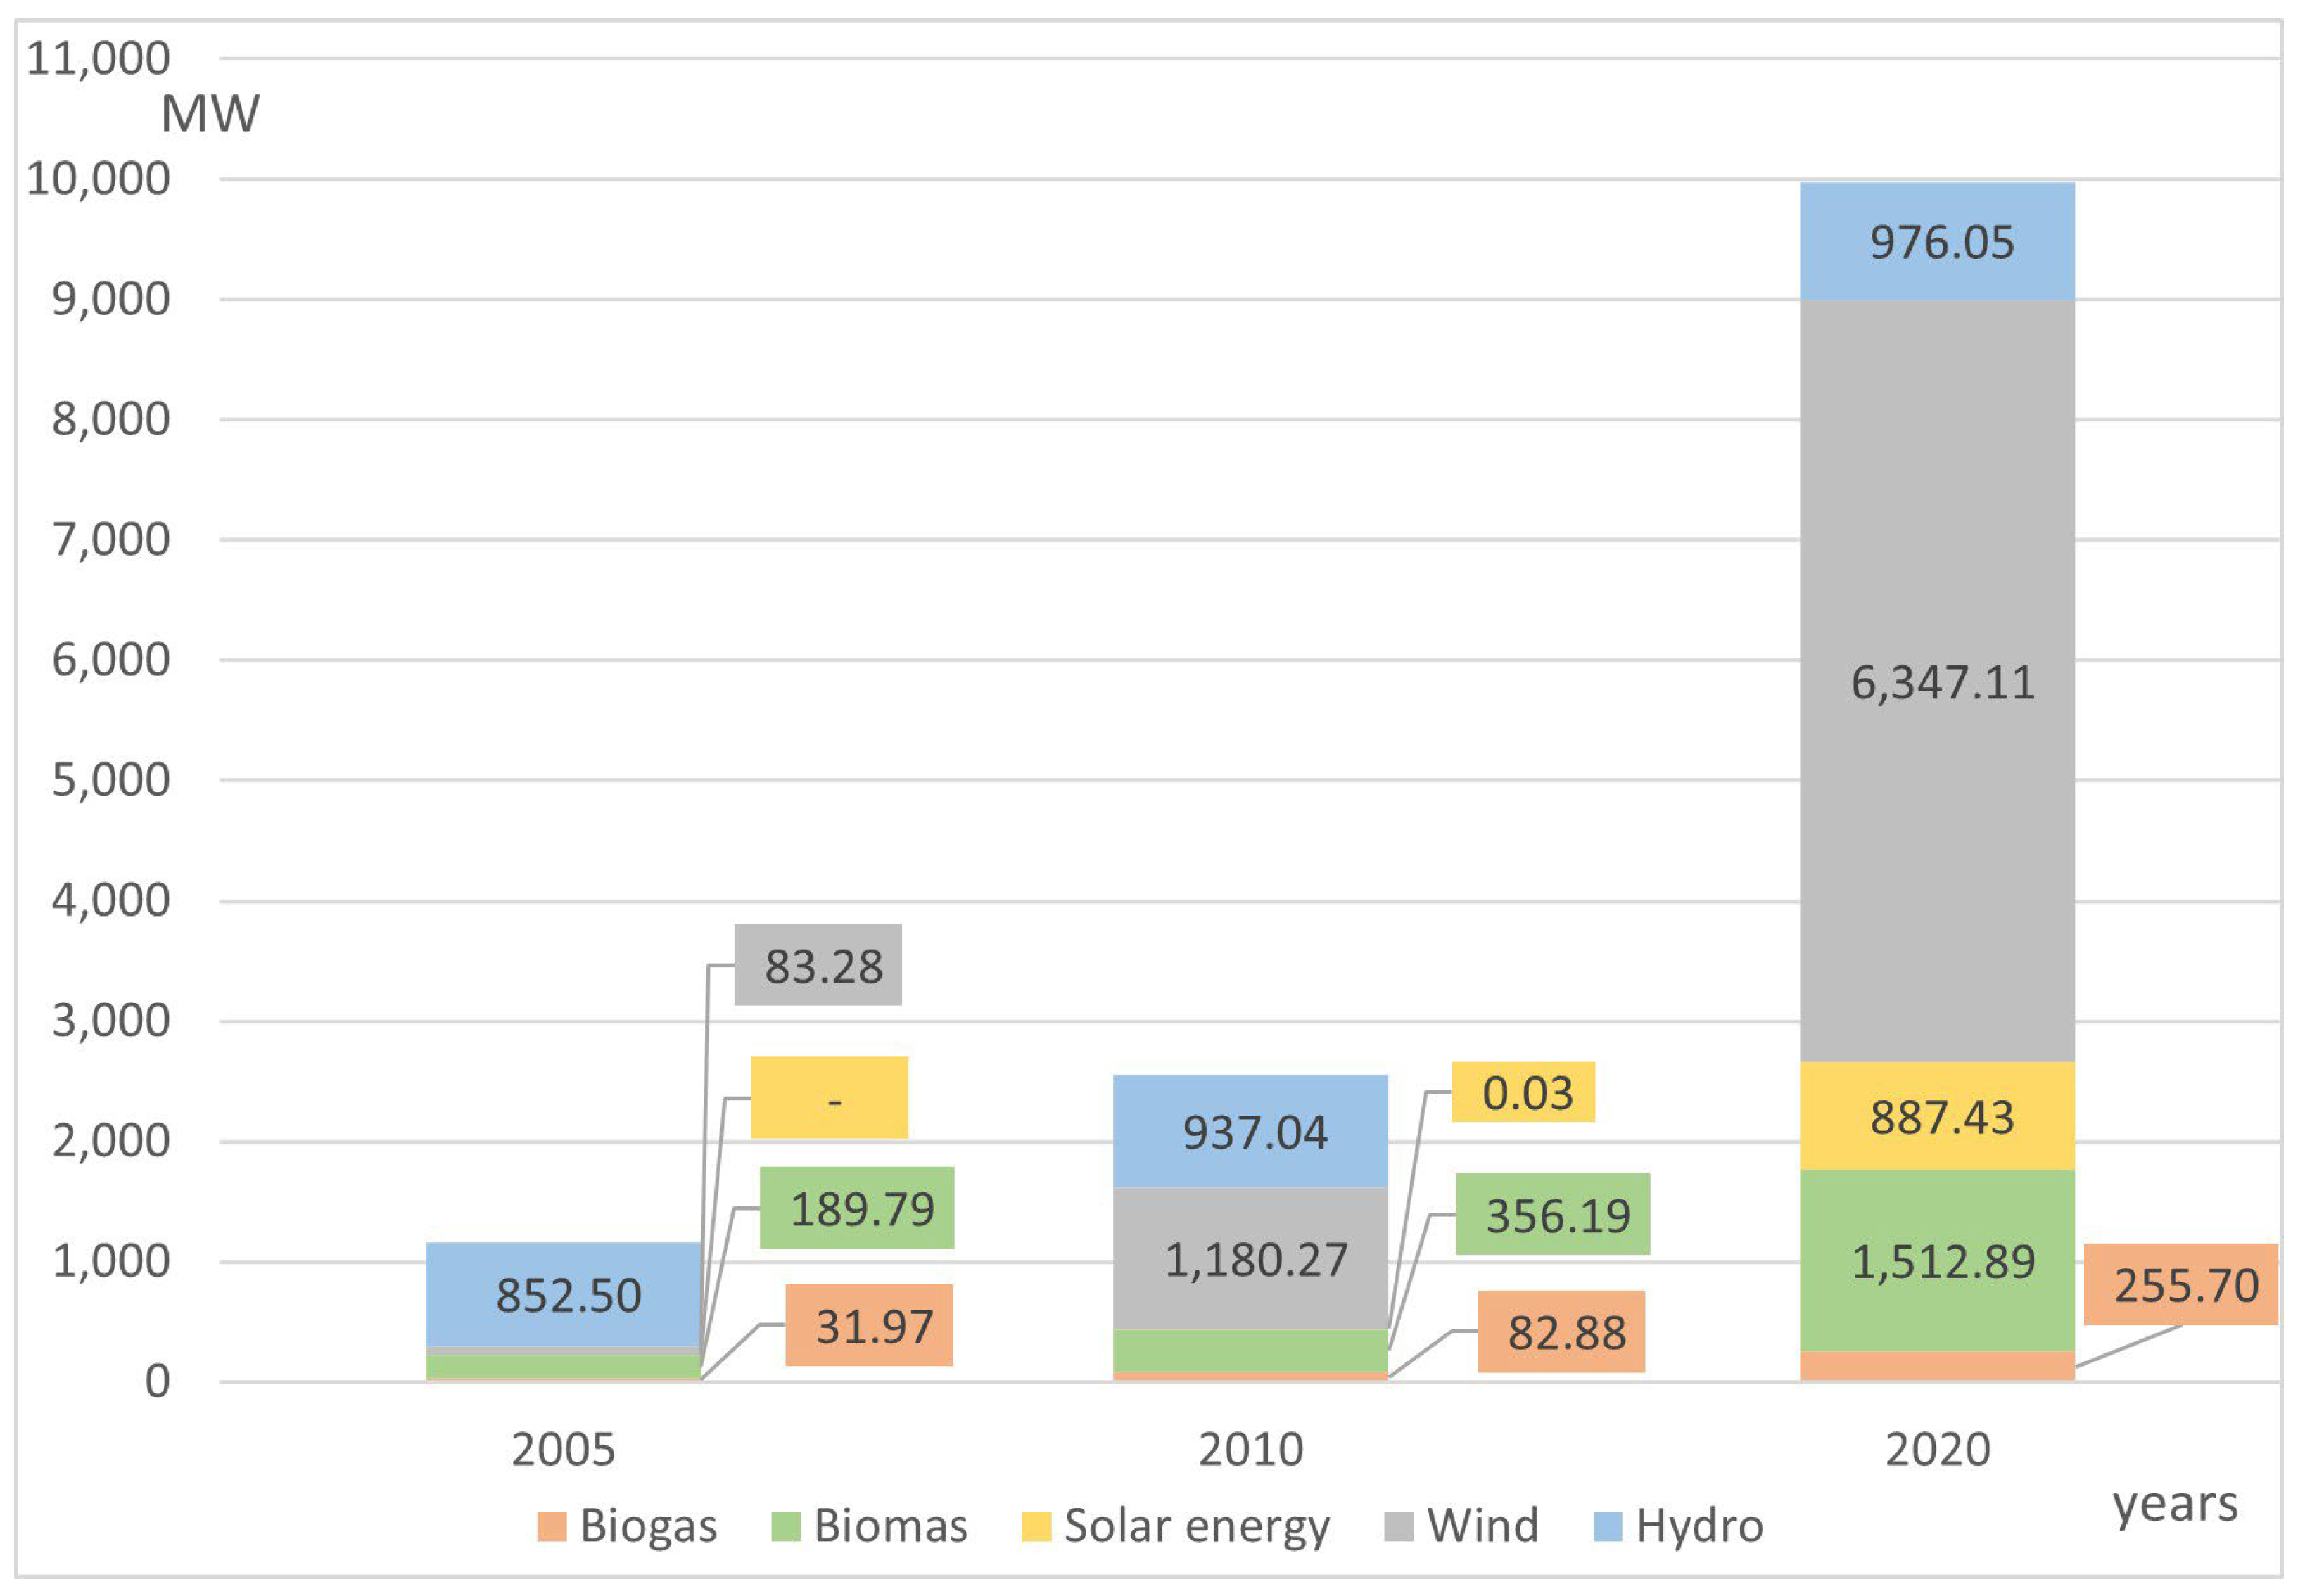
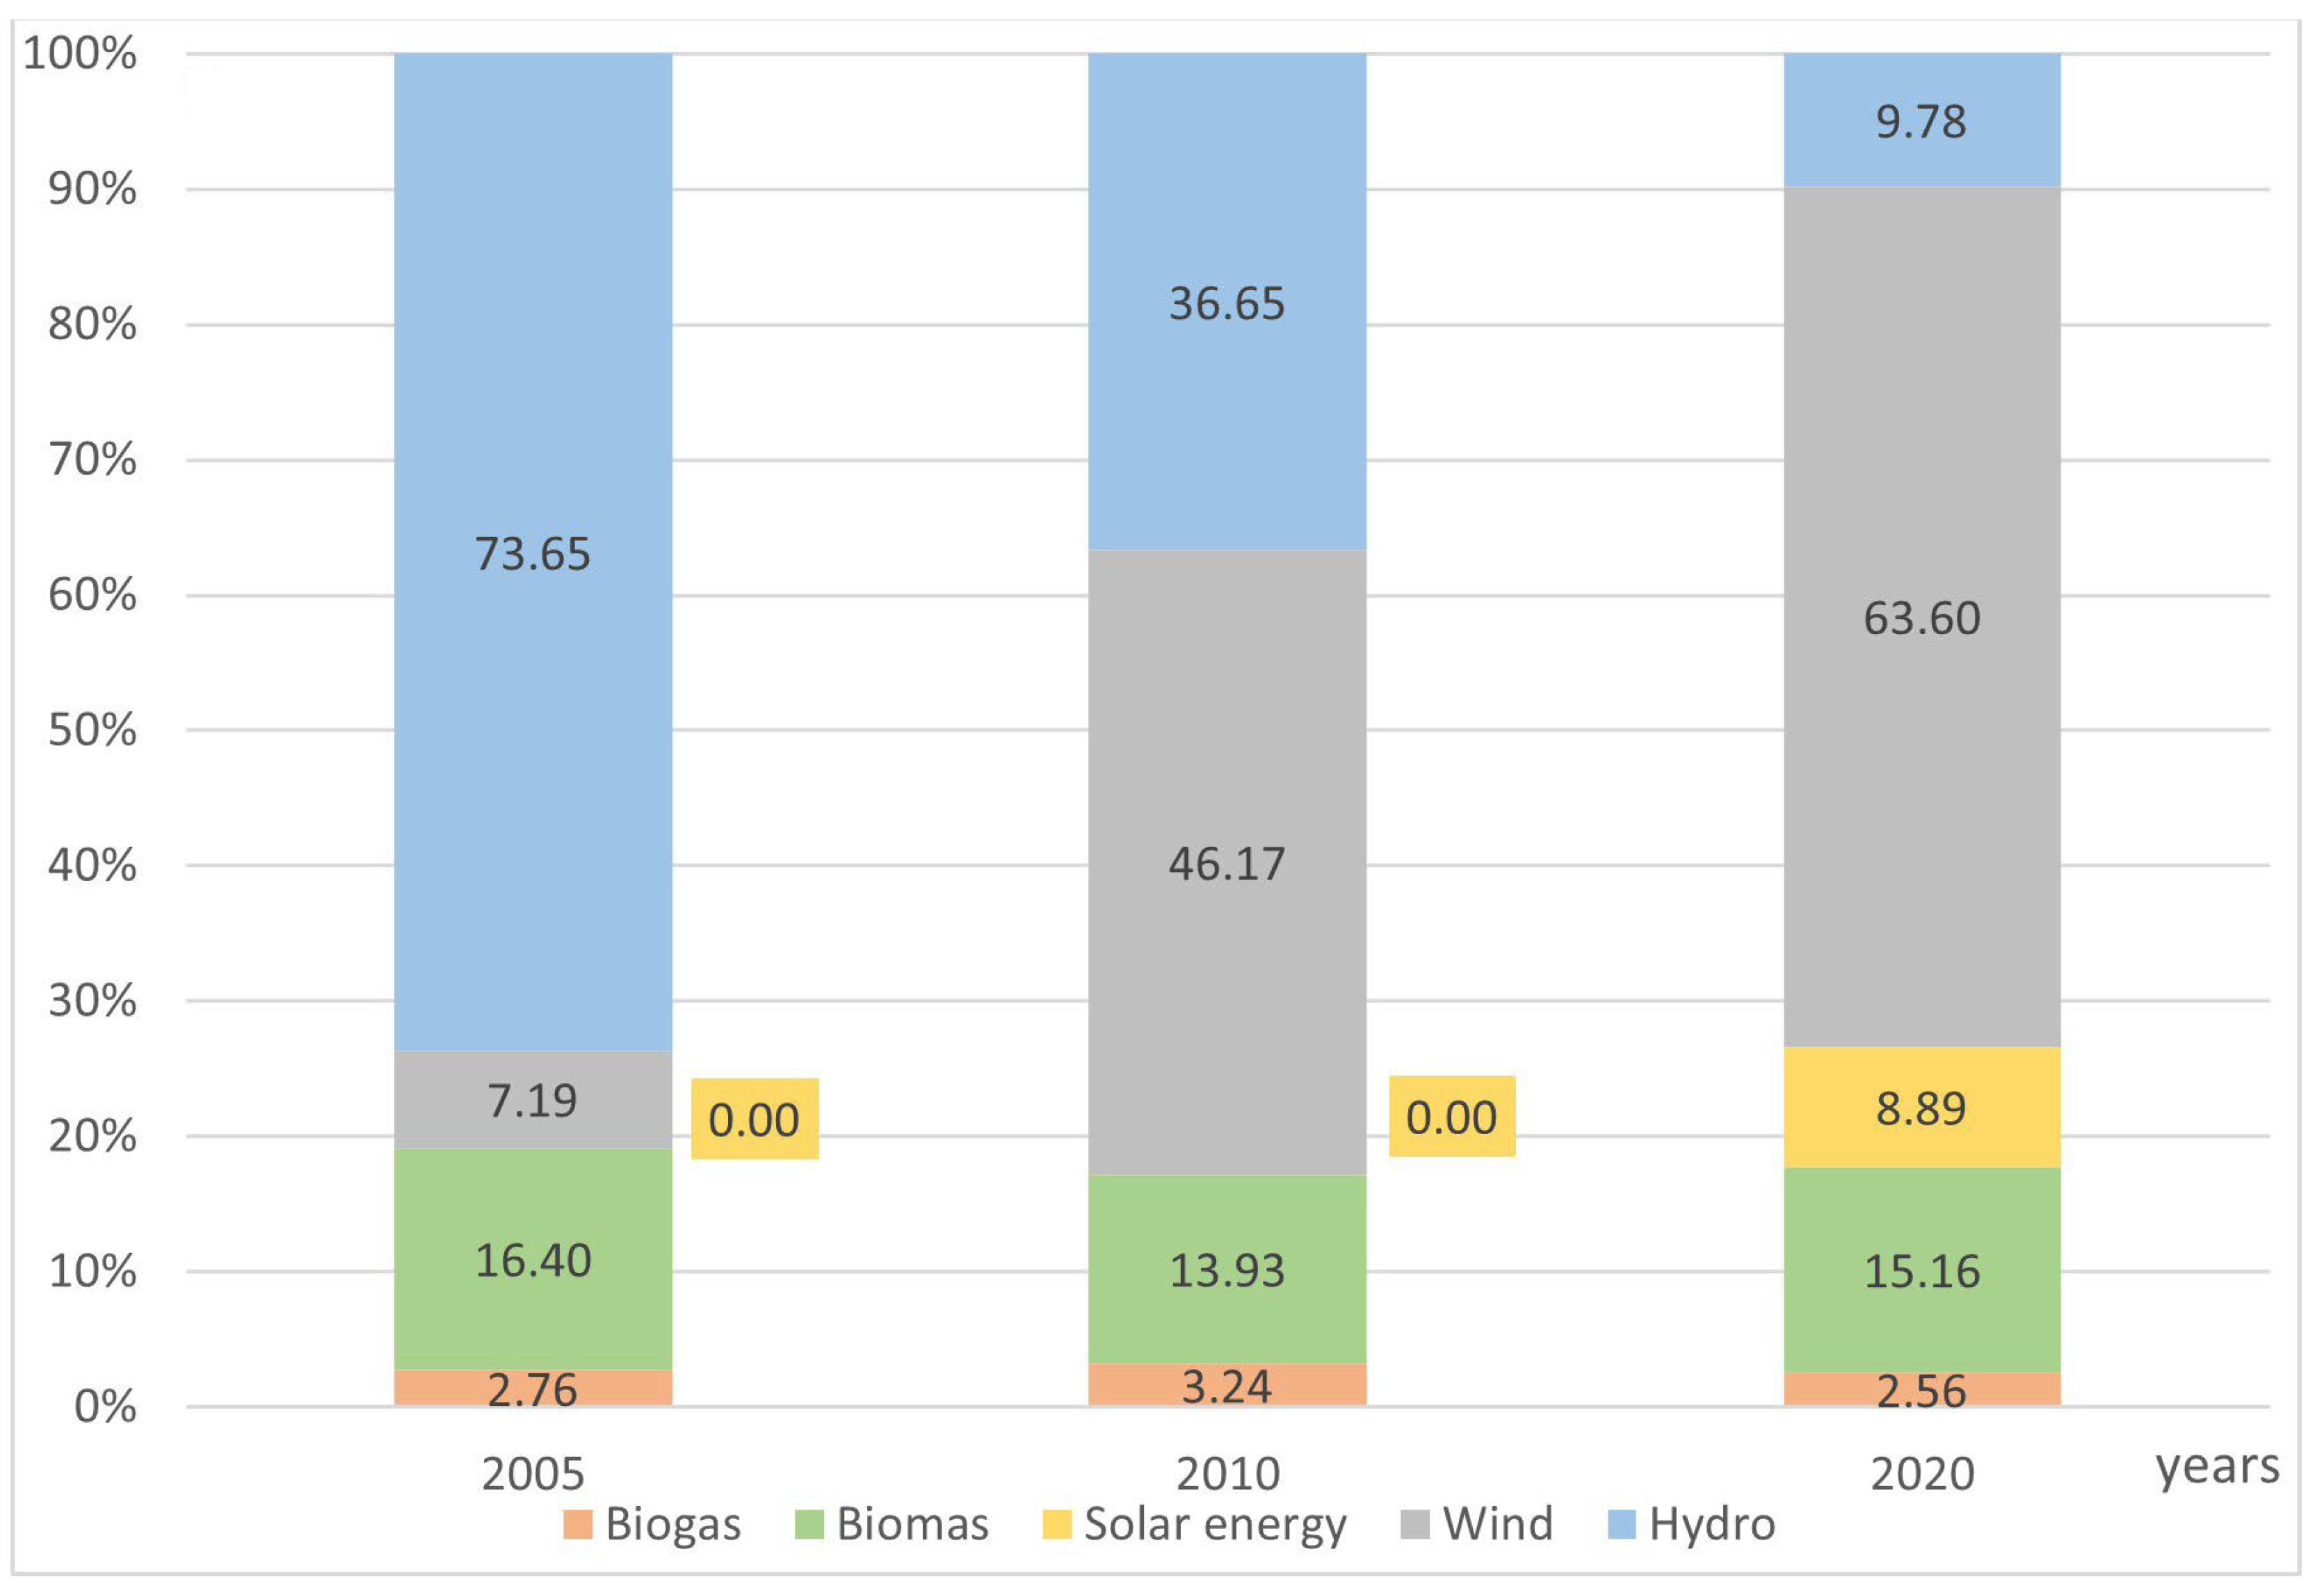
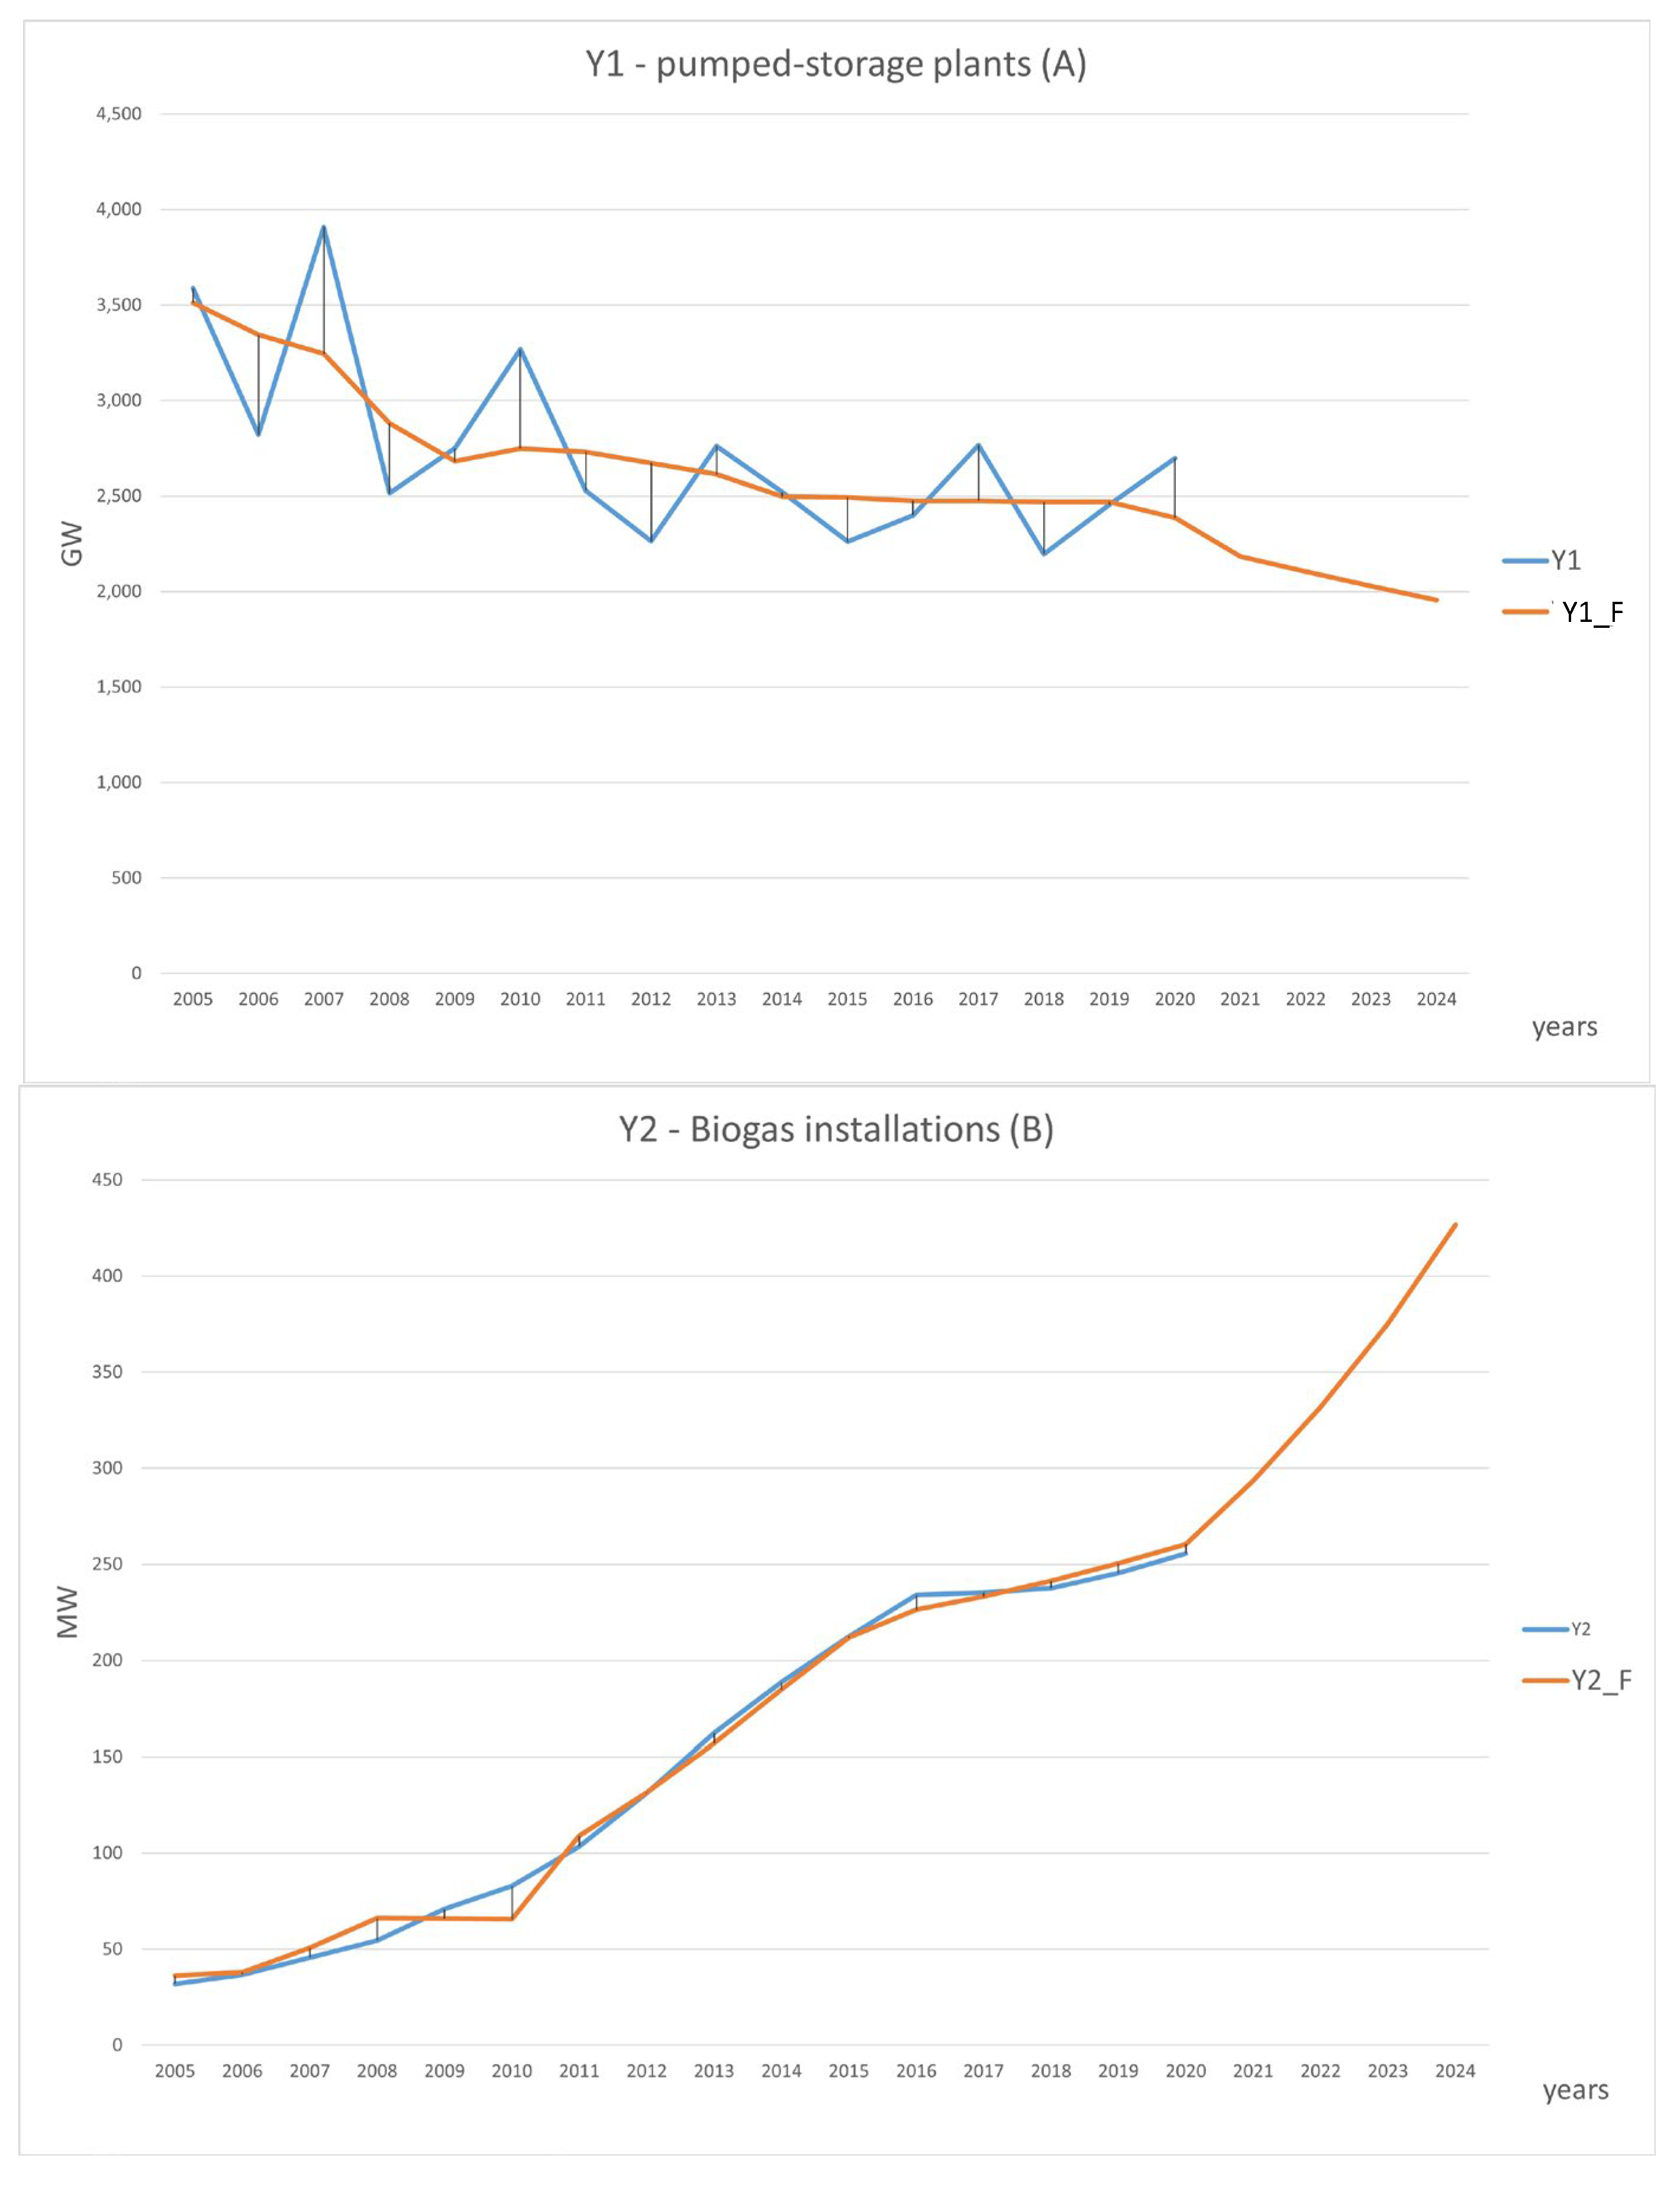
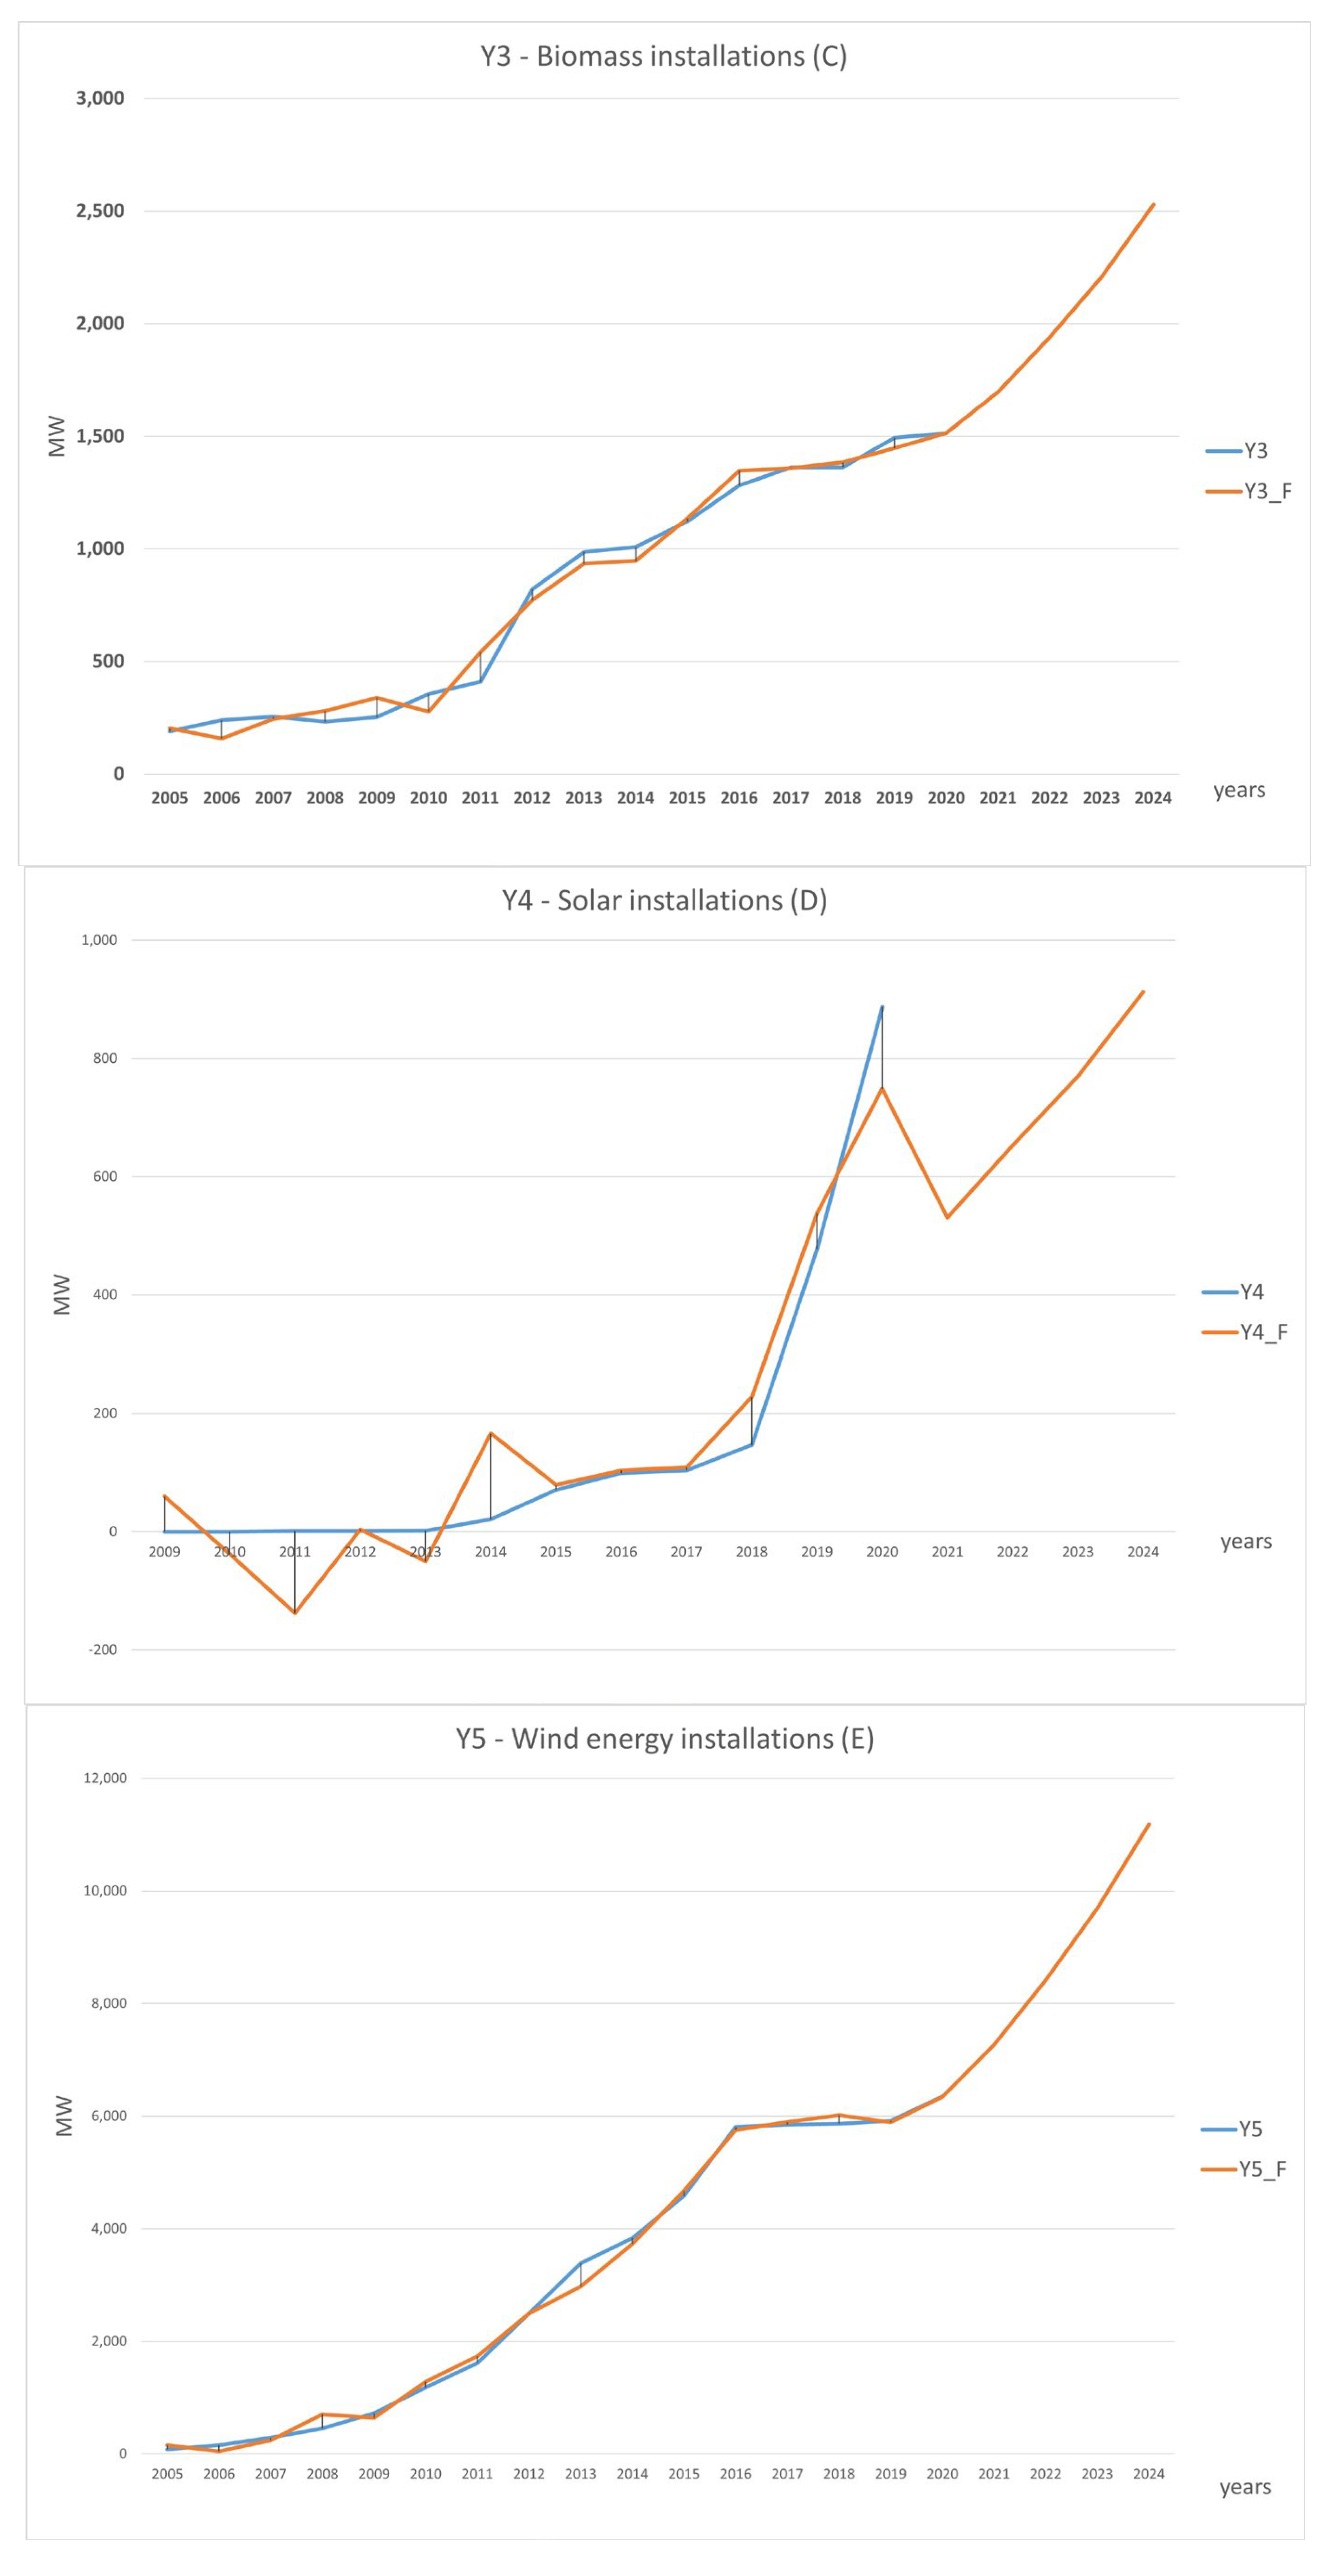
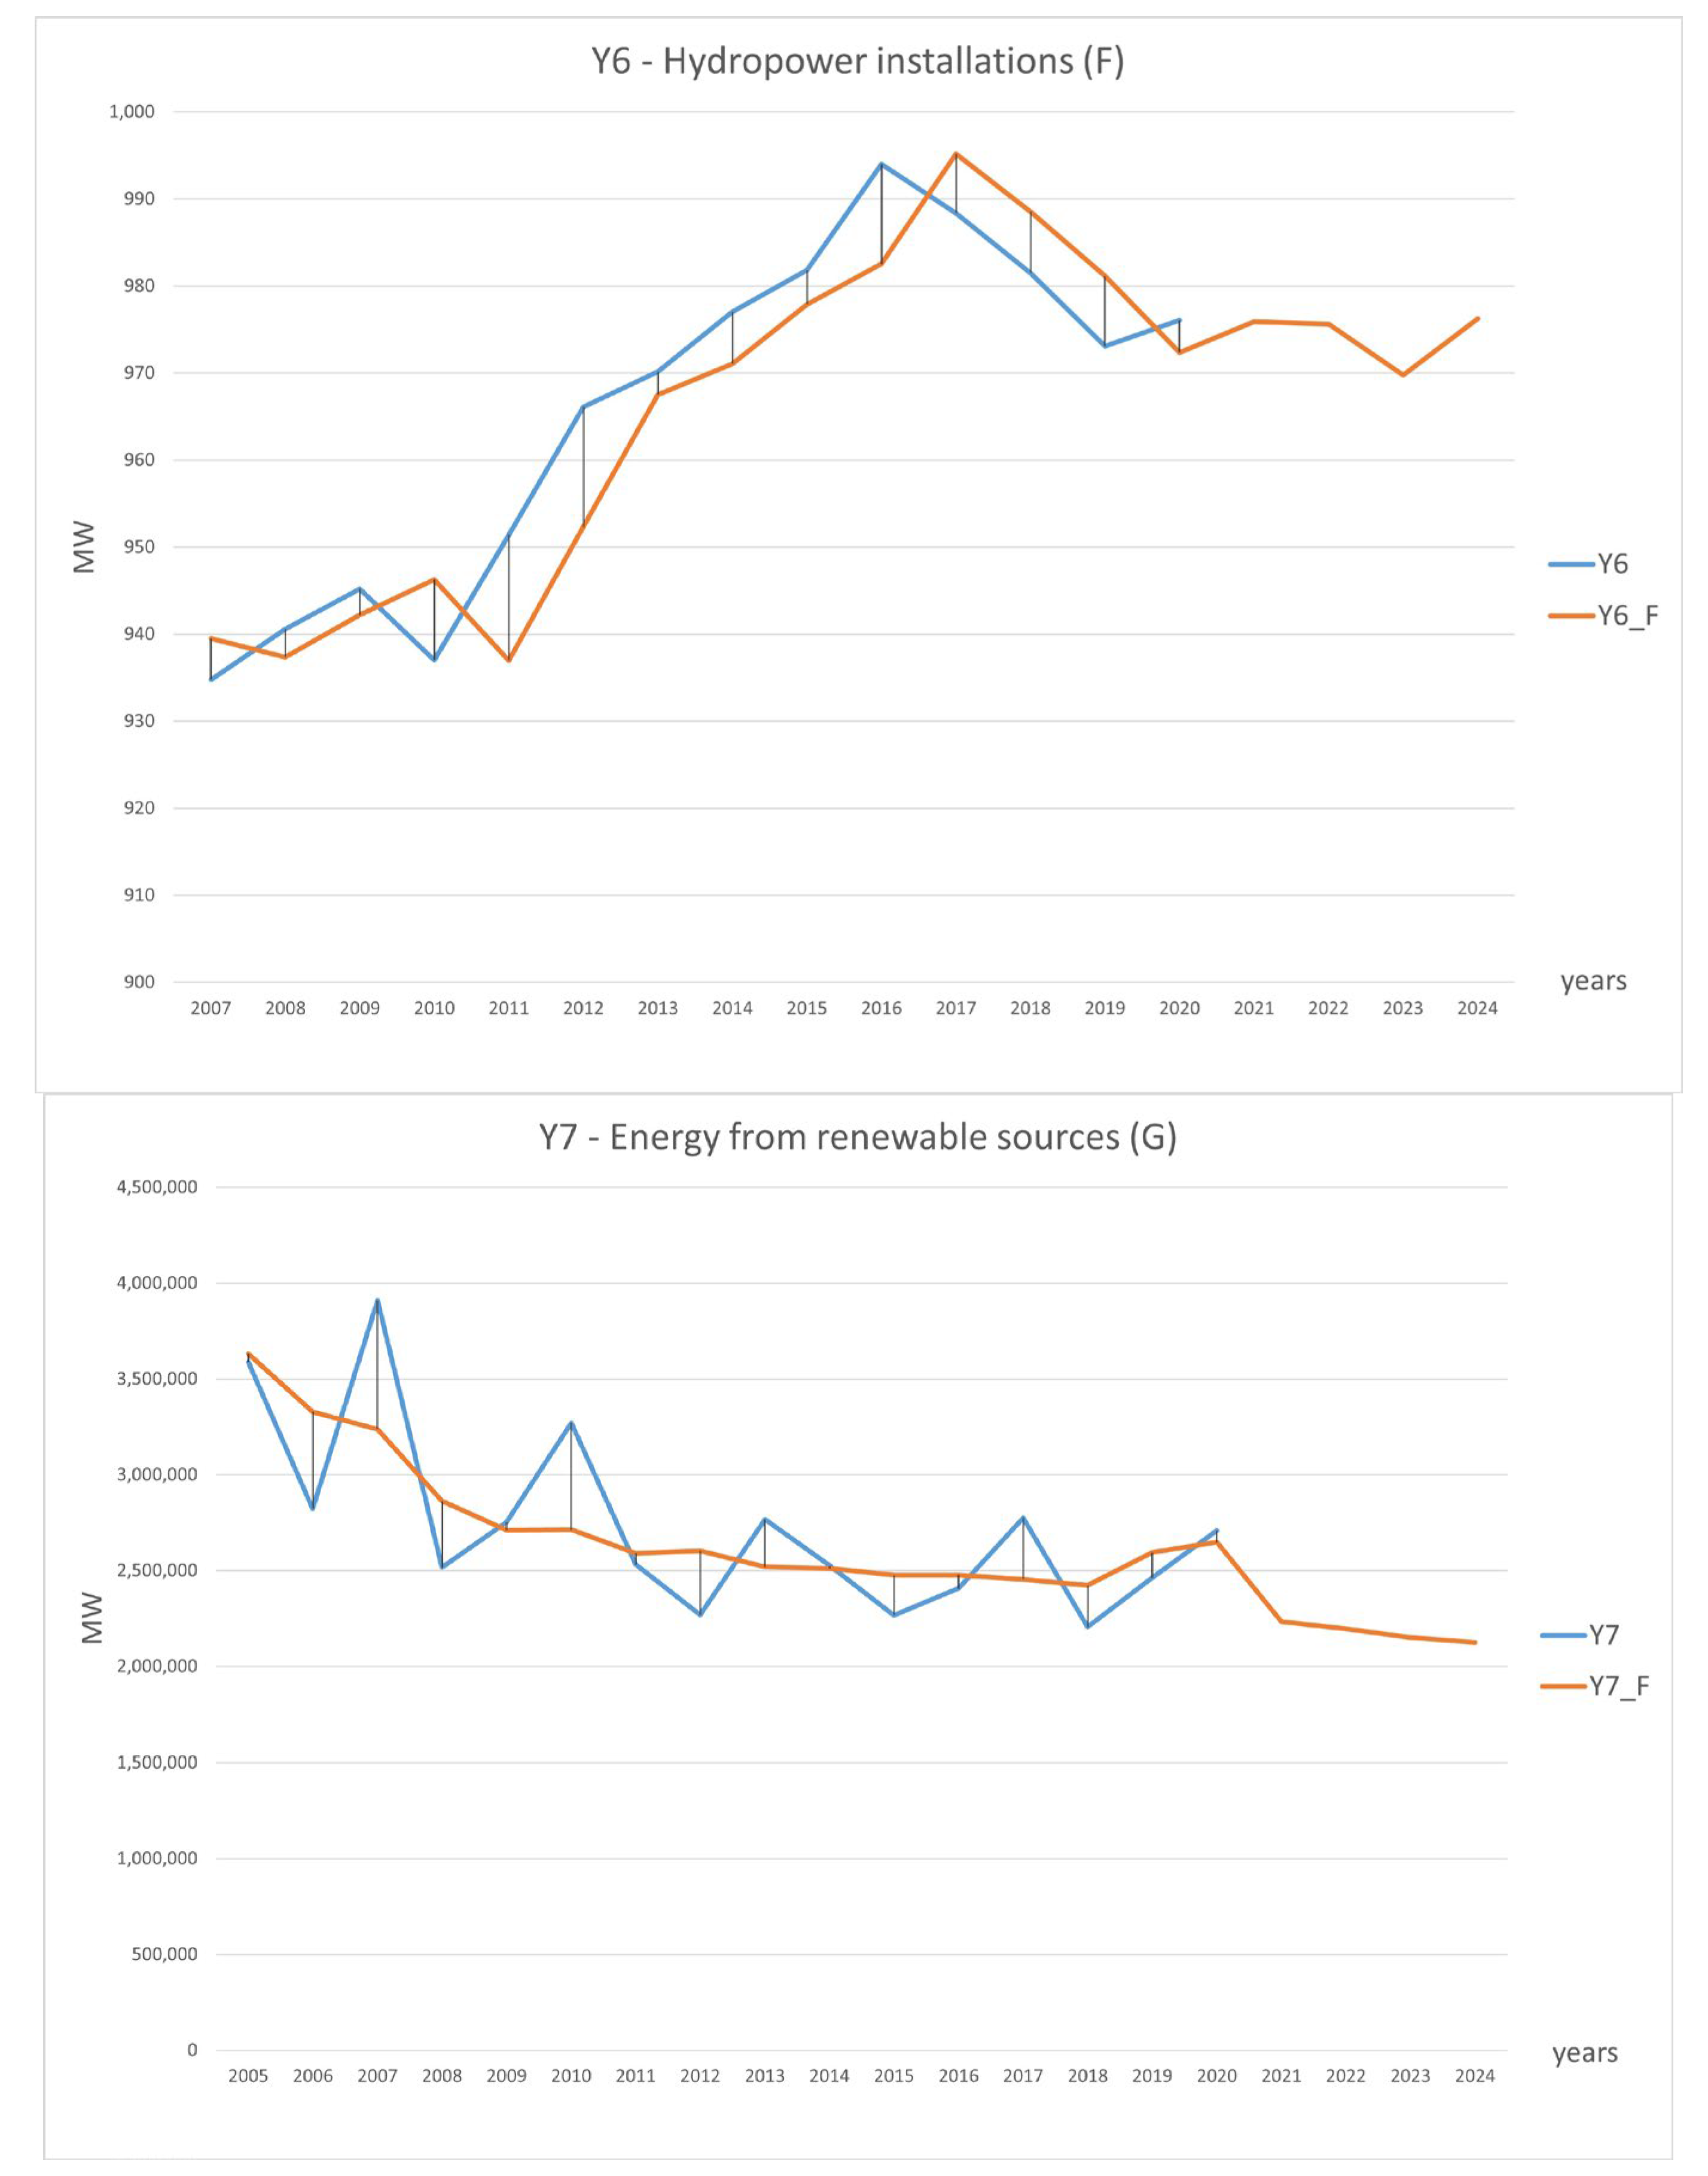
Table 1.
The most important stages and findings regarding climate policy.
| Date, Place and Name of the Event | Key Findings |
|---|---|
| The period before 1992 | Extensive debates supporting symbolic policy building towards a consensus, which creates foundations for the concept of sustainable development. |
| The period from 1998–2004 | A new direction of development with the shift into carbon pricing, resulting from attitude changes in Germany and Great Britain [20]. Emphasis placed on revising existing policies. The first European Climate Change Program (ECCP) is announced. Three out of 11 ECCP working groups are dedicated directly to energy issues: energy supply, energy demand and energy efficiency in end-use equipment and industrial processes [21]. |
| The period from 2005–2010 | In 2004, the European Environmental Agency points out that the GHE reduction targets are not achievable [21]. As a result, 2005 sees the launch of Phase 1 of the implementation of the EU Emissions Trading System. However, it is only the 2007 proposal of the 20-20-20 by 20 package and its adaptation in 2009 that sets the true boundaries and direction of change [22], especially for the countries of Central and Eastern Europe [23]. Ultimately, by 2010 the direction of climate policy development metamorphoses “from pieces to package” [18], and at the same time the integration of climate and energy policy objectives takes place. |
| The period 2010–2020 | The Europe 2020 strategy sets goals in terms of decarbonizing the economy, increasing the share of RES and supporting the growth of energy efficiency [24]. There is also focus on the development of monitoring strategy implementation progress and by 2016, it is anticipated that there is a real chance of achieving them [25]. Detailed studies and analyses indicate that the targets are not being achieved evenly both between them (with the least progress being made in energy efficiency) and between countries [26]. New energy targets are set: at least 40% cuts in greenhouse gas emissions (from 1990 levels), at least 32% share for RES and at least 32.5% improvement in energy efficiency [27]. |
| The period 2020 to now | The EU publishes its Green Deal, a new strategy for growth. Its aim is to build a modern, resource-efficient and competitive economy that will have reached net-zero greenhouse gas emissions by 2050 and that economic growth will include the optimal use of natural resources [27]. |
| The Fit for 55 package is the largest EU initiative to reduce greenhouse gas emissions, with a total of 13 legislative proposals. The proposed legislation includes a new EU forest strategy, a CO2 charging mechanism at the borders (CBAM), a social instrument for climate action and two transport initiatives focused on the deployment of sustainable aviation fuels, ReFuelEU Aviation, and on sustainability of the European maritime space, FuelEU Maritime. Amendments are to be enacted to the EU CO2 Emissions Trading System (EU ETS), the Land and Forest Land Use Regulation (LULUCF), the Renewable Energy Directive (RED), the Energy Efficiency Directive (EED) and the Regulation setting CO2 emission standards. These policies are also to be adapted to a more ambitious climate target for passenger cars. The Effort Sharing Regulation (ESR), the Alternative Fuels Infrastructure Directive (AFID) and the Energy Taxation Directive will be revised [28]. |
Source: Own study.
Table 2.
The most important summits and findings regarding climate policy.
| Date, Place and Name of the Event | Key Findings |
|---|---|
| Earth Summit Rio de Janerio (1992) | Setting the fundamental principles in socio-economic policy, which require that environmental protection be taken into account. Ends with the adoption of documents: United Nations Framework Convention on Climate Change, Agenda 21, Convention on the Conservation of Biological Diversity and Declaration on the direction of development, protection and use of forests [29]. |
| Kyoto Protocol (1997) | Defining binding greenhouse gas reduction targets, to be achieved through three market mechanisms: a carbon market between countries (emission trading—ET), the Clean Development Mechanism (CDM) and the Joint Implementation Mechanism (JI) [30]. |
| 2015 conference in Paris—COP21 | The landmark climate summit, ending with an agreement that every five years starting from 2020, each country should present new, ever higher climate goals and prepare adaptation plans, which are implemented at the national level. Another agreed objective was to redirect investments towards low-carbon development [4]. |
| 2018 climate summit in Katowice—COP24 | Refinement of the framework targets agreed in Paris. However, several of them remain unresolved: the global emissions trading system, length of commitment periods and forms for emission reporting [31]. |
| 2021 climate summit in Glasgow- COP26 | The climate summit sets targets for five areas: electromobility, hydrogen, clean energy, steel and agriculture. The rules for the functioning of the global emissions trading system are clarified. Forms for emission reporting are agreed in order to verify whether the emission reduction targets in individual countries are actually being met as planned. A major decision, adopted unanimously, concerns the development and distribution of clean technologies, while gradually eliminating coal capacity and phasing out fossil fuel subsidies [3]. Countries are required to present new, higher reduction targets for 2030. Among the many declarations, there are also those that concern the reduction in methane emissions, the reduction in deforestation, as well as the financial alliance for the goals of Net Zero [31]. |
Source: Own study.
Table 3.
Characteristics of the support mechanisms for RES in force in Poland.
| Mechanism | Instrument | Characteristics | Beneficiary of Support | Amount of Support |
|---|---|---|---|---|
| Financial mechanisms | Preferential loans | Preferential loans are loans granted for the implementation of projects in the area of installations generating energy from RES | The financing is intended for: organizational units of local government units, public finance sector units—other than those listed above | Preferential interest rates ranging from 0.25% to 0.5% per annum. |
| My Electricity Program | Grants from the “My Electricity” program are supported to increase the production of electricity from photovoltaic micro-installations (micro-PV). Beneficiaries receive reimbursement of costs incurred for the purchase and installation of a PV | This type of support may be granted to persons who generate electricity solely for their own needs and have a contract with the distribution system operator, which regulates issues related to the introduction into the grid of photovoltaic energy produced in micro-PV. | In the first two editions, the support amounted to PLN 5000. In subsequent editions, the support amounted to PLN 3000. | |
| Clean Air Program | The program grants non-refundable grants or subsidies intended for the repayment of part of the bank loan for the purchase and installation of a PV | As part of the program, natural persons who own a residential building can apply for funding for the replacement of old furnaces and boilers for solid fuel. | The amount of support ranges from 15–90% of the eligible investment costs and depends on the family’s income. | |
| Thermo-modernization bonus | The thermo-modernization bonus is an instrument granted by BGK. Its main purpose is to reimburse the costs incurred for the thermal modernization of buildings. The bonus can only be used if you take out a loan to complete the investment. | The thermo-modernization bonus can be used by: - owners of single-family houses, - legal persons (housing cooperatives and commercial law companies), - local government units, - housing communities | The premium may amount to up to 21% of the costs of the thermo-modernization project, provided that it also provides for the installation of micro-installations of RES. | |
| Energy Plus Program | Energy Plus is a program implemented by the National Fund for Environmental Protection and Water Management, its aim is to reduce the negative impact of enterprises on the environment and improve air quality. | Support under the program may be granted to entrepreneurs performing business activity | Support provided up to 50% of the eligible costs in the case of a grant or up to 85% of the eligible costs in the case of a preferential loan. If support is used in the form of a preferential loan, it is possible to partially redeem it up to 10% | |
| Biznesmax Guarantee | The Biznesmax guarantee is a bank guarantee program granted by BGK and consists in free securing a loan for investments in ecological innovations, including PV. | Support in this form can be used by small and medium-sized enterprises that want to install PV at home. | The support is offered for a period of 20 years with a guarantee range of up to 80% of the loan with a maximum amount of up to EUR 2.5 million. The support provided by the bank also includes an interest rate subsidy | |
| Agroenergy | The aim of this program is to increase the energy production from RES in the agricultural sector. Financial support covers projects involving the purchase and installation of PV | Support under this scheme is open to private persons and legal persons who own or lease agricultural property and whose total agricultural area ranges from 1 ha to 300 ha and who have run an agricultural holding for at least one year before submitting the application. | Aid in the form of grants up to 13% (for installations from 30 < kW ≤ 50) or up to 20% (for installations from 10 < kW ≤ 30) of the eligible investment costs | |
| Market mechanisms | Tradable green certificates system | Under this system, producers of RES are granted a certificate for each unit of energy they produce. This certificate is transferable and tradeable on the market | Power generators. The certificate of origin is granted only to electricity generated in a given RES installation for the first time before the date of entry into force of Chapter Four of the RES Act, i.e., before 1 July 2016 | The energy producer receives income from the physical sale of the produced energy, the price of which is set on the electricity market and additionally on the market of transferable certificates of origin of energy, i.e., certificates, specially designated for this purpose. |
| RES auction system | The RES auction is announced and carried out by the President of the Energy Regulatory Office (ERO) using the Internet Platform The first auction took place on 30 December 2016. Within a given basket of energy producers, the auction is won by those entities that offer the lowest price for the sale of energy | Power producers | The electricity production receives support in the form of a surcharge when the amount of the subsidy, depending on the outcome of the auction, is lower than the sale price (the average daily price of energy on the Polish Power Exchange (PPE). If the price of energy is higher, the producer is obliged to transfer the surplus. Auction winners receive a guarantee of a steady income from each MWh generated for the next 15 years | |
| Tax mechanisms | VAT relief | These are tax exemptions from activities related to the production of RES, which may relate to exemption from turnover, income, agricultural tax, as well as VAT and excise duty | Owners (investors) of houses with a usable area not exceeding 300 m2, apartments with a usable area of up to 150 m2, as well as objects covered by the social housing program | Reduction in the VAT rate from 23% to 8% |
| Excise tax relief | Owners of PV and consuming the electricity produced | Exemption from excise duty on the consumption of electricity produced from generators with a total capacity not exceeding 1 MW by entities that consume the energy produced | ||
| Thermo-modernization relief | Owners or co-owners of single-family residential buildings who carry out in their home investments of a thermo-modernization nature, including the installation of a PV, solar collectors and a heat pump | As part of which for a period of up to six consecutive years you can deduct a total of PLN 53,000 from income. This limit also applies to spouses, so in total they can make a deduction in the amount of PLN 106,000. | ||
| Investment relief for farmers | Relief granted to agricultural tax payers for expenses incurred for the purchase and installation of photovoltaic, wind and biogas installations and water fall | The relief is granted after the completion of a given investment and consists in deducting from the agricultural tax due on land located in the commune in which the investment was made in the amount of 25% of investment outlays documented by the accounts. | ||
| Regulatory mechanisms | Feed-in-tariff system | The FIT system is a mechanism covering installations with an installed capacity of less than 500 kW | Producers of electricity from biogas, biomass and hydroelectric power plants | The generator is entitled to conclude with the obligated seller a contract for the sale of electricity at a fixed price, which is 90% of the reference price |
| Feed-in premium system | The FIP system is a mechanism covering installations with an installed capacity of not less than 500 kW and not more than 1 MW. | Producers of electricity from biogas, biomass and hydroelectric power plants | The system is based on subsidies to the market price, i.e., covering 90% of the value of the so-called negative balance, which is the difference between the reference price announced for a given installation and the market average value of electricity sales | |
| System of net-metering | The system is valid until 31 March 2022—for prosumers with an installation connected to the power grid | Prosumers producing electricity in PV up to 50 kWp | Discount in installations up to: −10 kWp in a ratio of 1 to 0.8; −50 KWp in a ratio of 1 to 0.7. Prosumers who receive permission to connect micro-installations to the network until the date of entry into force of the Act will be settled on the current discounted rules for 15 years. | |
| System of net-billing | System valid from 1 April 2022—for new electricity prosumers | Prosumers producing electricity. | Prosumers will sell surplus energy introduced into the grid, will have a deposit—records of funds kept monthly and from it will be able to pay for the energy consumed | |
| PPAs | A contract for the purchase of renewable electricity on the basis of which a natural or legal person agrees to purchase renewable electricity directly from an electricity producer | Producer and consumer of electricity | In Poland, various models of PPAs are possible and acceptable: - on-site—the manufacturer’s RES installation is located directly at the recipient’s receiving installation, - near site direct wire RES installation is located in the vicinity of the recipient, and the electricity is transmitted by a dedicated distribution line, - off site—generated electricity from RES installations, is sent to the recipient via the transmission |
Source: Own study.
Table 4.
Variables used in cause-and-effect models.
| Variable Category | Specification | Unit | Symbol |
|---|---|---|---|
| Economic variables | GDP in Poland | (PLN billions) | X1 |
| The average price of electricity in Poland | (PLN/MWh) | X2 | |
| Expenditures on fixed assets to protect atmospheric air and climate | (PLN billions) | X3 | |
| Environmental variables | NOx emissions from the electricity energy sector | (thousands of tons) | X4 |
| Emission of SO2 by the electricity energy sector | (thousands of tons) | X5 | |
| Dust emission by the electricity energy sector | (thousands of tons) | X6 | |
| Greenhouse gas emissions from the electricity energy sector | (kt ekw. CO2) | X7 | |
| Industry variables | Total electricity energy production in Poland of which | (GWh) | X8 |
| -power plants | (GWh) | X9 | |
| -industrial power plants | (GWh) | X10 | |
| Electricity consumption in Poland | (GWh) | X11 |
Source: Own study.
Table 5.
Values of the validation measures of forecasting models according to the forecast variables.
Table 5.
Values of the validation measures of forecasting models according to the forecast variables.
| Prognostic Model | Miara Walidacji | Y1 | Y2 | Y3 | Y4 | Y5 | Y6 | Y7 |
|---|---|---|---|---|---|---|---|---|
| Cause-and-effect | MAPE | 0.095 | 0.031 | 0.115 | 0.175 | 0.172 | 0.010 | 0.085 |
| RMSE | 323.272 | 6.617 | 59.317 | 69.677 | 144.917 | 13.032 | 309,909.010 | |
| RMSPE | 0.204 | 0.040 | 0.151 | 0.364 | 0.126 | 0.003 | 0.176 | |
| Brown | MAPE | 0.151 | 0.042 | 0.102 | 0.461 | 0.125 | 0.007 | 0.151 |
| RMSE | 487.302 | 7.024 | 117.986 | 96.306 | 377.688 | 7.955 | 486,839.235 | |
| RMSPE | 0.189 | 0.056 | 0.158 | 0.544 | 0.152 | 0.008 | 0.189 | |
| Holt | MAPE | 0.181 | 0.117 | 0.103 | 0.408 | 0.109 | 0.028 | 0.138 |
| RMSE | 784.176 | 23.495 | 112.727 | 92.488 | 379.613 | 41.576 | 618,551.631 | |
| RMSPE | 0.246 | 0.136 | 0.162 | 0.526 | 0.135 | 0.044 | 0.190 | |
| Winters | MAPE | 0.117 | 0.070 | 0.154 | 0.602 | 0.142 | 0.009 | 0.255 |
| RMSE | 407.653 | 12.065 | 131.649 | 103.208 | 475.744 | 13.738 | 600,937.960 | |
| RMSPE | 0.178 | 0.106 | 0.224 | 0.637 | 0.195 | 0.014 | 0.314 |
Source: Own study.
Table 6.
The results of the correlation coefficients between the calculated historical forecasts and the empirical values of the forecast variables.
Table 6.
The results of the correlation coefficients between the calculated historical forecasts and the empirical values of the forecast variables.
| Prognostic Model | Y1 | Y2 | Y3 | Y4 | Y5 | Y6 | Y7 |
|---|---|---|---|---|---|---|---|
| Cause-and-effect | 0.7190 ** | 0.9967 *** | 0.9929 *** | 0.3007 | 0.9981 *** | 0.9197 *** | 0.9434 *** |
| Brown | 0.9966 *** | 0.9740 *** | 0.9880 *** | 0.8343 ** | 0.9220 *** | 0.9193 *** | 0.3247 |
| Holt | 0.9828 *** | 0.9770 *** | 0.9482 *** | 0.9895 *** | 0.1208 | −0.4336 | −0.3996 |
| Wintersa | −0.4703 | 0.9843 *** | 0.9574 *** | 0.9736 *** | 0.7367 ** | 0.1319 | 0.8195 * |
The statistical significance of the results was denoted by: *** for p < 0.001, ** for p < 0.01 and * for p < 0.05. Source: Own study.
Table 7.
Parameters of cause-and-effect models for variables Y1, Y2, Y3, Y4, Y5, Y7.
| Y1—capacity installed including hydroelectric power plants in professional power plants (GW) | ||||
| Explanatory variables | B | Std.Dev. | p | R2 |
| W. free | 2061.151 | 193.509 | 0.000 | 51.695% |
| X5 | 1.638 | 0.423 | 0.002 | |
| Y2—Biogas installations (MW) | ||||
| Explanatory variables | B | Std.Dev. | p | R2 |
| W. free | −20.0743 | 8.6708 | 0.038 | 99.02% |
| X1 | 0.096 | 0.015 | 0.000 | |
| X3 | −10.035 | 4.328 | 0.043 | |
| X4 | −0.987 | 0.161 | 0.000 | |
| X7 | −0.001 | 0.001 | 0.033 | |
| X8 | 0.004 | 0.001 | 0.000 | |
| Y3—Biomass installations (MW) | ||||
| Explanatory variables | B | Std.Dev. | p | R2 |
| W. free | 952.845 | 1063.773 | 0.391453 | 99.29% |
| X1 | 0.753 | 0.138 | 0.000 | |
| X3 | −152.227 | 38.793 | 0.003 | |
| X4 | −5.044 | 1.443 | 0.006 | |
| X7 | −0.015 | 0.005 | 0.010 | |
| X8 | 0.032 | 0.007 | 0.001 | |
| Y4—Solar installations (MW) | ||||
| Explanatory variables | B | Std.Dev. | p | R2 |
| W. free | 3288.597 | 930.145 | 0.006 | 87.982% |
| X1 | 0.766 | 0.091 | 0.000 | |
| X8 | −0.028 | 0.006 | 0.001 | |
| Y5—Wind energy installations (MW) | ||||
| Explanatory variables | B | Std.Dev. | p | R2 |
| W. free | −5373.940 | 2060.655 | 0.026 | 99.43% |
| X1 | 1.854 | 0.409 | 0.001 | |
| X3 | −375.959 | 77.954 | 0.001 | |
| X4 | −36.984 | 4.058 | 0.000 | |
| X9 | 0.046 | 0.016 | 0.017 | |
| X10 | 0.849 | 0.194 | 0.001 | |
| Y7—Energy from RES (MW) | ||||
| Explanatory variables | B | Std.Dev. | p | R2 |
| W. free | 4,670,506.497 | 2,425,406.916 | 0.076 | 48.390% |
| X5 | 2034.811 | 567.634 | 0.003 | |
| X9 | −19.249 | 6.905 | 0.015 | |
Source: Own study.
Table 8.
Parameters of the exponential smoothing model for the variable Y6 (MW).
| Y6—Hydropower Installations | |
|---|---|
| Forecast horizon | Alpha |
| h = 1 | 0.533474 |
| h = 2 | 0.383742 |
| h = 3 | 0.303612 |
| h = 4 | 0.255496 |
Source: Own study.
Table 9.
Y-variable forecast values obtained on the basis of selected models.
| Year | Y1 | Y2 | Y3 | Y4 | Y5 | Y6 | Y7 |
|---|---|---|---|---|---|---|---|
| 2021 | 2182.533 | 293.5098 | 1697.77 | 530.5487 | 7265.854 | 975.8987 | 2,235,184 |
| 2022 | 2105.383 | 332.03 | 1940.236 | 653.0178 | 8409.41 | 975.6088 | 2,196,625 |
| 2023 | 2027.666 | 375.3642 | 2207.836 | 769.7024 | 9690.534 | 969.7484 | 2,151,760 |
| 2024 | 1955.97 | 426.6483 | 2528.482 | 912.3445 | 11183.87 | 976.2505 | 2,124,591 |
Source: Own study.
Table 10.
Average and relative ex ante prediction error for forecasts generated from a cause-and-effect model.
Table 10.
Average and relative ex ante prediction error for forecasts generated from a cause-and-effect model.
| Year | Type of Ex Ante Prediction Error | Y1 | Y2 | Y3 | Y4 | Y5 | Y7 |
|---|---|---|---|---|---|---|---|
| 2021 | absolute | 166.048 | 4.385 | 39.308 | 57.569 | 96.046 | 170,048.958 |
| relative | 7.608% | 1.494% | 2.315% | 10.581% | 1.322% | 7.608% | |
| 2022 | absolute | 183.355 | 5.267 | 47.214 | 71.477 | 115.769 | 197,505.638 |
| relative | 8.709% | 1.586% | 2.433% | 10.946% | 1.377% | 8.991% | |
| 2023 | absolute | 201.287 | 6.306 | 56.527 | 87.873 | 139.274 | 226,450.964 |
| relative | 9.927% | 1.680% | 2.560% | 11.417% | 1.437% | 10.524% | |
| 2024 | absolute | 218.161 | 7.617 | 68.283 | 108.214 | 167.692 | 261,934.571 |
| relative | 11.154% | 1.785% | 2.700% | 11.861% | 1.499% | 12.329% |
Source: Own study.
Publisher’s Note: MDPI stays neutral with regard to jurisdictional claims in published maps and institutional affiliations. |
© 2022 by the authors. Licensee MDPI, Basel, Switzerland. This article is an open access article distributed under the terms and conditions of the Creative Commons Attribution (CC BY) license (https://creativecommons.org/licenses/by/4.0/).
Share and Cite
MDPI and ACS Style
Mazurek-Czarnecka, A.; Rosiek, K.; Salamaga, M.; Wąsowicz, K.; Żaba-Nieroda, R. Study on Support Mechanisms for Renewable Energy Sources in Poland. Energies 2022, 15, 4196. https://0-doi-org.brum.beds.ac.uk/10.3390/en15124196
AMA Style
Mazurek-Czarnecka A, Rosiek K, Salamaga M, Wąsowicz K, Żaba-Nieroda R. Study on Support Mechanisms for Renewable Energy Sources in Poland. Energies. 2022; 15(12):4196. https://0-doi-org.brum.beds.ac.uk/10.3390/en15124196
Chicago/Turabian StyleMazurek-Czarnecka, Agnieszka, Ksymena Rosiek, Marcin Salamaga, Krzysztof Wąsowicz, and Renata Żaba-Nieroda. 2022. "Study on Support Mechanisms for Renewable Energy Sources in Poland" Energies 15, no. 12: 4196. https://0-doi-org.brum.beds.ac.uk/10.3390/en15124196
Note that from the first issue of 2016, this journal uses article numbers instead of page numbers. See further details here.