
Mathematical Modeling of Sintering Air Leakage through Holes


1
School of Mechanical Engineering and Automation, Northeastern University, Shenyang 110819, China
2
Anshan Iron & Steel Corp. (AISC), Anshan 114051, China
*
Author to whom correspondence should be addressed.
Energies 2022, 15(12), 4224; https://0-doi-org.brum.beds.ac.uk/10.3390/en15124224
Submission received: 29 April 2022
/
Revised: 4 June 2022
/
Accepted: 6 June 2022
/
Published: 8 June 2022
(This article belongs to the Topic Fluid Mechanics)
Abstract
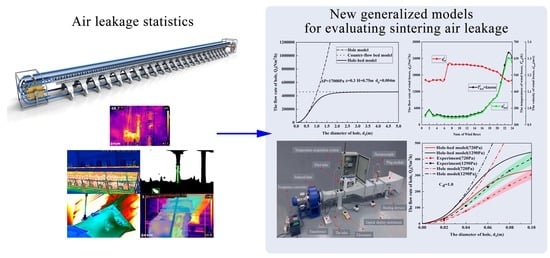
:The air leakage in sintering machines affects the technological and economic indexes of the sintering process. It is of great significance to monitor and estimate the key areas. Mathematical models of sintering air leakage through holes in the steady-state process are given based on the fluid mechanics to predict the flow rate and effect on the key area. It was found that the hole model is the application of constant orifice outflow in the computation of sintering air leakage. The counter-flow bed model is suitable for predicting the flow rate through a complete break in sintering wind boxes. Furthermore, This paper proposes a new hole–bed generalized model to cover all the possible hole diameters for further high-precision application. The model connects the leakage hole diameter with the sintering process for the first time and establishes their coupling relationship. The pressure state in the sintering system depends on the ratio of the leakage hole area to the sintering bed area. The proposed fast estimation models are a step forward in developing more precise and powerful calculation tools to foresee the effects and consequences of sintering air leakage. It has a good prospect for reducing and replacing complex manual measurement and bringing some insight into the state of the art that could be improved in the future.
1. Introduction
Air leakage is a worldwide problem in sintering plants [1]. It directly leads to the reduction in the sinter output and quality. It is also the waste of a large amount of energy. Mastering and evaluating the air leakage state of sintering is the first step to solving the problem. The air leakage rate in sintering machines is generally 30~60%. Leakage between pallets and wind boxes accounts for the greatest proportion of the total, including head and tail position gaps, slide-way sealing, abrasion, corrosion, connecting flange, etc. They usually exist in the form of gaps or holes. Due to the large structure, production environment and instrument limitations, the development of sintering air leakage detection and energy-saving technology remains sluggish. At present, the gas analysis method [2], airflow distribution on bed surface method [3], calorimetry method [4], etc., are the commonly used methods to detect the air leakage rate. For local air leakage points, the appropriate instruments can be used to detect the air leakage directly. The thermal anemometer is used to measure the air leakage of bed cracks and holes, pallets gap, etc., at the No. 3 sintering plant in Nagoya Works of Nippon Steel [5]. Reference [6] introduced the air leakage detection system based on the acoustic principle. The microphone was used to test and compare the sound pressure of the old pallet and the new one. It was found that the sound pressure of the pallet with large damage is significantly higher, which proves the feasibility of using the sound pressure to evaluate the air leakage. However, most off-line detection methods require complicated, time-consuming, low-efficiency or high-cost processes. Moreover, the result tends to have bad repeatability and accuracy. The impact of air leakage on the sintering bed remains in the virtue of experience to judge.
On the other side, the research of generalized gas leakage detection in pipelines has gradually become a hot research field. Many research results provide a variety of detection and quantitative means for the leakage problem. Therefore, those results significantly benefit the research and quantitative evaluation of sintering air leakage.
The study on the leakage model for gas pipelines enables engineers to estimate the leakage without instruments, which become the basis for consequence analysis and simulation of leakage diffusion of gas pipeline. Some studies on the gas leakage model have been carried out in recent years. Mathematical models of gas leakage are given according to the fluid mechanics.
The “hole model” [7,8] is applicable for the cases where the leakage hole is small enough, while the “pipe model” [9,10] is for the cases where the pipe section is a complete break. The hole-pipe model [11,12] is the synthesis of the above two. It is a universal leakage model considering the coupling effect of leakage hole size and pipeline pressure drop. Geoff Hankinson [13] presented a program of full-scale experiments. The results provided essential data for validating mathematical models and are used in developing risk assessment methodologies for gas pipelines. The calculation results of the pipe model of Picard [14] proved that the ideal gas assumption makes the gas leakage rate too small. Therefore, the real gas state equation must be added to the model to calculate the accurate leakage. Yuhua Dong et al. [15,16] added the real gas state equation to the medium and low-pressure hole-pipe model. The compressibility coefficient was introduced, so the hole-pipe model was suitable for high-pressure gas. Mahgerefteh et al. [17,18,19] combined the characteristic line, nested grid and fast mathematical algorithm to put forward a two-phase hydrocarbon pipeline’s fracture and leakage model. Young [20,21,22] assumed that the initial pressure in the pipe is constant and the leakage is an adiabatic process and obtained a simplified calculation model of the small hole leakage rate in a high-pressure pipeline. Kostowski et al. [23,24] presented a method of accounting for leakage utilizing a reference flow equation with a flow coefficient, and the dependency of the flow coefficient on pressure was demonstrated both with the literature data and the authors’ experimental results. It was eventually shown that the impact of the flow coefficient on the predicted outflow rate is of lesser importance than that of the applied flow model. The literature [25] proposed a prediction model of leakage intensity of leaked oil and seepage–diffusion range in the soil. The characteristics of dynamic seepage–diffusion of leaked oil in porous soil are investigated, which provides an essential basis and technical support for pipeline accident treatment.
Recently, computational fluid dynamics also promoted the development of gas leakage and diffusion models. A. Ebrahimi-Moghadam et al. [26,27] used the numerical method to investigate leakage estimation of compressible gas in above-ground and buried urban distribution natural gas pipelines. Mahmood Farzaneh-Gord et al. [28] developed an accurate equation for predicting methane emission into the environment during the natural gas purging process with the assistance of the CFD simulation. Xinhong Li et al. [29] presented a computational fluid dynamics (CFD) based approach to describe the behavior of underwater gas release and dispersion from subsea gas pipelines leak. Juliane Fiates et al. [30] developed a series of CFD simulations and a computational tool for handling the gas dispersion of heavy gases, such as LNG and CO2. Meanwhile, gas leakage detection technology is developing rapidly. Many research results provide a variety of detection and quantitative means for the leakage problem, such as the ultrasound method [31,32], acoustic emission method [33,34,35,36], infrared thermography technology [37,38,39,40], etc.
Compared with the leakage problems in the gas transmission pipeline, the study and detection methods for sintering air leakage still have a long way to go. Therefore, developing a fast estimation model for sintering air leakage is essential to reduce and replace complex manual measurements. Additionally, it can evaluate the impact of air leakage on sintering beds quantitatively. It is also a beneficial supplement to the systematization and standardization of air leakage monitoring technology in sintering machines.
Unlike gas pipelines, air leakage in the sintering machine is negative pressure leakage. The steady sintering process can be regarded as a high-temperature granular bed, and there is a huge temperature difference along the running direction of the pallets. Thus, its fast estimation model has unique characteristics. This paper gives mathematical models of air leakage in sintering machines by using fluid mechanics. They are the hole model, counter-flow bed model and hole–bed model. Application and validation examples of the models are offered. The proposed fast estimation models are a step forward in developing more precise and powerful calculation tools to foresee the effects and consequences of sintering air leakage.
2. Description of Simplified Model of Sintering System
2.1. System Description
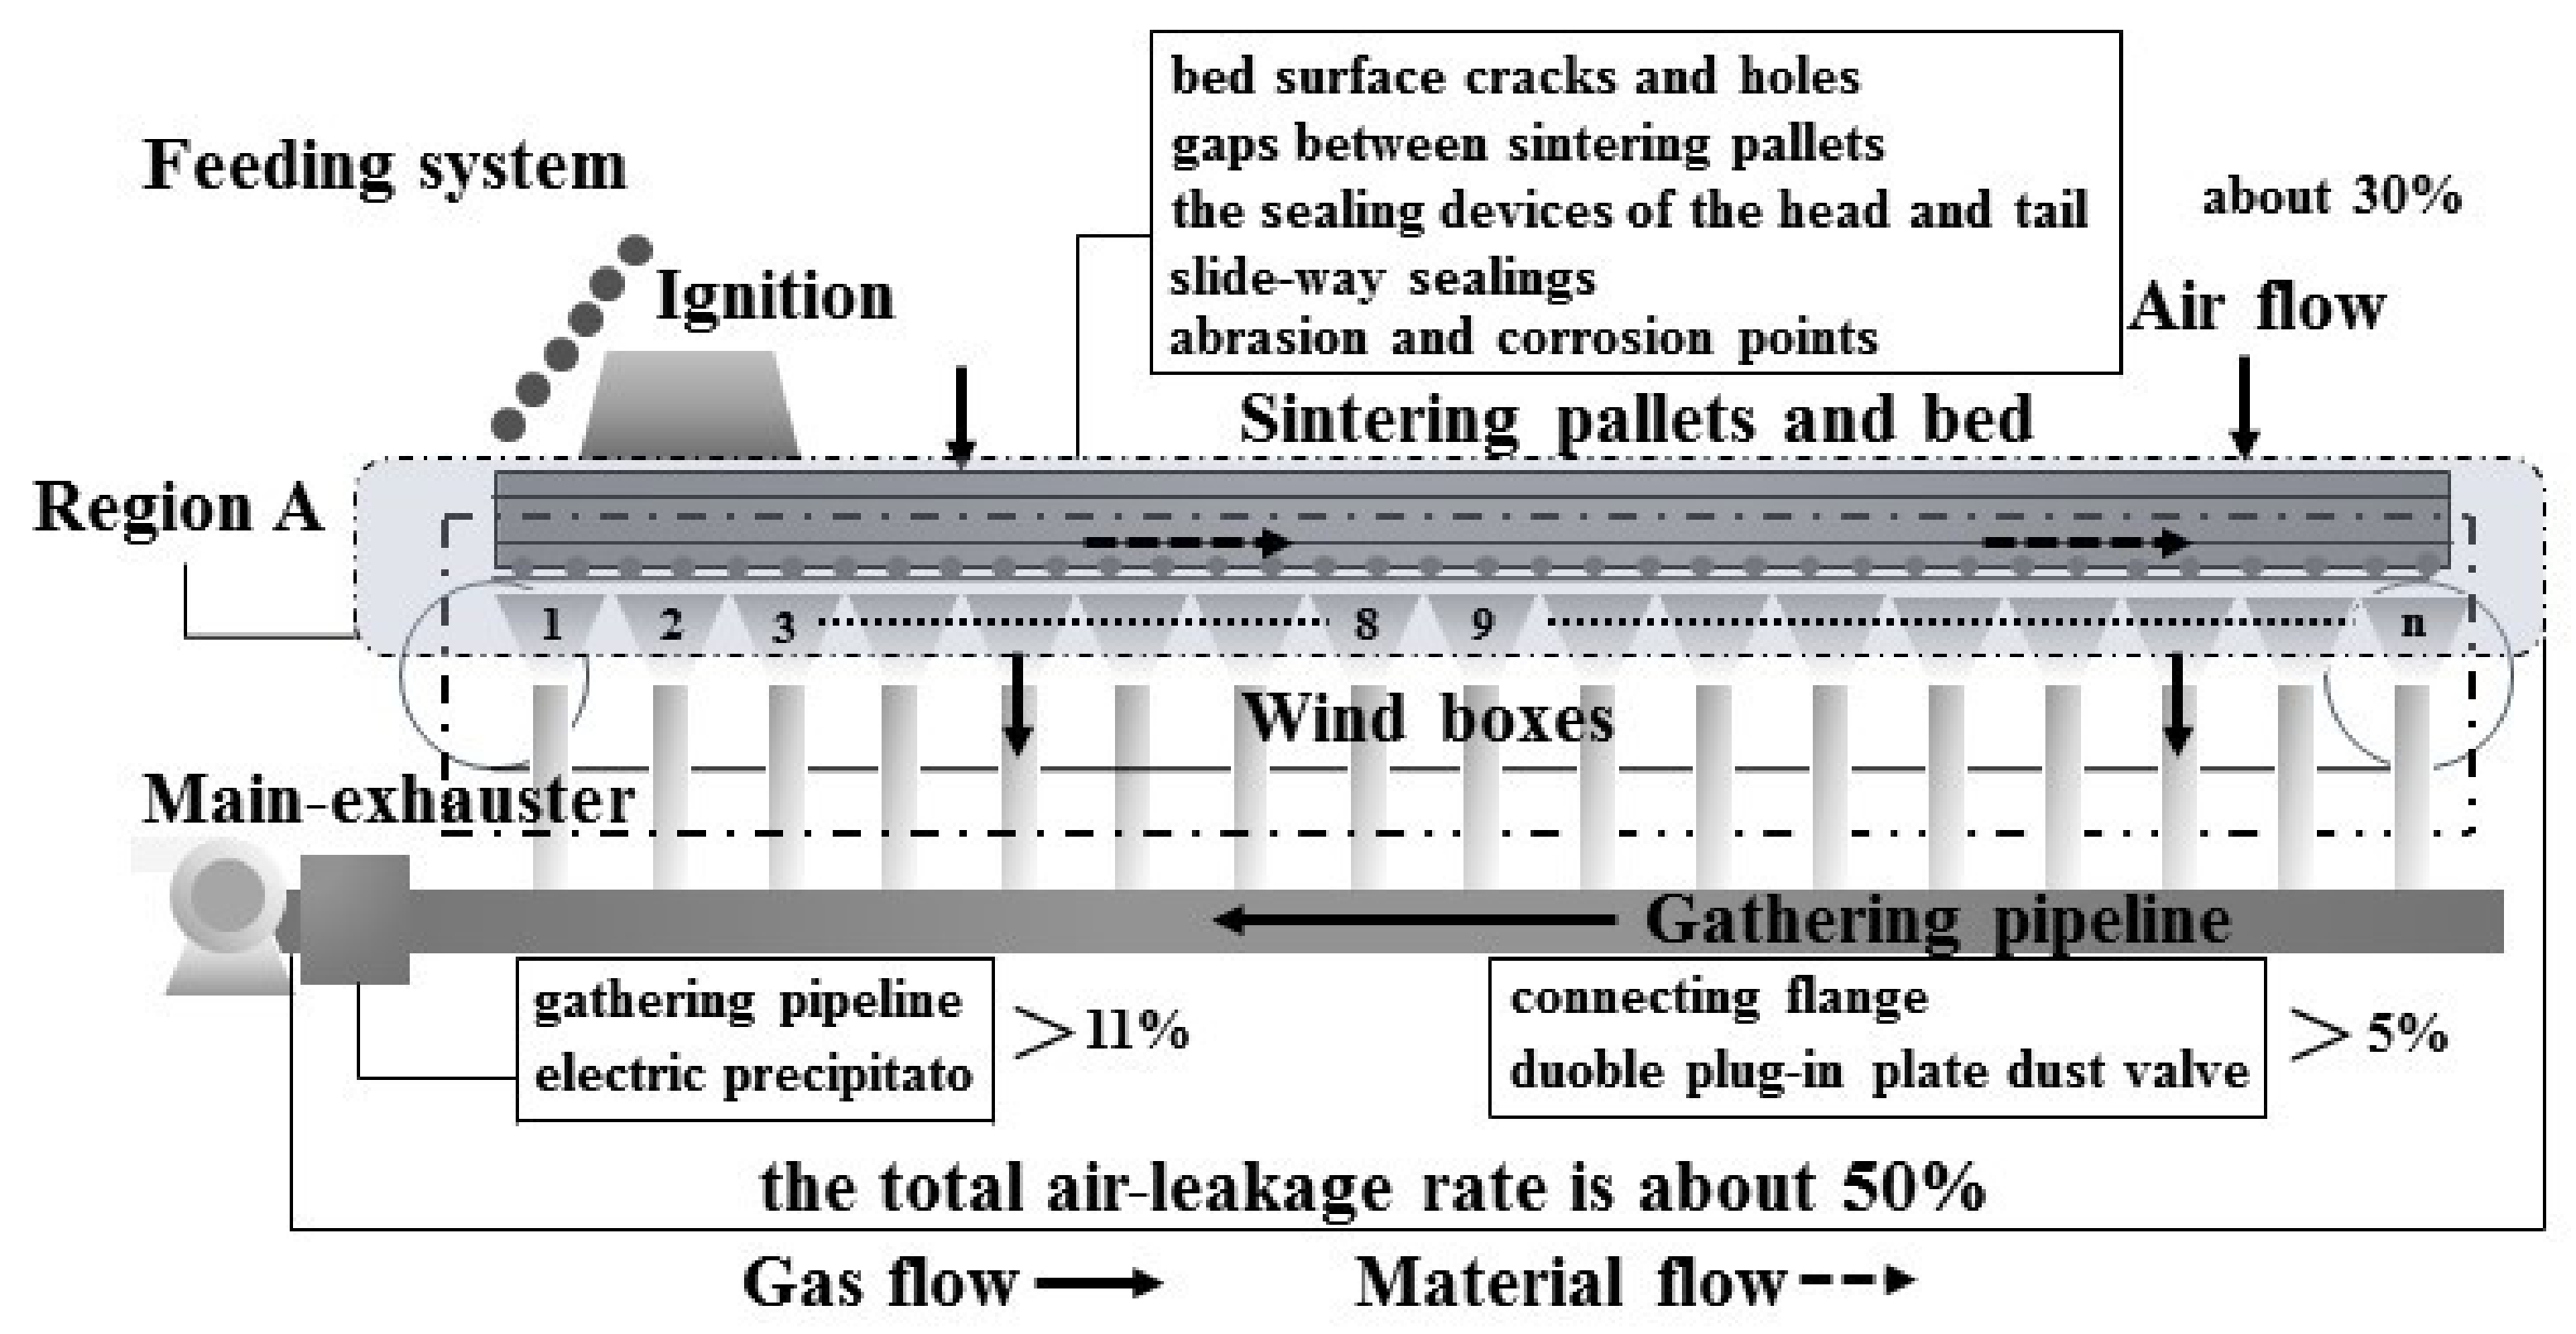
Figure 1 shows that the pallets carry the sintering material across the ignition furnace during normal production to start the sintering process. Vacuum suction is formed through the main exhaust fans to promote the airflow in the sintering bed. The air is sent to the material layer to accelerate the sintering process. The gas is heated after passing through the bed with some chemical reaction processes.
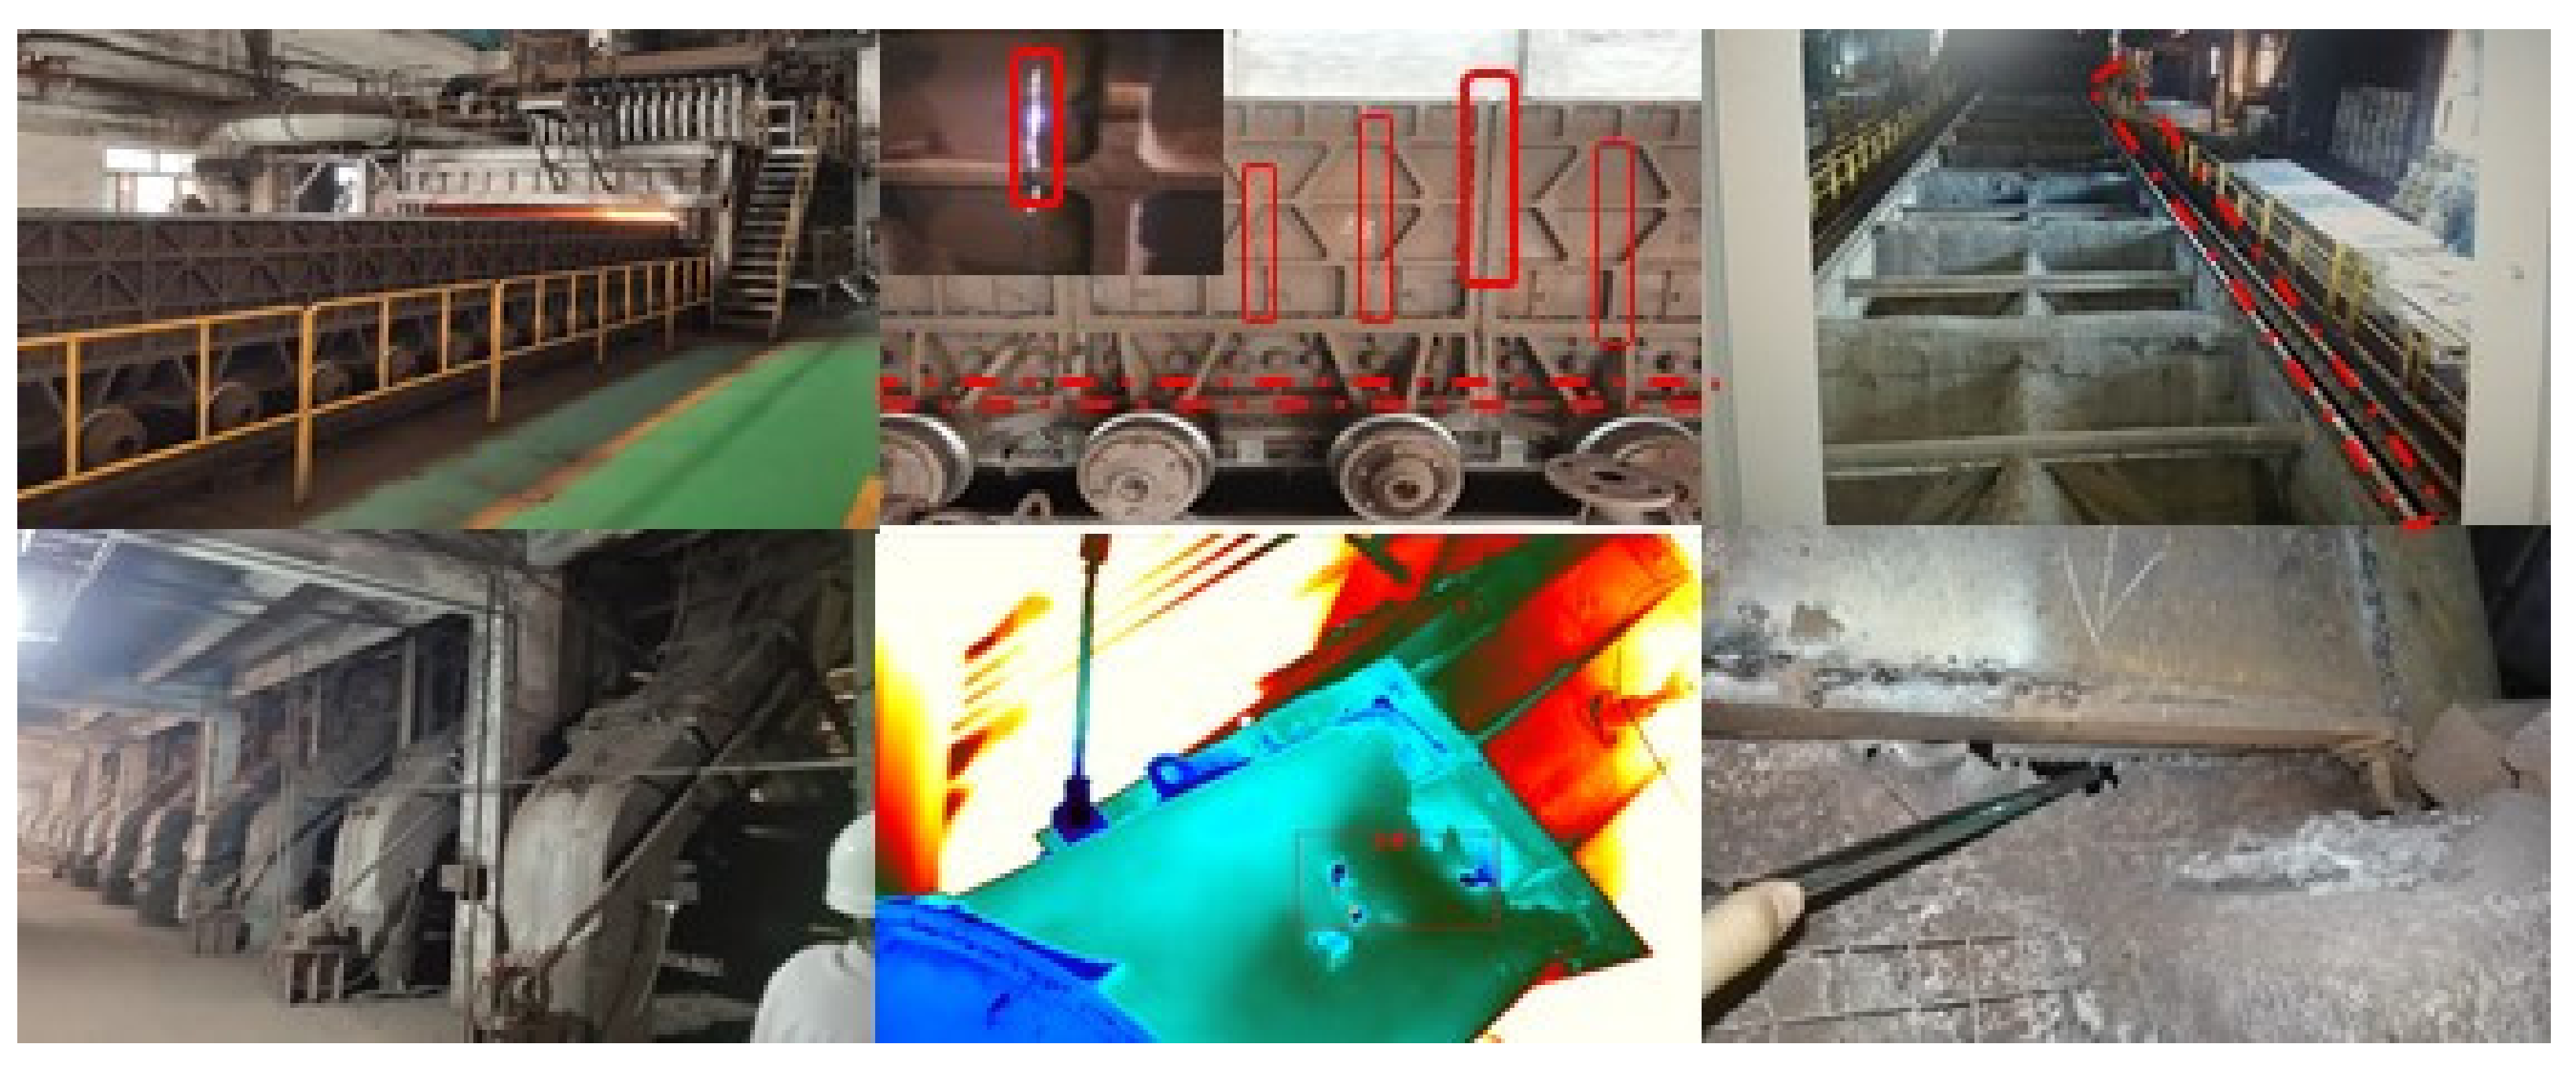
There are many air leakage areas in the sintering machine. The leakage between pallets and wind boxes (cf. Region A in Figure 1) accounts for the greatest proportion of the total. These air leakage points are close to the sintering bed. Therefore, region A is the key air leakage monitoring and evaluation area in sintering plants. Figure 2 shows some typical leakage in region A.
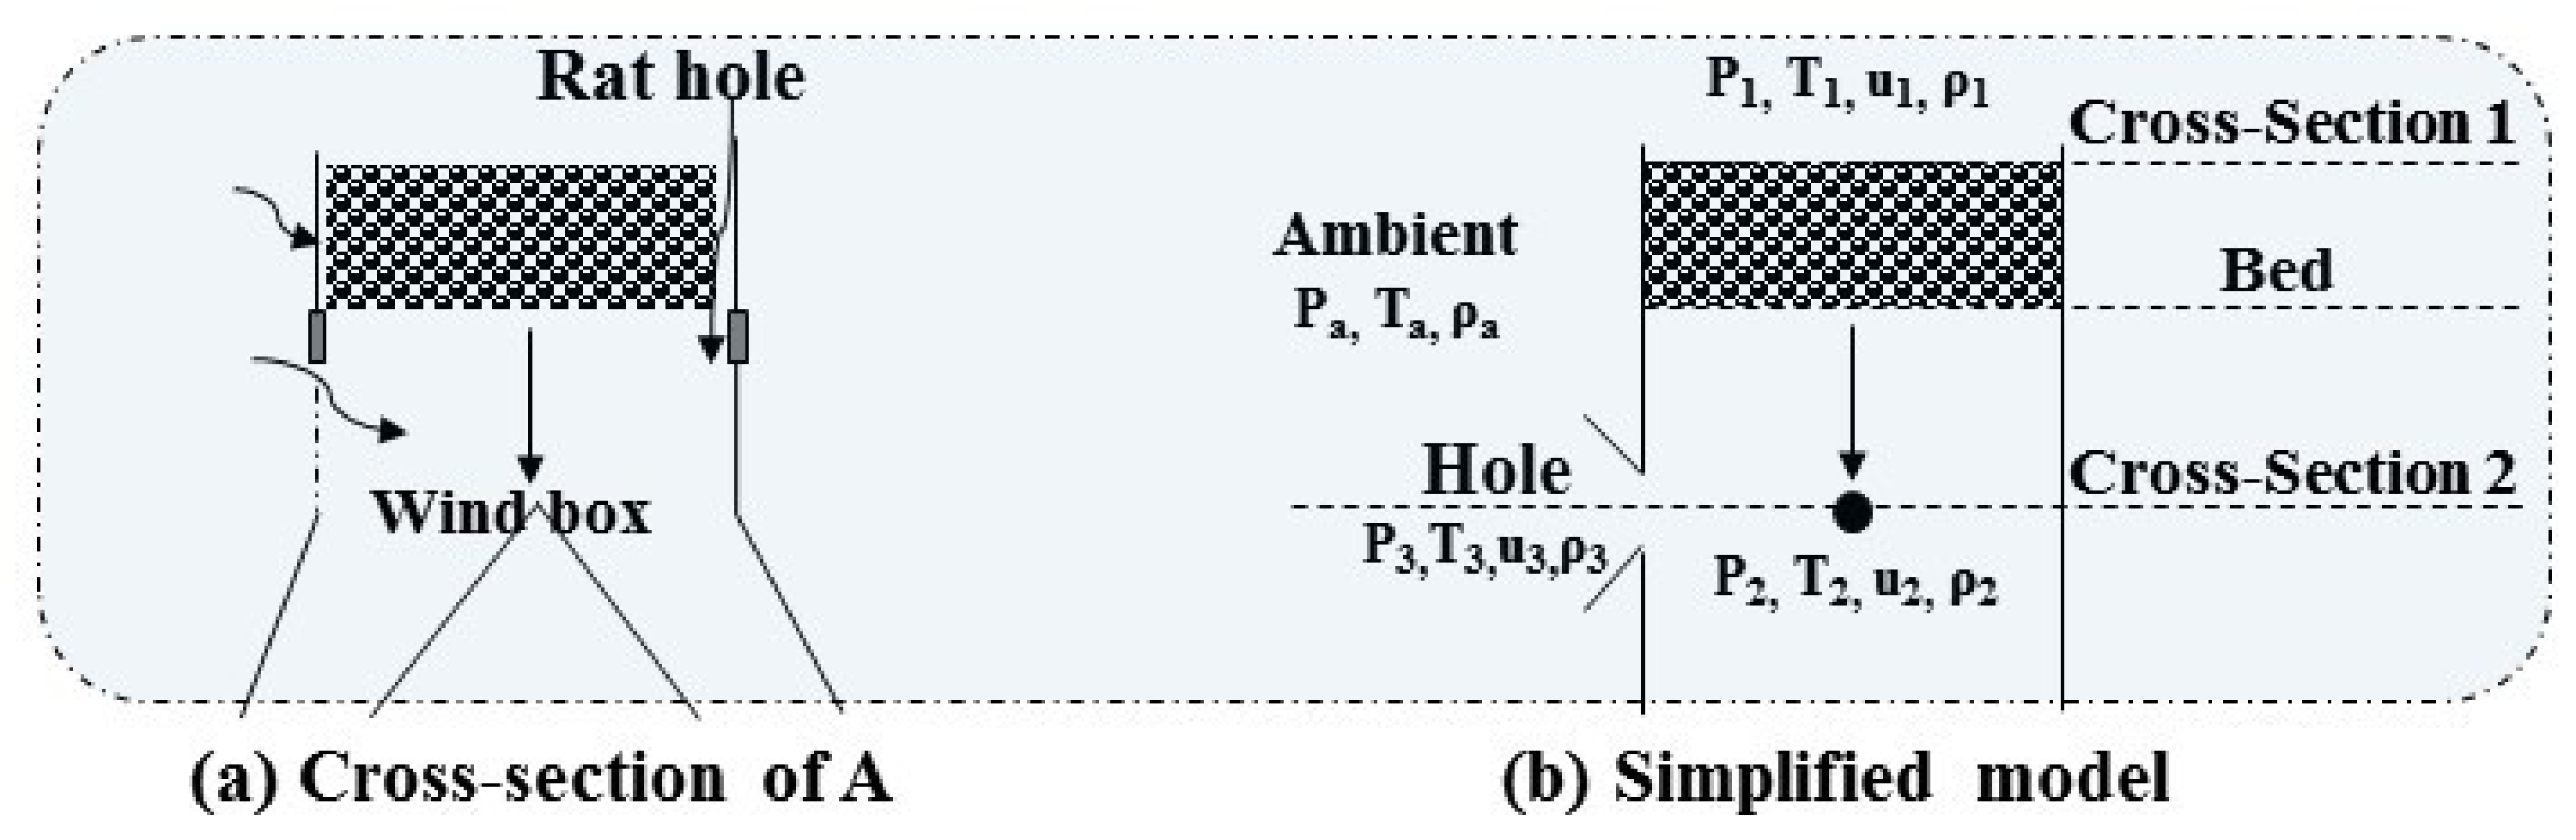
The simplified model diagram of the sintering system is shown in Figure 3, and the equivalent leakage occurs in region A. Several assumptions were made:
- (1)
- All leakage points (cf. Figure 3a) occurring in region A are equivalent to one hole for convenience;
- (2)
- The sintering process is steady, so the thermal state of each wind box is stable;
- (3)
- The cross-section area of wind boxes is tapered along the vertical direction (cf. Figure 3a). It is reasonable to treat Region A with the same equivalent diameter;
- (4)
- Because the packed bed has a vast interfacial area, its frictional loss is usually much greater than that of the rest of the sintering system. Therefore, the local and on-way resistance inside region A can be ignored;
- (5)
- The absolute pressure variation is usually less than 10% in the sintering bed. The working temperature along the length of the sintering machine varies greatly. Thus, the state equation for the incompressible ideal gas is used for the study (cf. Equation (1)). It can convert the different isothermal beds of each wind box position into the same temperature state.
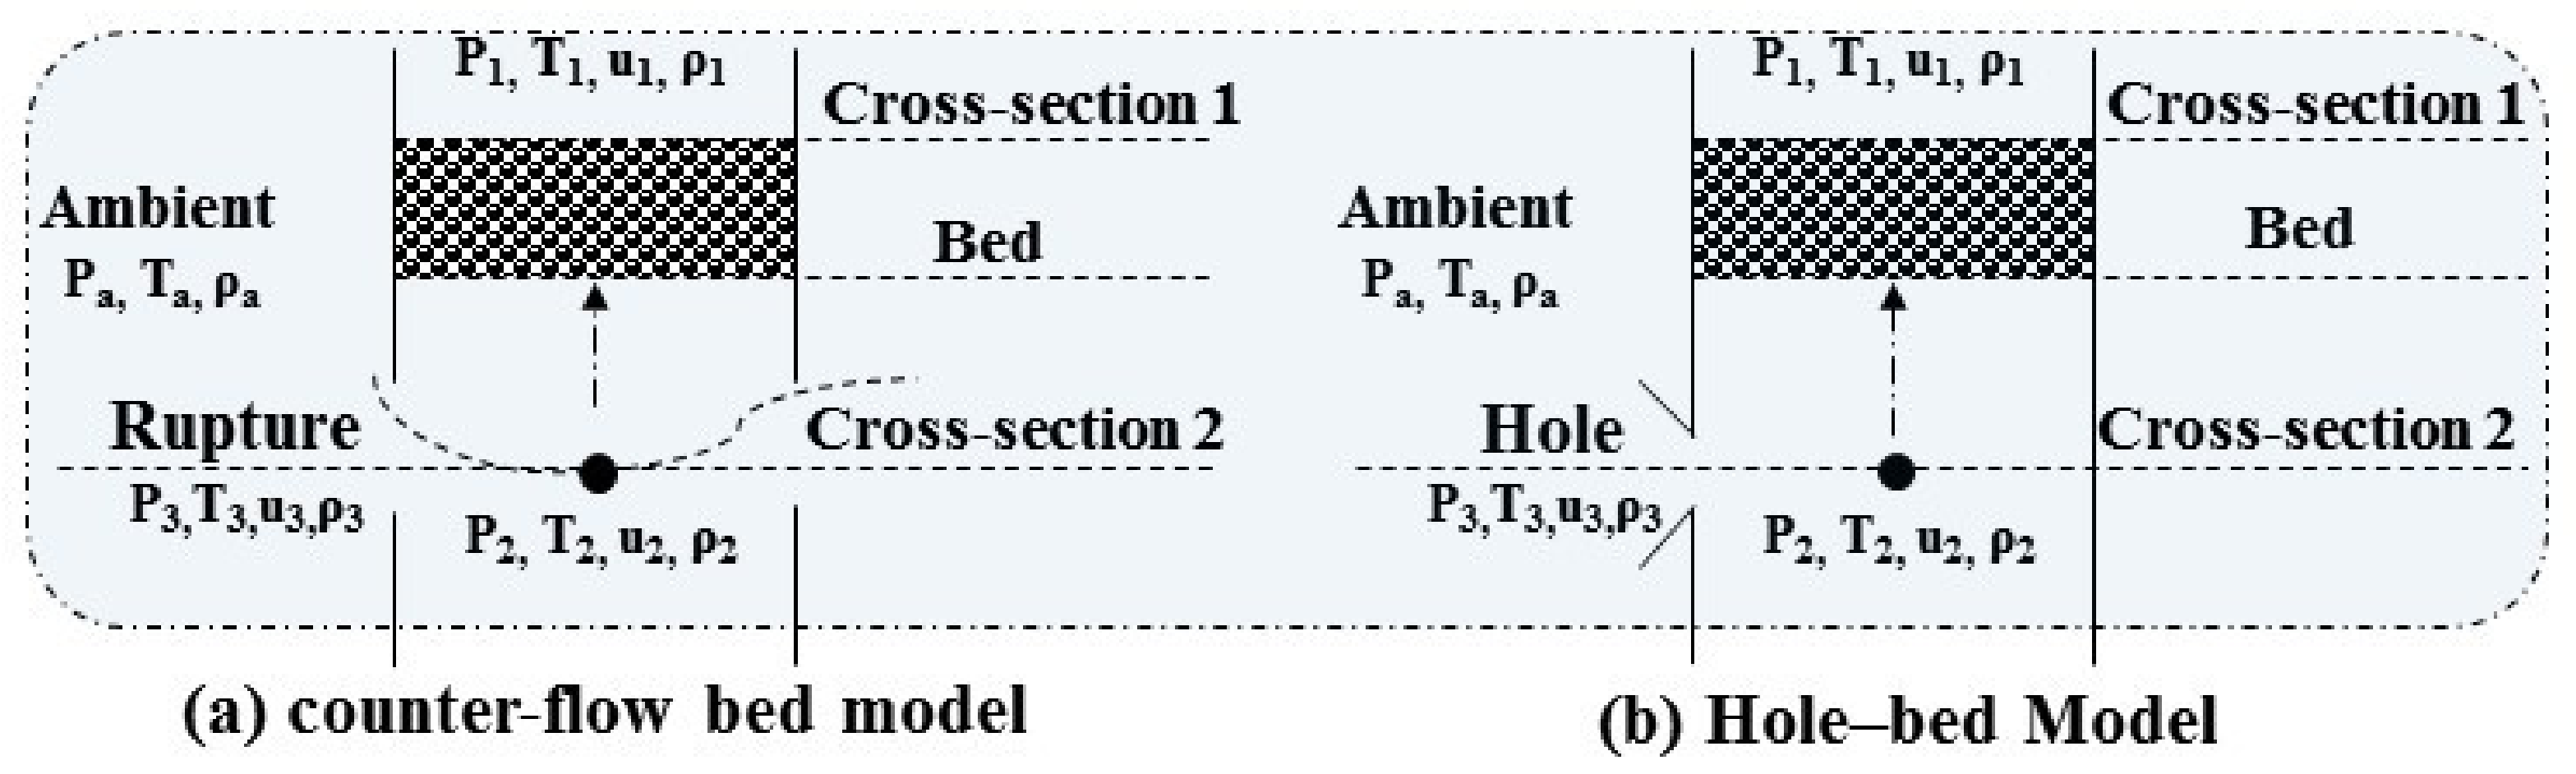
Accordingly, the sintering system (Region A) can be simplified as an isothermal bed in Figure 3b. Various cross-section positions are considered: cross-section 1 on the surface of the sintering bed; cross-section 2 inside wind boxes and on a level with the hole; cross-section 3 is the equivalent leakage hole; cross-section a is the ambient environment; cross-section bed is the sintering bed position.
2.2. Main Equations of the Simplified Model
By considering the flow system of Figure 3b, from cross-section 1 to cross-section 2, the mechanical energy balance equation with no chemicals, the state equation and the continuity equation give
Here, subscripts 1, 2, a and bed represent cross-section 1, cross-section 2, the ambient environment and the sintering bed. P is the absolute pressure, Pa; T is the temperature, K. ρ is the density, kg/m3; u is the velocity, m/s; Abed is the area of the sintering bed, m2; Qm is the flow rate of the sintering system (Region A), kg/s. M is the molecular weight of the air, 29 kg/kmol; R is the constant of gas, 8314 J/kmol·K; Pa = 101,325 Pa. Δ(u2/2) is the kinetic energy term, and this is generally negligible for gases because one rarely reaches very high velocities in packed beds. is the workflow term. When the fluid density does not vary much as it passes through the packed bed, one can use an average fluid density. Thus, based on the direction of the airflow in Figure 3b, . ΔPbed is the negative pressure of the sintering bed, Pa. Ftotal is the total friction. Ftotal = Fpacked, Fpacked, the frictional loss of packed beds. Additionally, because the system is interconnected, the pressure in wind boxes is equal everywhere. “known” represents known values in sintering plants.
The frictional loss for flow through packed beds can be expressed as
Here, H is the bed height, m; ε is the bed porosity. dp is the particle size, m; μ is the air viscosity, kg/m·s. When k1 = 150, k2 = 1.75, Equation (2) is an expression proposed by Ergun [41]. The particular research results by Hinkley [42,43], which are more suitable for the sintering bed are cited: k1 = 323 ± 15, k2 = 3.78 ± 0.15. This two-term expression of Equation (2) fits the frictional loss well; when the characteristic Reynolds number Rep < 20, the viscous loss term dominates and can be used alone with negligible error. On the other hand, when Rep > 1000, only the turbulent loss term needs to be used. According to the actual Rep in the sintering process, only the turbulent loss term of Equation (2) needs to be used.
The flow rate Qm is derived by Equations (1) and (2)
For Equation (3), there is still a variable Tbed unsolved.
Tbed is the mixed temperature of the whole sintering bed and can be obtained by the Equation (4) as follows:
Thus, the analytic formula of Tbed is shown by Equation (5)
i is the number of wind boxes (cf. Figure 1: 1, 2, …, n); qm,i is the flow rate through the sintering bed at each wind box location; Pbed,i, Tbed,i, ubed,i and ρbed,i are the absolute pressure, temperature, velocity and density of the sintering bed at each wind box location; P1,i, T1,i, u1,i and ρ1,i are the absolute pressure, temperature, velocity and density of cross-section 1 at each wind box location; P2,i, T2,i, u2,i and ρ2,i are the absolute pressure, temperature, velocity and density of cross-section 2 at each wind box location. n is the total amount of wind boxes.
Equations (1)–(5) are the simplified equations of sintering airflow through the bed under a steady-state state, among which Equation (3) is the flow rate of the sintering system. Based on the general simplified model of the sintering system, in what follows, three air leakage models are described. The leakage flow rate could be solved by Equation (6).
Here subscript 3 represents the hole, as shown in Figure 3b. d3 is the equivalent diameter of the hole. A3 is the leakage hole area; Q3 is the leakage flow rate of the hole, kg/s. De is the equivalent diameter of the sintering bed. Cd is the flow coefficient.
2.3. Hole Model
When the hole diameter is relatively small, air leakage would be calculated by the hole model. The assumptions are as follows: The ambient environment around Region A is regarded as an infinite tank with atmospheric pressure. Air leakage does not affect the pressure inside the sintering system. Therefore, the leakage can be considered a constant orifice outflow in fluid mechanics. As shown in Figure 3b, the Bernoulli equation and the state equation are used from the ambient environment tank (cross-section a) to the hole (cross-section 3).
In the infinite tank ua < < u3, thus,
Here, ζ3 is the local resistance coefficient of the hole. Cd is the flow coefficient. The necking phenomenon appears when the air flows from the area with higher pressure to lower pressure through the hole. There must be differences between the flow rate calculated by the hole model and the actual flow. Thus, Cd is the ratio of the real flow rate to the theoretical flow rate. This paper mainly focuses on the estimation models of sintering air leakage, so the value is set first to be 1.0 to study and discuss.
Therefore, Equation (8) is the analytic formula of the hole model for fast estimation of the air leakage. The hole model is the application of constant orifice outflow in the computation of sintering air leakage.
2.4. Counter-Flow Bed Model
A complete break usually does not exist for the sintering system, but the case analysis helps propose a further model. As shown in Figure 4a, when a complete break of the sintering system appears at the cross-section 2 location, no effective air passes through the sintering bed. The normal sintering process is completely interrupted. The state of point 2 is the same as that of point 3. Therefore, P2 = P3 = Pa, A3 = Abed.
In order to study the effect of leakage on the sintering bed, we can make the flow rate through the bed in regular operation be the maximum leakage flow limit, Q3 = Qm. Accordingly, that means the gas needs counter-flow through the sintering bed to unify the mathematical relationship of both flow and pressure in the complete break, as shown in Figure 4a.
It is the application of the general simplified model (cf. Section 2.2) according to the counter-flow direction actually. In particular, note that the direction of the pressure integral is from cross-section 2 to cross-section 1 in this model. The flow rate Qm is described by a mechanical energy balance equation, continuity equation, the state equation and the frictional loss equation.
Replace the pressure relationships of Equation (4) with Equation (9), and then Tbed is obtained by Equations (4) and (5),
The leakage flow rate Q3 is derived by Equation (3)
The final expression is precisely the same as Equation (3), but note that the pressure relationship at point 2 is the counter-flow system. This model is suitable for a complete break of the sintering system, which is the counter-flow application of the sintering permeability equation.
2.5. Hole–Bed Model
The “hole model” and “counter-flow bed model” actually reflect two extreme cases of sintering air leakage. The hole size in the hole model is small enough to keep the pressure of the sintering system constant and unaffected. In the counter-flow bed model, the area of the leakage hole is equal to the cross-sectional area of the sintering bed. This model considers the system pressure change caused by a complete break, but the influence of variation in leakage hole size on pressure is ignored. According to the high leakage rate characteristics in sintering, the equivalent hole is always a large one. Neither the hole model nor the counter-flow bed model would be suitable. Therefore, a new model bridging this gap would benefit sintering air leakage measurement. This section describes a model that considers all these aspects, thus covering all the possible hole diameters from small to complete break.
Figure 4b shows that the air leakage from the hole flows through the counter-flow bed system. The leakage flow rate Q3 from the hole is expressed by the hole model (Equation (8)), and the flow rate Qm in the counter-flow bed system is obtained by Equation (10). According to the continuity equation, the state equation, the hole model Equation (8) and the counter-flow bed model Equation (10):
There are three unknown variables: Qm, P2 and Tbed in Equation (11). Firstly, the analytical formula of P2 is derived by Equation (11).
Replace the pressure relationships of Equation (4) with Equation (13), and then Tbed is obtained by Equations (4) and (5),
Then, P2 can be calculated according to Equation (12), and the leakage flow rate of the hole Q3 can be obtained by Equation (14).
From Equation (12), the pressure state in the sintering system depends both on bed parameters (Tbed, dp, ε, H) and leakage hole parameters (A3, T3). Therefore, it can reflect the influence of the size of the leakage hole on the pressure drop of the sintering bed and the coupling relationship between leakage and process parameters.
Equation (14) is the hole–bed generalized model equation covering all the possible hole diameters. The model is preliminarily coupled with the parameters of the sintering granular bed, so it has obvious advantages in replacing manual repeated measurements.
3. Application Example of Models
Take a 360 m2 sintering machine as an example. The sintering machine is arranged on both sides. Each side is connected with the corresponding gas gathering pipeline and main exhaust fan, as shown in Figure 1. The state parameters of the sintering system can obtain easily in the HMI (Human–Machine Interface) system. The parameters of the sintering machine and wind boxes are given in Table 1 and Table 2. Therefore, fast estimation models can be applied to leakage holes found by any means (the image processing technology, manual inspection, statistics in capital repair, etc.) in region A. It dramatically benefits energy-saving and fine production to master the sintering machine’s real-time and accurate leakage state.
As shown in Table 1 and Table 2, the pressure of the gas-gathering pipeline is a constant negative pressure of 17,000 Pa. The negative pressure of each wind box is slightly different due to the non-uniform distribution of bed porosity and the local resistance of the gas pipeline. Pbed = Pbed,I = 84,325 Pa is fundamentally reasonable anywhere in the system. Table 2 also shows the temperature of each wind box Tbed,i = known. The ambient environment condition gives Ta = 300 K, Pa = 101,325 Pa.
According to the data source above, the leakage flow rate from holes with various diameters can be calculated using fast estimation models.
3.1. Hole Model Results
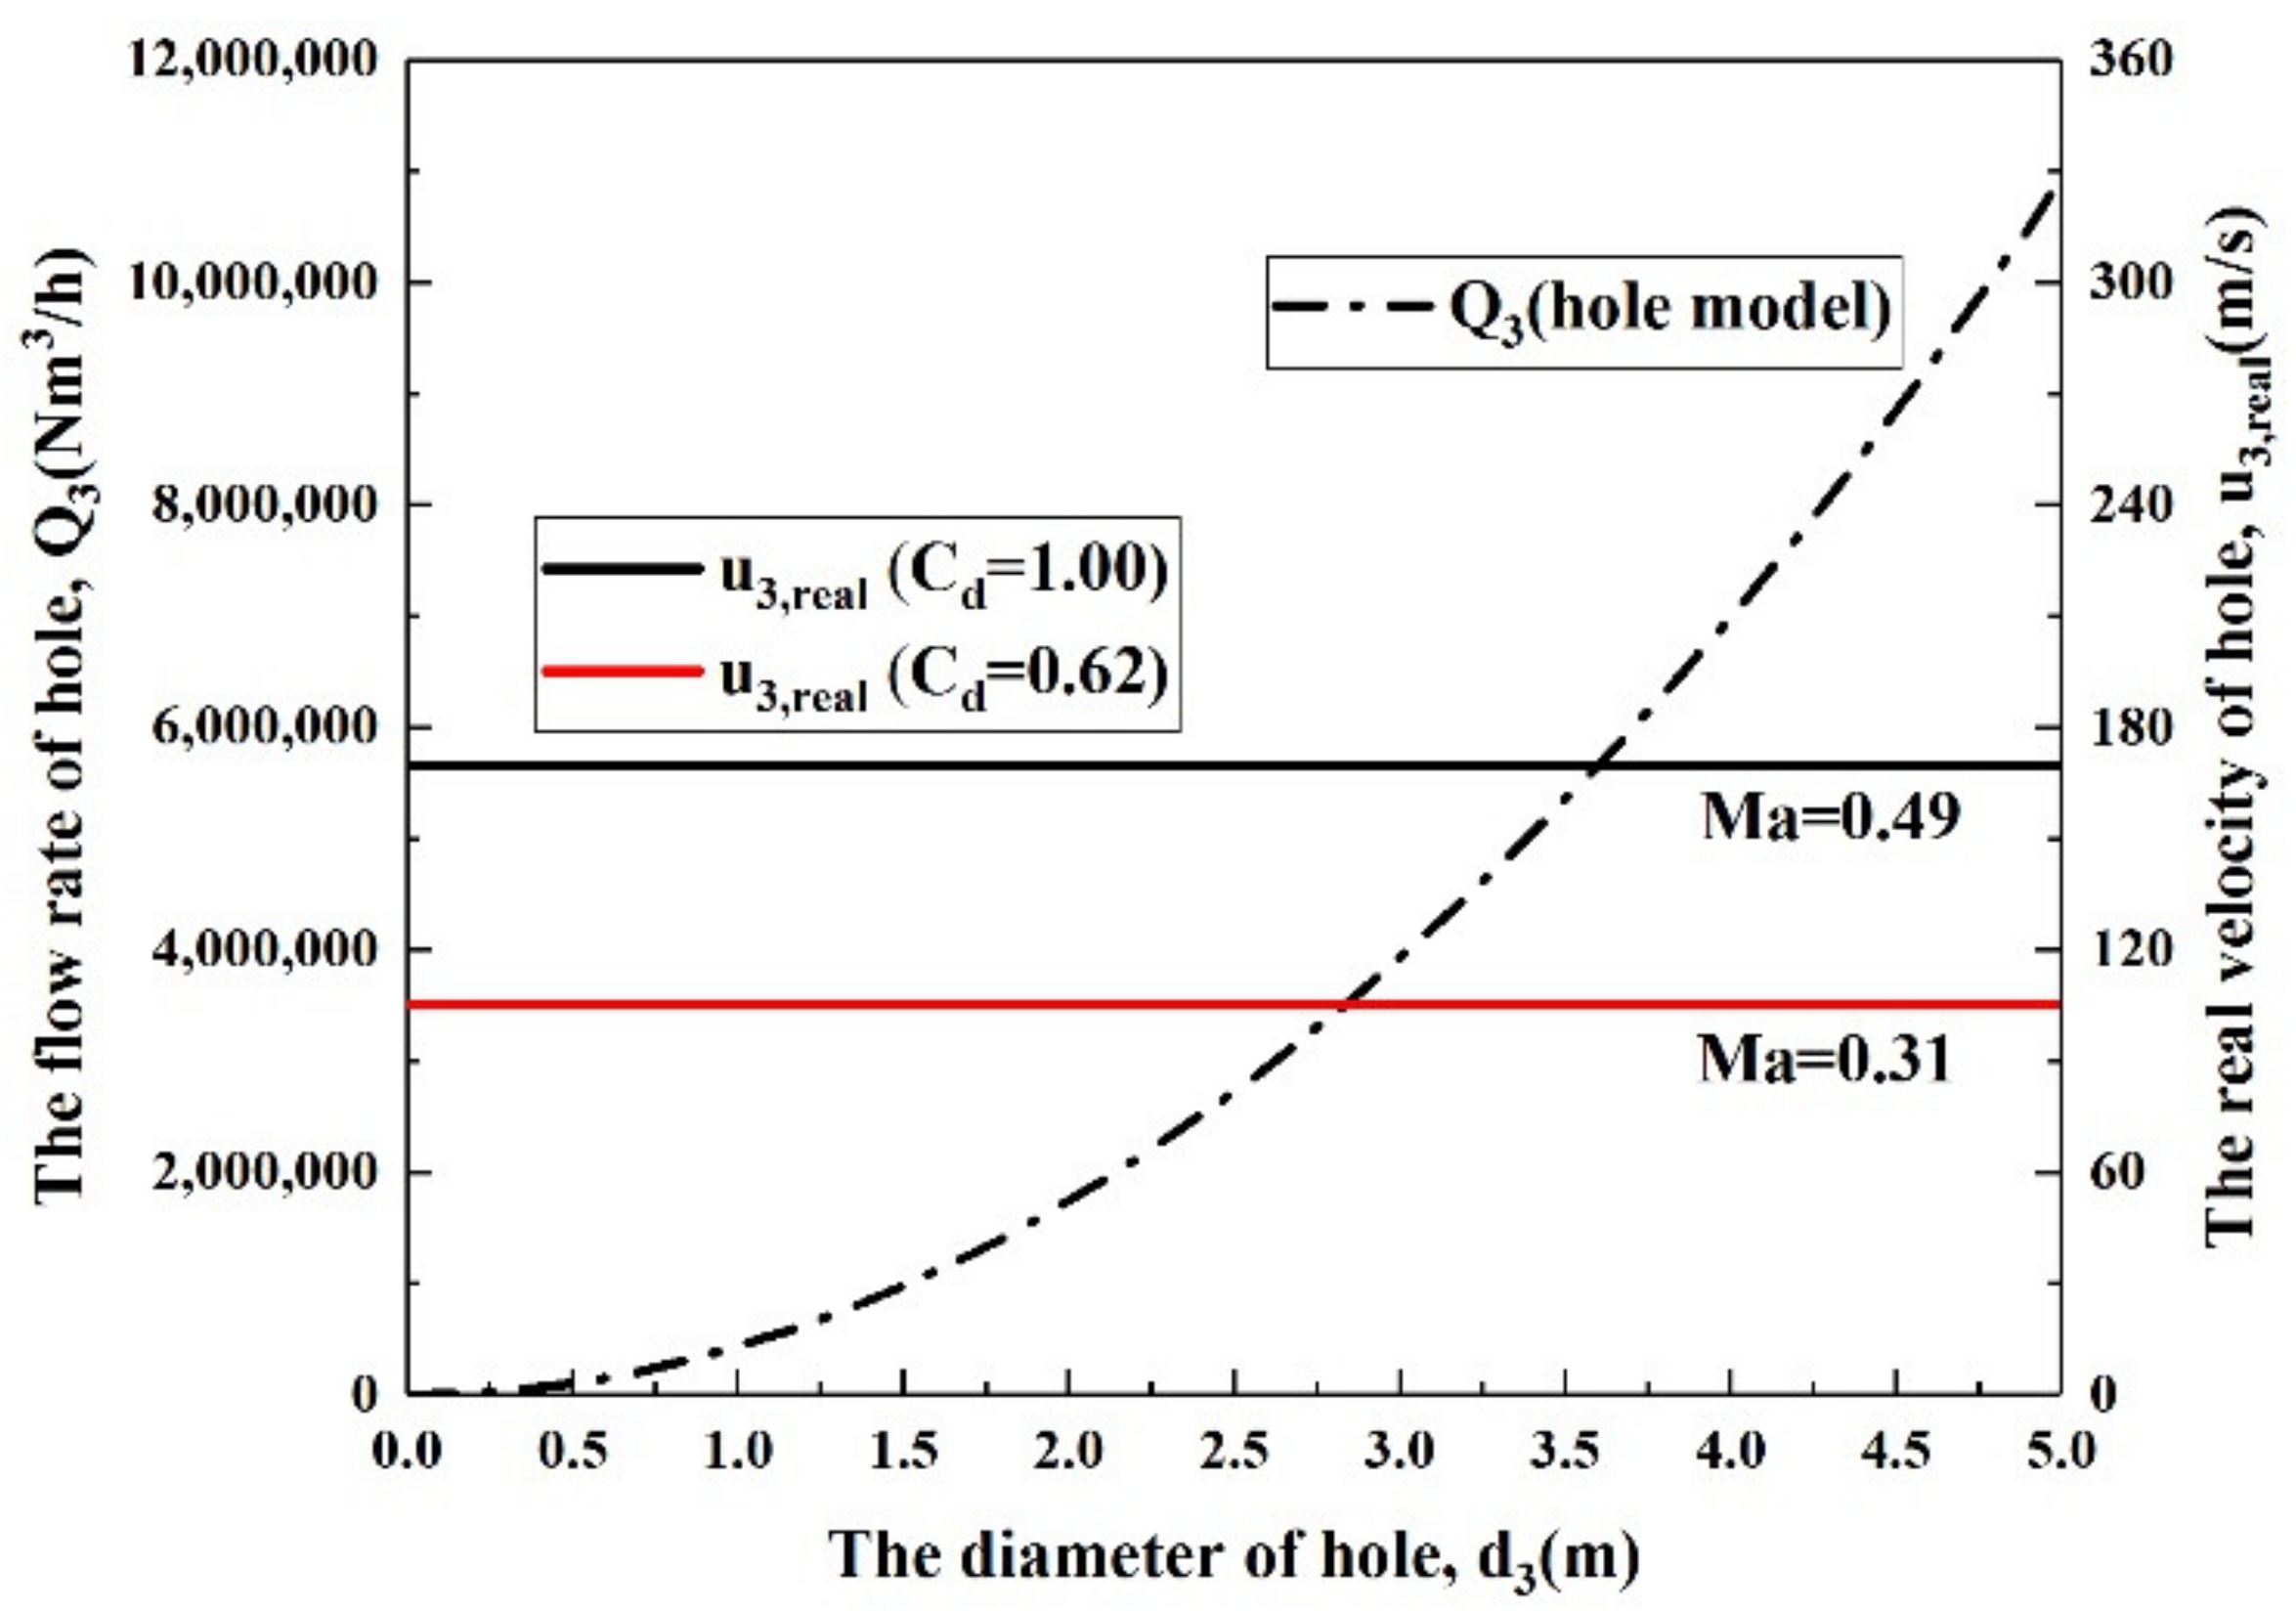
The results of the hole are shown in Figure 5. It can be seen that when the hole diameter increases, so do the flow rate of holes. The leakage flow rate exceeds the maximum limit Qm = 459,039 Nm3/h (cf. Figure 6a) when the hole diameter is about d3 > 1.0. It indicates that the hole model overestimates the leakage flow rate. However, the velocity of the hole is always constant. The phenomenon’s cause is that the hole model only considers variation in hole diameter but ignores the influence of leakage on bed pressure drop and temperature inside the wind boxes. Because the pressure difference between the ambient environment and inside the wind box keeps constant, the velocity keeps stable. The flow rate of the hole then rises with its diameter increasing.
Due to the necking phenomenon, the real average velocity of the hole can be defined as follows:
Ma stands for Mach number in Figure 5, Ma = u3,real/340. when Cd = 1.0, u3,real = 169 m/s, Ma = 0.49, the fluid belongs to the weakly compressible range. According to the following text, Cd = 0.62 is closer to reality than Cd = 1.0. At this time, u3,real = 105 m/s, Ma = 0.31, the fluid belongs to the incompressible range. Due to the normal working negative pressure limit (0–17,000 Pa), our assumption of incompressibility of gas is correct.
3.2. Counter-Flow Bed Model Results
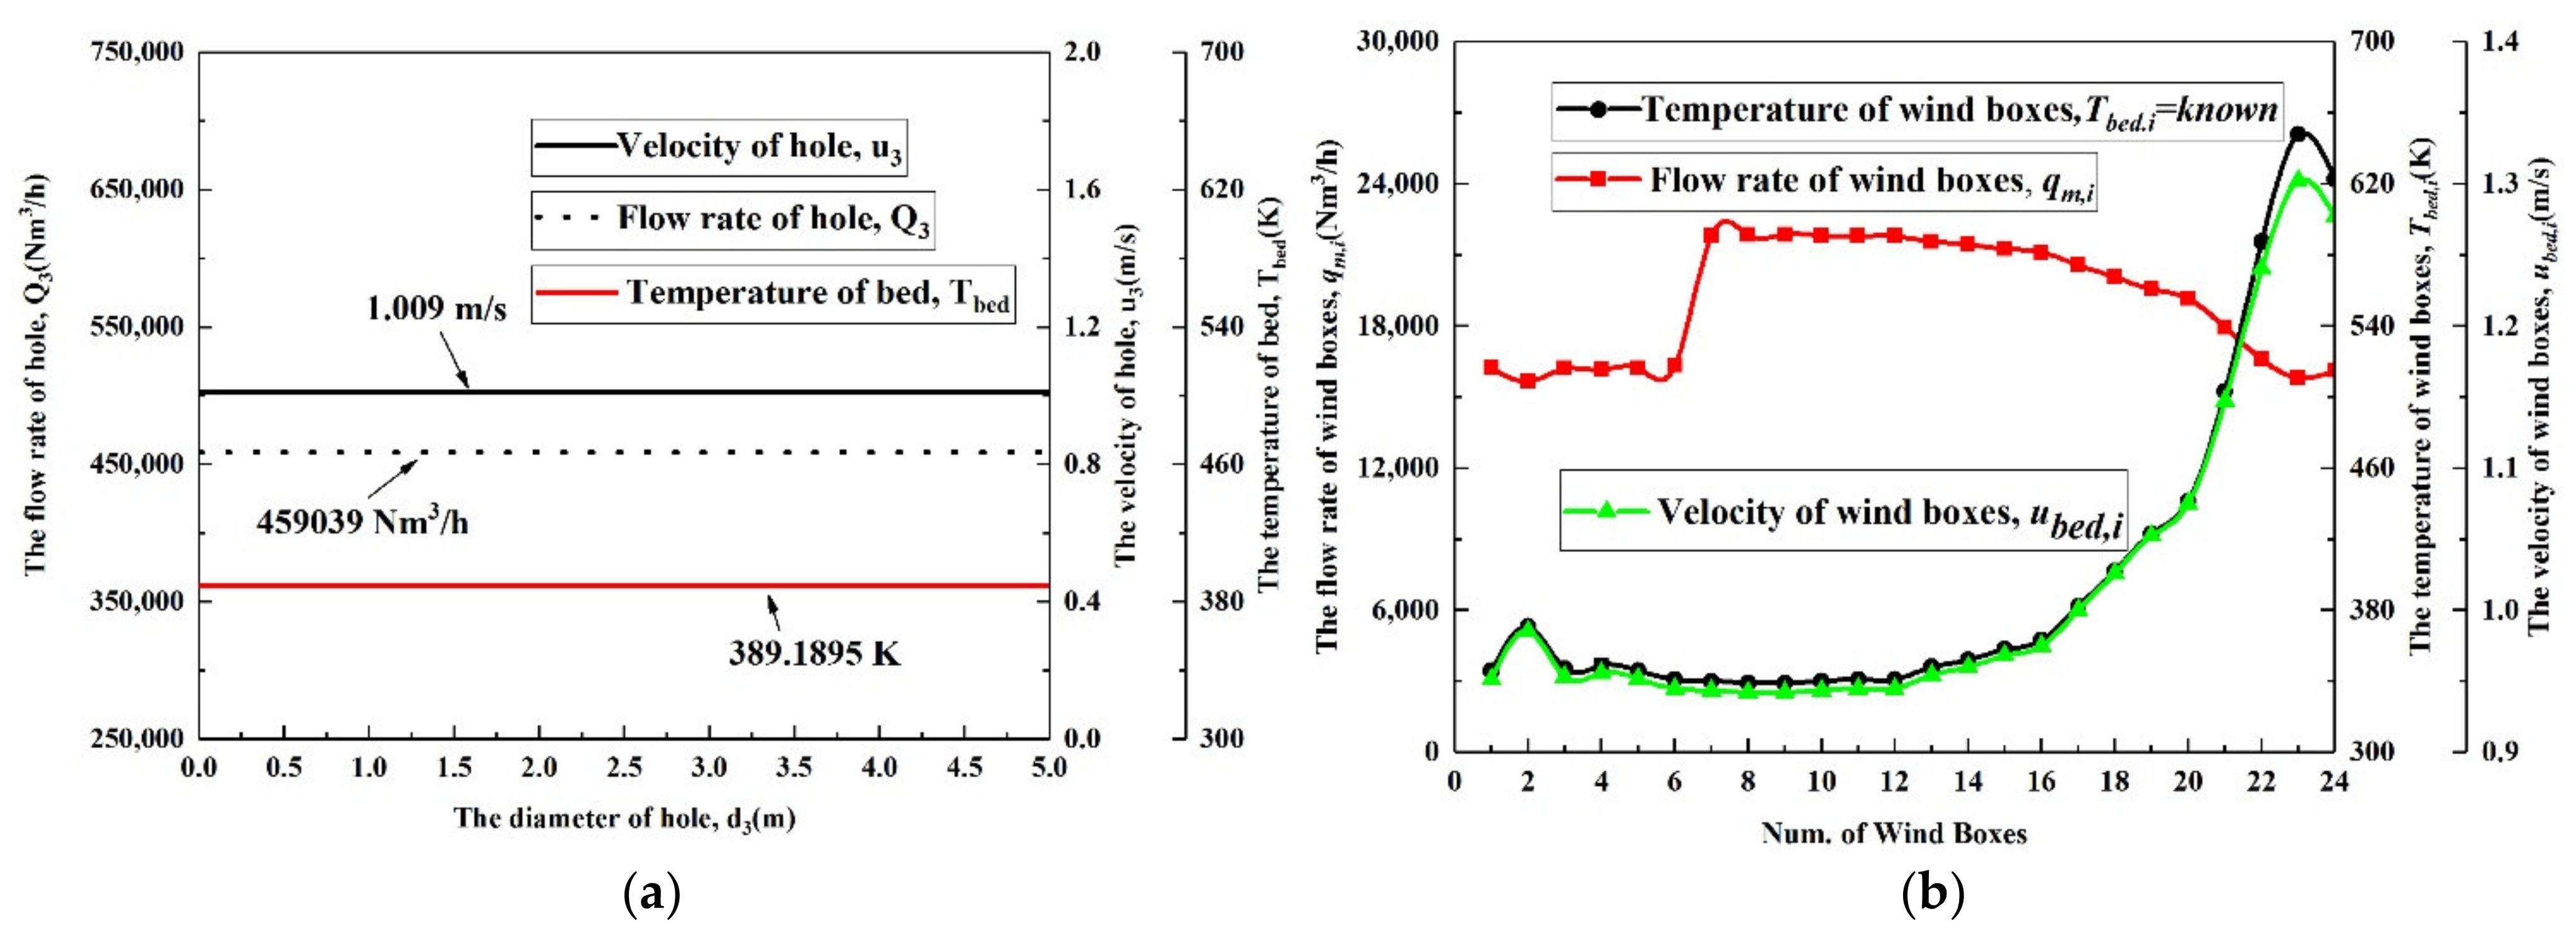
The counter-flow bed model was applied for the cases in the complete breaking. The leakage flow rate is always equal to the maximum limit of the system. As shown in Figure 6a, no matter how the hole diameter changes, the hole’s flow rate, velocity and temperature remain unchanged. The counter-flow model considers the pressure state in a complete break, but the diameter variation is not considered.
Because of a significant temperature difference among the wind boxes, the temperature represents the leak location (wind boxes). It can be seen from Figure 6b that in the case of complete breaking, the flow rate is not evenly distributed. The leakage flow rate and velocity are different with the different temperature locations. From Figure 6b and Equation (4), the variation tendency of the ubed,i is consistent with the Tbed,i. Due to the different sizes of wind box inlets (cf. Table 1: Abed,i), the flow rate of the first six (No. 1~6) wind boxes is lower than the others (No. 7–24) and rapidly increases between No. 6 and 7 wind boxes. The leakage flow rate has a slow downward trend from No. 7 to 24 wind boxes. It is mainly related to the temperature trend. Thus, Tbed,i = known must offer accurate and timely feedback. Any changes in Tbed,i lead to the changes in qm,i, Tbed and Qm, especially at high-temperature locations. It indicates that the counter-flow bed model allows the existence of the unsteady state, and timely feedback of process temperature changes can improve the accuracy of the bed model.
Since the sizes of wind box inlets (No. 7–24) are the same, the effect of temperature difference on the estimation accuracy can be evaluated in the counter-flow model. The estimation deviation ET between different temperature locations can be defined:
Thus, from qm,i in Table 2, the maximum estimated deviation at different temperature locations is −17.32% under the same breaking size. It is regarded as a non-existent limit deviation in practice.
3.3. Hole–Bed Model Results
3.3.1. Discussion of Flow and Pressure Results
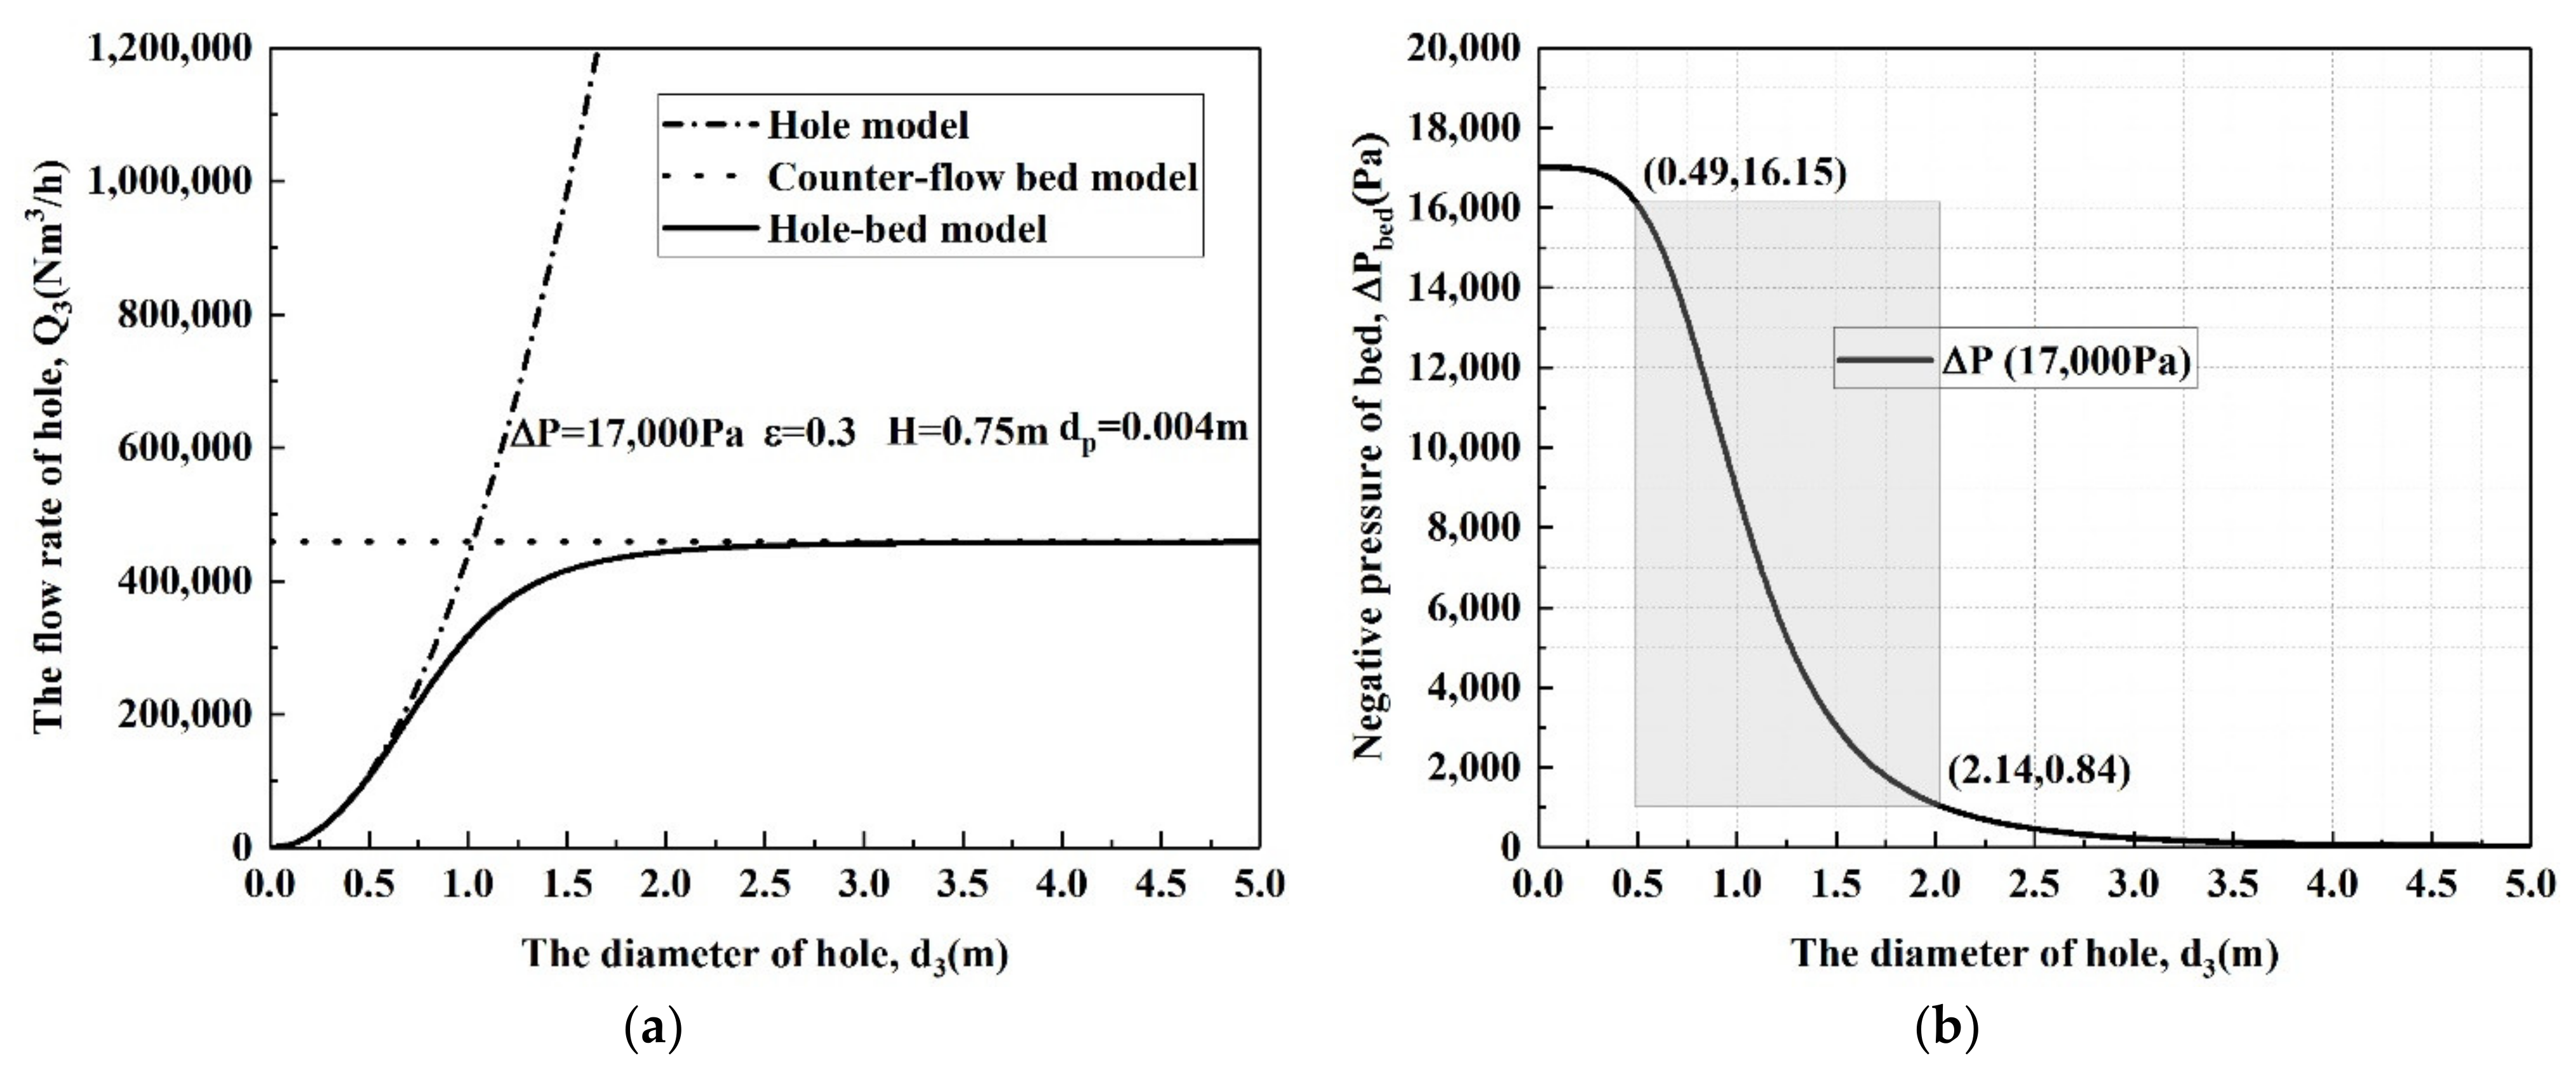
The hole–bed results are shown in Figure 7. As shown in Figure 7a, when the hole is relatively small, air leakage calculated by the hole–bed model is similar to that by the hole model. While the hole diameter approximates the bed equivalent diameter, here, it gives the same result as the bed model. It is closer to the facts. The hole–bed model, which combines the other two models mentioned above, considers their advantages, thus covering all the possible hole diameters and quantifying the effect on the pressure of the sintering bed. The calculation results show that the local leakage flow rate with various diameters is entirely mastered at one time based on the steady process.
There is a clear boundary between small and large holes in the gas transmission pipeline. The diameter scope recommended by EGIG (European Gas Pipeline Incident Data Group) is mainly adopted: small hole d ≤ 0.02 m, which is a form of long-term experience. However, it does not exist in sintering machines. Unlike gas pipelines, the small hole boundary of the sintering must change with the sintering process and machine parameters, which is beyond the scope of this article.
The estimation deviation Em between the two models can be defined:
Q3,hole and Q3,hole-bed are the leakage flow rate calculated by the hole and hole–bed models. According to the results of fast estimation models, when the hole diameter is 0.58 m, the estimation deviation between the hole model and the hole–bed model reaches 5.00%.
It can be seen from Figure 7b that with the increase in the hole diameter, the negative pressure of the sintering bed decreases. Therefore, air leakage is highly unfavorable to normal sintering production.
The change rate of negative pressure can be defined in the hole–bed model:
When the hole diameter reaches 0.49 m, the change rate of negative pressure comes to 5%. There is a rapid decreasing stage between about d3 = 0.49 and d3 = 2.14. When the d3 = 2.14, the change rate reaches 95%, and then the negative pressure decreases very slowly. In this case, normal sintering is almost completely interrupted, and only a small amount of effective air flows through the sintering bed. Therefore, leakage must be strictly controlled to ensure normal production.
Thus, comprehensively considering the calculation results of flow rate and pressure drop, 0.49~0.58 m can be preliminarily regarded as a noteworthy diameter area in this machine and sintering process.
3.3.2. Discussion of Different Process Parameters
The leakage is preliminarily combined with the sintering process through the bed equation representing the sintering process’s permeability in the hole–bed model. Figure 8 shows the variation in the leakage flow rate as a function of hole diameter under different process conditions. It found that even if the hole diameter is the same, the leakage rate is different under different process conditions.
There is little difference among processes for small holes (cf. Figure 7: d3 = 0.5 m), but the difference is apparent when the hole is large (about d3 = 0.5~2.14 m). The difference gradually and completely stabilized near the fixed values (about d3 > 2.14 m). That is because the variations in process parameters mean the change in bed permeability. The maximum flow rate in the hole–bed model change according to the permeability equation. The results of the large hole are closer to the leakage trend calculated by the bed model. The flow rate of each small hole also changes a little along with the maximum distribution. Thus, the process parameters affected the measurement repeatability. Air leakage measurement needs to be compared under the same process. It is also an important cause for the long-time test but poor repeatability in air leakage measurement.
More specifically, the estimation deviation EQ under different processes can be defined:
Q3,based are the based flow rate in the hole–bed model in Figure 7. When d3 = 0.5, Q3,based = 106,360.
Q3,other are the flow rate under other processes in Figure 8. When d3 = 0.5, each Q3,other are given in the figures.
When d3 = 0.5 m, the estimation deviation EQ under different processes is offered as follows:
According to the EQ above, among the four factors, negative pressure and bed porosity have the greater relative impact on the leakage flow rate apparently. Bed height has the least impact on the prediction of the small hole.
When d3 = 2.14 m and Q3,based = 447,442 Nm3/h, the estimation deviation EQ under different bed heights is offered as follows:
Figure 8d: H = (0.45, 0.60, 0.75, 0.90), EQ = (27.12%, 11.11%, 0%, −8.33%).
Obviously, for large holes, the influence of bed height on leakage flow rate is vast. Therefore, any change in process parameters can not be ignored for large holes.
The hole–bed model, coupled with the permeability equation, can avoid some repeated measurements at the same location. Its prediction accuracy partly depends on the related expression of sintering permeability in the hole–bed model. We did not elaborate on the effect of each parameter on permeability, as they are in line with the general studies of the sintering permeability.
4. Model Validations and Flow Coefficient
4.1. Bed Model Validation
According to the result of the bed model, Qm = 459,043 Nm3/h and Tbed = 390 K, which are almost the same as the measured average values (463,060 Nm3/h, 390~450 K) of the gas gathering pipeline on one side and belong to the parameter in the reasonable range. This indicates that the estimation effect of the bed model is reliable.
4.2. Hole Model Validation
According to the results of the hole model, the air velocity of the hole is relatively high. We tried to use the thermal anemometer and pitot tube to measure the flow of local air leakage points at the site. All the results exceed the range of the instrument (45 m/s) at the center of the leakage point. Therefore, the field flow test did not complete the evaluation of the prediction effect of the hole and hole–bed models, and the accurate flow rate could not be determined.
A test device for sintering air leakage is established based on the principle of similarity in the laboratory. The modular design was used for easily realizing different test functions. Figure 9 shows the composition of the test device and its instruments. In the relatively low negative pressure range (0–2 kPa), the effect of the hole and hole–bed models was evaluated.
Because there is no clear boundary between the small and large holes, it is difficult to measure the flow with a too-small hole. Therefore, the hole model can be verified: all processed holes are regarded as small, and the negative pressure and flow rate under each case are measured. Accordingly, the flow rate results of the hole model are given for comparison. The calculation of the hole–bed model should be based on the initial negative pressure without leakage. The experiment was carried out at room temperature and pressure.
The main experimental steps include the following: Keep the test device sealed without leakage holes. The entrance is plugged with a sinter module (H = 0.01 m, ε = 0.3). Start the frequency converter and fan to form steady-state initial negative pressures (ΔPbed = 1290 Pa, 870 Pa, 720 Pa). Simulate the leakage from small to large with different circular leakage hole modules (d3 = 0.02, 0.04, 0.06, 0.08 and 0.10 m). Hold the flow of the induced fan constant, and measure the wind velocity at the leakage point with a thermal anemometer. At the same time, the pitot tube is used to record the static pressure, dynamic pressure and flow rate before and after the leakage hole to ensure the reliability of the measured parameters.
The results of the experiment are shown in Table 3.
According to Table 3, the hole model cannot ignore the flow coefficient. The flow coefficient Cd is the ratio of the measured flow rate Q3,mea to the theoretical one Q3,hole, which is relatively stable (0.58~0.66) in laboratory research and entirely consistent with the general results of constant orifice outflow in fluid mechanics [44]. Therefore, we can consider that it is reasonable to use the average Cd = 0.62 in the hole model.
4.3. Hole–Bed Model Validation
It can be seen from Table 3 that the negative pressure of the system decreases gradually as the diameter of leakage holes increases. This trend is similar to that predicted by the hole–bed model. Based on the different initial negative pressure (720 Pa, 1290 Pa), Figure 10 shows the model validations of the hole–bed model in the laboratory (Cd = 1 and Cd = 0.62). Taking ±10% of the experimental test values as the reasonable prediction range, the flow rate (Cd = 1) calculated by the two models does not fall in this effective test region, which indicates that the factor of flow coefficient cannot be ignored in practical application. The overestimation error of the hole model is larger than the hole–bed model. When the hole diameter is 0.035 m, the estimation deviation Em between the hole model and the hole–bed model reaches 5.00% (720 Pa and 1290 Pa). It indicates that the boundary between the small and large holes may be certain.
Based on the coupling relationship between the hole and hole–bed models, Figure 10b shows the effect of Cd = 0.62 is used in the hole–bed model. The application Cd = 0.62 enhances the prediction accuracy of the hole–bed model. The applicable diameter range for the flow coefficient is (0~0.06 m) and accounts for about 20% of the test device’s whole diameter range (0~0.296 m). The diameter range of the hole model is much smaller than the hole–bed model. However, the flow coefficient is not applicable for all sizes of leakage holes. With the increase in hole diameter, the prediction deviation of the hole–bed model increases gradually. It indicates that the flow coefficient is affected by system pressure. Some research [24,45] also proves it.
According to the fluid mechanics, the recommended value of Cd is between 0.6 and 1.0. It is related to various factors such as the system’s pressure, the shape and location of the hole, the forms of damage and corrosion, the material and roughness of the tubes, etc. Therefore, further systematic research is essential for a more accurate prediction but is not involved in this article. The reasonable diameter range on the sintering machine can be achieved at about (0~3 m) with similarity theory (1:9), which fully meets the precision requirement.
Within a specific diameter range of the hole, the fast estimation models with the flow coefficient are proved effective. It is suggested to use the generalized hole–bed model for programming calculation mainly. In contrast, the hole model can be used for mastering the flow rate by engineers directly because of its simple expression.
5. Conclusions
According to the fluid mechanics, three mathematical models of sintering air leakage are proposed in this paper. They are the hole model, counter-flow bed model and hole–bed model.
- (1)
- The hole model conforms to the basic principle of constant orifice outflow. The hole model can predict the leakage flow rate when the hole is small. The counter-flow bed model can be used in a complete breaking. Although this case does not exist, it can estimate the flow rate of the total airflow; while the hole lies between the above two situations, the hole–bed model can be used;
- (2)
- The hole bed model combines the characteristics of the other two models. The leakage is preliminarily combined with the sintering process through the bed equation. In this case, the model also allows the calculation of the decrease in pressure over the sintering bed. The pressure of the sintering bed is affected by leakage parameters;
- (3)
- The calculation results show that the leakage flow rate of any hole is calculated and mastered at one time entirely in a steady process. It effectively reduces testing time, energy consumption and air leakage detection costs. With the model, real-time local leakage detection and a fast estimation system could be possible in the future and improve the detection means in the key area;
- (4)
- Experiment results prove the validation of the models and give the flow coefficient for preliminary application. The flow coefficient can reduce the uncertainty of the estimation of air leakage.
However, there are still some limitations to these models in this paper. For example, it does not apply to other areas, the small hole’s boundary is not clear, and the flow coefficient is fixed. Moreover, these models are still a step forward in the effort to develop more precise and powerful calculation tools to foresee the effects and consequences of sintering air leakage anyway. It has a good prospect for reducing and replacing complex manual measurement and bringing a deeper thinking direction to other research.
Author Contributions
J.C.: Conceptualization, validation, formal analysis, investigation, resources, data curation, writing—original draft preparation. X.K.: supervision, methodology. M.Y.: validation. All authors have read and agreed to the published version of the manuscript.
Funding
This research received no external funding.
Institutional Review Board Statement
Not applicable.
Informed Consent Statement
Not applicable.
Data Availability Statement
Not applicable.
Conflicts of Interest
The authors declare no conflict of interest.
Abbreviations
| Abed | The area of the sintering bed, (m2) |
| Abed,i | The area of the sintering bed at each wind box location, (m2) |
| A1 | The area of cross-section 1, (m2) |
| A2 | The area of cross-section 2, (m2) |
| A3 | The leakage hole area, (m2) |
| Cd | The flow coefficient |
| De | The equivalent diameter of the sintering bed, (m) |
| dp | The particle size, (m) |
| d3 | The equivalent diameter of the hole, (m) |
| ET | The estimation deviation between different temperature locations |
| Em | The estimation deviation between the hole and hole–bed models |
| EQ | The estimation deviation under different processes |
| Ftotal | The total friction. |
| Fpacked | The frictional loss of packed beds. |
| H | The bed height, (m) |
| i | The number of wind boxes |
| M | The molecular weight of the air, (kg/kmol) |
| Ma | Mach number |
| n | The total amount of wind boxes. |
| Pa | The ambient environment pressure, (Pa) |
| P1 | The absolute pressure of cross-section 1, (Pa) |
| P2 | The absolute pressure of cross-section 2, (Pa) |
| P3 | The absolute pressure of the hole, (Pa) |
| P1,i | The absolute pressure of cross-section 1 at each wind box location, (Pa) |
| P2,i | The absolute pressure of cross-section 2 at each wind box location, (Pa) |
| Pbed,i | The absolute pressure at each wind box location, (Pa) |
| ΔPbed | The negative pressure of the sintering bed, (Pa) |
| ΔPbed,i | The negative pressure of each wind box location, (Pa) |
| qm,i | The flow rate through the sintering bed at each wind box location, (kg/s) |
| Q3 | The leakage flow rate of the hole, (kg/s) |
| Qm | The flow rate of the sintering system(Region A), (kg/s) |
| Q3,hole | The leakage flow rate calculated by the hole model in Figure 7, (Nm3/h) |
| Q3,hole-bed | The leakage flow rate calculated by the hole–bed model in Figure 7, (Nm3/h) |
| Q3,based | The based flow rate in the hole–bed model in Figure 7, (Nm3/h) |
| Q3,other | The flow rate under other processes in Figure 8, (Nm3/h) |
| Q3,mea | The measured value of the leakage flow rate, (Nm3/h) |
| R | The constant of gas, (J/kmol·K) |
| Ta | The ambient environment temperature, (K) |
| T1 | The temperature of cross-section 1, (K) |
| T2 | The temperature of cross-section 2, (K) |
| T1,i | The temperature of cross-section 1 at each wind box location, (K) |
| T2,i | The temperature of cross-section 2 at each wind box location, (K) |
| Tbed | The mixed temperature of the whole sintering bed, (K) |
| Tbed,i | The temperature at each wind box location, (K) |
| u | The velocity, (m/s) |
| ρ | The density, (kg/m3) |
| ρbed,i | The density of the sintering bed at each wind box location, (kg/m3) |
| ρ1,i | The density of cross-section 1 at each wind box location, (kg/m3) |
| ρ2,i | The density of cross-section 2 at each wind box location, (kg/m3) |
| u1,i | The velocity of cross-section 1 at each wind box location, m/s |
| u2,i | The velocity of cross-section 2 at each wind box location, m/s |
| ubed,i | The velocity of the sintering bed at each wind box location, m/s |
| μ | The air viscosity, (kg/m/s) |
| ε | The bed porosity. |
| ζ3 | The local resistance coefficient of the hole. |
| HMI | Human Machine Interface |
| Known | The known values in sintering plants. |
| EGIG | European Gas Pipeline Incident Data Group |
References
- Wang, Y.Z.; Zhang, J.L.; Liu, Z.J.; Du, C.B. Recent Advances and Research Status in Energy Conservation of Iron Ore Sintering in China. JOM 2017, 69, 2404–2411. [Google Scholar] [CrossRef]
- Fan, X.H.; Jiang, L.J.; Chen, X.L. Air Leakage Online Monitoring and Diagnosis Model for Sintering. In Proceedings of the 3rd International Symposium on High-Temperature Metallurgical Processing, TMS (The Minerals, Metals & Materials Society), Orlando, FL, USA, 11–15 March 2012; pp. 323–329. [Google Scholar]
- Song, X.Y.; Li, W.H. On the Air Leakage Rate Measurement Technology of Sintering Machine System. Energy Energy Conserv. 2013, 95, 51–53. (In Chinese) [Google Scholar]
- Jin, Y.L.; Xu, N.P.; Wu, S.Y.; Cheng, Z.F. Study and Application of a New Technology for Measuringthe Leakage Ratio of Sintering Machine. J. Iron Steel Res. 1999, 11, 67–70. (In Chinese) [Google Scholar]
- Sakaue, H. Improvement of Production by Decreasing Air Leak at Nagoya No. 3 Sintering Plant. Tetsu-to-Hagane-J. Iron Steel Inst. Jpn. 2009, 95, 582–585. (In Japanese) [Google Scholar] [CrossRef]
- Shiau, J.S.; Huang, T.Y.; Liu, S.H.; Hsieh, C.M.; Yeh, P.Y. Energy Saving Technology for Lowering Air Leakage of Sintering Pallets and Dust Collectors in Sinter Plant. J. Mech. Eng. Autom. 2018, 8, 233–249. [Google Scholar]
- Woodard, J.L.; Mudan, K.S. Liquid and gas discharge rates through holes in process vessels. J. Loss Prev. Process Ind. 1991, 4, 161–165. [Google Scholar] [CrossRef]
- Crowl, D.A.; Louvar, J.F. Chemical Process Safety: Fundamentals with Application, 3rd ed.; Pearson: Upper Saddle River, NJ, USA, 2012; pp. 122–146. [Google Scholar]
- Turton, R. A new approach to non-choking adiabatic compressible flow of an ideal gas m pipes with friction. Chem. Eng. J. 1985, 30, 159–160. [Google Scholar] [CrossRef]
- Levinspiel, O. Engineering Flow and Heat Exchange, 3rd ed.; Springer: New York, NY, USA, 2014; pp. 20–51. [Google Scholar]
- Montiel, H.; Vilchez, J.A.; CasaL, J.; Arnaldos, J. Mathematical modelling of accidental gas releases. J. Hazard. Mater. 1998, 59, 211–233. [Google Scholar] [CrossRef]
- Arnaldos, J.; Casal, J.; Montiel, H.; Sánchez-Carricondo, M.; Vílchez, J.A. Design of a computer tool for the evaluation of the consequences of accidental natural gas releases in distribution pipes. J. Loss Prev. Process Ind. 1998, 11, 135–148. [Google Scholar] [CrossRef]
- Hankinson, G.; Lowesmith, B.J.; Genillon, P.; Hamaide, G. Experimental Studies of Releases of High Pressure Natural Gas from Punctures and Rips in Above-Ground Pipework. In Proceedings of the 3rd International Pipeline Conference (IPC2000), Calgary, AB, Canada, 1–5 October 2000. [Google Scholar]
- Picard, D.J.; Bishnoi, P.R. The importance of real-fluid behavior in predicting release rates resulting from high-pressure sour-gas pipeline ruptures. Can. J. Chem. Eng. 1989, 67, 3–9. [Google Scholar] [CrossRef]
- Dong, Y.H.; Gao, H.L.; Zhou, J.E.; Feng, Y.R. Evaluation of gas release rate through holes in pipelines. J. Loss Prev. Process Ind. 2002, 15, 423–428. [Google Scholar]
- Dong, Y.H.; Gao, H.L.; Zhou, J.E.; Feng, Y.R. Mathematical modeling of gas release through holes in pipelines. Chem. Eng. J. 2003, 92, 237–241. [Google Scholar]
- Mahgertfteh, H.; Saha, P.; Economou, I.G. A Study of the Dynamic Response of Emergency Shutdown Valves Following Full Bore Rupture of Gas Pipelines. Process Saf. Environ. Protect. 1997, 75, 201–209. [Google Scholar] [CrossRef] [Green Version]
- Mahgertfteh, H.; Saha, P.; Economou, I.G. Fast numerical simulation for full bore rupture of pressurized pipelines. AICHE J. 1999, 45, 1191–1201. [Google Scholar] [CrossRef]
- Mahgertfteh, H.; Oke, A.; Atti, O. Modelling outflow following rupture in pipeline networks. Chem. Eng. Sci. 2006, 16, 1811–1818. [Google Scholar] [CrossRef]
- Jo, Y.D.; Ahn, B.J. A simple model for the release rate of hazardous gas from a hole on high-pressure pipelines. J. Hazard. Mater. 2003, 97, 31–46. [Google Scholar] [CrossRef]
- Jo, Y.D.; Ahn, B.J. Analysis of hazard area associated with hydrogen gas transmission pipelines. Int. J. Hydrog. Energy 2006, 31, 2122–2130. [Google Scholar] [CrossRef]
- Jo, Y.D.; Crowl, D.A. Individual risk analysis of high-pressure natural gas pipelines. J. Loss Prev. Process Ind. 2008, 21, 589–595. [Google Scholar] [CrossRef]
- Kostowski, W.J.; Skorek, J. Application of experimental flow characteristics of pipeline ruptures in gas network simulation. Inz. Chem. Proces 2006, 27, 579–596. [Google Scholar]
- Kostowski, W.J.; Skorek, J. Real gas flow simulation in damaged distribution pipelines. Energy 2012, 45, 481–488. [Google Scholar] [CrossRef]
- He, G.X.; Lyu, X.D.; Liao, K.X.; Li, Y.S.; Sun, L.Y. A method for fast simulating the liquid seepage-diffusion process coupled with internal flow after leaking from buried pipelines. J. Clean. Prod. 2019, 240, 118167. [Google Scholar] [CrossRef]
- Ebrahimi-Moghadam, A.; Farzaneh-Gord, M.; Deymi-Dashtebayaz, M. Correlations for estimating natural gas leakage from above-ground and buried urban distribution pipelines. J. Nat. Gas Sci. Eng. 2016, 34, 185–196. [Google Scholar] [CrossRef]
- Ebrahimi-Moghadam, A.; Farzaneh-Gord, M.; Arabkoohsar, A.; Jabari-Moghadam, A. CFD analysis of natural gas emission from damaged pipelines: Correlation development for leakage estimation. J. Clean. Prod. 2018, 199, 257–271. [Google Scholar] [CrossRef]
- Farzaneh-Gord, M.; Pahlevan-Zadeh, M.S.; Ebrahimi-Moghadam, A.; Rastgar, S. Measurement of methane emission into environment during natural gas purging process. J. Environ. Pollut. 2018, 242, 2014–2026. [Google Scholar] [CrossRef] [PubMed]
- Li, X.H.; Chen, G.M.; Zhang, R.R.; Zhu, H.W.; Fu, J.M. Simulation and assessment of underwater gas release and dispersion from subsea gas pipelines leak. Process Saf. Environ. Protect. 2018, 119, 46–57. [Google Scholar]
- Fiates, J.; Santos, R.R.C.; Neto, F.F.; Francesconi, A.Z.; Simoes, V.; Vianna, S.S.V. An alternative CFD tool for gas dispersion modelling of heavy gas. J. Loss Prev. Process Ind. 2016, 44, 583–593. [Google Scholar] [CrossRef]
- Huseynov, J.; Baliga, S.; Dillencourt, M.; Bic, L.; Bagherzadeh, N. Gas-leak localization using distributed ultrasonic sensors. In Proceedings of the SPIE 7293, San Diego, CA, USA, 8–12 March 2009; Volume 7293. [Google Scholar]
- Dudić, S.; Ignjatović, I.; Šešlija, D.; Blagojevićand, V.; Stojiljković, M. Leakage quantification of compressed air using ultrasound and infrared thermography. Measurement 2012, 45, 1689–1694. [Google Scholar] [CrossRef]
- Liu, C.W.; Li, Y.X.; Fang, L.P.; Xu, M.H. New leak-localization approaches for gas pipelines using acoustic waves. Measurement 2019, 134, 54–65. [Google Scholar] [CrossRef]
- Wang, S.; Yao, X.F. Aeroacoustics measurement of the gas leakage rate for single hole. Rev. Sci. Instrum. 2020, 91, 045102. [Google Scholar] [CrossRef]
- Mostafapour, A.; Davoudi, S. Analysis of leakage in high pressure pipe using acoustic emission method. Appl. Acoust. 2013, 74, 335–342. [Google Scholar] [CrossRef]
- Jin, H.; Zhang, L.B.; Liang, W.; Ding, Q.K. Integrated leakage detection and localization model for gas pipelines based on the acoustic wave method. J. Loss Prev. Process Ind. 2014, 27, 74–88. [Google Scholar] [CrossRef]
- Li, J.K.; Jin, W.Q.; Wang, X.; Zhang, X. MRGC performance evaluation model of gas leak infrared imaging detection system. Opt. Express 2014, 22, A1701–A1712. [Google Scholar] [CrossRef]
- Wang, S.; Yao, X.F.; Yang, H. The heat conduction model and leakage characterization of the sealing interface. Int. J. Therm. Sci. 2019, 145, 106027. [Google Scholar] [CrossRef]
- Yang, H.; Yao, X.F.; Wang, S.; Yuan, L.; Ke, Y.C.; Liu, Y.H. Simultaneous determination of gas leakage location and leakage rate based on local temperature gradient. Measurement 2019, 133, 233–240. [Google Scholar] [CrossRef]
- Wang, S.; Yao, X.F.; Yang, H.; Yuan, L.; Dong, Y.F. A new leakage measurement method for damaged seal material. Meas. Sci. Technol. 2018, 29, 075203. [Google Scholar] [CrossRef]
- Ergun, S. Fluid flow through packed columns. Chem. Eng. Prog. 1952, 48, 89–94. [Google Scholar]
- Hinkley, J.; Waters, A.G.; Litster, J.D. An investigation of pre-ignition air flow in ferrous sintering. Int. J. Miner. Process. 1994, 42, 37–52. [Google Scholar] [CrossRef]
- Wang, G.; Wen, Z.; Lou, G.F.; Dou, R.F.; Li, X.W.; Liu, X.L.; Su, F.Y. Mathematical modeling and combustion characteristic evaluation of a flue gas recirculation iron ore sintering process. Int. J. Heat Mass Transf. 2016, 97, 964–974. [Google Scholar] [CrossRef]
- Brower, W.B.; Eisler, E.; Filkorn, E.J.; Gonenc, J.; Plati, C.; Stagnitti, J. On the Compressible Flow Through an Orifice. J. Fluids Eng.-Trans. ASME 1993, 115, 660–664. [Google Scholar] [CrossRef]
- Szente, V.; Vad, J. A semi-empirical model for characterisation of flow coefficient for pneumatic solenoid valves. Period. Polytech-Mech. Eng. 2003, 47, 131–142. [Google Scholar]
Figure 1.
Air leakage distribution in the sintering machine.

Figure 2.
Some typical leakage in region A.

Figure 3.
Cross-section of region A and simplified model.

Figure 4.
The principles of the counter-flow bed and the hole–bed models.

Figure 5.
The flow rate and velocity of holes as a function of hole diameter, according to the hole model.
Figure 5.
The flow rate and velocity of holes as a function of hole diameter, according to the hole model.

Figure 6.
The results of the counter-flow bed model. (a) The flow rate, velocity and temperature of holes. (b) The flow rate, velocity and temperature of the sintering bed at each wind box location.
Figure 6.
The results of the counter-flow bed model. (a) The flow rate, velocity and temperature of holes. (b) The flow rate, velocity and temperature of the sintering bed at each wind box location.

Figure 7.
The results of the hole–bed model. (a) Variation in the leakage flow rate as a function of hole diameter. (b) Variation in bed negative pressure as a function of hole diameter.
Figure 7.
The results of the hole–bed model. (a) Variation in the leakage flow rate as a function of hole diameter. (b) Variation in bed negative pressure as a function of hole diameter.

Figure 8.
The variation in air leakage flow rate as a function of hole diameter under different process conditions: (a) bed porosity; (b) particle diameters; (c) initial negative pressure; (d) bed depth.
Figure 8.
The variation in air leakage flow rate as a function of hole diameter under different process conditions: (a) bed porosity; (b) particle diameters; (c) initial negative pressure; (d) bed depth.

Figure 9.
The composition of the test machine and its instruments.

Figure 10.
The model validations of the hole–bed model in the laboratory. (a) Case: the flow coefficient Cd = 1; (b) Case: the flow coefficient Cd = 0.62.
Figure 10.
The model validations of the hole–bed model in the laboratory. (a) Case: the flow coefficient Cd = 1; (b) Case: the flow coefficient Cd = 0.62.


Table 1.
The known parameters of the sintering machine.
| Item | Parameters | Unit | Value |
|---|---|---|---|
| Sintering area of oneside | Abed | m2 | 180 |
| Area of the sintering bed at each wind box location | Abed,i (i = 1~6) Abed,i (i = 7~24) | m2 m2 | 3 × 2 4 × 2 |
| Bed height | H | m | 0.75 |
| Bed porosity | ε | 0.3 | |
| Molecular weight of the air | M | kg/kmol | 29 |
| Constant of gas | R | J/kmol·K | 8314 |
| Particle size | dp | m | 0.004 |
| Number of wind boxes | n | group | 24 |
| Ambient environment temperature | Ta | K | 300 |
| Ambient environment pressure | Pa | Pa | 101,325 |
| Pressure of the sintering bed | Pbed | Pa | 84,325 |
| Negative pressure of gathering pipeline | ΔPbed | Pa | 17,000 |
| Temperature of gathering pipeline | Tbed | K | 390~470 |
Table 2.
The parameters of each wind box’s location.
| Num. of Wind Boxes | Tbed,i = Known (K) | Pbed,i = Known (Pa) | ΔPbed,i = Known (Pa) | qm,i Solved (Nm3/h) |
|---|---|---|---|---|
| 1 | 345.99 | 84,325 | 17,000 | 16,228.62311 |
| 2 | 370.87 | 84,325 | 17,000 | 15,674.8212 |
| 3 | 347.15 | 84,325 | 17,000 | 16,201.48649 |
| 4 | 349.15 | 84,325 | 17,000 | 16,155.01719 |
| 5 | 346.15 | 84,325 | 17,000 | 16,224.87202 |
| 6 | 341.15 | 84,325 | 17,000 | 16,343.3379 |
| 7 | 340.15 | 84,325 | 17,000 | 21,823.12532 |
| 8 | 339.15 | 84,325 | 17,000 | 21,855.27491 |
| 9 | 339.15 | 84,325 | 17,000 | 21,855.27491 |
| 10 | 340.15 | 84,325 | 17,000 | 21,823.12532 |
| 11 | 341.15 | 84,325 | 17,000 | 21,791.1172 |
| 12 | 341.15 | 84,325 | 17,000 | 21,791.1172 |
| 13 | 348.15 | 84,325 | 17,000 | 21,570.93572 |
| 14 | 352.15 | 84,325 | 17,000 | 21,448.07591 |
| 15 | 358.15 | 84,325 | 17,000 | 21,267.65989 |
| 16 | 363.15 | 84,325 | 17,000 | 21,120.74145 |
| 17 | 382.15 | 84,325 | 17,000 | 20,588.99994 |
| 18 | 402.15 | 84,325 | 17,000 | 20,070.49797 |
| 19 | 423.15 | 84,325 | 17,000 | 19,566.13347 |
| 20 | 441.47 | 84,325 | 17,000 | 19,155.85699 |
| 21 | 503.15 | 84,325 | 17,000 | 17,943.34659 |
| 22 | 587.65 | 84,325 | 17,000 | 16,603.23879 |
| 23 | 647.78 | 84,325 | 17,000 | 15,813.87919 |
| 24 | 622.85 | 84,325 | 17,000 | 16,127.25489 |
Table 3.
Measurement results in the laboratory.
| d3, (m) | ΔP, (Pa) | u3,mea, (m/s) | Q3,mea, (m3/h) | Q3,hole, (m3/h) | Cd,mea |
|---|---|---|---|---|---|
| 720 | - | - | - | - | |
| 0.00 | 870 | - | - | - | - |
| 1290 | - | - | - | - | |
| 660 | 18.5 | 20.9124 | 36.1177 | 0.58 | |
| 0.02 | 820 | 23.0 | 25.9992 | 40.2582 | 0.64 |
| 1200 | 27.5 | 31.0860 | 48.7011 | 0.64 | |
| 560 | 17.5 | 79.1280 | 133.0767 | 0.59 | |
| 0.04 | 760 | 21.5 | 97.2144 | 155.0296 | 0.63 |
| 960 | 24.5 | 110.7792 | 174.2382 | 0.64 | |
| 410 | 15.5 | 157.6908 | 256.2019 | 0.62 | |
| 0.06 | 620 | 18.2 | 185.15952 | 315.0549 | 0.59 |
| 820 | 22.4 | 227.8886 | 362.3242 | 0.63 | |
| 280 | 13.2 | 238.7405 | 376.3976 | 0.63 | |
| 0.08 | 430 | 15.6 | 282.1478 | 466.4468 | 0.60 |
| 540 | 18.2 | 329.1725 | 522.7147 | 0.63 | |
| 200 | 10.8 | 305.208 | 497.0532 | 0.61 | |
| 0.10 | 230 | 12.5 | 353.25 | 533.0302 | 0.66 |
| 300 | 14.3 | 404.118 | 608.7633 | 0.66 |
Publisher’s Note: MDPI stays neutral with regard to jurisdictional claims in published maps and institutional affiliations. |
© 2022 by the authors. Licensee MDPI, Basel, Switzerland. This article is an open access article distributed under the terms and conditions of the Creative Commons Attribution (CC BY) license (https://creativecommons.org/licenses/by/4.0/).
Share and Cite
MDPI and ACS Style
Cai, J.; Kong, X.; Yu, M. Mathematical Modeling of Sintering Air Leakage through Holes. Energies 2022, 15, 4224. https://0-doi-org.brum.beds.ac.uk/10.3390/en15124224
AMA Style
Cai J, Kong X, Yu M. Mathematical Modeling of Sintering Air Leakage through Holes. Energies. 2022; 15(12):4224. https://0-doi-org.brum.beds.ac.uk/10.3390/en15124224
Chicago/Turabian StyleCai, Jin, Xiangwei Kong, and Mingzhu Yu. 2022. "Mathematical Modeling of Sintering Air Leakage through Holes" Energies 15, no. 12: 4224. https://0-doi-org.brum.beds.ac.uk/10.3390/en15124224
Note that from the first issue of 2016, this journal uses article numbers instead of page numbers. See further details here.