
Optimization of Energy Management Strategy for Fuel Cell Hybrid Electric Vehicles Based on Dynamic Programming


1
Hubei Key Laboratory of Advanced Technology for Automotive Components, Wuhan University of Technology, Wuhan 430070, China
2
Foshan Xianhu Laboratory of the Advanced Energy Science and Technology Guangdong Laboratory, Foshan 528200, China
3
Hubei Research Center for New Energy & Intelligent Connected Vehicle, Wuhan University of Technology, Wuhan 430070, China
4
School of Customs and Public Administration, Shanghai Customs College, Shanghai 201204, China
5
Technical Center of Dongfeng Commercial Vehicle, Wuhan 430056, China
*
Author to whom correspondence should be addressed.
Energies 2022, 15(12), 4325; https://0-doi-org.brum.beds.ac.uk/10.3390/en15124325
Submission received: 11 May 2022
/
Revised: 8 June 2022
/
Accepted: 10 June 2022
/
Published: 13 June 2022
(This article belongs to the Special Issue Advanced Techniques for Thermoelectric Generator and Fuel Cell System)
Abstract
:Fuel cell hybrid electric vehicles have attracted a large amount of attention in recent years owing to their advantages of zero emissions, high efficiency and low noise. To improve the fuel economy and system durability of vehicles, this paper proposes an energy management strategy optimization method for fuel cell hybrid electric vehicles based on dynamic programming. Rule-based and dynamic-programming-based strategies are developed based on building a fuel cell/battery hybrid system model. The rule-based strategy is improved with a power distribution scheme of dynamic programming strategy to improve the fuel economy of the vehicle. Furthermore, a limit on the rate of change of the output power of the fuel cell system is added to the rule-based strategy to avoid large load changes to improve the durability of the fuel cell. The simulation results show that the equivalent 100 km hydrogen consumption of the strategy based on the dynamic programming optimization rules is reduced by 6.46% compared with that before the improvement, and by limiting the rate of change of the output power of the fuel cell system, the times of large load changes are reduced. Therefore, the strategy based on the dynamic programming optimization rules effectively improves the fuel economy and system durability of vehicles.
1. Introduction
With the rapid growth of global car ownership and the consumption of nonrenewable energy, the world is facing challenges such as the energy crisis and climate change. The development of new energy vehicles is considered to be an effective solution to this challenge. A battery electric vehicle (BEV) is mainly composed of a battery, a motor and its controller. The energy required by the vehicle is only provided by the battery pack, which means that the capacity of the battery pack determines the driving range of the vehicle [1]. With the increase in battery capacity, the cost and weight of BEVs increase rapidly, which also determines that the capacity of BEV battery packs is limited [2]. Additionally, charging the battery pack takes longer than in conventional combustion engine vehicles, often taking hours to complete [3]. The hybrid electric vehicle (HEV) uses the internal combustion engine and the electric motor to provide power for the vehicle, and the vehicle has a longer driving range, and can make full use of the working characteristics of the internal combustion engine and the electric motor to improve the system efficiency [4,5]. The plug-in hybrid electric vehicle (PHEV) has the advantages of both BEVs and HEVs, which can effectively reduce exhaust emissions and provide a longer driving range [6,7], and are currently the most widely used in the field of public transportation. The mild hybrid electric vehicle (MHEV) uses a different low-voltage hybrid technology than the other two, and its configuration is simpler and lower cost [8,9]. The extended-range electric vehicle (EREV) only uses the motor to provide power for the vehicle, and the range extender directly charges the battery pack, so as to achieve the purpose of extending the driving mileage of the vehicle [10,11]. The fuel cell hybrid electric vehicle (FCHEV) uses the fuel cell as the main energy source and the battery/supercapacitor as the auxiliary energy source to jointly provide energy for the vehicle. The fueling time and driving range of FCHEVs are comparable to those of traditional internal combustion engine vehicles, and FCHEVs have the advantages of zero emission, high efficiency and low noise, and has broad application prospects [12]. At the same time, FCHEVs also face many problems that need to be solved urgently. The durability and cost of fuel cell systems (FCSs) are the major technical challenges for the application of FCHEVs [13].
Owing to its low operating temperature, high power density and fast response speed, proton-exchange-membrane fuel cells (PEMFCs) are the most widely used in FCHEVs [14]. However, it is difficult for the FCS to meet the frequently changing power demand of the vehicle in actual operating conditions, and it cannot recover the energy during braking. Therefore, an FCS is usually combined with a battery or supercapacitor in a hybrid system to provide electric power for the vehicle [15].
For FCHEVs equipped with two or more energy sources, energy management strategy (EMS) is a key technology to determine vehicle power performance and fuel economy. For an FCHEV, the aim of an EMS is to distribute the power demand among different energy sources to drive the vehicle, which leads to the improvement of the performance of both the fuel economy and the system durability. The control strategy for energy management can be divided into three categories: rule, optimization and learning-based strategies [16]. Rule-based strategies have the advantages of a convenient design, easy implementation and high robustness, which are widely used in vehicles. The strategies, including deterministic rules and fuzzy rules, which reasonably allocate the power of each energy source through preset rules, are mainly based on engineering experience [17,18]. Chen et al., and Li et al., verified that a state machine strategy can meet the requirements of a high-power hybrid powertrain and improve powertrain efficiency [19,20]. However, the rules are usually determined based on engineering experience and cannot achieve the optimal effect.
The optimization-based strategy derives the optimal power allocation strategy by calculating the optimal cost function, including dynamic programming (DP), Pontryagin’s minimum principle (PMP), equivalent consumption minimization strategy (ECMS) and model predictive control (MPC). The DP algorithm is a classic offline optimization method, which can solve and obtain the control effect of the theoretical global optimum. However, its reliance on prior knowledge of the driving cycle and the curse of dimensionality amplify the computational burden [21]. Its solution time increases exponentially with the increase in state variables and control variables. Dima et al., adopted the improved DP to add weights to the fitness function to guarantee faster convergence, which solved the limitation of dimensionality constraints [22]. Through this method, the optimal power allocation rule can be obtained and injected into the EMS of the Simulink model. However, DP is reliant on prior knowledge of the full driving cycle and cannot realize online application. PMP can obtain almost the same control effect as DP, and can also simplify the calculation [23]. PMP introduces a co-state variable and transforms a global optimization problem into an instantaneous optimization problem, which means that online application is possible [24,25,26]. However, for the complex operating conditions of vehicles, there is no effective and adaptable method to determine the co-state variable. The ECMS introduces an equivalent factor to obtain an instantaneous optimal control effect by minimizing the instantaneous cost function, which can be applied online [27,28], similarly to PMP. However, its control effect depends on the determination of the equivalent factor. Deng et al., improved ECMS through the DP algorithm to obtain a better control effect [29]. Based on the prediction model, MPC determines a global optimization algorithm solution in the prediction horizon. The model is simplified using a control model with piecewise-affine functions to achieve the optimal control effect, which can be applied online [30,31]. However, the algorithm has high requirements for the accuracy of the established vehicle model.
Owing to the complex operating conditions of vehicles, the adaptability of the optimization algorithm to complex operating conditions is poor. Therefore, some scholars apply the learning-based strategy to design EMSs. The strategy has good real-time performance and adaptability to working conditions through the use of big data for learning [32,33], but this strategy requires a large amount of data to learn.
These methods have been studied in hybrid electric vehicles with engines and motors, but they are not fully applicable to FCHEVs. As the core component of FCHEVs, the characteristics of FCSs play a key role in the performance and life of the vehicle. Compared with engines, FCSs have the characteristics of difficulty in starting, slow dynamic response, etc., and have more stringent requirements for operating conditions. At present, the cost of the fuel cell system is much higher than that of the engine, but its service life is still far behind that of the engine. Therefore, for vehicles equipped with an FCS and a battery or supercapacitor, the design requirements for EMSs are higher, and more factors need to be considered. Owing to the poor dynamic responses of FCSs, it is necessary to consider the influence of factors such as the rate of change of the output power of the FCS on its durability degradation. Wang et al., briefly described the factors affecting the durability of fuel cells [34]. Kwon et al., developed a near-optimal energy management control method that takes into account degradation costs and fuel costs during the design process [35]. Song et al., and Hu et al., incorporated the calculation of fuel cell and battery durability degradation into the optimization objective function to compare the fuel economy and system durability [36,37]. Using a nonlinear optimization method, He et al., improved the durability of the fuel cell by adding constraints on the current of the fuel cell [38]. In the process of EMS design, it is important that the development of the strategy can be guided by the analysis of the factors affecting the durability of the FCS. In the process of EMS design, it is necessary to analyze the influencing factors of FCS durability.
However, in the current research on EMSs with FCHEVs, considering the durability of fuel cells and developing practical and efficient energy management strategies still face many challenges: (1) rule-based control strategies are more suitable for engineering applications, but are not economical; (2) optimization and learning-based algorithms can effectively improve the fuel economy, but they are faced with problems such as extensive calculation and low robustness, which pose great challenges in practical application; (3) factors affecting the durability of fuel cell vehicles are complex and diverse, and it is difficult to optimize through energy management strategies.
In summary, the EMS of the FCHEV is developed for the FCS bench in our laboratory. The advances presented by this paper follow: Based on the bench test data and dynamic system parameters, an FCHEV dynamic system model is established. The factors affecting the fuel economy and system durability of FCHEVs are analyzed, and an energy management strategy optimization method based on dynamic programming is proposed. In this rule-based strategy, the influencing factor of fuel cell durability decline is added, and the economical optimal power distribution scheme is obtained through dynamic programming. This method can improve the fuel economy and system durability of FCHEVs, and has high practical value and application potential.
The paper is organized as follows: Section 2 establishes the forward simulation model of the FCHEV. Section 3 analyzes the influencing factors of FCHEV fuel economy and durability and establishes a rule- and DP-based EMS. Section 4 extracts the power allocation rules from the DP strategy and discusses a strategy to improve the rules. Section 5 compares and analyzes the simulation results of an improved EMS before and after the improvement. Section 6 provides the conclusions.
2. FCHEV Powertrain System Modeling
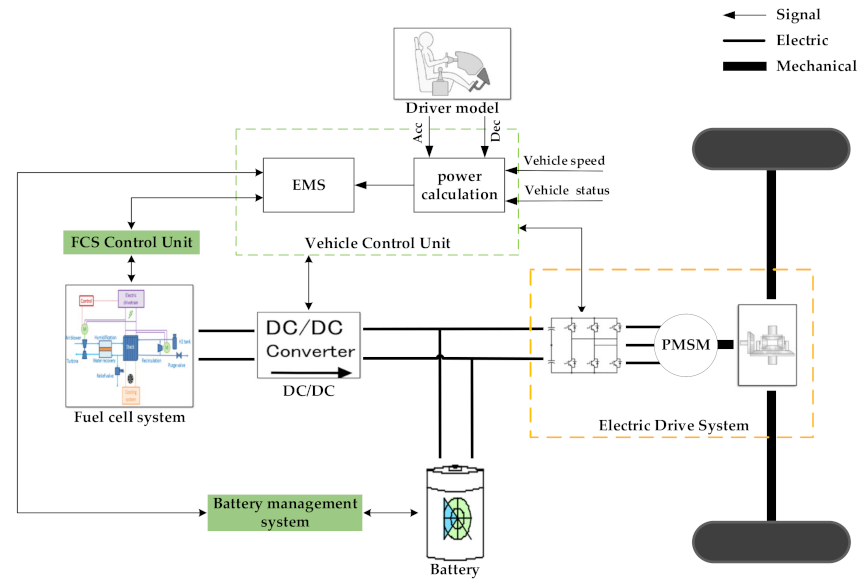
In this paper, the fuel cell hybrid electric passenger car is studied. Its powertrain system uses the FCS as the main energy source, which adjusts the FCS output power through DC/DC. The FCS is connected in parallel to the auxiliary energy source, the battery, on the DC bus to transmit electric energy to the electric drive system and other accessories. The powertrain system structure is shown in Figure 1 and modeled in MATLAB.
2.1. Vehicle Dynamics Modeling
In the modeling process, the influence of the lateral and vertical dynamics of the vehicle is ignored. According to the longitudinal dynamics of the vehicle, the dynamic equation of the vehicle [24] is as follows:
where Ft is the driving force; Ff is the rolling resistance, Ff = mgf cosα; Fw is the air resistance, ; and Fi is the slope resistance, Fi = mg sinα. The key parameters of FCHEV are listed in Table 1.
2.2. Motor Modeling
By analyzing the pedal opening signal, the required torque of the motor is obtained. Combined with the motor speed, the power demand of motor is calculated as follows:
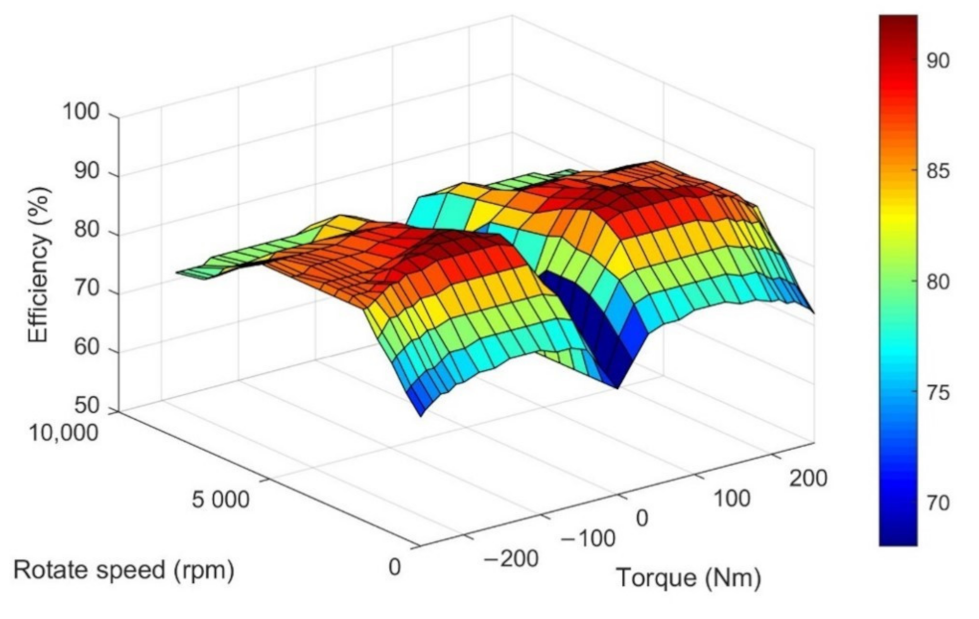
where is the motor torque; is the rotating speed of the motor shaft; and is the motor efficiency, . The efficiency map diagram is shown in Figure 2.
In this paper, the vehicle’s total power demand includes the required power of the motor and the power consumed by the auxiliary equipment of the FCS:
where is the power consumed by the auxiliary equipment of the FCS.
2.3. Modeling of Fuel Cell System
The FCS usually includes a fuel cell stack, air supply system, hydrogen supply system and hydrothermal management system. The output power of the fuel cell stack is determined by the voltage and current density, which can be written as follows:
where is the output power of the fuel cell stack, is the voltage of the monolithic fuel cell, is the number of cells, is the current density of the fuel cell, and is the effective area of the cell.
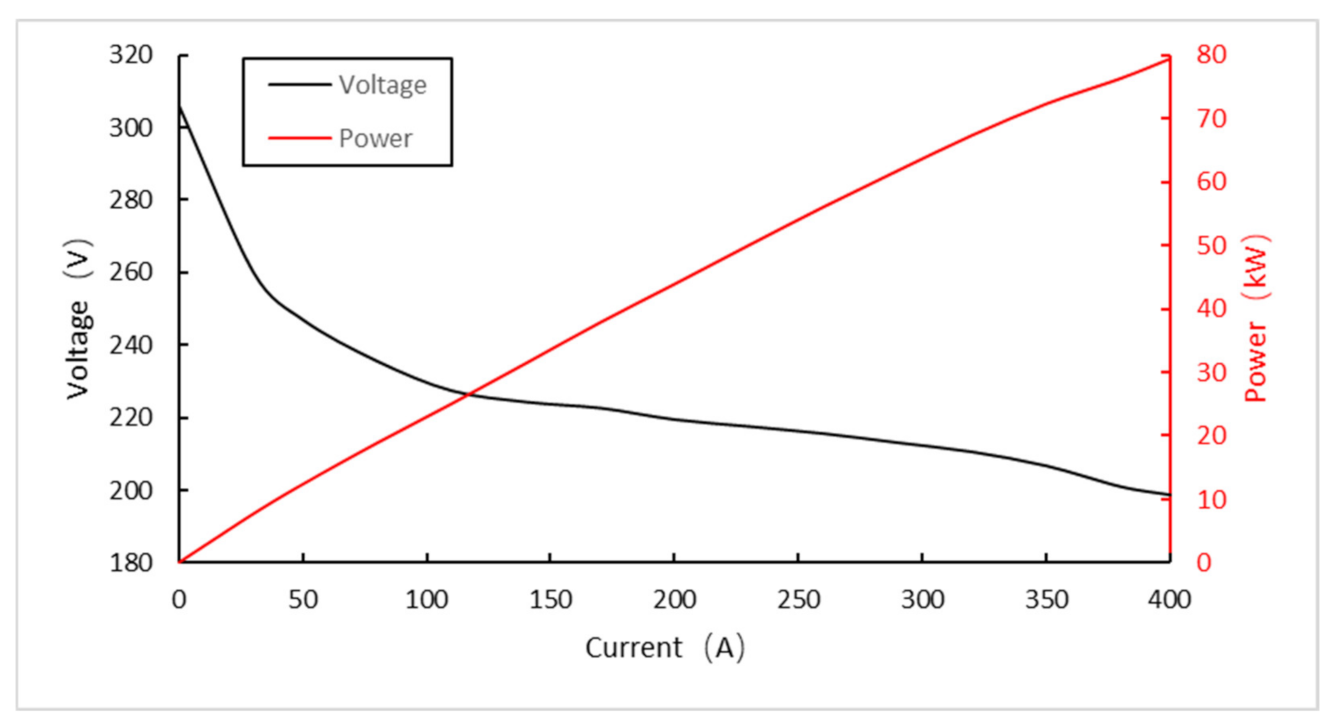
This paper uses a 62 kW proton exchange membrane fuel cell stack developed by Wuhan University of Technology. The specific parameters are shown in Table 1. According to the bench test, the relationship curve between the output current of the FCS and voltage and power is obtained, as shown in Figure 3.
This paper assumes that the air pressure and hydrogen pressure entering the stack are constant, while the hydrothermal management system always maintains the humidity of the air and hydrogen within a reasonable range. During normal operation, the hydrothermal management system can maintain the temperature of the system at approximately 75 °C for most of the time and the temperature variation range is relatively small. Additionally, during the cold start of the fuel cell, the hydrothermal management system can quickly increase the temperature of the FCS to the temperature during normal operation. The effect of temperature change on the output performance of the fuel cell can be considered small, assuming that the system temperature is always maintained at approximately 75 °C during the operation of the FCS. The output power command of the fuel cell is converted into the demand current according to the curve shown in Figure 3, and the flow rates of air and hydrogen are obtained using a lookup table according to the bench test data and input into the stack.
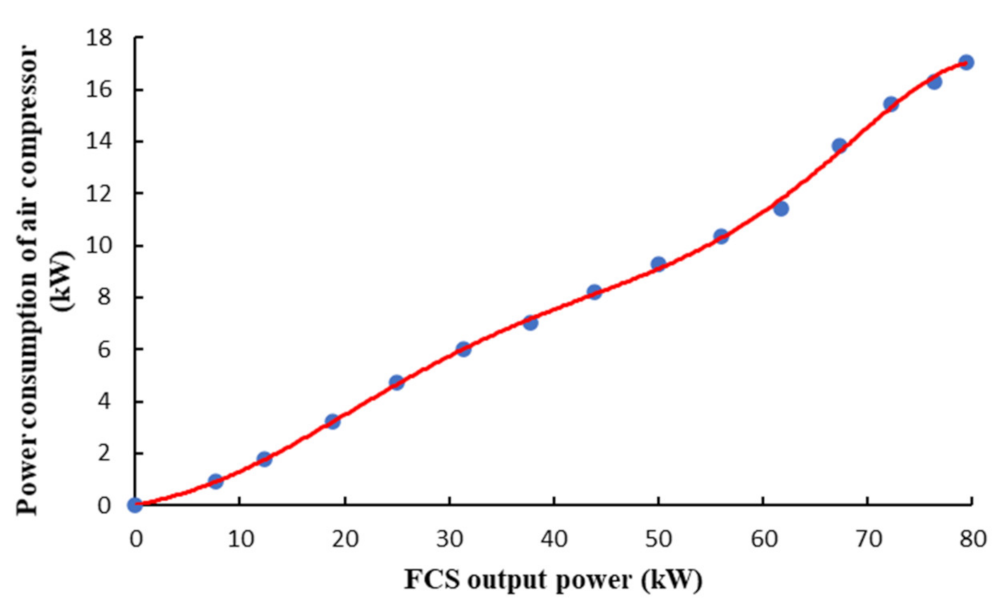
The air compressor and the water pump are the main auxiliary equipment in the FCS that consume power. The power consumption of the air compressor accounts for more than 95%, which increases with the increase in the FCS output power, as shown in Figure 4. The power consumed by the water pump and other auxiliaries is relatively small, and does not change much, so it can be regarded as a constant. The power consumed by the auxiliary equipment of the FCS is as follows:
where is the FCS output power, and and represent the start and stop states of the FCS.
The instantaneous hydrogen consumption rate of the FCS is calculated as follows:
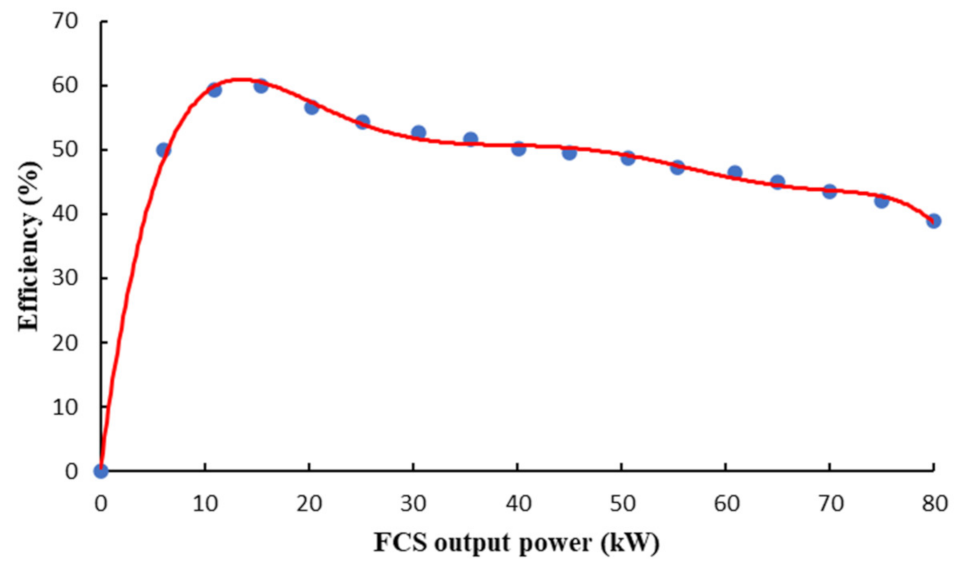
where is the FCS efficiency, according to the polynomial fitting of the experimental data, which changes with power, as shown in Figure 5. The highest efficiency point is , and is the hydrogen lower heating value (120 kJ/g).
2.4. Battery Modeling
In this paper, the lithium-ion battery is the auxiliary energy source, which is composed of 116 single cells and the battery cell-type is lithium–iron phosphate. It is simplified based on the equivalent internal resistance model. The battery power is calculated as follows:
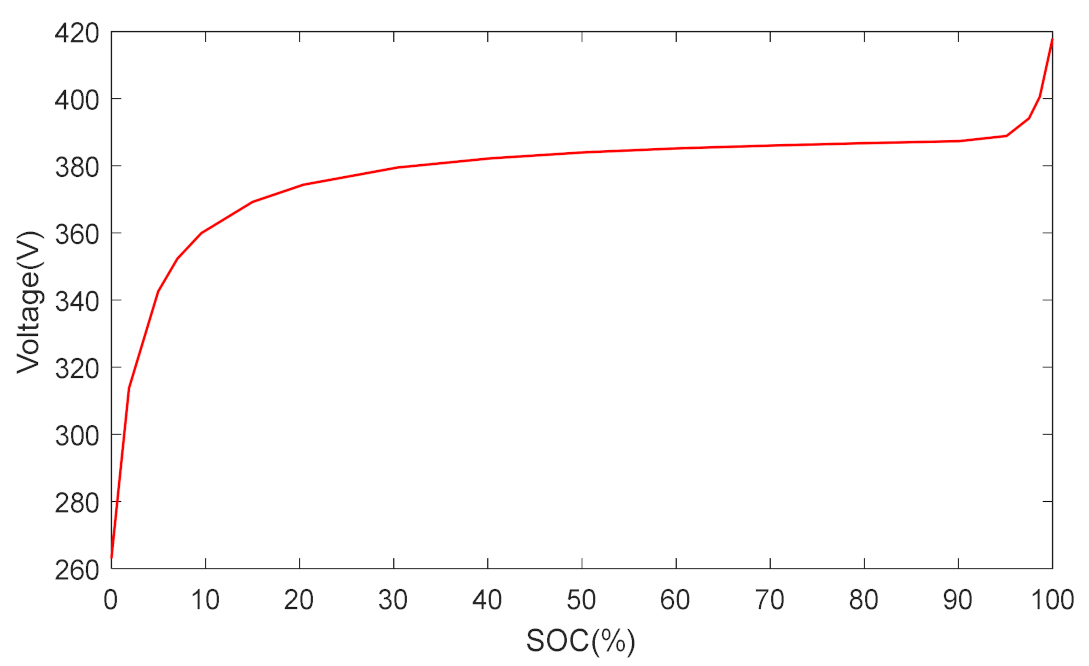
This paper assumes that under the normal operation condition, the battery thermal management unit controls the temperature at approximately 25 °C, with little temperature change. Therefore, it ignores the effect of temperature changes on the interior of the battery and assumes that the internal resistance of the battery is a constant, . The curve of the open circuit voltage of the battery pack as a function of battery state of charge (SOC) is shown in Figure 6.
When the battery power is known, can be calculated as follows:
The SOC is calculated using the ampere-hour integral method:
where is the state of charge at the initial moment of the battery, and is the capacity of the battery.
In order to accurately evaluate the fuel economy of the vehicle, the charging and discharging power of the battery is equivalent to the instantaneous hydrogen consumption rate , which is calculated as follows [36]:
where is the charge and discharge efficiency, which is calculated as follows:
3. Design of the Energy Management Strategy
The EMS of the FCHEV is the key to vehicle control technology, which directly affects the performance of the vehicle. The optimization of the control strategy can improve the system efficiency and slow down system life degradation. A good EMS can improve the fuel economy and durability of the powertrain system. Combining the fuel economy and durability influencing factors of FCHEV, rule- and dynamic-programming-based energy management strategies are developed on the basis of the models described above.
3.1. Influencing Factors of Economy and Durability
For the FCHEV, the total hydrogen consumption is the sum of the hydrogen consumption of the FCS and the equivalent hydrogen consumption of the battery, which is calculated as follows:
where is the total hydrogen consumption (g).
Taking an equivalent 100 km hydrogen consumption as the economic evaluation index, it is calculated as follows:
where is equivalent 100 km hydrogen consumption (g/100 km), and is the distance the vehicle is driven.
The fuel economy is related to the hydrogen consumption of the FCS and the equivalent hydrogen consumption of the battery. Furthermore, hydrogen consumption is specifically related to the efficiency of the powertrain system, the number of energy conversions, brake energy recovery, etc. Among them, improving the efficiency of the powertrain system can significantly improve the fuel economy. Therefore, in order to enhance fuel economy, the FCS should be operated within the high-efficiency range for as long as possible. In addition, the energy conversion between the FCS, battery and electric drive system also causes a certain amount of energy loss. Therefore, in the EMS, the number of energy conversions should also be minimized.
In summary, when designing the EMS, the following principles should be followed from the perspective of the fuel economy:
- (1)
- Make the FCS run in the high-efficiency range (8–40) kW;
- (2)
- Reduce the amount of energy conversion;
- (3)
- Maximize the recovery of braking energy.
On the other hand, the durability of the FCHEV, which includes the durability of the FCS and battery, should also be noted. The durability of the FCS is the focus of this paper. The main factors affecting battery durability are the number of charge–discharge cycles, temperature, discharge rate, depth of discharge and SOC. This paper assumes that the battery temperature is a constant; therefore, reducing overcharge and overdischarge of the battery can effectively prolong the battery life.
The durability of the FCS is closely related to the operating state. Operating conditions with frequent switching between start–stop, idling, high current density, large load changing, overload, cold start, etc., will accelerate the degradation of the FCS [39,40,41]. The start–stop of the FCS is expected to form a hydrogen–air interface that leads to a high potential, accelerates the corrosion of the carbon support and degrades the performance of the catalyst. When running at idling speed, the performance of the Pt catalyst is degraded due to the high potential. In the case of high power, it leads to a high current density, which often leads to flooding inside the stack and gas starvation that accelerate the aggregation of Pt particles, thereby reducing performance. When the load changes greatly, flooding and local starvation of gas are expected to occur inside the stack, resulting in the rapid degradation of the stack performance.
In the actual operating conditions of the vehicle, the large-load-change conditions have the largest impact on the durability of the fuel cell, followed by the start–stop conditions and the idle speed condition. The high-load operating conditions account for a small proportion.
In summary, from the perspective of durability, the following principles should be followed when designing an EMS:
- (1)
- Avoid large-load-changing frequency and switch between the start–stop of the FCS;
- (2)
- Limit the FCS output power and the rate of change in the output power;
- (3)
- Avoid running at idle speed and high power for a long time;
- (4)
- Maintain the SOC of the battery within the allowable range (0.35–0.85);
- (5)
- Try to keep the SOC within the target range (0.5–0.7);
- (6)
- Limit the charging and discharging power of the battery.
3.2. Rule-Based Control Strategy
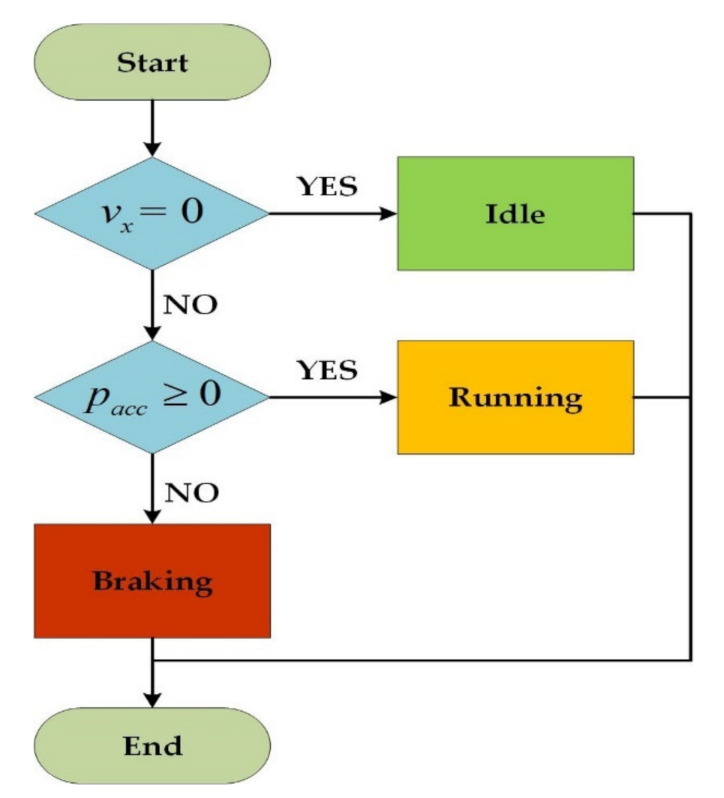
Under actual operating conditions, the vehicle can be divided into several different modes and performs different actions according to the driving conditions and the state of the powertrain system. Therefore, based on the idea of power that follows, this paper uses Stateflow of the MATLAB platform to establish a rule-based EMS to realize the regulation and energy flow control of the vehicle, and to reasonably allocate power to the FCS and battery. The modes of the vehicle are determined according to the vehicle speed and accelerator pedal position, namely, idle, running and braking, as shown in Figure 7. In this figure, represents the speed of the vehicle, and represents the accelerator pedal position.
3.2.1. Idle Mode
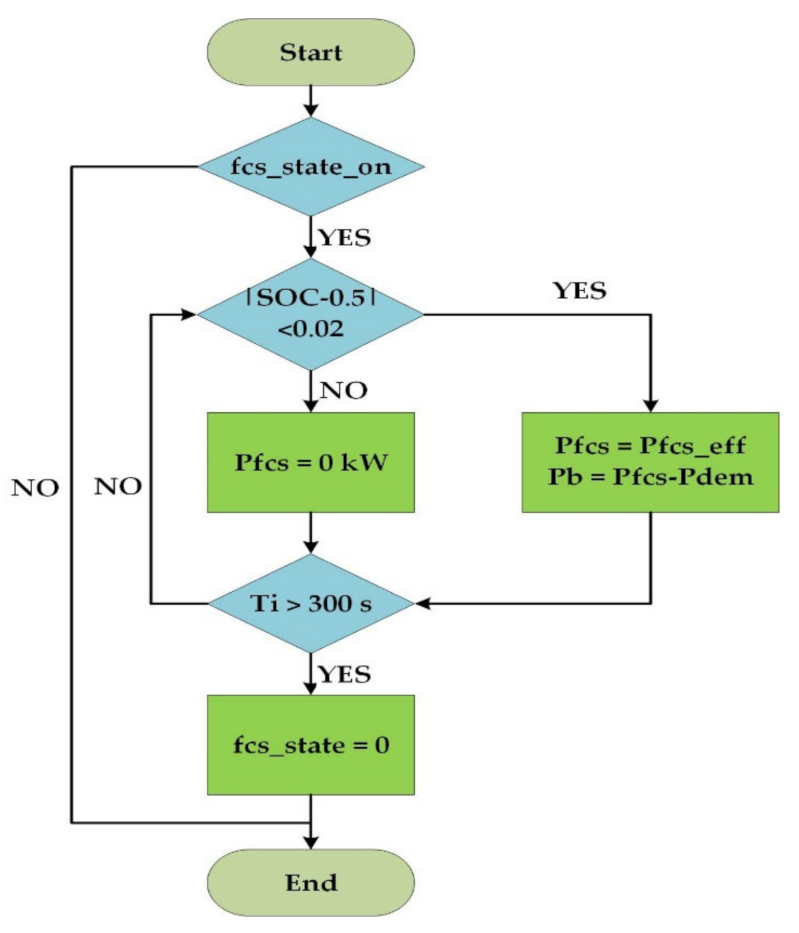
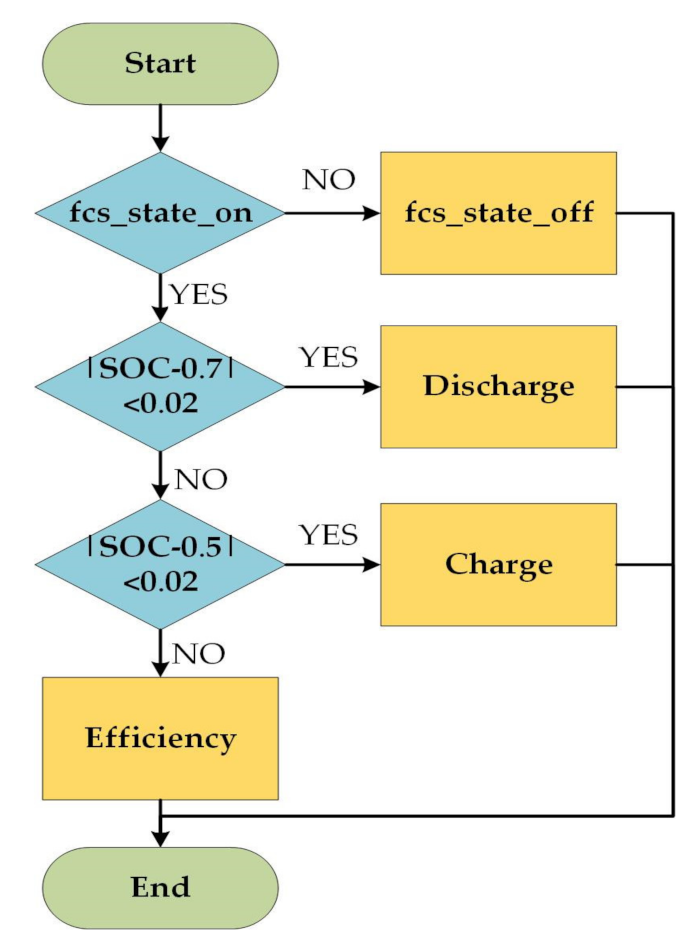
When the vehicle is in idle mode, the power required by the motor is , and the power demand of the vehicle is determined by the power consumed by the auxiliary equipment of the FCS. First, determine the on–off state of the FCS, then determine the size of value of the SOC, as shown in Figure 8. In this figure, and represent the start and stop states of the FCS, respectively; represents sending a start command to the FCS; and represents sending a stop command. To avoid jitter between different states when near the critical value, define . If the FCS is turned on, the operation state of the FCS is determined according to the SOC value. When the FCS is turned off, the power demand of the vehicle is provided by the battery.
A short-term idling operation can avoid a frequent switch between the start–stop of the FCS. However, a long-term idling operation not only increases hydrogen consumption, but also accelerates the decline in fuel cell durability. Therefore, after the idling operation exceeds the Ti time, a stop command is sent to the FCS.
3.2.2. Running Mode
The flowchart of the vehicle when it enters the running mode is shown in Figure 9. First, determine the on–off state of the FCS. When the FCS is turned off, that is, , the power demand of the vehicle is provided by the battery, . In order to maintain the SOC within a reasonable range and prevent the output power of the battery exceeding its limit, i.e., when , or and are satisfied, a start command is sent to the FCS.
When the fuel cell is turned on and , it is defined as a discharged state in which the battery is discharged. When , then the FCS output power takes the smaller value between the highest efficiency operating point and the power demand of the vehicle, . When , improve the FCS output power and prevent the output power of the battery from exceeding its maximum discharge power, then . When , then . When and , after running for more than the Ti time, a stop command is sent to the FCS.
When the FCS is turned on and , it is defined as a charge state in which the battery is charged within the normal output power range of the FCS. When the power demand of the vehicle does not exceed , the FCS output power is maintained at the highest efficiency point and the remaining power is used to charge the battery. When , then to be able to charge the battery, . When , in order to maintain the FCS output power within an appropriate range and prevent SOC from deviating too far from the target range, then . When , in order to prevent adverse damage to the durability of the FCS due to heavy load and to maintain the output power near the rated power point, that is, , the remaining power is taken up by the battery.
When the FCS is turned on and , the SOC is in the ideal range and the FCS can be operated in the high-efficiency range as much as possible. When , the FCS output power is . When , the FCS output power is , and remaining power is taken up by the battery. When , then .
3.2.3. Braking Mode
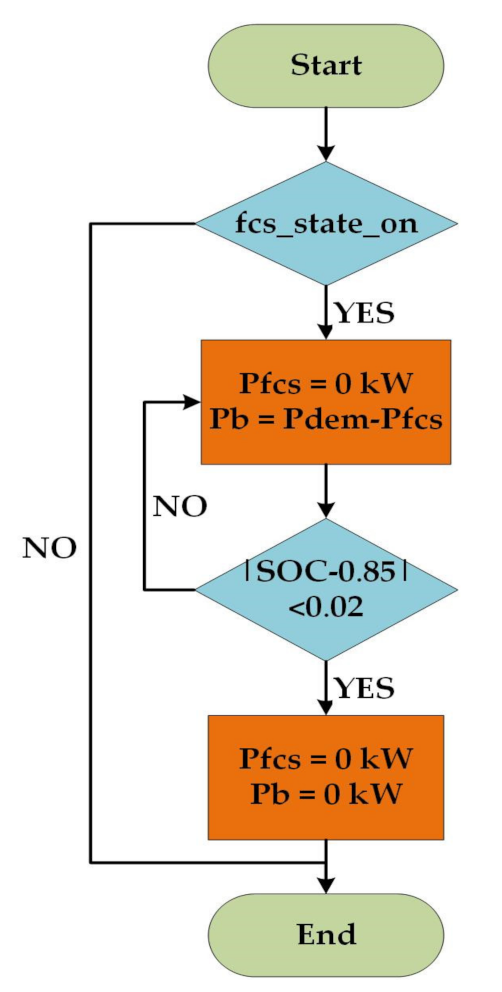
The flowchart for the vehicle when it enters the braking mode is shown in Figure 10. At this time, if the FCS is turned on, it maintains the idle speed, while the battery recovers the kinetic energy according to the designed maximum braking energy recovery strategy. When , it will stop recovering the braking energy.
Considering the response characteristics of the FCS, in this paper, the change rate of the power demand of the vehicle is greater than 7 kW/s and less than −10 kW/s, which is defined as a large-load-changing condition. To prevent the fuel cell from being in a large-load-changing condition and to respond to the demand of the vehicle as soon as possible, the rate of change in the FCS output power, , is limited. It is calculated as follows:
The rate of change in the FCS output power is related to the stack and system parameters, including the effective reaction area of the proton exchange membrane, pressure, humidity and air excess coefficient of reaction gas. Within a certain range, with the increase in reactive gas pressure, humidity and air excess coefficient, the dynamic response rate of the FCS is faster. For the FCS applied in this paper, the range of is set at .
3.3. DP-Based Control Strategy
The DP algorithm is a global optimization method for solving multistage decision-making problems. The essence is a nonlinear programming algorithm, and the core is the Bellman equation. Using the dynamic programming algorithm, the global optimal EMS of the hybrid system can be obtained under the pre-knowledge of the driving cycle. Owing to the inability to realize real-time applications, the results calculated by the DP method are usually used as a benchmark for evaluating vehicle performance [42]. The energy management problem is a typical multistage decision problem, and its essence is to realize the optimal control of fuel economy under the condition of satisfying the constraints. However, this optimal control problem is very complicated due to the nonlinearity and multiple constraints of the hybrid system [43]. The dynamic programming algorithm is suitable for this, which can solve the power distribution scheme that optimizes the fuel economy of the FCHEV.
Therefore, in order to obtain the most economical power allocation strategy for the FCHEV, the prior knowledge of the driving cycle is discretized and divided into N stages according to time. The discrete form of the system state transition equation follows:
where is the state variable of stage k, and is the control variable of state k. In the fuel cell/battery hybrid system, the SOC of the battery can reflect the current state of the system. Therefore, the state variable is , the output power of the FCS is used as a control variable to achieve power distribution in different stages, , and the output power of the power battery is . Therefore, the state transition equation of system follows:
In essence, the purpose of the DP algorithm is to solve the optimal control variable, , in each stage, so that the objective function, , is minimized. The objective function [44,45] follows:
where is the transition cost function for each stage. In this paper, the total hydrogen consumption of the vehicle is taken as the objective function. The transfer cost function of each stage follows:
During the actual operating conditions of the vehicle, the following constraints [46] should be satisfied:
where and are the minimum and maximum values of the allowable variation range of SOC, which are 0.35 and 0.85, respectively; and are the minimum and maximum SOC endpoint values, which are 0.7 and 0.5, respectively; and are the minimum and maximum output power of the FCS, which are 0 and 80 kW, respectively; and are the maximum values of battery charging and discharging power, which are −42 and 42 kW, respectively.
4. Optimization of Energy Management Strategy
The simulation results of the dynamic programming algorithm are analyzed based on the MATLAB platform, and the power distribution characteristics of the method are obtained. Using this feature to optimize the policy of the rule, the target policy of this paper is obtained.
The DP algorithm can obtain the most economical power allocation strategy, but it needs to have prior knowledge of the driving cycle and cannot realize online application. Therefore, some researchers extract the simulation results of DP to optimize the rule-based strategy to obtain a better control effect [47,48,49]. Therefore, the DP algorithm is used in this paper to optimize the rule-based control strategy to improve the fuel economy.
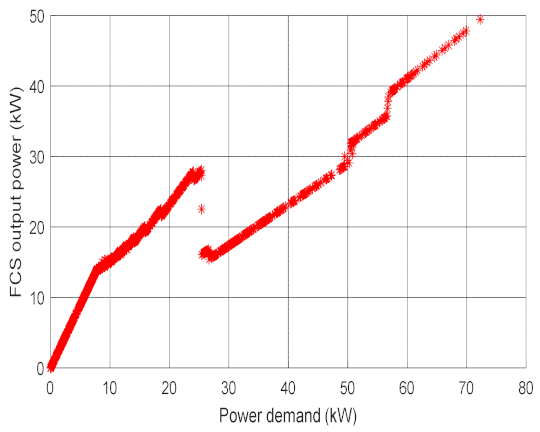
In the EMS of the FCHEV, the power allocation between the FCS and the battery is the key point. By controlling the FCS output power, the energy flow of the vehicle can be controlled, so as to achieve the purpose of controlling the power allocation among different energy sources. The WLTC driving cycle includes four parts: low speed, medium speed, high speed and ultrahigh speed. The whole cycle time is 1800 s, the total mileage is 23.25 km and the average speed is 46.5 km/h. The entire driving cycle includes idle speed and frequent acceleration and deceleration, and the driving conditions are complex and diverse, which are closer to the driving conditions of the actual road. Therefore, the initial value of SOC is set to 0.6, and the comparison between the power demand of the vehicle and the FCS output power of the DP-based strategy under WLTC conditions is shown in Figure 11. It can be seen from the figure that the FCS output power increases with the increase in the power demand of the vehicle. However, at the FCS output power jumps, which is mainly determined by the objective function . The objective function reflects the sum of the hydrogen consumption rate of the FCS and the equivalent hydrogen consumption rate of the battery. Therefore, with the increase in the power demand of the vehicle and the FCS output power, the total hydrogen consumption rate also increases rapidly. When , the FCS output power is maintained between 8 and 28 kW most of the time. The FCS operates in the highest efficiency range and the remaining power is used to charge the battery when the total hydrogen consumption rate is relatively small. The total hydrogen consumption rate increases gradually with the increase in the FCS output power. The total hydrogen consumption rate when the FCS output power alone is greater than the simultaneous output power of the FCS and the battery. Therefore, allocating the power demand of the vehicle to the FCS and battery reduces the total hydrogen consumption and provides better fuel economy.
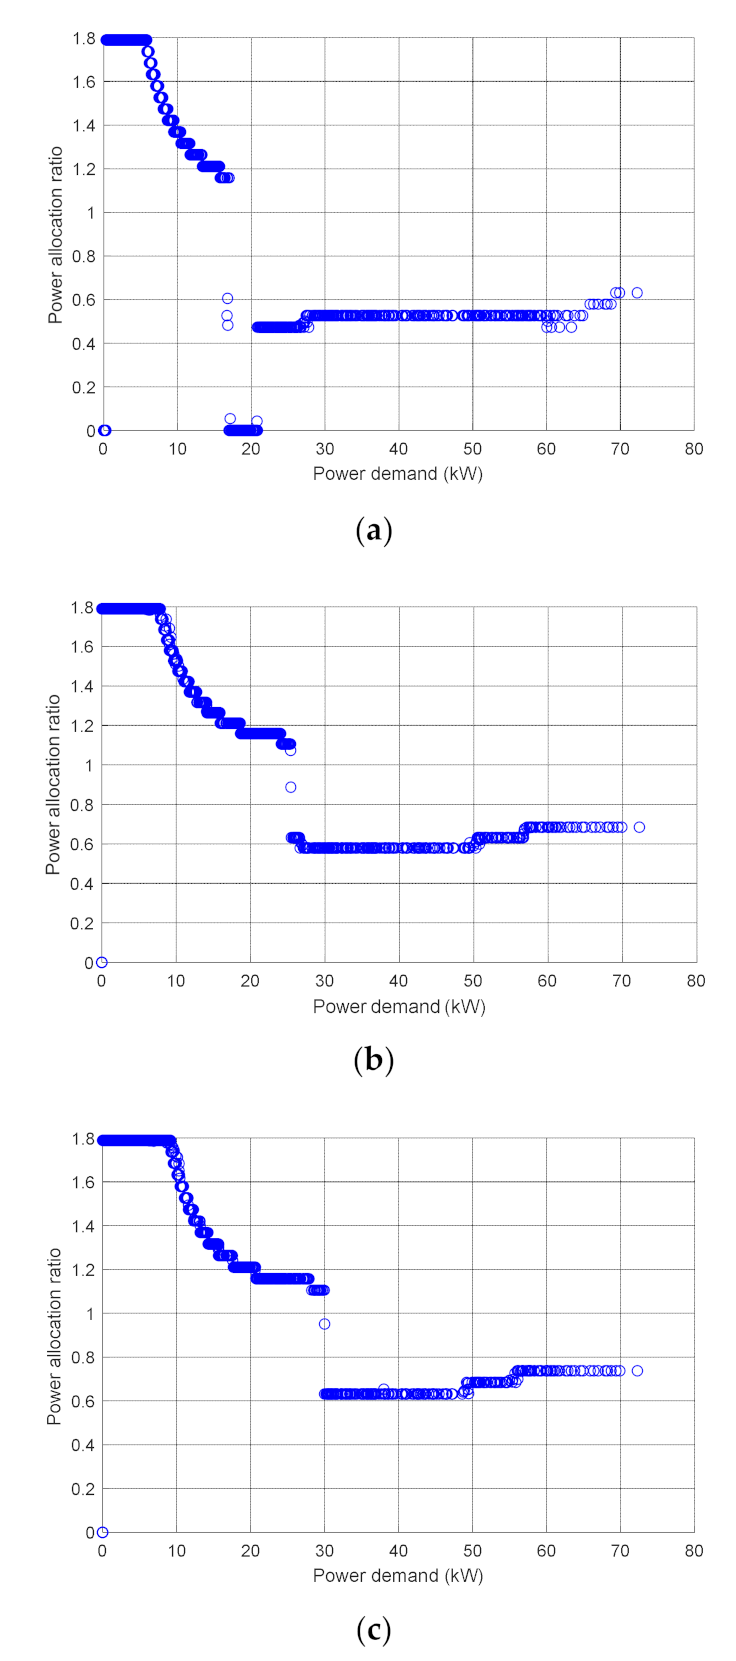
Summarizing, there is an obvious characteristic law between the FCS output power and the power demand of the vehicle. Therefore, the ratio of the FCS output power to the power demand of the vehicle is defined as the power distribution ratio, . Under the WLTC driving cycle, the DP algorithm is used to simulate different initial SOC values, and the power allocation ratio is obtained, as shown in Figure 12. It can be seen from the figure that the power allocation ratio can be divided into two parts. The first half shows a nonlinear change, while several stages in the second half are fixed values, and the change trend of the power allocation ratio under different initial SOC values is basically the same. In the case of different initial SOC values, in order to maintain the SOC within the target interval of , different vehicle power demands correspond to the boundary points of the front and rear parts of different initial SOC values.
Therefore, according to this analysis, it is concluded that the ratio of the FCS to the vehicle power demand is used to optimize the rule-based strategy. The power distribution rules obtained under different initial SOC values are used to improve the power distribution in the running mode by using the lookup table, so as to distribute the FCS output power and the battery and maintain the balance of SOC.
When the vehicle is in the running mode and , the power is allocated according to the analysis result when the initial SOC value is 0.8. When , the output power of the FCS varies nonlinearly with the power demanded by the vehicle, that is, . When , . When , . When , .
When , the power is allocated according to the analysis result when the initial SOC value is 0.6. When , . When , . When , .
When , the power is allocated according to the analysis result when the initial SOC value is 0.4. When , . When , . When , .
5. Simulation Results and Discussion
In this section, the rule- and DP-based strategies are compared, the analysis results visualized, and their advantages and disadvantages analyzed. The strategy based on the DP algorithm optimization rules is compared with the previous two methods.
5.1. Comparison of Rule-Based and DP-Based Strategy
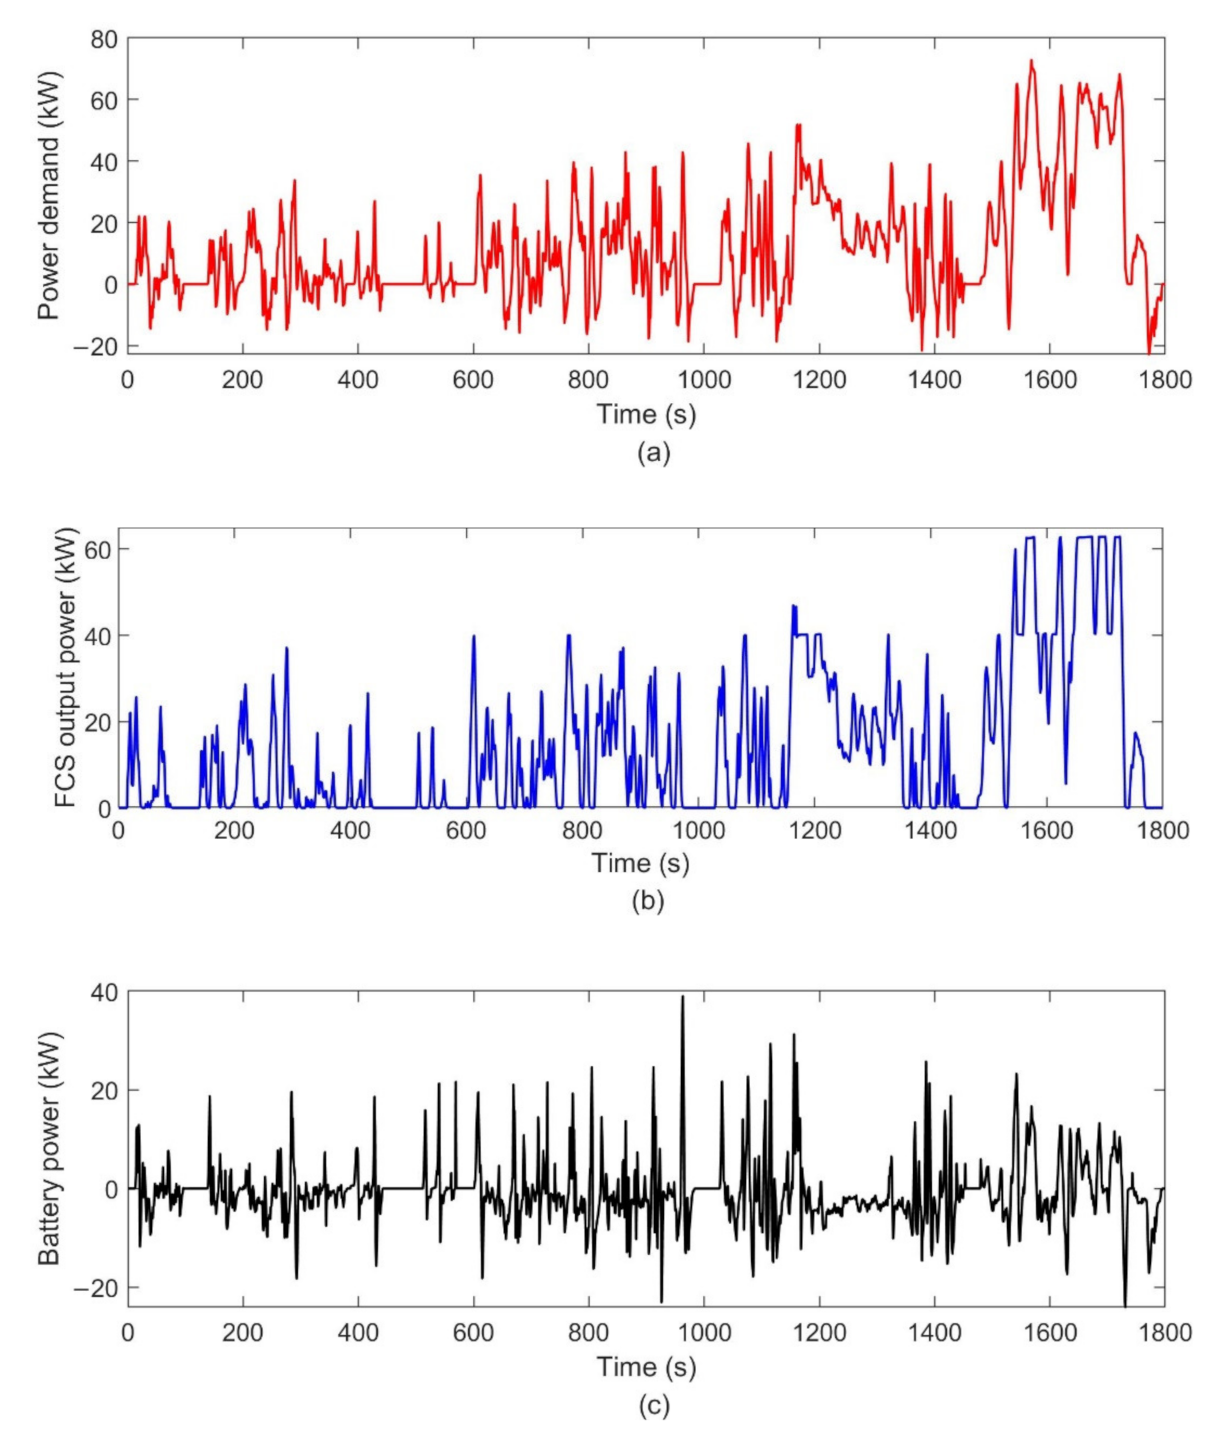
The rule-based strategy is solved using the vehicle’s forward simulation model established above and the DP-based strategy is solved using the vehicle’s backward simulation model. In the rule-based strategy, the power demand of the vehicle is compared with the FCS output power and battery power, as shown in Figure 13. It can be seen from the figure that the FCS output power follows the change in the power demand of the vehicle most of the time, and the change range is between 0 and 62 kW. The output power of the lithium-ion battery is very small or recovers the braking energy.
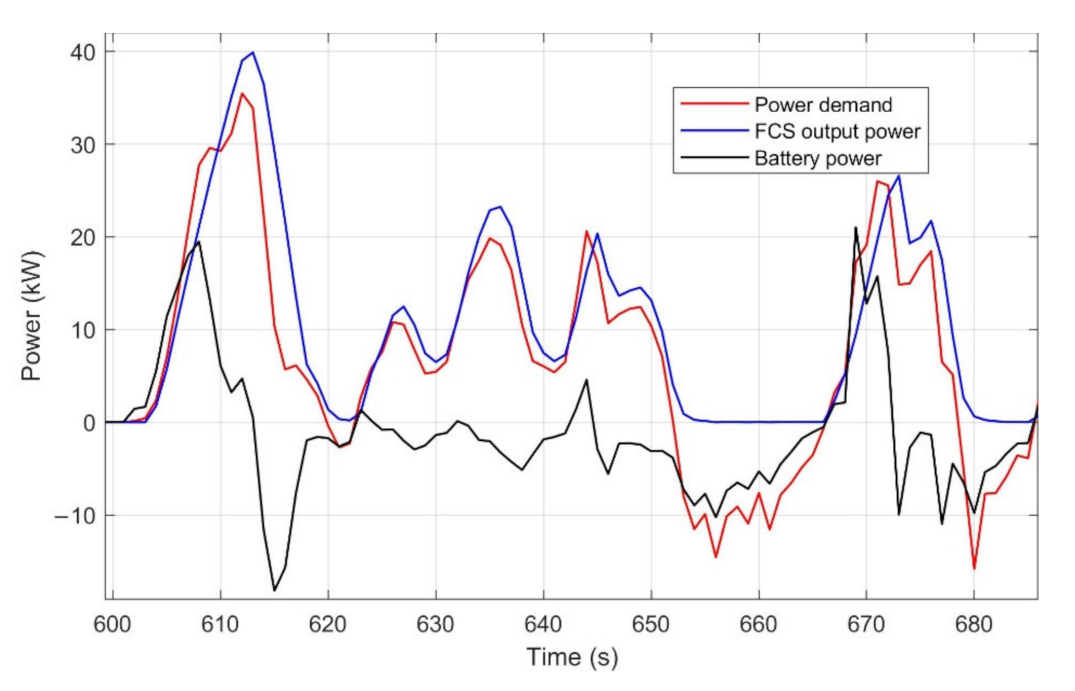
In the rule-based strategy, when the vehicle has a large load-change condition, the power demand of the vehicle, the output power of the FCS, and the power of the battery are shown in Figure 14. By configuring the battery and limiting the rate of change of the FCS output power, the durability decline in the FCS caused by the large load change is reduced, and the dynamic response requirements of the vehicle are also met.
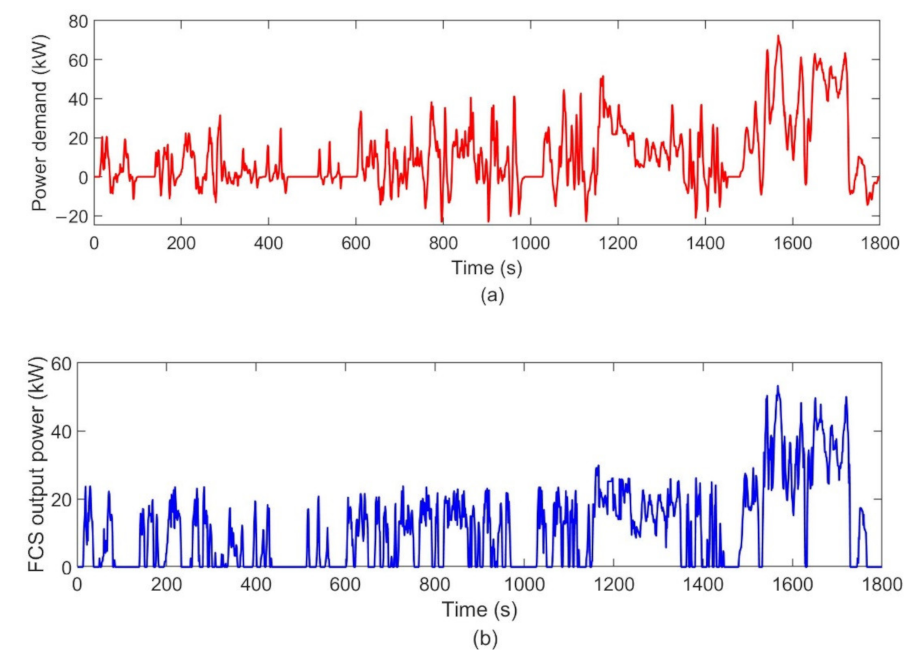
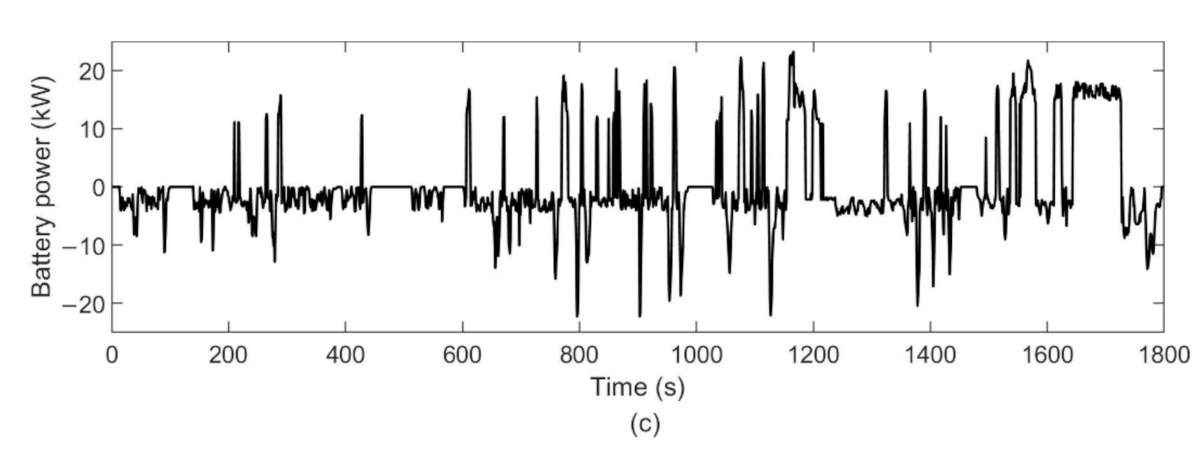
In the DP-based strategy, the power demand of the vehicle and the output power of the FCS and battery are compared, as shown in Figure 15. When the power demand of the vehicle is relatively small, that is, , the FCS output power hardly exceeds 30 kW, and the battery has low-power discharge or braking energy recovery. When the power demand of the vehicle is high, that is, , the FCS output power increases, but does not exceed 50 kW, and the battery bears part of the power. This is beneficial to maintain the FCS in a high-efficiency range while also avoiding the high-power discharge of the battery.
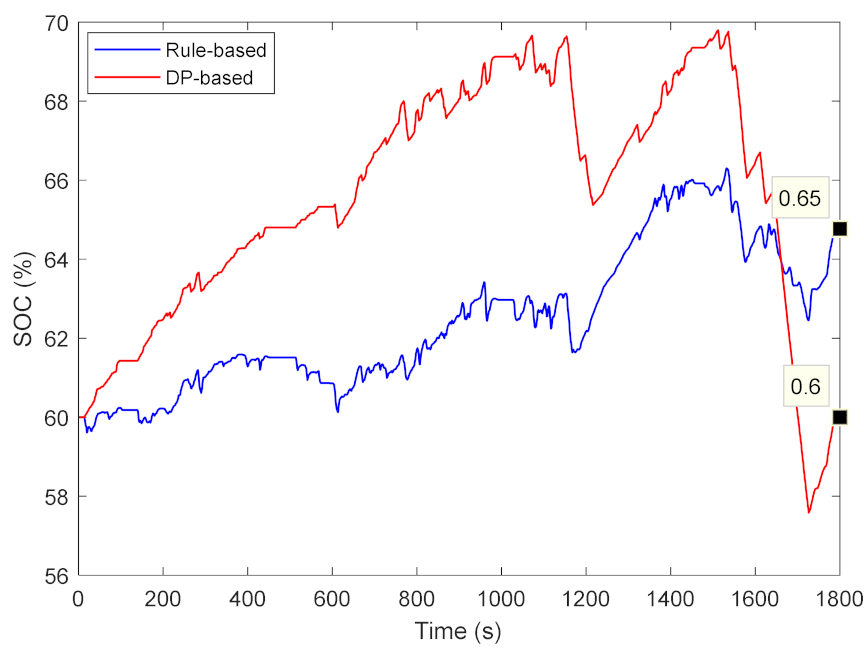
Figure 16 shows the change trend of the SOC within rule- and DP-based strategies. In the rule-based strategy, since the FCS output power follows the change in the vehicle’s power demand most of time and the battery only compensates for the lack of dynamic response of the FCS or performs braking energy recovery, so the fluctuation of SOC is smaller. However, in the DP-based strategy, in order to make the FCS operate in the high-efficiency range, the SOC of the battery fluctuates greatly, but it is still within the target range.
The simulation results of the rule- and DP-based strategies are compared in Table 2. Among the above two control strategies, the rule-based strategy makes the hydrogen consumption larger, while the fluctuation of SOC is smaller, and the DP-based strategy is the opposite. In the rule-based strategy, the FCS output power has a wider variation range, and the time of the high-power operation is longer, resulting in poor fuel economy. However, by limiting the power change rate, so that the load does not change significantly, it is beneficial to prolong the durability of the FCS. In these two strategies, the FCS is a start–stop state once in a driving-cycle condition. In the DP-based strategy, the FCS output power has a small variation range and most of the time runs in the high-efficiency range, which is beneficial to improve the fuel economy. However, the change rate of the FCS output power is very large and the number of large load changes is 103. This means that the FCS is frequently heavily loaded and unloaded, which will seriously damage the durability of the FCS.
According to Table 2, the total hydrogen consumption of the rule- and dynamic-programming-based energy management strategies developed in this paper under a WLTC cycle condition is 320.2 and 278.7 g, respectively, and the equivalent hydrogen consumption per 100 km is 1377 and 1198 g/100 km, respectively. The equivalent hydrogen consumption of the rule-based and dynamic-programming-based strategies designed in [24] is 253,502 and 233,627 g, respectively, under a combined operating condition of about 1300 s. In reference [36], the equivalent hydrogen consumption per 100 km of the above two strategies under two operating conditions is 1074 and 1060 g/100 km, and 1206 and 1161 g/100 km, respectively. In reference [22], the rule-based strategy is 1278 g/100 km. By comparing with existing research, it can be seen that the rule-based strategy designed in this paper is feasible. At the same time, factors such as the structural configuration of the vehicle and the parameters of the powertrain, as well as whether to consider the power consumed by accessories, will have a certain impact on hydrogen consumption.
5.2. Improved Rule-Based Strategy Analysis
Based on the comparative analysis of the advantages and disadvantages of the two control strategies, the optimal power allocation ratio obtained by the DP algorithm is used in the rule-based strategy to optimize the control strategy. Both the rule- and the dynamic-programming-optimization rule-based strategies have the potential for real-time application, and the dynamic-programming-based strategy can be used as a reference in most cases. Therefore, we focus on analyzing the performance improvement of the strategies before and after optimization, and compare the strategies based on dynamic programming.
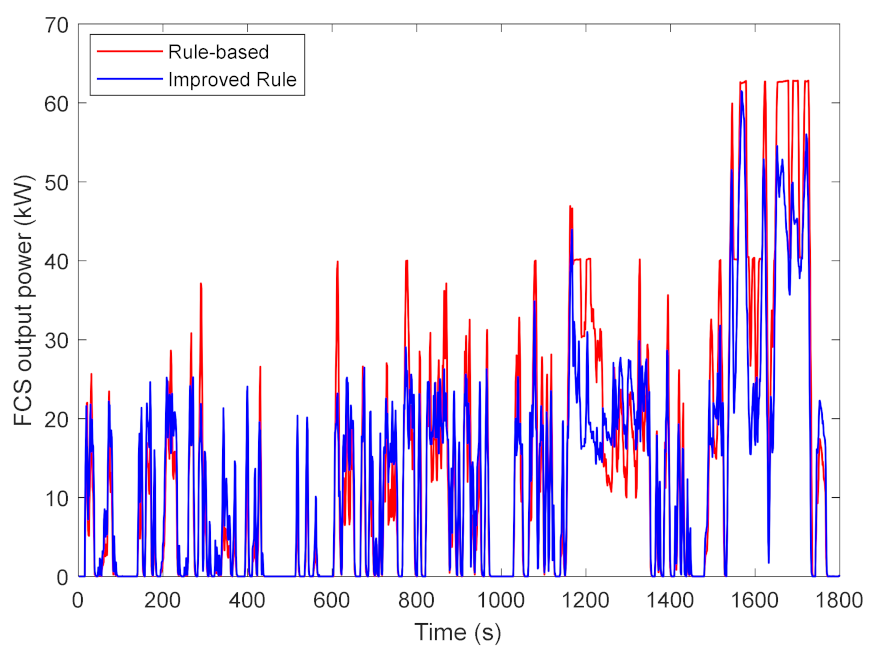
The comparison of the FCS output power results between the rule- and the dynamic-programming-optimization rule-based strategy is shown in Figure 17. Compared with the rule-based strategy before optimization, the FCS output power in the strategy optimization based on the DP algorithm is obviously more likely to be distributed in the region with higher system efficiency.
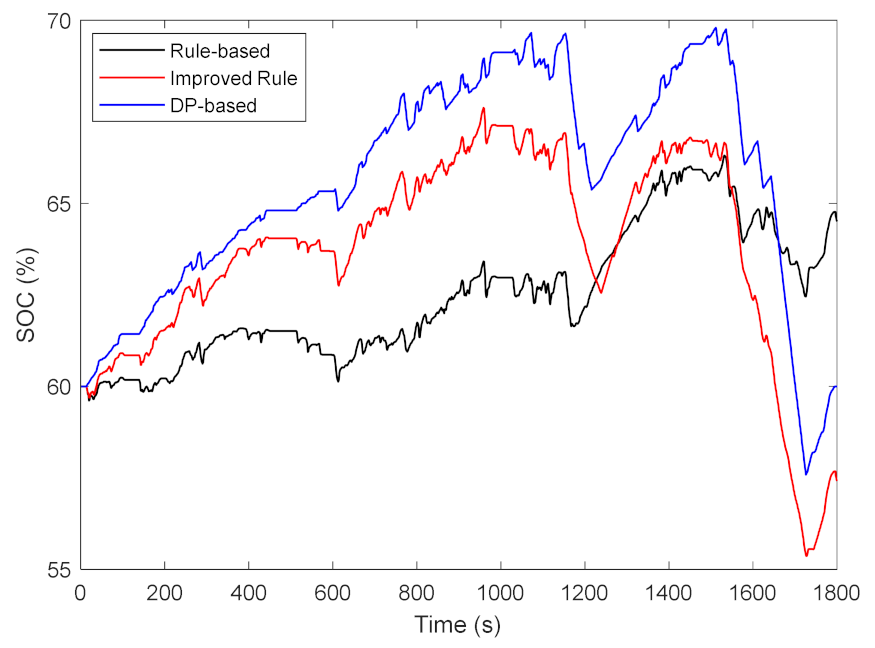
Figure 18 shows the changes in the SOC for the rule, the DP and the improved rule-based strategies under the WLTC driving cycle and the initial SOC value of 0.6. It can be seen from the figure that the change trend of the improved rule-based strategy is closer to that of the DP-based strategy. Compared with the rule-based strategy, the SOC of the improved strategy fluctuates more, but is still within the target range. The rapid decrease in SOC in the second half is due to the high-speed condition in the second half of the WLTC driving cycle while the power demand of the vehicle is large. In order to maintain the high efficiency of the system, this strategy reduces the output power of the FCS, and the remaining power required by the vehicle is transported by the battery.
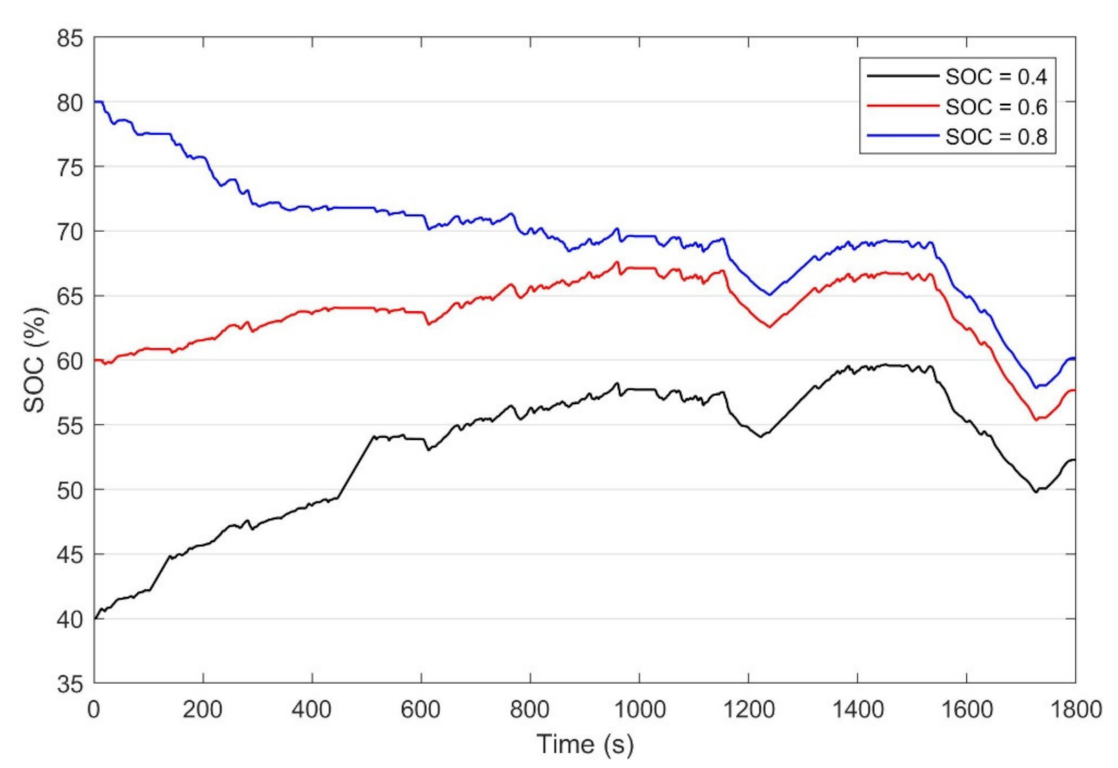
During the actual operation of the vehicle, the SOC may also deviate from the target range. At this time, the EMS should enable the vehicle to maintain the SOC within the target range after running for a period of time. In order to verify this situation, under the WLTC driving cycle, the SOC is set to different initial values for simulation and the results are shown in Figure 19. The improved rule-based strategy is able to maintain the SOC within the target range of 0.5 to 0.7 under different initial SOC values.
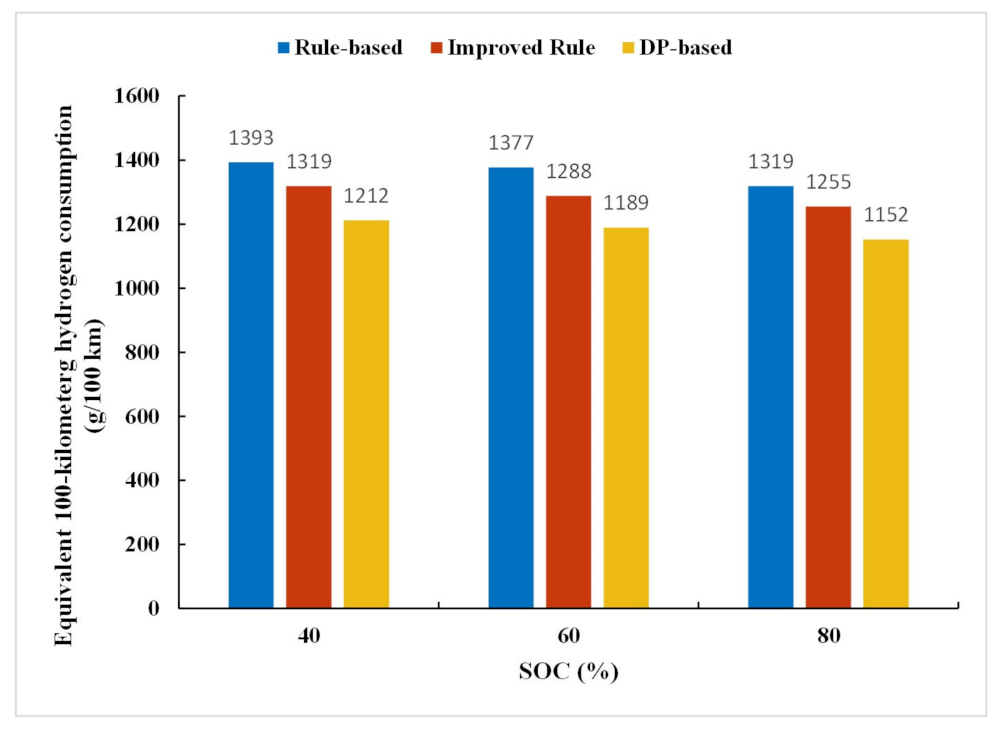
Compared with the rule-based and the DP-based strategies, the equivalent 100 km hydrogen consumption of the improved rule-based strategy under different initial SOC values is significantly reduced, as shown in Figure 20. Under different initial SOC values, the equivalent 100 km hydrogen consumption in the improved rule-based strategy is reduced by 5.31%, 6.46% and 4.85%.
At the same time, in order to verify that the improved strategy has good adaptability under different driving cycles, the rule-based, DP-based, and improved strategies are simulated and analyzed using different driving cycles. The driving-cycle conditions employed include compound driving cycles: WLTC, UDDS, NEDC, FTP75, JC08, urban driving cycle NYCC and suburban driving cycle HWFET. When the initial SOC value is 0.6, the simulation results of the three strategies under various cycle conditions are shown in Table 3. Regardless of the driving cycle under which the simulation is performed, the equivalent 100 km hydrogen consumption of the improved strategy is always better than that of the rule-based strategy. It can also be shown that the improved strategy has good adaptability to different driving cycles.
6. Conclusions
To improve the fuel economy and system durability of the FCHEV, this paper proposes an EMS based on DP algorithm optimization rules. By establishing a vehicle simulation model, the EMS design is verified. The main conclusions follow:
- (1)
- In the rule-based strategy, factors such as the large load change and on–off state of the FCS are taken into account, which effectively reduces the working time of the FCS under unfavorable conditions, avoids the large load change in the FCS and effectively prolongs the durability of the FCS.
- (2)
- The DP algorithm is used to obtain the most economical power allocation strategy. The variation rule between the FCS output power and the power demand of the vehicle is obtained.
- (3)
- The power allocation rules are extracted from the DP algorithm and used to optimize the rule-based strategy. The improved effect of this method is verified in the WLTC driving cycle. For the improved rule-based strategy, the simulation results show that the equivalent 100 km hydrogen consumption is reduced by 6.46% and that the fuel economy of the vehicle was significantly improved.
- (4)
- Simulations are carried out under different initial SOC values and different driving cycles. The results show that the EMS with the improved rule-based strategy can maintain the SOC within the target range, and the fuel economy is improved in different drive cycles. This shows that the method has good adaptability to operating conditions.
This paper focuses on the fuel economy and durability of the FCHEV, the results of which can provide a reference for relevant researchers. Although a large amount of work has been conducted in this field, there are still some limitations and challenges: on the one hand, it is not enough to analyze fuel cell degradation at the system level under typical operating conditions. On the other hand, the improved energy management strategy based on dynamic programming can be applied in real time, but the relevant verification has not been carried out. These limitations and challenges need to be further explored in future research.
Author Contributions
Conceptualization, D.W. and S.H.; methodology, C.D., Y.J. and Y.L.; software, S.H.; validation, S.H., D.W. and C.D.; formal analysis, S.H.; investigation, Y.J. and Y.L.; resources, D.W.; data curation, S.H.; writing—original draft preparation, S.H. and D.W.; writing—review and editing, C.D.; visualization, S.H.; supervision, Y.J. and Y.L.; project administration, C.D. and D.W.; funding acquisition, C.D. All authors have read and agreed to the published version of the manuscript.
Funding
This research and APC was funded by Key R&D project of Hubei Province, China, grant number (2021AAA006) and Foshan Xianhu Laboratory of the Advanced Energy Science and Technology Guangdong Laboratory, P. R. China, grant number (XHD2020-003).
Institutional Review Board Statement
Not applicable.
Informed Consent Statement
Not applicable.
Data Availability Statement
Not applicable.
Conflicts of Interest
The authors declare no conflict of interest.
Abbreviations
| BEV | Battery electric vehicle |
| HEV | Hybrid electric vehicle |
| PHEV | Plug-in hybrid electric vehicle |
| MHEV | Mild hybrid electric vehicle |
| EREV | Extended-range electric vehicle |
| FCHEV | Fuel cell hybrid electric vehicle |
| PEMFC | Proton exchange membrane fuel cell |
| FCS | Fuel cell system |
| EMS | Energy management strategy |
| DP | Dynamic programming |
| PMP | Pontryagin’s minimum principle |
| ECMS | Energy consumption minimization strategy |
| MPC | Model predictive control |
| SOC | State of charge |
| WLTC | World light vehicle test cycle |
| NEDC | New European driving cycle |
| UDDS | Urban dynamometer driving schedule |
| Nomenclature | |
| Vehicle mass/kg | |
| Vehicle speed/(km/h) | |
| Driving force/N | |
| Rolling resistance/N | |
| Slope resistance/N | |
| Inclination angle of the road/rad | |
| Coefficient of air resistance | |
| Front area/ | |
| Motor torque/Nm | |
| Rotating speed of the motor shaft/rpm | |
| Power demand of motor/kW | |
| Motor efficiency | |
| Total power demand of vehicle/kW | |
| power consumed by the auxiliary equipment of FCS/kW | |
| Fuel cell stack output power/kW | |
| Voltage of monolithic fuel cell/V | |
| Number of cells | |
| Current density of fuel cell/(A/cm2) | |
| Effective area of fuel cell/m2 | |
| Fuel cell system output power/kW | |
| Hydrogen consumption rate of fuel cell system/(g/s) | |
| Fuel cell system efficiency | |
| The highest efficiency point of fuel cell system/kW | |
| Hydrogen lower heating value/(kJ/g) | |
| Battery power/kW | |
| Open circuit voltage/V | |
| Current of battery/A | |
| Battery internal resistance/ | |
| Capacity of battery/Ah | |
| Hydrogen consumption rate of battery/(g/s) | |
| Efficiency of battery | |
| Total hydrogen consumption/g | |
| Equivalent 100 km hydrogen consumption/(g/100 km) | |
| Change rate of fuel cell system output power/(kW/s) |
References
- Grunditz, E.A.; Thiringer, T. Performance Analysis of Current BEVs Based on a Comprehensive Review of Specifications. IEEE Trans. Transp. Electr. 2016, 2, 270–289. [Google Scholar] [CrossRef]
- Jang, I.-G.; Lee, C.-S.; Hwang, S.-H. Energy Optimization of Electric Vehicles by DistributingDriving Power Considering SystemState Changes. Energies 2021, 14, 594. [Google Scholar] [CrossRef]
- Un-Noor, F.; Padmanaban, S.; Mihet-Popa, L.; Mollah, M.N.; Hossain, E. A Comprehensive Study of Key Electric Vehicle (EV) Components, Technologies, Challenges, Impacts, and Future Direction of Development. Energies 2017, 10, 1217. [Google Scholar] [CrossRef] [Green Version]
- Zhao, X.; Guo, G. Survey on Energy Management Strategies for Hybrid Electric Vehicles. Acta Autom. Sin. 2016, 42, 321–334. [Google Scholar]
- Hu, J.; Li, J.; Hu, Z.; Xu, L.; Ouyang, M. Power distribution strategy of a dual-engine system for heavy-duty hybrid electric vehicles using dynamic programming. Energy 2021, 215, 118851. [Google Scholar] [CrossRef]
- Hou, C.; Ouyang, M.; Xu, L.; Wang, H. Approximate Pontryagin’s minimum principle applied to the energy management of plug-in hybrid electric vehicles. Appl. Energy 2014, 115, 174–189. [Google Scholar] [CrossRef]
- Xie, S.; Li, H.; Xin, Z.; Liu, T.; Wei, L. A Pontryagin Minimum Principle-Based Adaptive Equivalent Consumption Minimum Strategy for a Plug-in Hybrid Electric Bus on a Fixed Route. Energies 2017, 10, 1379. [Google Scholar] [CrossRef]
- Oh, H.; Lee, J.; Woo, S.; Park, H. Effect of synergistic engine technologies for 48 V mild hybrid electric vehicles. Energy Convers. Manag. 2021, 244, 114515. [Google Scholar] [CrossRef]
- Deng, Y.; Gong, J.; Wang, Y. Energy Optimization and Simulation of HEV Using Mild Hybrid Control Strategy. China J. Highw. Transp. 2008, 21, 114–120. [Google Scholar]
- Chen, B.C.; Wu, Y.Y.; Tsai, H.C. Design and analysis of power management strategy for range extended electric vehicle using dynamic programming. Appl. Energy 2014, 113, 1764–1774. [Google Scholar] [CrossRef]
- Puma-Benavides, D.S.; Izquierdo-Reyes, J.; Calderon-Najera, J.D.D.; Ramirez-Mendoza, R.A. A Systematic Review of Technologies, Control Methods, and Optimization for Extended-Range Electric Vehicles. Appl. Sci. 2021, 11, 7095. [Google Scholar] [CrossRef]
- Wang, G.; Yu, Y.; Liu, H.; Gong, C.; Wen, S.; Wang, X.; Tu, Z. Progress on design and development of polymer electrolyte membrane fuel cell systems for vehicle applications: A review. Fuel Process. Technol. 2018, 179, 203–228. [Google Scholar] [CrossRef]
- Wang, Y.; Chen, K.S.; Mishler, J.; Cho, S.C.; Adroher, X.C. A review of polymer electrolyte membrane fuel cells: Technology, applications, and needs on fundamental research. Appl. Energy 2011, 88, 981–1007. [Google Scholar] [CrossRef] [Green Version]
- İnci, M.; Büyük, M.; Demir, M.H.; İlbey, G. A review and research on fuel cell electric vehicles: Topologies, power electronic converters, energy management methods, technical challenges, marketing and future aspects. Renew. Sustain. Energy Rev. 2021, 137, 110648. [Google Scholar] [CrossRef]
- Wu, X.; Zhou, P.; Fu, J.; Liu, P.; Yang, Y.; Cai, Y.; Zeng, Z. Research Progress on Energy Management Strategies of Fuel Cell Electric Vehicle Power Systems. J. Xihua Univ. 2020, 39, 89–96. [Google Scholar]
- Sorlei, I.-S.; Bizon, N.; Thounthong, P.; Varlam, M.; Carcadea, E.; Culcer, M.; Iliescu, M.; Raceanu, M. Fuel Cell Electric Vehicles—A Brief Review of Current Topologies and Energy Management Strategies. Energies 2021, 14, 252. [Google Scholar] [CrossRef]
- Wang, Y.; Sun, Z.; Chen, Z. Development of energy management system based on a rule-based power distribution strategy for hybrid power sources. Energy 2019, 175, 1055–1066. [Google Scholar] [CrossRef]
- Chen, J.; Xu, C.; Wu, C.; Xu, W. Adaptive Fuzzy Logic Control of Fuel-Cell-Battery Hybrid Systems for Electric Vehicles. IEEE Trans. Ind. Inform. 2018, 14, 292–300. [Google Scholar] [CrossRef]
- Chen, W.; Yan, Y.; Li, Q. Control Strategy Based on State Machine for Fuel Cell Hybrid Power System. J. Southwest Jiaotong Univ. 2019, 54, 663–670. [Google Scholar] [CrossRef]
- Li, Q.; Yang, H.; Han, Y.; Li, M.; Chen, W. A state machine strategy based on droop control for an energy management system of PEMFC-battery-supercapacitor hybrid tramway. Int. J. Hydrogen Energy 2016, 41, 16148–16159. [Google Scholar] [CrossRef]
- Enang, W.; Bannister, C. Modelling and control of hybrid electric vehicles (A comprehensive review). Renew. Sustain. Energy Rev. 2017, 74, 1210–1239. [Google Scholar] [CrossRef] [Green Version]
- Fares, D.; Chedid, R.; Panik, F.; Karaki, S.; Jabr, R. Dynamic programming technique for optimizing fuel cell hybrid vehicles. Int. J. Hydrogen Energy 2015, 40, 7777–7790. [Google Scholar] [CrossRef]
- Xu, L.; Ouyang, M.; Li, J.; Yang, F.; Lu, L.; Hua, J. Application of Pontryagin’s Minimal Principle to the energy management strategy of plugin fuel cell electric vehicles. Int. J. Hydrogen Energy 2013, 38, 10104–10115. [Google Scholar] [CrossRef]
- Li, X.; Wang, Y.; Yang, D.; Chen, Z. Adaptive energy management strategy for fuel cell/battery hybrid vehicles using Pontryagin’s Minimal Principle. J. Power Sources 2019, 440, 227105. [Google Scholar] [CrossRef]
- Ettihir, K.; Boulon, L.; Agbossou, K. Optimization-based energy management strategy for a fuel cell/battery hybrid power system. Appl. Energy 2016, 163, 142–153. [Google Scholar] [CrossRef]
- Qin, D.; Zeng, Y.; Su, L.; Zhan, S. Plug-in Hybrid Vehicle’s Real-time Control Strategy Based on Approximate Pontryagin’s Minimum Principle. J. Mech. Eng. 2015, 51, 134–140. [Google Scholar] [CrossRef]
- Xu, L.; Hua, J.; Bao, L.; Li, J.; Ouyang, M. Optimized Strategy on Equivalent Hydrogen Consumption for Fuel Cell Hybrid Electric Bus. China J. Highw. Transp. 2009, 22, 104–108. [Google Scholar] [CrossRef]
- Lin, X.; Xia, Y.; Li, X.; Li, H. Equivalent Consumption Minimization Strategy Adaptive to Various Driving Ranges for Fuel Cell Vehicles. Automot. Eng. 2019, 41, 750–756. [Google Scholar] [CrossRef]
- Deng, T.; Han, H.; Luo, J. Improved ECMS Energy Management Control of HEVs Based on DP Algorithm. China Mech. Eng. 2018, 29, 326–332. [Google Scholar] [CrossRef]
- Xie, S.; Hu, X.; Xin, Z.; Brighton, J. Pontryagin’s Minimum Principle based model predictive control of energy management for a plug-in hybrid electric bus. Appl. Energy 2019, 236, 893–905. [Google Scholar] [CrossRef] [Green Version]
- Zhao, Z.; Shen, P.; Jia, Y.; Zhou, L. Model Predictive Real-time Optimal Control of Fuel Cell Car. J. Tongji Univ. 2018, 46, 648–657. [Google Scholar] [CrossRef]
- Liu, T.; Zou, Y.; Liu, D.X.; Sun, F.C. Reinforcement Learning of Adaptive Energy Management With Transition Probability for a Hybrid Electric Tracked Vehicle. IEEE Trans. Ind. Electron. 2015, 62, 7837–7846. [Google Scholar] [CrossRef]
- Song, K.; Li, F.; Hu, X.; He, L.; Niu, W.; Lu, S.; Zhang, T. Multi-mode energy management strategy for fuel cell electric vehicles based on driving pattern identification using learning vector quantization neural network algorithm. J. Power Sources 2018, 389, 230–239. [Google Scholar] [CrossRef]
- Wang, Z.; Xie, Y.; Sun, W.; Zang, P. Modeling and Energy Management Strategy Research of Fuel Cell Bus. J. Tongji Univ. 2019, 47, 97–103, 123. [Google Scholar] [CrossRef]
- Kwon, L.; Cho, D.-S.; Ahn, C. Degradation-Conscious Equivalent Consumption Minimization Strategy for a Fuel Cell Hybrid System. Energies 2021, 14, 3810. [Google Scholar] [CrossRef]
- Song, K.; Wang, X.; Li, F.; Sorrentino, M.; Zheng, B. Pontryagin’s minimum principle-based real-time energy management strategy for fuel cell hybrid electric vehicle considering both fuel economy and power source durability. Energy 2020, 205, 118064. [Google Scholar] [CrossRef]
- Hu, Z.; Li, J.; Xu, L.; Song, Z.; Fang, C.; Ouyang, M.; Dou, G.; Kou, G. Multi-objective energy management optimization and parameter sizing for proton exchange membrane hybrid fuel cell vehicles. Energy Convers. Manag. 2016, 129, 108–121. [Google Scholar] [CrossRef]
- He, Y.; Miao, C.; Wu, J.; Zheng, X.; Liu, X.; Liu, X.; Han, F. Research on the Power Distribution Method for Hybrid Power System in the Fuel Cell V ehicle. Energies 2021, 14, 734. [Google Scholar] [CrossRef]
- Chen, H.; Zhao, X.; Zhang, T.; Pei, P. The reactant starvation of the proton exchange membrane fuel cells for vehicular applications: A review. Energy Convers. Manag. 2019, 182, 282–298. [Google Scholar] [CrossRef]
- Yue, M.; Jemei, S.; Gouriveau, R.; Zerhouni, N. Review on health-conscious energy management strategies for fuel cell hybrid electric vehicles: Degradation models and strategies. Int. J. Hydrogen Energy 2019, 44, 6844–6861. [Google Scholar] [CrossRef]
- Ren, P.; Pei, P.; Li, Y.; Wu, Z.; Chen, D.; Huang, S. Degradation mechanisms of proton exchange membrane fuel cell under typical automotive operating conditions. Prog. Energy Combust. Sci. 2020, 80, 100859. [Google Scholar] [CrossRef]
- Song, K.; Chen, H.; Wen, P.; Zhang, T.; Zhang, B.; Zhang, T. A comprehensive evaluation framework to evaluate energy management strategies of fuel cell electric vehicles. Electrochim. Acta 2018, 292, 960–973. [Google Scholar] [CrossRef]
- Lin, X.; Sun, D.; Qin, D.; Yin, Y. Development of Power-balancing Global Optimization Control Strategy for a Series—Parallel Hybrid Electric City Bus. China Mech. Eng. 2011, 22, 2259–2263. [Google Scholar]
- Xie, C.; Ogden, J.; Quan, S.; Chen, Q. Optimal power management for fuel cell-battery full hybrid powertrain on a test station. Int. J. Electr. Power Energy Syst. 2013, 53, 307–320. [Google Scholar] [CrossRef]
- Lin, W.-M.; Tu, C.-S.; Tsai, M.-T. Energy Management Strategy for Microgrids by Using Enhanced Bee Colony Optimization. Energies 2016, 9, 5. [Google Scholar] [CrossRef] [Green Version]
- Hosseinazadeh, M.; Salmasi, R. Robust Optimal Power Management System for a Hybrid AC/DC Micro-Grid. IEEE Trans. Sustain. Energy 2015, 6, 1–13. [Google Scholar] [CrossRef]
- Peng, J.; He, H.; Xiong, R. Rule based energy management strategy for a series–parallel plug-in hybrid electric bus optimized by dynamic programming. Appl. Energy 2017, 185, 1633–1643. [Google Scholar] [CrossRef]
- Zou, Y.; Hou, S.; Han, E.; Liu, L.; Chen, R. Dynamic Programming-based Energy Management Strategy Optimization for Hybrid Electric Commercial Vehicle. Automot. Eng. 2012, 34, 663–668. [Google Scholar] [CrossRef]
- Liu, C.; Wang, Y.; Wang, L.; Chen, Z. Load-adaptive real-time energy management strategy for battery/ultracapacitor hybrid energy storage system using dynamic programming optimization. J. Power Sources 2019, 438, 227024. [Google Scholar] [CrossRef]
Figure 1.
Structure of the fuel cell hybrid electric vehicle powertrain system.

Figure 2.
Motor-efficiency map.

Figure 3.
Current, voltage and power curves of the fuel cell system.

Figure 4.
The power consumption curve of the air compressor.

Figure 5.
Fuel cell system efficiency.

Figure 6.
Open circuit voltage of the battery.

Figure 7.
Flowchart of rule-based control strategy in vehicle operation mode.

Figure 8.
Flowchart of rule-based control strategy in idle mode.

Figure 9.
Flowchart of rule-based control strategy in running mode.

Figure 10.
Flowchart of rule-based control strategy in braking mode.

Figure 11.
Output power of the fuel cell system and vehicle power demand on the WLTC drive cycle.

Figure 12.
The power allocation ratio, under different initial SOC values: (a) initial SOC value is 0.8; (b) initial SOC value is 0.6; (c) initial SOC value is 0.4.
Figure 12.
The power allocation ratio, under different initial SOC values: (a) initial SOC value is 0.8; (b) initial SOC value is 0.6; (c) initial SOC value is 0.4.

Figure 13.
Power allocation with rule-based strategy.

Figure 14.
Rule-based power allocation with large load-change condition.

Figure 15.
Power allocation with DP-based strategy.


Figure 16.
The changing trend of SOC.

Figure 17.
The fuel cell system output power before and after improvement.

Figure 18.
Change trend of SOC before and after improvement.

Figure 19.
Variation in SOC under different values.

Figure 20.
The equivalent 100 km hydrogen consumption under different initial SOC values.


Table 1.
Parameters of the fuel cell hybrid electric vehicle.
| Component | Parameter | Value |
|---|---|---|
| Vehicle | Vehicle weight/kg | 1625 |
| Wheel radius/m | 0.316 | |
| Frontal area/m2 | 2.711 | |
| Coefficient of air resistance | 0.31 | |
| Coefficient of rolling resistance | 0.009 | |
| Final drive ratio | 6.52 | |
| Fuel cell system | Effective area of cell/cm2 | 280 |
| Number of cells | 300 | |
| Rated power/kW | 62 | |
| Maximal power/kW | 80 | |
| DC/DC converter | Efficiency | 0.97 |
| Battery | Capacity/Ah | 12 |
| Rated voltage/V | 384 | |
| Allowed range of state of charge (SOC)/% | 10–95 | |
| Motor | Maximal power/kW | 100 |
| Rated/maximal speed/rpm | 3200/8000 | |
| Maximal torque/Nm | 256 |
Table 2.
Performance comparison between rule- and DP-based strategies.
| Rule-Based | DP-Based | |
|---|---|---|
| Total hydrogen consumption | 320.2 g | 278.7 g |
| Fluctuation of SOC | ||
| Output power variation range | ||
| Start and stop times | 1 | 1 |
| Output power change rate of FCS | ||
| Number of large load change | 0 | 103 |
Table 3.
The equivalent 100 km hydrogen consumption (g/100 km) under different driving cycles.
| Driving Cycles | WLTC | UDDS | NEDC | FTP75 | JC08 | NYCC | FTP75 | |
|---|---|---|---|---|---|---|---|---|
| EMS | ||||||||
| DP-based | 1198 | 896 | 956 | 913 | 862 | 1268 | 1122 | |
| Rule-based | 1377 | 1160 | 1047 | 1201 | 1009 | 1481 | 1219 | |
| Improved Rule | 1288 | 1126 | 1000 | 1155 | 966 | 1443 | 1180 | |
| Percent fuel economy improvement | 6.46% | 2.93% | 4.49% | 3.83% | 4.26% | 2.57% | 3.2% | |
Publisher’s Note: MDPI stays neutral with regard to jurisdictional claims in published maps and institutional affiliations. |
© 2022 by the authors. Licensee MDPI, Basel, Switzerland. This article is an open access article distributed under the terms and conditions of the Creative Commons Attribution (CC BY) license (https://creativecommons.org/licenses/by/4.0/).
Share and Cite
MDPI and ACS Style
Du, C.; Huang, S.; Jiang, Y.; Wu, D.; Li, Y. Optimization of Energy Management Strategy for Fuel Cell Hybrid Electric Vehicles Based on Dynamic Programming. Energies 2022, 15, 4325. https://0-doi-org.brum.beds.ac.uk/10.3390/en15124325
AMA Style
Du C, Huang S, Jiang Y, Wu D, Li Y. Optimization of Energy Management Strategy for Fuel Cell Hybrid Electric Vehicles Based on Dynamic Programming. Energies. 2022; 15(12):4325. https://0-doi-org.brum.beds.ac.uk/10.3390/en15124325
Chicago/Turabian StyleDu, Changqing, Shiyang Huang, Yuyao Jiang, Dongmei Wu, and Yang Li. 2022. "Optimization of Energy Management Strategy for Fuel Cell Hybrid Electric Vehicles Based on Dynamic Programming" Energies 15, no. 12: 4325. https://0-doi-org.brum.beds.ac.uk/10.3390/en15124325
Note that from the first issue of 2016, this journal uses article numbers instead of page numbers. See further details here.