1. Introduction
With the recent developments of electric transportation systems all around the world, it is expected that the number of passenger electric vehicles (EVs) will increase from 3 million in 2020 to 66 million by 2040 [
1]. In the next 20 years, EVs will represent more than two thirds of all new vehicle sales globally [
1]. Considering the fact that Li-ion batteries (LiBs) are the main energy storage technology supporting EVs, a massive growth in battery production is expected. The United Kingdom alone is expecting a growth of installed battery capacity from about 5 GWh in 2020 to 140 GWh in 2040 [
2]. In mind of such an overview, exploring new material and designs is a key requirement in the production of LiB cells with desired energy density, durability, and costs. A comprehensive understanding of the relationship between the characteristics of the electrodes (cathode and anode) and the cells’ electrochemical performance over a complete range of load-cycles and environmental conditions is necessary for a successful design but very hard to achieve [
3]. This is due to the large number of electrode-related factors and control variables that have strong interdependencies with each other and with the performance indices of the cells [
4,
5,
6,
7,
8]. The electrode characteristics at the microstructure level are the most decisive for the cell performance [
9], and stability [
10], where the microstructure here is referring to stochastic geometrical characteristics at the micrometre and sub-micrometre scales [
11]. Correlating the heterogeneity of the microstructure and the cell characteristics has been attempted via several numerical methods [
12,
13,
14,
15]. Deliberately, considering an individual sample of electrode, ref. [
12] develops a computational model based on microstructure of LiB electrodes for predicting the temporal and spatial variation of Li concentration. Microstructural modelling is performed in [
13], where the electrochemical properties of batteries are determined. A finite element approach is utilised in [
14] to elucidate the mechanisms of the stress generation during the charge of the LiB cells. The impact of electrode microstructure on the lithium plating is studied via transport models in [
15].
Reducing the high cost and time associated with these numerical exploration approaches such as those listed above has been the main motivation for their replacement with systemic and computationally efficient methods supported by advanced data science and modelling techniques [
11]. In the general context of LiB design, the data-oriented prediction of microstructure properties can support the discovery of new materials, structures, and synthesis processes. A model-based analysis of a material microstructure in correlation with its characteristics has four main steps.
The microstructure imaging and presentation. At this step, the microstructure characteristics are captured via high resolution imaging equipment. The imaging technologies can be used for 2D or 3D characterisation.
Microstructure digitalisation or reconstruction, where the images are converted to processable data format in a software. At this step, the image segmentation is performed to distinguish the different materials and regions within the microstructure, such as active material particles, carbon binder domain, and pores. The segmentation of the images helps to increase the interpretability of the images to the data-processing software. The digitised microstructure images usually take the form of a numerical data set that can be visualised in the form of digital equivalents of the original images. The digitised images and data can then be used for statistical analysis or modelling activities.
Modelling, where the relationship between the digital microstructure characteristics and the material properties and performance is represented via analytical or data-driven methods. Such models can be forward, from material features to microstructure or backward from microstructure features to the material characteristics.
Analysis of the models and variable interdependencies, where the models developed in step 3 can be used to further explain the material properties and accelerate the design and generation of new microstructures.
Considering the four main steps listed above and by taking advantage of the information obtained from the microstructure of material through imaging techniques, some studies have addressed the microstructure digitalisation and model-based analysis and design. In [
16,
17], generative adversarial networks (GANs) [
18] are created to reconstruct a selection of different microstructures, but their applications in computational material design are unexplored. In [
3], a deep adversarial learning methodology is proposed based on GANs to reconstruct general microstructure images and learn the mapping between the features extracted from the images and the material microstructure. This particular methodology has been tested on a synthetic microstructure dataset. In [
19], variational autoencoders are trained with synthetic dual phase steel microstructures to overcome the difficulty of material design with usual dimension reduction methods, such as principal component analysis. Convolutional deep belief networks are proposed in [
20] to automate a two-directional conversion between microstructures and their low-dimensional feature representations and achieve a 1000-fold dimension reduction for titanium alloys preserving the prediction capability. In [
21], the GANS are trained to generate 3D image data from 2D slices of images. A combination of deep convolutional generative adversarial network and convolutional neural network is proposed in [
22] to regenerate two-phase microstructures and relate them to material properties.
The studies mentioned above, although very informative, rarely address an energy material application, including the LiB cells or electrodes which makes it hard to tailor and apply the methodologies to this specific problem. In fact, only a handful of studies has been dedicated to techniques for studying the LiB battery properties all the way from particle scale [
23,
24] to cell [
25,
26]. A comprehensive review of the microscopic imaging techniques for LiB cells is given in [
11]. The techniques are based on X-rays, electron neutrons, and ion beams, as well as various wavelengths of light to explore the microstructures across different length sales. One of the common instrumentations for representing the microstructures is X-ray tomography, which has progressed significantly in the past decade [
11,
27]. In [
28], a novel method assisted by X-ray nano-computed tomography method is developed for LiB microstructures where cells’ performance is simulated via physics-based models for each individual sample.
Considering the limited number of studies mentioned above, it is evident that the systematic analysis of LiB microstructures and correlation of their features with the electrode and battery characteristics have not been fully addressed yet. Considering this underpinning scientific gap, the goal of this study is to investigate if
This study is among the very first that attempts to provide a proof of concept for a methodology and a framework for data-driven and systematic material investigation for LiBs. This methodology is based on deep learning. While there exists a large number of papers using the strength of machine learning and deep learning models for the analysis of cell characteristics, such as state of health [
29,
30], safety [
31], and life [
32,
33] at the macro scale, there is a limited number of particularly focused works at the material scale of LIBs, which distinguishes the current work.
The proposed methodology here is dedicated to reconstructing the microstructures based on a deep learning network of autoencoder-decoders. The autoencoder (AE) helps to learn the relationship between the microstructures of LiB and the hidden features of it which are called the “latent features”. These latent features act as design variables and inputs for reconstruction of the microstructure and eventually have the potential to be considered as control variables for LiB electrode design. The validity and performance of this framework have been tested on the NREL open data set [
34]. A block diagram of the proposed methodology is shown in
Figure 1.
This study provides the full details of a suitable model for reconstruction of the images and their feature extraction, the details of the network to be trained, the validation methodology, and a framework to prepare the data for model-based analysis. During this study, different models are created considering three main case studies which address different approaches in pre-processing the microstructure image data in order to prepare a larger data set for training and validation. They also consider the two cases of calendered and uncalendered electrode samples. The results confirm that the created models can perform well in the reconstruction of the images. They also highlight the impact of the data size on the performance of the models.
This proposed framework and the methodology are believed to be able to represent the microstructures of Li-ion electrodes and be utilised for its electrochemical and structural property prediction. It helps to reduce the microstructure information dimension while preserving its characteristics for prediction purposes. It is fully scalable from one microstructure to another and has the potential to be utilised for the microstructure optimisation of future LiB electrodes where the latent features are offered as design variables.
This paper is structured as follows. In
Section 2, the dataset details are summarised, and the model configuration and reconstruction methodology are introduced.
Section 3 includes main feature extraction and reconstruction results for various case studies.
Section 4 terminates the paper with the conclusions and future works.
2. Dataset and Model
The images used for proving the concept of this study are from [
34]. The data set is valid for the problem under investigation as it includes samples of electrodes obtained at various cycling conditions with the same configuration and resolution preferred for LiB design and cell electrochemical evaluation. The images are obtained via X-ray tomography. Because the X-ray tomography is not able to distinguish the pores in the microstructure from carbon binder domain (CBD), the images need to be processed by a physics-based approach [
35], to separate the two domains computationally. This separation is important to achieve a microstructure image with clear boundaries in between different particles for an efficient feature extraction and reconstruction. The dataset includes both cathode and anode samples. In total, there are 7 cathode and 7 anode samples. For this study, only cathode samples have been utilised as the cathode is subject to more challenges in the design process of LiB cells [
36]. Cathode samples are based on Li(Ni0.5Mn0.3Co0.2)O
2, (NMC532), and for their associated half-cells, the lithium foils with 99.9% purity have been used for the anode. The active material loading of samples is between 2.05 and 8.27 mAh/cm
2, the porosity is between 34% and 52%, thickness is between 34 and 205 um, and the experimental C-rate (half-cell gravimetric capacity) is between 178 and 365 mAh/g. To cover various porosity and tortuosity values, samples have been evaluated both before and after calendering processes, and both sets have been used for modelling activities in this study. Hereafter, they are referred to as CAL and UNCAL samples.
The dataset details are summarised in the
Table 1, highlighting all pertinent data. The detailed step-by-step process of segmenting the images is described via the physics-based approach of [
35], as described in [
37]. Two different approaches for the segmentations are available for each sample, one where pore and carbon binder domain are distinctive and generated via the application of Otsu’s algorithm [
38], and one where the two domains are considered together via a manual segmentation approach via a global threshold. This study has been based on the first set of segmented microstructure images for a more comprehensive conclusion where the pores and carbon binder domain are distinguished, as shown in
Figure 2. It is worth mentioning that all of the microstructure samples are of the same voxel size of 398 × 398 × 398 nm
3.
Based on the segmented images, the Tau factor has been calculated for all samples via the Tau Factor open-source toolbox in MATLAB [
39]. It is beyond the scope of the paper to describe in detail the operation of the Tau Factor application. Further information can be found in [
39,
40] for reference. Further details regarding the chemistry, material ratios in the cathode, fabrication method, and segmentation of the dataset can be found in [
37].
2.1. Model: The Convolutional Auto-Encoder-Decoder
An auto-encoder is a neural network (NN) with the capability of compressing the knowledge representation of input data, i.e., representation learning [
41,
42]. The AE extracts non-linear relationships between the input features using lower dimensional hidden layers, as shown in
Figure 3. If the input features are independent of one another, compressing and reconstructing the input features will be a difficult task. The compressed low-dimensional feature space is known as the “bottleneck” of the AE. The “bottleneck” can be made up of fully connected neurons, as shown in
Figure 3, where all nodes are connected to each other or can be a partly connected network when only some of the nodes are connected to the others. An AE is represented using the following Equation (1).
where
E is the encoder,
F is the bottleneck with latent features, and
D is the decoder.
The AE is trained by minimising the reconstruction error (
E,
D), i.e., the difference between the input data and their reconstructed output. In terms of weights and biases for neural networks, the AE can be represented by Equation (2).
where
z is the latent dimension from the input layer of the neural network with
w weights and
b biases and
x′ is the output layer of the neural network with
w′ weights and
b′ biases.
L (
x,
x′) is the reconstruction error between the input data
x and its reconstructed data
x′.
For image representation, learning, and dimensionality reduction, AEs are adapted to convolutional auto-encoders (CAEs) [
43] by adding convolutional layers to extract discriminative spatial features from images and compress the spatial features into low dimensional latent features, as shown in
Figure 4. The latent features capture the non-linear relationships between the spatial features. If there exist spatial patterns in the input images, compressing and reconstructing the images will be possible.
CAEs and GANs [
18] have been shown to be efficient with great generalisation capabilities in image compression, i.e., they can easily adapt to new media content and formats [
44,
45]. However, CAEs are better than GANs for feature extraction due to their compact nature, i.e., “bottleneck”, while GANs are better for the quality reconstruction and compression of images. Therefore, CAEs have been preferred in this study to extract compact features (i.e., latent features) from high dimensional electrode microstructures for the potential prediction of their electrochemical properties.
As the CAE schematic shows (
Figure 4), the encoder is a multi-layer convolutional network. It is made up of
N 2D/3D convolutional layers. The convolution operation in the convolutional layers is performed by 2D
i × i filters (also known as kernels) in 2D convolutions or by 3D
j × i × i filters in 3D convolutions, where
i refers to the dimension of the filter. The filters slide through the images and perform mathematical computations on the pixels of the images, as shown in
Figure 5.
As an example, for the first convolution operation of the 3
× 3 kernel (i.e., ((1, 1, 1), (0, 0, 0), [1, 1, 1))) on the 3
× 3 image segment with pixel values ((0, 0, 0), (0, 10, 10), (0, 15, 30)), the computed pixel is obtained via Equation (3).
The values of the filters are initialised randomly at the beginning of the training process and optimised during training for minimising the reconstruction error. The filters help to capture various spatial patterns (so-called features in here) in an image, such as the edges, shapes, and intensity in pixels. The amount of sideward and downward shifts of the kernels (i.e., kernels sliding through the image) is determined by the stride value. As demonstrated n
Figure 5, a stride of 2 has been used in the model of this study in order to obtain a 3 × 3 feature map. After obtaining feature maps, the maps go through an activation layer to transform the values to more computationally efficient values. A commonly used activation function is rectified linear unit (ReLU) [
46], which converts all negative values to zero and maintains all positive values. By deactivating all values less than zero, the computation of derivatives is faster. After the feature mapping stage, the output feature maps from the convolutional layers in the encoder are flattened, concatenated, and passed to the “bottleneck” layers.
The decoding process is a mirror to the encoding process, as shown in
Figure 4. The output layer of the “bottleneck” is transformed to feature maps and sent to the
N 2D/3D transposed convolutional layers to reconstruct the image. Again, the different transposed convolutional layers are separated by activation layers to speed up the training process.
2.2. Evaluation of the Model Performance
For performance evaluation, the mean squared error (MSE) metric [
47], which is the average error between the original and reconstructed images, has been utilised here. MSE is a commonly used computational performance evaluation metric for regression and reconstruction analysis. MSE is a measure of how close a fitted plane is to actual data points and is calculated via Equation (4), where
P is predicted values and
A is actual values.
N is the total number of observations in the image set.
After calculating the MSE, it is necessary to find the statistical difference between the training MSE and validation MSE to further evaluate the performance of the model with new or unseen microstructures. This statistical test (i.e., the difference between training and validation MSEs) verifies if the model overfits or underfits on the training data and ensures model generalisation. While the MSE can act as a metric for the model’s performance, the significance analysis, with a prescribed significance threshold [
48], acts as a measure to show if the performance is good enough. It is also necessary for comparing different models. Generally, if the training MSE is statistically different from the validation MSE, i.e.,
p-value [
48] less than a significance level of α, this means the model either underfits or overfits on the training data. It is important to note that the significance level/threshold is set by the domain expert. The significance level is a measure of how strong the sample evidence must be to conclude that the results are statistically significant. In this study, the significance level has been set to α = 0.05, which means 1 out of 20 times the hypothesis, which is a significant relation between the training and validation performance, will be wrong or occurred by chance. For better understanding the quality of the reconstructed images, not only the statistical difference between the training and validation performance, but also the statistical difference between the original and reconstructed microstructures needs to be calculated. For this purpose, and for the sake of simplicity, a random microstructure is first selected from the validation dataset and the means and standard deviations of the image pixels in the microstructure before and after reconstruction are computed. Later, the means, standard deviations, and number of pixels are used to find the associated
p-values. In this context, a
p-value less than 0.05 means that the original microstructure is statistically different from the reconstructed microstructure.
3. Main Results
In this section, we describe the experimental design and results of three case studies of CAEs in extracting latent features and microstructure reconstruction for the prediction of battery electrochemical characteristics. Case studies 1 and 2 demonstrate different ways of increasing the number of cathode calendered microstructures for training CAEs by transforming the small dataset of 3D microstructures to a larger dataset of mini 3D microstructures. Meanwhile, case study 3 demonstrates the effectiveness of further increasing the dataset of mini microstructures for training CAEs by adding more diverse mini microstructures, i.e., uncalendered cathode microstructures.
For all the models implemented in the case studies, 10 latent features were considered as a reasonable feature set for state-of-the-art machine learning models’ interpretability and performance. In addition, it is a reasonable choice for balancing the accuracy and computational complexity of the CAEs. The number of latent features can be changed according to the requirements of the designer or the processor without loss of generality.
All experiments have used the Adam optimiser [
49], which is a variant of stochastic gradient descent, and were executed on a graphics processing unit (GPU) using four CPU cores and 6 GB RAM. All codes were implemented in the PyTorch programming language. Beside the model details, this section also describes the hyper-parameter configurations of the CAE architectures and the evaluation protocol.
In what follows, three case studies are given for the development of models based on the available data. While the first two are dedicated to only calendered images, the thirst case study is related to a mixture of calendered and uncalendered images.
The first two case studies concern the impact of data pre-processing on the model’s performance. Due to the relatively small number of cathode electrodes, i.e., four microstructures for calendered electrodes, it is difficult to exploit the discriminative power of deep convolutional layers to learn the spatial information contained in the electrodes. As a result, a data pre-processing approach has been taken in order to transform the 3D cathode microstructures to multiple 3D mini microstructures to increase the number of data samples. For this purpose, each microstructure block is decomposed to a smaller block, called mini microstructures. Each mini microstructure is obtained by selecting a prescribed number of image slices with a specific stride. This pre-processing is an important step in the proposed methodology for image-based modelling of this study.
3.1. Case Study 1: Calendered, 3D Mini Microstructures Created with Stride = 1
In the first case study, 3D sliding windows with different lengths and a stride of 1 are explored to create the new dataset of 3D mini microstructures.
Figure 6 shows an example of three mini microstructures extracted from an electrode using a 3D sliding window with length = 6 and a stride of 1. The selected sliding window lengths are given in
Table 2.
By using a sliding window of length =
l, i.e., the number of image slices, and a stride = 1, the microstructures are transformed to a new database of 3D mini microstructures. Then, the 3D mini microstructures in the new database are randomly selected to create a training dataset (85% of all mini microstructures) and validation dataset (15% of all mini microstructures). Here, three variations of 3D CAEs (with three, four, and five convolutional layers, respectively) are created with different hyper-parameters through minimising the MSE between the actual microstructures in the training dataset and their reconstructed microstructures. The hyper-parameters are listed in
Table 2. In this table, the learning rate controls how frequent the model weights are updated with respect to the training error. Moreover, the batch size defines the number of mini microstructures to go through a forward pass before updating the model’s parameters. The number of times all the data are passed to the model to update its parameters is referred to as the number of epochs. The number of hidden neurons is the number of neurons in the hidden layer of the fully connected layer.
After every epoch, the trained models are evaluated using the validation dataset. The model that produces the lowest validation reconstruction error (i.e., validation MSE) is saved for production. The following hyper-parameters were found to produce the lowest validation error for calendered images with a stride of 1: number of convolutional layers = 3, sliding window length = 24 images, number of hidden neurons = 128, number of epochs = 3500, batch size = 2, and learning rate = 0.0001.
Table 3 presents a summary of the structure of the 3D CAE for calendered images with three convolutional layers, a sliding window length of 24, and 128 hidden neurons.
Table 3 presents the output shape of the feature maps and the total number of trainable model parameters at each convolutional layer and fully connected layer. Output shapes assume that the input to the encoder is 24 × 224 × 224 (I.e., length × width × height) and input to the decoder is 10 × 1 latent features. Moreover, the encoder has a total of 1.55 million trainable parameters, with a total size of 64.6 MB, while the decoder has 1.56 million trainable parameters, with a total size of 69.2 MB.
A sliding window length of 24 and a stride of 1 lead to a database of 578 3D mini microstructures with dimensions 24 × 224 × 224. The database is split into 491 mini microstructures for training and 87 for validating the model. The training MSE is 0.111 (standard deviation = 0.01) and the validation MSE is 0.110 (standard deviation = 0.005). The training MSE was found to be not statistically different from the validation MSE with a p-value of 0.362, meaning the CAE does not overfit or underfit on the training dataset. However, the performance of the model needs further improvement, as observed by the statistical difference between the means of the original (mean = −0.216, std = 0.467) and reconstructed microstructures (mean = −0.202, std = 0.576) with a p-value < 0.0001.
Figure 7 shows a sample 3D mini microstructure as a sequence of image slices and its reconstructed microstructure. Even though the reconstructed microstructure is visually like the original microstructure, the model still requires further optimisation to obtain a statistically similar reconstructed microstructure.
The visually acceptable reconstruction performance shows the potential of 3D CAE for dimensionality reduction of 3D mini microstructures into non-linear latent features. It is worth noting that this obtained performance is related to a stride of 1, which creates similar neighbouring mini microstructures. The repetition of image slides in different microstructures causes the model to overfit on the training and validation data sets. An ideal scenario will be a stride equal to the length of the sliding window to prevent any repetition of image slices in microstructures, and this is discussed in the next case study.
3.2. Case Study 2: Calendered, 3D Mini Microstructures Created with Stride = Sliding Window Length
Here, the performance of CAE on a database of 3D mini microstructures created using a stride equal to the length of the sliding window has been evaluated.
Figure 8 shows an example of two mini microstructures extracted via this approach. It can be observed that the mini microstructures do not have any repetition of image slices.
Similar to the experiments of case study 1, three variations of 3D CAEs are trained (which have three, four, and five convolutional layers respectively) with the different hyper-parameter values in
Table 2, by minimising the mean squared error between the actual microstructures in the training dataset and their reconstructed microstructures. The hyper-parameters that have produced the lowest validation error with a stride equal to the length of sliding window include number of convolutional layers = 3, sliding window length = 4 images, number of hidden neurons = 128, number of epochs = 3500, batch size = 8 and learning rate = 0.0001.
Table 4 presents a summary of the structure of the 3D CAE with three convolutional layers, the sliding window length of 4 and 128 hidden neurons. It also shows the output shape of feature maps and number of trainable model parameters at each convolutional layer and fully connected layers. Output shapes assume that the input to the encoder is 4 × 224 × 224 (I.e., length × width × height) and input to the decoder is 10 × 1 of latent features. The encoder model has a total of 1.50 million trainable parameters, with a total size of 15.7 MB and the decoder model has 1.51 million trainable parameters, with a total size of 16.5 MB.
Using a sliding window length of 4 and stride equal to the sliding window length produces a database of 150 3D mini microstructures with dimensions 4 × 224 × 224. The database is split into 127 mini microstructures for training and 23 for validating the model (85 to 15% of training and validation split). The training MSE is 0.100 (standard deviation = 0.015) and the validation MSE is 0.240 (standard deviation = 0.036). The training and validation MSEs produced by the CAE with stride equal to sliding window length are statistically different (p-value < 0.0001). This means that the trained CAE cannot generalise well to microstructures with comparable electrochemical and physical properties as the validation mini microstructures.
Figure 9 shows a sample 3D mini microstructure as a sequence of image slices and its reconstructed microstructure. It is obvious that the CAE does not perform as well as case study 2 in reconstructing the microstructures and the mean of a randomly selected microstructure. The results show that the (mean = −0.223, std = 0.588) is statistically different from the mean of its reconstructed microstructure (mean = −0.155, std = 0.320) with a
p-value < 0.0001. This is due to the small dataset (only 127 microstructures) created with a stride = sliding window length that causes the model to underfit on the training data. Therefore, creating microstructures with identical image slices prevents overfitting but requires a large dataset (greater than 500 training microstructures according to the finding from case study 1) to accurately train the model.
According to the obtained results and the ability of the models to reconstruct images for case study 1 and its limited performance for case study 2, it is believed that the model performance is highly dependent on the size of the data set and therefore increasing the size of data set has a positive impact on the model performance.
In the next section, this hypothesis is tested by combining the calendered and uncalendered cathode microstructures to train and validate a 3D CAE.
3.3. Case Study 3: Calendered and Uncalendered 3D Mini Microstructures
In the two previous experiments, it was found that by using a stride equal to the sliding window length (case study 2), a smaller database of 3D mini microstructures is created compared to case study 1, which is insufficient to extract the spatial discriminative features (latent features) for reconstructing the microstructures. This implies that, in this case, the CAE underfits the training dataset. On the contrary, by using a stride of 1 (case study 1), the model trains well, but still does not lead to statistically acceptable reconstruction performance. Therefore, in this section, we increase the size of the dataset for training and validation by including both calendered and uncalendered cathode microstructure images. The hypothesis is that by increasing the training and validation datasets, the performance of the CAE may improve. Testing this hypothesis is important in order to guide the future research of CAE in extracting design variables for predicting lithium battery electrochemical characteristics.
By adding the three uncalendered microstructures with electrochemical characteristics described in
Table 1, the number of full electrode microstructures increases to 7.
Table 5 shows the optimal hyper-parameter configuration when the CAEs are trained and evaluated with the list of hyper-parameters given in
Table 2 for stride = 1 and different sliding window lengths.
Table 6 shows the average training and validation errors as well as the
p-values for significant difference between the original microstructures and reconstructed microstructures.
Table 7 shows statistical significance analysis results between an original and reconstructed microstructure.
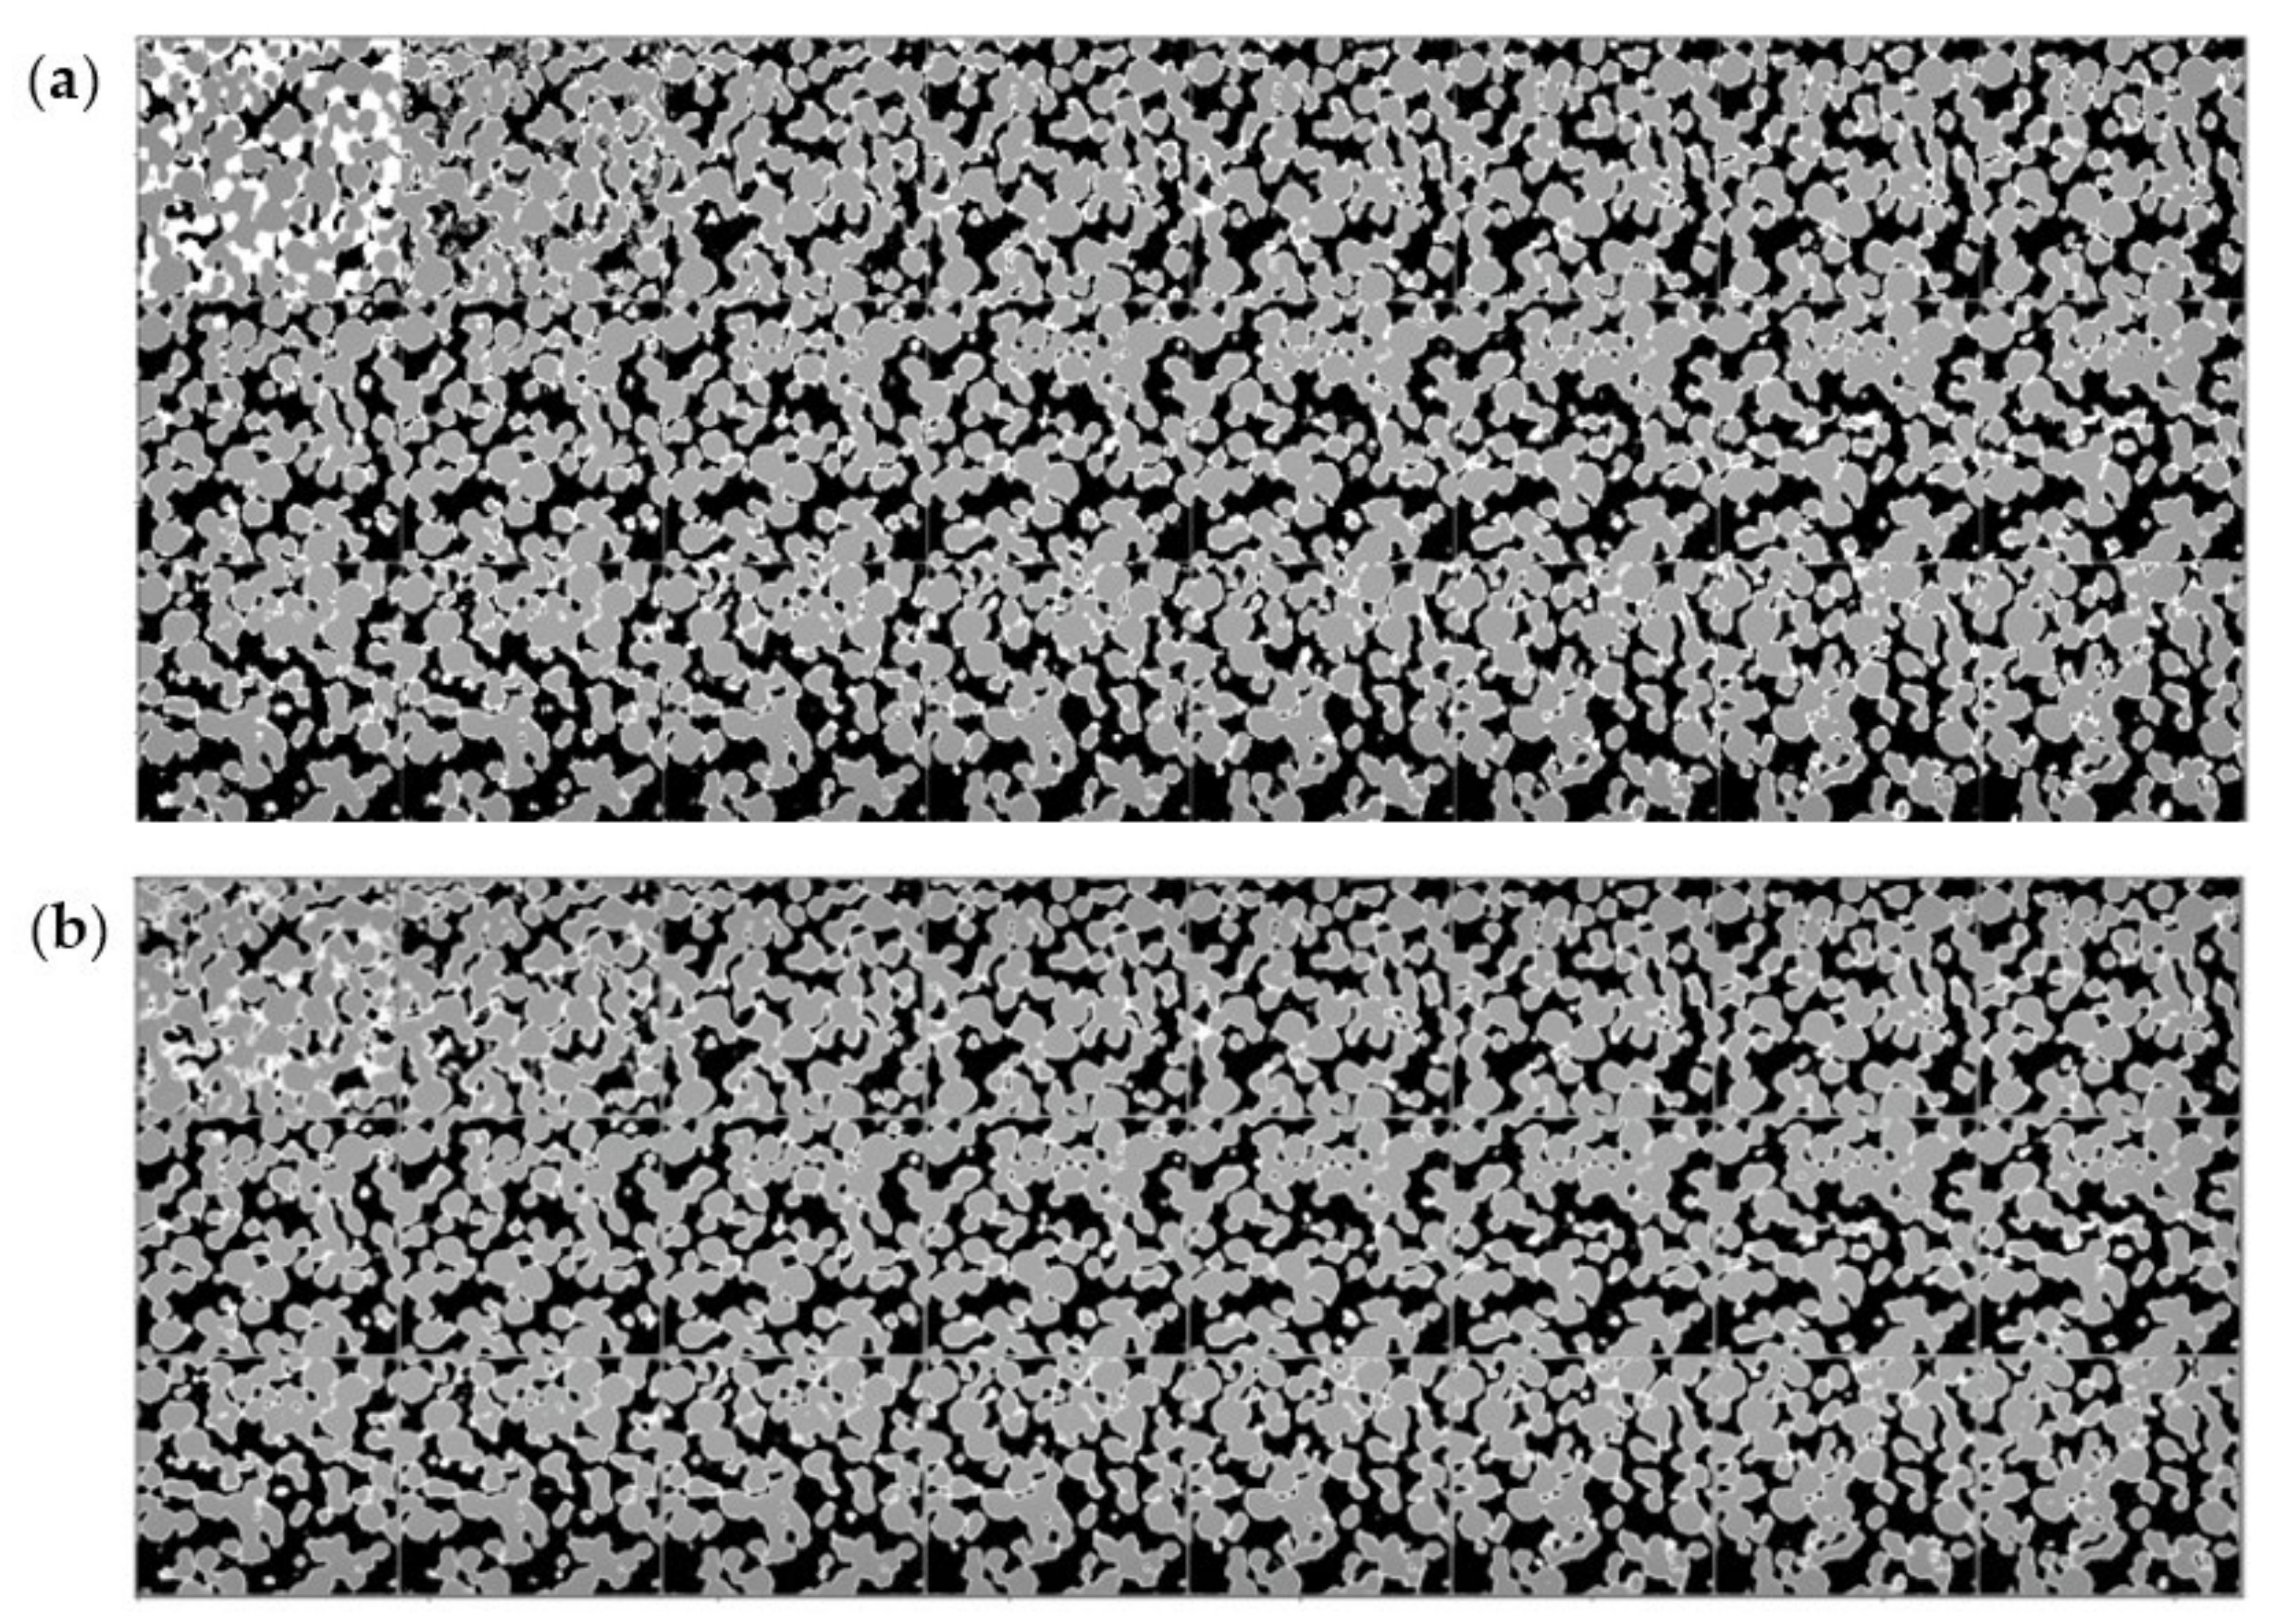
The original and reconstructed microstructures in
Figure 10, obtained from the CAE using calendered and uncalendered microstructures and a stride = 1, show very good reconstruction performance with low training and validation errors (i.e., 0.068 and 0.071, respectively), which are not statistically different with a
p-value of 0.095. The reconstructed microstructure is like the original microstructure with no statistical difference between their means (
p-value = 0.4730). Therefore, it can be concluded that adding more microstructures (from 578 to 1449 microstructures) has improved the performance of 3D CAE in extracting representative latent features and reconstructing the microstructures.
It is worth noting that there is still a difference between the training and validation MSEs (i.e., 0.083 and 0.240 respectively) produced by the CAE with stride = sliding window length (i.e., no identical image slices in the microstructure), even when we combine the calendered and uncalendered cathode microstructures, as observed by the p-value < 0.0001, meaning the CAE still underfits on the training set.
In addition, the difference between the means of original and reconstructed microstructures is still statistically significant, as shown in
Table 7 (
p-value < 0.0001). However, visualizing the reconstructed microstructure from the CAE trained on calendered plus uncalendered microstructures, as shown in
Figure 11, a better reconstruction performance is obtained compared to the reconstructed microstructure obtained by only utilizing the calendered microstructures (case study 2). Therefore, the performance of CAE with a stride = sliding window length shows an improvement when we add the uncalendered microstructure, but it is still not statistically significant due to the small training set (only 294 microstructures in the training dataset).
In order to summarise the findings from the three case studies,
Table 8 is presented. As shown, for the first case study in which only calendered mini microstructures are considered, the training and validation MSEs are not statistically different as the
p-value is high (greater than 0.05). Therefore, the model has not overfitted nor underfitted on the training dataset. However, the reconstructed images are statistically different from the original images, indicated by
p < 0.0001. A stride equal to sliding window length, to avoid the repetition of the images in the sequences and create mini microstructures that are more realistic, is addressed in case study 2. Results show that the training and validation MSEs are statistically different, and the reconstructed images are statistically different from the original images. Clearly, the reduction in performance in case study 2 is caused by the reduction in the training dataset from 491 in case study 1 to 127 in case study 2, implying that a larger dataset is necessary for improving the model performance. By increasing the volume of data in case study 3 (i.e., combining calendered and uncalendered microstructures), the training and validation MSEs both improve compared to previous case studies. In addition, with a stride of 1 (which led to 1159 mini microstructures), the reconstructed images are not statistically different from the original images. However, more data are still required to address a realistic scenario with a stride equal to sliding window length.
4. Conclusions and Future Works
This study proposes a deep learning architecture and a new methodology to extract low-dimensional features and reconstruct calendered and uncalendered microstructures of lithium-ion battery electrodes.
It starts with pre-processing the image slices (i.e., 3D microstructures) and transforms them into blocks of mini microstructures in order to increase the size of the data set for training the model. The models are auto encoders with convolutional layers that help to extract discriminative spatial features of the microstructures and the latent features. The paper reports the performance of different configurations of the model for various case studies. The model configuration is determined by optimising a set of hyper-parameters and the number of convolutional layers using the model’s performance on a validation data set.
During optimisation, increasing the number of convolutional layers, neurons, and number of filters increases the model’s ability to learn and reconstruct the images in the training dataset, but it will also increase the complexity of the network, which can lead to overfitting. To evaluate if the model is trained well, the statistical difference between the reconstruction error obtained from the training dataset and that from the validation set is utilised. The results show that the convolutional auto-encoders can be further optimised by including other computational layers, such as pooling layers (which reduces the number of trainable parameters and model complexity), batch normalization (which normalises the inputs for each mini-batch and stabilises the learning process), and regularisation (which reduces overfitting).
In summary, by employing a 3D sliding window with stride of 1 on the microstructures, a data set of size 578 is created, and the associated model can successfully reconstruct the image. This performance is less in the case with the stride equal to the length of the sliding window due to the limited size of the data set, which is only, 150. This finding led to the hypothesis that convolutional auto-encoders are suitable for the LiB reconstruction and feature extraction problems, and increasing the data set size will improve the model performance. This hypothesis was tested via a third case study and proven successfully. The reason that the case studies with a stride of 1 have a better performance than the stride of sliding window length is the presence of the repetitive image slices in the mini microstructures of the former, which may lead to an overfitting. However, the results with considerable reconstruction performance show the potential of 3D convolutional auto-encoders in extracting reliable latent features.
The accurate reconstruction of images as proposed in this study is equivalent to having highly representative latent features that can potentially act as control variables in the design of the microstructure or to predict the electrode characteristics. Accordingly, an important direction for future works, which is planned in anticipation of the availability of a large dataset, is to relate the latent features obtained from the microstructures to the electrochemical characteristics of the cells. In such a framework, the electrochemical features of cells, such as rated capacity, as well as the structural characteristics of the electrodes, such as tortuosity, volume fractions of different components, surface areas, and triple phase boundary densities, can be directly predicted from latent features of the images. Additionally, considering the fact that the subject of developing data-driven models from the microstructure images of electrodes is a rather new subject in the field of lithium-ion batteries, further works are also required in building the models using larger datasets. It is also necessary to extend the methodology and framework for handling the data and training the models to the anode microstructures. The anode has different characteristics, such as particle morphology, compared to the cathode and the reconstruction of the images and feature extraction are expected to present different challenges.


