Article

The Consistency of Yields and Chemical Composition of HTL Bio-Oils from Lignins Produced by Different Preprocessing Technologies

by
Hilde Vik Halleraker
1,
Konstantinos Kalogiannis
2,
Angelos Lappas
2,
Rafael C. A. Castro
3,
Ines C. Roberto
3,
Solange I. Mussatto
4 and
Tanja Barth
1,*
1
Department of Chemistry, University of Bergen, Allègaten 41, 5007 Bergen, Norway
2
Chemical Process and Energy Resources Institute (CPERI), Centre for Research and Technology Hellas (CERTH), 6th km Harilaou-Thermi Rd, 57001 Thessaloniki, Greece
3
Departmento de Biotecnologia Escola de Engenharia de Lorena, Universidade de São Paulo, Lorena 12602-810, SP, Brazil
4
Department of Biotechnology and Biomedicine, Technical University of Denmark, Søltofts Plads, Building 223, 2800 Kongens Lyngby, Denmark
*
Author to whom correspondence should be addressed.
Submission received: 10 May 2022 / Revised: 19 June 2022 / Accepted: 21 June 2022 / Published: 27 June 2022
(This article belongs to the Special Issue Bioenergy and Biobased Technologies to Support a Green Transition)

Abstract

:
This work evaluates the effect of feedstock type and composition on the conversion of lignin to liquid by solvolysis with formic acid as hydrogen donor (LtL), by analyzing the yields and molecular composition of the liquid products and interpreting them in terms of both the type and the preprocessing of the lignocellulosic biomass using chemometric data analysis. Lignin samples of different types and purities from softwood, hardwood, and grasses (rice straw and corn stover) have been converted to bio-oil, and the molecular composition analyzed and quantified using GC-MS. LtL solvolysis was found to be a robust method for lignin conversion in terms of converting all samples into bio-oils rich in phenolic compounds regardless of the purity of the lignin sample. The bio-oil yields ranged from 24–94 wt.% relative to lignin input and could be modelled well as a function of the elemental composition of the feedstock. On a molecular basis, the softwood-derived bio-oil contained the most guaiacol-derivatives, and syringol was correlated to hardwood. However, the connection between compounds in the bio-oil and lignin origin was less pronounced than the effects of the methods for biomass fractionation, showing that the pretreatment of the biomass dominates both the yield and molecular composition of the bio-oil and must be addressed as a primary concern when utilization of lignin in a biorefinery is planned.

1. Introduction

Production of biobased chemicals is attracting wide interest as a renewable alternative to fossil based products. Bio-refining of surplus lignocellulosic biomass and waste is a very promising approach, as it gives better utilization of feedstocks than single-product applications and increases the product value from a given feedstock. Lignin is a widely available but underutilized source of renewable aromatic compounds which at present is not widely exploited as a feedstock, but mostly burned for energy in, e.g., paper and pulp mills. In some cases it is used to produce value-added products such as binders, adhesives, dispersants, and emulsifiers [1]. However, lignin is also a potential source for chemicals such as benzene, phenol, guaiacol, and vanillic acid, which are all high-value chemicals that would contribute to the economic viability of lignocellulosic biorefineries [2,3,4,5,6,7,8]. In addition, there is a clear potential for production of molecules that are candidates for use as renewable monomers for plastics, typically to substitute terephthalic acid in polyesters like PET (polyethylene terephthalate) [9].
The chemical structure of the amorphous lignin polymer varies from species to species, and lignin from hardwood and lignin from softwood exhibit distinctive differences. Even lignin collected from different parts of the same tree can display considerable differences in molecular structure [10]. Conventionally, lignocellulosic biomass is divided into three main groups regarding the structure of lignin: softwood, hardwood, and grasses [1]. Based on this knowledge, it is reasonable to expect that the products from conversion of lignin to phenolic monomers will reflect the origin to some degree; for instance, that products from softwood would be dominated by guaiacyl-derived components, hardwood products would contain both guaiacyl (G)- and syringyl (S)-derived units, and grass-lignin would produce 4-hydroxyphenyl(H)-derived products. Van den Bosch et al. have documented such distributions during delignification with simultaneous solvolysis and catalytic hydrogenolysis under an H2 atmosphere at 250 °C [11]. Work performed by Galkin et al. [12] showed a correlation between wood-type and monomer yield (bio-oil) when the woody biomass was catalytically fractionated at 195 °C and 210 °C. They reported that softwood gave the lowest yields of monomers and that hardwood produced the highest monomer yields, and connected those findings with the frequency of β-O-4 moieties in the lignin [11]. Anderson et al. [13] studied the differences in the S/G ratio in natural poplar variants and concluded that the S/G ratio did not predict the monomer yields. However, most of these studies employ moderate temperature conditions that only give partial decomposition of the lignin structures. For solvolysis at a higher temperature, (360 °C), a study by performed by Gasson et al. suggests a biomass dependence on the distribution of specific compounds [14]. Other studies have shown reaction temperature to be a dominating variable in terms of molecular composition of the bio-oils from lignin decomposition [15]. Thus, there is no clear picture in the published literature on whether plant species or conversion conditions have the strongest influence on the monomer yields.
Another factor that should be considered is that the lignin that is available as a feedstock for biorefining has been separated from the other biomass constituents using a specific fractionation technology. The technology that has been used also influences the properties and chemical composition of the separated lignins or lignin-enriched fractions. The most commonly used fractionation technologies are briefly described below:
Kraft pulping is the most used delignification process in the world. Here, cellulose is separated from lignin and hemicellulose by adding a solution of sodium hydroxide and sodium sulfide to the wood chips, producing black liquor consisting of 29–45% lignin as a waste [16,17]. The process employs severe conditions with a strong base and temperature-driven reactions. The kraft lignin contains more C-C bonds than the original lignin and due to this factor it is expected to be more recalcitrant in thermochemical conversion to monomeric products than lignins produced by less severe methods [18].
Organosolv processing, on the other hand, is a pretreatment method that isolates cellulose, hemicellulose, and lignin in separate fractions, using the solubility of lignin in organic solvents at moderately increased temperatures to extract it from the carbohydrate polymers. It uses organic solvents with low boiling points to separate lignin, cellulose, and hemicellulose. Organosolv type processing can be combined with an oxidant (O2, O3, H2O2) [19]. The lignin-rich product stream can then be converted to bio-oil in a targeted way. Organosolv is a less severe treatment than the kraft process, and the extracted lignin has a chemical structure and molecular weight range that is considered to be representative for the native lignin [20].
Simultaneous saccharification and fermentation process (SSF): Kraft and organosolv processes recover lignins that are relatively pure and contain little residual carbohydrates. An alternative approach, which is used in many bio-ethanol production schemes, is to use the whole biomass as feedstock in a simultaneous saccharification and fermentation process (SSF), where mild pretreatment with dilute acids and enzymes enables carbohydrate depolymerization to sugars which are directly converted by fermentation to alcohols [21,22]. In such processing, the lignin remains in the solid residue after fermentation. Such lignin-rich residues mostly contain high levels of residual carbohydrates, enzyme residues and biomass from the fermentors, and thus provide a less well-defined feedstock for thermochemical conversion than lignins recovered before the fermentation step. The carbohydrate dissolution is not assumed to cause significant chemical changes in the lignin structure.
Wet oxidation and Milox: In yet another approach, oxidants are used for lignin recovery. The primary aim of Wet oxidation and Milox pulping is breaking the β-O-4 linkages in the lignin in oxidative processes providing low molecular weight lignin that is suitable for further conversion to monomers. However, reactions can also include lignin condensation, hydrolysis of lignin-carbohydrate complex structures and esters, and esterification of hydroxyl groups [19].
The different processes thus produce lignin fractions with different characteristics. The potential that such differences can influence the bio-oil composition in the further depolymerisation process therefore needs to be considered. To advance the development of bio-refinery applications, investigations showing the consequences of selecting specific conversion technologies must be available [23].
For lignin conversion to monomers, thermochemical processes are widely used, and a number of different approaches have been developed [24,25,26,27,28]. In this work, the procedure that is used is thermochemical conversion by solvolysis with formic acid as an added hydrogen donor, termed Lignin to Liquid (LtL), which has been under development for some years [29,30,31,32,33,34,35,36,37]. LtL-solvolysis is a one-pot depolymerization and hydrodeoxygenation process, which aims at lignin polymer conversion to a bio-oil that consists mostly of various simple phenolic compounds. Work on the conversion of some selected lignin types has already been presented, using lignin from eucalyptus, Norway spruce, birch, aspen, and Scots pine based on different types of carbohydrate hydrolysis and organosolv treatments. However, the effects of the different pre-processing technologies have not been systematically compared.
In this work, bio-oil from lignin produced from very different biomass types and preprocessing approaches are compared to explore how the lignin qualities obtained by the different fractionation processes influence the composition of the oil. This is a challenging objective, as the chemical complexity of the feedstocks prevents complete analysis, and the very high number of components in the bio-oil make direct comparison of the products difficult. To provide relevant information, we have performed LtL conversion under the same conditions using a range of lignins and lignin-rich residues that represent feedstocks that are already in use or based on technologies that can be deployed in the near future. The bio-oils produced from the different feedstocks have been studied in terms of the mass of the bulk oil yields by weight, the elemental composition and the molecular distribution of monomers as quantitatively analyzed using GC-MS. The results have been evaluated to identify the effect of differences in feedstock species and fractionation. The effect of the variation in lignin feedstock and preprocessing on the molecular composition of the oils is analyzed using chemometric comparisons, specifically principal component analysis (PCA) and partial least squares regression (PLS) to provide a statistically valid picture of similarities and differences.

2. Materials and Methods

All solvents and chemicals were purchased from Sigma Aldrich and used with no further upgrading. The solvents were all analytical grade (p.a.).

2.1. Lignin Feedstock Overview

An overview of the lignin feedstock used in this conversion study is given in Table 1. The lignin purity is stated in Table 2 in terms of the fraction of acid insoluble lignin, and the differences in lignin purity are substantial.

2.2. Lignin Samples and Pretreatment Procedures

Softwood: The lignin samples SW1 and SW2 are both purchased from Sigma Aldrich: the lignins were produced from softwood using kraft pulping and were used as is with no further pretreatment. The two samples are from different lots. SW3 and SW4 are both extracted from wood shavings of about 90% Norway spruce and about 10% Pine. Details on the biomass characteristics are given in Løhre et al. (2017) [36]. SW3 was extracted using organosolv fractionation, and SW4 was extracted using acetone/water oxidation. Results regarding SW3 have previously been published by Løhre et al. [36].
Grass: Rice straw (samples G2, G3, G4, and G5) was collected from fields in Canas, São Paulo state, Brazil. Samples G2, G3, and G4 were extracted using deacetylation. The G5 sample was extracted using acid precipitation. Details on these samples may be found in Castro et al. (2019) [38]. The corn stover sample (G1) was extracted using acetone/water oxidation. Further details on the lignin characteristics may be found in Kalogiannis et al. (2015) [39].

2.2.1. Deacetylation of Rice Straw

The rice straw was submitted to a two-step pretreatment in a 50-L stainless steel reactor aiming to produce second-generation ethanol from both cellulose and hemicellulose fractions [38]. The two-step pretreatment was performed as follows:
Initial mild alkaline process (80 mg NaOH/g biomass, at 70 °C for 45 min) for deacetylation and partial removal of lignin followed by a dilute acid pretreatment (100 mg H2SO4/g alkali-pretreated rice straw, at 121 °C for 85 min) for hemicellulose solubilization.
The pretreated solid (deacetylated cellulignin), and a control sample (only submitted to dilute acid pretreatment) were used as the substrate for ethanol production by a simultaneous saccharification and fermentation (SSF) process. SSF was performed using commercial cellulases at enzyme loadings of 21.5 FPU/g cellulose and 64.5 IU β-glucosidase/g cellulose, and the yeast Kluyveromyces marxianus NRRL Y-6860 at 1 g/L initial cell concentration, at 41.5 °C, 200 rpm, using 8 or 24% solids content. After the SSF process, fermentation broths were centrifuged (3500 rpm, 15 min), and the residual solid fractions (mostly composed of lignin) were recovered, placed on sieves (270 mesh), and dried in an oven at 50 °C until constant mass. Then, these fermentation residues were milled, and the following lignin samples were obtained:
G2: Fermentation residue obtained from SSF using control cellulignin at 8% solids content.
G3: Fermentation residue obtained from SSF using deacetylated cellulignin at 8% solids content.
G4: Fermentation residue obtained from SSF using deacetylated cellulignin at 24% solids content.

2.2.2. Acid Precipitation

From the mild alkaline pretreatment (deacetylation), an alkaline black liquor was obtained, in which lignin was partially solubilized. In order to recover the lignin, a precipitation process was performed using concentrated sulfuric acid. Then, the precipitate was washed two times with water, transferred to pre-weighed crucibles, and placed in an oven at 60 °C until constant mass. The lignin obtained after this step was G5, alkaline black liquor lignin, obtained after precipitation with sulfuric acid, dried, and ball-milled.

2.2.3. Acetone/Water Oxidation Pretreatment (Wet Oxidation)

Acetone/water oxidation (WO) of biomass was performed in a 975 mL Hastelloy C-276 Parr autoclave. 50 g of solid feedstock was fed into the reactor, and 500 g of a mixture of acetone and distilled water was then poured at a ratio of solid to liquid 1:10. The reactor was tightly sealed and pressurized up to 40 atm with a mixture of N2/O2 (mixture ratio 40/60 by volume and 99.0% grade). To control the temperature inside the reactor, a Parr Model 4848 reactor controller was used. The temperature was set to 175 °C, which corresponded to a reaction pressure of 64 bars with a reaction time of 2 h in all cases. The solid residue was separated from the liquid phase by filtration and subsequently washed with 250 g of acetone and 250 g of distilled water, and dried overnight in an oven at 80 °C. More details about the experimental procedure may be found elsewhere [39]. The dissolved lignin was recovered from the liquid effluent of acetone/water by vacuum distillation at 65 °C and 300 mbar. Upon evaporation of the acetone, the lignin sedimented in the water and was consequently filtered and dried overnight.
Hardwood: The beech wood samples (HW1, HW2) originated from a commercial wood biomass feed (Lignocel HBS 150–500). HW1 was extracted using acetone/water oxidation, and HW2 was extracted using milox pretreatment, which employed a mixture of formic acid and hydrogen peroxide. Further details on the hardwood lignin samples may be found in Kalogiannis et al. (2015) [39].

2.2.4. Milox Pulping

Single-stage Milox cooking was carried out at atmospheric pressure in 500 mL conical flasks. Formic acid (FA) was used at a 10:1 solvent to biomass weight ratio. H2O2 was added at concentration 2 wt.% in a solvent and the temperature was set at 80 °C. Each run treated 30 g of biomass. By the use of 6 volumes of the corresponding solvent, the delignified biomass samples were filtered and washed. The resulting pulp was dried in an oven (80 °C) overnight after being washed with distilled water. The dissolved lignin was recovered from the formic acid solution by vacuum distillation at 95 °C and 300 mbar. Upon evaporation of the formic acid, the lignin was recovered as a solid dark brown powder. It was then dried overnight. More details about the Milox pulping can be found elsewhere [40,41]. The resulting pulps were dried and weighed. The standard deviation for the recovered pulps was less than ±1.5%, which made the determination of the recoveries of each biomass constituent in the solid pulp possible.

2.3. Experimental Conditions in LtL Solvolysis

Lignin, water, and formic acid (FA) were combined in a 25 mL reactor from Parr instruments (4740-series). The reactor was sealed and placed in a Carbolite Laboratory High-Temperature oven preheated to the desired temperature. After the given reaction time, the reactor was removed from the oven and cooled to ambient temperature. The experimental conditions were chosen based on previous work, adjusted to the limited supply of lignin samples. The experimental conditions are listed in Table 3.
The reaction produced a gaseous phase, an aqueous phase, and a solid phase consisting of an organic phase adsorbed on char. By weighing the reactor before and after ventilating the gas, the amount of produced gas was determined. The aqueous phase is removed from the reactor before it is weighed and subsequently extracted with Ethyl Acetate (EtAc): Tetrahydrofuran (THF) (9:1 by volume) to recover as much as possible of the polar compounds present. The solid phase that is left in the reactor after removal of the aqueous phase is washed with the EtAc:THF solvent mixture and filtered through a 0.45 µm Puradisc TM 25 NYL filter to separate the produced organic phase from the char. The organic phases from the liquid-liquid extraction of the aqueous phase are combined and dried over Na2SO4 before filtration. The solvents are then evaporated using a rotary evaporator set to 40 °C and 175 mbar. Eventually, the organic phase is transferred to a vial and left under a weak flow of nitrogen gas for two days to ensure the evaporation of all the solvents. The experiments are conducted at a small laboratory scale, and some loss of product is inevitable. Replicate experiments are performed to evaluate the reproducibility. The results are reported as the yield of oil and residual solids relative to the mass of the lignin input and calculated according to Equations (1) and (2), respectively.
Oil   yield   wt . % = amount   of   obtained   oil   g amount   of   lignin   input   g 100 %
Solid   yield   wt . % = amount   of   solid   recovered   g amount   of   lignin   input   g 100 %
The gas yield is relative to FA input (which is the primary source of gases in the reaction), calculated according to Equation (3). Gas yields larger than 100% imply a significant contribution of gas-phase products from lignin feedstock reactions.
Gas   yield   wt . % = amount   of   ventilated   gas   from   the   reactor   g amount   of   formic   acid   input   g 100   %
The solvent recovery is reported as wt.% of the water input, and the wt.% mass recovery is all reactants combined to enable an evaluation of the overall reaction performance.

2.4. Silylation and Quantification

Selected major compounds in the oils are tentatively identified using GC-MS. The quantified compounds are present in a majority of the oils or assumed to be characteristic for the oils from the different lignin samples. The identification of the peaks is confirmed by comparing mass spectra from the silylated oils with silylated reference samples of the given compounds. The reference samples are prepared using the silylation method described below, and the mass spectra are visually matched with the mass spectra from the bio-oil. Calibration curves are prepared by GC-MS analysis of several standard samples with different concentrations and recording the ratio between the area of an internal standard and the area of the compound to be quantified. Stock solutions of the standard compounds are made by measuring 0.01 g of the standard compound into a vial and adding 20.0 mL of a mixture of dichloromethane and methanol in 93:7 (v v−1) ratio. A diluted sample of the stock solutions is prepared by mixing 50 µL of three different compounds and adding 5.0 mL of an internal standard solution (0.003 mg/mL hexadecane in pentane). 200 µL, 400 µL, 600 µL, 800 µL and 1000 µL of the diluted solution is transferred to separate GC-vials and pentane is added to get a total volume of 1 mL in each vial. 100 µL of pyridine and 100 µL of bis(trimethylsilyl)trifluoroacetamide (BSTFA) containing 1% trimethylchlorosilane (TMCS) is added before the vials are capped. In order to facilitate the silylation, the vials are placed in a preheated oven at 70 °C for 20 min. After removal from the oven, the vials are cooled to ambient temperature and subsequently cooled further at 5 °C overnight. The samples are filtered and then analyzed by GC-MS.
The bio-oil samples are prepared by dissolving 0.01 g bio-oil in 3 mL of an internal standard solution (0.01 mg/mL hexadecane in a mixture of ethyl acetate and tetrahydrofuran (9:1 v v−1)). 1 mL of the bio-oil solution is transferred to a GC-vial, and 150 µL of pyridine and 150 µL BSTFA are added. The GC-vial is capped and placed in a preheated oven at 70 °C. The sample is removed from the oven after 30 min and subsequently cooled to ambient temperature. 0.5 mL of the derivatized sample is placed in a new GC-vial and diluted with 0.5 mL of pentane and left in the fridge overnight. The samples are then filtered using a syringe fitted with an Acrodisc 13 mm syringe filter with a 0.2 µm nylon membrane and subsequently analyzed by GC-MS.
The wt.% of each quantified compound is calculated based on the calibration curve, which provides the concentration of the compound in the bio-oil. The concentration is converted to wt.% of each compound relative to the amount of bio-oil to ensure comparable values.

2.5. Gas Chromatography-Mass Spectrometry

The specifics of the GC-MS setup are listed in Table 4.
The temperature programs in Table 5 were applied. The temperature program for the quantitative analysis is based on the program for qualitative analysis with small modifications to increase the resolution of peaks of compounds the that were selected for quantification.
The quantitative analyses were done in SIM-mode to avoid overlapping peaks. The software used for the analysis of the samples was Enhanced MSD ChemStation F.01.00.1903 in combination with the NIST 2.0 library (Agilent Technologies, Santa Clara, CA, USA) for tentative identification of the peaks.

2.6. Elemental Analysis

The elemental analyses are conducted with a VarioEL III from Elementar in CHNS mode. The amount of oxygen is calculated by difference. The elemental analyses are made in duplicate, and the results are reported as an average of the duplicate analysis. No duplicate measurements with a difference of more than 15% are accepted, and new measurements are made in such a case.

2.7. Chemometric Analysis

The data are analyzed using principal component analysis (PCA) and partial least square regression (PLS). PCA is a statistical method that is widely used to extract systematic information from a dataset. The extracted information is expressed as a set of principal components (PC), which comprise a set of weighted variables that are orthogonal to each other. PC1 explains as much as possible of the variation in the dataset, PC2 explains as much as possible of the residual variation in the dataset with the constraint of being orthogonal to PC1, and so on [42]. PCA has been utilized in this study to get a better understanding of the correlations between the variables and responses and to ensure that correlations are not being overlooked. Another method in the chemometric analysis is partial least square regression (PLS), which in a similar procedure provides equations on the modeling of specific properties of the oils as a function of experimental parameters [43,44] The data analysis has been performed using the software package SiriusTM. The data are centered and standardized prior to PCA/PLS analysis to scale all variables to the same range. A detailed presentation of data analysis using PCA and PLS is given in Carlson and Carlson (2005) [44].

3. Results

3.1. Lignin Samples

The lignin samples used in this study were collected from different sources, both in terms of biomass and pretreatment types. In total, 11 different lignin samples were used. The samples include softwood, hardwood, and grasses, and a range of pretreatment strategies, as discussed in the introduction and specified in the Material and Methods section. The samples span a range of carbon content from 3.35–6.39 mol%, with an H/C range of 1.07–1.68 and an O/C range of 0.12–0.98 (Table S1, Supplementary Material).

3.2. LtL-Experiment Yields

The 22 experiments produced bio-oil in various amounts, as shown in Table 6. There is a considerable variation in the oil yields, covering a range from 24 wt.% to 94.2 wt.% of the lignin input. The standard deviation for replicate experiments, when available, is included in Table 6.
The highest yield is from lignin SW3 [36], which is an organosolv lignin from softwood, indicating that the lignin purity is a relevant factor for explaining the yield variations [29]. It is known that different lignin samples have different temperature optima [31,45], which we can see in this study as well since there is no systematic trend as to the dependence of the yield on the two temperatures (320 and 360 °C).
Replication of experiments was mostly not possible due to limited sample amounts. For some feedstocks replicate experiments were performed, as noted in Table 6. Except for the SW1-kraft-360 (standard deviation 9.6%), the standard deviations are below 3%, which is considered acceptable for naturally sourced feedstocks. For the SW3 lignins, previously published duplicate experiments at 340 °C gave oil yields of 89.3 and 89.4% weight [36]. Previous work with other lignin feedstocks gave standard deviations of ±3% weight for the oil yields [35]. On this basis we consider that the LtL results can be used in a statistically based analysis.
The recovered solids, calculated as wt.% of the input lignin, decrease with increasing temperature for all the lignins investigated, which suggests that the thermal conversion is not complete after 2 h at 320 °C, resulting in the solids still including some unreacted or partly reacted lignin. The results shown in Table 6 show a variation in the total mass recovery. The HW2-milox-320 experiment stands out with only 78.8 wt.% mass recovery. This is mainly caused by a low recovery of the solvent, where water contained in the LtL-oil was observed as a high degree of lumping of the sodium sulfate used as a drying agent compared to the rest of the experiments.

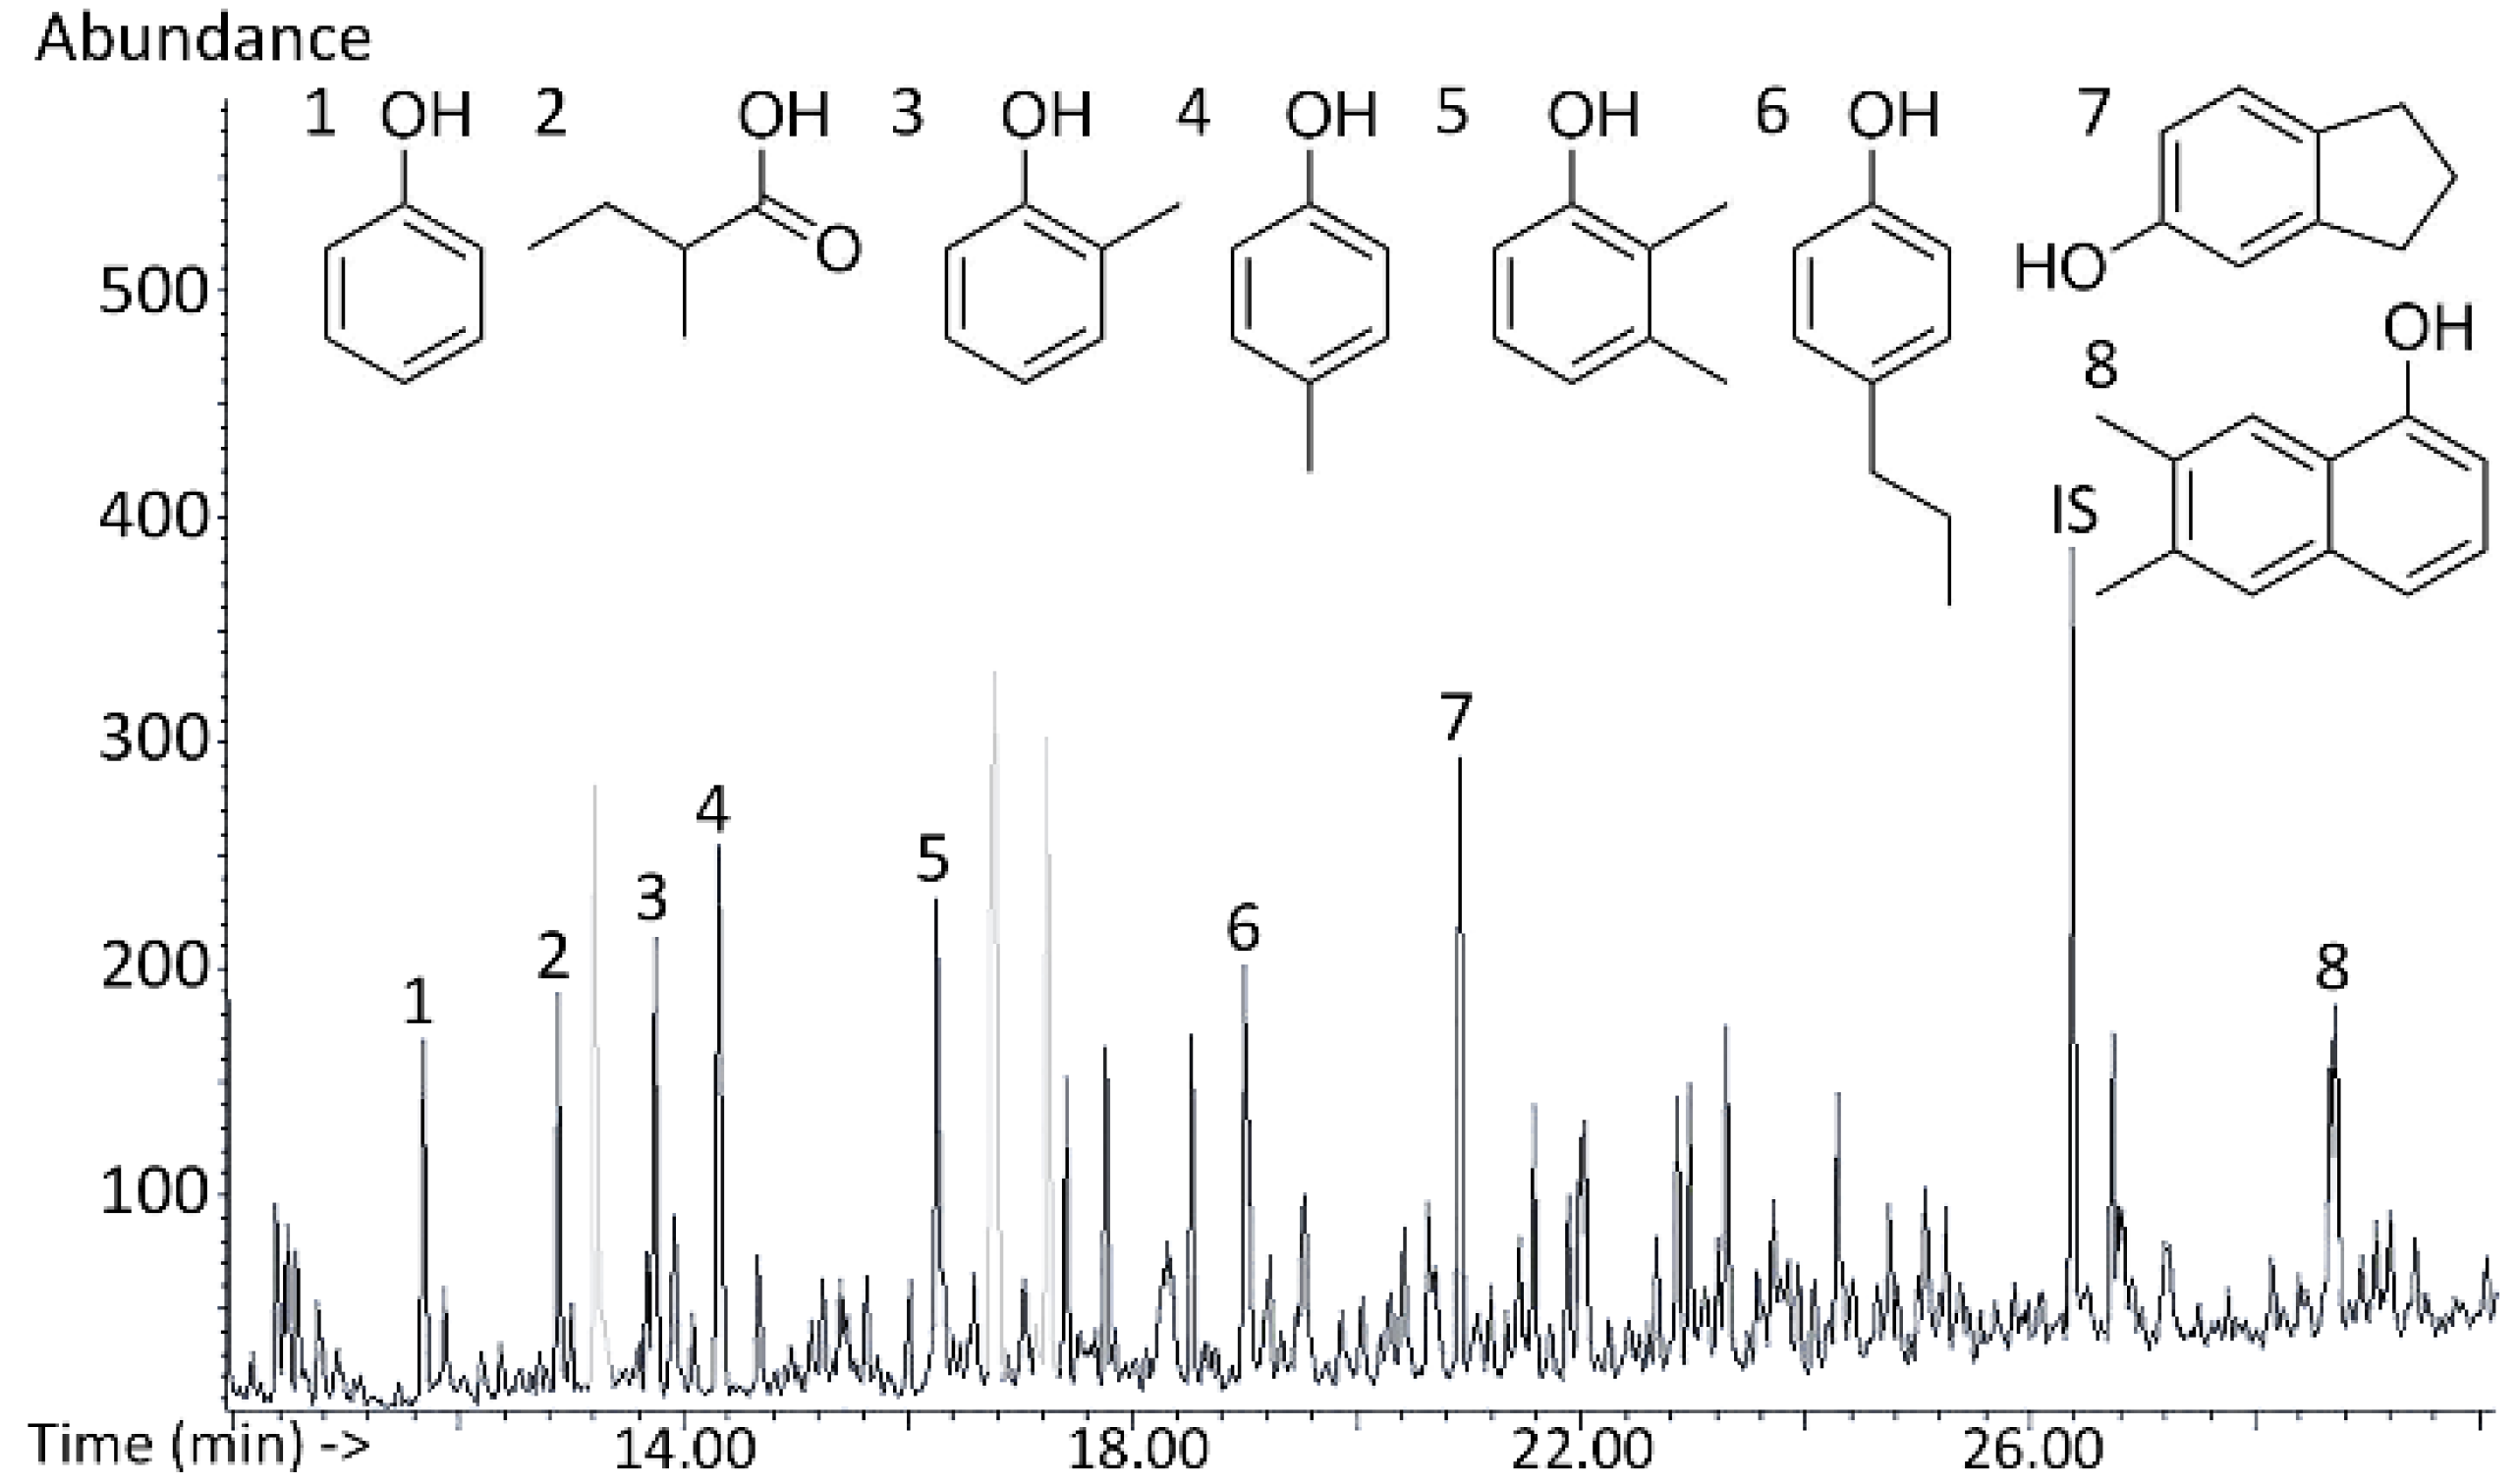
3.3. Qualitative Analysis of Bio-Oil Composition

A qualitative analysis was conducted of the bio-oils using GC-MS. There are considerable compositional differences between oils made with lignin from different origins, and the groups of softwood, hardwood, and grass display differences in chemical composition as expected. The peaks in the chromatograms were tentatively identified using the NIST library. Some of the most abundant compounds are shown in Figure 1, Figure 2 and Figure 3.
The mass spectra of the tentatively identified peaks are not fully resolved and may be isomers of the proposed structures rather than the precise structures given in the figures. Based on initial analysis, 15 compounds were selected for quantification. The quantified compounds have been positively identified using comparison with standard compounds.

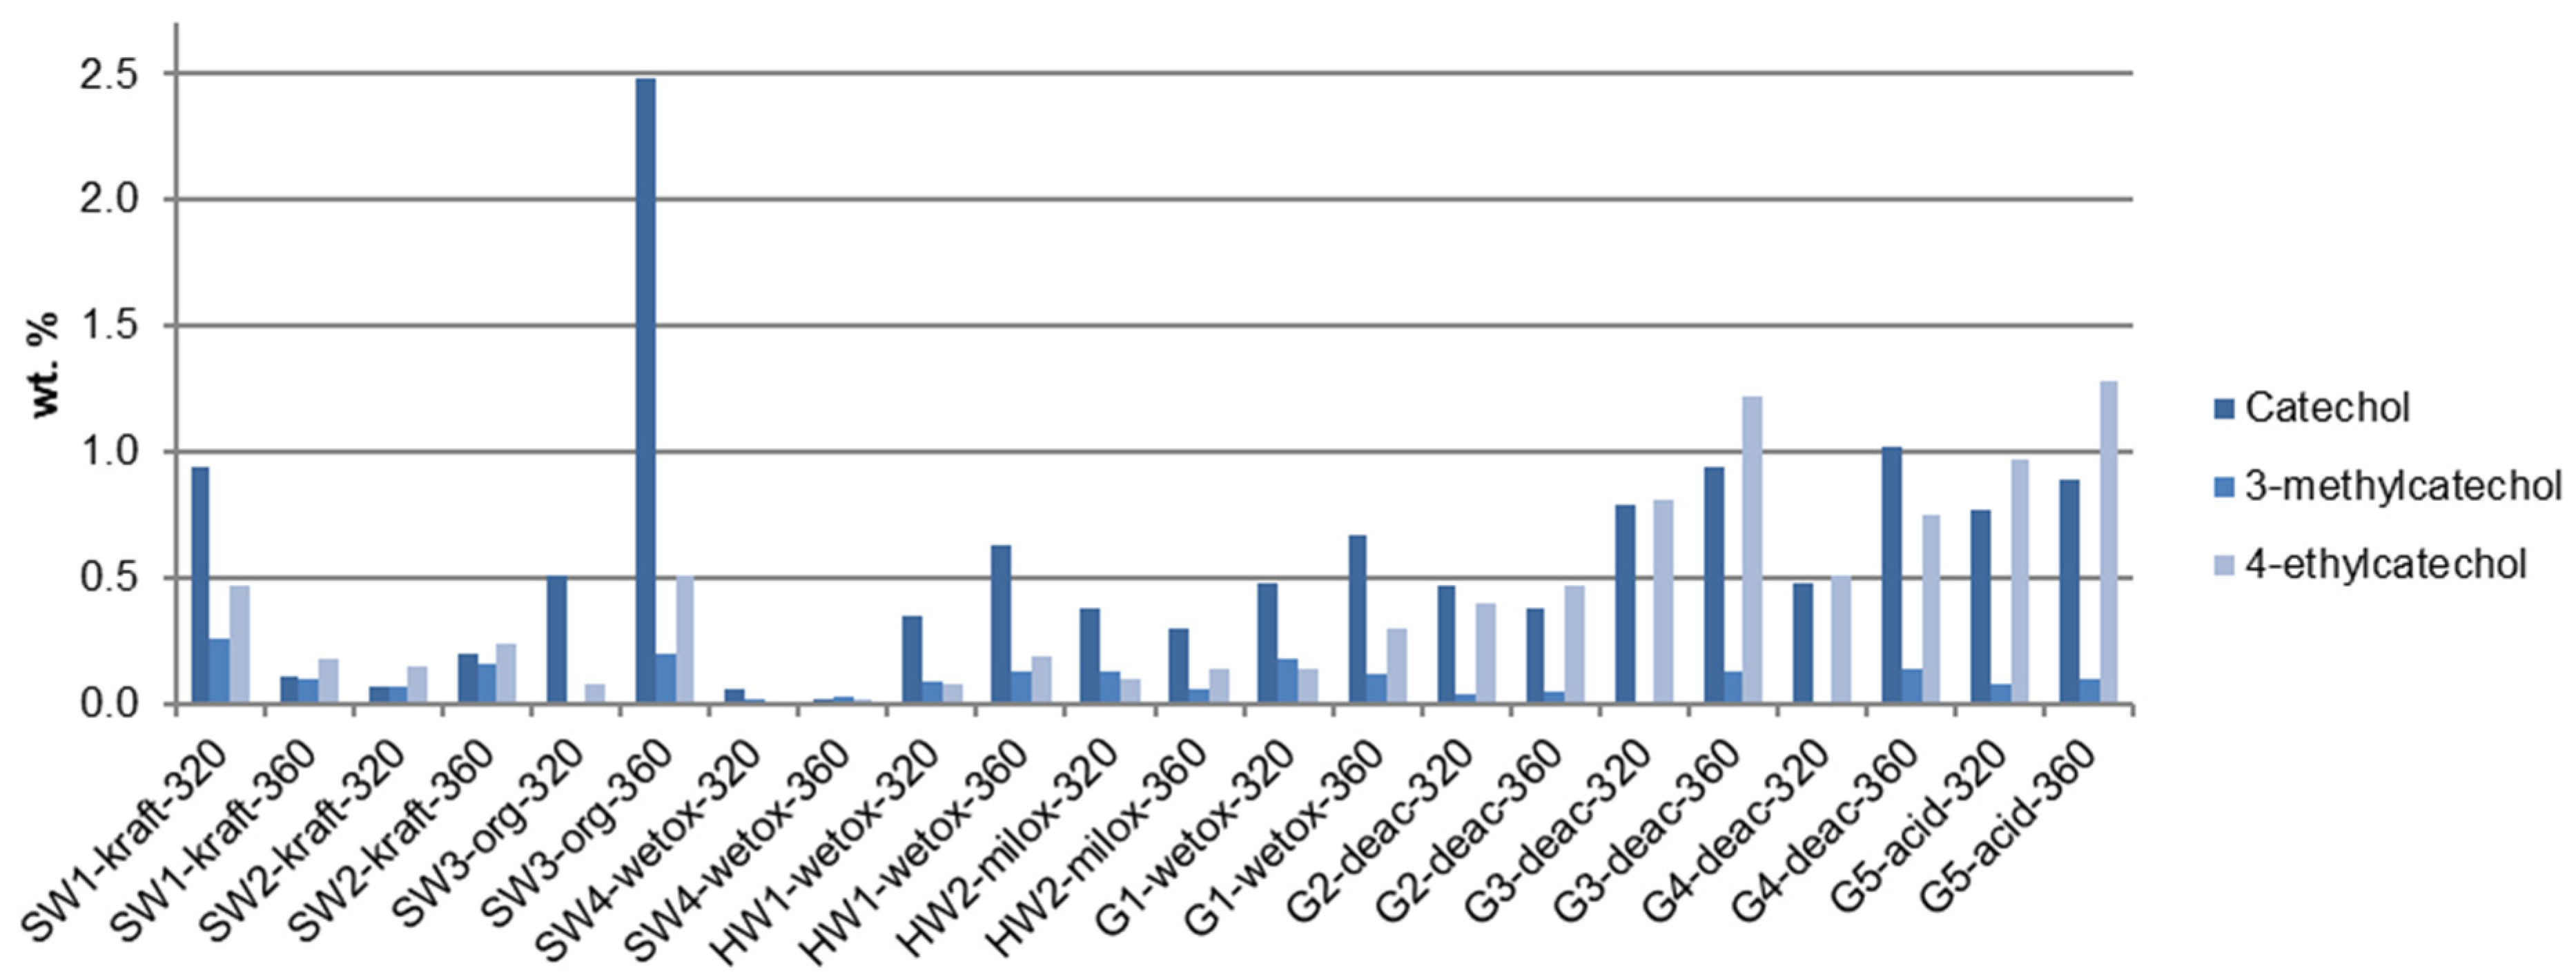
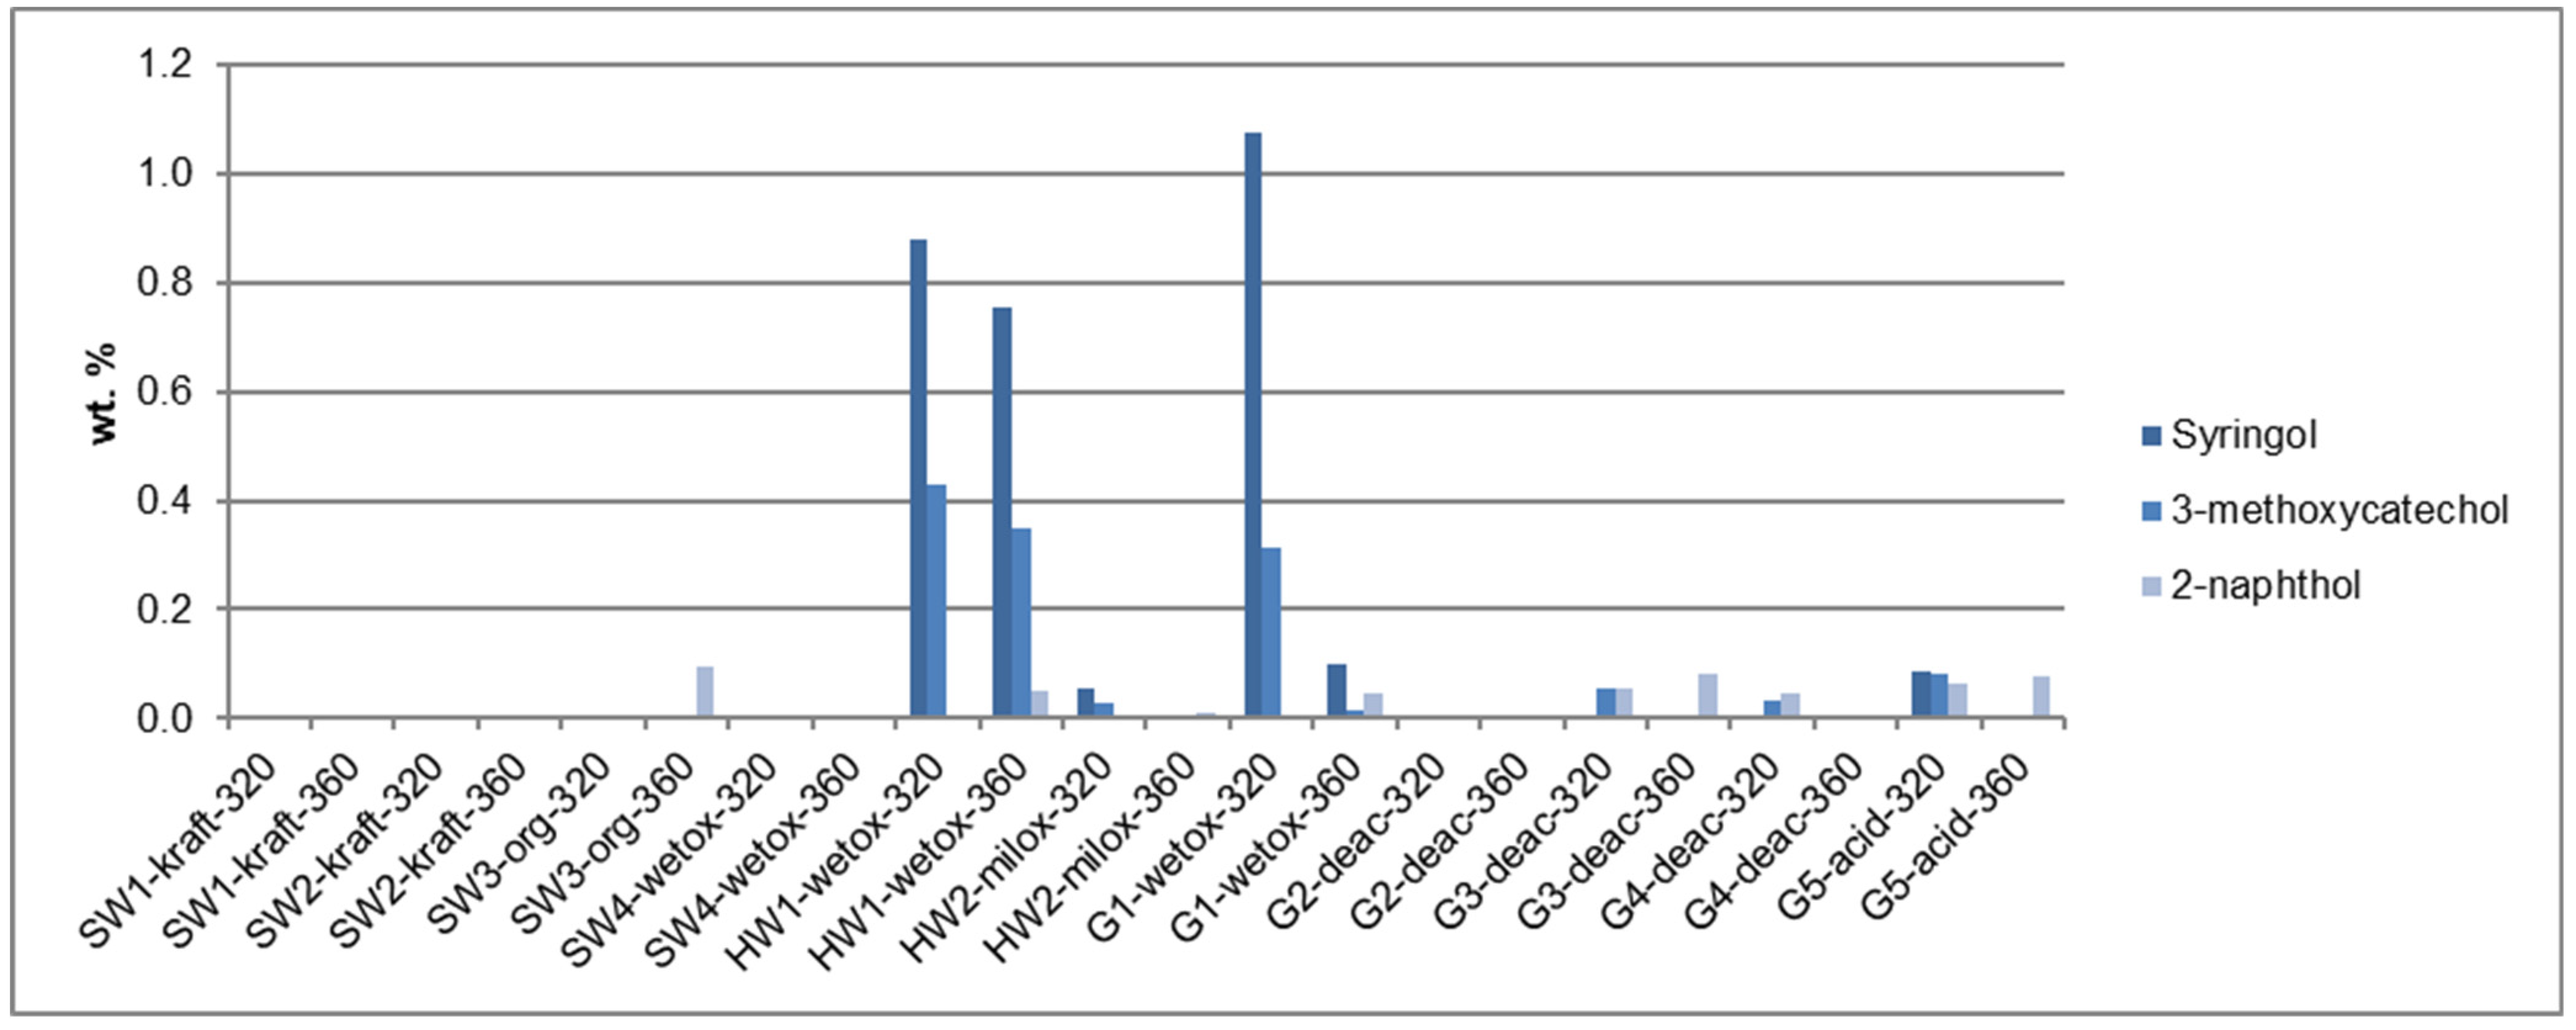
3.4. Quantitative Analysis: Monomer Composition

Quantification of individual compounds based on specific calibration curves illustrates that the oil is a mixture of many components where the concentration of each component is relatively low. The maximum content of any one individual compound that has been determined is 2.52 wt.% of guaiacol (9) in the bio-oil sample SW-org-360 [36] (softwood). Only a few compounds exceed 1 wt.% of the oil, see Table S2 (Supplementary Material). Figure 4, Figure 5, Figure 6 and Figure 7 illustrate the content of the most abundant compounds in the produced oils and show that there is a significant variation in molecular composition as a result of the different feedstock and fractionation methods.
Guaiacol and substituted guaiacols are typical components in all bio-oil samples. Softwood lignin contains about 90–95 wt.% guaiacyl units in its lignin, so the bio-oils from softwood lignins are expected to have a higher abundance of guaiacol and substituted guaiacols. The lignin samples SW1 and SW3 are lignin from softwood. However, the two bio-oils from SW1-lignin, SW1-kraft-320 and SW1-kraft-360, do not contain the highest quantity of guaiacols. SW3 [36], on the other hand, exhibits the expected trend with the highest quantity of guaiacol in SW3-org-360, as seen in Figure 4. The two acetone/water oxidation lignins in HW1 (beechwood) and G1 (corn stover), as well as the lignin from softwood in SW2, stand out as the oils with the highest abundance of guaiacol. Experiments SW4-wetox-320 and SW4-wetox-360, on the other hand, produced only small quantities of guaiacol.
Catechol and substituted catechols are components that are present in most of the oils regardless of the lignin type used, as shown in Figure 5. When comparing the yields, three of the rice straw lignins (G3–G5) produce high levels of catechol, together with the kraft softwood lignins (SW1 and SW2). SW3-org-360 [36] (softwood) stands out by being the oil that contains the most catechol.
Phenols are also a major compound class. In Figure 6, some of the bio-oils produced from grass lignin stand out with the highest quantities of 4-ethylphenol (marked 19 in Figure 1) (G2, G3, G4, and G5). The lignin samples G2, G3, G4, and G5 all originate from rice straw, whereas the G1 lignin comes from corn stover, which could explain why G2, G3, G4, and G5 display such similarities.
The syringyl unit of the lignin is most abundant in hardwood lignin with a content of about 50 wt.%, so it was expected that the highest abundance of syringol would be found in bio-oils made from hardwood lignin. This is, however, not always the case, as seen in Figure 7. HW1 is hardwood lignin and shows results as expected. G1, on the other hand, is lignin from corn stover, a type of grass, and produces even higher amounts of syringol, at 320 °C, than the HW1-experiments. HW2 is a lignin-rich residue derived from hardwood, but it hardly produces syringol in these experiments, probably because the lignin has been severely altered by the pretreatment method.

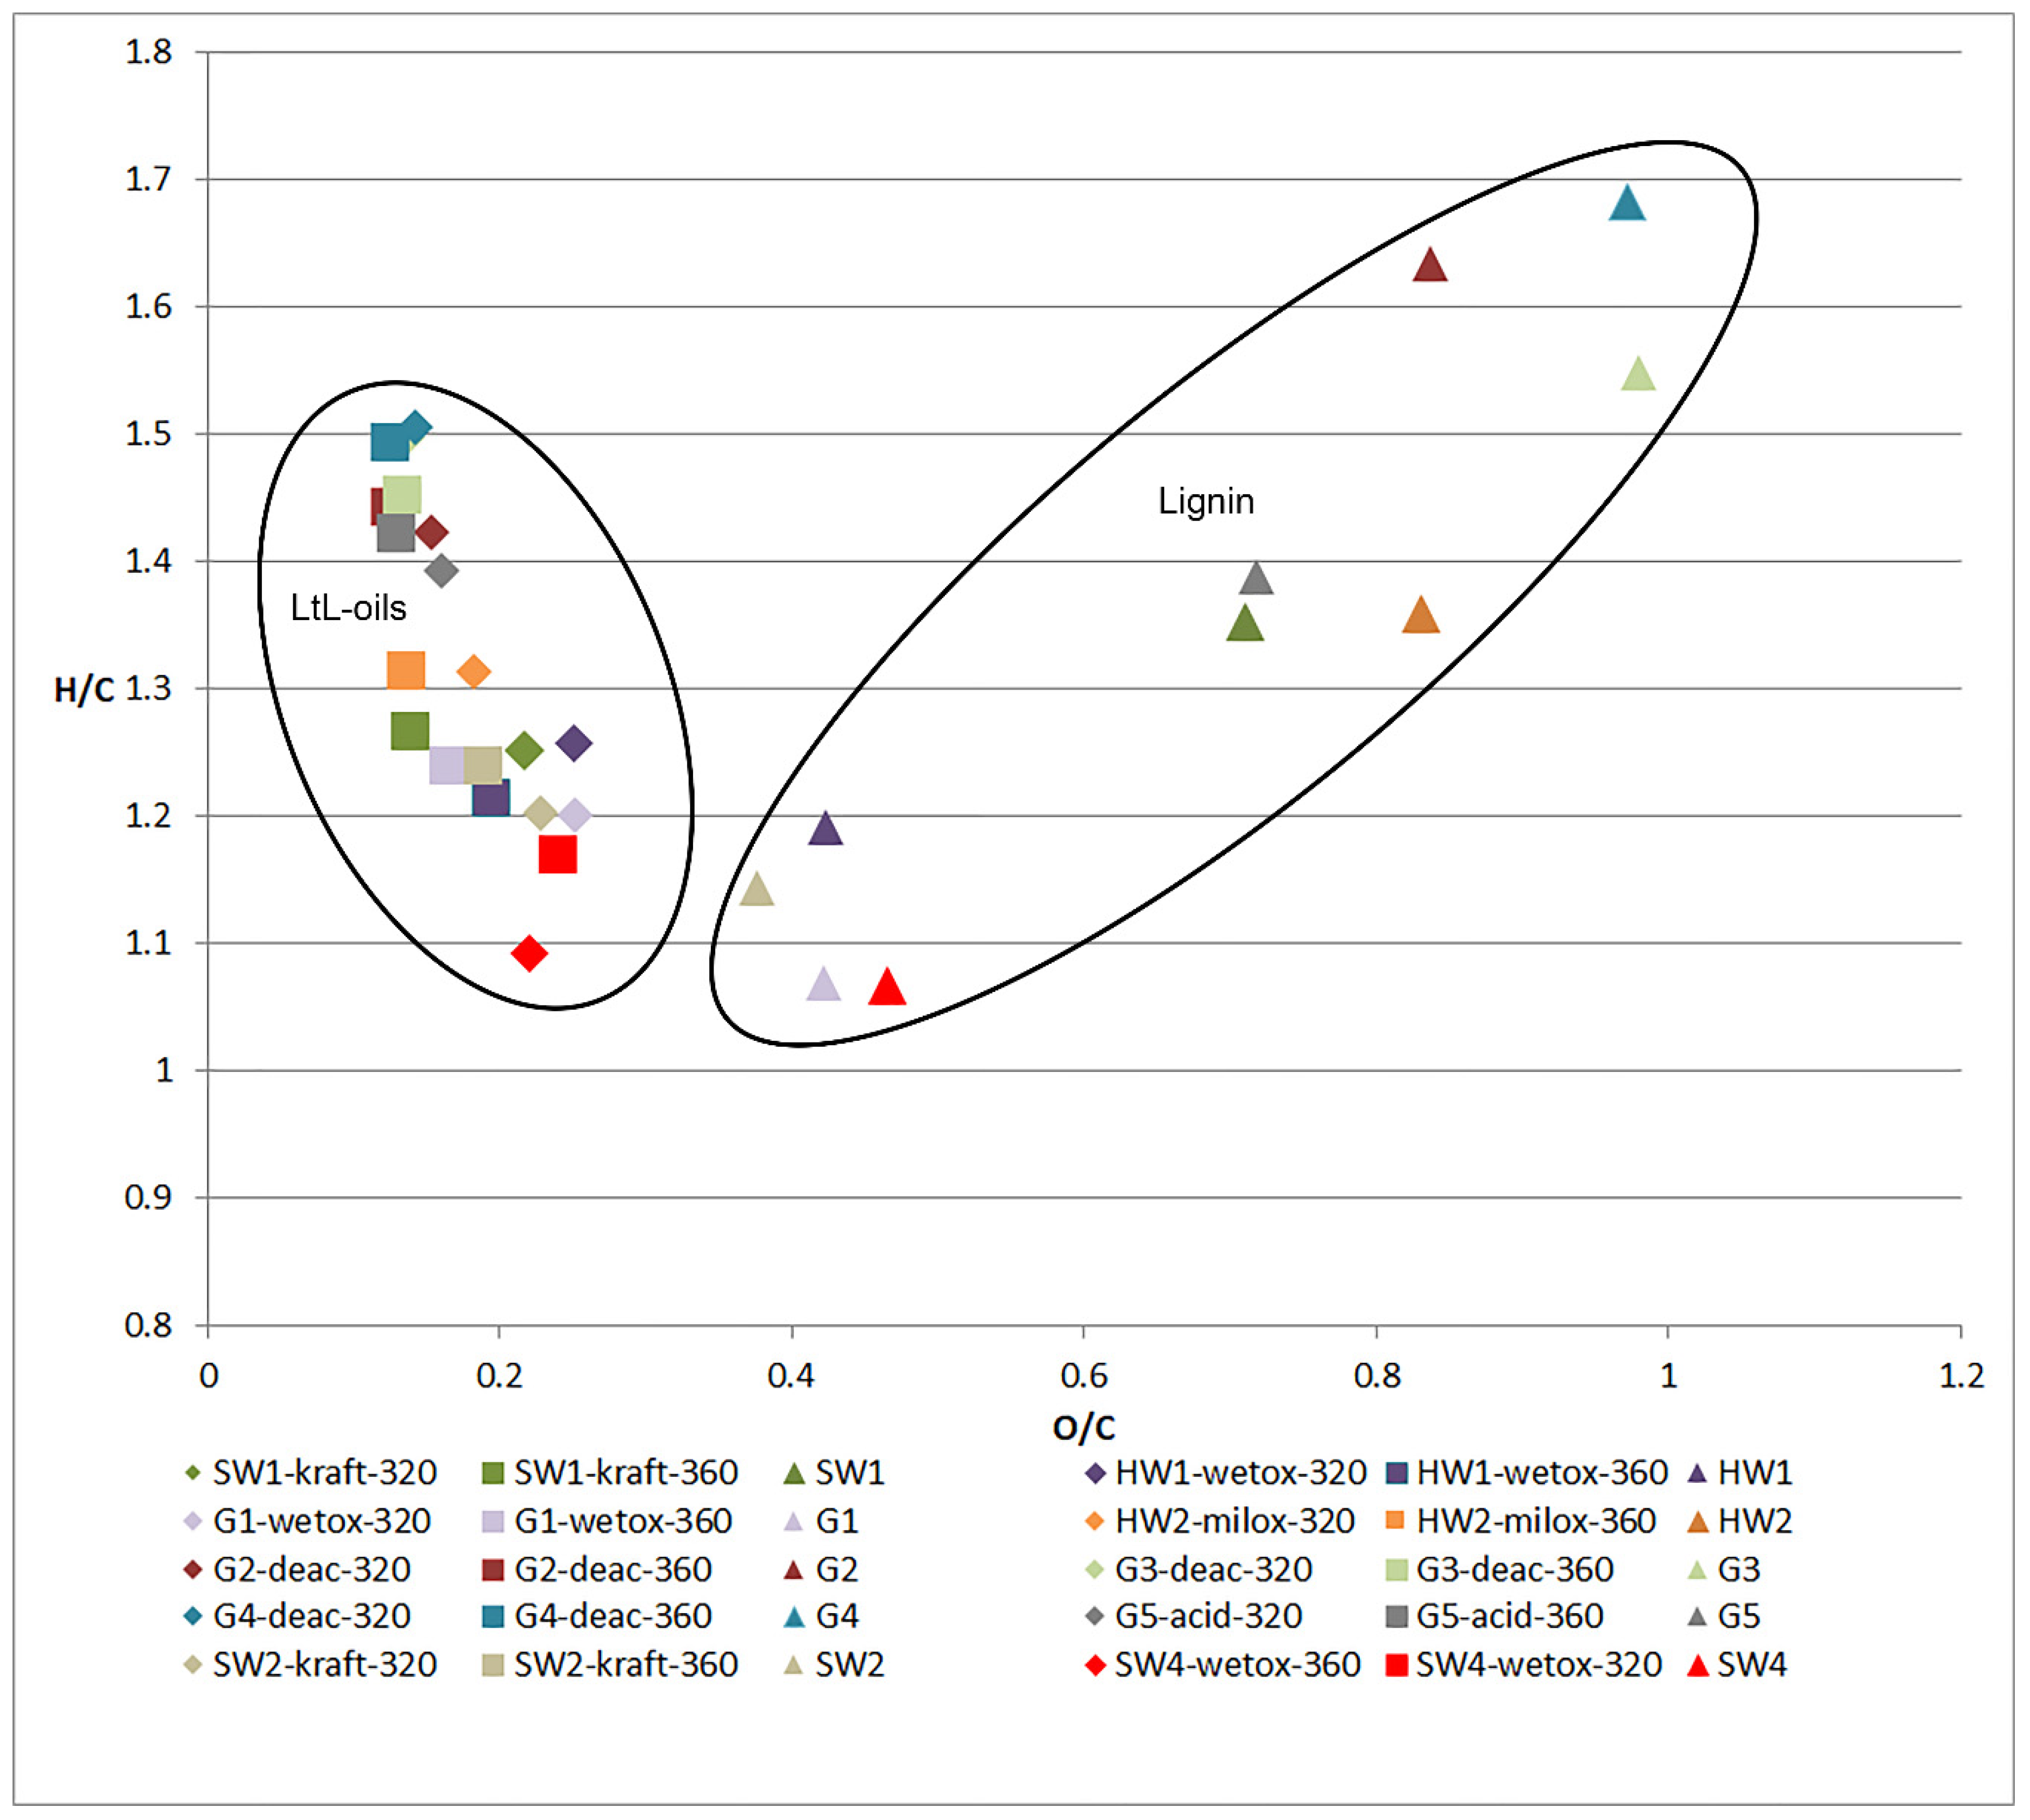
3.5. Elemental Analysis

The Van Krevelen plot in Figure 8 displays the variation in the hydrodeoxygenation that occurs in the different experiments. The results in LtL-oils made from feedstock G2, G3, and G4 show that no net hydrogenation has occurred, while there is distinct deoxygenation during the solvolysis process. The lignin samples G1, HW1, SW2, and SW4 are the samples with the lowest oxygen to carbon ratio and hydrogen to carbon ratio. The oils made from these lignins are both hydrogenated and deoxygenated. Overall, the hydrogenation of the lignin samples is limited in these experiments, and the deoxygenation is prominent. Table S1 (Supplementary Material) presents the results from the elemental analysis.

4. Discussion

4.1. LtL-Experiments: Oil Yields

Bio-oil is produced from all the lignin samples investigated in this study in amounts ranging from 24% to 94% (Table 6) relative to the lignin input. When the oil yields are compared to the elemental analysis, it is seen that the lignin samples with the lowest O/C-ratio give the highest oil yields, reflecting the dominance of deoxygenation in the conversion process. Thus, the yield of bio-oil is negatively correlated to the amount of oxygen in the lignin samples suggesting limited loss of carbon in the conversion reactions. Similarly, the amount of acid insoluble lignin in the feedstock is closely positively correlated to the yield, which means that the samples which have the highest purity of lignin will give the highest oil yield relative to the weight of input material. The relevant chemical mechanisms corresponding to these results would thus be substitution of hydroxy groups with hydrogen derived from formic acid decomposition, rather than dehydration or decarboxylation [46].
A multivariate analysis of lignin characteristics and oil and coke yields using PLS (Partial Least Squares) regression results in a good model for oil yields when modelled solely on the elemental composition of the lignin samples. The oxygen content is excluded since it is calculated by difference from the measured elements, so it is not an independent variable. Figure 9 shows the correlation for the 360 °C experiments, which have been selected to minimize the effect of temperature variation. The regression coefficient of R = 0.87 is quite good for a model based on such very diverse data as presented here. Equation (4) shows the PLS (partial least squares) equation for the line in Figure 9 using weighted variables.
Oil   yield = 4.62 0.33 × mol %   N   + 0.54 × mol %   C   + 0.29 × mol %   H
The fact that the oil yields are well modeled just based on the elemental composition of the lignin suggests that the LtL thermochemical conversion is robust and not very dependent on the detailed bond composition of the lignin precursor, and thus is suitable for a wide range of potential feedstock types.
Multivariate regression using PLS has also been applied to generate calibration models for oil yields based on biomass type and on pretreatment methods, giving regression coefficients of R = 0.68 and R = 0.85, respectively. This shows that the pretreatment method plays a more significant role than the biomass origin for the amount of bio-oil produced. The pretreatment is intimately connected to the produced lignin purity and resulting bulk elemental compositions, and especially the presence of carbohydrate residues which increase both the O and H content of the bulk lignin fractions. Another measure for lignin purity is the content of acid insoluble lignin. Modeling bio-oil yield solely on the amount of acid insoluble lignin, gives a regression coefficient of R = 0.81. Thus, the elemental composition provides the best quantitative model for lignin yields, since it contains information that is derived both from the lignin composition and the proportion of pure lignin in the feedstock.
Figure 10 shows that the two temperature levels used in this work do not play a significant role in the oil yields, which is not surprising since the lignin samples are so different. Different types of lignin have a maximum oil yield at different temperatures. The oil yield increases with increasing temperature up to a maximum and then decreases with further increased temperature when cracking reactions become quantitatively dominant [30,33]. That maximum yield point is not known for the samples used in this work due to the feedstock limitations, and the temperatures used are hence not optimized to maximum oil yield. Figure 10 also shows that softwood lignin, as well as the pretreatment methods organosolv and kraft, contribute positively to the oil yield. Though the correlations are quite strong for the samples investigated in this study, a larger and more systematic study is required to establish precise statistical cause-effect models.

4.2. Quantitative Analysis: Monomer Composition

The connection between plant species and yields of selected compounds is not very pronounced taking into account the established knowledge of lignin monomer composition. For example, the differences between the two hardwood samples (HW1 and HW2) indicates that the pretreatment method is just as crucial as the feedstock when it comes to which compounds are produced in the LtL-process. As discussed in our previous work [38] the milox pretreatment can significantly degrade the recovered lignin. More specifically, FTIR analysis of both acetone-water oxidation and milox recovered lignins showed that in the latter, the FTIR was missing peaks at characteristic wavelengths below 1500 cm−1, which correspond to guaiacyl, syringyl, and some methyl- and methylene-side chains. The HW1 lignin, on the other hand, was found to be much closer to native lignin, indicating that although the depolymerization effect is achieved via oxidation and cleaving of the beta ether bonds of lignin, the effect on the lignin quality is in fact minimal [19] This is also clearly seen from the characterization of the HW2 sample (Table 2) where the lignin content is low with only 17.5% (wt) of acid insoluble lignin, again indicating that lignin is significantly degraded during fractionation.
The softwood samples have also been pretreated with different methods (Table 2, SW1, SW2, SW3, and SW4), and there are large differences in the yields of the compounds recovered in the bio-oils. The two softwood samples SW1 and SW2 were expected to show strong similarities since they are both produced from softwood and extracted using kraft pulping. However, it is known that the structure of lignin differs from species to species [10], and since these two samples are bought from Sigma Aldrich, we do not know from what species the samples were obtained. The grass-samples G2–G5, display some similarities but are quite different from G1, which also comes from a species of grass. G2–G5 have undergone similar pretreatment methods (deacetylation and acid precipitation) as well as originating from the same kind of grass (rice straw), whereas G1 has been treated by acetone/water oxidation and originates from corn stover, which could both account for the differences.
The yields of compounds in the bio-oils have been analyzed by multivariate data analysis using PCA, looking specifically at the relationships between the quantity of the various compounds produced and pretreatment methods as well as plant type. In the biplot in Figure 11, all the variables of the experiments and the quantified compounds are displayed in black. The different experiments are color-coded with blue for oxidative preprocessing, green for kraft lignin, and red for deacetylation. The samples that plot close to a variable are positively correlated to this property and to each other, while an opposite placement relative to origo implies a negative correlation.
As shown in Figure 11, the variables grass and deacetylation as a pretreatment method are positively correlated with the compounds 4-ethylphenol (marked 19 in Figure 1, Figure 2 and Figure 3), 2-(4-hydroxyphenyl)ethanol (22) and phenylethylalcohol (23), all of which are to be expected to have a higher abundancy in bio-oils made from grass samples. However, G1 (grass prepared by oxidative pretreatment method), is negatively correlated with the abovementioned compounds, which indicates that in this case the pretreatment method dominates the production of these compounds. The G1-experiments and the SW4-experiments plot close to each other and thus show a high similarity with the hardwood samples that have been prepared by a similar oxidative pretreatment method. This indicates that the method of pretreatment has a higher impact on compound yields than the plant type.
However, there is also some degree of correlation between the properties of the bio-oil and the origin of the lignin. This is in agreement with Van den Bosch et al. [11] who reported a “direct correlation between the lignin building block composition and its tendency to depolymerize”. They also observed propyl guaiacol (16) and propyl syringol (24) to be dominating phenolic monomers in the products from hardwood and made the connection to the high levels of syringyl and guaiacyl units in the lignin from hardwood. They found the monomer and dimer products from softwood to contain almost exclusively guaiacyl-products, which is in line with what we expect knowing that softwood contains 90–95 wt.% guaiacyl-units [11]. Looking at another study performed under more severe conditions also suggests that the product mixture is highly dependent on the chemical structure of the starting material [14]. Previous experiments performed with the LtL-method by Løhre et al. [33] also suggested a connection between the origin of lignin and produced compounds; however, in this study we have used lignin extracted with harsher pretreatment methods which would alter the structure of the lignin to a greater extent than for the conditions used in the previous study. Looking at the biplot in Figure 11, it is evident that 4-ethylphenol (19), 2-(4-hydroxyphenyl)ethanol (22), and phenylethylalcohol (23) are strongly correlated to the preprocessing method of deacetylation and also to grass as the feedstock species.
The amount of phenol (1) and its derivatives are, to some extent, positively correlated to temperature, which confirms what Løhre et al. [47] have reported, where an increase in unsubstituted phenols and a decrease in phenols with methoxy substituents were observed with increasing temperatures. The depolymerization and demethoxylation reactions are more complete at higher temperatures which could account for these effects.
Regression models were prepared for each individual compound to see which of the three variables, biomass origin, pretreatment method or temperature were the dominating factor in their production. For a majority of the investigated compounds, the pretreatment method best predicts the amount produced with correlation coefficients of up to R = 0.82. Two of the compounds, 4-propyl guaiacol (16) and 3-methoxy catechol (12), are best explained by biomass origin with regression coefficients of R = 0.526 and R = 0.556, respectively. 4-methyl phenol (4), on the other hand, is best explained by the temperature with a regression coefficient of R = 0.651 (see Table S3, Supplementary Material).
For further development and utilization of lignin-derived compounds, the yield of specific phenols is of considerable interest. Several of the compounds found in the bio-oils in this work can be utilized in the chemical industry. Guaiacol, which is found in all the oils, is used medicinally as an expectorant, local anesthetic, and antiseptic [48]. 4-methyl guaiacol [49], 4-ethyl guaiacol [50], and 4-propyl guaiacol [51] are all flavoring agents used in the food industry. Guaiacol derivatives have chemical and biochemical applications such as production of pharmaceuticals and perfumes [52]. Catechol is used as a precursor in the pharmaceutical industry in addition to the production of pesticides [53]. Phenol is also a precursor in the production of chemicals [54]. This merits the continued research in fractionation and isolation of the individual compounds, where both feedstock species and pretreatment methods need to be considered and tailored for specific applications.

5. Conclusions

This work shows that LtL-solvolysis is a robust method for depolymerization of lignin-rich samples, where all the tested sample types gave a high yield of bio-oils rich in phenolic compounds. Thus, LtL-solvolysis can be used on a wide range of feedstock types. It is also found that the amount of oxygen in the lignin directly affects the oil yield by weight, meaning that the highest oil yield is achieved when the lignin feedstock contains less oxygen, and thus is of a higher purity. The dependence of the oil yield on the elemental composition provides a good calibration model when using PLS (R = 0.87). A similar correlation coefficient is found based on the fractionation method (R = 0.85), while the correlation based on feedstock type is weaker (R = 0.68). However, the molecular composition of the produced bio-oil reflects the origin of the lignin to some extent. The bio-oil from softwood lignin contained the most guaiacol-derivatives, and syringol correlates to hardwood lignin, but overall the correlation between the produced compounds and the origin of the lignin is quite inconsistent, and a stronger correlation with the pretreatment method of fractionation is observed. Thus, this work shows that the pretreatment of the biomass plays a vital role concerning product composition and may even be the dominating factor. This implies that the choice of the lignin fractionation technology must be considered as a critical factor when setting up a lignocellulosic biorefinery.

Supplementary Materials

The following supporting information can be downloaded at: https://0-www-mdpi-com.brum.beds.ac.uk/article/10.3390/en15134707/s1, Table S1: Elemental composition of the lignin and oil samples. In the case of replicate experiments performed, the value presented in the table is an average of the experiments in question; Table S2: Quantification of selected compounds (weight percent of bio-oil). The sample with the highest content of each compound is given in bold; Table S3: Results from regression modelling of the individual compounds based on biomass origin, pretreatment method and temperature. The higher the regression coefficient, the better the model explains the results.

Author Contributions

Conceptualization, H.V.H., S.I.M., K.K. and T.B.; Methodology, H.V.H.; Formal analysis, H.V.H.; Investigation, H.V.H.; Resources, S.I.M., K.K. and R.C.A.C.; Writing—original draft, H.V.H.; Writing—review & editing, T.B.; Visualization, H.V.H.; Supervision, T.B., S.I.M. and I.C.R.; Project administration T.B.; Funding acquisition, A.L. All authors have read and agreed to the published version of the manuscript.

Funding

The authors gratefully acknowledge the following institutions for funding: The University of Bergen for funding Hilde V. Halleraker, the Novo Nordisk Foundation (NNF), Denmark (grant number: NNF20SA0066233), Fundação de Amparo à Pesquisa do Estado de São Paulo (FAPESP), Brazil (grant numbers 2015/20510-9; 2015/24813-6; 2013/13953-6), Coordenação de Aperfeiçoamento de Pessoal de Nível Superior (CAPES), Brazil (Finance Code 001), and the Hellenic Foundation for Research and Innovation (HFRI) and the General Secretariat for Research and Technology (GSRT), grant agreement No 1085.

Acknowledgments

The authors would like to thank I. J. Fjellanger for assisting with elemental analysis.

Conflicts of Interest

The authors declare no conflict of interest.

References

  1. Tian, X.; Fang, Z.; Smith, R.L.; Wu, Z.; Liu, M. Properties, Chemical Characteristics and Application of Lignin and Its Derivatives. In Production of Biofuels and Chemicals from Lignin; Fang, Z., Smith, J.R.L., Eds.; Springer: Singapore, 2016; pp. 3–33. [Google Scholar] [CrossRef]
  2. Varanasi, P.; Singh, P.; Auer, M.; Adams, P.D.; Simmons, B.A.; Singh, S. Survey of renewable chemicals produced from lig-nocellulosic biomass during ionic liquid pretreatment. Biotechnol. Biofuels 2013, 6, 14. [Google Scholar] [CrossRef] [PubMed] [Green Version]
  3. Mussatto, S.I.; Dragone, G.M. Chapter 1 Biomass Pretreatment, Biorefineries, and Potential Products for a Bioeconomy De-velopment. In Biomass Fractionation Technologies for a Lignocellulosic Feedstock Based Biorefinery; Elsevier: Amsretdam, The Netherlands, 2016; pp. 1–22. [Google Scholar] [CrossRef]
  4. Yamakawa, C.K.; Qin, F.; Mussatto, S.I. Advances and opportunities in biomass conversion technologies and biorefineries for the development of a bio-based economy. Biomass Bioenergy 2018, 119, 54–60. [Google Scholar] [CrossRef]
  5. Cao, Y.; Chen, S.S.; Zhang, S.; Ok, Y.S.; Matsagar, B.M.; Wu, K.C.W.; Tsang, D.C.W. Advances in lignin valorization towards bio-based chemicals and fuels: Lignin biorefinery. Bioresour. Technol. 2019, 291, 121878. [Google Scholar] [CrossRef] [PubMed]
  6. Azadi, P.; Inderwildi, O.R.; Farnood, R.; King, D.A. Liquid fuels, hydrogen and chemicals from lignin: A critical review. Renew. Sustain. Energy Rev. 2013, 21, 506–523. [Google Scholar] [CrossRef]
  7. Mussatto, S.I.; Fernandes, M.; Roberto, I.C. Lignin recovery from brewer’s spent grain black liquor. Carbohydr. Polym. 2007, 70, 218–223. [Google Scholar] [CrossRef]
  8. Schutyser, W.; Renders, T.; Van den Bosch, S.; Koelewijn, S.F.; Beckham, G.T.; Sels, B.F. Chemicals from lignin: An interplay of lignocellulose fractionation, depolymerisation, and upgrading. Chem. Soc. Rev. 2018, 47, 852–908. [Google Scholar] [CrossRef]
  9. Mialon, L.; Vanderhenst, R.; Pemba, A.G.; Miller, S.A. Polyalkylenehydroxybenzoates (PAHBs): Biorenewable Aro-matic/Aliphatic Polyesters from Lignin. Macromol. Rapid Commun. 2011, 32, 1386–1392. [Google Scholar] [CrossRef] [PubMed]
  10. Pereira, A.L.A.H. Compositional Variability of Lignin in Biomass. In Lignin—Trends and Applications; Matheus, P., Ed.; IntechOpem: London, UK, 2018; p. 308. [Google Scholar]
  11. Van den Bosch, S.; Schutyser, W.; Vanholme, R.; Driessen, T.; Koelewijn, S.F.; Renders, T.; De Meester, B.; Huijgen, W.J.J.; Dehaen, W.; Courtin, C.M. Reductive lignocellulose fractionation into soluble lignin-derived phenolic monomers and dimers and processable carbohydrate pulps. Energy Environ. Sci. 2015, 8, 1748–1763. [Google Scholar] [CrossRef] [Green Version]
  12. Galkin, M.V.; Smit, A.T.; Subbotina, E.; Artemenko, K.A.; Bergquist, J.; Huijgen, W.J.J.; Samec, J.S.M. Hydrogen-free catalytic fractionation of woody biomass. ChemSusChem 2016, 9, 3280–3287. [Google Scholar] [CrossRef] [PubMed]
  13. Anderson, E.M.; Stone, M.L.; Katahira, R.; Reed, M.; Muchero, W.; Ramirez, K.J.; Beckham, G.T.; Román-Leshkov, Y. Differ-ences in S/G ratio in natural poplar variants do not predict catalytic depolymerization monomer yields. Nat. Commun. 2019, 10, 2033. [Google Scholar] [CrossRef] [Green Version]
  14. Gasson, J.R.; Forchheim, D.; Sutter, T.; Hornung, U.; Kruse, A.; Barth, T. Modeling the Lignin Degradation Kinetics in an Ethanol/Formic Acid Solvolysis Approach. Part 1. Kinetic Model Development. Ind. Eng. Chem. Res. 2012, 51, 10595–10606. [Google Scholar] [CrossRef]
  15. Goldmann, W.M.; Anthonykutty, J.M.; Ahola, J.; Komulainen, S.; Hiltunen, S.; Kantola, A.M.; Telkki, V.-V.; Tanskanen, J. Effect of Process Variables on the Solvolysis Depolymerization of Pine Kraft Lignin. Waste Biomass Valoriz. 2020, 11, 3195–3206. [Google Scholar] [CrossRef] [Green Version]
  16. Silva, E.A.B.d.; Zabkova, M.; Araújo, J.D.; Cateto, C.A.; Barreiro, M.F.; Belgacem, M.N.; Rodrigues, A.E. An integrated process to produce vanillin and lignin-based polyurethanes from Kraft lignin. Chem. Eng. Res. Des. 2009, 87, 1276–1292. [Google Scholar] [CrossRef]
  17. Chakar, F.S.; Ragauskas, A.J. Review of current and future softwood kraft lignin process chemistry. Ind. Crops Prod. 2004, 20, 131–141. [Google Scholar] [CrossRef]
  18. Pandey, M.P.; Kim, C.S. Lignin Depolymerization and Conversion: A Review of Thermochemical Methods. Chem. Eng. Technol. 2011, 34, 29–41. [Google Scholar] [CrossRef]
  19. Kalogiannis, K.G.; Stefanidis, S.; Marianou, A.; Michailof, C.; Kalogianni, A.; Lappas, A. Lignocellulosic Biomass Fractionation as a Pretreatment Step for Production of Fuels and Green Chemicals. Waste Biomass Valoriz. 2015, 6, 781–790. [Google Scholar] [CrossRef]
  20. Li, M.-F.; Sun, S.-N.; Xu, F.; Sun, R.-C. Organosolv Fractionation of Lignocelluloses for Fuels, Chemicals and Materials: A Biorefinery Processing Perspective. In Biomass Conversion: The Interface of Biotechnology, Chemistry and Materials Science; Baskar, C., Baskar, S., Dhillon, R.S., Eds.; Springer: Berlin/Heidelberg, Germany, 2012; pp. 341–379. [Google Scholar] [CrossRef]
  21. Kádár, Z.; Szengyel, Z.; Réczey, K. Simultaneous saccharification and fermentation (SSF) of industrial wastes for the production of ethanol. Ind. Crops Prod. 2004, 20, 103–110. [Google Scholar] [CrossRef]
  22. Nilsson, U.; Barron, N.; McHale, L.; McHale, A.P. The effects of phosphoric acid pretreatment on conversion of cellulose to ethanol at 45 °C using the thermotolerant yeast Kluyveromyces marxianus IMB3. Biotechnol. Lett. 1995, 17, 985–988. [Google Scholar] [CrossRef]
  23. Galbe, M.; Wallberg, O. Pretreatment for biorefineries: A review of common methods for efficient utilisation of lignocellulosic materials. Biotechnol. Biofuels 2019, 12, 294. [Google Scholar] [CrossRef] [Green Version]
  24. Echresh Zadeh, Z.; Abdulkhani, A.; Saha, B. Characterization of Fast Pyrolysis Bio-Oil from Hardwood and Softwood Lignin. Energies 2020, 13, 887. [Google Scholar] [CrossRef] [Green Version]
  25. Du, B.; Chen, C.; Sun, Y.; Yu, M.; Yang, M.; Wang, X.; Zhou, J. Catalytic conversion of lignin to bio-oil over PTA/MCM-41 catalyst assisted by ultrasound acoustic cavitation. Fuel Process. Technol. 2020, 206, 106479. [Google Scholar] [CrossRef]
  26. Kang, S.; Li, X.; Fan, J.; Chang, J. Hydrothermal conversion of lignin: A review. Renew. Sustain. Energy Rev. 2013, 27, 546–558. [Google Scholar] [CrossRef]
  27. Liu, T.; Mori, A.; Arai, R.; Asano, S.; Kudo, S.; Hayashi, J.-I. Selective Production of Phenolic Monomers and Biochar by Py-rolysis of Lignin with Internal Recycling of Heavy Oil. Energy Fuels 2020, 34, 7183–7189. [Google Scholar] [CrossRef]
  28. Camas, K.L.; Ullah, A. Depolymerization of lignin into high-value products. Biocatal. Agric. Biotechnol. 2022, 40, 102306. [Google Scholar] [CrossRef]
  29. Kleinert, M.; Barth, T. Towards a Lignincellulosic Biorefinery: Direct One-Step Conversion of Lignin to Hydrogen-Enriched Biofuel. Energy Fuels 2008, 22, 1371–1379. [Google Scholar] [CrossRef]
  30. Kleinert, M.; Barth, T. Phenols from Lignin. Chem. Eng. Technol. 2008, 31, 736–745. [Google Scholar] [CrossRef]
  31. Kleinert, M.; Gasson, J.R.; Barth, T. Optimizing solvolysis conditions for integrated depolymerisation and hydrodeoxygenation of lignin to produce liquid biofuel. J. Anal. Appl. Pyrolysis 2009, 85, 108–117. [Google Scholar] [CrossRef] [Green Version]
  32. Liguori, L.; Barth, T. Palladium-Nafion SAC-13 catalysed depolymerisation of lignin to phenols in formic acid and water. J. Anal. Appl. Pyrolysis 2011, 92, 477–484. [Google Scholar] [CrossRef]
  33. Løhre, C.; Barth, T.; Kleinert, M. The effect of solvent and input material pretreatment on product yield and composition of bio-oils from lignin solvolysis. J. Anal. Appl. Pyrolysis 2016, 119, 208–216. [Google Scholar] [CrossRef]
  34. Oregui Bengoechea, M.; Hertzberg, A.; Miletić, N.; Arias, P.L.; Barth, T. Simultaneous catalytic de-polymerization and hydrodeoxygenation of lignin in water/formic acid media with Rh/Al2O3, Ru/Al2O3 and Pd/Al2O3 as bifunctional catalysts. J. Anal. Appl. Pyrolysis 2015, 113, 713–722. [Google Scholar] [CrossRef] [Green Version]
  35. Oregui-Bengoechea, M.; Gandarias, I.; Arias, P.L.; Barth, T. Unraveling the Role of Formic Acid and the Type of Solvent in the Catalytic Conversion of Lignin: A Holistic Approach. ChemSusChem 2017, 10, 754–766. [Google Scholar] [CrossRef]
  36. Løhre, C.; Halleraker, H.V.; Barth, T. Composition of Lignin-to-Liquid Solvolysis Oils from Lignin Extracted in a Semi-Continuous Organosolv Process. Int. J. Mol. Sci. 2017, 18, 225. [Google Scholar] [CrossRef] [Green Version]
  37. Løhre, C.; Kleinert, M.; Barth, T. Organosolv extraction of softwood combined with lignin-to-liquid-solvolysis as a semi-continuous percolation reactor. Biomass Bioenergy 2017, 99, 147–155. [Google Scholar] [CrossRef]
  38. Castro, R.C.A.; Ferreira, I.S.; Roberto, I.C.; Mussatto, S.I. Isolation and physicochemical characterization of different lignin streams generated during the second-generation ethanol production process. Int. J. Biol. Macromol. 2019, 129, 497–510. [Google Scholar] [CrossRef] [PubMed]
  39. Kalogiannis, K.G.; Stefanidis, S.D.; Michailof, C.M.; Lappas, A.A.; Sjöholm, E. Pyrolysis of lignin with 2DGC quantification of lignin oil: Effect of lignin type, process temperature and ZSM-5 in situ upgrading. J. Anal. Appl. Pyrolysis 2015, 115, 410–418. [Google Scholar] [CrossRef]
  40. Katsimpouras, C.; Kalogiannis, K.G.; Kalogianni, A.; Lappas, A.A.; Topakas, E. Production of high concentrated cellulosic ethanol by acetone/water oxidized pretreated beech wood. Biotechnol. Biofuels 2017, 10, 54. [Google Scholar] [CrossRef] [PubMed] [Green Version]
  41. Dimos, K.; Paschos, T.; Louloudi, A.; Kalogiannis, K.G.; Lappas, A.A.; Papayannakos, N.; Kekos, D.; Mamma, D. Effect of Various Pretreatment Methods on Bioethanol Production from Cotton Stalks. Fermentation 2019, 5, 5. [Google Scholar] [CrossRef] [Green Version]
  42. Abdi, H.; Williams, L.J. Principal component analysis. WIREs Comput. Stat. 2010, 2, 433–459. [Google Scholar] [CrossRef]
  43. Grung, B. Det matematiske grunnlaget for latent variabel-metoder. In Anvendelse av Kjemometri Innen Forskning og Industri; Nortvedt, R., Brakstad, F., Kvalheim, O.M., Lundstedt, T., Eds.; Norsk Kjemisk Selskap and The Swedish Chemical Society: Bergen, Norway, 1996; pp. 121–144. [Google Scholar]
  44. Carlson, R.; Carlson, J.E. Chapter 18: Quantitative relations: Observed responses and experimental variations. In Design and Optimization in Organic Synthesis; Elsevier: Amsterdam, The Netherlands, 2005. [Google Scholar]
  45. Oregui Bengoechea, M.; Miletíc, N.; Vogt, M.H.; Arias, P.L.; Barth, T. Analysis of the effect of temperature and reaction time on yields, compositions and oil quality in catalytic and non-catalytic lignin solvolysis in a formic acid/water media using experi-mental design. Bioresour. Technol. 2017, 234, 86–98. [Google Scholar] [CrossRef] [PubMed]
  46. Holmelid, B.; Kleinert, M.; Barth, T. Reactivity and reaction pathways in thermochemical treatment of selected lig-nin-like model compounds under hydrogen rich conditions. JAAP 2012, 98, 37–44. [Google Scholar] [CrossRef]
  47. Løhre, C.; Laugerud, G.-A.A.; Huijgen, W.J.J.; Barth, T. Lignin-to-Liquid-Solvolysis (LtL) of Organosolv Extracted Lignin. ACS Sustain. Chem. Eng. 2018, 6, 3102–3112. [Google Scholar] [CrossRef]
  48. National Center for Biotechnology Information. PubChem Database. Guaiacol, CID = 460. Available online: https://pubchem.ncbi.nlm.nih.gov/compound/guaiacol (accessed on 3 July 2020).
  49. National Center for Biotechnology Information. PubChem Database. 2-Methoxy-4-methylphenol, CID = 7144. Available online: https://pubchem.ncbi.nlm.nih.gov/compound/2-Methoxy-4-methylphenol (accessed on 3 July 2020).
  50. National Center for Biotechnology Information. PubChem Database. 4-Ethyl-2-methoxyphenol, CID = 62465. Available online: https://pubchem.ncbi.nlm.nih.gov/compound/4-Ethyl-2-methoxyphenol (accessed on 3 July 2020).
  51. National Center for Biotechnology Information. PubChem Database. 2-Methoxy-4-propylphenol, CID = 17739. Available online: https://pubchem.ncbi.nlm.nih.gov/compound/2-Methoxy-4-propylphenol (accessed on 3 July 2020).
  52. Alhassan, Y.; Hornung, U.; Bugaje, I.M. Lignin Hydrothermal Liquefaction into Bifunctional Chemicals: A Concise Review. In Biorefinery Concepts; IntechOpen: London, UK, 2020. [Google Scholar]
  53. Fiege, H.; Voges, H.-W.; Hamamoto, T.; Umemura, S.; Iwata, T.; Miki, H.; Fujita, Y.; Buysch, H.-J.; Garbe, D.; Paulus, W. Phenol Derivatives. In Ullmann’s Encyclopedia of Industrial Chemistry; Wiley-VCH Verlag GmbH & Co. KGaA: Hoboken, NJ, USA, 2000. [Google Scholar] [CrossRef]
  54. Weber, M.; Weber, M. Phenols. In Phenolic Resins: A Century of Progress; Pilato, L., Ed.; Springer: Berlin/Heidelberg, Germany, 2010; pp. 9–23. [Google Scholar] [CrossRef]
Figure 1. Chromatogram of the oil from experiment SW1-kraft-360. Peaks from impurities in the solvent are in grey. Internal standard (IS) is hexadecane.
Energies 15 04707 g001
Figure 2. Chromatogram of the oil from experiment HW1-wetox-360. Peaks from impurities in the solvent are in grey. Internal standard (IS) is hexadecane.
Energies 15 04707 g002
Figure 3. Chromatogram of the oil from experiment G3-deac-360. Internal standard (IS) is hexadecane.
Energies 15 04707 g003
Figure 4. Quantification of guaiacol and selected substituted guaiacols in the produced bio-oils, given as wt.% in the obtained bio-oil. Sample names are specified in the experimental section.
Energies 15 04707 g004
Figure 5. Quantification of catechol and selected substituted catechols in the produced bio-oils, given as wt.% in the obtained bio-oil.
Energies 15 04707 g005
Figure 6. Quantification of phenol, selected substituted phenols and 2-(4-hydroxyphenyl) ethanol in the produced bio-oils, given as wt.% in the obtained bio-oil.
Energies 15 04707 g006
Figure 7. Quantification of syringol, 3-methoxy catechol, and 2-naphthol, given as wt.% in the obtained bio-oil.
Energies 15 04707 g007
Figure 8. Van Krevelen plot displaying the oxygen to carbon ratio (x-axis) and hydrogen to carbon ratio (y-axis) of samples of lignin feedstock and LtL-oils. The ratios are based on mol% (all samples were analyzed in duplicates and presented in this plot as an average of the two analyses. Where replicate experiments were performed, the average of the experiments in question is presented in this plot).
Energies 15 04707 g008
Figure 9. Multivariate regression model of predicted vs. measured oil yield based on the elemental analysis of lignin as specified in Equation (4). The regression coefficient is 0.87.
Energies 15 04707 g009
Figure 10. LtL-oil yield and solid yield presented as the weight percent of lignin input. SW3 experiments are included for comparison. The gas yields are given as a continuous line. Gas yields larger than 100% imply a significant contribution of gas-phase products from lignin feedstock reactions. All results regarding SW3 have previously been published in Løhre et al. [36].
Energies 15 04707 g010
Figure 11. Biplot containing all variables and all experiments from this work. Experiments done with kraft-lignin are marked in green, the blue experiments are done with lignin from oxidative preprocessing, and the red experiments are performed with lignin from a deacetylation preprocessing.
Energies 15 04707 g011
Table 1. Lignin characteristics. Elemental ratio based on mol%.
SampleSourceDelignification MethodElemental Ratio (Moles)
O/CH/C
SW1SoftwoodKraft0.711.35
SW2SoftwoodKraft0.381.14
SW3 [a]Spruce (90%)Organosolv0.331.08
SW4Spruce (90%)Acetone/Water oxidation0.471.07
HW1BeechwoodAcetone/Water oxidation0.421.19
HW2BeechwoodMilox0.831.36
G1Corn StoverAcetone/Water oxidation0.421.07
G2Rice strawDeacetylation0.841.63
G3Rice strawDeacetylation0.981.55
G4Rice strawDeacetylation0.971.68
G5Rice strawAcid precipitated0.721.39
[a] SW3 added as a comparison. All results regarding SW3 have previously been published [36].
Table 2. Lignin and carbohydrate contents of the samples [a].
SampleAcid Insoluble Lignin (wt.%)Acid Soluble Lignin (wt.%)Glucan (wt.%)Xylan (wt.%)
SW153.513.4**
SW290.7 2.0 0.4 1.3
SW3 [36]94.90.5**
SW481.47.5**
HW188.33.80.10.5
HW217.511.02.124.4
G188.43.60.10.2
G243.24.68.4 3.4
G344.4 5.0 6.8 3.6
G438.4 3.6 12.2 6.9
G554.6 7.0 2.2 5.7
* Not measured. [a] Values taken from [22,36].
Table 3. Experimental conditions.
ExperimentLignin
g
Water
mL
Water
g
Formic Acid
mL
Formic Acid
g
Time
h
Temperature
°C
SW1-kraft-3200.524.04.01.01.222320
SW1-kraft-3600.524.04.01.01.222360
SW2-kraft-3200.524.04.01.01.222320
SW2-kraft-3600.524.04.01.01.222360
SW3-org-320 [a]0.514.04.01.01.222320
SW3-org-360 [a]0.514.04.01.01.222360
SW4-wetox-3200.504.04.01.01.222320
SW4-wetox-3600.504.04.01.01.222360
HW1-wetox-3200.524.04.01.01.222320
HW1-wetox-3600.524.04.01.01.222360
HW2-milox-3200.524.04.01.01.222320
HW2-milox-3600.524.04.01.01.222360
G1-wetox-3200.524.04.01.01.222320
G1-wetox-3600.524.04.01.01.222360
G2-deac-3200.524.04.01.01.222320
G2-deac-3600.524.04.01.01.222360
G3-deac-3200.524.04.01.01.222320
G3-deac-3600.524.04.01.01.222360
G4-deac-3200.524.04.01.01.222320
G4-deac-3600.524.04.01.01.222360
G5-acid-3200.524.04.01.01.222320
G5-acid-3600.524.04.01.01.222360
[a] SW3 added as a comparison. All results regarding SW3 have previously been published [36].
Table 4. Specification of GC-MS instrument and instrumental conditions.
Gas chromatographAgilent Technologies 7890A
Mass spectrometry detectorAgilent Technologies 5977A
ColumnAgilent Technologies 30 m HP-5ms column with 250 µm ID and thickness of 0.25 µm
ModeSplitless
Injection volume1 µL
Injector temperature280 °C
Carrier gasHelium
Flow1 mL/min
Detector temperature250 °C
Table 5. Temperature programs for the GC analysis.
Qualitative AnalysisSolvent delay4.6 min
Start temperature40 °CHold time 5 min
Heating rate 16 °C/minHold time 0 minFinal temperature 280 °C
Heating rate 240 °C/minHold time 5 minFinal temperature 300 °C
Quantitative AnalysisSolvent delay11 min
Start temperature40 °CHold time 5 min
Heating rate 16 °C/minHold time 5 minFinal temperature 73 °C
Heating rate 26 °C/minHold time 0 minFinal temperature 280 °C
Heating rate 340 °C/minHold time 5 minFinal temperature 300 °C
Table 6. Results from LtL-solvolysis, yields. The naming of the experiments is specified in Table 3 in the experimental section. The experiments with an oil yield of more than 60% are in bold.
ExperimentLtL-Oil
wt.% of Lignin Input
Gas
wt.% of FA Input
Aq. Ph. [c]
wt.% of Solvent Input
Solids
wt.% of Lignin Input
Total Mass Recovery
wt.%
SW1-kraft-320 [a]50.6 ± 2.194.3 ± 4.187.625.4 ± 1.387.6
SW1-kraft-360 [a]46.3 ± 9.698.4 ± 094.913.5 ± 1.792.1
SW2-kraft-32077.490.293.213.692.0
SW2-kraft-36081.390.294.711.493.2
SW3-org-320 [b]94.290.299.19.797.6
SW3-org-360 [b]88.798.496.65.796.8
SW4-wetox-32039.695.995.210.891.1
SW4-wetox-36052.897.592.923.892.0
HW1-wetox-32068.298.494.114.493.6
HW1-wetox-36063.590.297.46.593.0
HW2-milox-320 [a]31.3 ± 0.6102.5 ± 4.175.123.3 ± 1.278.8
HW2-milox-360 [a]35.7 ± 1.4106.6 ± 097.610.4 ± 1.194.5
G1-wetox-32048.398.490.727.790.6
G1-wetox-360 [a]47.5 ± 2.798.2 ± 0.193.818.1 ± 3.292.9
G2-deac-32026.598.489.925.787.9
G2-deac-36034.598.489.925.787.9
G3-deac-32034.190.280.231.180.6
G3-deac-36030.698.480.328.281.9
G4-deac-32024.390.288.524.885.0
G4-deac-36031.2106.687.320.587.8
G5-acid-32033.190.294.418.589.2
G5-acid-36042.298.483.512.083.6
[a] Values presented are an average of replicate experiments, and the uncertainty is the calculated standard deviation. [b] Results previously published by Løhre et al. [36]. [c] Aq.Ph. = aqueous phase.
Publisher’s Note: MDPI stays neutral with regard to jurisdictional claims in published maps and institutional affiliations.

