
Performance Estimation of a Downsized SI Engine Running with Hydrogen


Department of Civil and Mechanical Engineering, University of Cassino and Southern Latium, 03043 Cassino, Italy
*
Author to whom correspondence should be addressed.
Energies 2022, 15(13), 4744; https://0-doi-org.brum.beds.ac.uk/10.3390/en15134744
Submission received: 30 May 2022
/
Revised: 24 June 2022
/
Accepted: 26 June 2022
/
Published: 28 June 2022
(This article belongs to the Special Issue Hydrogen-Fuelled Spark-Ignition Engines)
Abstract
:Hydrogen is a carbon-free fuel that can be produced in many ways starting from different sources. Its use as a fuel in internal combustion engines could be a method of significantly reducing their environmental impact. In spark-ignition (SI) engines, lean hydrogen–air mixtures can be burnt. When a gaseous fuel like hydrogen is port-injected in an SI engine, working with lean mixtures, supercharging becomes very useful in order not to excessively penalize the engine performance. In this work, the performance of a turbocharged PFI spark-ignition engine fueled by hydrogen has been investigated by means of 1-D numerical simulations. The analysis focused on the engine behavior both at full and partial load considering low and medium engine speeds (1500 and 3000 rpm). Equivalence ratios higher than 0.35 have been considered in order to ensure acceptable cycle-to-cycle variations. The constraints that ensure the safety of engine components have also been respected. The results of the analysis provide a guideline able to set up the load control strategy of a SI hydrogen engine based on the variation of the air to fuel ratio, boost pressure, and throttle opening. Furthermore, performance and efficiency of the hydrogen engine have been compared to those of the base gasoline engine. At 1500 and 3000 rpm, except for very low loads, the hydrogen engine load can be regulated by properly combining the equivalence ratio and the boost pressure. At 3000 rpm, the gasoline engine maximum power is not reached but, for each engine load, lean burning allows the hydrogen engine achieving much higher efficiencies than those of the gasoline engine. At full load, the maximum power output decreases from 120 kW to about 97 kW, but the engine efficiency of the hydrogen engine is higher than that of the gasoline one for each full load operating point.
1. Introduction
To reduce the environmental impact of internal combustion engines, it is mandatory to explore the potential of new “green fuels” able to guarantee good performance associated with a small environmental impact.
Hydrogen is an important energy carrier that can be obtained in many ways, such as steam-reforming, chemical or biological processes, and gasification [1]. When produced from renewable sources, hydrogen is the green fuel par excellence. It is a carbon-free fuel, so its combustion does not generate CO2 nor CO, PM, or UHC. When it is burned with air, the only pollutants emitted are NOx due to the in-air nitrogen fraction.
Hydrogen can be used as a fuel in ICEs, both as a neat fuel [2,3] and as an additive [4]. It is mainly suited for spark-ignition engines [5], working also with lean mixtures [6]. Hydrogen can be introduced into the engine using both direct and port injection [7].
Table 1 compares some properties of hydrogen and gasoline. Hydrogen has a better knock resistance, therefore a higher geometrical compression ratio and/or higher boost ratios can be employed in downsized engines. Due to the high molecular diffusivity and low activation energy, it can operate on a wider flammability rate respect to gasoline, from 4 to 75% of volume in air, allowing lean and very lean combustion with an acceptable cycle-to-cycle variation [8]. Furthermore, hydrogen has a higher laminar burn velocity, about six times higher than gasoline and methane [9,10,11]. This allows fast combustion, increasing the combustion efficiency. Lean, stable, and fast combustion processes allow the engine load adjustment by varying the air to fuel ratio, like a diesel engine reducing the throttled operation in spark-ignition engines. This is clearly positive for the engine efficiency [12,13].
Furthermore, compared to traditional fuels, hydrogen is characterized by a very high lower calorific value [1]. However, considering its use in volumetric machines, it is more correct to evaluate the heat released per volume unit of the burnt mixture. As displayed in Table 1, considering an air–fuel mixture at 298 K and 1 bar, the heat released by a stoichiometric air–hydrogen mixture is 16.7% lower than the heat released by a stoichiometric air–gasoline mixture. Keeping the same temperature, Figure 1 indicates that the same heat released by a volume unit of stoichiometric air–gasoline mixture can be obtained, increasing 1.2 times the pressure of a stoichiometric air–hydrogen mixture, or 1.6 times the pressure of an air–hydrogen mixture characterized by an equivalence ratio equal to 0.7. This proves that supercharging becomes important when using hydrogen as a fuel, in particular to achieve lean combustion without penalizing the engine power output too much.
Verhelst et al. [16] studied the effect of supercharging coupled with exhaust gas recirculation on an engine running with stoichiometric air–hydrogen mixture. They obtained a power gain of nearly 30% compared to the power output of a similar naturally aspirated gasoline engine. In [17], analyzing the effect of an external supercharger on the combustion performance of a spark-ignition engine, the authors discovered that a boost pressure of 40 kPa increases the thermal efficiency of 14.2%. Studying a plume ignition combustion process in a single cylinder direct injection hydrogen engine, Oikawa et al. [18] highlighted that the boost pressure increasing determines a decrease of hydrogen unburnt and an improvement of thermal efficiency. Nevertheless, they discovered an increase of NOx production.
The effects of both equivalence ratio and compression ratio was experimentally investigated by Pandey and Kumar [19]. They analyzed the performance of a PFI naturally aspirated engine, varying the compression ratio (CR) from 10 to 15 and the equivalence ratio (ϕ) from 0.4 to 1. They discovered that the increase in CR leads to better combustion characteristics, higher-pressure peak, and a higher NOx amount. The best thermal efficiency has been achieved for a compression ratio equal to 15 and an equivalence ratio equal to 0.7.
Luo et al. [20,21] measured the combustion characteristics and NOx emissions in a port fuel injection engine operating with an equivalence ratio equal to 0.55 at different speeds and loads. They also analyzed the influence of the equivalence ratio on a given engine operating point varying ϕ between 0.4 and 1.1. They discovered that the engine delivers the maximum power when it runs with an equivalence ratio equal to about 0.9, while the efficiency remains approximately constant and equal to its maximum value for ϕ ranging from 0.65 to 0.8, while it decreases for richer or leaner mixtures. They also discovered acceptable engine cycle variations for all the investigated ϕ.
A technical drawback of PFI hydrogen engines is the backfire. Gao et al. [22] analyzed the influence of valve timing, fuel injection, fuel–air equivalence ratio, compression ratio, combustion duration, residual exhaust gas, and hot spot on this phenomenon. They highlighted that it is important to consider and optimize all these parameters in order to develop suitable control strategies.
The most important problem concerning the hydrogen usage in transportation is its low energy content for volume unit. However, together with conventional physically based (compressed and liquid) storages, new material-based (adsorbent or absorbent) storages can provide technologically viable solutions [23]. Furthermore, ammonia can be a suitable hydrogen carrier [24].
The aim of this work is to analyze, by means of numerical simulations, the behavior of downsized SI engines developed for gasoline vehicles and converted to run with hydrogen. Considering an automotive application, focus is on the engine behavior both at full and partial load considering low and medium engine speed. A load control strategy based on the variation of the air to fuel ratio, boost pressure, and throttle opening has been defined. The main objective of this paper is to evaluate the potential of SI hydrogen engines for light duty vehicles comparing the hydrogen engine performances to those of the base gasoline engine. The authors want to highlight that the numerical results, presented in this first step of the research, may be useful in providing a guideline to set up the correct control strategy rather than the exact project parameters of an air–hydrogen fueling.
2. Materials and Methods
To investigate the potential of hydrogen fueling, a turbocharged, port fuel injection, spark-ignition engine developed to run with straight regular grade gasoline fueling has been considered (Table 2).
The engine features four cylinders: four valves per cylinder and a pent-roof combustion chamber. The intake ducts are shaped to produce a strong tumble motion able to generate high turbulence levels at the end of compression. The geometrical compression ratio is 9.8, quite high considering the usual gasoline engines. A waste-gate turbocharger group allows for performing a very high specific power. As usual in turbocharged SI engine, particularly rich mixtures must be used at high load levels to prevent knocking and to limit the exhaust gas temperature at turbine inlet.
The entire engine layout (Figure 2) has been modelled by means of a 1-D approach already described in previous papers [25,26].
The in-pipe flow has been estimated by means of the finite volume approach, while the turbocharger has been modeled using the steady flow maps provided by the manufacturer. However, the turbine inlet scroll has been modeled as a duct to consider the propagation of pressure waves. To allow the boost pressure control, a part of the exhaust may bypass the turbine simulating the action of the wastegate valve.
The burn rate is described by a quasi-dimensional predictive approach, considering the combustion chamber geometry, the spark location and timing, the air motion, and the fuel properties. A spherical flame propagates from the spark plug, while a turbulent entrainment process controls the combustion rate, portrayed in Equations (1) and (2)
where Me is the mass of the fresh gas mixture entering the flame front and Mb is the burned mass. Af is the surface area at the edge of the flame front, ρe is the fresh gas density, u′ is the turbulent intensity and SL is the laminar flame speed. τ is a time constant depending on the ratio between the Taylor microscale of turbulence and the laminar flame speed. The Taylor scale is calculated as a function of the integral length of turbulence and the kinematic viscosity of the unburned mixture. Following a hierarchical approach described in [27], both the integral length scale (li) and the turbulent intensity (u′) have been imposed exploiting the flow field details provided by 3-D calculations.
In order to predict the knocking phenomena, Douaud and Eyzat’s approach [28] was used. Knock occurs when the induction time calculated as in Equation (3) becomes higher than one, while its intensity is calculated as in [29] Equation (4).
where is the mass of burned fuel, is the compression ratio, is the knock onset crank angle, is the engine speed. is the maximum crank angle for which knock is still audible and it is set to 50 CAD, while is a tuning parameter set equal to 3500 rpm. As in [26,30], tolerable knock conditions are assumed for values less than or equal to 0.5.
The heat transfer rate through the walls of the combustion chamber has been estimated by means of the well-known Woschni correlation, while the friction losses have been estimated as a function of the engine speed.
The model has been validated considering the engine running with pure gasoline [31] both at full and partial load. It was able to reproduce measured data with good accuracy. As an example, considering fuel consumption, turbocharger speed, and exhaust gas temperature, the average error was less than 5%. The model was also able to predict the in-cylinder pressure curves and the experimental knock limited spark advance with a confidence of about 1 crank angle degree.
Furthermore, when varying the fuel properties, the model correctly reproduced the behavior of the engine running with different alcohol–gasoline blends [25]. This encouraged the authors to use the model to predict the performance of the engine running with hydrogen. In particular, the laminar flame speed is calculated according to burning velocities obtained by the kinetic scheme proposed by O’Conaire [32], Equations (5) and (10):
where TU and P are, respectively, the temperature and pressure of the unburned mixture, and XEGR represents the mass fraction of the residual gases; P0 and T0 are the reference conditions of pressure and temperature, equal to 20 bar and 500 K.
The induction time of hydrogen–air mixtures has been calculated through the Equation (11) [33]:
where λ is the air–fuel equivalence ratio (1/ϕ). Reference conditions T0 and P0 have been fixed to 300 K and 1 bar. The coefficients a, b, c, d, e, f, g, and h are tabulated according to pressure and temperature ranges [33].
3. Results
The described 1-D approach was used in order to simulate the engine operation with hydrogen fueling. First, considering several constraints, a load control strategy was defined and the performances of the hydrogen engine were evaluated and compared to those of the gasoline engine. Then, the full load operation was investigated.
3.1. Load Control Strategy
Parametrical analyses have been performed varying the mixture’s air–fuel ratio, the boost pressure, and the spark timing. Focus is on low and medium engine speeds (1500 and 3000 rpm) that delimit the most interesting part of the engine map for automotive applications.
Constraints displayed in Table 3 have been considered. Equivalence ratios higher than 0.35 have been considered in order to ensure acceptable cycle-to-cycle variations, according to [20]. The other constraints ensure the safety of the engine components. It is worth noting that, due to hydrogen faster combustion, pressure peaks higher than those typical of gasoline are reached.
Figure 3 portrays the engine torque calculated at 1500 rpm and 3000 rpm for different boost pressure levels and equivalence ratios. At each operating point, the spark timing has been tuned to obtain the maximum engine torque according to the constraints mentioned above.
The engine torque increases almost linearly with both the mixture richness (as reported in [19]) and the boost pressure (as in [17]).
At a given engine speed, by increasing the mixture richness, the exhaust gas enthalpy content increases, allowing higher boost levels. Unfortunately, as the equivalence ratio and the boost pressure increase, the exhaust gas temperature, the peak pressure, and the knock intensity increase as well, reducing the allowable spark angle region (Figure 4). This limits the maximum torque output of the engine.
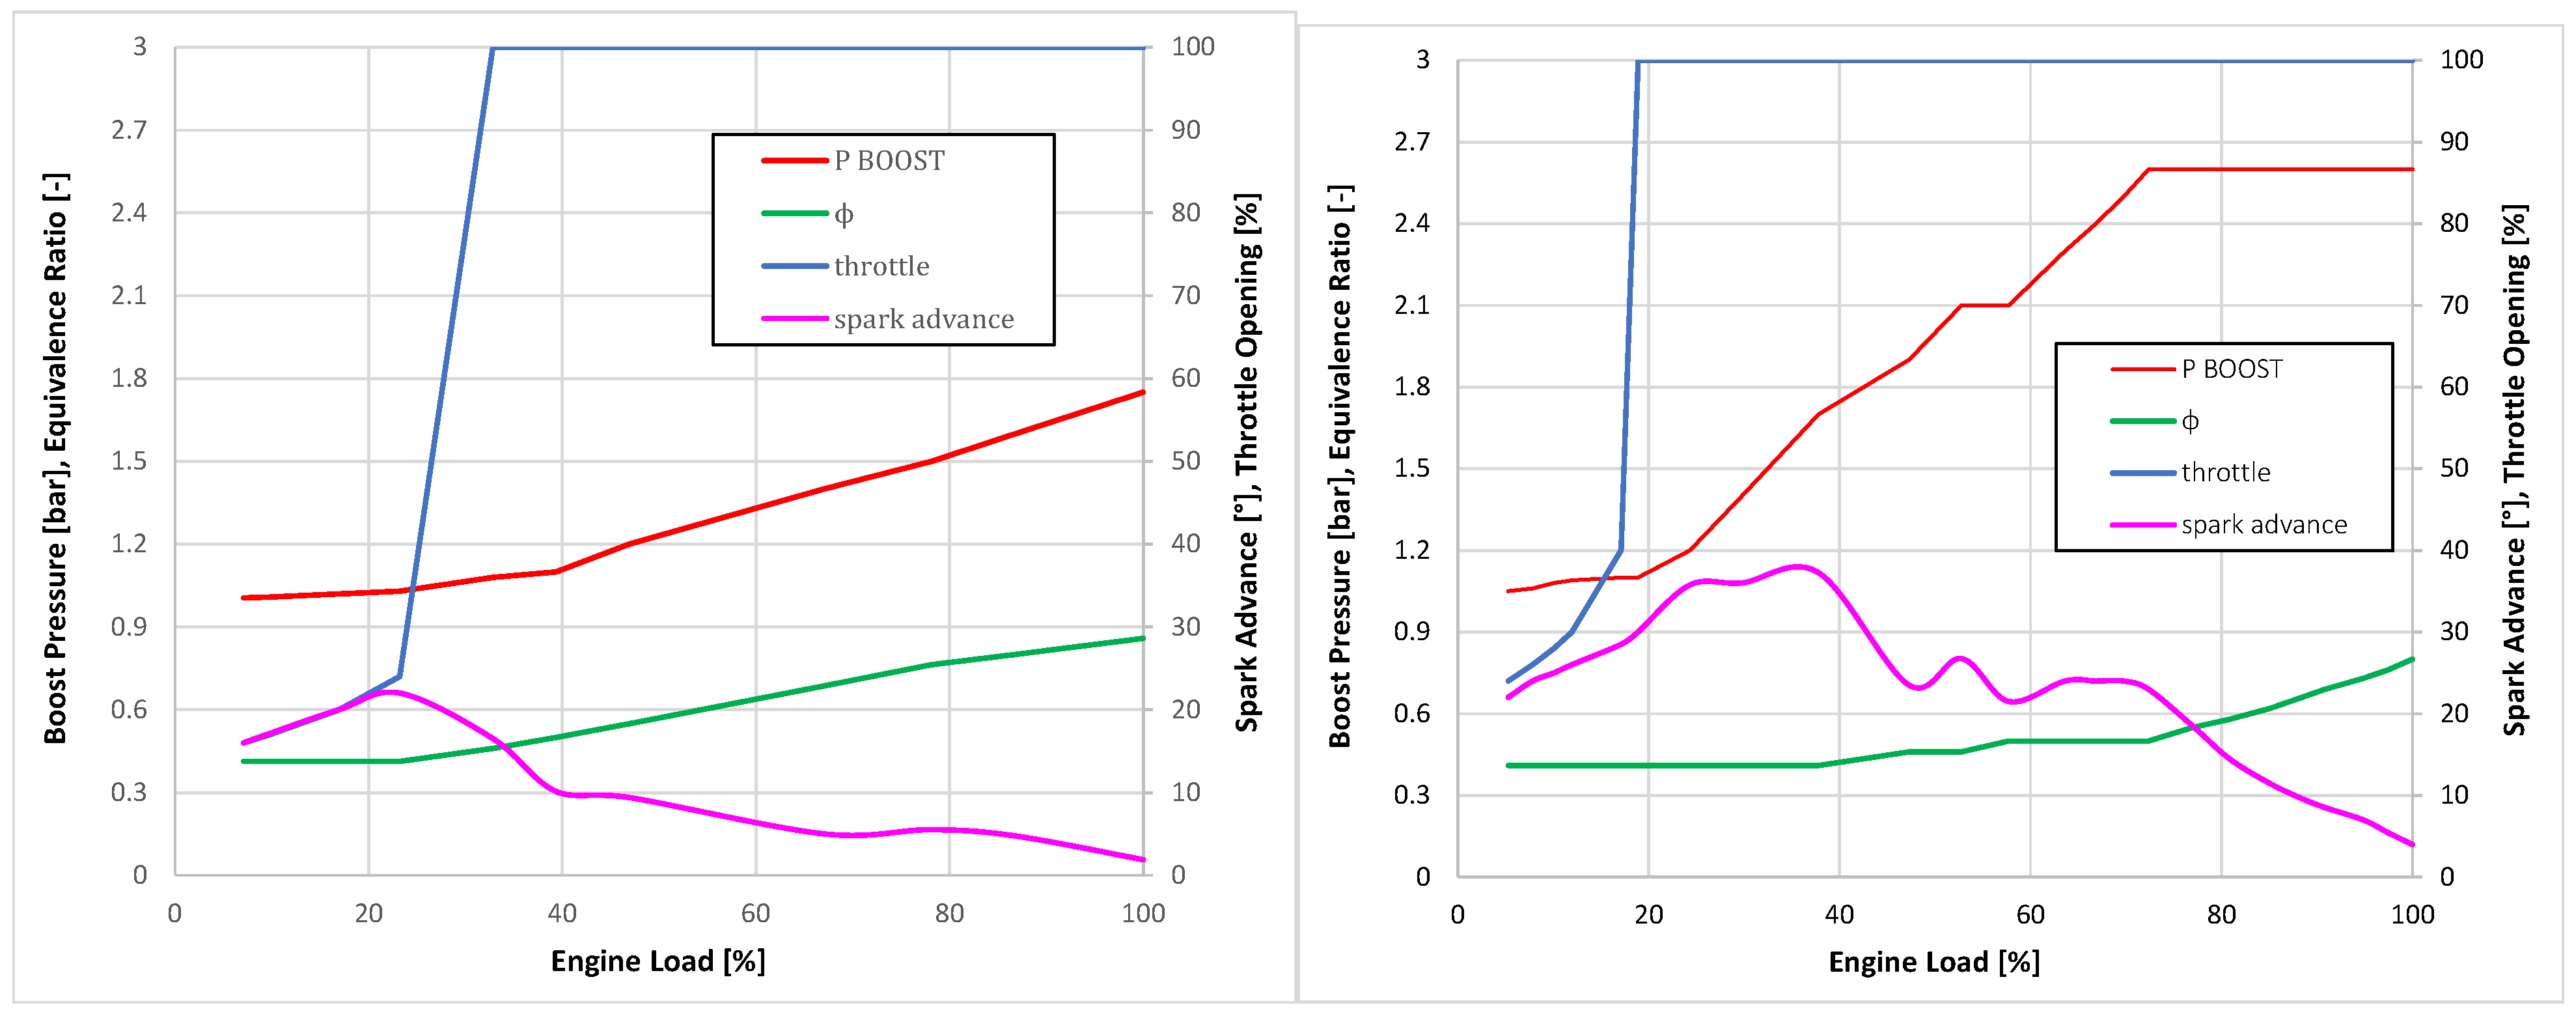
Naturally, at a given equivalence ratio, the boost pressure and the torque output can be lowered by increasing the wastegate valve opening. When the wastegate valve is fully opened (i.e., the engine is not supercharged), the delivered torque can be further lowered by throttling the engine. In this way, the engine load can be regulated by appropriately combining the mixture richness, the boost pressure, and the throttle opening.
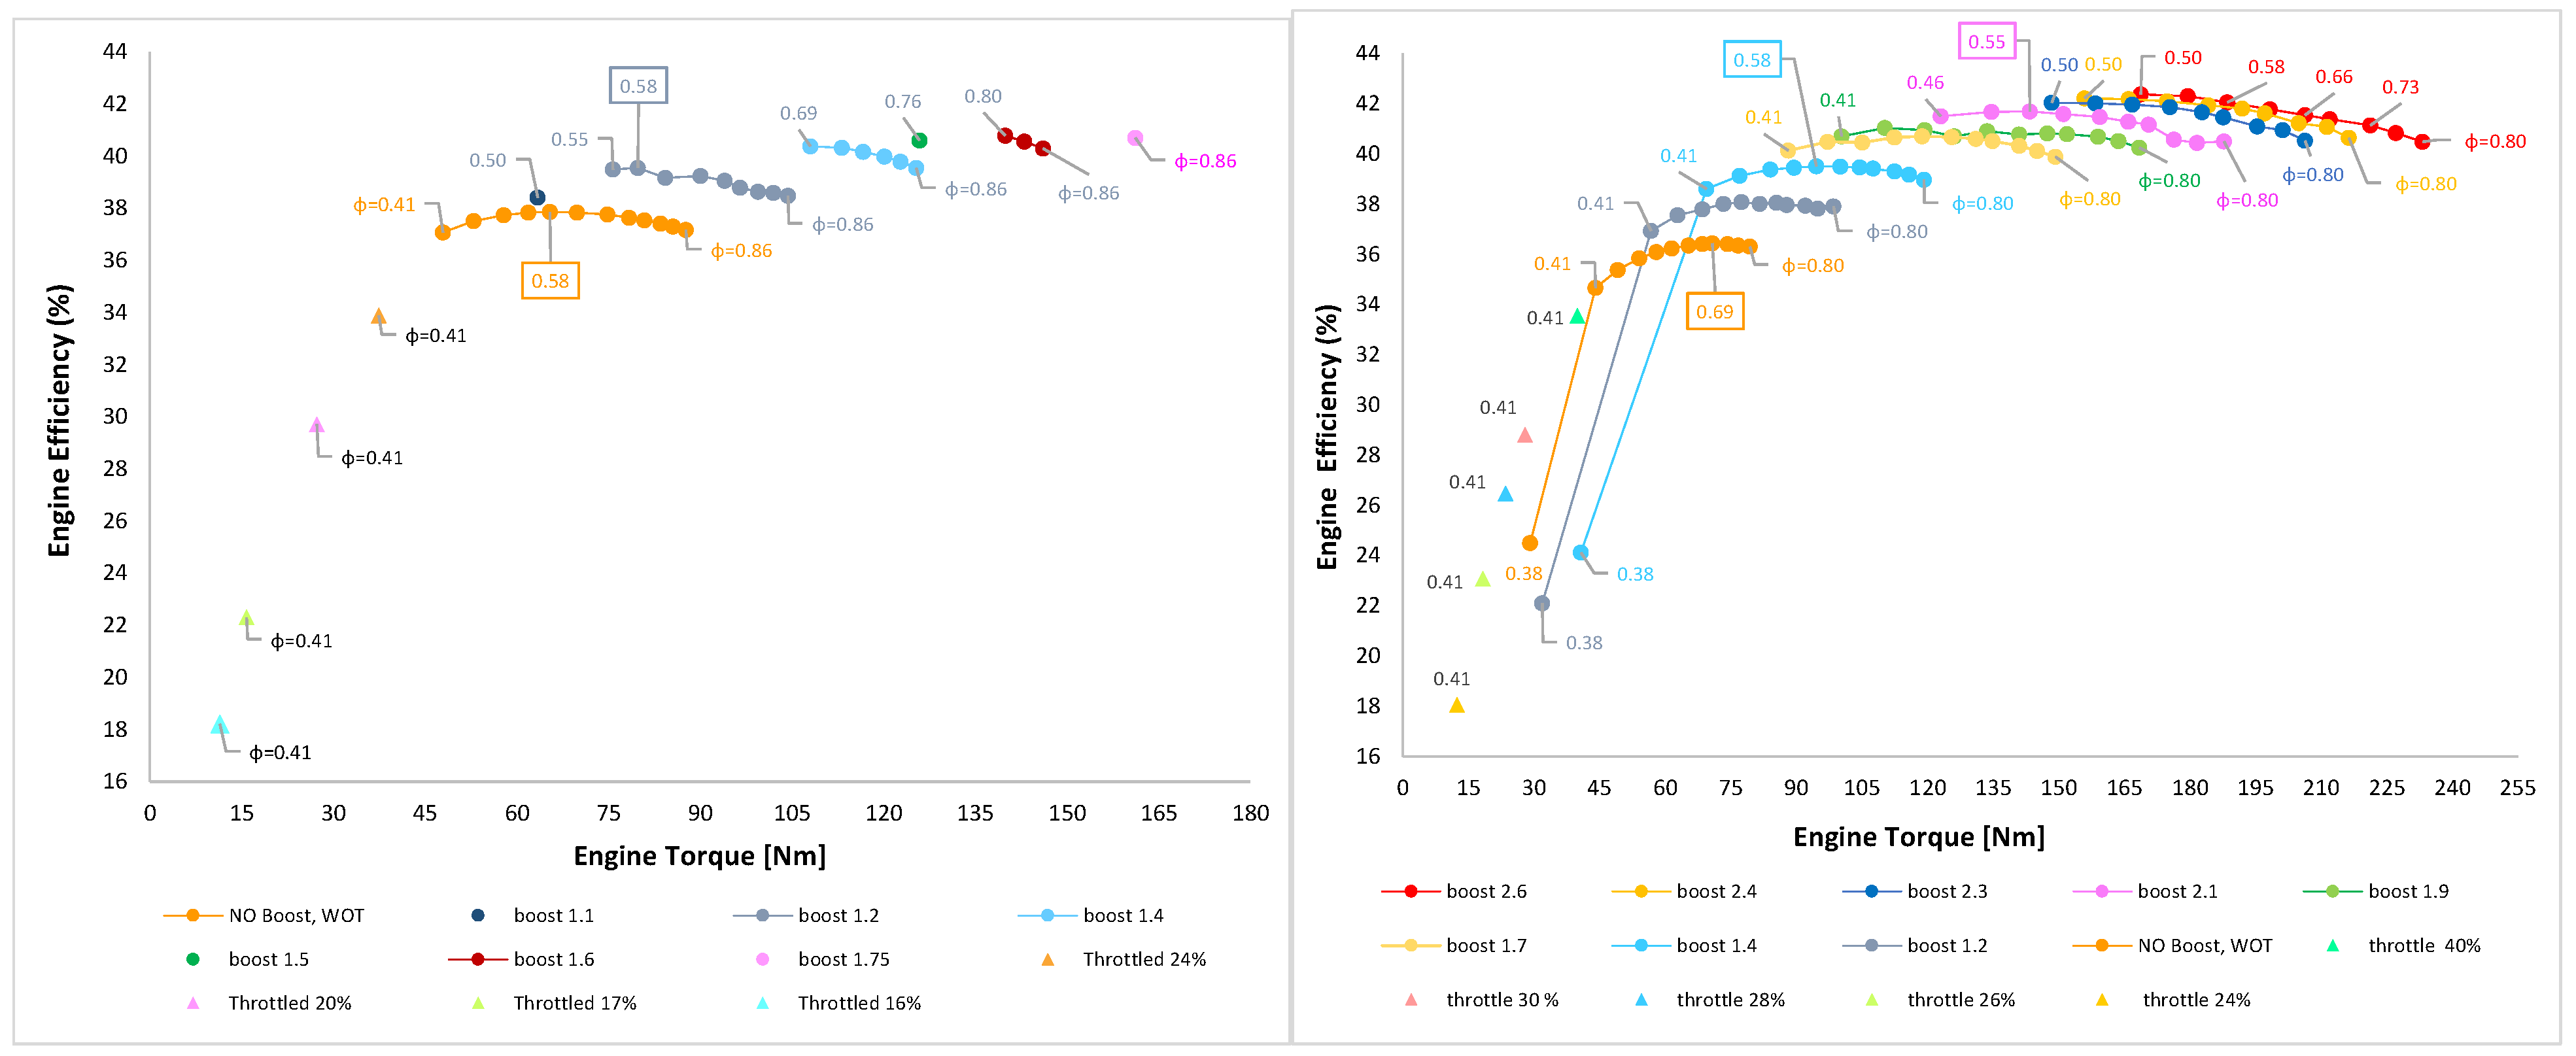
For all the investigated points, Figure 5 portrays the engine efficiency as a function of the delivered torque. When the air–fuel equivalence ratio is less than 0.4, the mixture becomes too diluted. At 1500 rpm the mixture does not burn at all, while at 3000 rpm, the combustion slows down excessively, penalizing the engine efficiency. Consequently, very low loads (i.e., engine torque less than about 45 Nm) must be achieved, keeping the equivalence ratio equal to 0.41 and throttling the engine. Figure 5 also highlights that at a given boost level, there is a value of the equivalence ratio that optimizes the engine efficiency, in agreement with the results presented in [20]. This optimal value decreases as the boost pressure increases. Figure 6 reports the optimized engine control parameters as a function of the engine load.
Optimized Engine Performance
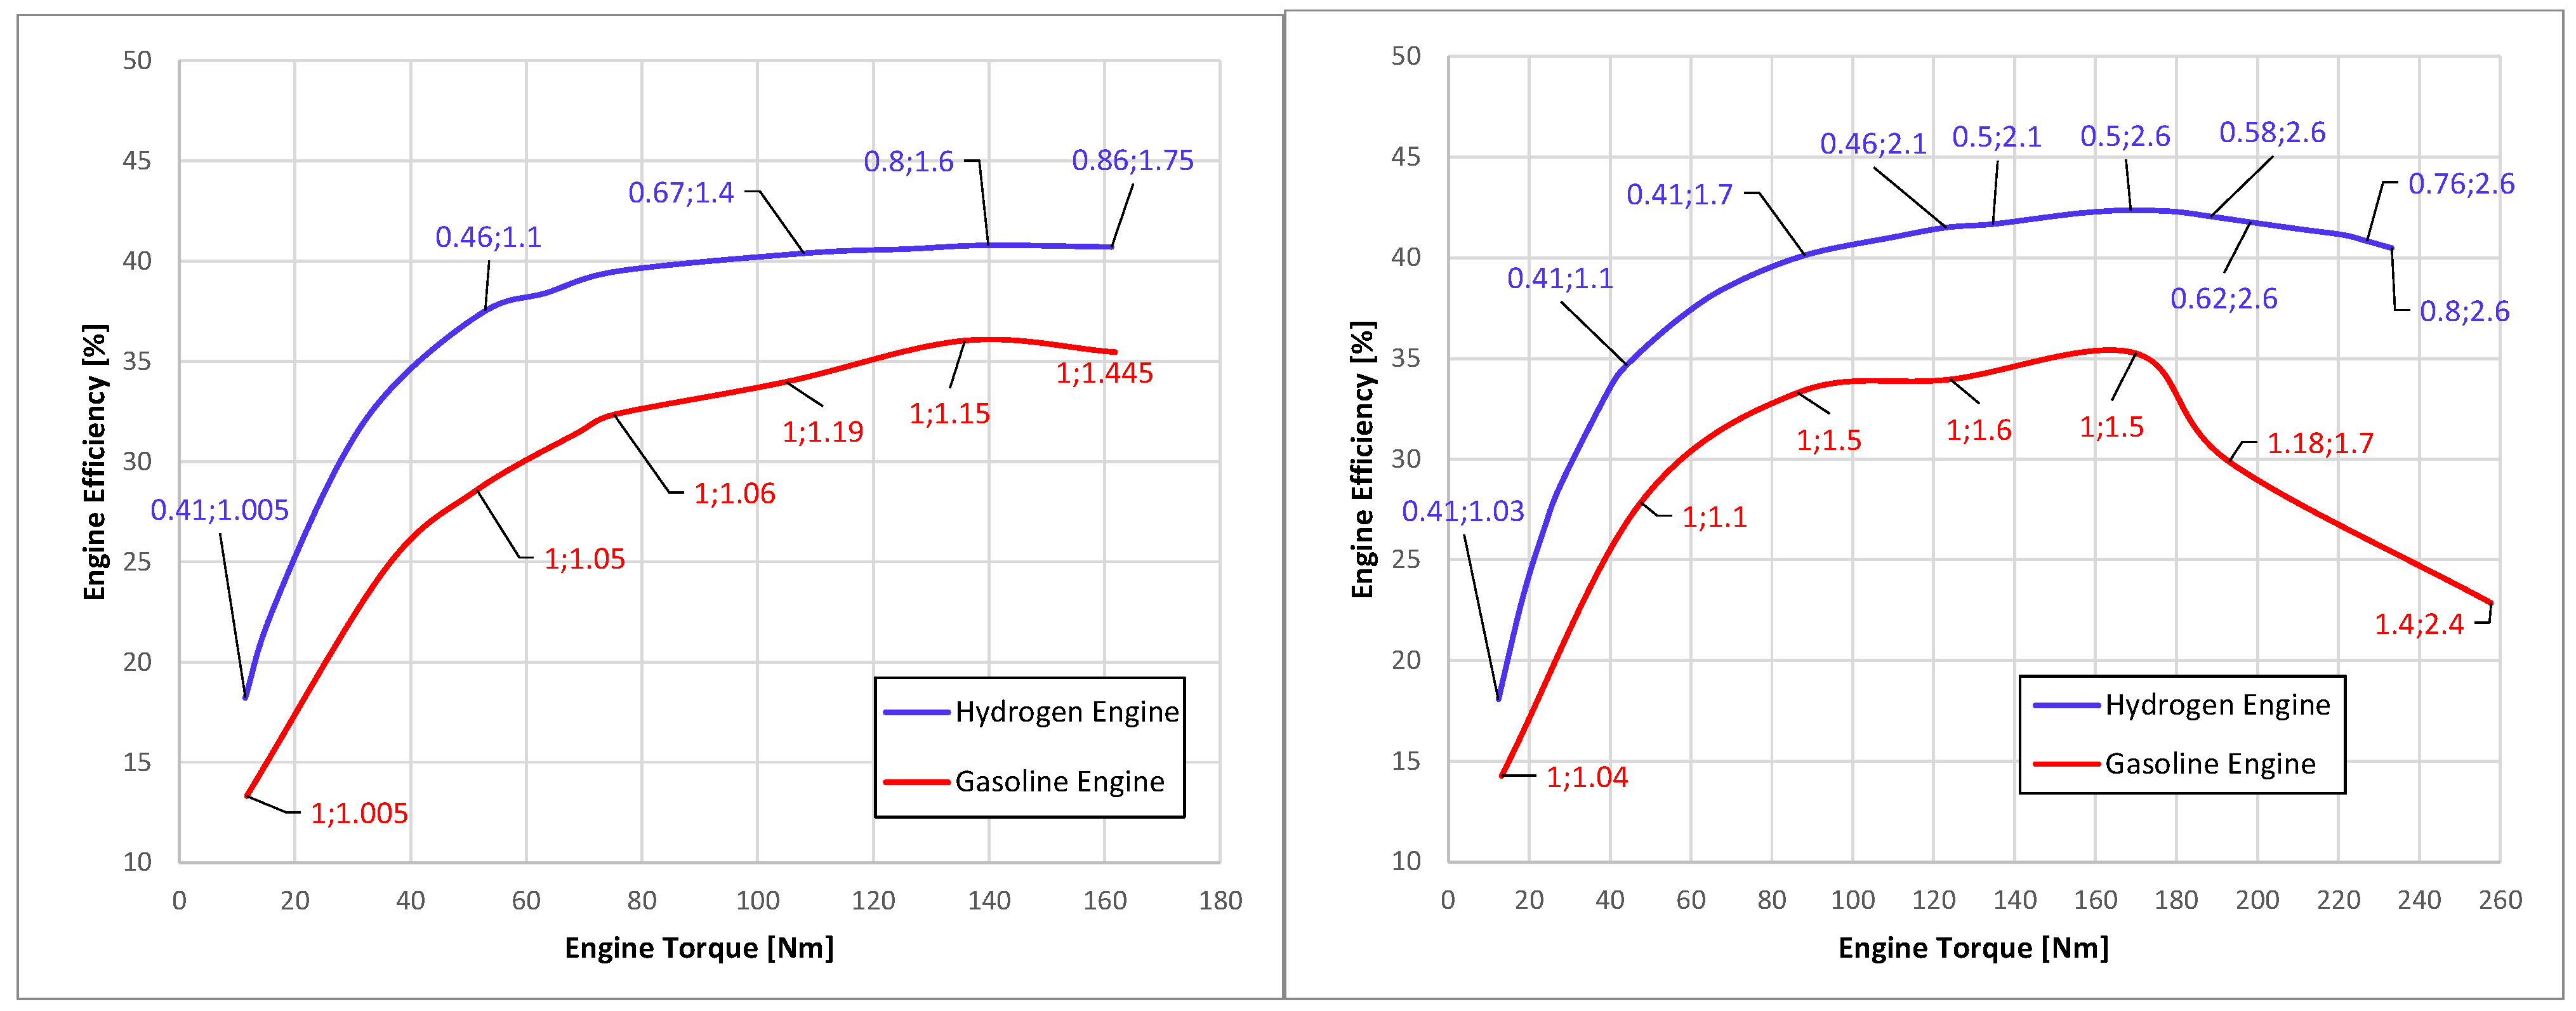
Considering the optimized control parameters portrayed in Figure 6, the results with respect to engine performance are reported as the following: Figure 7 compares the hydrogen engine efficiency to that of the gasoline engine as a function of the delivered torque. At 3000 rpm, the hydrogen engine does not deliver the same maximum torque level of the gasoline engine. To compensate for the lower energy capacity of the air–hydrogen mixture compared to the air–gasoline mixture, the hydrogen engine should run with a boost level and a mixture richness incompatible with the constraints reported in Table 3.
However, lean burn allows the hydrogen-fueled engine to achieve much higher efficiencies than those of the gasoline-fueled engine for each engine load. This efficiency gain is particularly noticeable at 3000 rpm, and very high loads when the gasoline engine needs to run with very rich mixtures to limit the exhaust gas temperature. Comparing operating points where the gasoline engine runs with stoichiometric mixtures (i.e., engine torque less than 170 Nm), the hydrogen engine achieves efficiencies approximately 20% higher than the gasoline engine.
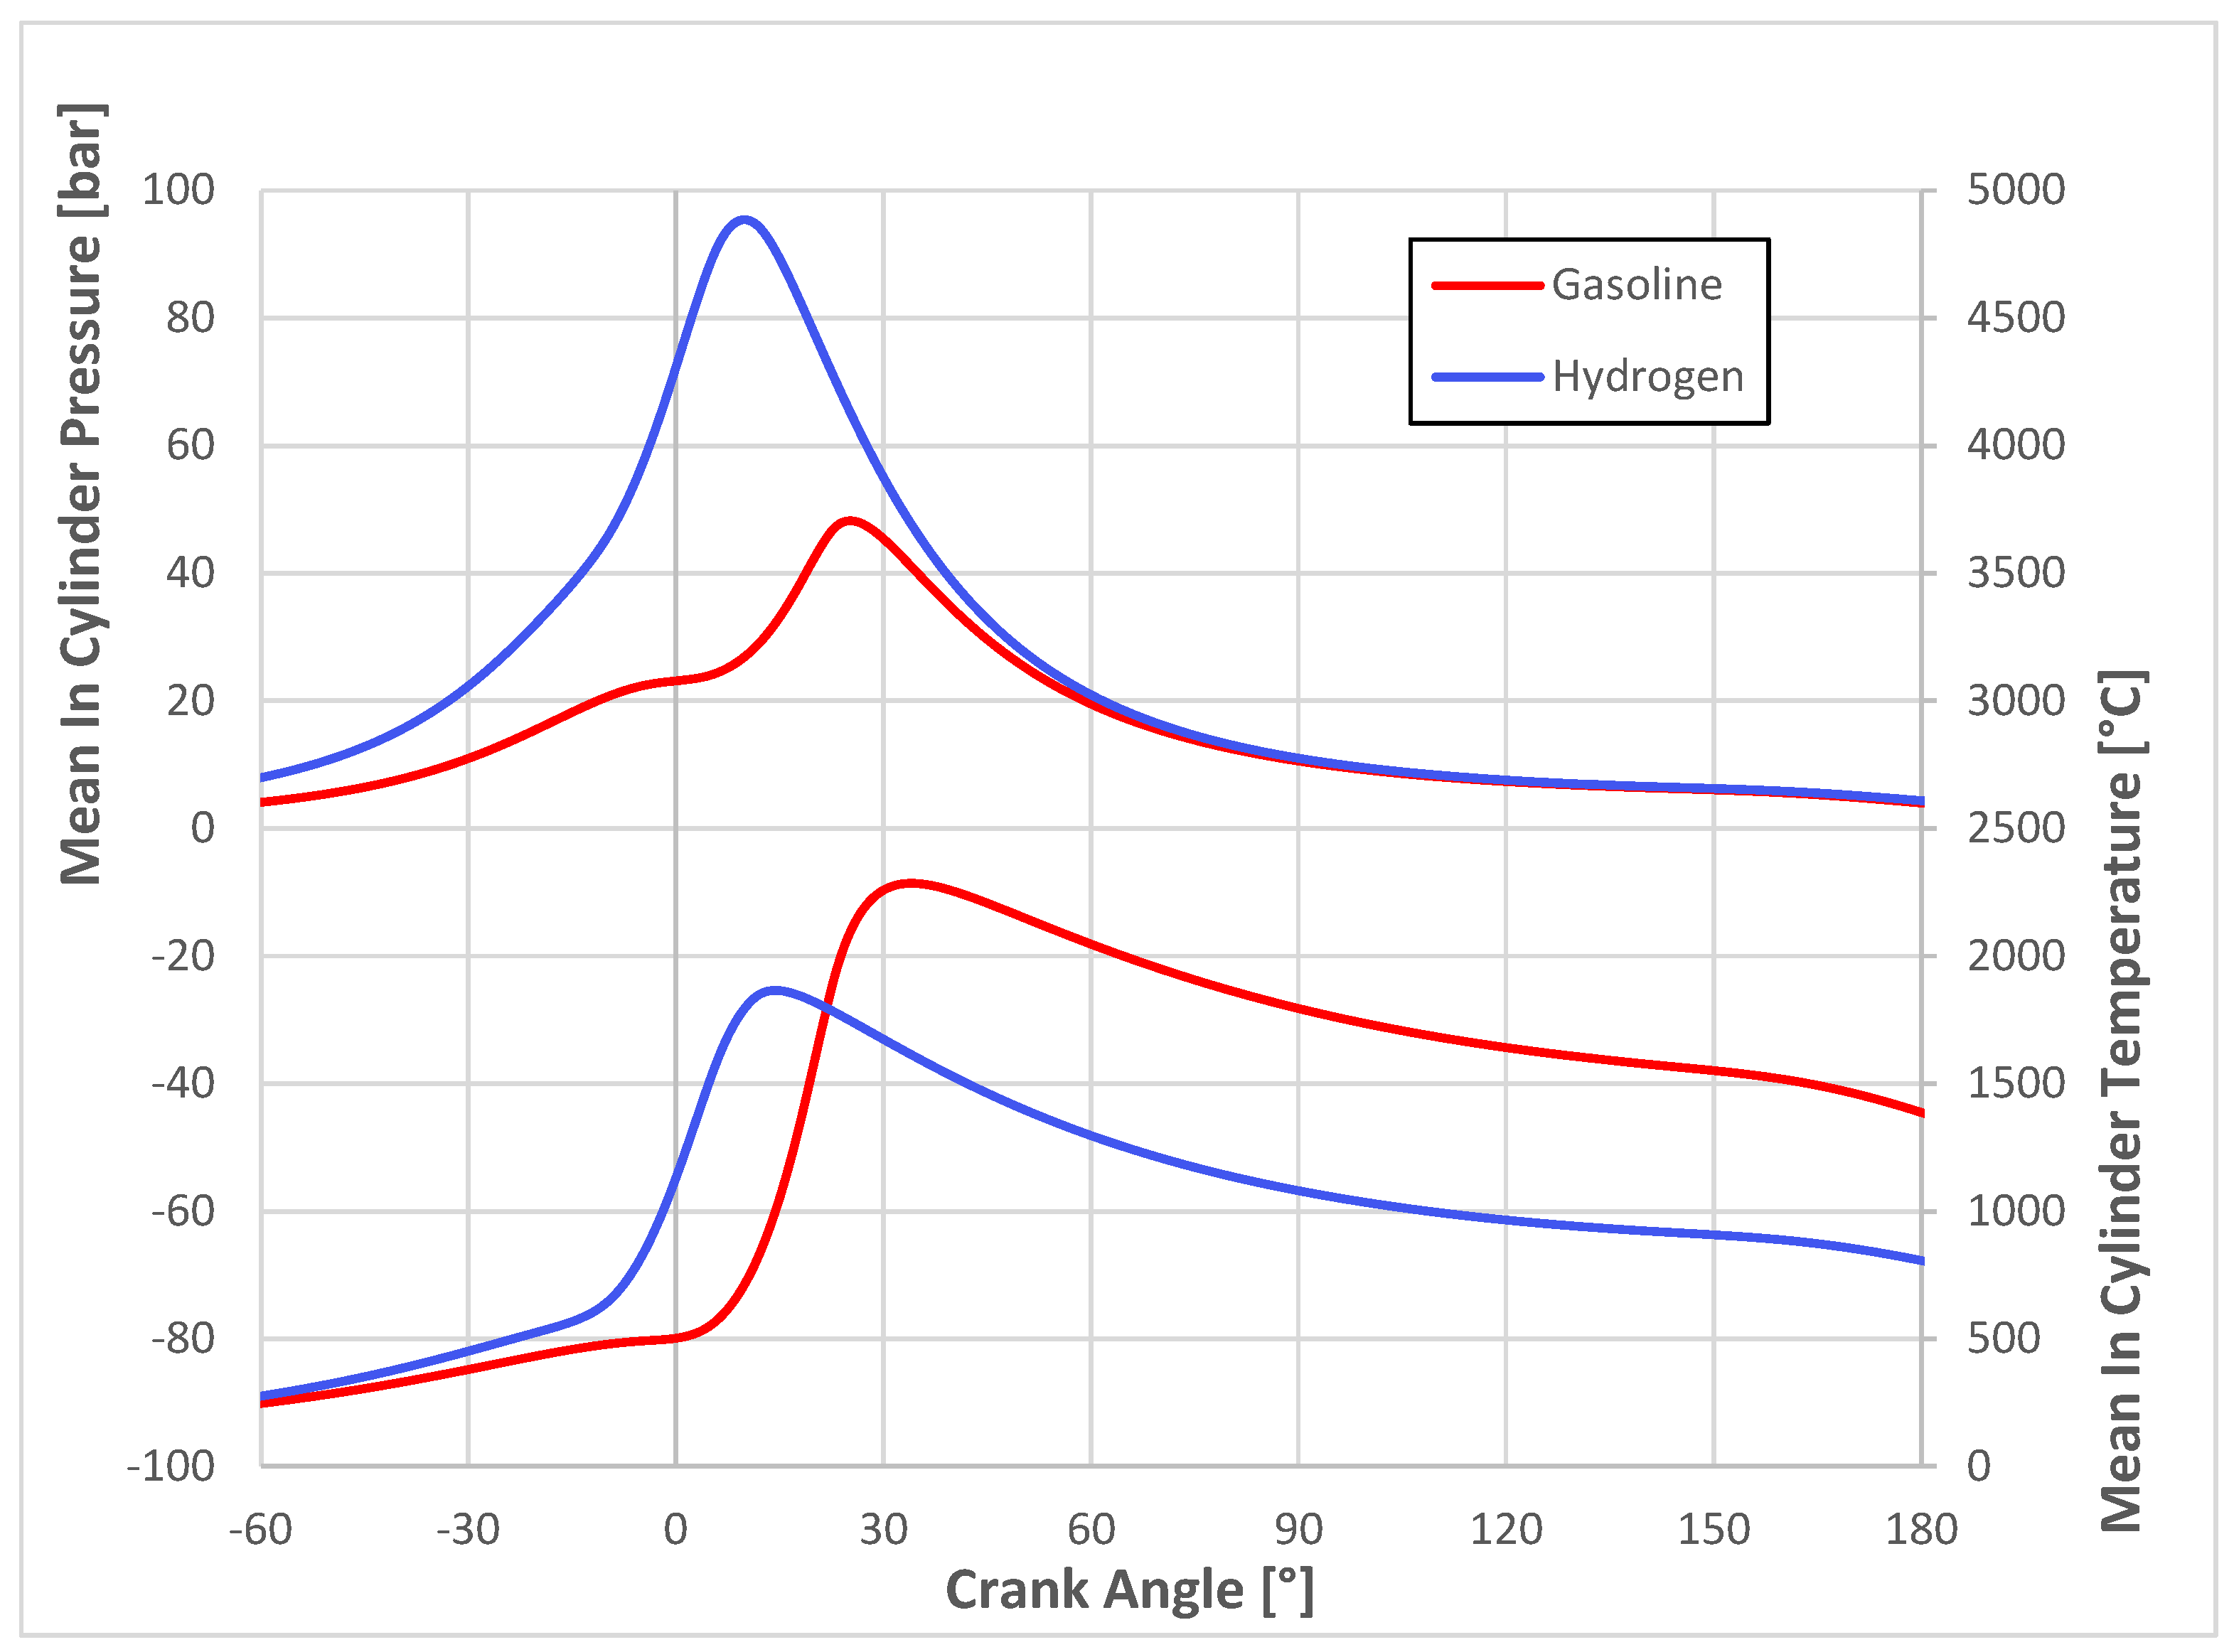
Figure 8 compares in-cylinder mean quantities calculated for both the hydrogen engine and the gasoline engine at a medium load. Because of the higher boost level, the pressure peak calculated for the hydrogen engine is much higher and more advanced than that of the gasoline engine. However, the higher charge dilution determines much lower in-cylinder mean temperatures.
3.2. Full Load Operation
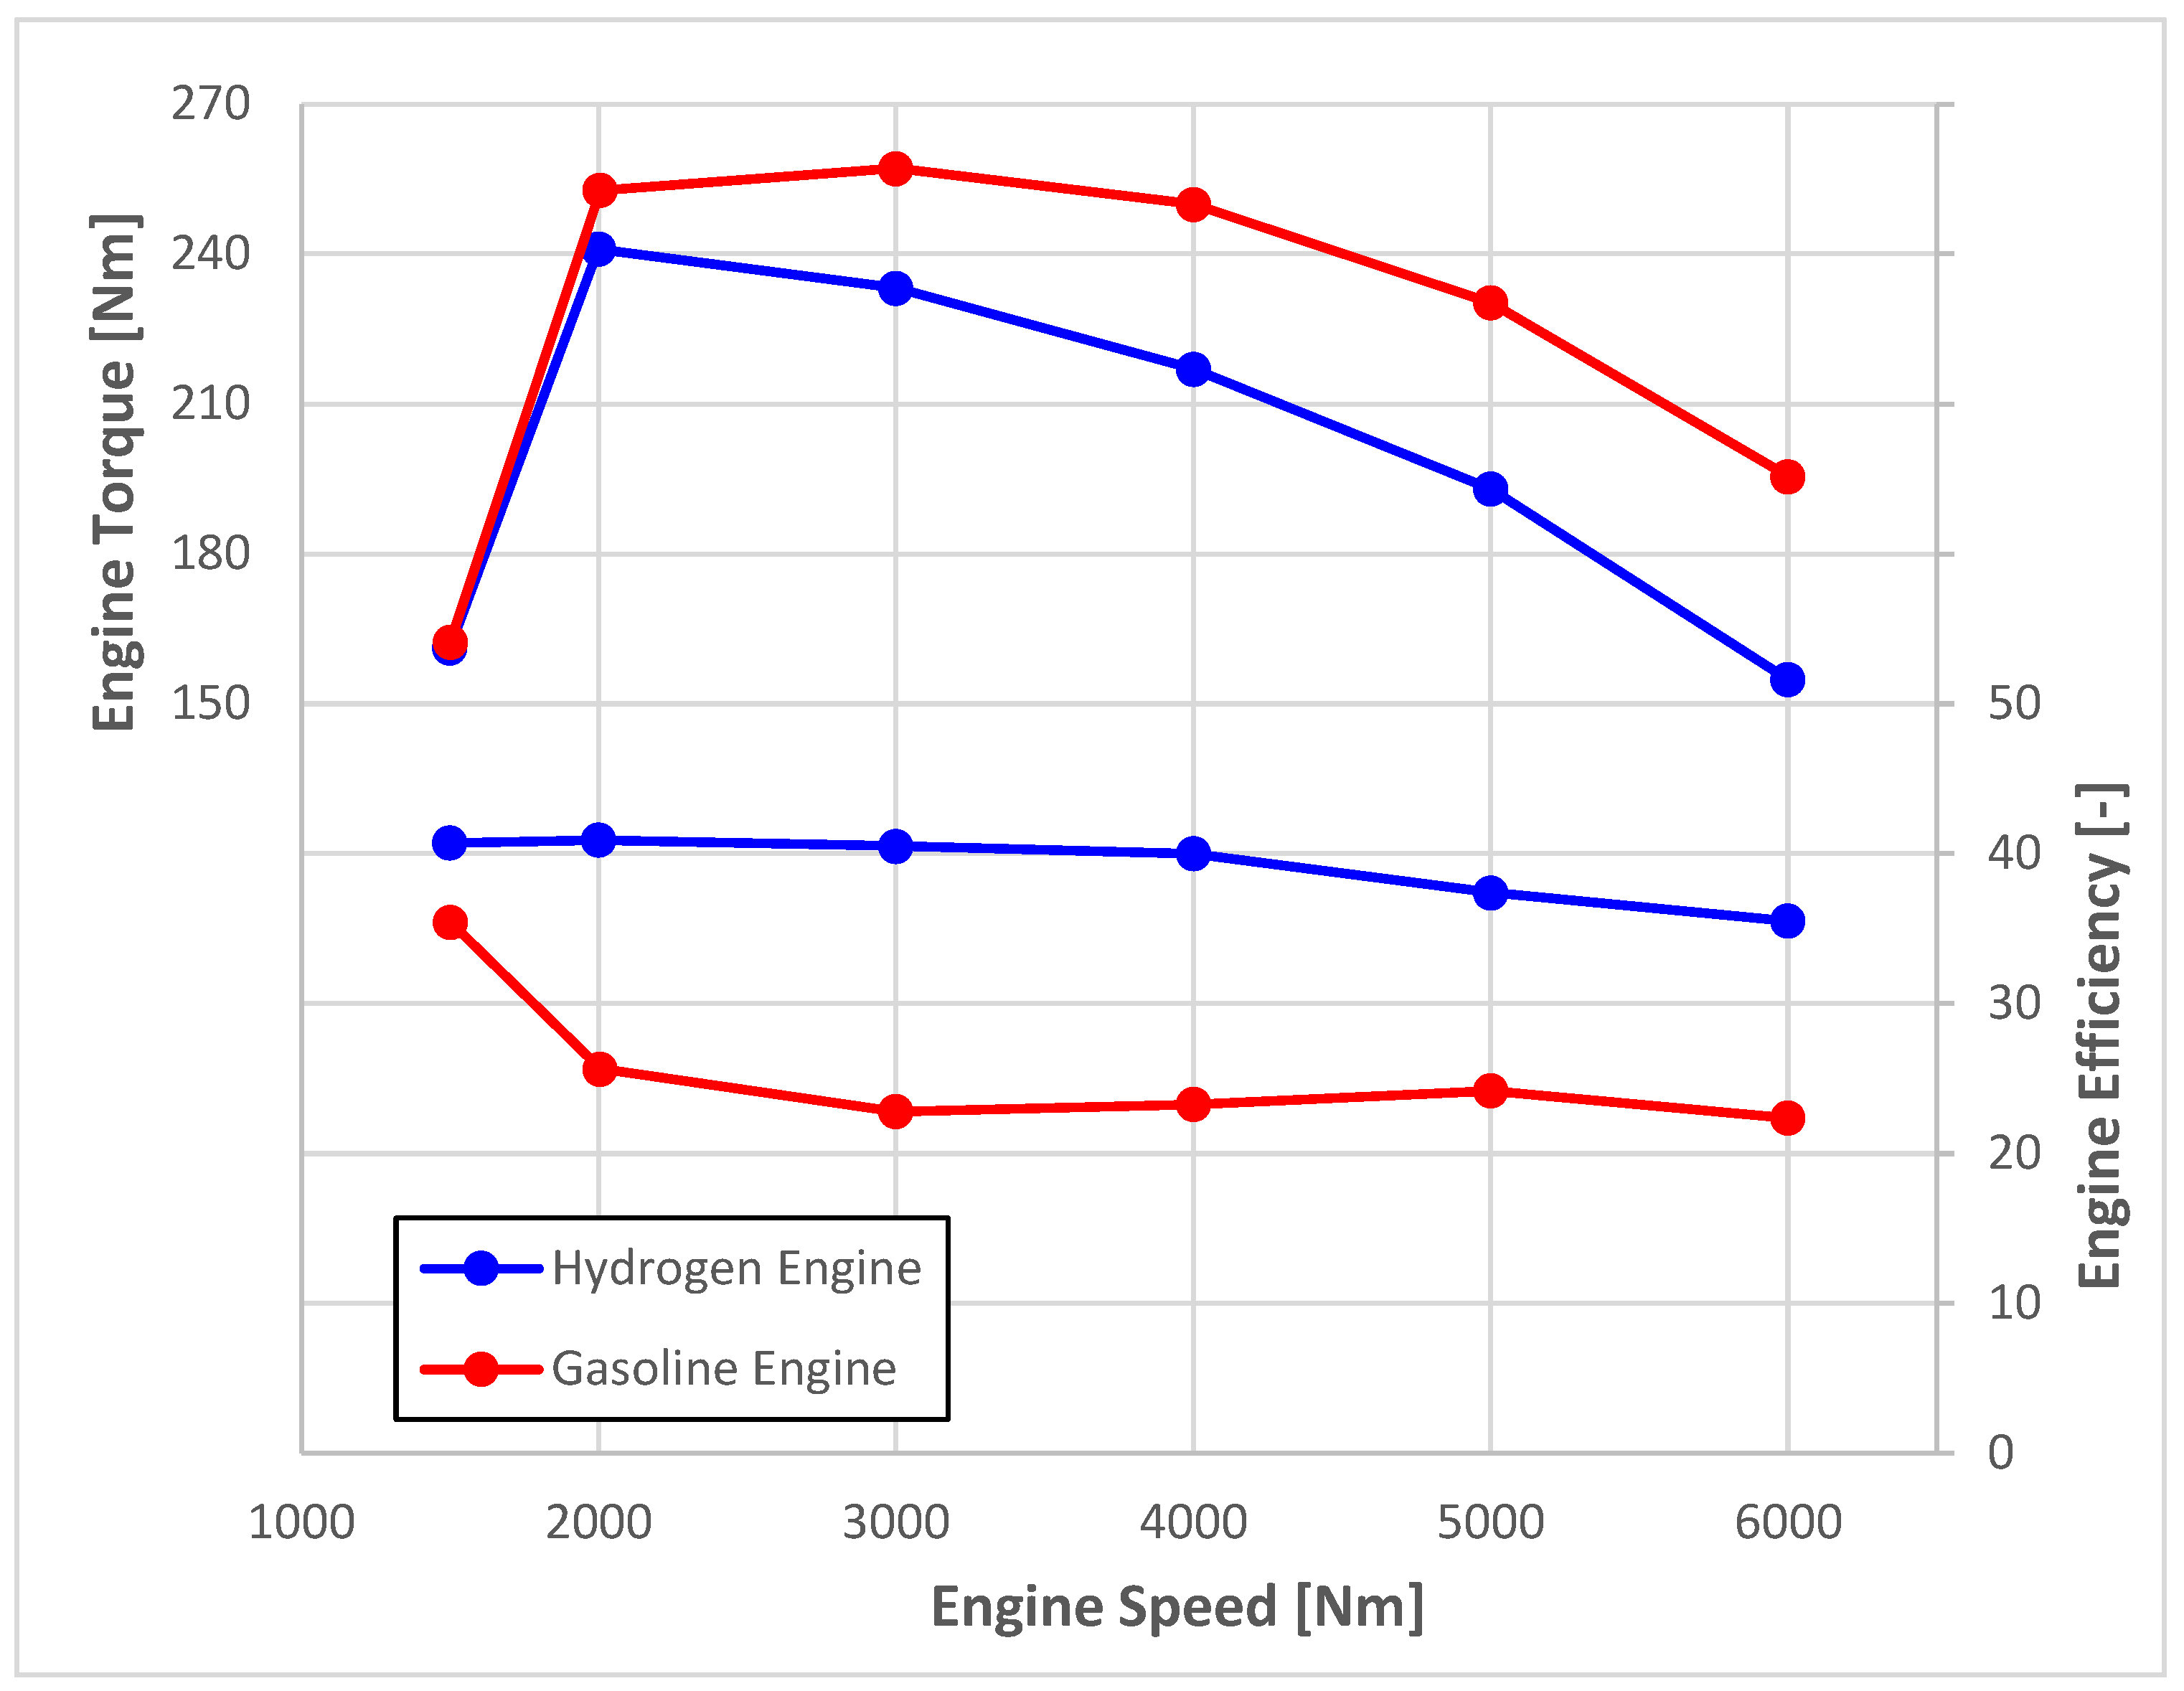
At the end, respecting the constraints indicated in Table 3, the hydrogen engine performance at full load was evaluated. Figure 9 compares both the delivered torque and the efficiency at full load. The hydrogen engine performs the same torque level as the gasoline engine, only at 1500 rpm. As the engine speed increases, the gap between the two curves increases. When the engine runs with gasoline, it delivers a maximum torque level equal to about 260 Nm at 3000 rpm. Running with hydrogen, its maximum torque level is equal to about 240 Nm at 2000 rpm. Consequently, the maximum power output decreases from about 120 kW to about 97 kW.
Conversely, the efficiency of the hydrogen engine is always greater than that of gasoline engine, particularly when the engine runs at medium and high speed where the gasoline engine burns very rich mixtures (Table 4).
Table 4 indicates that, on average, the hydrogen engine operates with a boost pressure 0.3 bars higher than the gasoline engine. The maximum equivalence ratio decreases with the engine speed, ranging from 0.86 at 1500 rpm to 0.69 at 6000 rpm.
4. Conclusions
In this work, the operation of a turbocharged PFI spark-ignition engine fueled by hydrogen was investigated by means of a 1-D numerical model. The important results can be summarized as:
- At 1500 and 3000 rpm, the hydrogen engine load can be regulated by properly combining the equivalence ratio and the boost pressure. Particularly, at a given boost level, there is a value of the equivalence ratio that optimizes the engine efficiency. At very low loads (i.e., engine torque less than about 45 Nm) the engine must be throttled, keeping the equivalence ratio equal to 0.41.
- Considering the control parameters that optimize the engine efficiency, at 3000 rpm the hydrogen engine does not reach the same maximum torque level as the gasoline engine. This is due to the lower energy capacity of the air–hydrogen mixture compared to the air–gasoline mixture. However, lean burn allows the hydrogen engine to achieve much higher efficiencies than the gasoline one for each engine load, from about 20% higher when the gasoline engine runs with stoichiometric mixtures to about 60% higher when it runs with rich mixtures.
- At the same engine load and speed, the peak in-cylinder pressure for the hydrogen engine is much higher and more advanced than that of the gasoline one, while in-cylinder mean temperatures result much lower due to the higher charge dilution of the hydrogen–air mixtures.
- At full load, the hydrogen engine achieves the same torque level as the gasoline engine, only at 1500 rpm. Increasing the engine speed, the gap between hydrogen and gasoline maximum torque values increases. Consequently, the maximum power output is reduced from 120 kW to about 97 kW. Conversely, the engine efficiency of the hydrogen engine is higher than that of the gasoline one for each full load operating point.
Author Contributions
Conceptualization, E.G. and D.L.; data curation, E.G., D.L., G.D. and S.S.; formal analysis, E.G. and D.L.; investigation, S.S.; methodology, E.G. and G.F.; supervision, E.G. and G.F.; writing—original draft, E.G., D.L., G.D. and S.S.; writing—review & editing, G.F. All authors have read and agreed to the published version of the manuscript.
Funding
This research received no external funding.
Institutional Review Board Statement
Not applicable.
Informed Consent Statement
Not applicable.
Conflicts of Interest
The authors declare no conflict of interest.
References
- Dawood, F.; Anda, M.; Shafiullah, G.M. Hydrogen production for energy: An overview. Int. J. Hydrogen Energy 2020, 45, 3847–3869. [Google Scholar]
- Ji, C.; Wang, S. Effect of hydrogen addition on combustion and emissions performance of a spark ignition gasoline engine at lean conditions. Int. J. Hydrogen Energy 2009, 34, 7823–7834. [Google Scholar] [CrossRef]
- Fayaz, H.; Saidur, R.; Razali, N.; Anuar, F.S.; Saleman, A.R.; Islam, M.R. An overview of hydrogen as a vehicle fuel. Renew. Sustain. Energy Rev. 2012, 16, 5511–5528. [Google Scholar]
- Yusuf, A.A.; Inambao, F.L.; Farooq, A.A. Impact of n-butanol-gasoline-hydrogen blends on combustion reactivity, performance and tailpipe emissions using TGDI engine parameters variation. Sustain. Energy Technol. Assess. 2020, 40, 100773. [Google Scholar] [CrossRef]
- Shadidi, B.; Najafi, G.; Yusaf, T. A Review of Hydrogen as a Fuel in Internal Combustion Engines. Energies 2021, 14, 6209. [Google Scholar] [CrossRef]
- Kahraman, E.; Ozcanlı, S.C.; Ozerdem, B. An experimental study on performance and emission characteristics of a hydrogen fuelled spark ignition engine. Int. J. Hydrogen Energy 2007, 32, 2066–2072. [Google Scholar] [CrossRef] [Green Version]
- Kumar, D.S.N.; Guruprasad, D. Performance, Emission and Fuel Induction System of Hydrogen Fuel Operated Spark Ignition Engine-A Review. Int. J. Mod. Eng. Res. 2012, 2, 565–571. [Google Scholar]
- Tang, X.; Kabat, D.M.; Natkin, R.J.; Stockhausen, W.F.; Heffel, J. Ford P2000 hydrogen engine dynamometer development. SAE Trans. 2002, 111, 631–642. [Google Scholar]
- Milton, B.E.; Keck, J.C. Laminar burning velocities in stoichiometric hydrogen and hydrogen hydrocarbon gas mixtures. Combust. Flame 1984, 58, 13–22. [Google Scholar] [CrossRef]
- Heywood, J.B. Internal Combustion Engine Fundamentals; McGraw-Hill Education: New York, NY, USA, 2018; ISBN 1-260-11610-7. [Google Scholar]
- Verhelst, S.; Wallner, T. Hydrogen-fueled internal combustion engines. Prog. Energy Combust. Sci. 2009, 35, 490–527. [Google Scholar] [CrossRef] [Green Version]
- Galloni, E. Combustion Modelling and Performance Estimation of an SI Engine Using Lean Hydrogen-Air Mixtures. In Proceedings of the WHEC, Lyon, France, 13–16 June 2006; Volume 16, pp. 1–6. [Google Scholar]
- Galloni, E.; Minutillo, M. Performance of a spark ignition engine fuelled with reformate gas produced on-board vehicle. Int. J. Hydrogen Energy 2007, 32, 2532–2538. [Google Scholar] [CrossRef]
- Onorati, A.; Payri, R.; Vaglieco, B.M.; Agarwal, A.K.; Bae, C.; Bruneaux, G.; Canakci, M.; Gavaises, M.; Günthner, M.; Hasse, C.; et al. The role of hydrogen for future internal combustion engines. Int. J. Engine Res. 2022, 23, 529–540. [Google Scholar] [CrossRef]
- Lhuillier, C.; Brequigny, P.; Contino, F.; Mounaïm-Rousselle, C. Performance and Emissions of an Ammonia-Fueled SI Engine with Hydrogen Enrichment. In Proceedings of the 14th International Conference on Engines & Vehicles, Capri, Italy, 15–19 September 2019. [Google Scholar]
- Verhelst, S.; Maesschalck, P.; Rombaut, N.; Sierens, R. Increasing the power output of hydrogen internal combustion engines by means of supercharging and exhaust gas recirculation. Int. J. Hydrogen Energy 2009, 34, 4406–4412. [Google Scholar] [CrossRef] [Green Version]
- Gürbüz, H.; Akçay, İ.H. Evaluating the effects of boosting intake-air pressure on the performance and environmental-economic indicators in a hydrogen-fueled SI engine. Int. J. Hydrogen Energy 2021, 46, 28801–28810. [Google Scholar] [CrossRef]
- Oikawa, M.; Kojiya, Y.; Sato, R.; Goma, K.; Takagi, Y.; Mihara, Y. Effect of supercharging on improving thermal efficiency and modifying combustion characteristics in lean-burn direct-injection near-zero-emission hydrogen engines. Int. J. Hydrogen Energy 2022, 47, 1319–1327. [Google Scholar] [CrossRef]
- Pandey, J.K.; Kumar, G. Effect of variable compression ratio and equivalence ratio on performance, combustion and emission of hydrogen port injection SI engine. Energy 2022, 239, 122468. [Google Scholar] [CrossRef]
- Luo, Q.; Hu, J.-B.; Sun, B.; Liu, F.; Wang, X.; Li, C.; Bao, L. Effect of equivalence ratios on the power, combustion stability and NOx controlling strategy for the turbocharged hydrogen engine at low engine speeds. Int. J. Hydrogen Energy 2019, 44, 17095–17102. [Google Scholar] [CrossRef]
- Luo, Q.; Hu, J.-B.; Sun, B.; Liu, F.; Wang, X.; Li, C.; Bao, L. Experimental investigation of combustion characteristics and NOx emission of a turbocharged hydrogen internal combustion engine. Int. J. Hydrogen Energy 2019, 44, 5573–5584. [Google Scholar] [CrossRef]
- Gao, J.; Wang, X.; Song, P.; Tian, G.; Ma, C. Review of the backfire occurrences and control strategies for port hydrogen injection internal combustion engines. Fuel 2022, 307, 121553. [Google Scholar] [CrossRef]
- Langmi, H.W.; Engelbrecht, N.; Modisha, P.M.; Bessarabov, D. Chapter 13—Hydrogen storage. In Electrochemical Power Sources: Fundamentals, Systems, and Applications; Smolinka, T., Garche, J., Eds.; Elsevier: Amsterdam, The Netherlands, 2022; pp. 455–486. ISBN 978-0-12-819424-9. [Google Scholar]
- Valera-Medina, A.; Xiao, H.; Owen-Jones, M.; David, W.I.F.; Bowen, P.J. Ammonia for power. Prog. Energy Combust. Sci. 2018, 69, 63–102. [Google Scholar] [CrossRef]
- Scala, F.; Galloni, E.; Fontana, G. Numerical analysis of a downsized spark-ignition engine fueled by butanol/gasoline blends at part-load operation. Appl. Therm. Eng. 2016, 102, 383–390. [Google Scholar] [CrossRef]
- Lanni, D.; Galloni, E.; Fontana, G. Numerical analysis of the effects of port water injection in a downsized SI engine at partial and full load operation. Appl. Therm. Eng. 2022, 205, 118060. [Google Scholar] [CrossRef]
- Bozza, F.; Fontana, G.; Galloni, E.; Torella, E. 3D-1D Analyses of the Turbulent Flow Field, Burning Speed and Knock Occurrence in a Turbocharged SI Engine. SAE Trans. J. Engines 2007, 116, 1495–1507. [Google Scholar]
- Douaud, A.; Eyzat, P. Four-Octane-Number Method for Predicting the Anti-Knock Behavior of Fuels and Engines. SAE Trans. 1978, 87, 294–308. [Google Scholar]
- Richard, S.; Bougrine, S.; Font, G.; Lafossas, F.-A.; Le Berr, F. On the Reduction of a 3D CFD Combustion Model to Build a Physical 0D Model for Simulating Heat Release, Knock and Pollutants in SI Engines. Oil Gas Sci. Technol.—Rev. IFP 2009, 64, 223–242. [Google Scholar] [CrossRef]
- Galloni, E.; Fontana, G.; Scala, F. Experimental and Numerical Analyses of a Spark-Ignition Engine Firing with N-Butanol-Gasoline Blends at High Load Operation. Energy Procedia. 2018, 148, 336–343. [Google Scholar] [CrossRef]
- Galloni, E.; Fontana, G.; Palmaccio, R. Numerical analyses of EGR techniques in a turbocharged spark-ignition engine. Appl. Therm. Eng. 2012, 39, 95–104. [Google Scholar]
- Ó Conaire, M.; Curran, H.J.; Simmie, J.; Pitz, W.; Westbrook, C.K. A comprehensive modeling study of hydrogen oxidation. Int. J. Chem. Kinet. 2004, 36, 603–622. [Google Scholar] [CrossRef]
- Kuppa, K.; Goldmann, A.; Dinkelacker, F. Predicting ignition delay times of C1-C3 alkanes/hydrogen blends at gas engine conditions. Fuel 2018, 222, 859–869. [Google Scholar] [CrossRef]
Figure 1.
Heat released by a volume unit of air–H2 mixtures at T = 25 °C and different pressures. Reference value is the heat released by a volume unit of a stoichiometric air-gasoline mixture at the same temperature and a pressure equal to 1 Bar.
Figure 1.
Heat released by a volume unit of air–H2 mixtures at T = 25 °C and different pressures. Reference value is the heat released by a volume unit of a stoichiometric air-gasoline mixture at the same temperature and a pressure equal to 1 Bar.

Figure 2.
Schematic of engine layout.

Figure 3.
Engine torque as a function of equivalence ratio for different boost pressure levels. Engine speed 1500 rpm (left) and 3000 rpm (right). Circles stand for unthrottled operating conditions, triangles stand for throttled ones.
Figure 3.
Engine torque as a function of equivalence ratio for different boost pressure levels. Engine speed 1500 rpm (left) and 3000 rpm (right). Circles stand for unthrottled operating conditions, triangles stand for throttled ones.

Figure 4.
Exhaust Gas temperature, in-cylinder pressure peak and knock intensity versus spark angle. (Left): boost = 2.6 bar, ϕ = 0.5; (middle): boost = 2.3 bar. ϕ = 0.8; (right): boost = 2.6 bar, ϕ = 0.8. Engine running at 3000 rpm.
Figure 4.
Exhaust Gas temperature, in-cylinder pressure peak and knock intensity versus spark angle. (Left): boost = 2.6 bar, ϕ = 0.5; (middle): boost = 2.3 bar. ϕ = 0.8; (right): boost = 2.6 bar, ϕ = 0.8. Engine running at 3000 rpm.

Figure 5.
Engine efficiency as a function of the engine torque for different boost pressures [bar] and equivalence ratios. In some operating points, the equivalence ratio value is reported. For some boost levels, the equivalence ratio value maximizing the efficiency is also highlighted.
Figure 5.
Engine efficiency as a function of the engine torque for different boost pressures [bar] and equivalence ratios. In some operating points, the equivalence ratio value is reported. For some boost levels, the equivalence ratio value maximizing the efficiency is also highlighted.

Figure 6.
Optimized control parameters for the hydrogen engine running at 1500 rpm (left) 3000 rpm (right).
Figure 6.
Optimized control parameters for the hydrogen engine running at 1500 rpm (left) 3000 rpm (right).

Figure 7.
Engine efficiency as a function of the engine torque at 1500 rpm (left) and 3000 rpm (right). Equivalence ratio and boost pressure values (φ;BP) are highlighted for some operating points.
Figure 7.
Engine efficiency as a function of the engine torque at 1500 rpm (left) and 3000 rpm (right). Equivalence ratio and boost pressure values (φ;BP) are highlighted for some operating points.

Figure 8.
Comparison between in-cylinder data for the engine fueled with hydrogen and gasoline at the same operating point. Engine speed 3000 rpm. Engine torque 120 Nm.
Figure 8.
Comparison between in-cylinder data for the engine fueled with hydrogen and gasoline at the same operating point. Engine speed 3000 rpm. Engine torque 120 Nm.

Figure 9.
Torque and efficiency at full load. Comparison between the engines running with hydrogen and gasoline.
Figure 9.
Torque and efficiency at full load. Comparison between the engines running with hydrogen and gasoline.


Table 1.
Main characteristics of hydrogen and gasoline.
| Hydrogen | Gasoline | |
|---|---|---|
| Energy content [kJ/kg] [14] | 120,000 | 44,000 |
| Flammability limit (ϕ) [11] | 0.1–7.1 | 0.66–3.85 |
| Octane number [-] [14] | >120 | 92–98 |
| Auto ignition temperature [K] [15] | 773–850 | 503 |
| Lower Heat Value [MJ/Kg] [15] | 120 | 44.5 |
| Quenching distance [mm] [14] | 0.64 | 2.84 |
| Stoichiometric air–fuel ratio [14] | 34.3 | 14.8 |
| Laminar Flame speed at ambient condition [m/s] [14] | 1.85 | 0.37–0.43 |
| Heat released by a volume unit of stoichiometric air–fuel mixture [MJ/m3] | 2.88 | 3.46 |
Table 2.
Engine main characteristics.
| Model | 4 Cylinders, 16 Valves |
|---|---|
| Displacement [cm3] | 1368 |
| Bore/Stroke/Con. Rod [mm] | 72/84/129 |
| Compression Ratio [-] | 9.8 |
| Max Power (ISO Conditions) [kW] | 110.3 at 5500 rpm |
| Max Torque (ISO Conditions) [Nm] | 230 at 3000 rpm |
| Turbocharger group | IHI RHF3 |
Table 3.
Analysis constraints.
| Knock intensity [-] | <0.5 |
| Exhaust gas temperature [°C] | <900 |
| Peak pressure [bar] | <120 |
| Turbocharger speed [rpm] | <250,000 |
| Equivalence ratio [-] | >0.35 |
Table 4.
Main engine operating parameters at full load.
| Engine Speed [rpm] | 1500 | 2000 | 3000 | 4000 | 5000 | 6000 | ||||||
|---|---|---|---|---|---|---|---|---|---|---|---|---|
| Hyd. | Gas. | Hyd. | Gas. | Hyd. | Gas. | Hyd. | Gas. | Hyd. | Gas. | Hyd. | Gas. | |
| Boost Pressure [bar] | 1.75 | 1.45 | 2.70 | 2.40 | 2.6 | 2.40 | 2.6 | 2.20 | 2.4 | 2.0 | 2.2 | 1.94 |
| Spark Angle [°] | −1.9 | 1.0 | 1.0 | 7.5 | −4.0 | 2.6 | −8.5 | −3.0 | −9.0 | −8.1 | −11.3 | −14.2 |
| Equivalence ratio [-] | 0.86 | 1.00 | 0.83 | 1.30 | 0.80 | 1.45 | 0.73 | 1.45 | 0.73 | 1.41 | 0.69 | 1.47 |
Publisher’s Note: MDPI stays neutral with regard to jurisdictional claims in published maps and institutional affiliations. |
© 2022 by the authors. Licensee MDPI, Basel, Switzerland. This article is an open access article distributed under the terms and conditions of the Creative Commons Attribution (CC BY) license (https://creativecommons.org/licenses/by/4.0/).
Share and Cite
MDPI and ACS Style
Galloni, E.; Lanni, D.; Fontana, G.; D’Antuono, G.; Stabile, S. Performance Estimation of a Downsized SI Engine Running with Hydrogen. Energies 2022, 15, 4744. https://0-doi-org.brum.beds.ac.uk/10.3390/en15134744
AMA Style
Galloni E, Lanni D, Fontana G, D’Antuono G, Stabile S. Performance Estimation of a Downsized SI Engine Running with Hydrogen. Energies. 2022; 15(13):4744. https://0-doi-org.brum.beds.ac.uk/10.3390/en15134744
Chicago/Turabian StyleGalloni, Enzo, Davide Lanni, Gustavo Fontana, Gabriele D’Antuono, and Simone Stabile. 2022. "Performance Estimation of a Downsized SI Engine Running with Hydrogen" Energies 15, no. 13: 4744. https://0-doi-org.brum.beds.ac.uk/10.3390/en15134744
Note that from the first issue of 2016, this journal uses article numbers instead of page numbers. See further details here.