
Interpretative Review of Diesel Spray Penetration Normalized by Length and Time of Breakup (Similarity Law of Diesel Spray and Its Application)

Gunma University, Maebashi 371-8510, Gunma, Japan
Energies 2022, 15(13), 4926; https://0-doi-org.brum.beds.ac.uk/10.3390/en15134926
Submission received: 31 May 2022
/
Revised: 27 June 2022
/
Accepted: 28 June 2022
/
Published: 5 July 2022
(This article belongs to the Special Issue Advanced Research on Internal Combustion Engines and Engine Fuels)
Abstract
:Tip penetration of diesel spray is one of the most useful parameters to evaluate diesel combustion dynamics. It has strong relationships with ignition delay, premix/diffusion combustion and engine performance, including exhaust emissions. To discuss general combustion physics in various size sprays, non-dimensional expression of spray tip penetration is reviewed. Length and time of injected fuel jet breakup can be considered as characteristic length and timescale of diesel spray. Then, normalized penetration by length and time of breakup was proposed for the scaling of various diesel sprays. Using the proposed scaling method and similarity law, tip penetrations of various size sprays are collapsed into one simple expression. It becomes a base of similarity law of diesel spray. For example, local or average A/F is uniquely expressed by the normalized length and time of breakup. Penetration of a wall impingement spray is also expressed uniquely by this normalization method and physical parameters affecting the wall impingement spray are explained. Injection rate shaping effect at an initial stage of injection is clearly demonstrated by using this scaling. Further, mixing degrees of diesel spray at an ignition timing and in a combustion phase can be reasonably explained by the equivalence ratio change with non-dimensional elapsed time after injection start.
1. Introduction
The bore size of a small diesel engine ranges between approximately 70 and 90 mm but the size range for a large diesel engine is 500~960 mm. It means that there are many differences in combustion phenomena between small- and large-scale engines, though both are diesel combustion engines. Thus, the scale similarity problem is a long-term issue to be clarified by diesel engine research. Performance, such as engine power and thermal efficiency, depends strongly on engine size. S. Brown, et al. [1] reviewed the scaling effect on performance. They reported that residence time and surface/volume ratio that were functions of engine scale had strong influence on the engine performance. Combustion similarity for different sized diesel engines was theoretically studied by T. Chikahisa and T. Murayama [2]. They used non-dimensional parameters of length, velocity, engine speed, density, temperature, and pressure that were normalized by representative values of a reference engine.
The general view of length and timescales for diesel spray and diesel combustion phenomena is shown in Figure 1. The timescale for chemical reactions is usually nano- to micro-second order and its length scale ranges in the mean mobility distance of fuel molecules. Its scales are expanding to turbulent scales in turbulent diffusion flames, such as a diesel flame. Further soot oxidation has a longer timescale because of slow surface reaction. Droplet formation, its evaporation, and mixture formation has a longer timescale and larger length scale compared with chemical reaction, but diesel combustion is not directly affected by these phenomena, except for turbulent mixing. As for the diesel combustion, its ranges are 10~200 mm on the length scale and 1~200 ms on the timescale, and these are directly affected by diesel spray development.
However, macroscale phenomena of diesel spray development and diesel combustion have no direct relationship with microscale phenomena, including chemical reaction and droplet behavior. The diesel spray formation process, represented by liquid fuel jet breakup phenomena, is then considered as the mesoscale stage, connecting the above micro- and macroscale phenomena. It means that general combustion behavior in diesel engine has a possibility to be discussed using breakup scale of fuel spray jet. In other words, microscale and macroscale phenomena in a diesel combustion engine have their own length and timescales, but there is no direct relationship between them. Thus, a middle-scale (mesoscale) parameter representing diesel spray development is needed to interpolate the relationship between micro- and macroscale phenomena in diesel combustion.
There are many studies on the scale similarity of diesel engines. Some of them treated diesel spray scaling as a mesoscale parameter of diesel combustion. T. Suzuki and R. Ohsima [3] tried to express diesel spray tip penetration by using non-dimensional breakup time and breakup length. R. Payri et al. [4] used momentum flux to understand the influence of nozzle geometry on the discharge coefficient. F. DF. Chuahy et al. [5] used L parameter (bore size) to express various non-dimensional parameters, including spray tip penetration, and explained the difference between small (bore dia. is 82 mm) and large (bore dia. is 137 mm) engines. K. Inagaki, et al. [6] introduced a similarity law of diesel spray and predicted down-sizing engine performances. J. Naber and D. Siebers [7] proposed dimensionless expressions of spray penetration using characteristics of length and time. It was based on the transient gas jet theory. F. dos Santos, et al. [8] reviewed the above dimensionless expression. However, there is no detailed analysis on the similarity law related with the above dimensionless treatment. M. Arai [9,10] reviewed diesel spray characteristics and emphasized a possibility of non-dimensional expression of diesel spray penetration to discuss the scaling effect on diesel combustion.
As for a diesel nozzle similarity, T. Cao, et al. [11] considered Strouhal number, Reynolds number, Euler number, and Froude number, respectively. Here, Strouhal number is a dimensionless number, including characteristic length and time of fluid dynamic oscillation. Based on these similarity laws, they studied diesel nozzle cavitation using a 10-times scale-up model. B. W. Knox, et al. [12] introduced a mixing-chemistry timescale, diffusion combustion timescale derived from lift-off length of diesel spray combustion and air entrainment inflection length related to effective injection velocity, respectively. They reported a conceptual diagram between “steady injection” ignition timescale and “end of injection” ignition timescale. Based on the above timescale, they explained combustion phases, such as a partial spray combustion.
X. Zhou, et al. [13] considered three similarity laws, named speed rule, lift-off rule, and pressure rule for the scaling of fuel sprays injected by different sized nozzles. Their theoretical analysis and experimental results revealed that the similarity rule keeping the injection pressure constant is more preferable for scaling the spray angle, tip penetration, and excess air ratio, while the other two similarity rules with reduced injection pressure resulted in narrowing spray angle and increasing spray tip penetration. With respect to the post-impingement behavior, although the spray from the large-hole nozzle impinged upon the wall later than those of the small-hole nozzles with the speed rule and the lift-off rule, the spray rebound height of the large-hole nozzle is higher than those from the small holes. It shows a theoretical limitation of their similarity rules. As the viewpoint of application, they applied the above three similarity rules to marine engines of different sizes (340 mm and 520 mm bore sizes), and successfully analyzed the combustion process [14].
There is no direct dimensionless scaling for diesel spray itself. Length scale and development timescale might become changed by injector size and injection pressure differences. When an adequate scaling of diesel spray and similarity laws related with the scaling are developed, the following items are possible applications of scale similarity of diesel spray [9].
- (1)
- Non-dimensional comparison of diesel sprays of various conditions results in the establishment of general concept of diesel spray.
- (2)
- Engineering suggestion of diesel spray for down-sizing engine.
- (3)
- Engineering suggestion of diesel spray for high-boosted engine.
- (4)
- Deeper physical understanding of diesel spray.
- (5)
- Easy application of engineering knowledge of diesel spray to other spray engineering.
Additionally, the following advantages are expected from the non-dimensional scaling of diesel spray.
- (1)
- Non-dimensional expression for formation rate of combustible mixture.
- (2)
- New concept of mesoscale parameter between combustion chemistry and heat release rate in diesel combustion.
In this article, dimensionless expression of diesel spray was reviewed. Tip penetration of diesel spray was normalized using length and time of liquid jet breakup. Using this breakup scaling, tip penetrations of various diesel sprays could be collapsed into a single unique expression. Local air/fuel ratio at the spray tip was derived uniquely as a function of non-dimensional elapsed time. The normalized expression was expanded to estimate tip penetration of wall impingement spray. Validation of this normalization was confirmed using various experimental data retrieved from reference studies. Further usefulness of non-dimensional expression of spray tip penetration was shown using some examples. This article is the supplemental work following the author’s previous studies [9,10,15].
2. Theoretical Treatment of Spray Tip Penetration
Tip penetration of diesel spray can be described using a combination of high-speed liquid jet breakup and momentum conservation after breakup. V. G. Levich [16] obtained breakup length formula of a high-speed liquid jet under the following assumptions,
- (i)
- Liquid jet of density ρl is moving in a gaseous medium with density ρa, (ρa << ρl).
- (ii)
- Relative velocity between liquid jet and gas medium is large.
- (iii)
- Amplitude of liquid jet surface disturbance is accelerated by local pressure disturbance of gaseous medium around the jet.
- (iv)
- As the amplitude of surface disturbance increases, the jet tends to be unstable, and finally, it may breakup into droplets.
- (v)
- Breakup length, Lb is calculated from breakup time tb.
- (vi)
- Injection pressure and injection rate are constant during injection period.
- (vii)
- Spray tip velocity, within intact length (before breakup) is constant and coincides with initial jet velocity Uinj.
Here, Cv is the velocity coefficient of injection nozzle and ΔP = Pinj − Pa is the substantial injection pressure of the nozzle. Since the flow contraction caused by cavitation is not considered, Cv means the apparent velocity coefficient based on a no-contraction assumption. A further viscosity effect of liquid is also included in Cv. Thus, its value is almost the same with the flow coefficient of contraction.
- (viii)
- Spray tip penetration is proportional to based on momentum conservation and the continuous jet theory of Y. Wakuri, et al. [18].
Transient time (breakup time) from start of injection to jet breakup is obtained from and Lb.
Further, Cv, α, and β can be replaced by newly defined coefficients, Kv, Kbl, Kbt, and Kp.
Here, coefficients Kv, Kbl, Kbt, and Kp have the following relationships. These relationships mean that the principal parameters of tip penetration are two parameters among Kv, Kbl, Kbt, and Kp. All of these new parameters are non-dimentional parameters, though the old parameter β has the demension of [m/s0.5].
Then breakup length and its time are expressed as follows.
Using new parameters, the following relationships for spray tip penetration are obtained. Before the breakup (0 < t ≤ tb), spray tip penetration and its velocity are simply expressed by Kv.
After the breakup (tb < t), spray tip penetration and its velocity are expressed by Kp, (see Equation (9)).
Original coefficients, such as Cv, α, and β, were obtained from the experimental data of a classical jerk-type injection system [17]. Recently M. Arai proposed modification sets of coefficients obtained from a common rail injection system [19,20]. Table 1 is the summarized sets of the coefficients.
In the above analysis, there is no discussion concerning liquid viscosity and surface tension, whereas these liquid properties have a great effect on diesel spray characteristics. For example, Sauter mean diameter of the spray was well expressed by the function of viscosity and surface tension [21,22]. However, surface wave motion is primary driven by static pressure disturbance near the surface and Wakuri’s spray tip penetration is based on momentum conservation, controlled by mass and velocity.
Then, the viscosity and surface tension do not appear as the primary parameters in the above equations. Liquid viscosity has a strong effect on nozzle cavitation and injection velocity and its effect is included in the parameter Kv. On the contrary, surface tension has a strong effect on the final progress of breakup. Its effect is implicitly included in parameter Kp. As for a diesel fuel, since variations in fuel properties are not so large compared to the variations in injection pressure and density ratio ρl/ρa there is no application trouble for the calculation of diesel spray penetration without these properties. These effects are estimated within the same order of measurement error. For high-viscosity and high-surface-tension liquid, slightly smaller values of Kv and Kp have to be used for the fitting for measured penetration.
3. Normalized Expression of Spray Tip Penetration
3.1. Representative Scale of Diesel Spray
Breakup length and its time are considered as eigenvalues of a diesel spray. These values change with nozzle size and injection conditions. A comparison of small-scale (SS) and large-scale (LS) diesel sprays is illustrated in Figure 2. Here, size similarity and internal structure similarity are represented by contour size and internal eddy vortex, respectively.
Though the differences in nozzle size and injection condition might be significant, LS diesel spray at t = t1 is illustrated to be only 10% larger than SS diesel spray (t = t1) in contour size. It means,
Here, the contour of spray means the outlook configuration (appearance) of each spray. However, there is significant difference in internal structures. This is because contour sizes for the liquid column at breakup are different between SS1 and LS1 sprays. As the viewpoint of internal structure similarity, SS diesel spray at t = t1 should be compared with LS diesel spray at t = t2. Then,
is reasonable because LS diesel spray usually has an eddy vortex of a larger scale than SS. It means that both length and timescale normalizations are needed as a comparison base of various sized diesel sprays.
As shown in Figure 3, breakup length is usually governed by a surface wave on a liquid column and a fundamental wave on the surface is expressed by the following equation.
where, k is the angular wave number and a is the increasing rate of wave amplitude. Then, length and timescales of the surface wave can be expressed as follows.
As for the internal structure of diesel spray, it can be considered that the eddy vortex structure and above wave scales might have a strong relationship, even though eddy motion is accelerated by turbulent mixing between spray and surroundings. Further, the above scales have strong relationships with length and time of breakup because the liquid jet is broken up by the wave motion on the surface. In this analysis, then, length and time of breakup are assumed to be characteristic length and time representing a diesel spray, and these values become eigenvalues of each diesel spray.
Here, the diesel spray scale in Equations (23) and (24) can be considered as a kind of wave scale (Equations (21) and (22)) on the liquid jet before breakup. In other words, the following Strouhal number concept can be introduced into diesel spray development.
It suggests that the relationship between nozzle diameter and wave frequency or wavelength is controlled by St similarity. In other words, diesel sprays having the same St number might show the same macroscale turbulent structure.
When the Rayleigh wave, λ = 4.51Dn and single wave breakup oscillation of λ = Lb, = 0.77 mm are assumed (λ = 0.77 mm), St is 0.22. It means that the scale of breakup length becomes a macroscale turbulence, dominating the spray and 4.51 Dn is its scale. The value of 0.22 is the same order value of St as in the Karman vortex (large-scale instability by pressure fluctuation). When the St is in the order of 10−4, the high-speed, quasi-steady-state portion of the movement dominates the oscillation.
Figure 4 shows examples of PIV frequency analysis of diesel spray fluctuation. It shows the results of FFT analysis on r = 0 (center) r = σ and r = 2σ location. Here, radial distance σ is a standard deviation location in radial velocity distribution [23,24]. Red values represent the wavelengths corresponding with the frequency peaks and average spray velocity. The Strouhal number can be obtained from nozzle diameter, average velocity, and frequency of fluctuation or obtained directly from nozzle diameter and wavelength.
In the main body of diesel spray, the dominant frequency of the spray jet is in a range of 1~10 kHz, and in a range of 10~100 m/s. St corresponds with them in a range of 0.15~0.0035. Thus, both pressure fluctuation and flow instability affect spray fluctuation or the internal structure of the diesel spray. The internal structure of the dense portion of the spray shows the wave characteristics of St < 0.009. It means that dominant wavelength (turbulent structure) is longer than breakup length (Lb = 18.7 mm, St ~ Dn/Lb = 0.009, see Table 3 in the later section). However, in the spray periphery (r = 2σ) and the elapsed spray portion (Z = 80 mm), the wave components comparable or shorter than the breakup length (0.009 ≲ St < 0.22) remain. This suggests that the wave of which length corresponds to breakup length is a critical wave of the internal structure of diesel spray. In other words, a large wave having breakup length scale might be the origin of the internal fluctuation scale because St number increases generally with turbulence dispersion.
3.2. Normalized Expression
The length- and timescales discussed here might have a relationship with the internal structure of the diesel spray. Though nozzle diameter and injection conditions, such as injection pressure and surrounding gas density, are different, similar developments of two diesel sprays might be expected when both sprays have similar breakup length and similar breakup time. Then, spray tip development normalized by breakup scale might become useful parameters for the general aspect of diesel spray.
The possibility of non-dimensional expression based on breakup phenomena was already proposed by M. Arai [9,10]. Non-dimensional length and timescales, S* and t*, are defined by normalizing the actual length and timescales with break length and time, respectively.
This can be called “breakup scaling” because the size of diesel spray is characterized by the breakup of the liquid jet injected from a diesel nozzle. This normalization concept is similar with the dimensionless penetration model proposed by J. Naber and D. Siebers [7], but Equations (26) and (27) have more clear normalizing physics fixed on the liquid breakup. Using these normalizations, spray tip penetration is simply expressed as follows [9].
The spray tip penetration following the above equations is shown in Figure 5. It means that spray tip penetrations of various sprays under various conditions can be summarized by one simple unique curve when the length and time of breakup are adopted as representative eigenvalues of each spray. Since all the sprays expressed by show the same development behavior with t*, it can be considered as a similarity law equation of diesel spray penetration. In other words, scale effects are compressed in the breakup length and time. Whole effects of nozzle diameter, injection pressure, densities (fuel and gas), and elapsed time on the penetration are included in the breakup length and time, shown in Equations (10) and (11) or (26) and (27).
When local fuel and air masses in the spray tip are expressed by Δmf and Δma, momentum conservation of the spray tip can be expressed as follows. Here, Δ in this equation means a spatially averaged local spray element at the tip.
Then, local air/fuel mass ratio A/F in the spray tip can be expressed by,
Finally, Equations (32)–(34) are obtained as normalized characteristics of the spray tip.
Logarithmic-scale expression of Equations (32)–(34) is shown in Figure 6. It shows the length and time similarity of sprays. Since the velocity deceleration starts suddenly at t* = 1, and A/F lines show discontinuous changes at t* = 1, this means that breakup from the liquid column to spray results in the velocity change. As expressed in Equation (34), the air/fuel mass ratio, A/F, is uniquely defined by non-dimensional time t*. Here, A/F at the spray tip means an imaginal local air/fuel ratio of spray tip on the spray axis. Since the A/F is given as the function of t*, it means the formation rate of the combustible mixture.
Further, the average A/F of a whole spray after breakup to injection end can be expressed by the following equations under an assumption of constant injection rate. It can be obtained by an integration of whole local A/F that is represented by tip A/F during the development process of spray from t* = 1 to t* = t*.
The average A/F is also shown in Figure 6. Its rough meaning for developed spray (t* > 100) is that the average A/F is two-thirds of the A/F of the spray tip. It might be lower than the average A/F obtained from the volume of spray, because the average A/F obtained here is the center line average of spray (see reference [25]). Both the spray tip A/F and average A/F become important factors when spray combustion takes place. Since the A/F is uniquely expressed by t*, breakup time is considered as the main parameter of spray development.
4. Spray Development
A trial of non-dimensional scaling was performed using original data that were adopted in the deviation of penetration coefficients, shown in Table 1. Figure 7 shows the injection rate of the tested common injection system. A steep rise in the injection rate (response time of 0.082 ms for 90% regulated rate) was attained by an air-driven common rail system and a special injector controller. It resulted in a rectangular pattern for the injection rate and a diesel spray having constant injection velocity. It was the first validation of assumptions (vi), (vii), and Equation (2).
Spray tip penetrations used in the breakup scaling validation are shown in Figure 8. These data were obtained in a high-pressure test chamber at room temperature. Adopting Kv = 0.6 and using Equations (10) and (11), breakup scales of the sprays in Figure 8 are estimated. Table 2 shows the basic data for the estimation and Table 3 is the obtained datasets of the breakup scaling.
Non-dimensional spray tip penetration normalized by breakup scale is shown in Figure 9. It shows that all the spray penetrations evaluated here are collapsed into one simple penetration curve, expressed by . As for the spray injected into 0.1 MPa surroundings, it penetrates only twice the distance of its breakup length, though actual penetration in Figure 8 is over 100 mm. On the other hand, the spray under the 5.0 MPa condition penetrates to over 12 non-dimensional distance. It means that the non-dimensional penetrations depend greatly on the breakup scales, even though the actual scales of spray penetrations are the same. Non-dimensional time periods needed for 100 mm penetration are far different with spray by spray. As a viewpoint of t*, a spray under 0.1 MPa is a flesh spray at 100 mm position but under 5 MPa is an aged spray.
The normalized penetration S* of actual spray shows some deviation from , owing to measurement error. It might be caused by the time measurement error at the early stage of injection. Measured starting time of injection usually contains ±0.01 ms error and is the same order error of injection rate response. It causes data scattering in the early stage of injection. However, the higher deceleration rate of spray penetration is obviously observed when t* exceeds 50. This is because of the theoretical limit of momentum conservation.
Spray tip penetration, Equation (3), based on momentum conservation completely neglects the turbulence dispersion of the momentum; it is explained later in Equation (39). When the momentum dispersion takes place in the spray tip, its penetration speed might decrease. Then, the spray tip penetration can roughly be expressed by the following modified equation.
Here, exponential index n represents a degree of penetration and Δn = n − 0.5 indicates an index of deviation from the momentum conservation theory. Its effect on normalized penetration is shown in Figure 10. It depicts various penetration curves in a range of n = 0.5 ± 0.1. Momentum conservation shown by Equation (30) means that the mixture has a unique velocity. When droplets in the spray tip have a higher velocity than that of associated air (existence of local relative velocity between gas and droplet), the exponential index takes a larger value than 0.5. On the contrary, when momentum dispersion occurs in the spray tip, it takes a lower value than 0.5. As for the penetrations shown in Figure 9, n = 0.48 is the most fitted index. It means that diesel spray far from the injection nozzle might be stagnated by turbulence dispersion of the momentum.
As the standpoint of the developing jet, U* is the longitudinal velocity of spray tip and it is obtained from the derivative of S*(t*). The velocity ratio of spray tips between Equations (29) and (38) is obtained by the following equations.
or
The above ratio is a function of index n and time t* or t. Its ratios are shown in Figure 11. The ratios at t* = 1 mean the discontinuous longitudinal velocity decrease/increase in momentum loss/gain that co-occurs with the transition from liquid column to spray. Its loss is caused by momentum transfer from longitudinal momentum to others, such as turbulent momentum. When the velocity U in Equation (30) is separated to average longitudinal velocity and turbulence component Δū, then the momentum conservation equation has to be expressed as follows.
Tip penetration velocity means Ū, and Ū = U is reasonable under the assumption of Δū = 0. In an actual spray, whereas Δū ≠ 0 and U*n/U*0.5 < 1 under n < 0.5 situation is reasonable. Larger n than 0.5 means momentum addition by, for example, entrainment air having longitudinal momentum or locally higher droplet velocity, as explained previously.
As for the case of n = 0.48 (corresponding to Figure 9), the velocity ratio is 0.897 at t* = 30. It means that 10.3% of longitudinal velocity decreases in the spray tip. It might be caused by momentum dispersion by the turbulence motion in the spray. It consists of a theoretical analysis of the developing gas jet [26]. Low-velocity ratio related with n becomes a more important factor for wall impingement spray, explained in the next section.
When the exponential index change takes place at the middle stage, t*m, of spray penetration, spray tip penetration changes at t* = t*m, (1 << t*m). It is expressed by Equations (42) and (43) and shown by Figure 12. These situations might be observed on a spray with delta-shape injection rate (n > 0.5), mutual interaction of parallel sprays (n > 0.5), wall impingement spray (n < 0.5), and sprays receiving surrounding flow contributions (n 0.5).
5. Catchup and Overtake Motion of Following Spray
The above discussion is based on the assumption of constant injection pressure and the tip penetration of the initial spray is only considered. Since an actual injection condition, such as injection pressure, changes during the injection period, catchup and overtake motion caused by a following spray are often observed in the actual spray that is continuously injected during a certain injection period. Tip penetration of a following spray that has a delayed injection timing of tdelay is expressed as follows.
Then, the time when the following spray catches up to the initial spray has to satisfy the following relationship.
It shows that the catchup time depends on the injection delay time and the penetration exponents of these two sprays. For a case of ninitial ≥ nfollow, no catchup has taken place, whereas catchup and overtake phenomena take place in a case of ninitial < nfollow. Though the length and time of the following spray are the same as those of the initial spray, the situation of ninitial < nfollow is natural because of entrained gas motion around the following spray. In other words, the following spray penetrates in the surroundings having some axial velocity that is caused by previous spray and it causes larger nfollow than 0.5.
Catchup and overtake phenomena are roughly shown in Figure 13. Here, two sprays having the same length and time of breakup but different starting times are depicted with various penetration exponents. Delayed starting time of the following spray is 10 on the non-dimensional scale. For example, it roughly corresponds to 0.52 ms in a conventional high-speed diesel spray (see Pa = 1.0 MPa condition in Table 3). When ninitial = 0.5 and nfollow = 0.6 are picked up as an extreme case, catchup happens at t* ≈ 24 and S* ≈ 4.9. This means that catch up takes place at the 92 mm location and after 1.24 ms for the above reference spray. After that, the following spray overtakes the initial spray and the whole spray structure might be changed.
When the whole spray in a certain injection period consists of many elemental sprays having different breakup characteristics and different delayed starting time, more complicated catchup and overtake phenomena take place in the whole spray development process. Since catchup and overtake phenomena depend on injection period and injection rate pattern, the period and pattern become other characteristic parameters of diesel spray.
6. Wall Impingement Spray
An example of normal impinging spray on a flat wall is shown in Figure 14 and Figure 15. The nozzle diameter is 0.17 mm and four sprays with different injection pressures are shown. Spray penetration is evaluated by the total length of S = Lz + Lr. Since the breakup length is defined by density ratio and nozzle diameter (see Equation (10)), breakup length is Lb = 17.8 mm and wall position is S*w = 2.8 in all injection pressure conditions. As shown in Figure 15, normalized penetrations are well collapsed into one line but these lines have discontinuous jumps at impingement times (depending on individual breakup time). This is because the definition of radial penetration is illustrated in Figure 14, which can then be modified by S* = L*z + (L*r + ΔL*). Here, ΔL* ≈ 0.7 (12.5 mm: see the starting distance of Lr in Figure 14) is assumed and is a slightly larger value of half-spray width at the impingement point. The exponential index n after impingement is around 0.32. It means that strong momentum loss caused by liquid film formation and wall friction is taking place on the wall.
According to the analysis of N. Najaratnam [27], for a gaseous jet radially expanding on a wall, velocity decay is proportional to the distance from the impingement center. Then, tip penetration of radial spray jet along a wall can be expressed by the following.
Here, S** = S* − S*w and t** = t* − t*w are the distance from the impingement center and time after impingement. Kw is a coefficient, including whole effect of radial spray width, liquid film formation, and wall friction. Finally, spray tip penetration is expressed by the following equation.
As shown in Figure 15, when a value of 0.37 is adopted as Kw, estimated penetration is well fitted to the experimental data. Equation (38) is convenient and applicable for many sprays in various situations but it has no clear physical meaning to the exponential index for impingement spray, while Equation (48) shows the clear meaning of a wall spray that is similar to a radial gaseous jet developing on a well. As for an oblique impingement of diesel spray, Kw in Equation (48) or exponential index n in Equation (38) with ΔL* (or ΔS*), have to be changed following some experimental dataset in a given situation [28].
Here, the difference between (2) and (3) in the figure is 0.7 as ΔS*, and (4) is the fitted line from Equation (48). Dotted line (3) in the figure is the plots of Equation (49) that are based on Equation (38). Exponential index of n = 0.32 is selected as the most fitted line, taking ΔS* = ΔL* = 0.7 correction. According to the velocity decay chart shown in Figure 11, it is estimated that around 50% of longitudinal momentum is lost by the wall impingement [29,30].
Both Equation (48) with Kw = 0.37 and (49) are well fitted to the experimental results. Thus, a final form of tip penetration of wall impingement spray can be expressed by the following equation.
Here, ΔS* is a measurement correction for the radial spray tip, Kw is wall friction modification factor of radial spray, and index n includes momentum modification for turbulent dispersion and additional momentum changes.
ΔS* depends on the definition of tip penetration path of impingement diesel spray. As shown in Figure 15, either Kw = 1 or n = 0.5 is applicable for diesel spray in a practical development range for diesel combustion. Further, ΔS*, Kw, and n are three fitting parameters having different physical meanings in principle. Detailed fluid dynamic analysis and direct measurements of these parameters are needed to understand the meanings and to define them. However, owing to the lack of data, we cannot separately define these three parameters.
7. Validation of Breakup Scaling
Since the modified empirical coefficient sets listed in Table 1 and breakup scaling results shown in Figure 9 were obtained from the same literature data as shown in Figure 8, the agreement in Figure 9 logical. Then, the validation of breakup scaling has to be checked by using other data that are unrelated to the empirical coefficient analysis introduced in the previous sections.
First, the trial for the validation check was performed on the experimental data reported by I. V. Roisman, et al. [31]. Equation (51) is their theoretical penetration RT versus time t (detail of the equation is explained in the literature [31]). This includes experimental coefficients, such as a and τ. Note, the principal constants of the penetration equation are length and time constants, but these values were not reported in the literature. Further it was unclear that a and τ are changing with the experimental condition or constants for whole analyses of experiments. However, a form of two parameter expresssions seems to be the same as the breakup equations shown by Equations (10) and (11), becase two among Kv, Kbt, Kbl, and Kp are principal coefficents.
They used a common rail injection system and an injector having a 0.19 mm nozzle hole, and reported various penetrations shown in Figure 16. Predicted penetrations obtained from Equation (51) are well fitted to their experimental results. Since they investigated sprays formed by only one nozzle, they did not mention the scale effect of nozzle diameter.
Table 4 is the estimated length and time of breakup for normarization and breakup scaling. These data were obtained by experimental condditions (nozzle diameter, density, and pressure in the literature [31]) and assumed penetration coefficients. Since the priciple coefficents of the penetration are two among Kv, Kbt, Kbl, and Kp, coefficients of Kv = 0.6 and Kbt = 15.7 were selected here. Data on the tip penetration were reconstructed from the literature shown in Figure 16. Figure 17 shows the results of non-dimentional tip penetrations after breakup scaling. All the penetrations are collapsed into a normalized single curve. When Equation (38) is adopted, exponential index n changes in a range of 0.45 to 0.55 with surroudnig pressure.
When Equation (38) is considered as the fitting function of the penetration, the exponential index n is changing from 0.47 at 25 bar (≈2.5 MPa) to 0.54 at 1 bar (≈0.1 MPa). In a low-ambient pressure condition, incomplete atomization results in longer Lb than estimated Lb and a coarse spray after breakup. This results in less momentum transfer from spray droplets to entrained air results larger n than 0.5. Further, there is a possibility of injection pattern change with ambient pressure but the actual injection pattern was not opened in the literature.
A second validation check for normalized expression was performed on the experimental data reported by Y. Lei, et al. [32]. Figure 18 is their original data and Figure 19 is the non-dimensional expressions by breakup scaling. Injection start timing seems to be delayed by around 0.03 ms from the indicated injection timing in Figure 18. Further, its trace is clearly observed in Figure 19. To adjust the injection start timing, time bases of the all data are sifted by 0.03 ms. Thus, modified non-dimensional penetrations are re-expressed in Figure 20. After this procedure, all the penetrations show good agreement with line. It means that breakup scaling greatly depends on the measurement accuracy of injection start timing.
The third validation check was performed on the experimental data reported by X. Zhou, et al. [33]. They used a 0.11 mm nozzle and reported an ambient pressure (15–25 MPa) effect under injection pressure of 150 MPa. Normalized penetrations are shown in Figure 21.
According to the literature, the response time of the injection rate rises from the start to 80% of the maximum in less than 0.1 msec. It results in good agreements between estimations and measurements of breakup length and time. Further, three penetration lines are well collapsed into one line, but these lines deviate from the similarity law equation of . When S* = (t*)0.46 is adopted as a modified equation, it is well fitted to the experimental penetrations. According to the velocity ratio shown in Figure 11, 20% of velocity is dispersed at t* = 100 from longitudinal velocity to other velocities, such as turbulence. It might show the spray stagnation effect due to longitudinal velocity loss.
The difference in non-dimensional penetrations shown in Figure 20 and Figure 21 might be caused by momentum loss in the penetration stage. Spray having a wide angle and high turbulence tends to disperse the momentum and to show less penetration. In other words, the sprays shown in Figure 21 are to be stagnated more than the sprays shown in Figure 19. Nozzle diameters for Figure 19 and Figure 21 are 0.26 mm and 0.11 mm, respectively. High turbulence might be caused by nozzle cavitation and the internal flow structure of the spray. Further, smaller diameter nozzles tend to produce high turbulence and this might be a reason for the difference between the two results. We can use the proposed breakup scaling and normalized penetration equation for the evaluation of these effects. However, there are not enough data in the literature.
The last example of validation was carried on the experimental data reported by M. Tongroon et al. [34]. They used a common rail injection system and a relatively large injector nozzle (solenoid type injector: Dn = 0.30 mm). Their results shown in Figure 22 obviously suggests that actual injection starts at 0.35 ms, delaying from the indicated time base.
Though the time base is adjusting, the data plotted in Figure 23 do not fit to the line. An estimated reason for this is considered to be the slow injection rate rise (Δ-type injection rate shaping) at the beginning of the injection. A slow rise in the injection rate is a unique characteristic of a solenoid-type injector. Further, a slow rise injection pattern is sometimes preferred to suppress diesel combustion noise and NOx formation. However, details of the injection system and injection rate were not described in the literature. Though all the penetrations do not fit to the theoretical line in Figure 23, they are well collapsed into one unique line. This means that breakup scaling is useful to understand not only the characteristics of sprays but also the characteristics of the injection system and injection rate shaping.
8. Similarity of Diesel Spray
An example of similarity law application could be realized with a system of fuel-into-water injection. When a diesel fuel is injected into water, the diesel fuel jet makes an emulsion and it can be observed as looking like a spray injected into gaseous surroundings. Since a high-injection speed is not needed for fuel-into-water injection, it is sometimes used for easy observation of liquid jet behavior coupling with atomization.
Pseudo-diesel spray formed by the fuel-into-water injection system was reported by S. Yoshikawa, et al. [35]. The upper five rows in Table 5 show their experimental conditions. They considered the density ratio (ρfuel/ρambient)0.5 as the similarity base. When Lb,water = Lb,air and tb,water = 8tb,air were assumed, dimensions of the scale-up nozzle for the fuel-into-water system, the effective injection pressures of both fuel-into-air and fuel-into-water injection systems, and surrounding compressed air pressure of a fuel-into-air system, could be designed. Here, L/d stands for length-to-diameter ratio of the injector nozzle.
Figure 24 shows the results of similarity law application for pseudo sprays obtained by a fuel-into-water injection system. The timescale for fuel-into-water is scaled up by eight-times based on the assumption. There is close agreement between fuel-into-air and fuel-into-water (L/d = 3) during the whole injection period. The behavior of fuel-into-water spray is linear in the period of the initiation of injection, and then proportional to the square root of time. The breakup lengths for the fuel-into-water sprays are estimated as 19 mm for L/d = 2 and 23 mm for L/d = 3. Comparing these breakup lengths with the breakup length (21.8 mm) of fuel-into-air spray, the agreement from breakup length shows the applicability of the similarity law of spray penetration. It shows that diesel spray and pseudo-diesel spray of L/d = 3 have similar tip penetrations, though the timescales are different.
The lower half of Table 5 is breakup time and breakup length, used for the non-dimensional expression of penetrations of these sprays. Non-dimensional expressions of spray tip penetration are shown in Figure 25 and Figure 26. Figure 25 is obtained using Equations (1) and (4) (old equations) and Figure 26 is obtained using Equations (10) and (11) (new equations). The above two equation couples are the same meaning but have different breakup parameters. The equation parameters of these breakups are shown in Table 1.
Since S. Yoshikawa’s experimental system [35] used a classical jerk pump injection system with low injection pressure and ΔP (effective injection pressure) was obtained from opening pressure in the injector needle, non-dimensional expressions using old-type equations with original coefficients match sophistically rather than the new ones. Further, when the exponential index n in Equation (38) is changed from 0.5 to 0.43, both of the spray tip penetrations for fuel-into-air and fuel-into-water sprays well coincide with the prediction curve, except the pseudo spray of L/d = 2. Figure 26 shows that new parameters do not well predict the penetrations. The main reason is the slow injection rate rise (no actual data) for the jerk pump system because new coefficients are based on a spray having a rectangular injection rate pattern.
Nozzle cavitation has a strong effect on the breakup process of the liquid jet [36]. It might enhance the atomization but its effect is not directly included in the penetration equations. It results in short penetration comparing the sprays of L/d = 3. Though the cavitation effect is indirectly included in velocity coefficient Kv, it is not enough for the expression of the penetration of L/d = 2 spray.
Since the length and time of breakup are eigenvalues of each spray and both include the whole the effects of nozzle configuration, cavitation, and injection rate shaping, spray tip penetrations might be collapsed into a unique curve when the actual times and lengths of breakup observed in real sprays are used in normalization. Figure 27 shows spray penetrations normalized by measured lengths and times of breakup. Used data are shown in the bottom two rows of Table 5. In this normalization, all three penetrations coincide well and also the estimated curve is well matched to the experimental results. It means that the length and time of liquid jet breakup are key parameters in the similarity law of spray penetration. This similarity law can be applicable not only to diesel sprays but also to pseudo-diesel sprays formed by fuel-into-water injection systems. In other words, spray tip penetration of diesel spray and breakup characterization of diesel spray jet are the same physical meaning for the characterization of diesel spray.
9. Application of Breakup Scaling
9.1. Micro-Hole Nozzle and Ignition Delay
A high-pressure common rail injector with a small-hole nozzle is a trend of injector development. A trial for a micro-hole injector was reported by S. Kobori, et al. [37]. They used a prototype micro-hole injector with a diameter of 0.06 mm. Table 6 shows three different injectors used in their experiment. Figure 28 shows their feasibility test results for the nozzle orifice diameter effect on the equivalence ratio of spray mixture. Here, the equivalence ratio is estimated at 0.8 ms (corresponding to average ignition delay) and this equivalence ratio is an average equivalence ratio of the whole mixture. It was obtained by injecting fuel mass and spray volume. Lean equivalence ratio for small orifice diameter means that spray formation speed increases with decreasing orifice diameter. According to the breakup scaling, since a diesel spray injected from a small nozzle has short breakup time and develops faster than a large nozzle diesel spray, a leaner mixture formation at 0.8 ms is a reasonable feature of the small spray.
The ignition delay period is strongly affected by the mixture formation. The micro-hole effect on ignition delay was investigated using three kinds of nozzle and a Rapid Compression Machine (RCM). Figure 29 shows their results. In this experiment, to keep the total injection fuel in a combustion cavity the same, numbers of orifice were arranged to keep the same total orifice area. Results show that the micro-hole injector can shorten the ignition delay owing to quick mixture formation.
The above micro-hole injector effect can be explained by the similarity law and downsizing effect of spray scale. A normalized timescale can be used to evaluate the ignition delay. Figure 30 shows the relationship between actual ignition delay and non-dimensional ignition delay, normalized by breakup time. As shown here, non-dimensional time of ignition is clearly separated by the orifice diameter of the nozzle. Note, tb depends on orifice diameter and effective injection pressure, as shown in Equation (11). Timescale rearranged by Equation (26) with Kbt = 15.7 is used here.
Ignition in the 0.06 mm nozzle spray occurs 15-times later than the breakup time. When we use Kbt = 8.87, it means over 8.4-times later. Though the actual ignition delays for three different nozzles do not show such a large difference, normalized timings of the ignition are far different. In other words, mixing degrees at ignition time are different. In the original paper [31], it was reported that the soot reduction effect of the micro-hole nozzle was obvious. The soot reduction effect can be explained by enough normalized mixing time before ignition, because the smaller scale of spray and constant chemical ignition delay that is independent from the scale of spray might provide a lean mixture for combustion.
9.2. Development of Diesel Spray and Its Combustion
Another trial of breakup scaling was performed on the diesel combustion simulation results reported by K. M. Pang, et al. [38]. They studied the performance of an Eulerian Stochastic Field (ESF) model in the simulation of spray flames produced by three injectors with different nozzle diameters of 0.100 mm, 0.180 mm, and 0.363 mm. Table 7 is the injectors and injection conditions used in their experiment and simulation.
Liquid-phase and vapor-phase penetrations obtained by simulation were well fitted to the experimental data. According to their report, liquid-phase penetration (LPL) of vaporizing spray is 15 mm for Case 1 (0.100 mm nozzle) and 33 mm for Case 2 (0.257 mm nozzle). This suggested an injector size effect on diesel spray. Ignition delay periods obtained from the experiment were 0.52 ms, 0.44 ms, and 0.56 ms for 0.100 mm, 0.180 mm and 0.363 mm nozzles, respectively. However, almost 0.71 ms ignition delay was obtained by the simulation and no effect of nozzle diameter on the ignition delay resulted. Set-off lengths [9,10] (LOL: lift-off length [7,8]) by OH (mass fraction threshold: 4 × 10⁻⁴) were 16 mm, 19 mm, and 30 mm for 0.100 mm, 0.180 mm, and 0.363 mm nozzles, respectively.
Figure 31a shows the comparisons of equivalence ratio—temperature (ϕ–T) scatter plots for the three established flames—which are extracted at approximately 0.5 ms after their respective ignition delays (~0.71 ms). The spray flame in the larger diameter nozzle (blue plots, Case 5: 0.363 mm nozzle) has a richer mixture region within the region of local temperature of 1200 K to 2200 K. However, the flame in the smaller nozzle (gray plots, Case 3: 0.100 mm nozzle) has a high-temperature combustion region but no extremely rich combustion appears. Figure 31b shows the non-dimensional flame length normalized by nozzle diameter. As the viewpoint of nozzle diameter, the diesel flame in the small nozzle has relatively longer normalized flame length than that of the larger nozzle.
Figure 32 depicts the temperature contours for the established flames. Black solid lines are used to represent iso-contours of ϕ, ranging from 1 to 4, where ϕ = 1 denotes the stoichiometric mixture (st). The spray jets at the center are cooled by the vaporized fuels and have rather low temperatures. The low-temperature region is extended with the increase in nozzle diameter. When the 0.363 mm nozzle is used, the fuel-rich regions mainly appear to be adjacent to the stoichiometric mixtures and do not meet along the spray axis prior to flame impingement on the chamber wall (over 100 mm).
It also illustrates the flame structures at approximately 0.5 ms after ignition (meaning 1.21 ms after injection start). It is apparent that the flame developments progress more rapidly and the spray flame jets are longer (and wider) in the cases with larger diameter nozzles. For quantitative comparison, the flame length is defined as the length where a significant amount of OH mass fraction is observed. The threshold is set to a mass fraction of 4 × 10⁻⁴, which is similar to the definition used for LOLs. The associated iso-contours are represented by the white solid line. The simulated flame lengths (hf) are then normalized by the orifice diameters (dnozz). The normalized flame length, as shown in Figure 31b, appears to have a decreasing tendency as the nozzle diameter increases.
Using the above data, breakup scaling analysis was performed. Breakup time tb and breakup length Lb are obtained from Table 7, and Equations (10) and (11) with Kv = 0.6. Summaries of scaling parameters are listed in Table 8. Though the simulated results of ignition delays of three cases are almost the same, the normalized ignition delays are far different from each other. Smaller spray (Case 3: 0.100 mm nozzle) has longer normalized ignition delay than others. Set-off length (LOL: Lift-off length) was obtained from the literature data and normalized by breakup length. Smaller spray (Case 3: 0.100 mm nozzle) also has the longest non-dimensional distance among the three cases. The three images in Figure 32 are a snapshot result of 0.5 ms after ignition but non-dimensional times normalized by breakup time were different.
Diesel spray combustion analysis based on breakup scaling is finally summarized, as shown in Figure 33. Normalized time and location of ignition estimated from the literature data are indicated by ![Energies 15 04926 i004]() mark. Diesel sprays corresponding to the snapshots in Figure 32 are also indicated on the S*–t* diagram (non-dimensional penetration-time diagram). When the development degrees of three sprays are compared in the S*–t* diagram, Case 3 spray (0.100 mm nozzle spray) is ignited at the most developed stage among three sprays. Then, the lean combustion tendency shown in Figure 31a is quite reasonable. Further, the relationship between ignition delay and nozzle diameter has a similar trend to the nozzle effect shown in Figure 30. From the S*–t* diagram, the following considerations are derived.
mark. Diesel sprays corresponding to the snapshots in Figure 32 are also indicated on the S*–t* diagram (non-dimensional penetration-time diagram). When the development degrees of three sprays are compared in the S*–t* diagram, Case 3 spray (0.100 mm nozzle spray) is ignited at the most developed stage among three sprays. Then, the lean combustion tendency shown in Figure 31a is quite reasonable. Further, the relationship between ignition delay and nozzle diameter has a similar trend to the nozzle effect shown in Figure 30. From the S*–t* diagram, the following considerations are derived.
 mark. Diesel sprays corresponding to the snapshots in Figure 32 are also indicated on the S*–t* diagram (non-dimensional penetration-time diagram). When the development degrees of three sprays are compared in the S*–t* diagram, Case 3 spray (0.100 mm nozzle spray) is ignited at the most developed stage among three sprays. Then, the lean combustion tendency shown in Figure 31a is quite reasonable. Further, the relationship between ignition delay and nozzle diameter has a similar trend to the nozzle effect shown in Figure 30. From the S*–t* diagram, the following considerations are derived.
- (a)
- Though the actual elapsed times at snapshots shown in Figure 32 are almost the same, the snapshot of Case 3 (0.100 mm nozzle spray) corresponds to the most-progressed spray (non-dimensionally aged spray). As the viewpoint of breakup scaling, Case 3 shows an aged diesel spray combustion and Case 5 corresponds to a flesh spray combustion.
- (b)
- Ignition in Case 5 (0.363 mm nozzle spray) occurs in the breakup region (S* < 1) of the spray, whereas ignition in Case 3 (0.100 mm nozzle spray) occurs far away (S* > 1) from the breakup region.
- (c)
- The high-temperature flame in Case 3 spray is caused by a sufficiently developed spray (aged spray) of small scale.
- (d)
- Relative flame length normalized by nozzle diameter (Figure 31b) and relative flame length by breakup scaling (h*f = S*flame − S*ig in Figure 33) shows an inverse tendency. Non-dimensional flame length is almost twice the value in Case 3 (0.100 mm nozzle spray) compared with Case 5 (0.363 mm nozzle spray). It means that the mixing degree of Case 3 is more well progressed (aged spray combustion) than Case 5 (flesh spray combustion).
- (e)
- Local equivalence distribution in ϕ-T map expands to a rich mixture area when the size of the injector nozzle changes to large. When the diameter of the nozzle changes to small, local equivalence ratio distribution in the rich mixture area vanishes and high-temperature combustion is promoted. This is quite reasonable when the different degree of spray development is taken into consideration.
Further, K. M. Pang, et al. [39] reported flame lift-off positions changing with ambient pressure (ambient gas density). Figure 34 shows their numerical results. Both the lift-off length and ignition delay are shortened by an increase in the ambient pressure. Figure 35 is the non-dimensional expression following the proposed method (Kv = 0.6) in this article. From the rearranged expression shown here, it is clear that flame lift-off position is stabilizing near the breakup position of the spray. The magenta dotted line indicates the boundary separating the domains of ignition (latter time domain after ignition) and induction to ignition (former time domain before ignition). By depicting the tip penetration, it can be clearly indicated in the figure.
When the ambient pressure increases from 4.2 MPa (14.8 kg/m3) to 17 MPa (58.5 kg/m3), the lift-off position becomes nearer to the nozzle than breakup length position that is defined as the complete breakup of the spray center. High ambient pressure tends to decrease breakup length but also promotes the mixing process of side spray around the liquid core in the spray. It promotes quick auto-ignition around the core of the spray and results in shorter lift-off length. It cannot be explained by the lift off that is based on the flame propagation velocity. To explain this tendency, the set-off time (preparation time) of the local reactive mixture should be considered [9].
ASI (after start of injection) time of 1.5 ms corresponds to 28 non-dimensional time for 4.2 MPa spray (14.8 kg/m3 spray) and 53 non-dimensional time for 17 MPa spray (58.5 kg/m3 spray). As the viewpoint of breakup time scaling, the latter spray has a two-times longer characteristic combustion period than the former spray. It means that the 17 MPa spray (58.5 kg/m3 spray) aged quickly compared to the 4.2 MPa spray (14.8 kg/m3 spray). The mixing process of the 17 MPa spray is more processed than the 4.2 MPa spray. As pointed out in the original literature [38], thus, the NO formation process might be accelerated by the relatively short ignition delay and high-temperature combustion in the local premixed mixture in the 17 MPa spray (58.5 kg/m3 spray).
9.3. Boost Pressure Effect on Diesel Spray
The length and time of the diesel spray are affected by the boost pressure in the engine operation condition. W. F. Colban, et al. [40] investigated the intake pressure effect on performance and emission in a diesel engine operation. Using a single-cylinder test engine, shown in Table 9, they measured the engine performance and hydrocarbon emissions under boost pressures of 1.0, 1.5, and 2 bar.
Since these boost conditions corresponded to around 40, 60, and 80 bar back pressure conditions at fuel injection timing, they simulated spray development under these backpressure conditions and depicted the sprays shown in Figure 36. The left-hand sides of the images illustrate the spray penetration, dispersion angle, and relative position of the piston and injector tip at 2 °CA after the actual start of injection (ASOIa). Where spray penetration profiles overlapped the piston bowl, impingement on the piston was implied. For intake pressures of 1.0 and 1.5 bar, the fuel jet targeting at 2 °CA ASOIa showed that a portion of the fuel vapor might enter the squish volume, while at 2.0 bar intake pressure, little or no fuel vapor was expected to enter the squish volume. Apart from spray targeting, the reduction in penetration distance with increasing boost should also contribute to reduced fuel penetration in the squish volume. They used this analysis and successfully explained the UHC emission reduction in a high-boost operation.
Using their open data in the literature [40] and some additional assumptions, breakup times and lengths of their sprays are estimated as listed in Table 10. According to the breakup time estimation, 2 °CA after the actual start of injection (ASOIa) corresponds to the non-dimensional breakup times of 3.08 for 1 bar boost, 3.67 for 2 bar boost, and 4.49 for 2 bar boost. Spray tip A/F in Figure 6 is changed 2.58, 2.83, and 3.28 corresponding to the non-dimensional time of t* = 3.08, 3.67, and 4.49, respectively. It suggests that the spray of the 2.0 bar condition in Figure 36 is a more aged spray than the other two sprays, though the vapor penetration is shorter than the others. The aged spray means that fuel mixing with hot air is promoted and unburned hydrocarbon tended to remain hardly near the squish wall.
Estimated breakup length results in a similar discussion as the original paper, but additional information related to the timescale can produce a deeper discussion. The estimated breakup length 1.0 bar spray is 13% longer than the liquid length of 17.1 mm at 0.5 °CA. As for the 2.0 bar condition, the estimated breakup length is 7% shorter than the liquid length of 13.9 mm at 0.5 °CA and suggests a smaller length scale spray than the others. Thus, estimated breakup length shows a clearer reduction with a boost pressure increase. It might be constant during the combustion phase because of no large density change by combustion. Both the time and length scale for the high-boost condition results in a small-scale spray; in other words, “scale down effect”, similar to the small nozzle spray explained in Figure 33.
When an early stage premixed combustion during injection period results in a combustion pressure rise from 40 bar to 60 bar, the time and length scale of diesel spray decreases 16% for the timescale and 17% for length. It implies a scale-down effect of combustion pressure rise. However, a quick and large pressure rise is not expected for recent diesel injection near TDC timing. This means that diesel spray scale is not affected by a combustion pressure rise in usual diesel combustion.
10. Diesel Spray and Engine Scale
The principle of breakup scaling proposed here is based on the characteristics of diesel spray. Thus, engine size, engine speed, heat release period, etc., can be normalized and evaluated using the breakup scaling principle. It can show the relative length and time relationships among dynamic behavior of diesel spray, engine size, and speed. Figure 37 shows the above relationship, illustrated on the S*–t* diagram. Here, small and high-speed diesel represents an engine with a bore of 85~110 mm and speed of 1500~2500 rpm. The medium-sized engine corresponds to 140~160 mm bore and speeds of 1000~1500 rpm. Large-sized and low-speed diesel corresponds to 250~350 mm bore and 200~500 rpm.
The combustion-phase period tϴ is normalized by the breakup time of the spray. Here, the period from TDC to 90 deg. aTDC is adopted as the combustion-phase period. On the other hand, cavity size L is normalized by the breakup length. Profiles of L*–tϴ* relationships corresponding to three engine sizes (small, medium, and large) are shown by red, green, and blue zones, respectively. Further, the normalized heat-release phase (usually shorter than tϴ*) for each size of engine is shown near the t* axis. As a standpoint of a given scale engine with a given injector specification, the upper zone of the spray penetration line in the L*–tϴ* diagram, which corresponds to the longer distance space than spray tip position. The lower zone is the shorter distance space than spray tip position.
In the small and high-speed diesel, the spray is confined in a relatively narrow space. It results in a relatively flesh spray combustion that is affected by the cavity wall. On the contrary, aged spray in a free space is a typical feature of large and low-speed diesel. It means relatively smaller spray than engine size. However, the heat-release period in large-sized and low-speed diesel is not delayed, because absolute speeds of mixture formation and chemical reaction, including auto-ignition, are changed only slightly by engine size and engine speed. It means the relatively short heat-release period for a large sized engine. On the contrary, it means that a relatively long heat-release period is a typical feature of small-size and high-speed engines. Using breakup scaling, we can consider the many diesel spray combustion events related with relative temporal and spatial characteristics of diesel spray itself.
11. Summaries
Tip penetration of diesel spray is reconsidered to derive the general concept of diesel spray that can be applicable to various scale sprays. The main conclusions of this analysis are as follows.
- (1)
- Breakup length and breakup time can be considered as characteristic eigenvalue parameters of an individual diesel spray. In other words, all the behavior of non-dimensional tip penetration after breakup is uniquely governed by these two eigenvalues.
- (2)
- Breakup scaling using breakup length and its time is a useful method for non-dimensional expression of spray tip penetration.
- (3)
- Tip penetrations of various sprays are collapsed into one unique function when breakup scaling is adopted. It can also be applicable to a pseudo-diesel spray formed with a fuel-into-water injection system. Thus, similarity law can be established using breakup scaling.
- (4)
- The air–fuel ratio (A/F) of a spray tip can be expressed by a simple function of non-dimensional elapsed time, normalized by breakup time. Further, the average A/F of the whole spray can be expressed by normalized breakup time.
- (5)
- Various spray penetrations, including wall impingement sprays, can be collapsed into one unique penetration relationship on the S*–t* diagram.
- (6)
- Breakup scaling and the S*–t* diagram can be expanded to wall impingement diesel spray.
- (7)
- Breakup scaling and the S*–t* diagram are useful to explain the nozzle size effect on diesel spray. Further, this diagram is useful for understanding the injection rate change at the beginning of the injection.
- (8)
- Ignition delay and set-off (lift-off) position of diesel spray combustion can be explained reasonably using the S*–t* diagram.
- (9)
- An increase in intake boost pressure has a scale-down effect on diesel spray.
Funding
This research received no external funding.
Acknowledgments
Author appreciates the many literature authors to use their data for verification of the breakup scaling. The concept of breakup scaling is the summarized result of my long-term (1980–2015) diesel spray research and many researchers had been joined to my diesel spray researches. Author thanks to their co-operation.
Conflicts of Interest
The author of this article declares no conflict of interest for this article.
References
- Brown, S.; Menon, S.; Hagen, C. Investigation of Scaling Laws for Combustion Engine Performance. Available online: https://sites01.lsu.edu/faculty/smenon/wp-content/uploads/sites/133/2017/02/WSSCI_Provo_v5.pdf#search=%27Scaling+law%2C+engine%27 (accessed on 17 December 2019).
- Chikahisa, T.; Murayama, T. Theory on Combustion Similarity for Different-Sized Diesel Engines. Trans. Jpn. Soc. Mech. Eng. Part B 1990, 33, 395–400. [Google Scholar] [CrossRef] [Green Version]
- Suzuki, T.; Ohshima, R. An Experimental Study on Diesel Spray Behavior. Non-dimensional Expression for Spray Tip Penetration. J. Jpn. Inst. Mar. Eng. 2002, 37, 213–219. [Google Scholar] [CrossRef] [Green Version]
- Payri, R.; García, J.; Salvador, F.; Gimeno, J. Using spray momentum flux measurements to understand the influence of diesel nozzle geometry on spray characteristics. Fuel 2005, 84, 551–561. [Google Scholar] [CrossRef]
- Chuahy, F.D.F.; Olk, J.; DelVescovo, D.; Kokjohn, S.L. An engine size-scaling method for kinetically controlled combustion strategies. Int. J. Engine Res. 2018, 21, 927–947. [Google Scholar] [CrossRef] [Green Version]
- Inagaki, K.; Mizuta, J.; Kawamura, K.; Idota, Y.; Hashizume, T. Theoretical Study on Spray Design for Small-Bore Diesel Engine; SAE Technical Paper; SAE International: Warrendale, PA, USA, 2016. [Google Scholar] [CrossRef]
- Naber, J.D.; Siebers, D.L. Effects of Gas Density and Vaporization on Penetration and Dispersion of Diesel Sprays. SAE Trans. 1996, 105, 82–111. [Google Scholar] [CrossRef] [Green Version]
- Dos Santos, F.; Le Moyne, L. Spray Atomization Models in Engine Applications, from Correlations to Direct Numerical Simulations. Oil Gas Sci. Technol.—Rev. d’IFP Energ. Nouv. 2011, 66, 801–822. [Google Scholar] [CrossRef] [Green Version]
- Arai, M. Physics behind Diesel sprays, ICLASS-2012. In Proceedings of the 12th Triennial International Conference on Liquid Atomization and Spray systems, Heidelberg, Germany, 2–6 September 2012. CD-1419. [Google Scholar]
- Arai, M. Chapter 4.1.6 Non-dimensional Spray Penetration. In Physics behind Diesel Spray and Its Combustion; LAMBERT Academic Publishing: Saarbrücken, Germany, 2016; pp. 145–148. [Google Scholar]
- Cao, T.; He, Z.; Zhou, H.; Guan, W.; Zhang, L.; Wang, Q. Experimental study on the effect of vortex cavitation in scaled-up diesel injector nozzles and spray characteristics. Exp. Therm. Fluid Sci. 2019, 113, 110016. [Google Scholar] [CrossRef]
- Knox, B.W.; Genzale, C.L. Scaling combustion recession after end of injection in diesel sprays. Combust. Flame 2017, 177, 24–36. [Google Scholar] [CrossRef]
- Zhou, X.; Li, T.; Lai, Z.; Wang, B. Scaling fuel sprays for different size diesel engines. Fuel 2018, 225, 358–369. [Google Scholar] [CrossRef]
- Zhou, X.; Li, T.; Wei, Y.; Wu, S. Scaling spray combustion processes in marine low-speed diesel engines. Fuel 2019, 258, 116133. [Google Scholar] [CrossRef]
- Arai, M. Tip Penetration of Diesel Spray Normalized by Breakup Length and Time, Special Lecture, Atomization Symposium, ILASS-Japan; Institute of Liquid Atomization and Spray Systems: Kiryu Gunma, Japan, 2020. [Google Scholar]
- Veniamin, G.L. Physicochemical Hydrodynamics; Prentice-Hall Inc.: Englewood Cliffs, NJ, USA, 1962; pp. 639–650. [Google Scholar]
- Hiroyasu, H.; Kadota, T.; Arai, M. Supplementary Comments: Fuel Spray Characterization in Diesel Engines, Combustion Modeling in Reciprocating Engines; James, N.M., Charles, A.A., Eds.; Prenum Press: New York, NY, USA; London, UK, 1980; pp. 369–408. [Google Scholar]
- Wakuri, Y.; Fujii, M.; Amitani, T.; Tsuneya, R. Studies on the Penetration of Fuel Spray of Diesel Engine. Trans. Jpn. Soc. Mech. Eng. 1959, 25, 820–826. [Google Scholar] [CrossRef] [Green Version]
- Arai, M. Diesel Spray Penetration and Air Entrainment. In Proceedings of the 13th Triennial International Conference on Liquid Atomization and Spray Systems, Tainan, Taiwan, 23–27 August 2015. B2-1-002. [Google Scholar]
- Arai, M. Diesel Spray Behaviour and Air Entrainment. Free. Access J. Nanosci. Nanotechnol. Appl. 2018, 102, 1–17. [Google Scholar]
- Hiroyasu, H.; Arai, M.; Tabata, M. Empirical Equations for the Sauter Mean Diameter of a Diesel Spray. SAE Trans. 1989, 98, 868–877. [Google Scholar] [CrossRef]
- Arai, M. Chapter 3.3.5 Droplet Size Distribution and Mean Droplet Size. In Physics behind Diesel Spray and Its Combustion; LAMBERT Academic Publishing: Saarbrücken, Germany, 2016; pp. 110–116. [Google Scholar]
- Zama, Y.; Ochiai, W.; Furuhata, T.; Arai, M. Study on Behavior of Diesel Spray under High Ambient Dencity Conditionm. In Proceedings of the 15th Annual Conference on Liquid Atomization and Spray Systems—Asia, ILASS-Asia 2011, Kenting, Pingtung, Taiwan, 20–21 October 2011. [Google Scholar]
- Zama, Y.; Ochiai, W.; Furuhata, T.; Arai, M. Velocity distribution inside a diesel spray under high ambient density condition. In The Proceedings of the International Symposium on Diagnostics and Modeling of Combustion in Internal Combustion Engines; The Japan Society of Mechanical Engineers: Tokyo, Japan, 2012; No. 1246; pp. 269–274. [Google Scholar]
- Arai, M. Chapter 5.4.1 Momentum Conservation and Air Entrainment. In Physics behind Diesel Spray and Its Combustion; LAMBERT Academic Publishing: Saarbrücken, Germany, 2016; pp. 206–208. [Google Scholar]
- Craske, J.; van Reeuwijk, M. Energy dispersion in turbulent jets. Part 1. Direct simulation of steady and unsteady jets. J. Fluid Mech. 2014, 763, 500–537. [Google Scholar] [CrossRef] [Green Version]
- Rajaratnam, N. Turbulent Jets; Japanese Version; Nomura, Y., Translator; Elsevir Scientific Publishing: Amsterdam, The Netherlands, 1976. [Google Scholar]
- Ebara, T.; Amagai, K.; Arai, M. Image Analysis of a Diesel Spray Impinging on a Wall. Int. J. Fluid Mech. Res. 1997, 24, 261–272. [Google Scholar] [CrossRef]
- Ko, K.; Arai, M. Diesel Spray and Adhering Fuel on an Impingement Wall; SAE Technical Paper; SAE International: Warrendale, PA, USA, 2002. [Google Scholar] [CrossRef]
- Akop, M.Z.; Zama, Y.; Furuhata, T.; Arai, M. Characteristics of Adhesion Diesel Fuel on an Impingement Disk Wall. At. Sprays 2014, 24, 625–650. [Google Scholar] [CrossRef]
- Roisman, I.V.; Lucio Araneo, C. Tropea, Effect of ambient pressure on penetration of a diesel spray. Int. J. Multiph. Flow 2007, 33, 904–920. [Google Scholar] [CrossRef]
- Lei, Y.; Liu, J.; Qiu, T.; Mi, J.; Liu, X.; Zhao, N.; Peng, G. Effect of injection dynamic behavior on fuel spray penetration of common-rail injector. Energy 2019, 188, 116060. [Google Scholar] [CrossRef]
- Zhou, X.; Li, T.; Lai, Z.; Wei, Y. Modeling diesel spray tip and tail penetrations after end-of-injection. Fuel 2018, 237, 442–456. [Google Scholar] [CrossRef]
- Tongroon, M.; Thongchai, S.; Chollacoop, N.; Lim, O. The Spray Characteristics of Ethanol-Biodiesel-Diesel Blended Fuel (B10E10). In Proceedings of the 14th Triennial International Conference on Liquid Atomization and Spray Systems, Chicago, IL, USA, 22–26 July 2018. Paper No. 232. [Google Scholar]
- Yoshikawa, S.; Nishida, K.; Arai, M.; Hiroyasu, H. Visualization of Fuel-Air Mixing Processes in a Small D.I. Diesel Engine Using the Liquid injection Technique. SAE Trans. 1988, 97, 453–462. [Google Scholar] [CrossRef]
- Arai, M. Chapter 2 Cavitation and Nozzle Flow. In Physics behind Diesel Spray and Its Combustion; LAMBERT Academic Publishing: Saarbrücken, Germany, 2016; pp. 43–73. [Google Scholar]
- Kobori, S.; Kamimoto, T.; Kosaka, H. Ignition, Combustion and Emissions in a DI Diesel Engine Equipped with a Micro-hole Nozzle. Trans. Jpn. Soc. Mech. Eng. Ser. B 1996, 62, 814–819. [Google Scholar] [CrossRef]
- Pang, K.M.; Jangi, M.; Bai, X.; Schramm, J.; Walther, J.H. Effects of Nozzle Diameter on Diesel Spray Flames: A numerical study using an Eulerian Stochastic Field Method. In Proceedings of the 9th International Conference on Applied Energy, ICAE2017, Cardiff, UK, 21–24 August 2017; Energy Procedia 142. pp. 1028–1033. [Google Scholar]
- Pang, K.M.; Jangi, M.; Bai, X.-S.; Schramm, J.; Walther, J.H.; Glarborg, P. Effects of ambient pressure on ignition and flame characteristics in diesel spray combustion. Fuel 2018, 237, 676–685. [Google Scholar] [CrossRef]
- Colban, W.F.; Miles, P.C.; Oh, S. Effect of Intake Pressure on Performance and Emissions in an Automotive Diesel Engine Operating in Low Temperature Combustion Regimes. SAE Trans. 2007, 116, 957–977. [Google Scholar] [CrossRef]
Figure 1.
Time and length scales of diesel spray.

Figure 2.
Small- and large-scale diesel sprays.

Figure 3.
Surface wave on a cylindrical liquid column.

Figure 4.
Frequency analysis of diesel spray fluctuation. It was obtained by FFT analysis on spray velocity measured by PIV (Dn = 0.17 mm, Pinj = 90 MPa, Pa = 1 MPa). Red values represent the wavelength corresponding with the frequency.
Figure 4.
Frequency analysis of diesel spray fluctuation. It was obtained by FFT analysis on spray velocity measured by PIV (Dn = 0.17 mm, Pinj = 90 MPa, Pa = 1 MPa). Red values represent the wavelength corresponding with the frequency.

Figure 5.
Normalized expression of spray tip penetration.

Figure 6.
Normalized penetration, normalized velocity, and air/fuel ratio of spray tip.

Figure 7.
Injection rate of tested injection system [16].
Figure 7.
Injection rate of tested injection system [16].


Figure 9.
Non-dimensional spray tip penetration normalized by breakup scale. Plot indicated by leader line of pressure condition shows the 100 mm penetration position of each spray.
Figure 9.
Non-dimensional spray tip penetration normalized by breakup scale. Plot indicated by leader line of pressure condition shows the 100 mm penetration position of each spray.

Figure 10.
General behavior of non-dimensional spray penetration changing with exponential index n.

Figure 11.
Longitudinal velocity change as a function of index n and timing t*.

Figure 12.
Middle stage change of spray penetration. Exponential index changes from 0.5 to n at t*m = 10.
Figure 12.
Middle stage change of spray penetration. Exponential index changes from 0.5 to n at t*m = 10.

Figure 13.
Penetrations of initial and following sprays. Delayed starting time of the following spray is 10 on non-dimensional timescale.
Figure 13.
Penetrations of initial and following sprays. Delayed starting time of the following spray is 10 on non-dimensional timescale.

Figure 14.
Spray tip penetration after wall impingement.

Figure 15.
Normalized spray penetration after wall impingement.

Figure 16.
Influence of the ambient pressure on the spray penetration. The injection pressures are: (a) Pi = 300 bar, (b) Pi = 700 bar, (c) Pi = 1000 bar, (d) Pi = 1350 bar. Dots are their experimentally obtained results. The continuous lines correspond to the proposed theoretical model (Reprinted with permission from Ref. [31]. Copyright 2007, Elsevier Ltd.).

Figure 17.
Normalized spray penetrations of Figure 16 sprays. The injection pressures are: (a) Pi = 300 bar, (b) Pi = 700 bar, (c) Pi = 1000 bar, (d) Pi = 1350 bar. The dashed line corresponds penetration of similarity law equation with .
Figure 17.
Normalized spray penetrations of Figure 16 sprays. The injection pressures are: (a) Pi = 300 bar, (b) Pi = 700 bar, (c) Pi = 1000 bar, (d) Pi = 1350 bar. The dashed line corresponds penetration of similarity law equation with .


Figure 19.
Normalized diesel spray penetration, Dn = 0.260 mm, ρa = 12 kg/m3 (at 1.0 MPa).

Figure 20.
Normalized diesel spray penetration with 0.03 ms modification, Dn = 0.260 mm, ρa = 12 kg/m3 (at 1.0 MPa).
Figure 20.
Normalized diesel spray penetration with 0.03 ms modification, Dn = 0.260 mm, ρa = 12 kg/m3 (at 1.0 MPa).

Figure 21.
Normalized spray penetration of 150 MPa injection under 15, 20 and 25 MPa surroundings. Nozzle diameter is 0.11 mm. The dashed line corresponds penetration of similarity law equation with and solid line is S* = (t*)0.46. Penetration data are reconstructed from the literature [33].
Figure 21.
Normalized spray penetration of 150 MPa injection under 15, 20 and 25 MPa surroundings. Nozzle diameter is 0.11 mm. The dashed line corresponds penetration of similarity law equation with and solid line is S* = (t*)0.46. Penetration data are reconstructed from the literature [33].

Figure 22.
Spray penetration length at back pressure of 30 and 50 bar (Nozzle diameter: 0.30 mm, Injection pressure: 600, 900, and 1200 bar by common rail injection system) [34].
Figure 22.
Spray penetration length at back pressure of 30 and 50 bar (Nozzle diameter: 0.30 mm, Injection pressure: 600, 900, and 1200 bar by common rail injection system) [34].

Figure 23.
Normalized spray penetration length at back pressure of 30 and 50 bar (nozzle diameter: 0.30 mm, injection pressure: 600, 900, and 1200 bar by common rail).
Figure 23.
Normalized spray penetration length at back pressure of 30 and 50 bar (nozzle diameter: 0.30 mm, injection pressure: 600, 900, and 1200 bar by common rail).

Figure 24.
Penetration similarity between fuel-into-air and fuel-into-water injections. Upper timescale is for fuel-into-water spray and lower is for fuel-into-air spray [35].
Figure 24.
Penetration similarity between fuel-into-air and fuel-into-water injections. Upper timescale is for fuel-into-water spray and lower is for fuel-into-air spray [35].

Figure 25.
Spray tip penetrations normalized by old equations and coefficients.

Figure 26.
Spray tip penetrations normalized by new equations and coefficients.

Figure 27.
Spray tip penetration normalized by measured length and time of breakup.

Figure 28.
Effect of nozzle orifice diameter and injection pressure on mean equivalence ratio at 0.8 ms after start of injection [37].
Figure 28.
Effect of nozzle orifice diameter and injection pressure on mean equivalence ratio at 0.8 ms after start of injection [37].

Figure 29.
Effect of nozzle diameter on ignition delay [37].
Figure 29.
Effect of nozzle diameter on ignition delay [37].

Figure 30.
Non-dimensional timescale of ignition delay.

Figure 31.
Comparisons of (a) ϕ-T characteristics at 0.5 ms after ignition and (b) normalized flame lengths for different nozzle diameters [38].
Figure 31.
Comparisons of (a) ϕ-T characteristics at 0.5 ms after ignition and (b) normalized flame lengths for different nozzle diameters [38].

Figure 32.
Comparisons of temperature distributions of the established flames for nozzle diameters of (a) 100 µm, (b) 180 µm, and (c) 363 µm. The temperature contours, equivalence ratio iso-contours (black lines), and OH mass fraction iso-contours (white lines) are reflected along the spray axis, while the purple solid lines represent the averaged LPL (liquid penetration length) in the reacting cases [38].

Figure 33.
Diesel spray combustion analysis based on breakup scaling. (a): Case 3 with 0.100 mm nozzle, (b): Case 4 with 0.180 mm nozzle, and (c): Case 5 with 0.363 mm nozzle. Mark ![Energies 15 04926 i004]() shows the ignition location and time, and illustration
shows the ignition location and time, and illustration ![Energies 15 04926 i005]() shows the spray flame configuration at snapshot timing in the simulation.
shows the spray flame configuration at snapshot timing in the simulation.
shows the ignition location and time, and illustration  shows the spray flame configuration at snapshot timing in the simulation.
Figure 33.
Diesel spray combustion analysis based on breakup scaling. (a): Case 3 with 0.100 mm nozzle, (b): Case 4 with 0.180 mm nozzle, and (c): Case 5 with 0.363 mm nozzle. Mark ![Energies 15 04926 i004]() shows the ignition location and time, and illustration
shows the ignition location and time, and illustration ![Energies 15 04926 i005]() shows the spray flame configuration at snapshot timing in the simulation.
shows the spray flame configuration at snapshot timing in the simulation.
shows the ignition location and time, and illustration shows the spray flame configuration at snapshot timing in the simulation.
Figure 34.
Ambient pressure effect on flame lift-off positions of the reacting sprays as a function of time after start of injection (ASI). Basic conditions are same as Case 4 in Table 6. Vertical and horizontal dash-dotted lines with asterisks represent the experimental ignition delay times and averaged flame lift-off lengths, respectively. Magenta dotted line indicates the boundary separating the domains of ignition (latter time domain after ignition) and the domain of induction to ignition (former time domain before ignition) [39].

Figure 35.
Non-dimensional expression of flame set-off (lift-off) positions corresponding to Figure 34.
Figure 35.
Non-dimensional expression of flame set-off (lift-off) positions corresponding to Figure 34.

Figure 36.
Schematics showing vapor penetration distances and dispersion angles in the left-hand column, and liquid length positions at certain times after the start of actual injection (ASOIa) in the right-hand column [40].
Figure 36.
Schematics showing vapor penetration distances and dispersion angles in the left-hand column, and liquid length positions at certain times after the start of actual injection (ASOIa) in the right-hand column [40].

Figure 37.
Breakup scaling of spray tip penetration, combustion phase, and engine size.


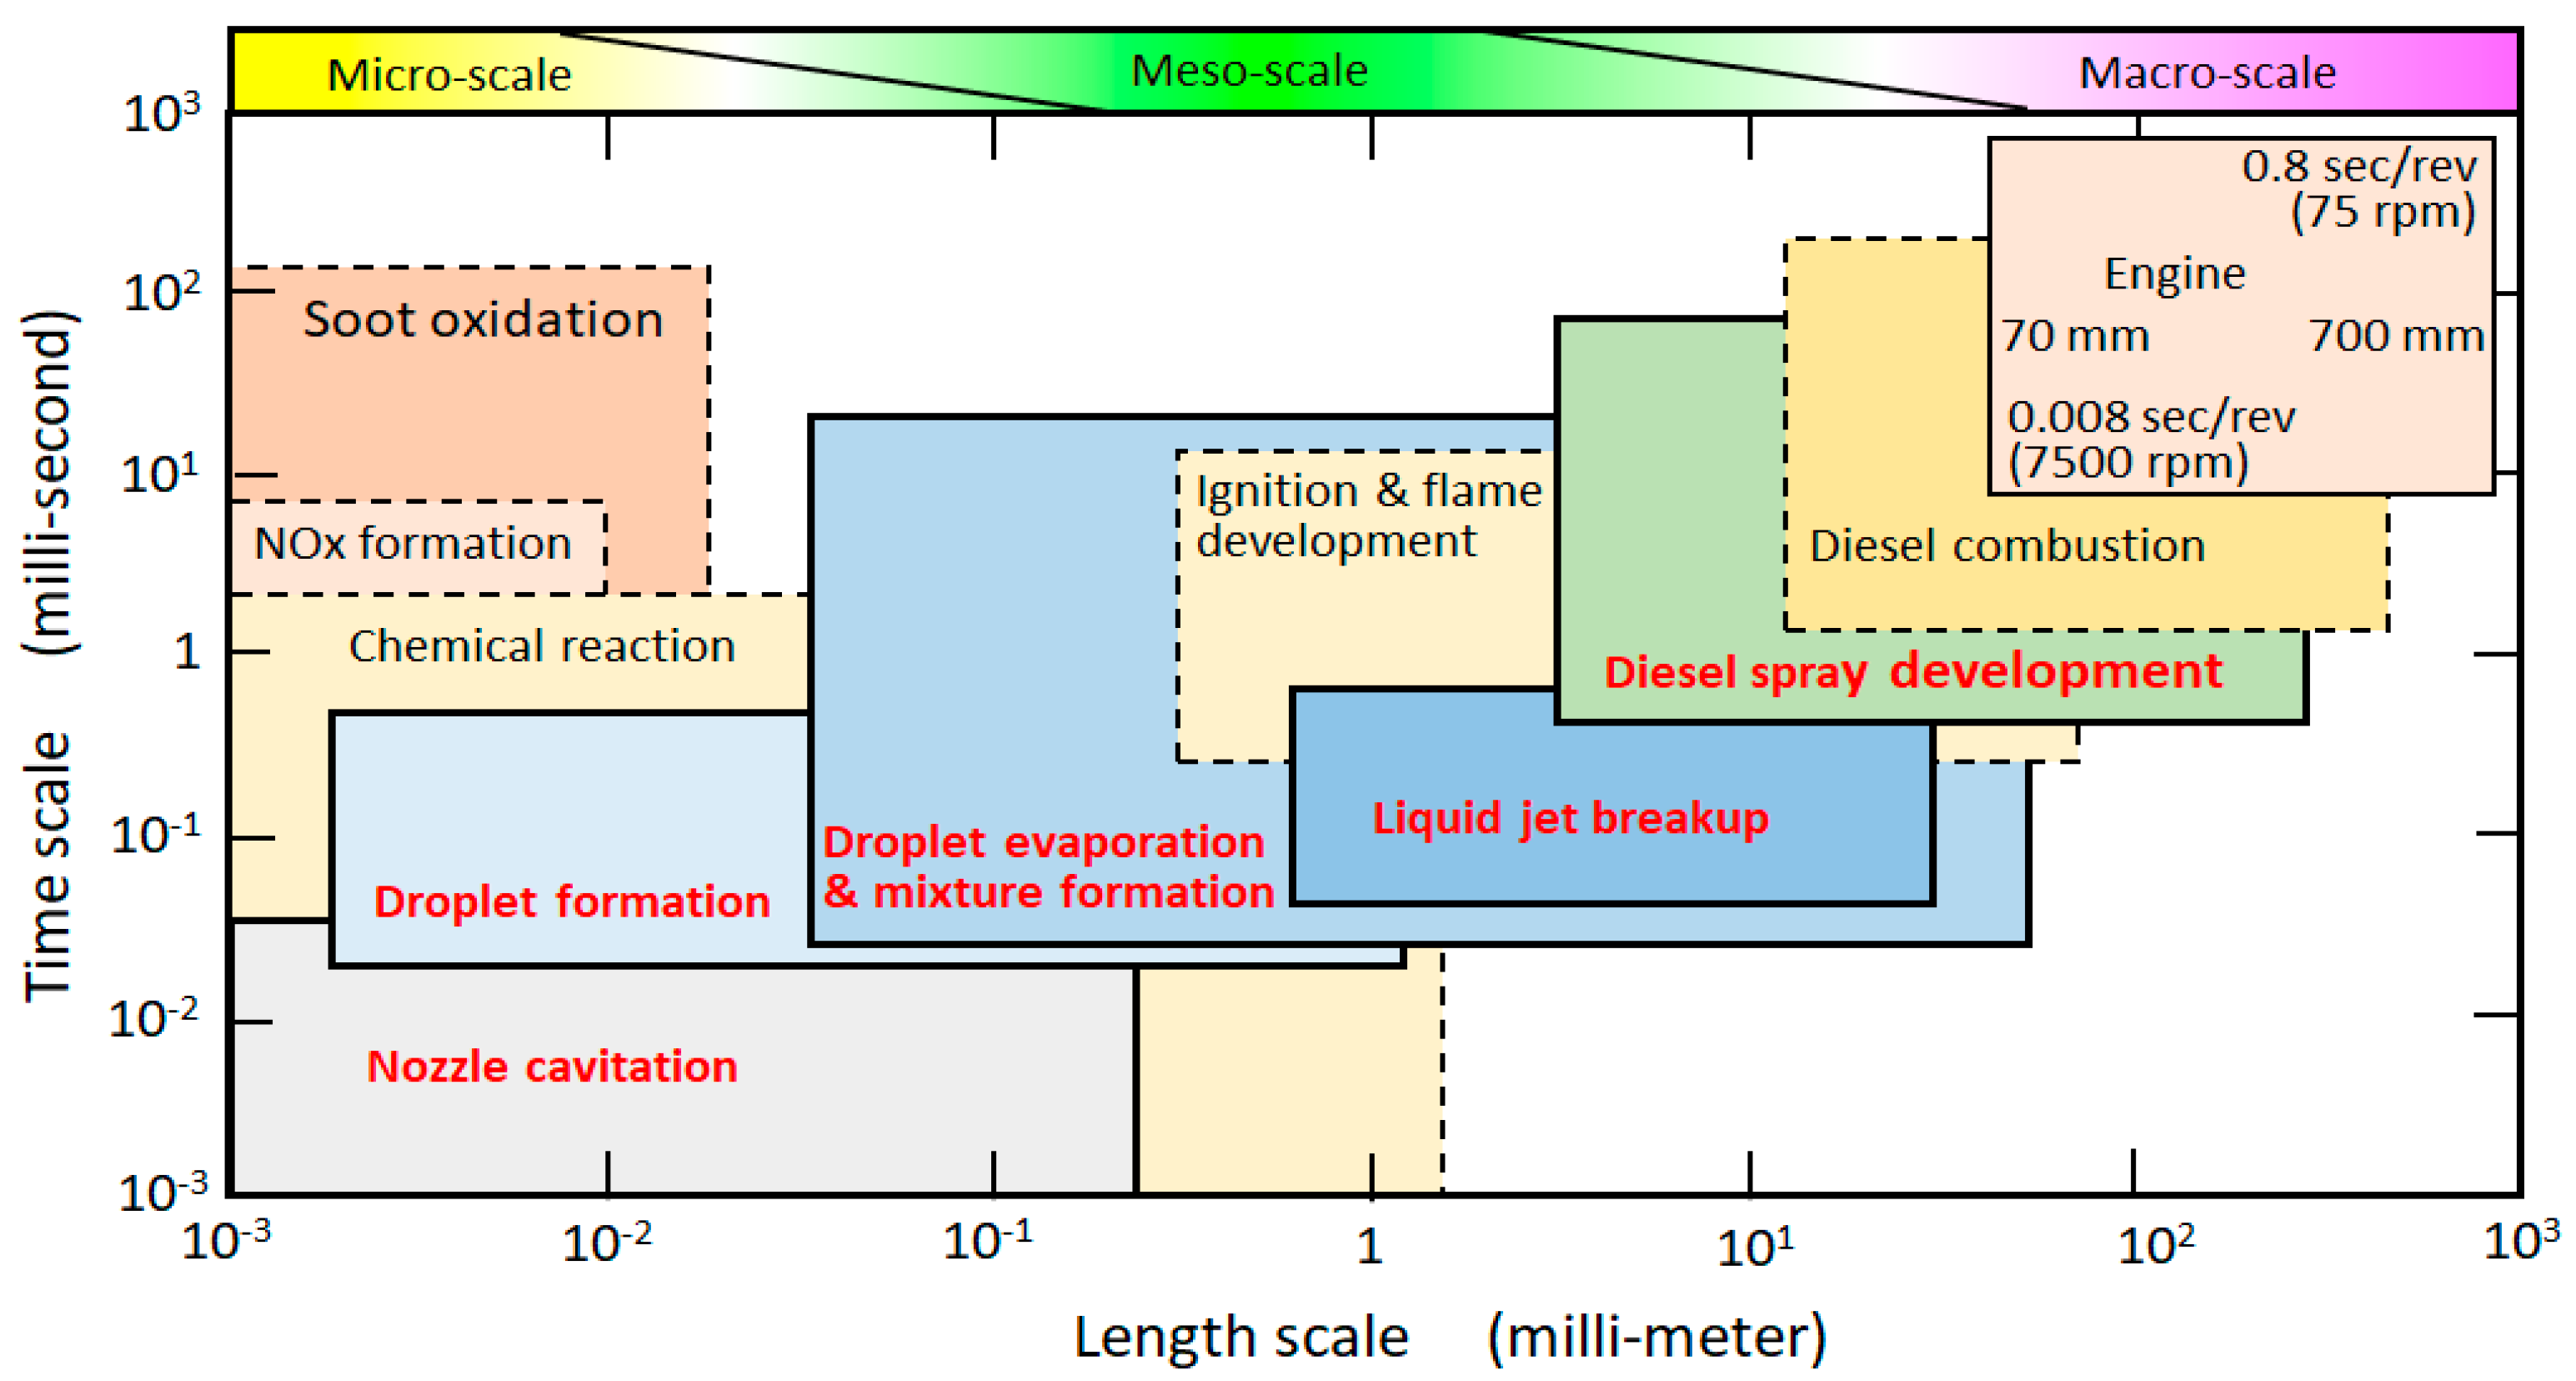
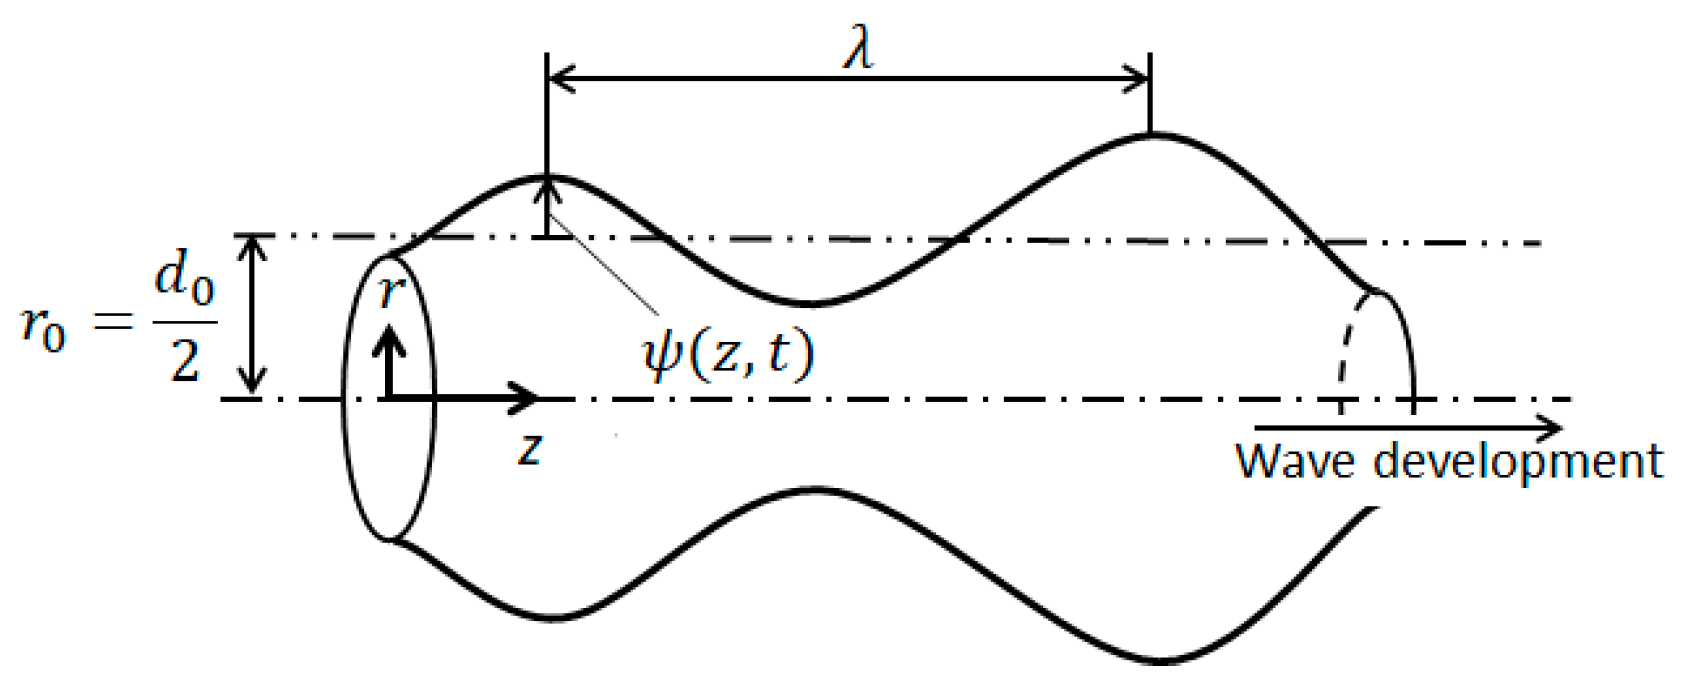
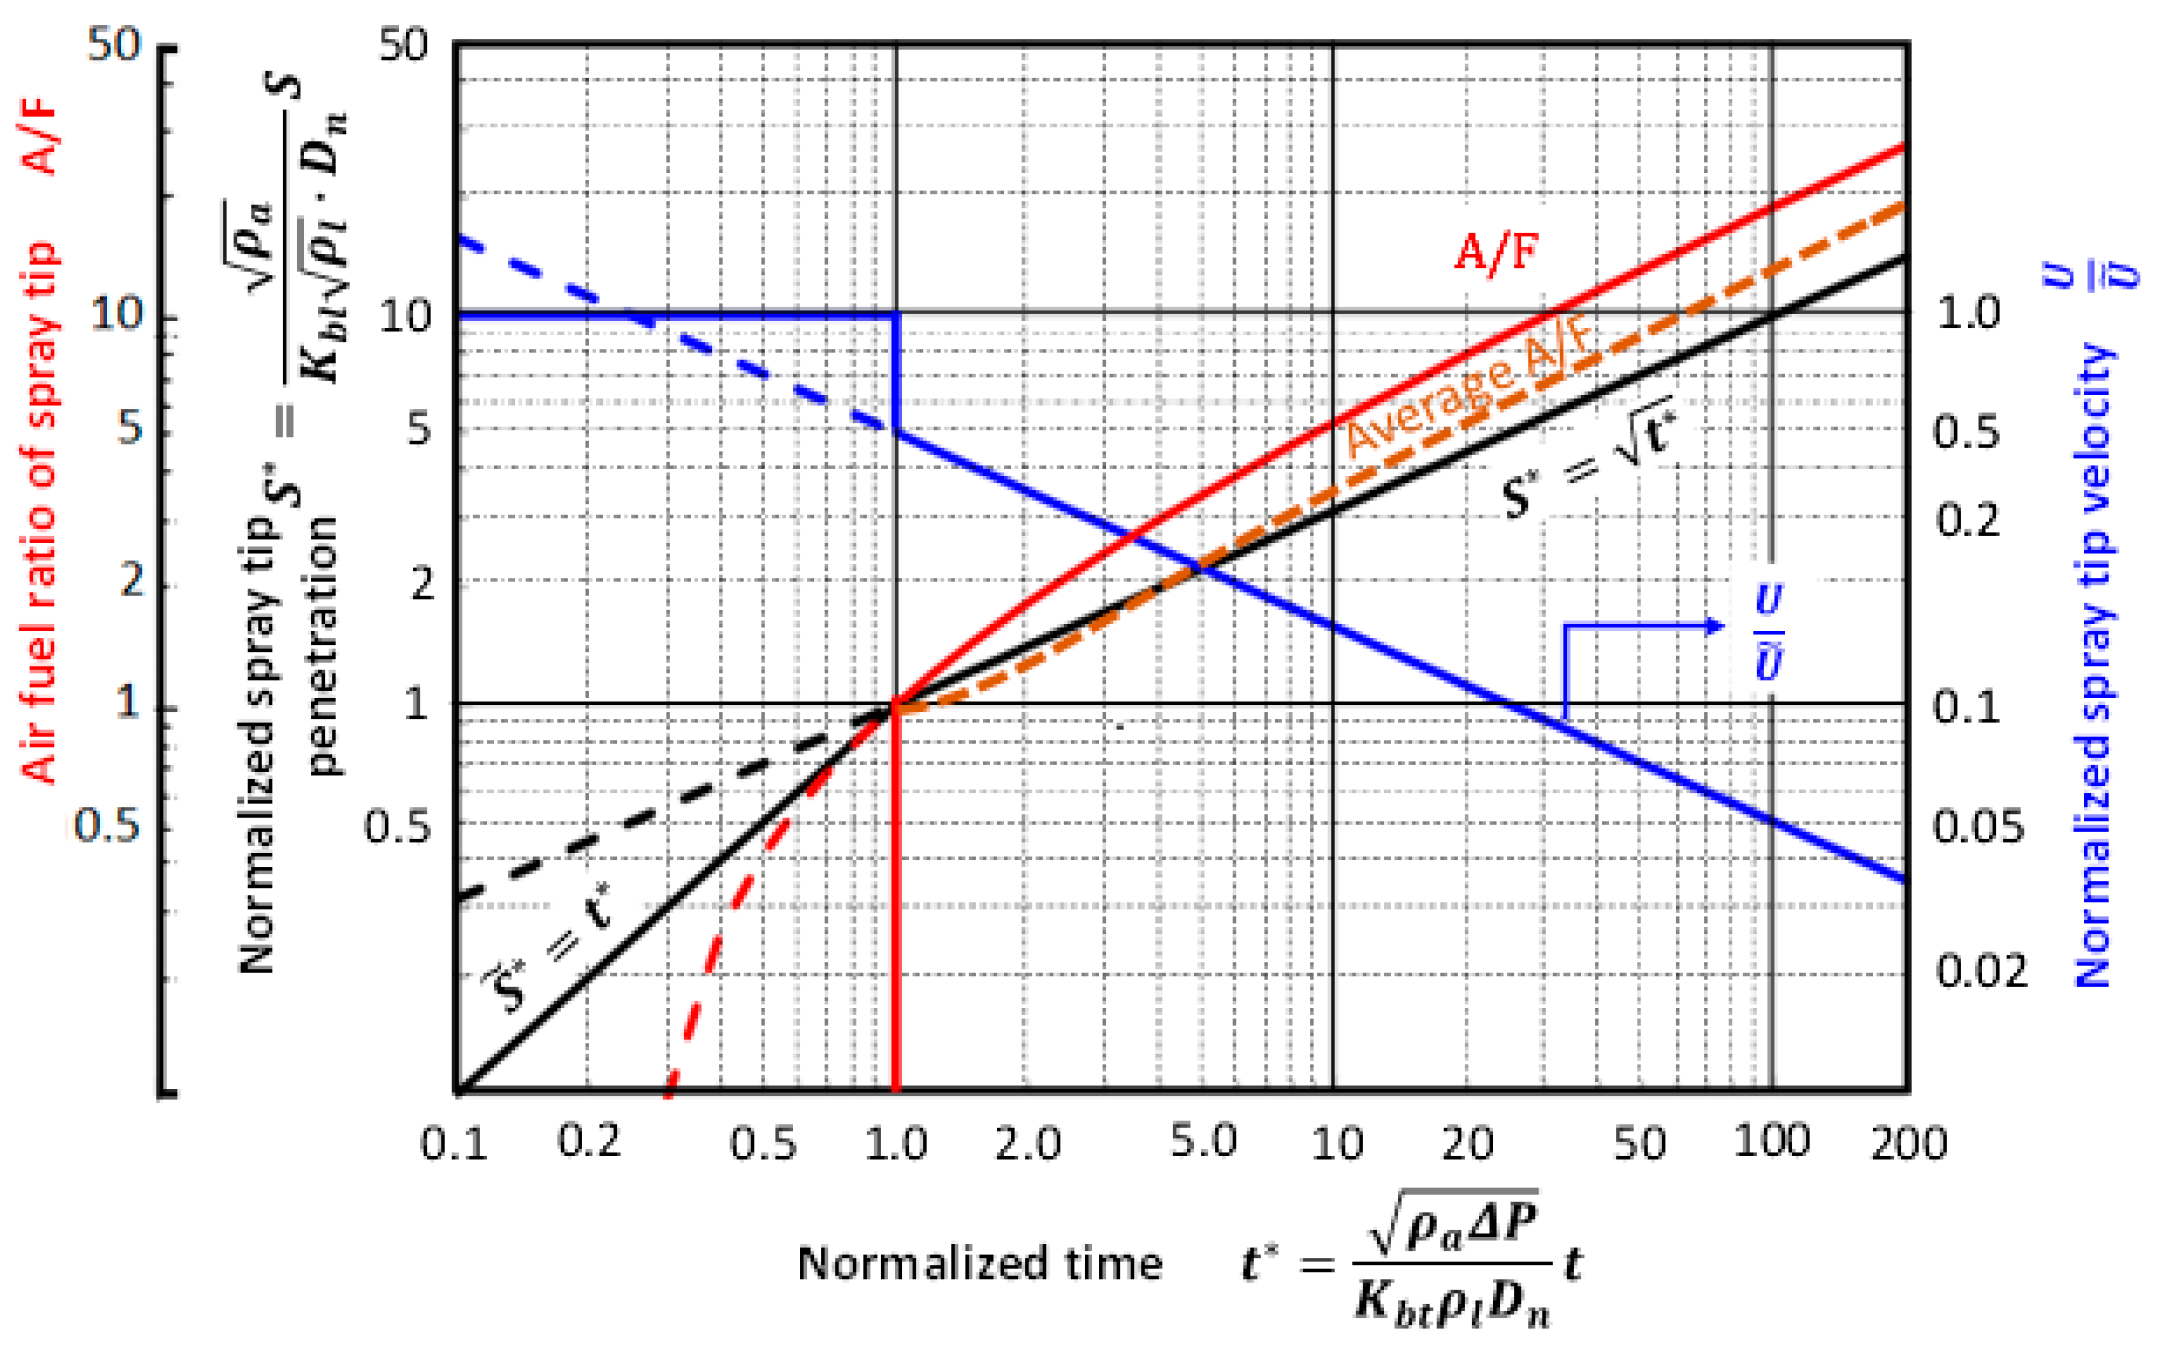
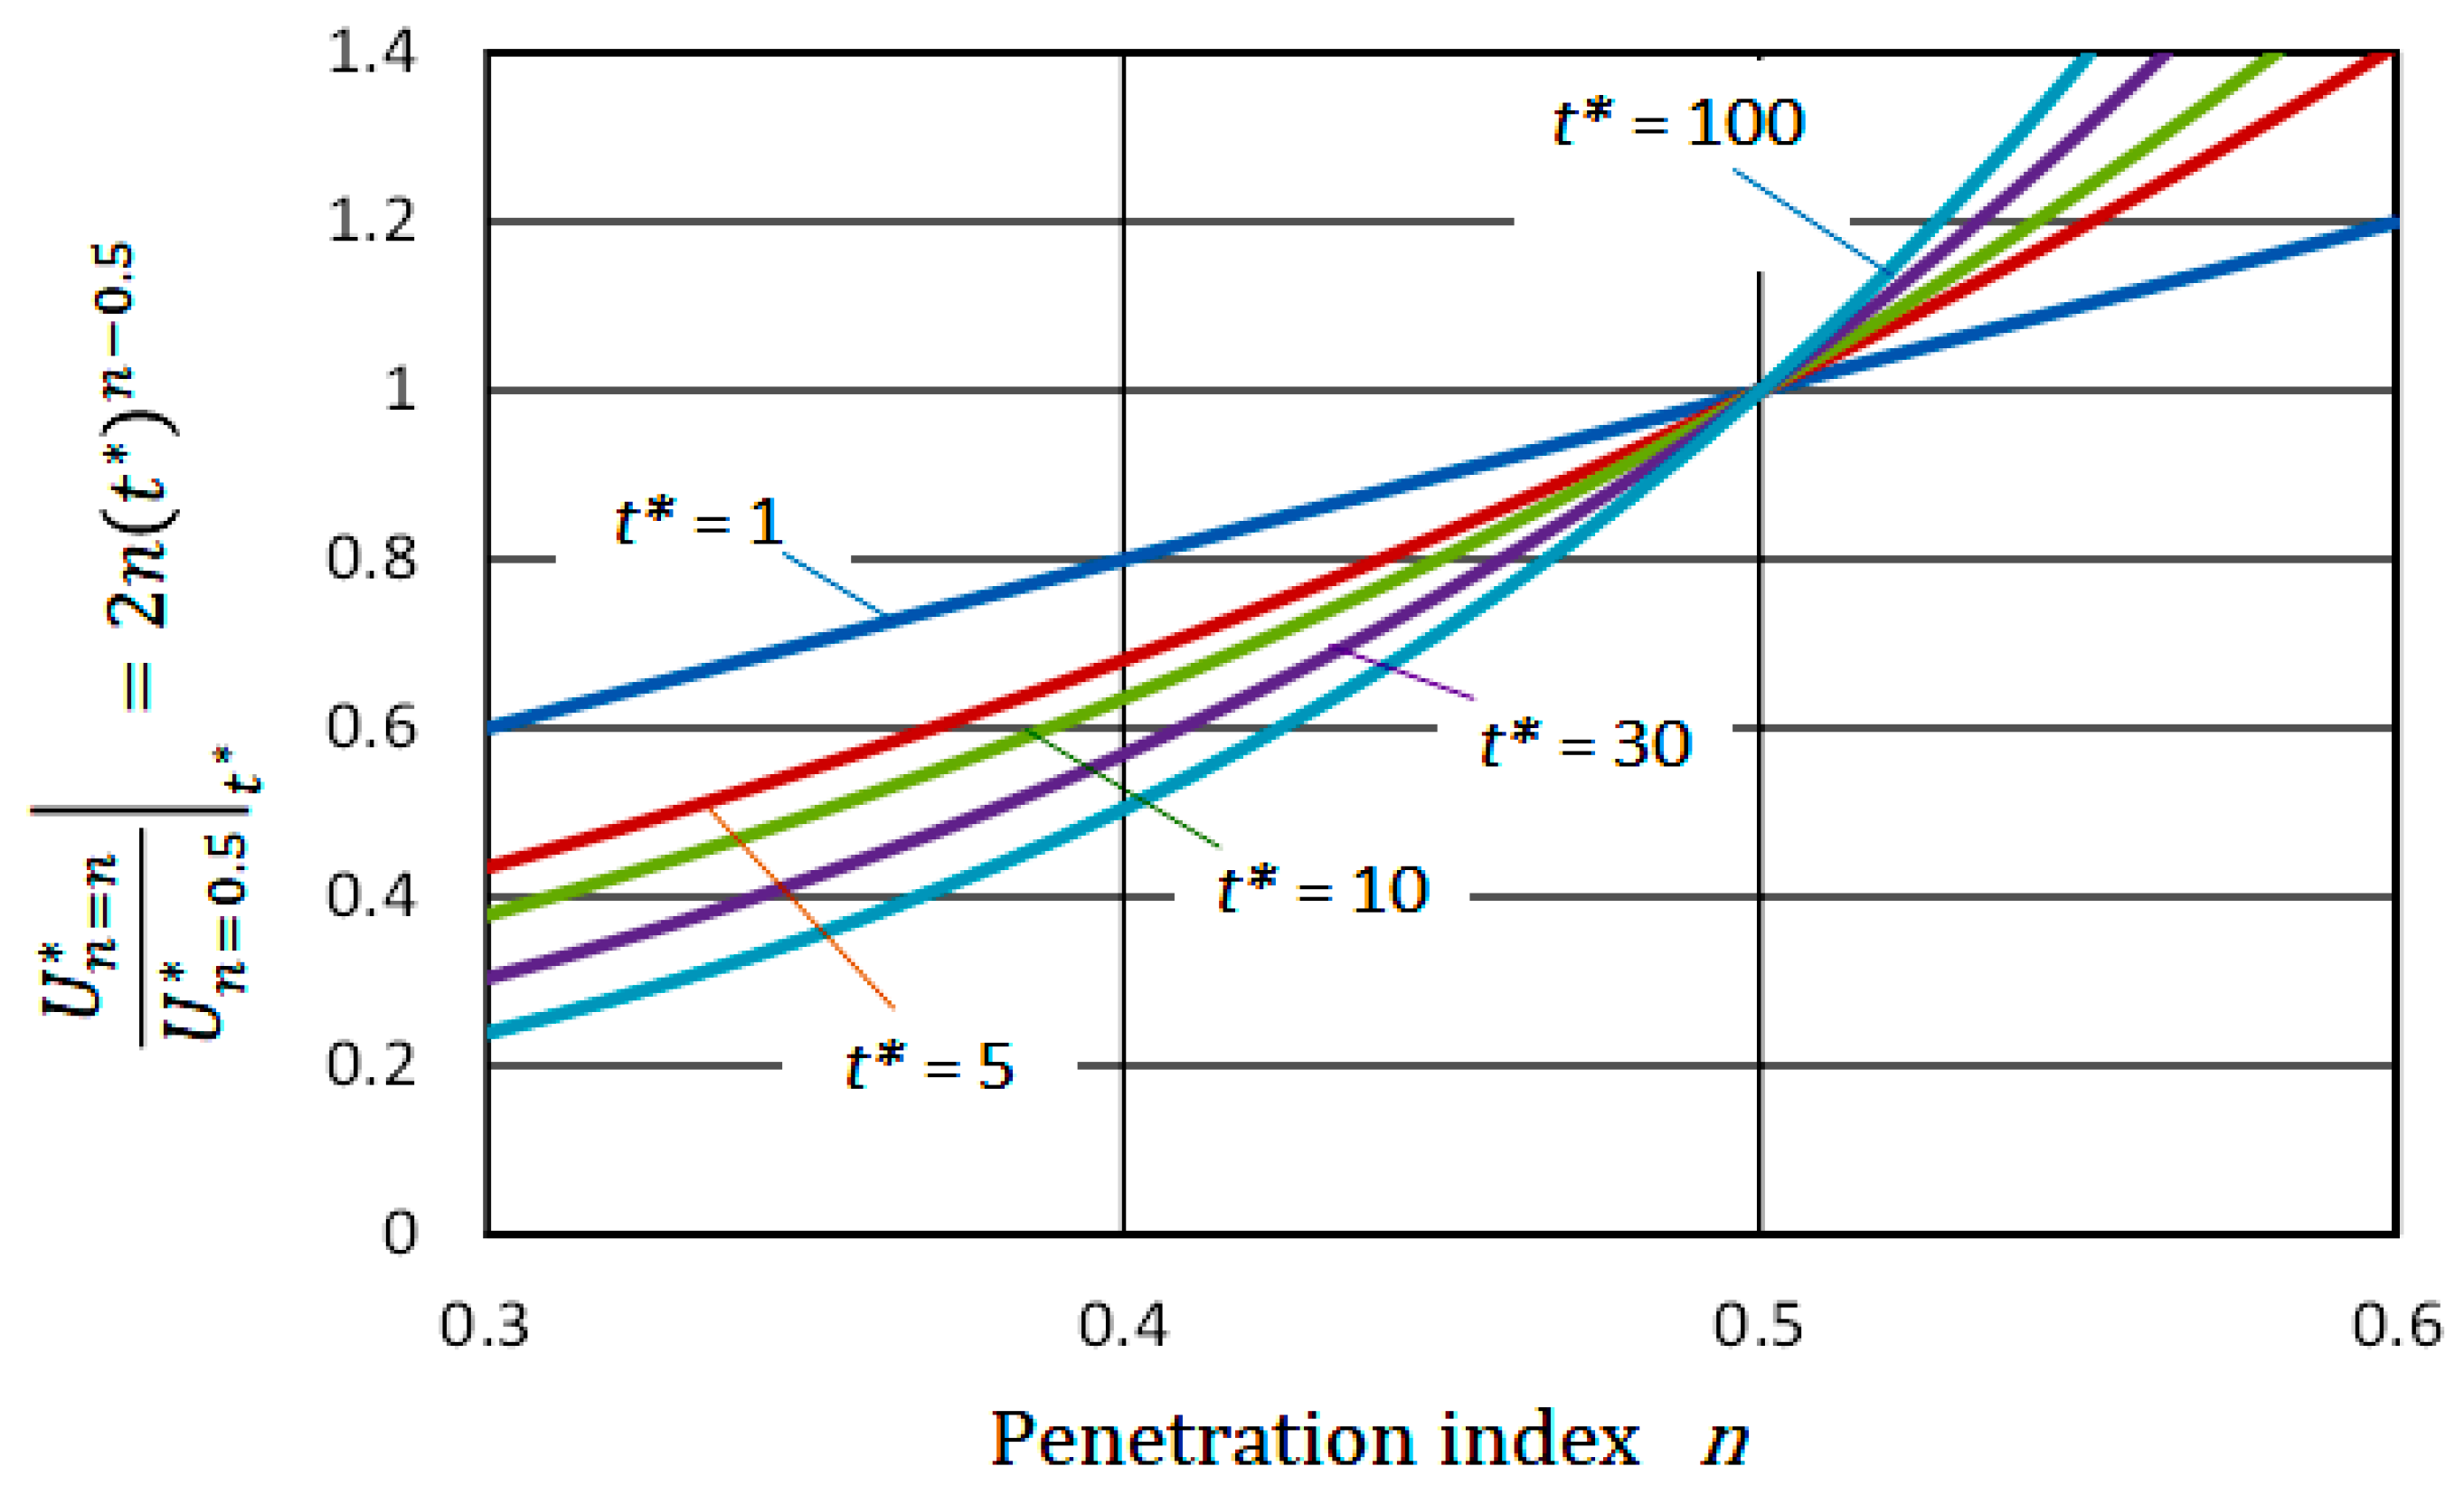
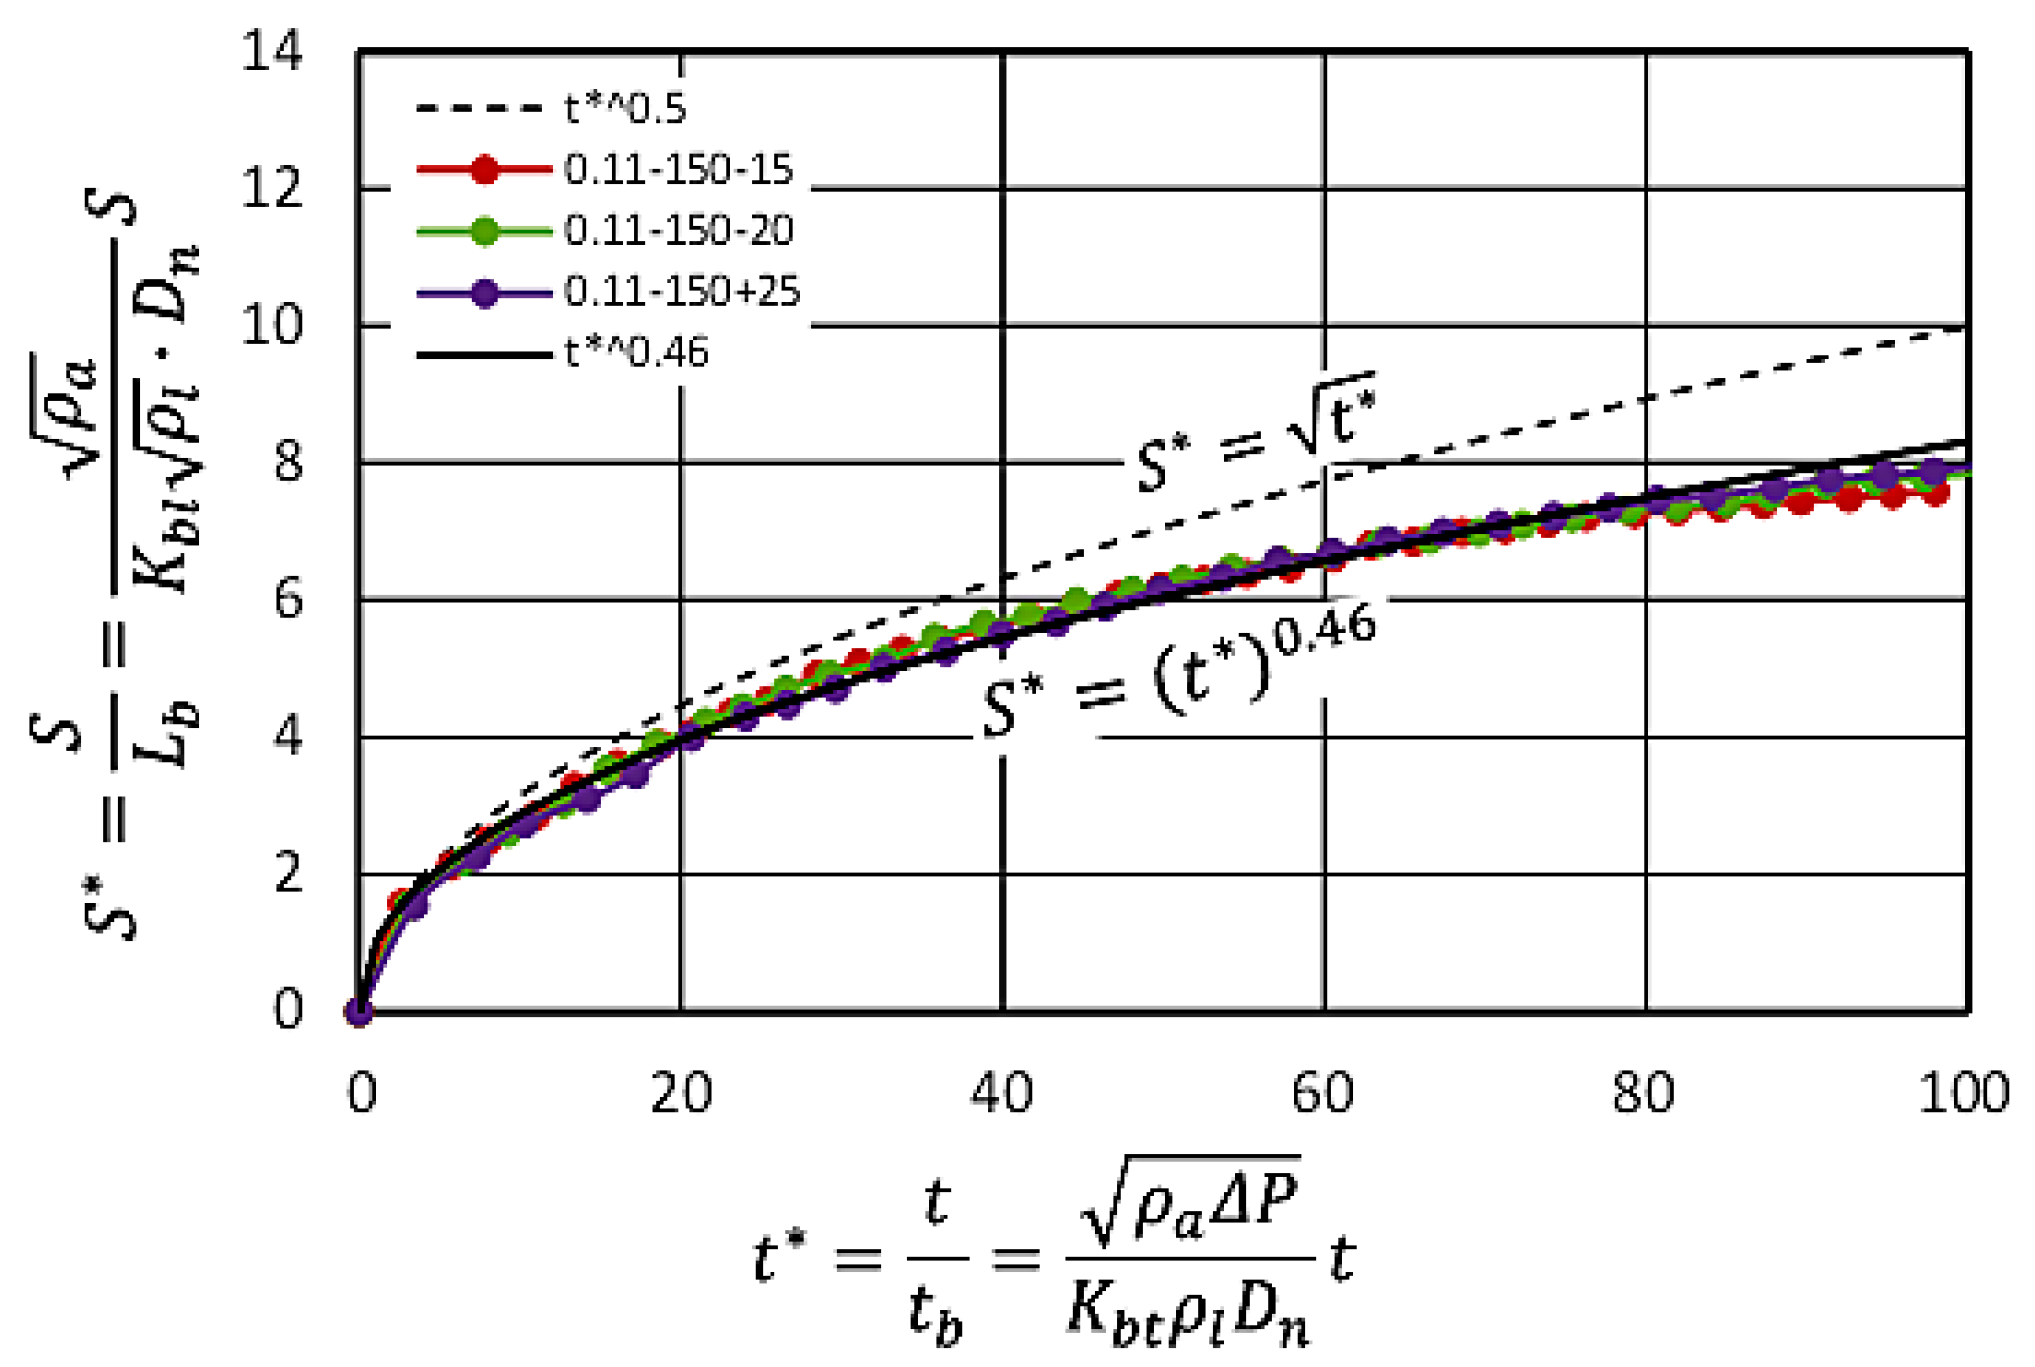
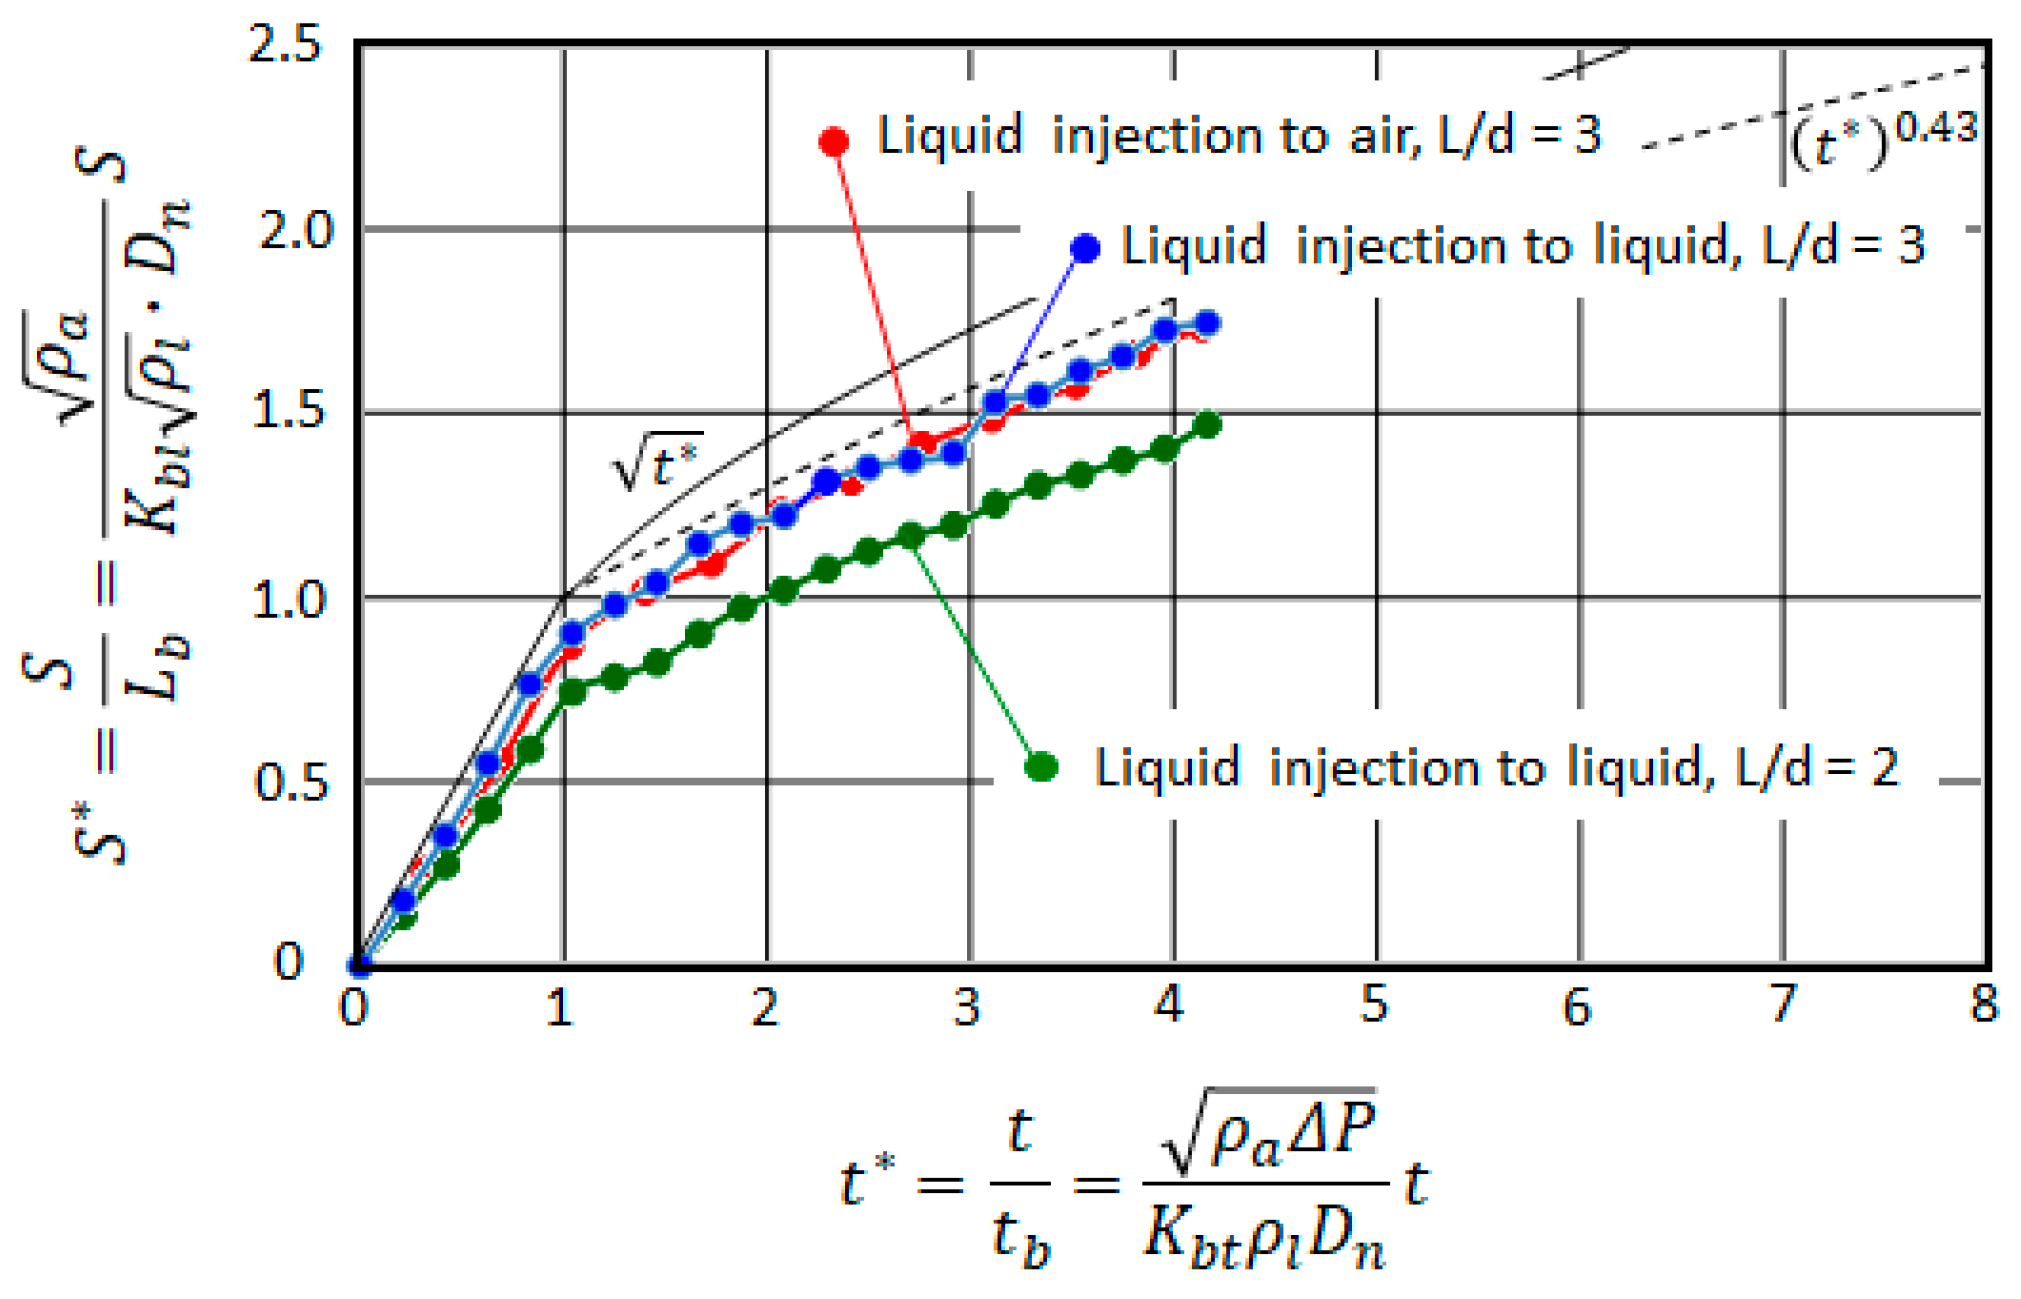
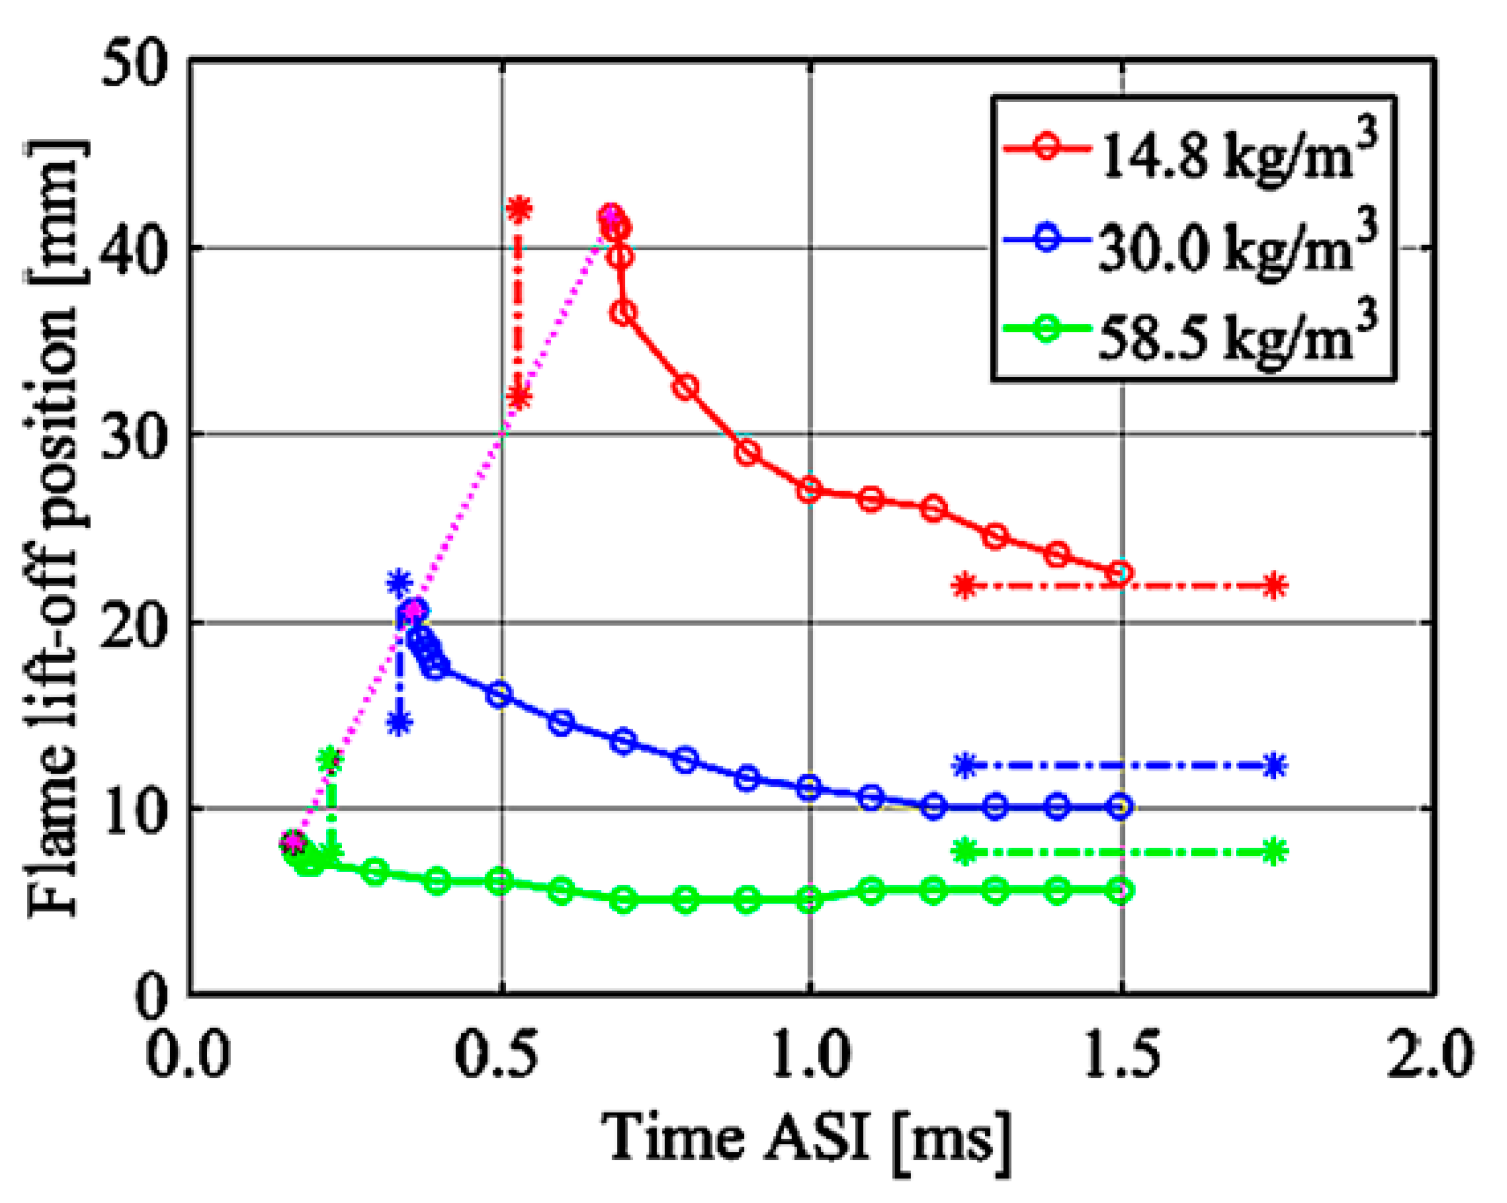
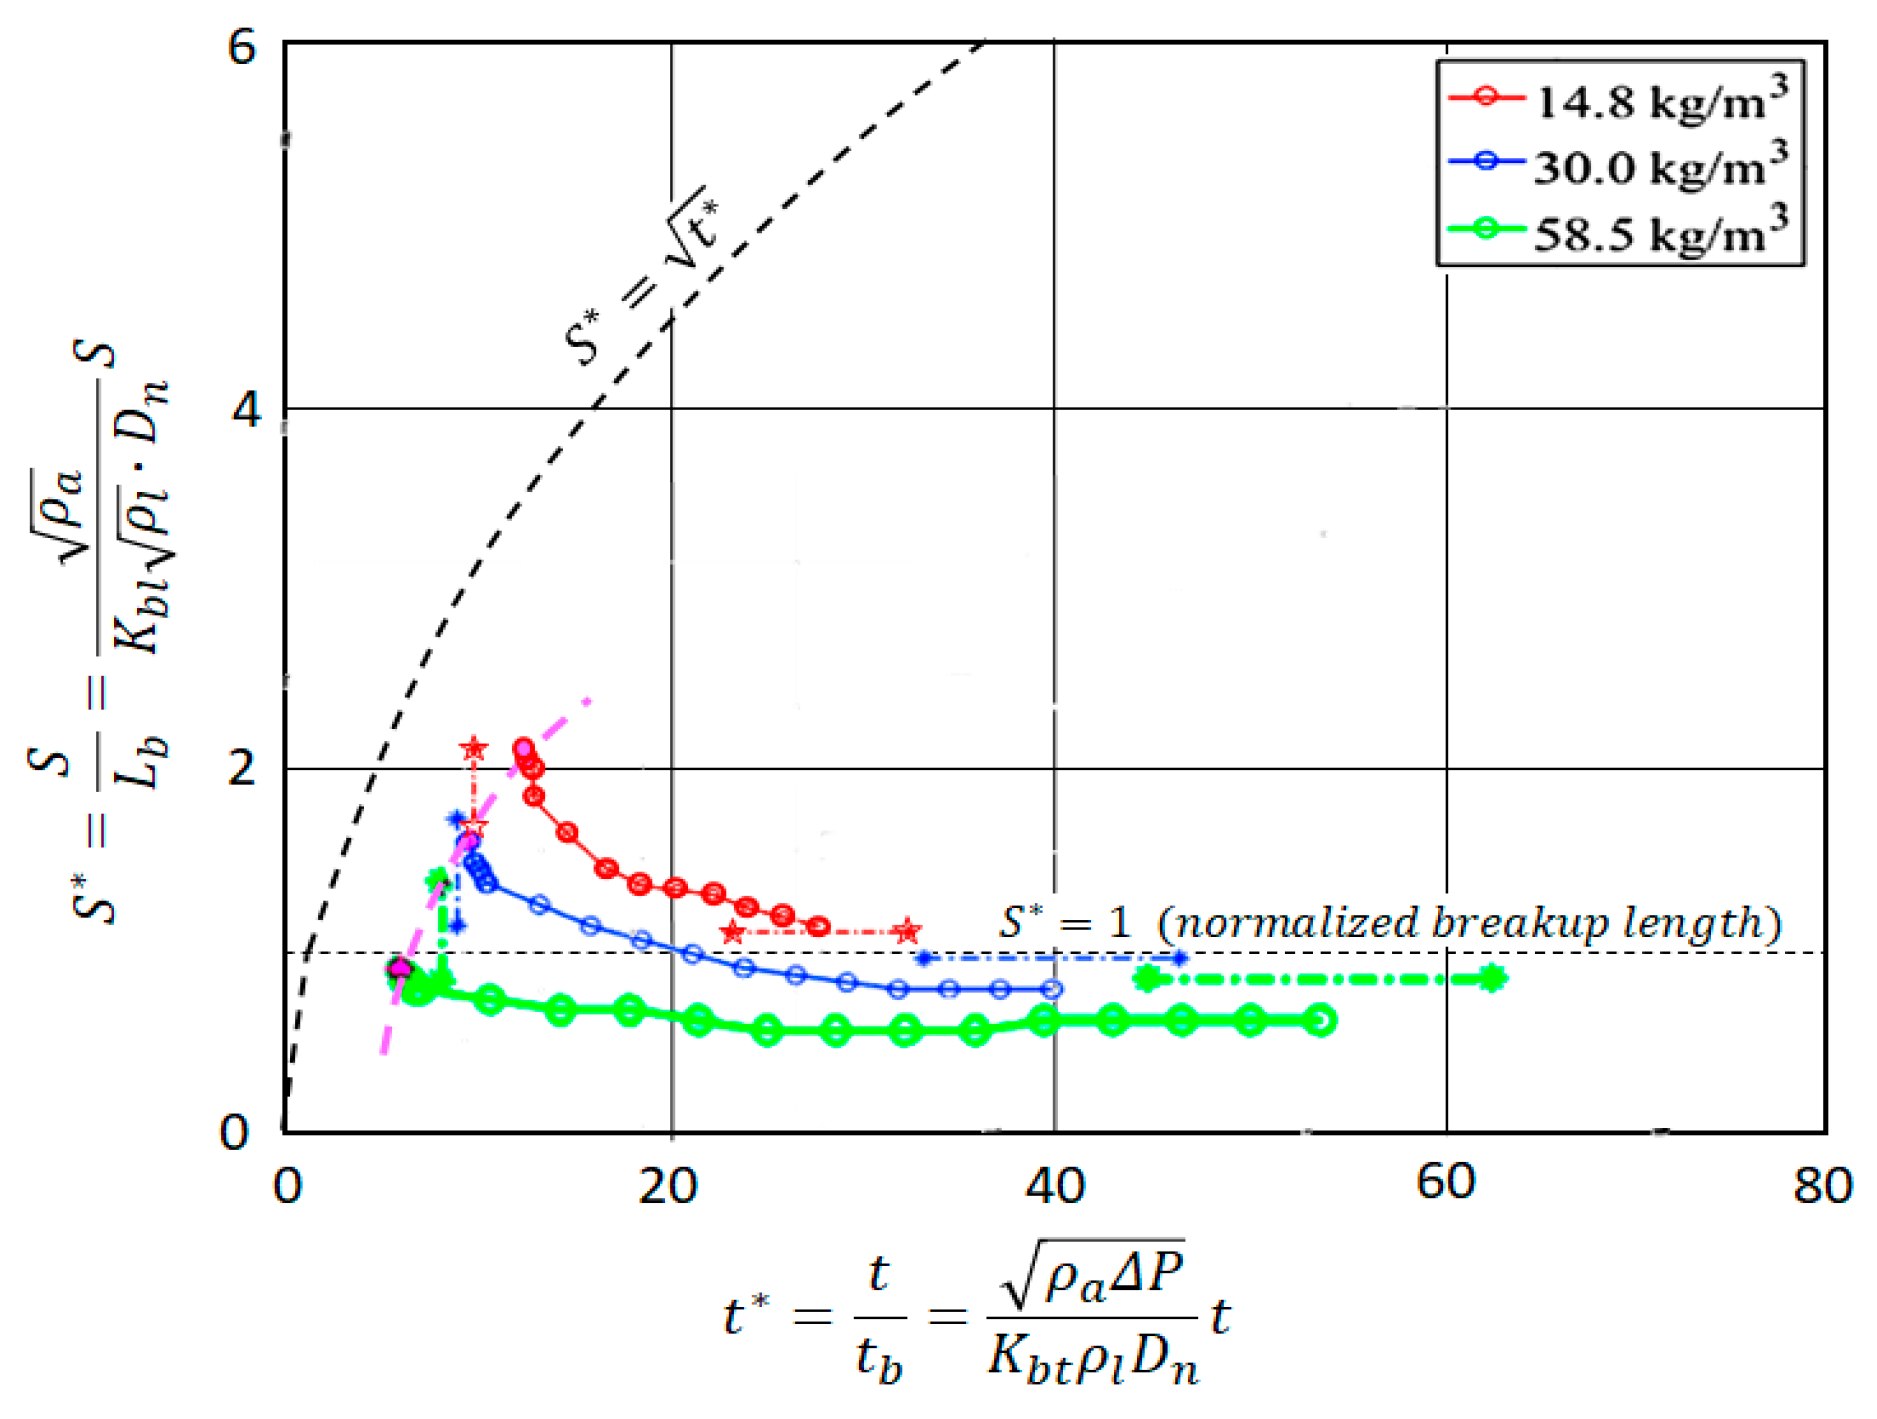
| Original Equation | Modified Equation | ||
|---|---|---|---|
| 0.39 | 0.60 | 0.80 | |
| 15.8 | 13.3 | 10.0 | |
| 28.7 | 15.7 | 8.84 | |
| 2.95 | 3.36 | 3.36 | |
Table 2.
Basic data for breakup scale estimation.
| Nozzle Diameter Dn | Injection Pressure Pin | Fuel Density | Ambient Gas Density | Ambient Pressure Pa | Kv | Kbt | Kbl | Kp |
|---|---|---|---|---|---|---|---|---|
| 0.170 mm | 150 MPa | 820 kg/m3 | 1.20 kg/m3 (at 0.1 MPa) | 0.1 MPa~5.0 MPa | 0.60 | 15.7 | 13.3 | 3.36 |
Table 3.
Length and time of breakups for tested spray jets.
| Pa (MPa) | 0.1 | 0.5 | 1 | 2 | 3 | 4 | 5 |
| tb (msec) | 0.163 | 0.0731 | 0.0518 | 0.0367 | 0.0301 | 0.0261 | 0.0236 |
| Lb (mm) | 59.1 | 26.4 | 18.7 | 13.2 | 10.8 | 9.35 | 8.36 |
Table 4.
Breakup time and breakup length of validation sprays.
| Pinj-Pa (bar) | 300-1 | 300-3 | 300-5 | 300-7 | 300-10 | 300-16 | 300-25 |
| tb (msec) | 0.408 | 0.237 | 0.184 | 0.156 | 0.131 | 0.105 | 0.0852 |
| Lb (mm) | 66.1 | 38.1 | 29.5 | 25.4 | 20.9 | 16.5 | 13.2 |
| Pinj-Pa (bar) | 700-1 | 700-3 | 700-5 | 700-7 | 700-10 | 700-16 | 700-25 |
| tb (msec) | 0.267 | 0.154 | 0.120 | 0.104 | 0.0850 | 0.0675 | 0.0544 |
| Lb (mm) | 66.1 | 38.1 | 29.5 | 25.4 | 20.9 | 16.5 | 13.2 |
| Pinj-Pa (bar) | 1000-1 | 1000-3 | 1000-5 | 1000-7 | 1000-10 | 1000-16 | 1000-25 |
| tb (msec) | 0.223 | 0.129 | 0.100 | 0.0847 | 0.0710 | 0.0563 | 0.0452 |
| Lb (mm) | 66.1 | 38.1 | 29.5 | 25.4 | 20.9 | 16.5 | 13.2 |
| Pinj-Pa (bar) | 1350-1 | 1350-3 | 1350-5 | 1350-7 | 1350-10 | 1350-16 | 1350-25 |
| tb (msec) | 0.192 | 0.111 | 0.0861 | 0.0728 | 0.061 | 0.0483 | 0.0388 |
| Lb (mm) | 66.1 | 38.1 | 29.5 | 25.4 | 20.9 | 16.5 | 13.2 |
Table 5.
Breakup time and breakup length of pseudo sprays.
| Into Air (Engine Condition) | Into Water (Fuel-into-Water Injection) | Into Water (Fuel-into-Water Injection) | Comments | |
|---|---|---|---|---|
| Nozzle Hole Dia. (mm) | 0.22 | 1.8 | ||
| Length to hole ratio of nozzle, L/d | 3 | 2 | 3 | |
| Breakup time (ms) (Original design) | 1 | 8 | Given as time scale | |
| Density of Surroundings (kg/m3) | 15.6 | 998 | Compressed air and ambient water | |
| Effective Injection Pressure (MPa) | 19.6 | 0.3 | Similarity law of same breakup length | |
| Breakup time (ms) (Calculated) | 0.29 | 2.4 | 2.4 | Calculated by old equation (Kv = Cv = 0.39) |
| Breakup length (mm) (Calculated) | 25.1 | 25.5 | 25.5 | Calculated by old equation (Kv = Cv = 0.39) |
| Breakup time (ms) (Calculated) | 0.16 | 1.32 | 1.32 | Calculated with Kv = 0.60 |
| Breakup length (mm) (Calculated) | 21.1 | 21.5 | 21.5 | Calculated with Kv = 0.60 |
| Breakup time (ms) (Measured) | 0.3 | 2.5 | 2.5 | Estimated from penetration |
| Breakup length (mm) (Measured) | 21.8 | 19.0 | 23.0 | Estimated from penetration |
Table 6.
Tested injectors [37].
Table 6.
Tested injectors [37].
 |  |  | |
| Orifice dia. | ϕ 0.15 mm | ϕ 0.1 mm | ϕ 0.06 mm |
| No. of orifice | 1 | 2 | 6 |
| Total orifice area | 0.0177 mm2 | 0.0157 mm2 | 0.017 mm2 |
| Δθ | – | 90° | 22° |
Table 7.
Operating conditions and injection specifications in the test cases [38].
Table 7.
Operating conditions and injection specifications in the test cases [38].
| Case | Ambient O₂ Level [%] | Ambient Temperature [K] | Ambient Density (kg/m3) | Nozzle Diameter (µm) | Injection Pressure (bar) | Fuel Mass Flow Rate (mg/ms) |
|---|---|---|---|---|---|---|
| 1 | 0 | 1000 | 14.8 | 100 | 1400 | 2.7 |
| 2 | 0 | 1000 | 13.9 | 257 | 1400 | 14.0 |
| 3 | 21 | 1000 | 14.8 | 100 | 1400 | 2.7 |
| 4 | 21 | 1000 | 14.8 | 180 | 1400 | 8.8 |
| 5 | 21 | 1000 | 14.8 | 363 | 1400 | 35.8 |
Table 8.
Spray characteristics based on breakup scaling.
| Case 3 | Case 4 | Case 5 | |
|---|---|---|---|
| Dn (mm) | 0.100 | 0.180 | 0.363 |
| tb (ms) | 0.0287 | 0.0517 | 0.104 |
| Lb (mm) | 9.90 | 17.8 | 35.9 |
| ting/tb | 24.7 | 13.3 | 6.83 |
| Set-off length (LOL)/Lb | 1.63 | 1.07 | 0.836 |
| (ting + 0.5)/tb | 42.2 | 23.4 | 11.6 |
Table 9.
Engine and fuel injector specifications [40].
Table 9.
Engine and fuel injector specifications [40].
| Engine Specifications | |||
| Bore: | 82.0 [mm] | ||
| Stroke: | 90.4 [mm] | ||
| Displacement Volume: | 477 [cm3] | ||
| Geometric CR: | 16.7 | ||
| Squish Height: | 0.78 [mm] | ||
| Swirl Ratio: | 2.2 | ||
| Engine Speed: | 1500 RPM | ||
| Valve Events (0.15 mm lift) | |||
| IVO: | −359 °CA | EVO: | 132 °CA |
| IVC: | −152 °CA | EVC: | 360 °CA |
| Fuel Injector | |||
| Number of Holes: | 7 | ||
| Included Angle: | 149° | ||
| Sac Volume: | 0.12 [mm3] | ||
| Nozzle Hole Diameter: | 0.14 [mm] | ||
| Rail Pressure: | 860 bar | ||
| Bosch Flow Number: | 440 [cc/30 sec] | ||
| Fuel: | #2 Diesel | ||
Table 10.
Boost pressure effect of breakup time and length.
| Pinj-Pa (MPa) | Pb = 0.1 MPa 86-4 | Pb = 0.15 MPa 86-6 | Pb = 0.2 MPa 86-8 |
| tb (msec) | 0.0720 | 0.0605 | 0.0495 |
| Lb (mm) | 19.3 | 16.0 | 12.9 |
Publisher’s Note: MDPI stays neutral with regard to jurisdictional claims in published maps and institutional affiliations. |
© 2022 by the author. Licensee MDPI, Basel, Switzerland. This article is an open access article distributed under the terms and conditions of the Creative Commons Attribution (CC BY) license (https://creativecommons.org/licenses/by/4.0/).
Share and Cite
MDPI and ACS Style
Arai, M. Interpretative Review of Diesel Spray Penetration Normalized by Length and Time of Breakup (Similarity Law of Diesel Spray and Its Application). Energies 2022, 15, 4926. https://0-doi-org.brum.beds.ac.uk/10.3390/en15134926
AMA Style
Arai M. Interpretative Review of Diesel Spray Penetration Normalized by Length and Time of Breakup (Similarity Law of Diesel Spray and Its Application). Energies. 2022; 15(13):4926. https://0-doi-org.brum.beds.ac.uk/10.3390/en15134926
Chicago/Turabian StyleArai, Masataka. 2022. "Interpretative Review of Diesel Spray Penetration Normalized by Length and Time of Breakup (Similarity Law of Diesel Spray and Its Application)" Energies 15, no. 13: 4926. https://0-doi-org.brum.beds.ac.uk/10.3390/en15134926
Note that from the first issue of 2016, this journal uses article numbers instead of page numbers. See further details here.