Article

Impact of Active Diesel Particulate Filter Regeneration on Carbon Dioxide, Nitrogen Oxides and Particle Number Emissions from Euro 5 and 6 Vehicles under Laboratory Testing and Real-World Driving

by
Athanasios Dimaratos
1,
Barouch Giechaskiel
2,
Michaël Clairotte
2 and
Georgios Fontaras
2,*
1
Laboratory of Applied Thermodynamics, Department of Mechanical Engineering, Aristotle University of Thessaloniki, 54124 Thessaloniki, Greece
2
European Commission Joint Research Centre, 21027 Ispra, Italy
*
Author to whom correspondence should be addressed.
Submission received: 7 April 2022 / Revised: 7 July 2022 / Accepted: 8 July 2022 / Published: 12 July 2022

Abstract

:
Particulate mass concentration is a crucial parameter for characterising air quality. The diesel particulate filter (DPF) is the primary technology used to limit vehicle particle emissions, but it needs periodic cleaning, a process called regeneration. This study aims to assess the impact of active DPF regeneration on the performance and emissions of Euro 5 and 6 vehicles. The study examined both carbon dioxide (CO2) and pollutant (nitrogen oxides (NOx) and particle number (PN)) emissions for eight vehicles tested in the laboratory and on the road. Apart from the DPF, a wide range of emission control systems was covered in this experimental campaign, including exhaust gas recirculation (EGR), diesel oxidation catalyst (DOC), lean NOx trap (LNT) and selective catalytic reduction (SCR) catalyst, revealing the different impacts on NOx emissions. The regeneration frequency and duration were also determined and used to calculate the Ki factor, which accounts for the emissions with and without regeneration, weighted over the distance driven between two consecutive regeneration events. Based on these outcomes, representative emission factors (EF) were proposed for the regeneration phase only and the complete regeneration interval. In addition, the effect of regeneration on efficiency was estimated and compared with other energy consumers. The results indicated a significant impact of DPF regeneration on CO2, NOx and PN emissions, higher in the case of driving cycle testing in the laboratory. The relevant mechanisms behind the elevated emission levels were analysed, focusing on the regeneration period and the test phase following immediately after. The calculation of the Ki factor and the comparison with the official values revealed some weaknesses in its application in real-world conditions; to overcome these, new NOx EF values were calculated, depending on the emission control system. It was revealed that Euro 6 vehicles equipped with SCR could comply with the applicable limits when considering the complete regeneration interval. Finally, it was indicated that the DPF regeneration impact on vehicle efficiency is similar to that of driving with the air conditioning (A/C) system and headlights on.

1. Introduction

a a a aAir pollution has adverse impacts on human health [1]. Road transport contributes significantly to air quality (characterised by the concentrations of nitrogen dioxide (NO2) and particulate matter (PM)), particularly in urban areas [2], where three-quarters of European citizens live [3]. Various emission control technologies have been developed and deployed to limit road transport’s impact on air quality.
Diesel particulate filters (DPF) have been in commercial serial production for more than 20 years and have been introduced massively in the light-duty vehicles (LDV) market with the Euro 5 emission standard. However, the fundamental understanding of soot filtration and regeneration mechanisms is still progressing [4]. In general, DPFs are characterised by high filtration efficiency, capable of reducing engine-out particle emissions by up to 99%, depending, among other parameters, on the formed soot cake inside the filter [5,6].
The operating principle of DPFs is based on trapping a certain quantity of the engine-out particles, requiring a (periodic) cleaning process, known as DPF regeneration, to empty the filter from the trapped particle mass, which mainly consists of soot. This is an essential process to avoid negative consequences on the vehicle since a failure in filter regeneration may impact the vehicle’s driveability (i.e., filter clogging) [7]. The soot captured in the filter is oxidised during the regeneration by increasing the exhaust gas temperature. The regeneration process can be either periodic or continuous. In the former case, the DPF is cleaned at regular intervals according to the trapped soot mass, which is determined by combining the pressure drop across the filter and other parameters in a model embedded in the ECU. In the latter case, where the DPF is characterised as a “continuously regenerating system”, the filter operates at a balance temperature at which the soot mass captured in the filter is equal to the soot mass oxidised, thus keeping constant the soot loading and the pressure drop. If the exhaust gas temperature increases further, then the filter undergoes a (full) regeneration where the soot oxidation rate is higher than the trapping rate.
Two forms of DPF regeneration exist, namely active and passive regeneration. In the case of an active regeneration, soot oxidation is achieved with the oxygen contained in the exhaust gas. The exhaust gas temperature at the inlet of the DPF is increased above 600 °C to trigger an active regeneration. This is achieved by appropriate thermal management, either of the engine (by EGR optimisation, exhaust throttling and fuel post-injection) or the aftertreatment system (by using an electrical heater, fuel burners or heat-up catalysts). In the case of passive regeneration, soot oxidation is mainly achieved by the nitrogen dioxide (NO2) contained in the exhaust gas. Such a process can occur at lower temperatures than active regeneration but requires increased NO2 concentration in the exhaust gas. The required regeneration temperature can generally be decreased by using a fuel-bound catalyst [7]. Other, even more active, oxidants have been investigated, such as ozone [8] (requiring, however, an onboard ozone generator), while alternative strategies have also been examined, such as the addition of H2/CO mixtures, to enhance DPF regeneration [9].
The active regeneration of the DPF has direct impacts on both fuel consumption/CO2 emissions and pollutant emissions. Starting with the performance characteristics, DPF is associated with fuel penalty (also translated to CO2 emissions penalty) originating in the increased back pressure (caused by the filter itself) and the regeneration process. The latter is most usually controlled by activating fuel (late) post-injection. The term ‘late’ in an injection strategy with three post-injections corresponds to the last. The second post-injection may also be activated during DPF regeneration in order to increase engine-out exhaust gas temperature (the fuel injected in the 2nd post-injection is oxidised within the cylinder. The first post-injection (the one coming directly after the main injection) is used for soot oxidation, while it also contributes to power production.), i.e., supplying extra fuel (into the cylinder) during the exhaust stroke (or even directly in the exhaust manifold), which does not produce useful work. Instead, it is oxidised in the diesel oxidation catalyst (DOC), upstream of the DPF, increasing the gas temperature and facilitating soot oxidation in the DPF. Limited data have been published concerning the impact of active DPF regeneration on fuel consumption and CO2 emissions since the main focus is on pollutant emissions, usually particle number. Previous results on Euro 6 vehicles indicate an increase in CO2 emissions by 4–14% on chassis dynamometer cycles (WLTC, CADC), while the respective effect in on-road tests was much lower [10,11]. Aged DPFs with a mileage of above 170,000 km are associated with higher fuel consumption due to the high ash content and, thus, higher exhaust back pressure, although the ash accumulation improves filtration efficiency [12,13,14].
On the pollutant side, DPF regeneration has significant effects on NOx emissions. During on-road testing with a Euro 6 vehicle equipped with LNT, 30% higher NOx emissions have been observed, attributed to the closed EGR valve (increasing the engine-out levels), the reduced efficiency of the LNT due to the very high temperatures and the absence of LNT regeneration, which requires a rich operation that would eliminate oxygen in the exhaust gas [15]. NOx emissions were doubled during regeneration on a Euro 4 vehicle equipped with DPF [16]. When the DPF has SCR coating, then the consumption of NO2 in the SCR reactions has a negative effect on passive DPF regeneration [17]. However, an aftertreatment configuration with a separate SCR system has the potential for high NOx conversion, even during the DPF regeneration period, ensuring compliance with the applicable limits [11], although the increased regeneration temperatures may impact the SCR efficiency (depending on its exact formulation) negatively [18].
Concerning particle emissions, several studies have reported significant increases in mass (PM) emissions and up to three orders of magnitude higher particle number (PN) emissions during DPF regeneration events [10,11,16,19,20,21]. A recent detailed study, including long-term monitoring of a diesel vehicle, running laboratory and on-road measurements, revealed that current DPFs could retain PN emissions below the applicable Not-To-Exceed (NTE) limits during regenerations in real-world driving [11]. The NTE limits are calculated by multiplying the Euro 6 emission limit (applicable on laboratory testing, i.e., WLTC) with the Conformity Factor (CF), which accounts for the other inaccuracies of on-road measurement with a Portable Emissions Measurement System (PEMS) compared to laboratory measurement. The CF for PN emissions is 1.5, as defined in Regulation (EU) 2017/1151. In most studies PN emissions refer to solid particles with a minimum size of 23 nm (SPN23), which is also the current cut-off size of the legislation, while the information concerning solid sub-23 nm particles during DPF regeneration are limited [11,21,22,23]. In addition, the required portable equipment for measuring sub-23 nm particles (both solid and total) on the road is still under development and optimisation [24,25,26]. A recent study employing such a novel exhaust gas sampling and dilution system revealed that the number of solid particles with a minimum size of 2.5 nm (SPN2.5) emitted during a DPF regeneration under steady-state conditions was 2.3 times higher than SPN23 [27]. Some data and information are also available on the total particle number (TPN) emissions (comprising non-volatile, semi-volatile and volatile components) during DPF regeneration [16,21,22,27,28]. In general, TPN increases orders of magnitude during a regeneration, raising concerns about whether these particles should be left unmonitored. However, based on the currently available data and information, there is not a consistent conclusion on the levels of TPN during DPF regeneration, with various impacts coming from the sampling and dilution system (introducing artefacts), the accuracy of the measuring equipment at the lower cut-off sizes and the behaviour of the vehicle itself (deviating findings for different vehicles) [29].
Apart from NOx and particle emissions, increased levels of CO and HC emissions, as well as of currently non-regulated species (such as CH2O, NH3 and SO2), have also been observed during DPF regeneration, both in older and modern vehicles [10,19,30].
The significance of these emission impacts of DPF regeneration depends on the frequency they appear. High peaks that appear scarcely may be less critical than lower emission levels occurring more often. Therefore, further to the emission impact on an individual test, the regeneration frequency (or interval), expressed as the distance between consecutive regenerations, is an equally important factor when considering the lifetime environmental effects of DPF equipped vehicles. In general, an active regeneration may occur every 300–800 km [31], with the interval depending on the engine-out particle emissions, the specifications of the filter, the driving conditions and the control strategy [32]. However, a recent study has shown a high scatter in the regeneration frequency, highlighting a decreasing trend in the interval between two consecutive events for more modern vehicles [11].
Concerning the active DPF regeneration duration, this depends on the driving conditions and only limited data are available, primarily for older vehicles. For example, if the regeneration occurs during driving on the highway, where exhaust gas flow and temperature are already high, the duration of DPF regeneration may be shorter. In contrast, under urban driving conditions (e.g., low velocity, stop and go) the DPF regeneration may last longer. However, the exact behaviour depends on the DPF fill state [22] and on the vehicle specifications and control strategy. The regeneration duration is typically in the range of 5–15 min, without excluding longer durations in particular cases [31]. During a vehicle monitoring campaign for 13,700 km, including lab and real-world testing, it has been found that the regeneration duration is longer, the higher the soot load and shorter, the higher the average engine power [32]. The above hold for complete active DPF regenerations. If a regeneration remains incomplete, both the interval and the duration may be significantly shorter [11,21].
All the above findings concern conventional diesel vehicles, while similar data and analyses have not been reported for diesel-hybrid powertrains in light-duty vehicle applications. In such a powertrain, the intermittent operation of the internal combustion engine poses some challenges to the precise control of the DPF regeneration and will need more research. Nevertheless, their share is expected to be small compared to their gasoline counterparts.
According to the current legislation (Regulation (EU) 2017/1151), DPF regeneration is partly considered without an explicit limit for the emissions associated particularly with regeneration. The test is not considered valid in the laboratory if regeneration occurs during the WLTC. However, the overall impact of DPF regeneration on WLTC CO2 and pollutant emissions are considered with the Ki factor (multiplicative) or Ki offset (additive), which accounts for the emissions with and without regeneration, weighted over the distance driven between two consecutive regeneration events. For particle emissions, Ki is applicable for PM only since the impact of regeneration on PN levels was considered negligible back in 2011 when the relevant limits were introduced, referring to a particle cut-off size of 23 nm and the NEDC as type approval cycle [33]. As already described above, PN emissions elevate during and immediately after the regeneration event, the latter occurring due to the low filtration efficiency of the DPF before forming a minimum soot cake [16]. In on-road RDE tests, a test with DPF regeneration can be rejected and repeated after ensuring that the regeneration has been fully completed in the preceding cycle. If a DPF regeneration occurs in the second repetition, the test is accepted, and the respective emission levels are considered for the analysis (as described in Regulation (EU) 2017/1151 as amended by Regulation (EU) 2018/1832). In the context of future vehicle emission standards, it is proposed that a test with regeneration will be considered valid, and the relevant PN emissions will be considered [34].
The objectives, which also highlight the novelty and scientific contribution of the current paper, are:
-
Investigate the impact of DPF regeneration on CO2, NOx and PN emissions in a wide range of operating conditions, including a mix of laboratory and on-road testing.
-
Assess the DPF regeneration frequency and duration.
-
Estimate Ki factors and verify the official values (where available).
-
Propose updated NOx emission factors (EF) taking into consideration DPF regeneration.
-
Investigate the impact of DPF regeneration on vehicle efficiency.
Eight diesel LDVs of various drivetrain and emission control technologies were tested for prolonged periods under different operating conditions, both in the laboratory and on the road. A number of regenerations occurred in most vehicles and measurements of gaseous and particle emissions were conducted during and between regenerations. This enabled the characterisation of emissions during and after each event and the evaluation of the impact of DPF regeneration on the overall emission level of each vehicle.
Following this introduction, the paper is structured as follows:
-
Section 2 presents the materials and methods, including the tested vehicles, the driving profiles and the measuring equipment.
-
Section 3 focuses on the methodologies for the identification of the active DPF regeneration, using either detailed ECU and OBD data or tailpipe temperature and emissions data.
-
Section 4 analyses and discusses the results of the experimental campaign and is organised in four sub-sections:
Section 4.1 focuses on individual tests, analysing the emissions impact of DPF regeneration.
Section 4.2 analyses the DPF regeneration frequency and duration.
Section 4.3 assesses the impact of DPF regeneration on the overall emission of each vehicle.
Section 4.4 estimates the energy consumption and efficiency under DPF regenerating conditions.
-
Section 5 summarises the work conducted and the relevant conclusions, together with the scientific contribution of the paper and some suggestions for future work.
-
Appendix A and Appendix B provide additional data and information concerning the testing procedures and the emissions results.

2. Materials and Methods

2.1. Tested Vehicles

Eight diesel vehicles have been tested under various driving profiles in the laboratory and on the road, running on commercial market fuel (typically B7). Table 1 summarises the main technical specifications of the tested vehicles. Seven out of the eight vehicles are passenger cars, covering a range of segments (C-medium, E-executive and J-SUV), particularly the J-SUV category, which is the one with the highest market share during the last years in the EU [35], while one tested vehicle is a class 2 (N1-II) Light Commercial Vehicle (LCV). In addition, only conventional vehicles were selected, since the EU market share of diesel-hybrid vehicles is below 1% [36], thus, their overall contribution is minimal. Six vehicles are compliant with the Euro 6b emission standard and the other two are Euro 5b compliant. While both Euro 5 and Euro 6 vehicles have the same PN emissions limit, the NOx emissions limit is lower for Euro 6 vehicles (80 mg/km vs. 180 mg/km). For this reason, Euro 6 vehicles are equipped with a deNOx aftertreatment system (LNT and/or SCR). All vehicles are fitted with a DPF, while all the engines have EGR as internal measure for NOx formation control. None of the vehicles of this study had to comply with the RDE regulation (Regulation (EU) 2018/1832). The tested vehicles cover all drivetrain types (FWD/RWD/4WD) and are equipped with either manual (MT) or automatic (AT) transmission. The tested vehicles also cover a range of engine displacement (from 1.6 L to 3.0 L) and power (from low-powered LCV and SUV to high-powered luxury passenger car).

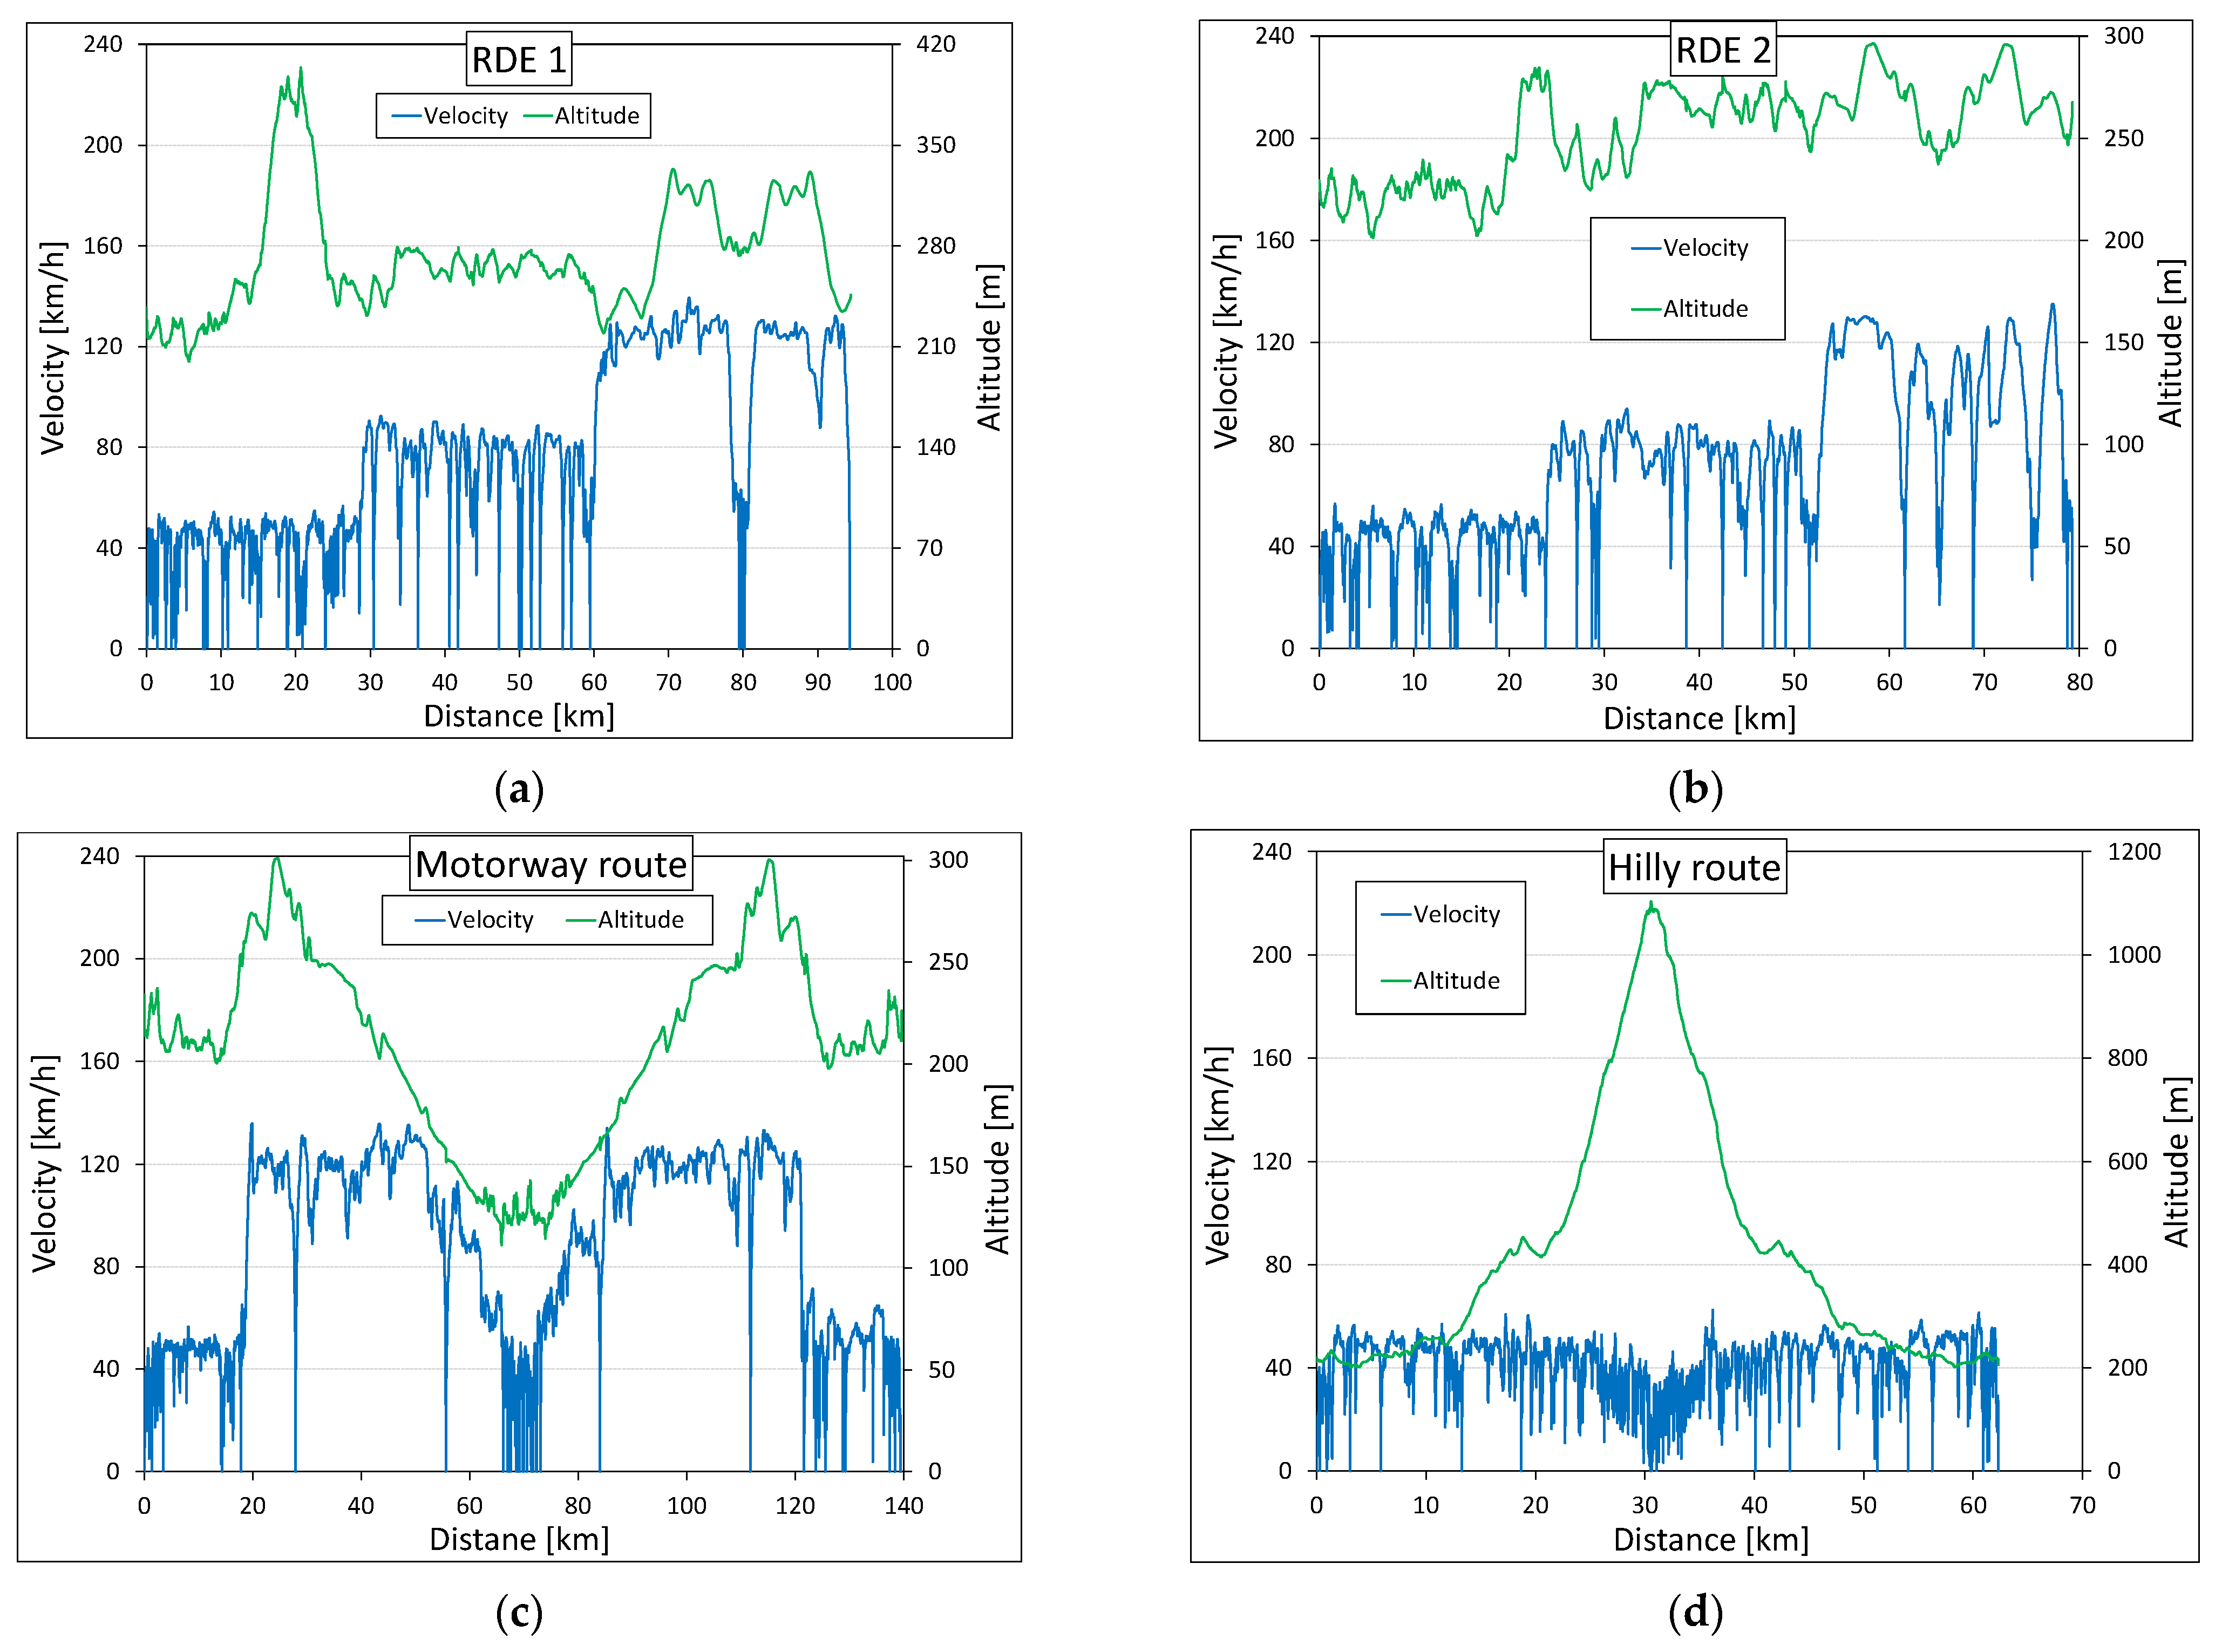
2.2. Test Schedules and Driving Profiles

The test campaign consisted of both laboratory and real-world measurements. Using the respective mass and road load settings, two driving cycles were tested on the chassis dynamometer, the NEDC and the WLTC. The cycles were run under both cold and hot starting conditions, under various ambient temperatures (e.g., 10, 23, 30 °C). In addition, some variations of the cycles were tested, incorporating additional load on the engine (e.g., by activating the A/C and headlights). The laboratory tests with and without DPF regeneration are compared on the timescale since the driving profile is repeated precisely, without any influence of external factors.
Four different routes were followed on the road with different velocity and altitude profiles, as shown in Figure 1. The first two routes, RDE 1 and RDE 2, are compliant with Regulation (EU) 2017/1151, while the third and fourth focus on motorway and hilly driving, respectively. In some cases, the tests were repeated with different driving modes (e.g., dynamic driver behaviour or different vehicle setting such as ‘eco-mode’). The on-road tests with and without DPF regeneration are compared on the distance scale since the driving profile cannot be repeated precisely, owing to external effects, such as the traffic conditions and the absence of a ‘default’ velocity profile. Table 2 summarises the characteristics of all the tested driving profiles.
A mix of laboratory and on-road tests was run on each vehicle, without any particular order. More details concerning the exact tests on each vehicle, the respective distance driven and the tests where regeneration occurred are provided in Appendix A.

2.3. Measurement Equipment

The tests were conducted at two Vehicle Emission Laboratories (VELA) of the European Commission Joint Research Centre (JRC) (Ispra, Italy). The first facility had a chassis dynamometer with two 48 inches rollers (AIP/MAHA, Haldenwang, Germany), a Constant Volume Sampler (CVS) with a critical flow venturi, and gas analyser benches (MEXA-7400 for the dilution tunnel and bags, HORIBA, Kyoto, Japan). The second facility had a chassis dynamometer with two 48 inches rollers (ZÖLLNER GmbH, Bensheim, Germany), a CVS with a critical flow venturi, and gas analyser benches (AMAi60, AVL, Graz, Austria). The principles of operation of the gas analysers were: non-dispersive infrared detection (NDIR) for CO and CO2, chemiluminescence (CLD) for NOx, and hot (191 °C) flame ionisation detection (FID) for total hydrocarbons (THC) and methane (CH4).
The applied resistances on the chassis dynamometer were estimated based on the vehicle characteristics [38]. In addition, all WLTP tests have been conducted following the requirements of the new test procedure (Regulation (EU) 2017/1151), such as: increased and more realistic test mass, new gearshift strategy (for vehicles with manual transmission), test temperature, the accuracy of the chassis dyno for the road load simulation, and vehicle preconditioning.
To assess emissions performance of the tested vehicles over on-road tests, the three following models of PEMS were used:
  • SEMTECH-DS (Sensors, Saline, MI, USA—model 2008)
  • SEMTECH-ECOSTAR (Sensors, Saline, MI, USA—model 2013)
  • MOVE (AVL, Graz, Austria—model 2016)
The PEMS equipment comprised an exhaust gas flow meter, exhaust gas analysers, a GPS device, a weather probe with ambient gas and pressure, a power supply device, and an OBD data acquisition device (not in all tests). The exhaust flow meter was based on the Pitot tube principle. NOx emissions were measured via the Non-Dispersive UltraViolet (NDUV) principle, while CO and CO2 emissions were measured via the NDIR principle.

3. Identification of Active DPF Regeneration

Various parameters can be used to identify an active DPF regeneration, either the ones triggering and controlling it or others that come as its direct results. The availability of the relevant information depends on the test facilities (engine bench, chassis dynamometer, on-road testing) and measuring equipment (OBD scanner, laboratory emissions analysers, PEMS). As summarised in [27], the fuel injection strategy, EGR rate, boost pressure and throttling (either exhaust or intake) can indicate an active DPF regeneration. In some modern vehicles, there is also an OBD binary indicator that shows the occurrence of an active regeneration [21]. After triggering an active DPF regeneration, exhaust gas temperature increases sharply, while fuel consumption (thus, CO2 emissions, as well) and pollutant emissions are significantly affected.
In the present study, exhaust gas (tailpipe) temperature and CO2 and pollutant (NOx and PN) emissions were systematically recorded in all the tests, either with or without DPF regeneration. In addition, in some cases, OBD data were also recorded. The following two paragraphs describe the methodologies used to identify the regeneration, using either detailed ECU and OBD data or by analysing temperature and emissions recordings. It is noted that the present experimental campaign included tests with and without regeneration. The direct comparison of those tests proved a valuable tool for correctly identifying regeneration. Some relevant observations can be used as hints for identifying a DPF regeneration in an individual test, as well.

3.1. Using Detailed ECU and OBD Data

When detailed ECU and OBD data can be made available, e.g., when using an OBD scanner on the vehicle or directly from the open ECU on the engine test bench, then it is possible to monitor the parameters that trigger and control the regeneration. For example, the pressure drop across the filter, which is a fundamental parameter used for the calculation of the soot load of the DPF [39], can be recorded, or, in the case of full access to an open ECU, the calculated soot load may also be available. In case the trapped soot mass exceeds the relevant threshold, an active DPF regeneration is triggered, usually by activating fuel post-injection. This threshold depends strongly on vehicle specifications and DPF sizing, while the operating conditions also influence it. A previous study [32] found that the minimum soot load to trigger an active regeneration was 60% of the filter’s capacity, while several events commenced when the DPF was completely full. The main reason behind this variation is the control strategy, which evaluates and selects the most favourable operating conditions for regeneration [32].
Figure 2-top illustrates an indicative example of the fuel post-injection profile during an active DPF regeneration. The medium post-injection assists in increasing the exhaust gas temperature, while the late one supplies the fuel that will be further oxidised to raise the temperature in the DPF in the order of 600 °C. At the same time, the EGR valve is closed to maintain the high exhaust gas temperature [32]. It is interesting to observe the delay of around 1 min between the activation of the post-injection (i.e., triggering of the regeneration) and the increase in the DPF inlet temperature at the required levels. This is attributed to the thermal inertia of the system, and it is expected to be even longer in case the tailpipe temperature is used as an indicator of the regeneration, owing to the longer distance. Figure 2-bottom presents another example of recording OBD data during on-road vehicle testing. The trip section depicted includes a part of the DPF regeneration that can be compared with the following part of the trip. Apart from the closed EGR valve, the behaviour of two additional parameters is highlighted. The first is the engine speed, which is kept at a higher level during idling (i.e., when the vehicle stands still) in regenerating conditions to maintain the required exhaust gas flow to the DPF. If the vehicle is equipped with start-stop functionality, this is deactivated during the regeneration. The second is the battery voltage, which indicates battery charging during the regeneration. The alternator is activated to put some extra load on the engine, again to increase the exhaust gas temperature. In order to keep a balance of the battery voltage, some high electrical consumers may also be activated (e.g., heated mirrors and rear window).

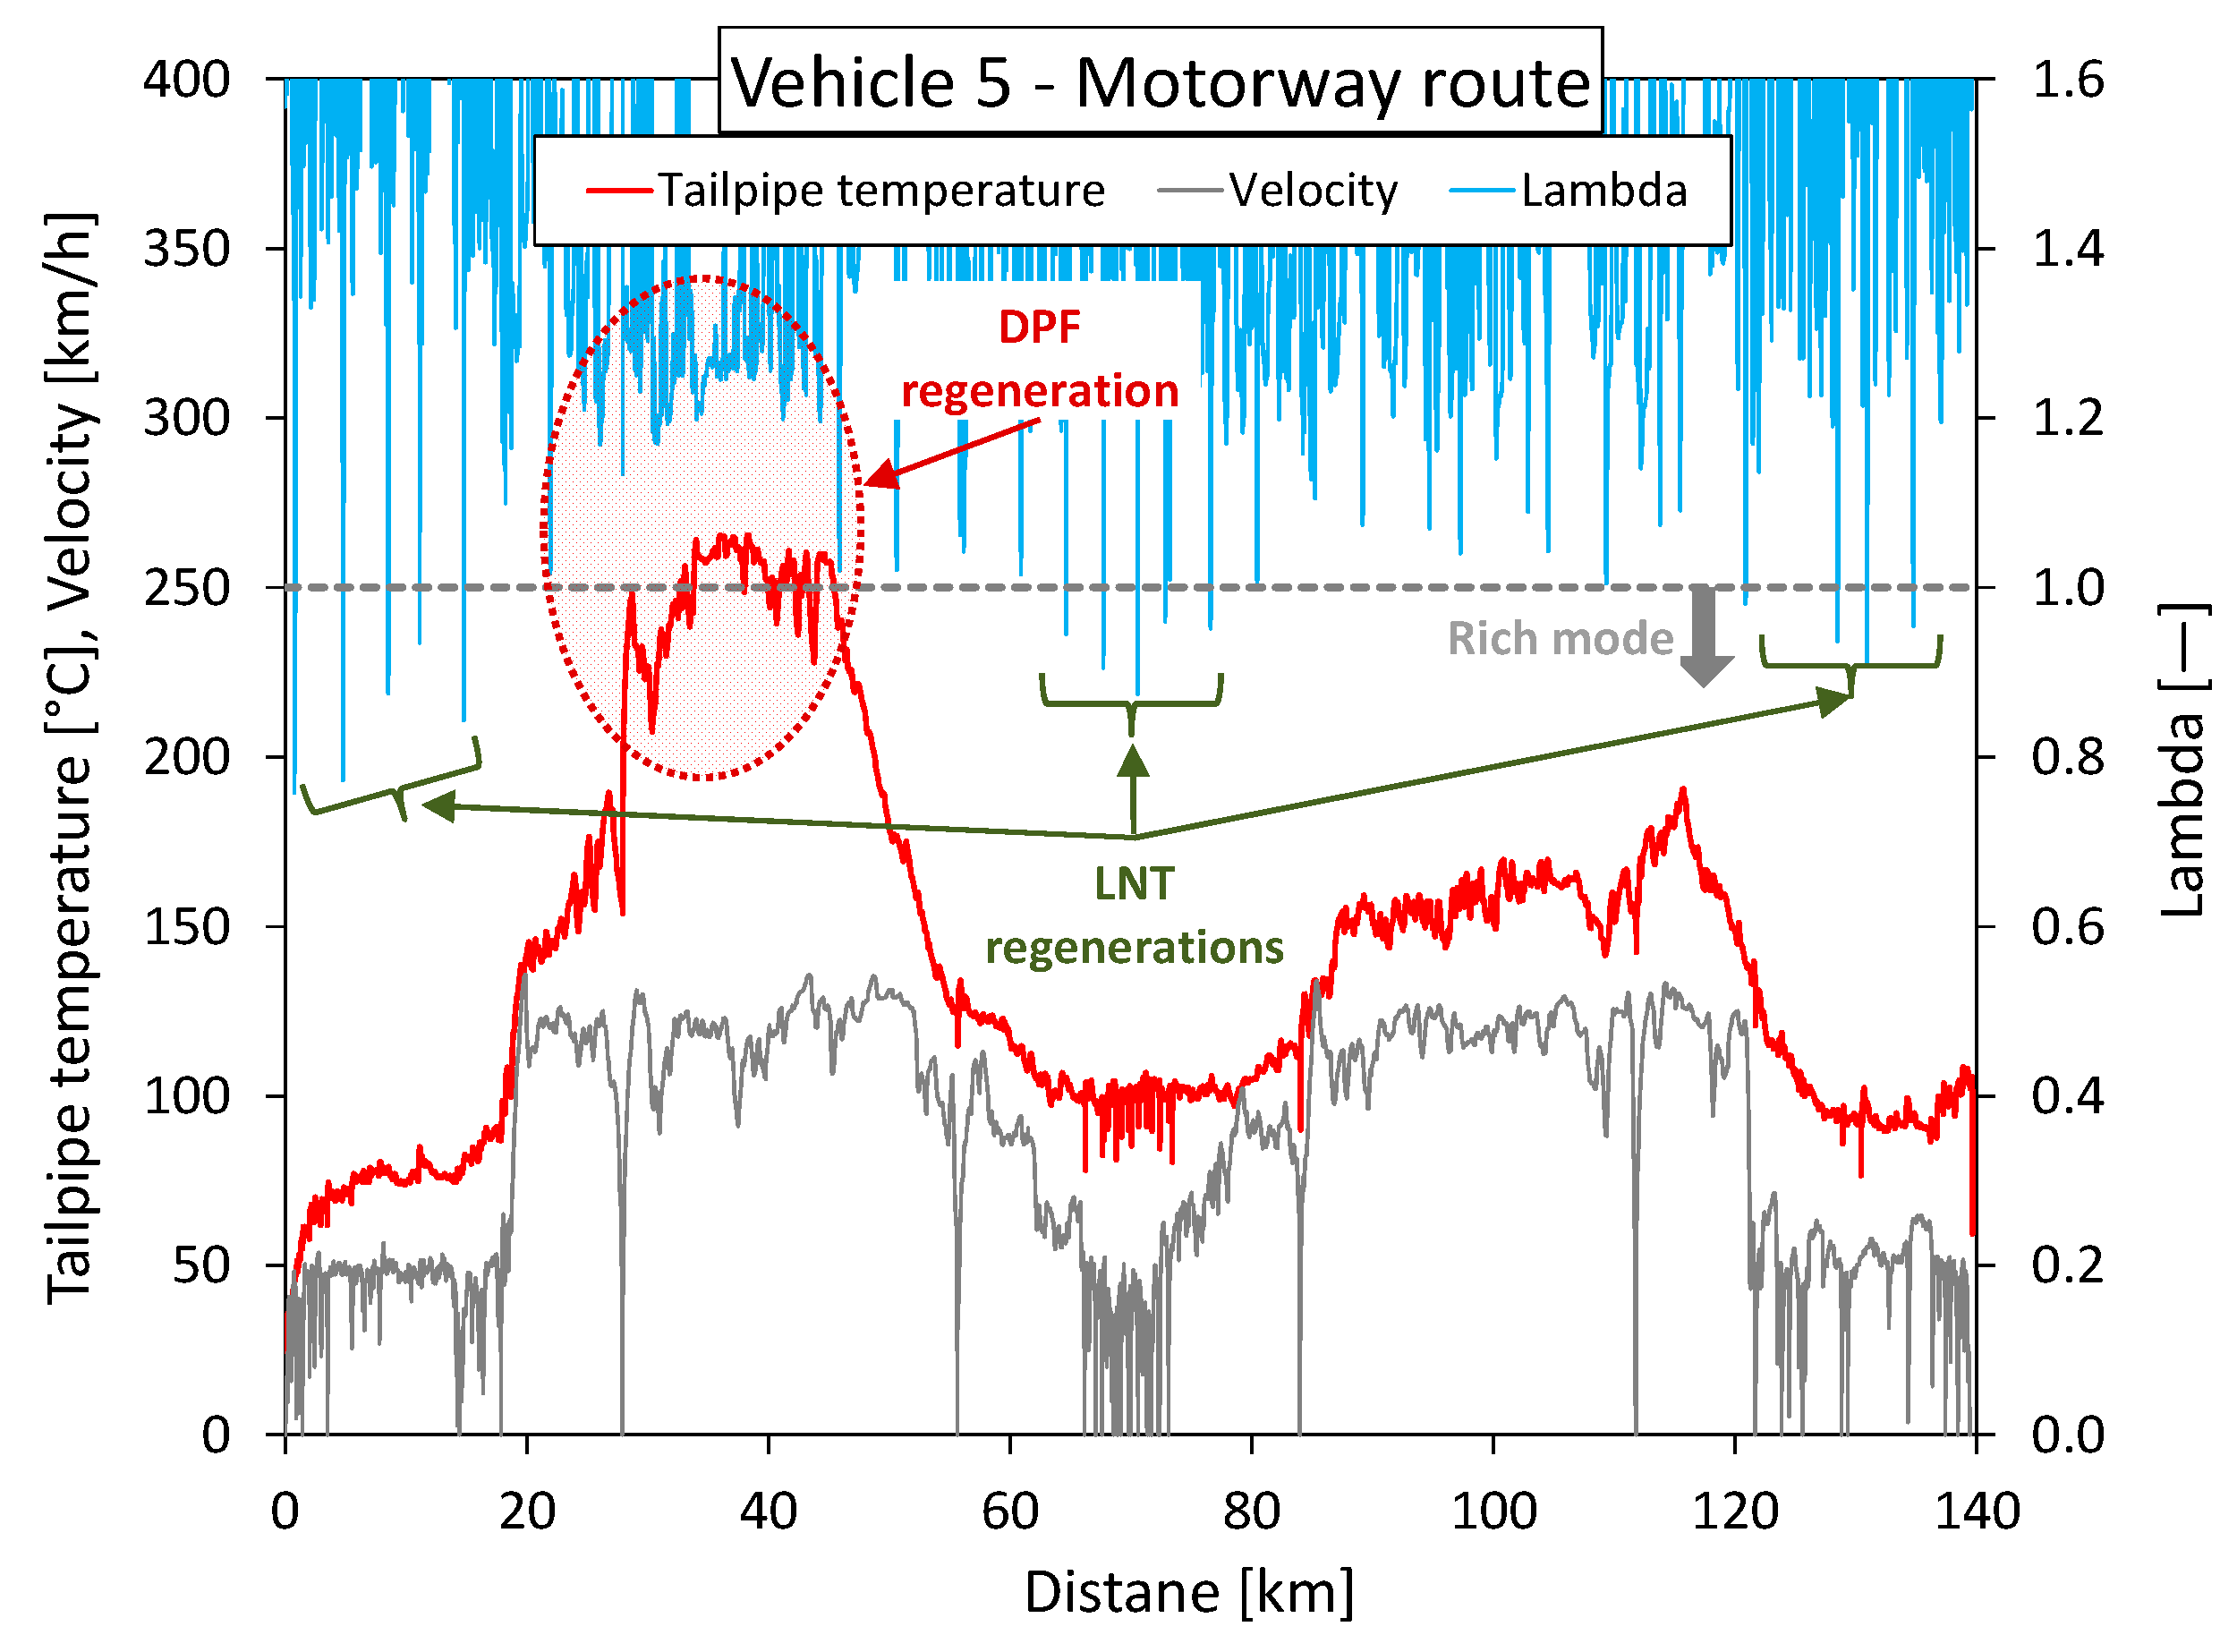
3.2. Using Tailpipe Temperature and Emissions Data

If OBD data are not available, then a number of other parameters can be used to identify an active DPF regeneration. The most common ones are the tailpipe temperature and emissions. However, care shall be taken when correlating these parameters with the actual vehicle operation and driving conditions, particularly during on-road testing.
Laboratory testing on the chassis dynamometer has the obvious advantage of repeatability. The driver follows specified speed and gear (for manual transmissions) profiles and needs to respect them within specific limits. There are not any external influences (e.g., weather and traffic conditions), and in the case of standard driving cycles (e.g., NEDC, WLTC), a straight and flat road is actually simulated. These testing conditions make identification of the DPF regeneration easier using the tailpipe temperature and emissions profiles. As shown in Figure 3a, the tailpipe temperature is significantly higher when an active regeneration (DPF REG) occurs, reaching values up to 250 °C. Due to this clear divergence, this parameter is commonly used to define the start and end of the regeneration [40]. However, as pointed out in the previous section, there is a delay (in the order of 1 min or more) between the triggering of the regeneration and the rise in exhaust gas temperature.
Further to tailpipe temperature, exhaust emissions can also be used to identify an active DPF regeneration. Figure 3b,c show elevated CO2 and NOx emissions during the regeneration. Although the difference is evident in the instantaneous emissions values, it is challenging to identify where the regeneration starts and ends using these profiles. On the other hand, the cumulative emitted mass profiles provide much clearer indications about the regeneration period, particularly when examining their difference. The latter is zero (or very low, at least) before the regeneration; it increases upon its activation and remains constant after the regeneration. This behaviour is attributed to the different operations of the engine during the active regeneration. In particular, CO2 emissions increase due to the extra fuel supplied with post-injection and the oxidation of the accumulated soot in the filter, the contribution of which is quantified in a following section. The increase in NOx emissions is attributed mainly to the closed EGR valve (which is a usual strategy in DPF regenerating conditions) and the reduced efficiency of NOx aftertreatment devices (LNT, SCR) at very high temperatures and the absence of LNT regeneration (when LNT is present) [15]. Since the parameters governing the increase in CO2 and NOx emissions are related to the regeneration triggering and control, these two species can be used as good indicators of the start and end of the regeneration. In addition, HC emissions can also be used to detect an active DPF regeneration, as described in [21]. However, HC emissions may not always be available, particularly in on-road testing, due to the capabilities of common currently existing PEMS. Finally, instantaneous CO emissions peaks may indicate the triggering of a DPF regeneration, although not a systematic and consistent trend was observed in this experimental campaign.
When it comes to PN emissions, significantly different behaviour is observed, as shown in the example of Figure 3d. During the first part of the regeneration, PN emissions remain at very low levels, similar to the case without regeneration. This is followed by a sharp increase in the second part, reflected in both instantaneous and cumulative values, where particles are oxidised and exhausted due to the lower filtration efficiency of the DPF. On top of that, PN emissions exhibit increased levels (compared to the case without DPF REG) for a short period after the regeneration, owing to the still inadequate soot cake [16,27]. Therefore, PN emissions cannot be considered a reliable indicator of the exact regeneration period but rather a flag that regeneration occurs due to their significant increase, which is relatively easy to identify [11].
Similar considerations can also be made for on-road testing, using the tailpipe temperature and exhaust emissions as indicators of the DPF regeneration. However, additional effects that influence these parameters need to be considered. The first is the traffic conditions, resulting in a non-repeatable velocity profile in the time domain. Therefore, on-road testing results will be illustrated versus distance. The second effect is the road characteristics, specifically the altitude. Uphill driving is translated to higher engine load, leading to elevated exhaust gas temperatures and, possibly, emissions. The third effect is the driving behaviour, with dynamic driving resulting again in high engine loads, while abrupt accelerations directly impact emissions. The fourth effect is the vehicle mode (if available, e.g., eco/normal/sport) and the activation of auxiliaries (e.g., A/C or heater), which can be set freely in on-road testing.
The combined outcome of these effects may be misleading for identifying an active DPF regeneration. In addition, specific on-road conditions, such as downhill driving with fuel cut-off, may also favour passive regeneration. An indicative example of the impact of these parameters on tailpipe temperature is illustrated in Figure 4, where the vehicle specifications are also considered. These diagrams reveal explicitly that the tailpipe temperature can reach elevated values comparable to those of regeneration for several reasons. Under normal conditions, a DPF regeneration produces tailpipe temperatures in the order of 250–300 °C (Figure 4-left). However, when the vehicle is set in ‘eco’ mode, the maximum tailpipe temperature may drop below 250 °C during regeneration. At the same time, tailpipe temperature can reach 200 °C during dynamic driving and even exceed 250 °C during uphill driving. This becomes even more critical when examining a low-powered LCV (Figure 4-right). In this case, dynamic and uphill driving and high payload can produce tailpipe temperatures in the order of 250–300 °C, which may be misinterpreted as an indication of DPF regeneration.
Another critical point that also needs to be taken into consideration is the completeness of the DPF regeneration. Although the regeneration may be triggered within a test, it is not necessarily stopped when it is fully complete, but it might be discontinued due to unfavourable operating conditions. Therefore, although tailpipe temperature is falling, the regeneration may not have ended. This is likely to occur when the operating conditions change shortly after the triggering of the regeneration. Such an example is presented in Figure 5, where the regeneration was triggered in the middle of the extra-urban part of NEDC and was then interrupted due to the short duration until the end of the cycle, remaining incomplete. This is fully confirmed by the fact that the regeneration continued from the beginning of the cycle following immediately after. This is indicated by the tailpipe temperature profile and the very high PN emissions of the following cycle.
Overall, the best indicators of the DPF regeneration are the soot level and the OBD binary indicator [21]. However, both these parameters were not made available in the OBD port of the tested vehicles in this experimental campaign, while the OBD indicator is usual in more modern vehicles (particularly the ones compliant with the Euro 6d standard).

4. Results

This section presents the results of the testing campaign and the relevant interpretation. First, the impact of DPF regeneration on emissions of individual tests is presented, followed by the determination of the regeneration frequency. The regeneration impact on overall emission levels is calculated by combining the previous outcomes. Finally, the vehicle efficiency during a regeneration event is discussed.

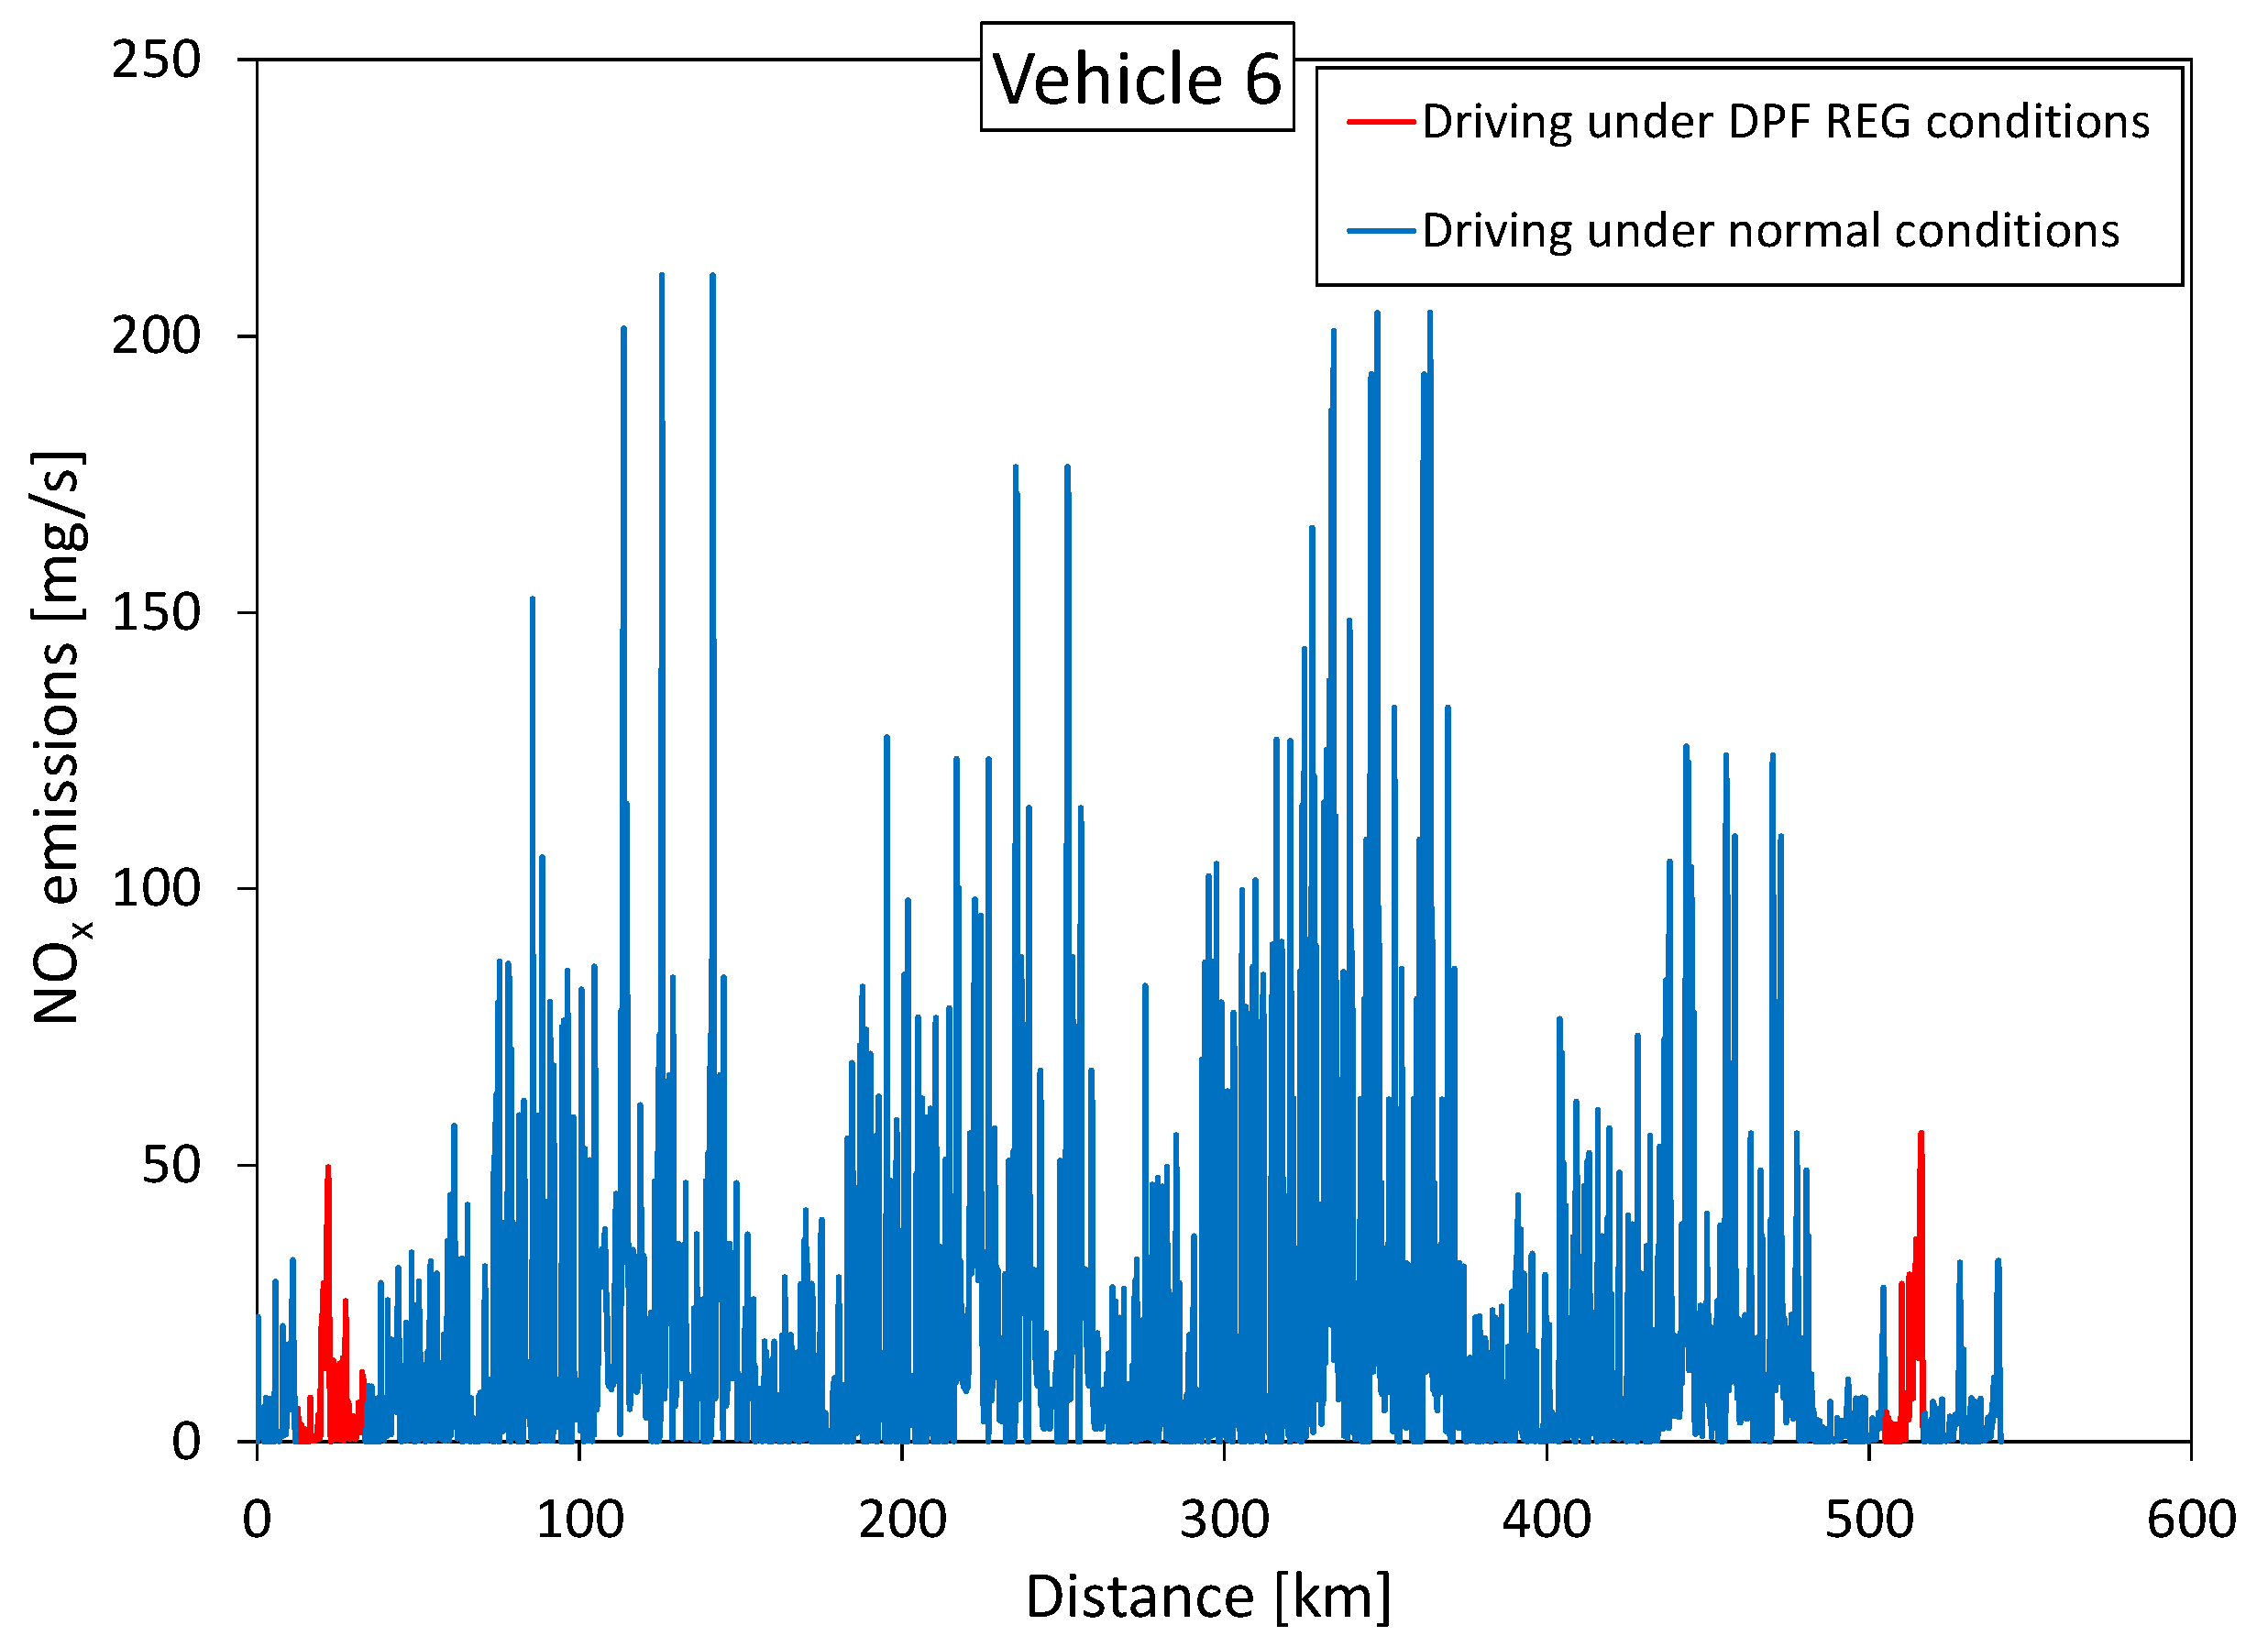
4.1. Impact of DPF Regeneration on Emissions of Individual Tests

Starting with the overall impact of DPF regeneration, Table 3 presents for each vehicle the percentage increase in CO2, NOx and PN emissions throughout the complete test, either on the chassis dynamometer or on the road, as well as during the regeneration period only, compared to the same tests without regeneration. Together, the regeneration frequency and duration are provided. The corresponding information for the absolute emissions in tests with and without regeneration is provided in Appendix B. In the case of Vehicle 8, no DPF regeneration was observed during the specific tests, covering a total distance >1500 km. It is possible that a regeneration took place during a preconditioning cycle or other driving that was not recorded. Alternatively, this vehicle may use a fuel additive to enhance DPF regeneration, while the constantly high exhaust gas temperature may favour continuous passive regeneration.
Although different mechanisms and phenomena lie behind the increase in each exhaust gas constituent, there are two common observations. The first is the much higher increase in emissions when isolating the DPF regeneration period than the ones of the complete test. The impact of the significant differentiation of emissions during the regeneration is diluted when the phases before and after it are considered, where emission levels are similar in the cases with and without regeneration. The second common observation is the higher (percentage) impact of regeneration on the chassis dynamometer tests compared to the on-road ones. This is the combined result of the low emissions of driving cycles (NEDC, WLTC), the significantly longer distance of on-road tests and the conditions under which the regeneration occurs, which also affect its duration. These effects are analysed in a following section.
A wide range of increases in CO2 emissions due to regeneration is observed in Table 3, highlighting the significant impact of the conditions under which the regeneration takes place and the vehicle specifications. When considering the complete test, CO2 increases by 22–64% in the laboratory and by 4–18% on the road. The corresponding increase during the regeneration period is 42–115% on the chassis dynamometer and 29–90% on the road. The increase in CO2 emissions comes from the extra fuel supplied with post-injection, oxidised upstream of the DPF to increase exhaust gas temperature, and not contributing to the production of useful work, as well as from the oxidation of the accumulated soot in the filter. To estimate the contribution of the latter phenomenon, it is assumed that the DPF volume is 1.5 times the engine displacement and that a regeneration is triggered when the soot load in the filter reaches 6–7 g/L [12,41]. It is also assumed that soot consists of carbon, which is fully oxidised to CO2 during the regeneration, meaning that the maximum possible contribution of this phenomenon is estimated (it is acknowledged that other compounds also make part of the filter load). Under these assumptions, soot oxidation during the regeneration is responsible for 1.5–6.5% of the CO2 emitted during the regeneration period. The impact drops to 0.3–3.5% when considering the whole trip duration, with the lower values corresponding to the on-road tests and the higher to the laboratory ones. When calculating the fuel consumption of a test with regeneration based on CO2 emissions, the contribution of soot oxidation should also be considered. While most of the extra CO2 emissions during the regeneration come from the post-injected fuel, a small part comes from soot oxidation and, ideally, it should be extracted before calculating the fuel consumption of the specific individual test. The accumulated soot in the filter makes part of the fuel consumed between two consecutive regenerations and not of the regeneration event itself, and it is taken into account through the Ki factor. However, the actual impact tends to be very low (almost negligible), particularly in on-road tests.
On the pollutant side, NOx emissions exhibit a very wide range of increase when regeneration occurs. If the complete test is examined, then NOx emissions can be up to 8 times higher (Vehicle 2), while if only the regeneration period is considered, they can be 11 times higher (Vehicles 2 and 5). In general, two mechanisms of the regeneration event are responsible for the observed increase in NOx emissions, namely the increased engine-out levels and the reduced efficiency of the aftertreatment system. The first is related to the very low (if not zero) levels of EGR, as already shown in Figure 2 and reported in previous studies [27,32]. Closing the EGR valve allows a higher engine-out temperature and shifts the NOx/soot trade-off towards increased NOx formation and soot oxidation, favoured by the higher combustion temperatures and oxygen availability [42,43]. This is fully confirmed by the results of Vehicle 3, where OBD data were recorded during the on-road tests. This vehicle repeated four times the RDE 1 profile (Figure 1), undergoing a DPF regeneration in two of the repetitions (at different phases of the trip). Isolating the regeneration period, the average EGR rate was 3.5% during the first event, while the corresponding level at the non-regenerating repetitions was 34%. Similarly, the average EGR rate was 1.5% during the second regeneration period and 21% at the respective phase of the non-regenerating repetitions.
While EGR affects NOx formation, the other mechanism is related to NOx abatement and depends on the type of aftertreatment devices. When the vehicle is equipped with SCR, then the very high temperatures experienced during DPF regeneration cause a drop in NOx conversion efficiency [44], which is optimum in a typical range of 250–450 °C [45]. High conversion efficiency is restored after the temperature decreases to levels without DPF regeneration. It has been found that a large portion of the engine-out NOx emissions is NO2, which supports further the DPF regeneration [44]. If the vehicle is equipped with LNT, then the increased tailpipe NOx emissions are affected by the absence of LNT regeneration [15]. The latter is achieved by switching the engine to rich operation for a short period (in the order of few seconds), which would lead to oxygen shortage in the exhaust gas and hinder DPF regeneration. This means that after the LNT is saturated, engine-out NOx emissions pass unchanged directly to the tailpipe. This behaviour is fully confirmed by the results of Vehicle 5 (which is equipped with LNT and DPF), where data from the lambda sensor are available. As presented in Figure 6, before and after the DPF regeneration, several LNT purges occur with the engine switching to rich-mode operation, as indicated by the lambda values. However, during the DPF regeneration period, lambda never falls below 1.2 and LNT is not cleaned.
PN emissions, measured only in the laboratory tests of this experimental campaign, also exhibit an extensive range of increases due to DPF regeneration, as observed in Table 3. Either throughout the complete test or during the regeneration period only, PN emissions can increase by three orders of magnitude, in most cases exceeding the legislative limit of 6 × 10¹¹ #/km (cf. tables in Appendix B). The exact characteristics of the emitted particles depend strongly on the conditions of the regeneration (temperature, duration, soot loading) [46] and the findings vary when different sizes are examined, as well as when volatiles are taken into account [11,22,27,46]. It should be kept in mind that engine-out particle characteristics also vary during the DPF regeneration [46], as the engine operates in a different mode (e.g., closed EGR valve, fuel post-injection), and both engine-out and deposited particles can be blown out during the regeneration process [47]. When solid particles larger than 23 nm are considered, then two phases can be distinguished, as shown in Figure 3, the initial heating part where emissions remain low, followed by the high emissions phase where particles are oxidised and exhausted and also go through the DPF due to the lower filtration efficiency. While CO2 and NOx emissions are affected only during regeneration, PN emissions are not restored immediately after regeneration. The consumed soot cake results in a lower filtration efficiency and takes some time until PN emissions are restored to the pre-regeneration levels. This is explicitly shown in Figure 7, where PN emissions are illustrated before, during and immediately after the regeneration, following the same driving profile consecutively. Before the regeneration, very low levels are observed, well below the legislative limit, confirming the high filtration efficiency of the DPF. During the regeneration, the limit is exceeded by more than 3 times, while PN emissions are above 6 × 10¹¹ #/km immediately after. It is interesting to notice the very high peak at the engine start, immediately after the end of DPF regeneration with a clean filter, and the subsequent local peaks until the stabilisation around the mid of the cycle. This agrees with relevant literature on light-duty vehicles [22,33]. A similar finding has also been reported for a heavy-duty vehicle running the JE05 cycle, where PN emissions stabilised after the 10th repetition of the test [44].

4.2. DPF Regeneration Frequency and Duration

The main parameter triggering an active regeneration is the engine backpressure and the estimated soot load, calculated with the pressure drop across the filter [39]. Other circumstances may also trigger an active regeneration, such as system resetting or catalyst desulphurisation [11]. On top of that, the control strategy considers a minimum threshold in soot load and the most favourable operating conditions for regeneration (e.g., vehicle speed, engine speed and load, exhaust temperature, etc.) [32]. Sometimes the regeneration is not completed, which will affect the distance until the next regeneration [11]. This means that a DPF regeneration is not programmed at a specific distance or time interval but rather depends strongly on engine-out emissions and specifications and actual conditions of the filter. The regeneration frequency varies significantly among similar vehicles, occurring more frequently in modern ones [11]. An average distance of 495 km (±215 km) between two regenerations has been reported for Euro 5 vehicles, while for the Euro 6 ones, the respective distance drops to 415 km (±155 km) and even to 196 km (±110 km) for a specific Euro 6d-temp passenger car [11].
In this study, one of the two Euro 5 vehicles (Vehicle 6) underwent two regenerations and made possible the frequency estimation, which corresponds to a distance of 480 km (Table 3), being within the previously reported intervals. In most of the Euro 6 vehicles, two (or more) regenerations occurred, allowing for a more detailed frequency calculation. On average, the regeneration interval was 485 km (±106 km) for the Euro 6 vehicles, again being within the previously reported range. Since only one Euro 5 vehicle provided the relevant results, a direct comparison of the regeneration frequency with Euro 6 vehicles is not feasible.
However, examining the scatter within the Euro 6 vehicles is interesting, particularly for each vehicle, since the absence of detailed information concerning the filters does not allow for direct comparison among the different vehicles. Vehicle 2 presented a high scatter in the regeneration interval, from 470 km to almost 600 km. This can be attributed to the different driving conditions between consecutive regenerations, directly affecting engine-out particle emissions and, thus, DPF loading. During the longer interval (~600 km), the vehicle was driven both in the laboratory and on the road: 190 km on the chassis dyno (mostly NEDC and three repetitions of WLTC) and 403 km on the road. In contrast, on the shorter interval, the vehicle was driven for 470 km on the road. The relatively low emissions associated with lab testing (accounting for 190 km), particularly for the NEDC, resulted in limited filter load and allowed for a longer distance to be driven before the next regeneration. The following 403 km on the road, where the vehicle operated at a much wider range of conditions, increased the filter load to the level triggering a regeneration after a total driven distance of ~600 km. In the second interval, the vehicle was driven only on the road, and 470 km were enough to bring the filter again to a regeneration state. A similar discrepancy has been observed on a 2014 diesel passenger car, where it has been estimated that if only NEDC was run then 45 cycles (492 km) would be needed from one regeneration to the next, while in the case that only WLTC was tested the next regeneration would occur after 14 cycles (326 km) [32].
The above findings do not necessarily mean that the filter load is the same at any regeneration event, suggesting that the vehicle needs to travel longer distances when engine-out emissions are lower. This is valid when the engine operates at a fully controlled environment and under repeatable conditions, where lowering the engine-out emissions lengthens the regeneration interval [41]. Apparently, there is a correlation between regeneration interval and soot load in real-world conditions [32], but additional parameters influence the system behaviour. One of them is the conditions under which the regeneration takes place, where it has been found that the WLTC includes driving conditions capable of triggering a regeneration [32]. In contrast, the lower loads of the NEDC do not constitute the most favourable conditions for a regeneration. In the present study, regenerations occurred under various operating conditions, including urban, rural and motorway conditions. In most cases, the average speed during the regeneration was above 40 km/h, while in half of them, the vehicle travelled with more than 60 km/h. This means that DPF regenerations occurred during both low-speed urban driving and rural/motorway conditions.
The conditions under which the regeneration takes place affect directly its duration, which also depends strongly on the soot load in the filter. A comparison among different vehicles may not provide reliable results due to the varying filter specifications and control strategies. In the current study, Vehicle 3 underwent two regenerations during on-road testing under different parts of the RDE 1 profile: in case A, the regeneration occurred in the motorway part and in case B, it was triggered in the urban part and was completed in the rural. Table 4 summarises the conditions during the two regeneration events (cases A and B) and the respective information from an additional repetition without regeneration (case C). Figure 8 illustrates the tailpipe temperature of all three cases. Regeneration A lasts for more than 7 min, corresponding to 14.3 km in the motorway, while in the B case it lasts for half an hour or 21.3 km of urban and rural driving. Although the soot load in the filter, which can strongly affect the regeneration duration, is unknown, this huge difference is also attributed to the significantly different operating conditions. Regeneration A occurs in the motorway part, specifically in an uphill driving section where vehicle speed, exhaust mass flow, and temperature are already high. These are favourable conditions for regenerating the DPF, which is already at elevated temperature. Under these conditions, the fuel quantity of post-injection accounts for an extra 23%, compared to the non-regenerating case C. In contrast, in the B case, where the regeneration occurs in the urban and rural parts, the low vehicle speed, temperature and exhaust mass flow do not allow for a fast regeneration. For this reason, the engine control increases the fuel supply significantly (by 55%) with the post-injection. In a previous study, it has been reported that the post-injection fuel accounts for 40–60% of the total fuel injected in the regeneration period and that this fraction is not linked to the soot load in the filter [32]. The absolute difference in the total fuel consumed during the regenerations A and B may indicate different soot load at the start of the regeneration [32].

4.3. Impact of DPF Regeneration on Overall Emissions

The analysis in Section 4.1 assessed the impact of DPF regeneration on CO2, NOx and PN emissions at the test level, comparing individual repetitions with and without regeneration. However, since regeneration is a periodic event, it is also important to estimate its effect on the vehicle’s overall emissions so as to have a complete indication of its behaviour throughout its lifetime. This can be done by reducing the regeneration effects to the interval between two consecutive events after determining the regeneration frequency (Section 4.2). Currently, this is made in Regulation (EU) 2017/1151 with the Ki factor, which is calculated using the emissions with and without regeneration, weighted over the distance driven between two consecutive events. More precisely, and since the whole procedure is based on WLTC testing, the number of successive cycles completed between two regenerations is used in the calculation. This means that the Ki factor is determined with a laboratory procedure, leading to potential deviations from the real-world operation. In addition, the Ki factor is calculated for PM, not PN emissions in the current regulation.
In the present study, the test campaign included a mix of chassis dynamometer driving cycles and real-world road trips. The Ki factor was determined for CO2 and NOx emissions (PN emissions were not measured in on-road tests) and was calculated using the distance travelled between consecutive regenerations. In the cases where more than two regenerations occurred, all the intervals were taken into consideration, as depicted in Figure 9. The following equation was used for the calculation of Ki factors:
K i = M normal × D + M reg × d D + d M normal
where Mnormal and Mreg are the mass emissions (g/km for CO2, mg/km for NOx) in conditions without and with regeneration, respectively, D is the distance (km) between two regenerations and d is the distance (km) required for a complete regeneration. Particular care needs to be taken that with this definition, the Ki factor may be calculated lower than 1 in real world conditions. This can happen when Mreg is lower than Mnormal, which may occur in case that the regeneration takes place in lower load operation (e.g., in urban conditions or in NEDC in the current test campaign) and the driving conditions in the intermediate interval include real-world driving at high loads (e.g., aggressive uphill driving, motorway, etc.) that result to very high emissions (particularly NOx). In the legislation, D is the number of WLTCs between two regenerations and d is the number of WLTCs required for complete regeneration. Since the same standard test is repeated, the number of cycles and distance are equivalent parameters for the regulation.
Figure 10 presents the Ki factor for CO2 (left) and NOx (right) emissions, calculated with the results of the current test campaign. The official Ki values were also available for CO2 emissions. According to the Regulation (EU) 2017/1151, in case the manufacturer proves that emissions remain below the limits in the cycle with regeneration, then the procedure to determine the Ki factor can be skipped, and a fixed value of 1.05 is used for CO2 emissions. In addition, if the regeneration interval is longer than 4000 km, it is considered that the regeneration does not have a substantial impact on emissions and the Ki factor is taken as equal to 1.
A first interesting finding in Figure 10 is that the actual CO2 Ki factor calculated with this test campaign results is lower than the official value, except Vehicle 2. Consistent with the results of Table 3, this finding highlights regeneration’s lower impact on CO2 emissions when real-world driving is included. Of course, this does not necessarily imply that real-world driving results in lower CO2 emissions, but it clarifies that the official Ki values are not directly transferable to real-world conditions. To give a numerical example, an extreme case is considered for Vehicle 1, where DPF regeneration occurs once in real-world conditions (RDE 1 profile) and once on the NEDC. The respective data are presented in Table 5, showing that DPF regeneration’s impact on CO2 emissions is more than double on the NEDC compared to the on-road testing. For a more realistic example, Table 5 also presents the CO2 emissions of Vehicle 3, which underwent two regenerations in real-world driving in different parts of the same route. Consistent with the previous analysis (Table 4), regeneration has a higher impact on CO2 emissions when it occurs in urban conditions (B) rather than in the motorway part (A), also incorporating the effect of the driven distance during the regeneration.
Concerning the Ki factor for NOx emissions, this presents a higher scatter, exceeding 1.2 in some cases. However, the most interesting observation is that for Vehicle 6 the NOx Ki factor is slightly below 1. This is again attributed to the varying emissions level during and between regenerations. For better visualisation, Figure 11 illustrates the instantaneous NOx emissions during a part of the test campaign where two regenerations occurred. Both events occurred in NEDC, without a strong increase in absolute NOx emissions. On the other hand, the intermediate distance was travelled exclusively on the road, including motorway and uphill driving, resulting in much higher NOx emissions. When combining these results in the formulation of Ki according to Equation (1), a value lower than 1 is calculated.
The above findings make clear that the specific definition of Ki has some limitations, and it is applicable only when the same driving profile is repeatedly followed, ideally on the chassis dyno (as is the case in the current regulation). Therefore, the Ki determination in real-world conditions faces some difficulties. At the same time, it highlights the substantial emission effect of driving dynamics and DPF regeneration. Considering possible future emission standards may also include DPF regeneration and to better characterise the real-world environmental performance of passenger cars, it is useful to establish the respective emission factors (EF). In this direction, the concept of an enhanced EF for PN emissions has been proposed in [27], as a weighted average of the EF under normal and regenerating conditions, assuming a representative regeneration interval (frequency). The application of this concept provided more representative real-world PN emissions, while the relevant analysis highlighted the importance of determining the regeneration frequency accurately.
Using the absolute emission results of the current study (cf. tables in Appendix B), NOx EFs are calculated for the following phases:
-
during the regeneration period in laboratory testing (NEDC, WLTC)
-
during the regeneration period under real-world driving
-
for the complete regeneration interval, i.e., the period between the start of two consecutive regeneration events
Particularly for the latter, it is noted that the actual emissions are taken into account for the complete interval, which includes driving in a wide range of conditions. Thus, the respective EF can be considered representative for each vehicle category. The resulting EFs are presented in Figure 12, where the vehicles have been categorised according to their NOx emission control systems. NOx EFs decrease when a more sophisticated emission control system is included (from EGR only to EGR + LNT and to EGR + SCR). It should be noted that vehicle 2, equipped with both SCR and LNT, is categorised as “EGR + SCR”, since it is considered that the main deNOx system is the SCR, with the LNT having supporting role (particularly at lower temperatures). Isolating the regeneration period (Figure 12-left), NOx EFs tend to be higher in on-road driving compared to laboratory tests, owing to the increased engine-out levels that originate in the (usually) higher engine loads encountered in real-world conditions. When considering the complete interval between two regeneration events, NOx EFs are reduced (Figure 12-right), compared to the values corresponding to the regeneration period due to the longer distance travelled in non-regenerating conditions. It is also observed that NOx levels of SCR-equipped vehicles can be very low, even when including DPF regeneration, remaining below the applicable limits (current WLTC limit of 80 mg/km) when considering the complete regeneration interval.

4.4. Energy Consumption and Efficiency

DPF regeneration affects vehicle energy efficiency since it is a process that consumes fuel without the production of useful work. To quantify this impact, efficiency throughout the cycle is calculated using the fuel consumed, the wheel energy and the drivetrain’s average efficiency (depending on the driving profile and the starting conditions) [48]. This is done for the laboratory tests, where the repeatability is high, compared to on-road driving, where other parameters affect the vehicles’ energy consumption. Figure 13-left presents the correlation between the efficiency and the specific wheel energy during the tests—this plot is actually an alternative presentation of the Willans lines that correlate fuel consumption with engine power. The points at lower energy correspond to the NEDC, while the ones at higher energy levels refer to the WLTC, with the error bars showing the test repeatability. The latter set of points presents a much wider range due to the significant variation of the WLTP road load among the vehicles. Each vehicle is represented with different markers and colours, while all red markers show the cycles with DPF regeneration.
A robust linear correlation is achieved starting with the cycles without DPF regeneration. Indicatively, for vehicle 1 the correlation coefficient reaches 0.98 and it is similar (0.97) for vehicle 2. For all vehicles together, the average R2 is in the order of 0.95. When the regeneration cycles are also considered, R2 drops to 0.83 and 0.45 for vehicles 1 and 2, respectively. For the complete group of vehicles, the average R2 is 0.60 when the regeneration cycles are included. This already shows the impact of regeneration on the efficiency since the propulsion work is the same. For vehicle 1, the NEDC efficiency is 18% and drops to 12% when regeneration occurs. Similarly, for vehicle 2 the WLTC efficiency is 27% and drops to 19% under DPF regenerating conditions. When all vehicles are considered, then the average efficiency in NEDC is 20% in normal operation and 13% when the filter is regenerated. Respectively, in WLTC the average efficiency is 25% and 18% in normal and regenerating conditions. With these results, it seems that DPF regeneration has a slightly higher impact in NEDC than in WLTC, something that could be expected given the lower load and milder speed profile of the NEDC. However, more data would be needed from a broader range of vehicles to make general conclusions. Overall, it can be said that the effect of DPF regeneration on efficiency in NEDC and WLTC, expressed as the relative difference, is in the order of 30%.
An additional comparative evaluation is made against other energy consumers’ impact that do not produce work for vehicle propulsion to characterise this difference better. To do so, a few cycles were repeated with the A/C and the headlights on (not the daylights), the former set at the lowest cooling temperature, estimating that way the maximum possible effect. The results are shown in Figure 13-right for a specific vehicle (Vehicle 3), and although the starting conditions of the test are not the same, the relative effect can still be quantified. It is indicated that the DPF regeneration during the NEDC has a similar impact on efficiency as if running the cycle with the A/C and headlights on. Such information could be helpful for vehicle modelling activities and extrapolation to fleets at different regions operating under varying conditions and driven with different behaviour. In any case, this comparison provides only an estimate of the order of magnitude of the relevant impacts coming from other energy consumers (A/C and headlights) and a more focused test campaign should be run in order to draw general conclusions.

5. Conclusions

The present work aimed to assess DPF regeneration’s impact on CO2, NOx and PN emissions of Euro 5 and 6 vehicles, driven under laboratory and real-world conditions. Eight vehicles were tested, covering a wide range of segments, drivetrains and emission control systems. The means to identify an active DPF regeneration were also analysed, highlighting key points that may be misleading and misinterpreted as an indication of regeneration. This concerns particularly the on-road testing, where dynamic and uphill driving and high payload (important for LCVs) may increase tailpipe temperature to similar levels to the ones during regeneration.
The results indicated a significant impact of DPF regeneration on CO2, NOx and PN emissions, higher in the case of driving cycle testing in the laboratory. The average CO2 increase was 46% and 10% in the laboratory and on the road, respectively, throughout the complete test. Isolating the DPF regeneration period only, the respective average values were 71% and 46%, in the laboratory and on the road. Due to the various NOx emission control systems (EGR only, EGR + LNT, EGR + SCR), a very wide range of increase was observed. In any case, it was indicated that SCR systems are capable of achieving very low NOx emissions in tests with DPF regeneration and even remain compliant with the limits in on-road conditions. However, the deactivation of the control systems during the regeneration phase can result to significantly high NOx emissions. PN emissions, measured only in the laboratory, increased by up to 3 orders of magnitude throughout the complete test and the regeneration period, with only one vehicle remaining compliant with the limit under DPF regenerating conditions. The impact of the clean filter on the PN emissions of the test following the regeneration was also highlighted, with peak emissions at the subsequent engine start. The regeneration frequency for Euro 6 vehicles was calculated at 485 km (±106 km). In parallel, the significant impact of the operating conditions on the regeneration duration was highlighted, where the elevated temperatures in motorway driving favoured a shorter regeneration. The calculation of the Ki factors, based on a mix of laboratory and on-road tests for CO2 emissions, revealed some discrepancies compared to the official values, while there was a case where this factor received a value lower than 1 for NOx emissions. These findings highlighted some weaknesses of applying the specific definition of the Ki factor in real-world on-road testing. For this reason, new EF for NOx emissions were calculated depending on the relevant emission control system. When examining the complete regeneration interval, SCR systems could keep NOx emissions at low levels, even lower than the limit. Finally, the impact of DPF regeneration on efficiency was estimated in the order of 30%, as an average of all tested vehicles. Specific tests on one vehicle indicated a similar impact of DPF regeneration on efficiency as the one of A/C and headlights.
Closing the paper, its novelty and contribution to scientific research can be summarised as follows:
  • A comprehensive investigation of both CO2 (equivalently, fuel consumption) and pollutant (NOx and PN) emissions under DPF regenerating conditions, extended also to energy efficiency and covering regeneration frequency and duration, as well. Most of the existing studies address only individual topics, mainly pollutant emissions (mostly PN).
  • Detailed analysis of the underlying phenomena during the active DPF regeneration, assessing the varying impacts under different operating conditions.
  • Assessment of Ki factors under real-world operating conditions and verification of the official values (where available).
  • Proposal of updated NOx emission factors that take into consideration the DPF regeneration effect.
The main limitation of this study lies in the method used to identify the DPF regeneration, where two tests are needed, one with and one without regeneration. This means that, although it is an approach that can indicate the start and end of the regeneration with high accuracy, it is not applicable in individual (on-road) tests. However, this does not degrade the quality and the significance of the findings, since the main research question of the paper is the impact of the DPF regeneration on CO2, NOx and PN emissions. In that sense, it is necessary to implement a methodology that is capable of identifying with high accuracy the exact duration of the DPF regeneration. In summary, the method used for the identification of the DPF regeneration serves in the best possible way the objectives of the current paper, but it is not generally applicable in case of individual tests.
Possible topics for future research could be the examination of additional pollutants, such as NH3, particularly for SCR-equipped vehicles, and total particle emissions, incorporating volatile compounds as well. The investigation of DPF regeneration in diesel-hybrid vehicles is also of interest, owing to the intermittent operation of the internal combustion engine, although the market share of such vehicles is very low.

Author Contributions

Conceptualisation, A.D., G.F. and B.G.; formal analysis, A.D.; data curation, M.C., A.D. and B.G.; writing—original draft preparation, A.D.; writing—review and editing, B.G., G.F. and M.C.; visualisation, A.D.; supervision, G.F. and B.G.; project administration, G.F. All authors have read and agreed to the published version of the manuscript.

Funding

This research received no external funding [4].

Institutional Review Board Statement

The article has been reviewed by the JRC’s scientific review board and was approved for publication.

Informed Consent Statement

Not applicable.

Data Availability Statement

The data are available upon request from the corresponding author.

Acknowledgments

The authors would like to acknowledge the support of the VELA staff for conducting the tests.

Conflicts of Interest

The authors declare no conflict of interest.

Disclaimer

The views expressed in this study are purely those of the authors and shall not be interpreted as an official position of the European Commission.

Nomenclature

Automatic Transmission (AT); Carbon Dioxide (CO2); Conformity Factor (CF); Diesel Oxidation Catalyst (DOC); Diesel Particulate Filter (DPF); Emission Factor (EF); Engine Control Unit (ECU); Exhaust Gas Recirculation (EGR); Front Wheel Drive (FWD); Light Commercial Vehicle (LCV); Light-Duty Vehicle (LDV); Lean NOx Trap (LNT); Manual Transmission (MT); New European Driving Cycle (NEDC); Ammonia (NH3); Nitrogen Dioxide (NO2); Nitrogen Oxides (NOx); Not-To-Exceed (NTE); Nitrogen Dioxide (NO2); On Board Diagnostics (OBD); Particulate Matter (PM); Particle Number (PN); Portable Emissions Measurement System (PEMS); Real Driving Emissions (RDE); Relative Positive Acceleration (RPA); Rear Wheel Drive (RWD); Selective Catalytic Reduction (SCR); Sport Utility Vehicle (SUV); Total Particle Number (TPN); Worldwide harmonised Light vehicles Test Cycle/Procedure (WLTC/P); 4 Wheel Drive (4WD).

Appendix A. Number of Tests and Distance Travelled for Each Vehicle and Tests Where DPF Regeneration Occurred

As shown in Table A1, the maximum mileage of the tested vehicles is below 30,000 km, while the minimum one is above 4500 km—excluding Vehicle 8 which did not undergo a DPF regeneration. At higher mileage, the ash quantity accumulated in the DPF increases, resulting in higher exhaust back pressure and, thus, higher fuel consumption, as well as to improved filtration efficiency. However, at this low mileage range of the tested vehicles, the impact is very low, as confirmed also by previous studies [12].
Table A1. Number of tests and corresponding distance travelled (including the preconditioning) on the chassis dynamometer and on the road.
Vehicle IDMileage at Start of Test Campaign [km]Number of Tests and Distance Travelled
Chassis DynoOn-Road
124,47318 tests—392.6 km9 tests—917.3 km
2481022 tests—393.7 km12 tests—1185.3 km
314,77133 tests—665.8 km11 tests—1028.2 km
4479226 tests—627 km8 tests—803 km
525,60241 tests—852.9 km13 tests—1297.1 km
629,17320 tests—272.4 km4 tests—436.2 km
723,12017 tests—309 km
87936 tests—733.0 km 10 tests—1015.0 km
Table A2. Total number of tests and tests with DPF regeneration (in parenthesis) for each vehicle.
Vehicle IDNEDCWLTCRDE 1RDE 2MotorwayHilly
113 (1)53 (1)22 (1)2
2175 (1)6 (2)51
325 (1)85 (2)321
413134 (1)4
52120 (1)36 (1)2 (2)2
620 (1)4
713 (1)4
820164411

Appendix B. Absolute Impact of DPF Regeneration on Emissions

The tables below summarise the absolute emission levels (in the form of emission factors) and are formulated as follows:
  • Table A3: Emissions of the complete tests with DPF regeneration
  • Table A4: Emissions during the DPF regeneration only
  • Table A5: Emissions of the complete tests without DPF regeneration
  • Table A6: Emissions of the tests without DPF regeneration during the regeneration phase of the equivalent tests, i.e., what would be the emissions of the vehicle during the regeneration phase if regeneration did not occur
These data were used for the calculation of the percentage differences presented in Table 3. In the cases where more than one regeneration took place, the respective ranges are presented in Table A3 and Table A4 (for the emissions and the duration of the regeneration), instead of single values. In Table A5, the average values of all the repetitions without DPF regeneration are presented. In Table A6, the ranges presented in on-road CO2 and NOx emissions correspond to the emission levels of the tests without regeneration during the regeneration phase of the equivalent tests. Vehicle 2, which has the most sophisticated emission control system (cf. Table 1) presented the lowest NOx emissions in normal operation (i.e., without DPF regeneration), both in the laboratory and on the road (Table A5 and Table A6). The combination of EGR, SCR and LNT kept NOx emissions at the lowest levels, compared to the other vehicles, even in the tests with DPF regeneration (Table A3). Deactivation of the control system during the DPF regeneration (e.g., by closing the EGR valve, pausing urea injection in the SCR and without any LNT purging) led to significant increase in NOx emissions (Table A4). This is the reason why very high percentage values are presented for this vehicle in Table 3. All vehicles were compliant with the PN Euro 6 limit of 6.0 × 10¹¹ (Table A5). Vehicle 3 remained compliant with the limit even in the tests with DPF regeneration (Table A3 and Table A4). This can be attributed to several reasons, such as a very efficient filter, a partial regeneration or a low soot load at the point of triggering the regeneration. All other vehicles exceeded the PN limit in the laboratory tests with DPF regeneration (Table A3, PN emissions were not measured in the on-road tests).
Table A3. Actual CO2, NOx and PN emissions throughout the complete test cycle (chassis dyno)/trip (on-road) with DPF regeneration.
Vehicle IDDPF REG Frequency [km]DPF REG Duration
[s]/[km]
CO2 Emissions [g/km]NOx Emissions [mg/km]PN Emissions
[#/km]
Chassis DynoOn-RoadChassis DynoOn-RoadChassis DynoOn-RoadChassis DynoOn-Road
1406–500710 s/8.3 km625–957 s
16.0–29.1 km
244.1166.4–187.3447.2228.1–341.93.6 × 1012
2469–593805 s/14.8 km798–996 s
7.7–13.5 km
202.6147.9–155.9132.244.7–51.61.9 × 1012
3558–632306 s/5.9 km434–1874 s
14.3–21.3 km
166.2166.7436.1585.22.0 × 1011
4685 s/9.3 km159.5402.6
5326–3901025 s/12.1 km926 s/22.0 km190.2167.1258.4217.86.0 × 1012
6480895 s/5.2 km214.2397.91.6 × 1012
7600 s/8.0 km232.8591.42.2 × 1012
Table A4. Actual CO2, NOx and PN emissions during the DPF regeneration period only.
Vehicle IDDPF REG Frequency [km]DPF REG Duration
[s]/[km]
CO2 Emissions [g/km]NOx Emissions [mg/km]PN Emissions
[#/km]
Chassis DynoOn-RoadChassis DynoOn-RoadChassis DynoOn-roadChassis DynoOn-Road
1406–500710 s/8.3 km625–957 s
16.0–29.1 km
261.9182.5–230.2536.5443.5–685.14.6 × 1012
2469–593805 s/14.8 km798–996 s
7.7–13.5 km
236.2222.0–285.5175.2271.2–404.52.9 × 1012
3558–632306 s/5.9 km434–1874 s
14.3–21.3 km
165.2263.4412.01837.65.4 × 1010
4685 s/9.3 km229.6
5326–3901025 s/12.1 km926 s/22.0 km225.2202.0437.7544.08.9 × 1012
6480895 s/5.2 km308.0705.32.8 × 1012
7600 s/8.0 km253.0785.13.3 × 1012
Table A5. Actual CO2, NOx and PN emissions throughout the complete test cycle (chassis dyno)/trip (on-road) without DPF regeneration.
Vehicle IDDPF REG Frequency [km]DPF REG Duration
[s]/[km]
CO2 Emissions [g/km]NOx Emissions [mg/km]PN Emissions
[#/km]
Chassis DynoOn-RoadChassis DynoOn-RoadChassis DynoOn-RoadChassis DynoOn-Road
1406–500710 s/8.3 km625–957 s
16.0–29.1 km
149.7146.1–175.276.0190.3–290.13.8 × 1010
2469–593805 s/14.8 km798–996 s
7.7–13.5 km
144.3142.717.539.31.7 × 1010
3558–632306 s/5.9 km434–1874 s
14.3–21.3 km
139.8154.0351.8561.91.5 × 1009
4685 s/9.3 km135.7368.0
5326–3901025 s/12.1 km926 s/22.0 km141.1158.057.7100.51.5 × 1009
6480895 s/5.2 km129.3194.91.7 × 1009
7600 s/8.0 km158.9382.25.4 × 1009
Table A6. Actual CO2, NOx and PN emissions of tests without DPF regeneration during the regeneration phase of the equivalent tests.
Vehicle IDDPF REG Frequency [km]DPF REG Duration
[s]/[km]
CO2 Emissions [g/km]NOx Emissions [mg/km]PN Emissions
[#/km]
Chassis DynoOn-RoadChassis DynoOn-RoadChassis DynoOn-RoadChassis DynoOn-Road
1406–500710 s/8.3 km625–957 s
16.0–29.1 km
146.4134.6–173.769.4162.3–373.23.5 × 1010
2469–593805 s/14.8 km798–996 s
7.7–13.5 km
147.8139.3–149.914.76.6–11.51.1 × 1010
3558–632306 s/5.9 km434–1874 s
14.3–21.3 km
116.2204.1113.21035.75.9 × 1011
4685 s/9.3 km135.6
5326–3901025 s/12.1 km926 s/22.0 km134.0150.637.277.01.7 × 1009
6480895 s/5.2 km143.2244.22.7 × 1009
7600 s/8.0 km156.9434.23.8 × 1009

References

  1. Hoffmann, B.; Roebbel, N.; Gumy, S.; Forastiere, F.; Brunekreef, B.; Jarosinska, D.; Walker, K.D.; van Erp, A.M.; O’Keefe, R.; Greenbaum, D.; et al. Air Pollution and Health: Recent Advances in Air Pollution Epidemiology to Inform the European Green Deal: A Joint Workshop Report of ERS, WHO, ISEE and HEI. Eur. Respir. J. 2020, 56, 2002575. [Google Scholar] [CrossRef] [PubMed]
  2. Hooftman, N.; Messagie, M.; Van Mierlo, J.; Coosemans, T. A Review of the European Passenger Car Regulations—Real Driving Emissions vs Local Air Quality. Renew. Sustain. Energy Rev. 2018, 86, 1–21. [Google Scholar] [CrossRef]
  3. Statista. Degree of Urbanisation (Percentage of Urban Population in Total Population) by Continent in 2020. Available online: https://0-www-statista-com.brum.beds.ac.uk/statistics/270860/urbanization-by-continent/ (accessed on 10 March 2022).
  4. Johnson, T. Vehicular Emissions in Review. SAE Int. J. Engines 2016, 9, 1258–1275. [Google Scholar] [CrossRef]
  5. Orihuela, M.P.; Gómez-Martín, A.; Miceli, P.; Becerra, J.A.; Chacartegui, R.; Fino, D. Experimental Measurement of the Filtration Efficiency and Pressure Drop of Wall-Flow Diesel Particulate Filters (DPF) Made of Biomorphic Silicon Carbide Using Laboratory Generated Particles. Appl. Therm. Eng. 2018, 131, 41–53. [Google Scholar] [CrossRef]
  6. Zhong, D.; He, S.; Tandon, P.; Moreno, M.; Boger, T. Measurement and Prediction of Filtration Efficiency Evolution of Soot Loaded Diesel Particulate Filters; SAE Technical Paper No. 2012-01-0363; SAE International: Warrendale, PA, USA, 2012. [Google Scholar]
  7. Majewsky, W.A.; Khair, M.K. Diesel Emissions and Their Control; SAE International: Warrendale, PA, USA, 2006; ISBN 978-0-7680-0674-2. [Google Scholar]
  8. Hirata, H.; Kakinohaha, M.; Ibe, M. Exhaust Gas Purification System Utilising Ozone. U.S. Patent 8,051,643, 8 November 2011. [Google Scholar]
  9. Hemmings, S.; Megaritis, A. Periodically Regenerating Diesel Particulate Filter with a Hydrogen/Carbon Monoxide Mixture Addition. Int. J. Hydrogen Energy 2012, 37, 3573–3584. [Google Scholar] [CrossRef]
  10. Leblanc, M.; Noël, L.; R’Mili, B.; Boréave, A.; D’Anna, B.; Raux, S. Impact of Engine Warm-up and DPF Active Regeneration on Regulated & Unregulated Emissions of a Euro 6 Diesel SCR Equipped Vehicle. J. Earth Sci. Geotech. Eng. 2016, 6, 29–50. [Google Scholar]
  11. Valverde, V.; Giechaskiel, B. Assessment of Gaseous and Particulate Emissions of a Euro 6d-Temp Diesel Vehicle Driven >1300 km Including Six Diesel Particulate Filter Regenerations. Atmosphere 2020, 11, 645. [Google Scholar] [CrossRef]
  12. Sappok, A.; Wong, V. Ash Effects on Diesel Particulate Filter Pressure Drop Sensitivity to Soot and Implications for Regeneration Frequency and DPF Control; SAE Technical Paper No. 2010-01-0811; SAE International: Warrendale, PA, USA, 2010; pp. pp. 1,3,5,12. [Google Scholar]
  13. Cui, Y.; Cai, Y.; Fan, R.; Shi, Y.; Gu, L.; Pu, X.; Tian, J. Effects of Residual Ash on DPF Capture and Regeneration. Int. J. Automot. Technol. 2018, 19, 759–769. [Google Scholar] [CrossRef]
  14. Jang, J.; Lee, Y.; Kwon, O. Comparison of Fuel Efficiency and Exhaust Emissions between the Aged and New DPF Systems of Euro 5 Diesel Passenger Car. Int. J. Automot. Technol. 2017, 18, 751–758. [Google Scholar] [CrossRef]
  15. Ko, J.; Myung, C.-L.; Park, S. Impacts of Ambient Temperature, DPF Regeneration, and Traffic Congestion on NOx Emissions from a Euro 6-Compliant Diesel Vehicle Equipped with an LNT under Real-World Driving Conditions. Atmos. Environ. 2019, 200, 1–14. [Google Scholar] [CrossRef]
  16. Dwyer, H.; Ayala, A.; Zhang, S.; Collins, J.; Huai, T.; Herner, J.; Chau, W. Emissions from a Diesel Car during Regeneration of an Active Diesel Particulate Filter. J. Aerosol Sci. 2010, 41, 541–552. [Google Scholar] [CrossRef]
  17. Chigada, P.I.; Ahmadinejad, M.; Newman, A.D.; Ng, A.I.P.; Torbati, A.; Watling, T.C. Impact of SCR Activity on Soot Regeneration and the Converse Effects of Soot Regeneration on SCR Activity on a Vana-Dia-SCRF®; SAE Technical Paper No. 2018-01-0962; SAE International: Warrendale, PA, USA, 2018. [Google Scholar]
  18. DieselNet. Selective Catalytic Reduction. Available online: https://dieselnet.com/tech/cat_scr.php (accessed on 11 October 2021).
  19. Papadopoulos, G.; Ntziachristos, L.; Tziourtzioumis, C.; Keramydas, C.; Lo, T.-S.; Ng, K.-L.; Wong, H.-L.A.; Wong, C.K.-L. Real-World Gaseous and Particulate Emissions from Euro IV to VI Medium Duty Diesel Trucks. Sci. Total Environ. 2020, 731, 139137. [Google Scholar] [CrossRef] [PubMed]
  20. Amanatidis, S.; Ntziachristos, L.; Giechaskiel, B.; Bergmann, A.; Samaras, Z. Impact of Selective Catalytic Reduction on Exhaust Particle Formation over Excess Ammonia Events. Environ. Sci. Technol. 2014, 48, 11527–11534. [Google Scholar] [CrossRef] [PubMed]
  21. Krajinska, A. New Diesels, New Problems; Transport & Environment: Brussels, Belgium, 2020. [Google Scholar]
  22. Giechaskiel, B. Particle Number Emissions of a Diesel Vehicle during and between Regeneration Events. Catalysts 2020, 10, 587. [Google Scholar] [CrossRef]
  23. Su, S.; Lv, T.; Lai, Y.; Mu, J.; Ge, Y.; Giechaskiel, B. Particulate Emissions of Heavy Duty Diesel Engines Measured from the Tailpipe and the Dilution Tunnel. J. Aerosol Sci. 2021, 156, 105799. [Google Scholar] [CrossRef]
  24. Samaras, Z.; Rieker, M.; Papaioannou, E.; van Dorp, W.F.; Kousoulidou, M.; Ntziachristos, L.; Andersson, J.; Bergmann, A.; Hausberger, S.; Keskinen, J.; et al. Perspectives for Regulating 10nm Particle Number Emissions Based on Novel Measurement Methodologies. J. Aerosol Sci. 2022, 162, 105957. [Google Scholar] [CrossRef]
  25. Samaras, Z.; Andersson, J.; Bergmann, A.; Hausberger, S.; Toumasatos, Z.; Keskinen, J.; Haisch, C.; Kontses, A.; Ntziachristos, L.; Landl, L.; et al. Measuring Automotive Exhaust Particles Down to 10 nm; European Commission: Brussels, Belgium, 2020; p. 12. [Google Scholar]
  26. Chasapidis, L.; Melas, A.D.; Tsakis, A.; Zarvalis, D.; Konstandopoulos, A. A Sampling and Conditioning Particle System for Solid Particle Measurements Down to 10 nm; SAE Technical Paper 2019-24-0154; SAE International: Warrendale, PA, USA, 2020. [Google Scholar]
  27. Toumasatos, Z.; Raptopoulos-Chatzistefanou, A.; Kolokotronis, D.; Pisitkopoulos, P.; Samaras, Z.; Ntziachristos, L. The Role of the Driving Dynamics beyond RDE Limits and DPF Regeneration Events on Pollutant Emissions of a Euro 6d-Temp Passenger Vehicle. J. Aerosol Sci. 2022, 161, 105947. [Google Scholar] [CrossRef]
  28. Mamakos, A.; Martini, G.; Manfredi, U. Assessment of the Legislated Particle Number Measurements Procedure for a Euro 5 and a Euro 6 Compliant Diesel Passenger Cars under Regulated and Unregulated Conditions. J. Aerosol Sci. 2013, 55, 31–47. [Google Scholar] [CrossRef]
  29. Giechaskiel, B.; Melas, A.; Martini, G.; Dilara, P.; Ntziachristos, L. Revisiting Total Particle Number Measurements for Vehicle Exhaust Regulations. Atmosphere 2022, 13, 155. [Google Scholar] [CrossRef]
  30. Bikas, G.; Zervas, E. Regulated and Non-Regulated Pollutants Emitted during the Regeneration of a Diesel Particulate Filter. Energy Fuels 2007, 21, 1543–1547. [Google Scholar] [CrossRef]
  31. Beatrice, C.; Costagliola, M.A.; Guido, C.; Napolitano, P.; Prati, M.V. How Much Regeneration Events Influence Particle Emissions of DPF-Equipped Vehicles? SAE Technical Paper 2017-24-0144; SAE International: Warrendale, PA, USA, 2017. [Google Scholar]
  32. Chappell, E.; Burke, R.; Lu, P.; Gee, M.; Williams, R. Analysis of a Diesel Passenger Car Behavior On-Road and Over Certification Duty Cycles; SAE Technical Paper 2016-01-2328; SAE International: Warrendale, PA, USA, 2016. [Google Scholar]
  33. Giechaskiel, B.; Munoz-Bueno, R.; Rubino, L.; Manfredi, U.; Dilara, P.; De Santi, G.; Andersson, J. Particle Measurement Programme (PMP):Particle Size and Number Emissions Before, During and After Regeneration Events of a Euro 4 DPF Equipped Light-Duty Diesel Vehicle; SAE Technical Paper 2007-01-1944; SAE International: Warrendale, PA, USA, 2007. [Google Scholar]
  34. CLOVE Consortium. CLOVE Presentation on Proposals for Future LDV Exhaust Emission Standards in the 9th AGVES Meeting. 2021. Available online: https://circabc.europa.eu/ui/group/f57c2059-ef63-4baf-b793-015e46f70421/library/83a09cc8-7f8f-4ca6-9764-0b77da57d4cc/details (accessed on 10 March 2022).
  35. ICCT. European Vehicle Market. Statistics—Pocketbook 2021/22; International Council on Clean Transportation: Washington, DC, USA, 2021. [Google Scholar]
  36. EEA. Monitoring of CO2 Emissions from Passenger Cars—Regulation (EU) 2019/631. Available online: https://www.eea.europa.eu/data-and-maps/data/co2-cars-emission-20 (accessed on 10 March 2022).
  37. Clairotte, M.; Valverde, V.; Bonnel, P.; Giechaskiel, B.; Carriero, M.; Otura, M.; Fontaras, G.; Pavlovic, J.; Martini, G.; Krasenbrink, A.; et al. Joint Research Centre 2017 Light-Duty Vehicles Emissions Testing—Contribution to the EU Market. Surveillance: Testing Protocols and Vehicle Emissions Performance; European Commission, Joint Research Centre: Ispra, Italy, 2018. [Google Scholar]
  38. Tsiakmakis, S.; Fontaras, G.; Ciuffo, B.; Samaras, Z. A Simulation-Based Methodology for Quantifying European Passenger Car Fleet CO2 Emissions. Appl. Energ. 2017, 199, 447–465. [Google Scholar] [CrossRef]
  39. Haralampous, O.A.; Kandylas, I.P.; Koltsakis, G.C.; Samaras, Z.C. Diesel Particulate Filter Pressure Drop Part 2: Onboard Calculation of Soot Loading. Int. J. Engine Res. 2004, 5, 163–173. [Google Scholar] [CrossRef]
  40. Valverde, V.; Clairotte, M.; Pavlovic, J.; Giechaskiel, B.; Bonnel, P. On-Road Emissions of Euro 6d-TEMP Vehicles: Consequences of the Entry into Force of the RDE Regulation in Europe; SAE International: Warrendale, PA, USA, 2020. [Google Scholar]
  41. Rose, K.; Hamje, H.; Janses, L.; Fittavolini, C.; Clark, R.; Cardenas Almena, M.D.; Katsaounis, D.; Samaras, C.; Geivanidis, S.; Samaras, Z. Impact of FAME Content on the Regeneration Frequency of Diesel Particulate Filters (DPFs). SAE Int. J. Fuels Lubr. 2014, 7, 563–570. [Google Scholar] [CrossRef] [Green Version]
  42. Li, T.; Ogawa, H. Analysis of the Trade-Off between Soot and Nitrogen Oxides in Diesel-Like Combustion by Chemical Kinetic Calculation; SAE Technical Paper 2011-01-1847; SAE International: Warrendale, PA, USA, 2011. [Google Scholar]
  43. Dimitriadis, A.; Natsios, I.; Dimaratos, A.; Katsaounis, D.; Samaras, Z.; Bezergianni, S.; Lehto, K. Evaluation of a Hydrotreated Vegetable Oil (HVO) and Effects on Emissions of a Passenger Car Diesel Engine. Front. Mech. Eng. 2018, 4, 7. [Google Scholar] [CrossRef] [Green Version]
  44. Yamada, H. PN Emissions from Heavy-Duty Diesel Engine with Periodic Regenerating DPF; SAE Technical Paper 2013-01-1564; SAE International: Warrendale, PA, USA, 2013. [Google Scholar]
  45. Karamitros, D.; Koltsakis, G. Model-Based Optimisation of Catalyst Zoning on SCR-Coated Particulate Filters. Chem. Eng. Sci. 2017, 173, 514–524. [Google Scholar] [CrossRef]
  46. Meng, Z.; Chen, C.; Li, J.; Fang, J.; Tan, J.; Qin, Y.; Jiang, Y.; Qin, Z.; Bai, W.; Liang, K. Particle Emission Characteristics of DPF Regeneration from DPF Regeneration Bench and Diesel Engine Bench Measurement. Fuel 2020, 262, 116589. [Google Scholar] [CrossRef]
  47. Tong, Y.; Tan, J.; Meng, Z.; Chen, Z.; Tan, L. Experimental Investigation on the DPF High-Temperature Filtration Performance under Different Particle Loadings and Par-Ticle Deposition Distributions. Processes 2021, 9, 1465. [Google Scholar] [CrossRef]
  48. Giechaskiel, B.; Komnos, D.; Fontaras, G. Impacts of Extreme Ambient Temperatures and Road Gradient on Energy Consumption and CO2 Emissions of a Euro 6d-Temp Gasoline Vehicle. Energies 2021, 14, 6195. [Google Scholar] [CrossRef]
Figure 1. Velocity and altitude profiles on the routes followed during on-road testing. (a) RDE 1 route, (b) RDE 2 route, (c) motorway route, (d) hilly route.
Energies 15 05070 g001
Figure 2. Identification of active DPF regeneration with detailed ECU and OBD data, (top): injection strategy during regeneration at steady-state operation, (bottom): engine and vehicle parameters during on-road driving with regeneration.
Energies 15 05070 g002
Figure 3. Indicative example of the identification of active DPF regeneration in WLTC testing. (a) Tailpipe temperature, (b) CO2 emissions, (c) NOx emissions, (d) PN emissions (the case without DPF REG is hardly visible due to the very low PN levels).
Energies 15 05070 g003
Figure 4. Correlation of tailpipe temperature with altitude for various driving conditions. (Left): Impact of DPF regeneration, vehicle mode, uphill driving, dynamic driving. (Right): Impact of payload, dynamic driving, uphill driving with a low-powered LCV.
Energies 15 05070 g004
Figure 5. Indicative example of incomplete (partial) DPF regeneration in NEDC testing. (Left): Tailpipe temperature. (Right): PN emissions (the case without DPF REG is hardly visible due to the very low PN levels).
Energies 15 05070 g005
Figure 6. Tailpipe and lambda profiles during the motorway route with DPF regeneration.
Energies 15 05070 g006
Figure 7. Instantaneous (left) and cumulative (right) PN emissions before, during and immediately after DPF regeneration.
Energies 15 05070 g007
Figure 8. Tailpipe temperature during the DPF regeneration events of Vehicle 3 in different repetitions of the RDE 1 profile.
Energies 15 05070 g008
Figure 9. Consecutive DPF regenerations, as determined with the tailpipe temperature, used for the determination of the regeneration frequency.
Energies 15 05070 g009
Figure 10. Ki factor for CO2 and NOx emissions, calculated in the test campaign, and comparison with official values (for CO2).
Energies 15 05070 g010
Figure 11. Instantaneous NOx emissions during testing of Vehicle 6.
Energies 15 05070 g011
Figure 12. NOx EF for the regeneration period (left) and for the complete regeneration interval (right).
Energies 15 05070 g012
Figure 13. Efficiency versus specific wheel energy (left) and impact of other energy consumptions (right).
Energies 15 05070 g013
Table 1. Specifications of the tested vehicles [37].
Vehicle IDVehicle Class/SegmentEmissions StandardEmission Control SystemEngine Capacity [l]Rated Power [kW]Transmission/Drivetrain
1M1/CEuro 6bEGR + DOC + LNT + DPF2.0110AT6/FWD
2M1/EEuro 6bEGR + DOC + LNT + DPF + SCR3.0195AT8/RWD
3M1/J (SUV)Euro 6bEGR + DOC + LNT + DPF1.785MT6/FWD
4M1/J (SUV) Euro 6bEGR + DOC + SCR + DPF1.673MT5/FWD
5M1/CEuro 6bEGR + DOC + LNT + DPF2.0110AT6/FWD
6M1/J (SUV)Euro 5bEGR + DOC + DPF2.0130AT7/FWD
7M1/J (SUV)Euro 5bEGR + DOC + DPF2.0103MT6/4WD
8N1—IIEuro 6bEGR + DOC + SCR + DPF1.673MT5/FWD
Table 2. Characteristics of the tested driving profiles.
TestDistance [km]Duration [min]Average/Maximum Speed [km/h]Average Positive Acceleration [m/s2]v × a_95% [W/kg]RPA [m/s2]Positive Elevation Gain [m/100 km]
NEDC11.019.733.6/1200.1318.20.1110
WLTC23.330.046.6/131.30.17412.60.1450
RDE 194.3107.352.7/139.40.33615.50.128740
RDE 279.396.849.1/135.10.34515.30.140645
Motorway139.5143.258.4/135.80.30616.40.112363
Hilly62.3109.234.2/62.50.3588.80.1611636
Table 3. Impact of DPF regeneration on CO2, NOx and PN emissions throughout the complete test/during the regeneration period only. The calculations are made by comparing the tests with and without regeneration. The distance and duration of the laboratory tests were 11–23 km or 20–30 min approximately. The distance and duration of the on-road tests were around 80–140 km and 1.5–2.5 h approximately.
Vehicle IDDPF REG Interval (Frequency) [km]DPF REG Duration [s]/[km]CO2 Emissions Increase [%]NOx Emissions Increase [%]PN Emissions Increase
[×Times]
Chassis DynoOn-RoadChassis DynoOn-RoadChassis DynoOn-RoadChassis DynoOn-Road
1406–500710 s/8.3 km625–957 s
16.0–29.1 km
63%/79%7–14%/33–36%488%/673%18–20%/
82–173%
×95/×131
2469–593805 s/14.8 km798–996 s
7.7–13.5 km
41%/60%4–9%/59–90%774%/1095%14–31%/
3417–4009%
×106/×267
3558–632306 s/5.9 km434–1874 s
14.3–21.3 km
22%/42%8%/29%51%/264%4%/77%×43/×92
4685 s/9.3 km18%/69%9%/―
5326–3901025 s/12.1 km926 s/22.0 km36%/68%6%/34%350%/1075%117%/606%×4092/×5372
6480895 s/5.2 km64%/115%95%/189%×476/×1049
7600 s/8.0 km47%/61%55%/81%×5/×876
8No DPF regenerations observed
Table 4. Conditions during the DPF regeneration events of Vehicle 3 in different repetitions of the RDE 1 profile.
CaseDuration [s]Distance [km]Average Speed [km/h]Average Tailpipe Temperature [°C]Average Exhaust Mass Flow [kg/h]Cumulative Fuel
Consumed [l]
Average EGR [%]
A: DPF REG in
Motorway part
43414.3118.6250208.51.53 (+23%)3.5%
C: No DPF REG Motorway part42414.3125.6166200.81.2434%
B: DPF REG in
Urban + Rural parts
187421.341.015566.71.77 (+55%)1.5%
C: No DPF REG
Urban + Rural parts
192121.339.98359.41.1421%
Table 5. CO2 emissions [g/km] during DPF regeneration under different operating conditions.
Driving Profilew/o DPF REGw/DPF REGChange
Vehicle 1
NEDC146.4261.978%
RDE 1173.7230.233%
Vehicle 3
RDE 1—Motorway (A) ‐204.1263.429%
RDE 1—Urban + Rural (B)132.2179.035%
Publisher’s Note: MDPI stays neutral with regard to jurisdictional claims in published maps and institutional affiliations.

