
Study on Heating and Cooling Performance of Air-to-Water Heat Pump System for Protected Horticulture


1
Smart Agriculture Innovation Center, Kyungpook National University, Daegu 41566, Korea
2
Department of Horticulture Environment System, Korea National University of Agriculture and Fisheries, 1515, Kongjwipatjwi-ro, Deokjin-gu, Jeonju-si 54874, Korea
3
Department of Bio-Industrial Machinery Engineering, Gyeongsang National University, Jinju 660701, Korea
4
Department of Agricultural Engineering, Kyungpook National University, Daegu 41566, Korea
*
Author to whom correspondence should be addressed.
†
These authors contributed equally to this work.
Energies 2022, 15(15), 5467; https://0-doi-org.brum.beds.ac.uk/10.3390/en15155467
Submission received: 7 July 2022
/
Revised: 26 July 2022
/
Accepted: 27 July 2022
/
Published: 28 July 2022
(This article belongs to the Topic Emerging Agricultural Engineering Sciences, Technologies, and Applications)
Abstract
:There is much interest in alternative energy sources for greenhouse heating and cooling, due to the impact of severe climatic conditions and increasing fossil fuel prices. The main objective of this study was to experimentally evaluate the performance of an air-to-water heat pump (AWHP) system to fulfil the cooling and heating energy requirements of a three-spanned greenhouse under local weather conditions in Daegu, South Korea. For this purpose, a system comprising three air-to-water heat pumps, a water storage tank, and fan coil units (FCU)s was designed. Experiments were conducted extensively during the summer and winter seasons. The maximum heating and cooling energy supply to the greenhouse was 210 kcal∙h−1∙m−2 and 230 kcal∙h−1∙m−2, respectively. Based on the outcomes of this study, the AWHP system can provide heating during the winter season. During the summer season, the FCU capacity was insufficient to provide the desired cooling to achieve the setpoint air temperature inside the studied greenhouse. To achieve the desired microclimate during the summer season, the capacity of the FCU or number of FCUs must be increased. Moreover, one AWHP with a water storage tank, was sufficient to provide the required cooling and heating in both seasons. Two additional AWHPs can be used to provide energy to more greenhouse areas in the future. The results can be used as a case study to find a more resilient and reliable source for greenhouse heating and cooling. The average COP of the AWHP in heating mode was 2.2, while on cooling mode, it was 3.2.
1. Introduction
Over the last several decades, greenhouse farming has grown rapidly in many countries, including South Korea, where open farming is not possible due to harsh climatic conditions in both winter and summer. Moreover, in recent years, other forms of controlled environment agriculture (CEA) have emerged, including plant factory vertical farming, rooftop greenhouses, and building integrated cropping facilities. The primary objective of CEA is to achieve year-round crop production. In winter, the internal temperature of the CEA decreases, especially during the night, and in summer, the temperature increases to the optimum range for crop growth. To address this issue, different heating and cooling systems are used inside CEA facilities. Fossil fuels are mostly used for this purpose. In addition to this, globally, other sectors also use fossil fuels to satisfy the energy demand. According to a recent report, the energy demand of the world food chain is 30% of the global energy demand, which is currently met by fossil fuels [1]. Moreover, the global population is expected to reach 9.8 billion by 2050 [2]. There is a surge in energy and food demand because of the growing population; therefore, these are areas that should be focused on to help achieve global sustainability. Worldwide increases in oil prices are also a major concern. Moreover, the utilization of fossil fuels not only raises production costs but also causes CO2 emissions and environmental pollution [3,4]. One of the reports recently showed that the greenhouse energy supplying costs have increased to 45% of the total production costs in South Korea [5]. The increasing cost is due to the continually increasing oil prices and high energy demands. To cope with these issues, like other countries, the South Korean government is also promoting the use of renewable energy sources in various sectors [6].
Many studies have reported that the use of heat pumps could be a good option for greenhouse heating and cooling [7,8,9]. Ground source heat pumps (GSHP) are widely used for greenhouse heating and cooling, and they are more efficient in terms of the coefficient of performance (COP) than air source heat pumps [10,11,12,13]. There have been several studies carried out relating to ground source heat pumps integrated with other systems. Kim et al. [14] used a heat pump and exhausted heat from a power plant to provide energy to a greenhouse and compared it with a conventional boiler and reported the economic feasibility of the system. In one study, Yildirim et al. [15] evaluated a GSHP system assisted with solar photovoltaic panels to fulfil the heating and cooling energy demand of a greenhouse. Boughanmi et al. [16] analyzed the COP of a new conic helicoidal geothermal heat exchanger with a GSHP to provide heat energy to a greenhouse. Hassanien et al. [17] analyzed a ground source heat pump system with a solar-assisted water heater. The focus of these studies was to provide year-round efficient energy supply to the greenhouse.
On the other hand, because of the easy installation and comparatively low cost of air source heat pumps, they could also be a viable option to provide the required energy to greenhouses. Their use is also increasing worldwide in the building sector [18]. The air source heat pump offers a 40% reduction in installation cost as compared with the ground source heat pump [19]. Many other studies have mentioned that the use of an air source heat pump could be of great interest due to its many other advantages, such as simple operation, low maintenance, and no pollution [20,21,22]. The heat pumps use less energy to generate thermal outputs that are several times higher than GSHPs [23]. In addition, to reduce their impact on global warming and ozone depletion, they have now started to use natural refrigerants [24]. Air source heat pumps draw and expel heat from the outside air during the heating and cooling seasons, respectively. Air-source heat pumps are categorized into two types: air-to-air heat pumps (AAHP) and air-to-water heat pumps (AWHP). In two previous studies, [25,26] we proposed an AWHP model for greenhouse heating and cooling. These studies were limited to model creation and validation using the TRNSYS program. Aye et al. [27] studied the performance of an AWHP system in the heating mode. The study used a modeling-based assessment of the system to provide heat energy to greenhouses under weather conditions in Melbourne, Australia, and reported a 16% reduction in energy consumption with a 6-year payback period. Moon et al. [28] investigated the heating performance of an AWHP system with a storage tank for greenhouse heating by calculating the COP of the system. In a recent study, Lim et al. [29] performed an economic analysis of an AWHP system in the heating mode. The results forecast an average COP of 4.5 and 70% reduction in energy cost when compared with a conventional air heating system.
From the above-presented review of the literature, we can conclude that the studies that analyze a particular AWHP for the use of greenhouse heating and cooling under specific weather conditions are lacking. Many AWHP with different configurations are available in the market, and studies have shown that the COP depends on different parameters, including the AWHP used, greenhouse design and area, control system, and local weather conditions. Therefore, in this study, efforts have been made to study a specific AWHP to provide cooling and heating energy to greenhouses under local weather conditions. The main objective of this study was to conduct an investigation of the AWHP system equipped with a water storage tank, heat pump, and fan coil unit to fulfill the energy requirement of the integrated greenhouse. The investigation was conducted in terms of energy performance of the system, keeping in mind that to reduce the energy cost efficiently, all the components should be designed properly. The AWHP system was tested in both cooling and heating modes. A feasibility analysis of the studied systems was conducted to fulfil the energy cooling and heating requirements of a three-spanned greenhouse under local weather conditions in Daegu, South Korea. This study aimed to find a more reliable and resilient source for heating and cooling of greenhouses. The COP of the AWHP was computed separately from the measured data for both the heating and cooling seasons.
2. Materials and Methods
2.1. Experimental Greenhouse
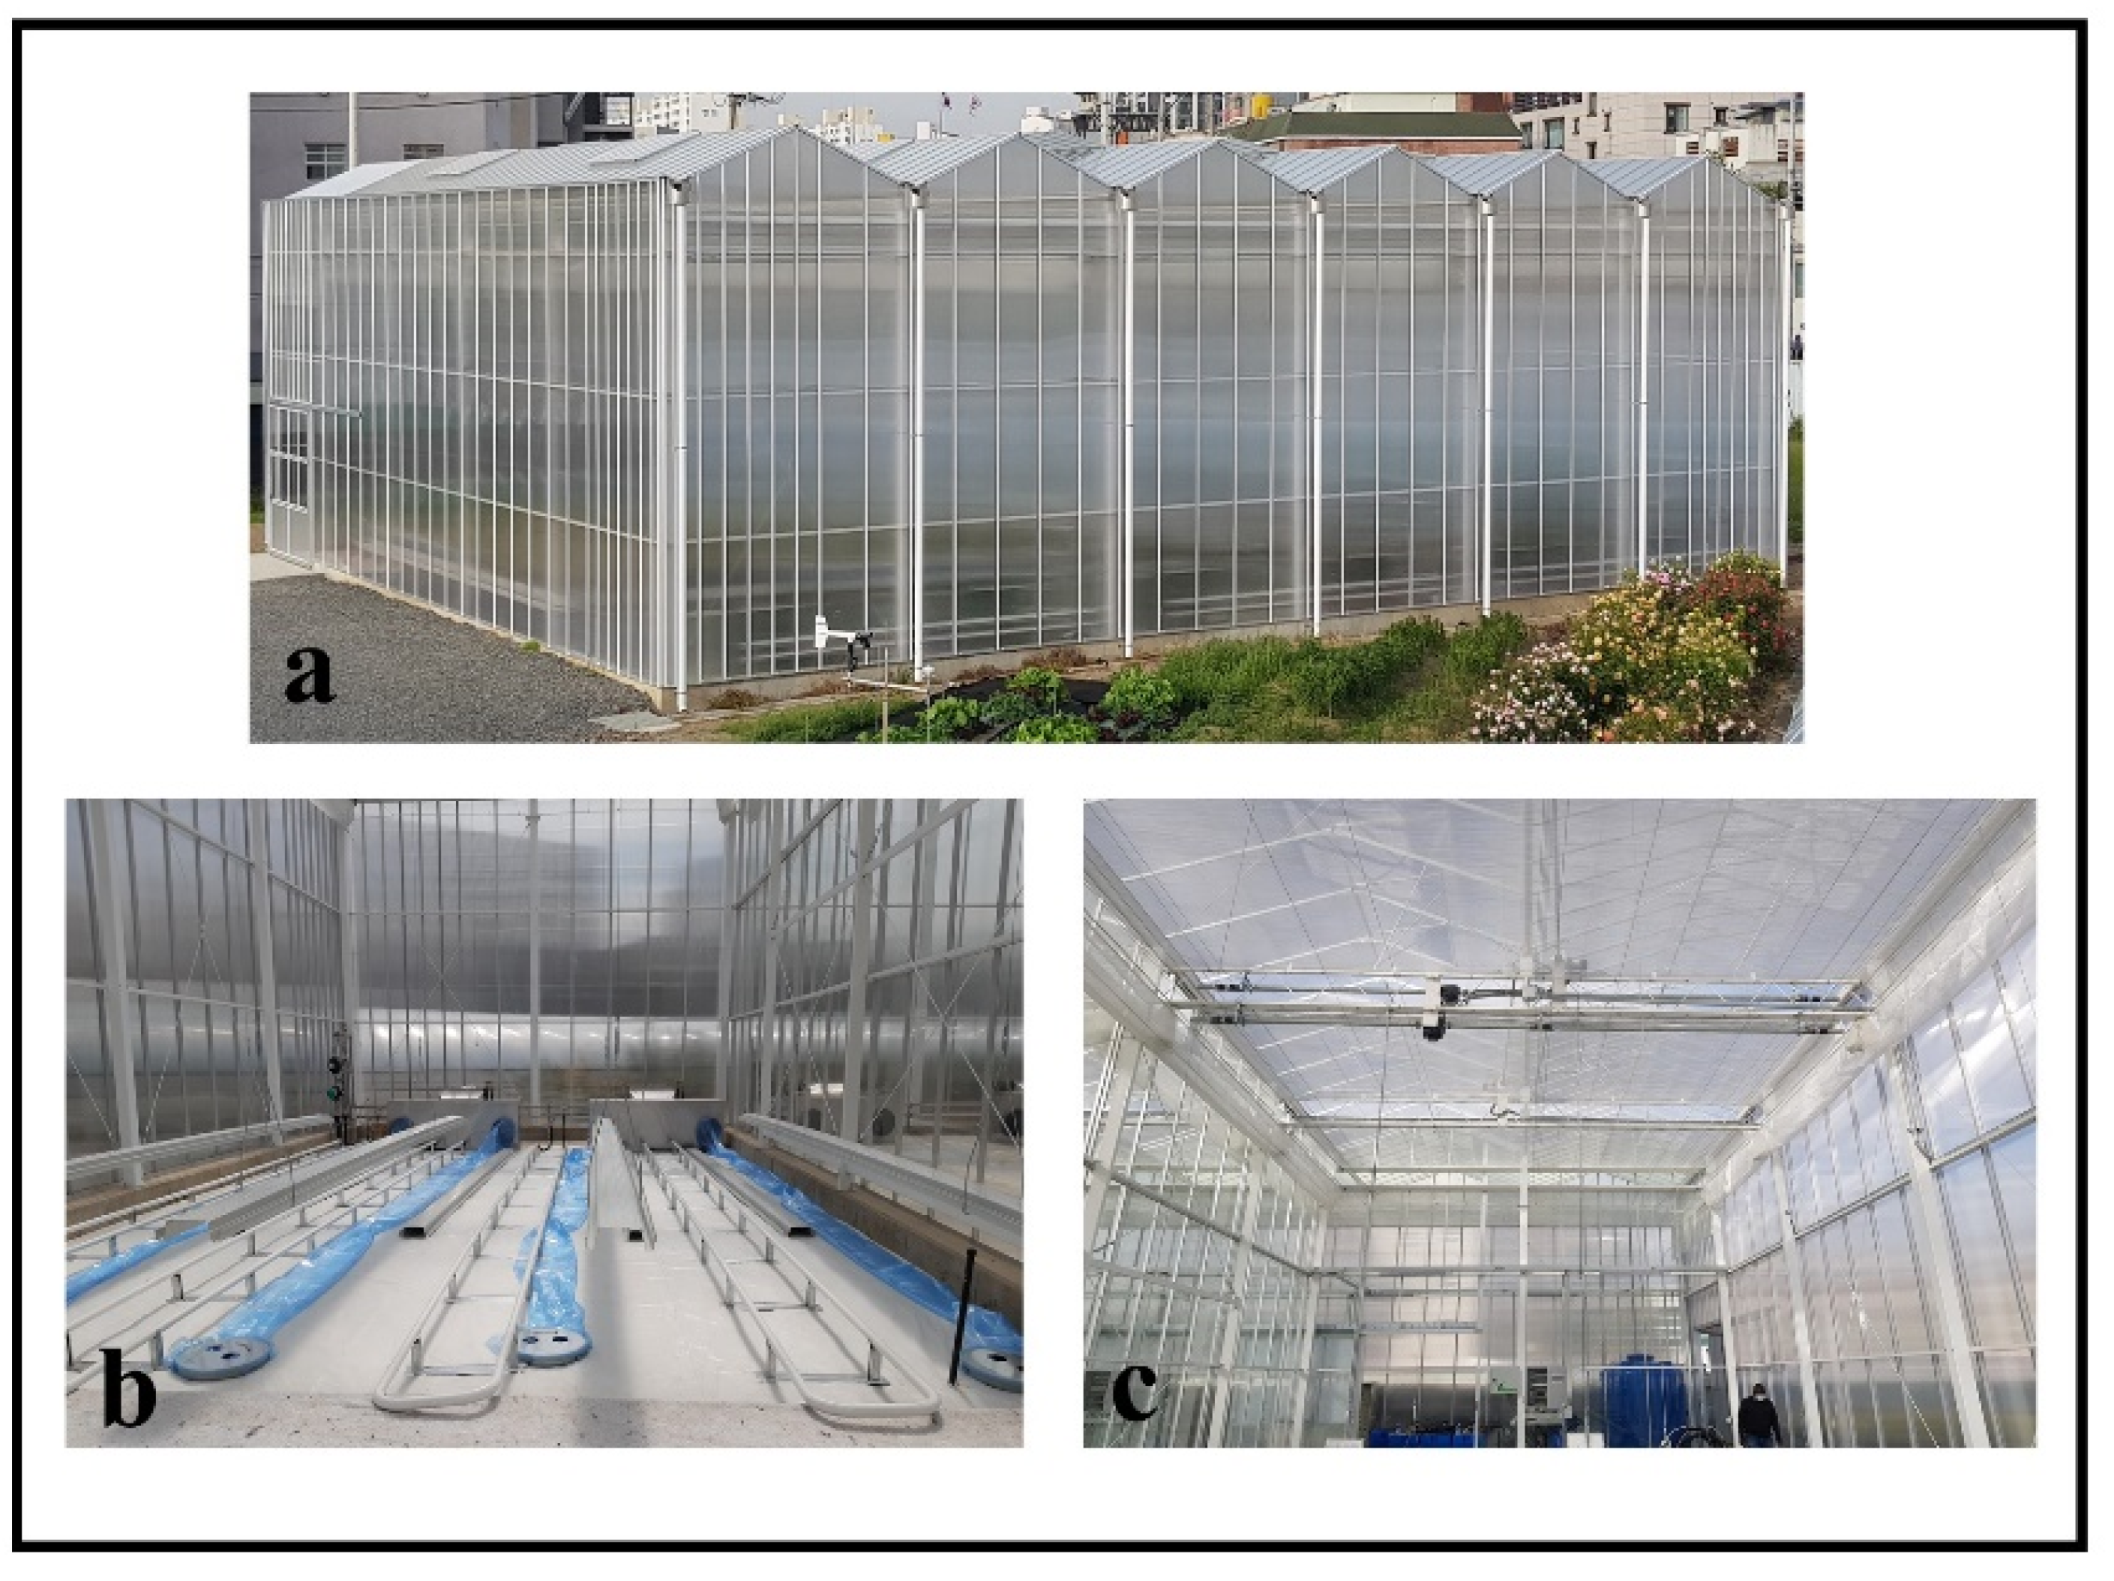
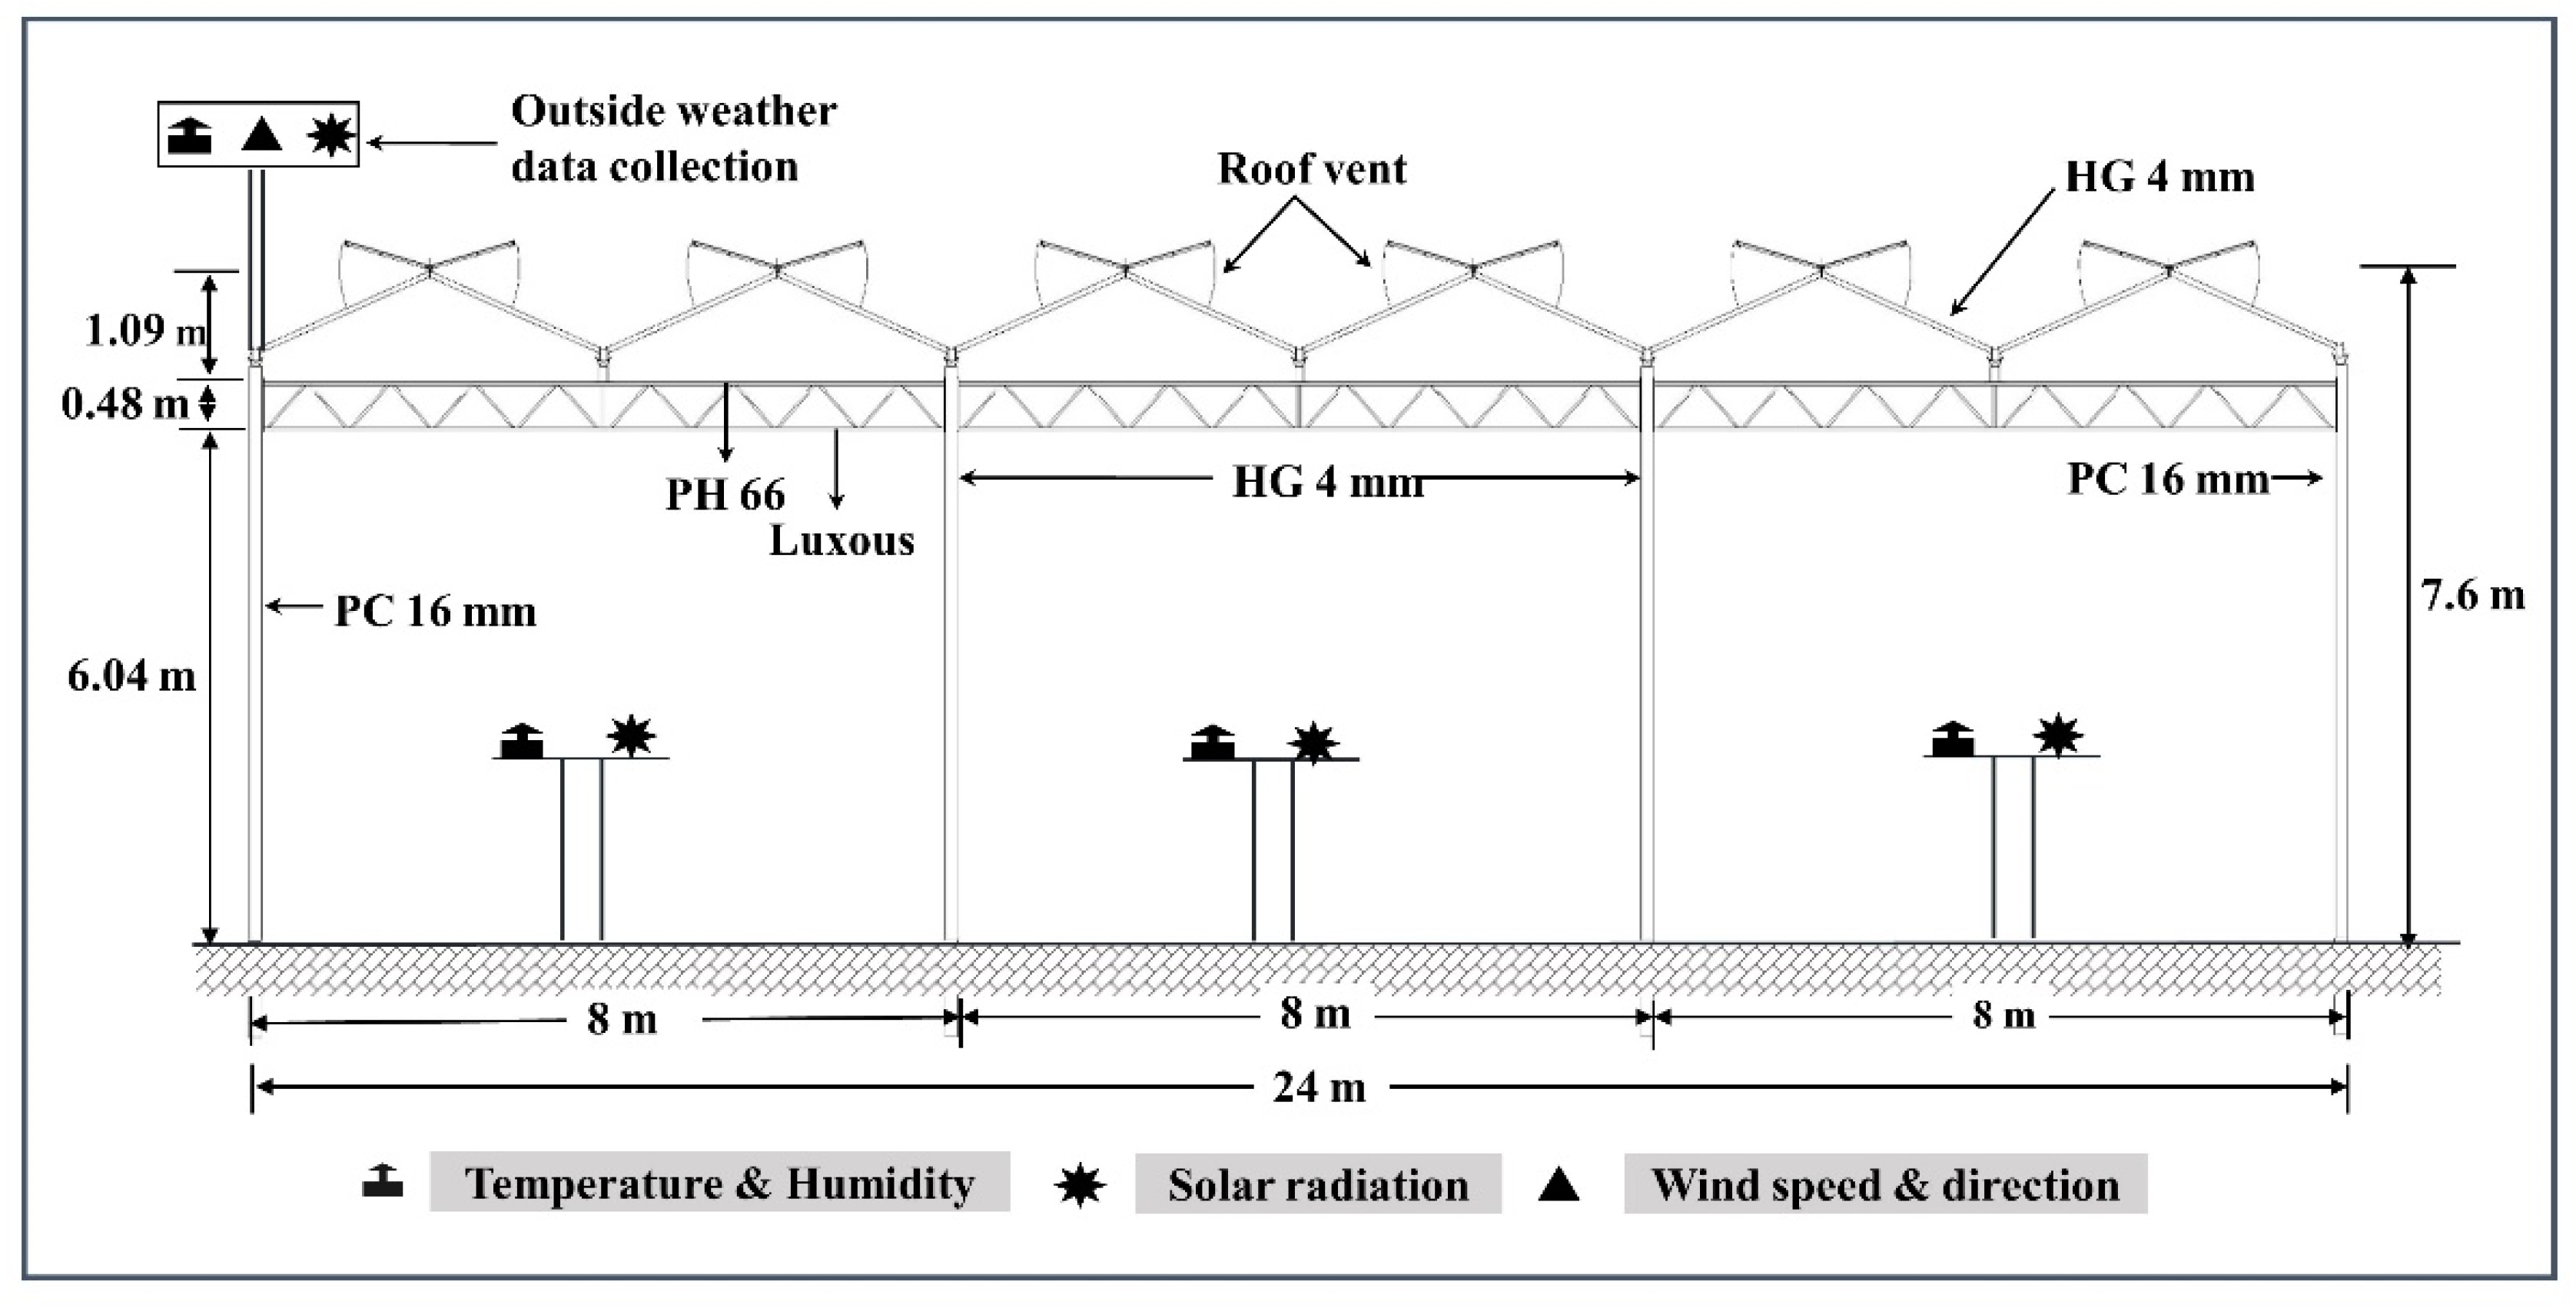
The field analyses were conducted with a greenhouse located at Kyungpook National University, Daegu, South Korea (latitude 35.53° N, longitude 128.36° E, elevation 48 m). The experimental greenhouse was a three-span, Venlo-roofed, north–south (N-S) oriented, rectangular, greenhouse with a total floor area of 391.2 m2 (length × width × height of 24 m × 16.3 m × 7.6 m). In addition, three equal sections were created in the greenhouse to create distinct climatic conditions for the different experiments. The created sections do not have any effect on heat supplying systems. The dimensions of each section were 8 m × 16.3 m × 7.6 m, with a floor area of 130.4 m2 each. Figure 1a–c shows the field picture of the (a) experimental greenhouse, (b) inside view greenhouse partition, and (c) installed energy screens. The sidewalls were covered with polycarbonate (PC, 16 mm), and the middle wall and roof were covered with horticultural glass (HG, 4 mm). The weather data, including air temperature, was measured using a Ridder MTV sensor unit, and solar radiation was measured using Hukseflux SR05-D2A2-TMBL (Hukseflux, Delft, The Netherlands) sensors, positioned inside and outside of the greenhouse. The data were recorded from 1 June, 2021 to 31 March 2022 for the cooling and heating analysis. As a passive energy-saving technique, a shading screen (commercial name, PH-66) was used to reflect excessive solar radiation during the daytime in the summer season, and two energy screens (commercial name, PH-66 and Luxous) were used in the winter season during the nighttime, positioned under the roof of the greenhouse, to reduce heat loss to outside weather. The shading and energy screen deployment and retraction were subject to automatic control when the outside solar radiation intensity was >430 kcal·h−1·m−2 and >35 kcal·h−1·m−2 during the summer and winter seasons, respectively. Figure 2 provides a detailed view of the experimental greenhouse dimensions and the construction and location of the sensors. Furthermore, only roof vents were used for natural ventilation in the greenhouse. The opening and closing of the ventilation windows were controlled automatically with the internal air temperature of the greenhouse maintained at 30 °C.
2.2. AWHP
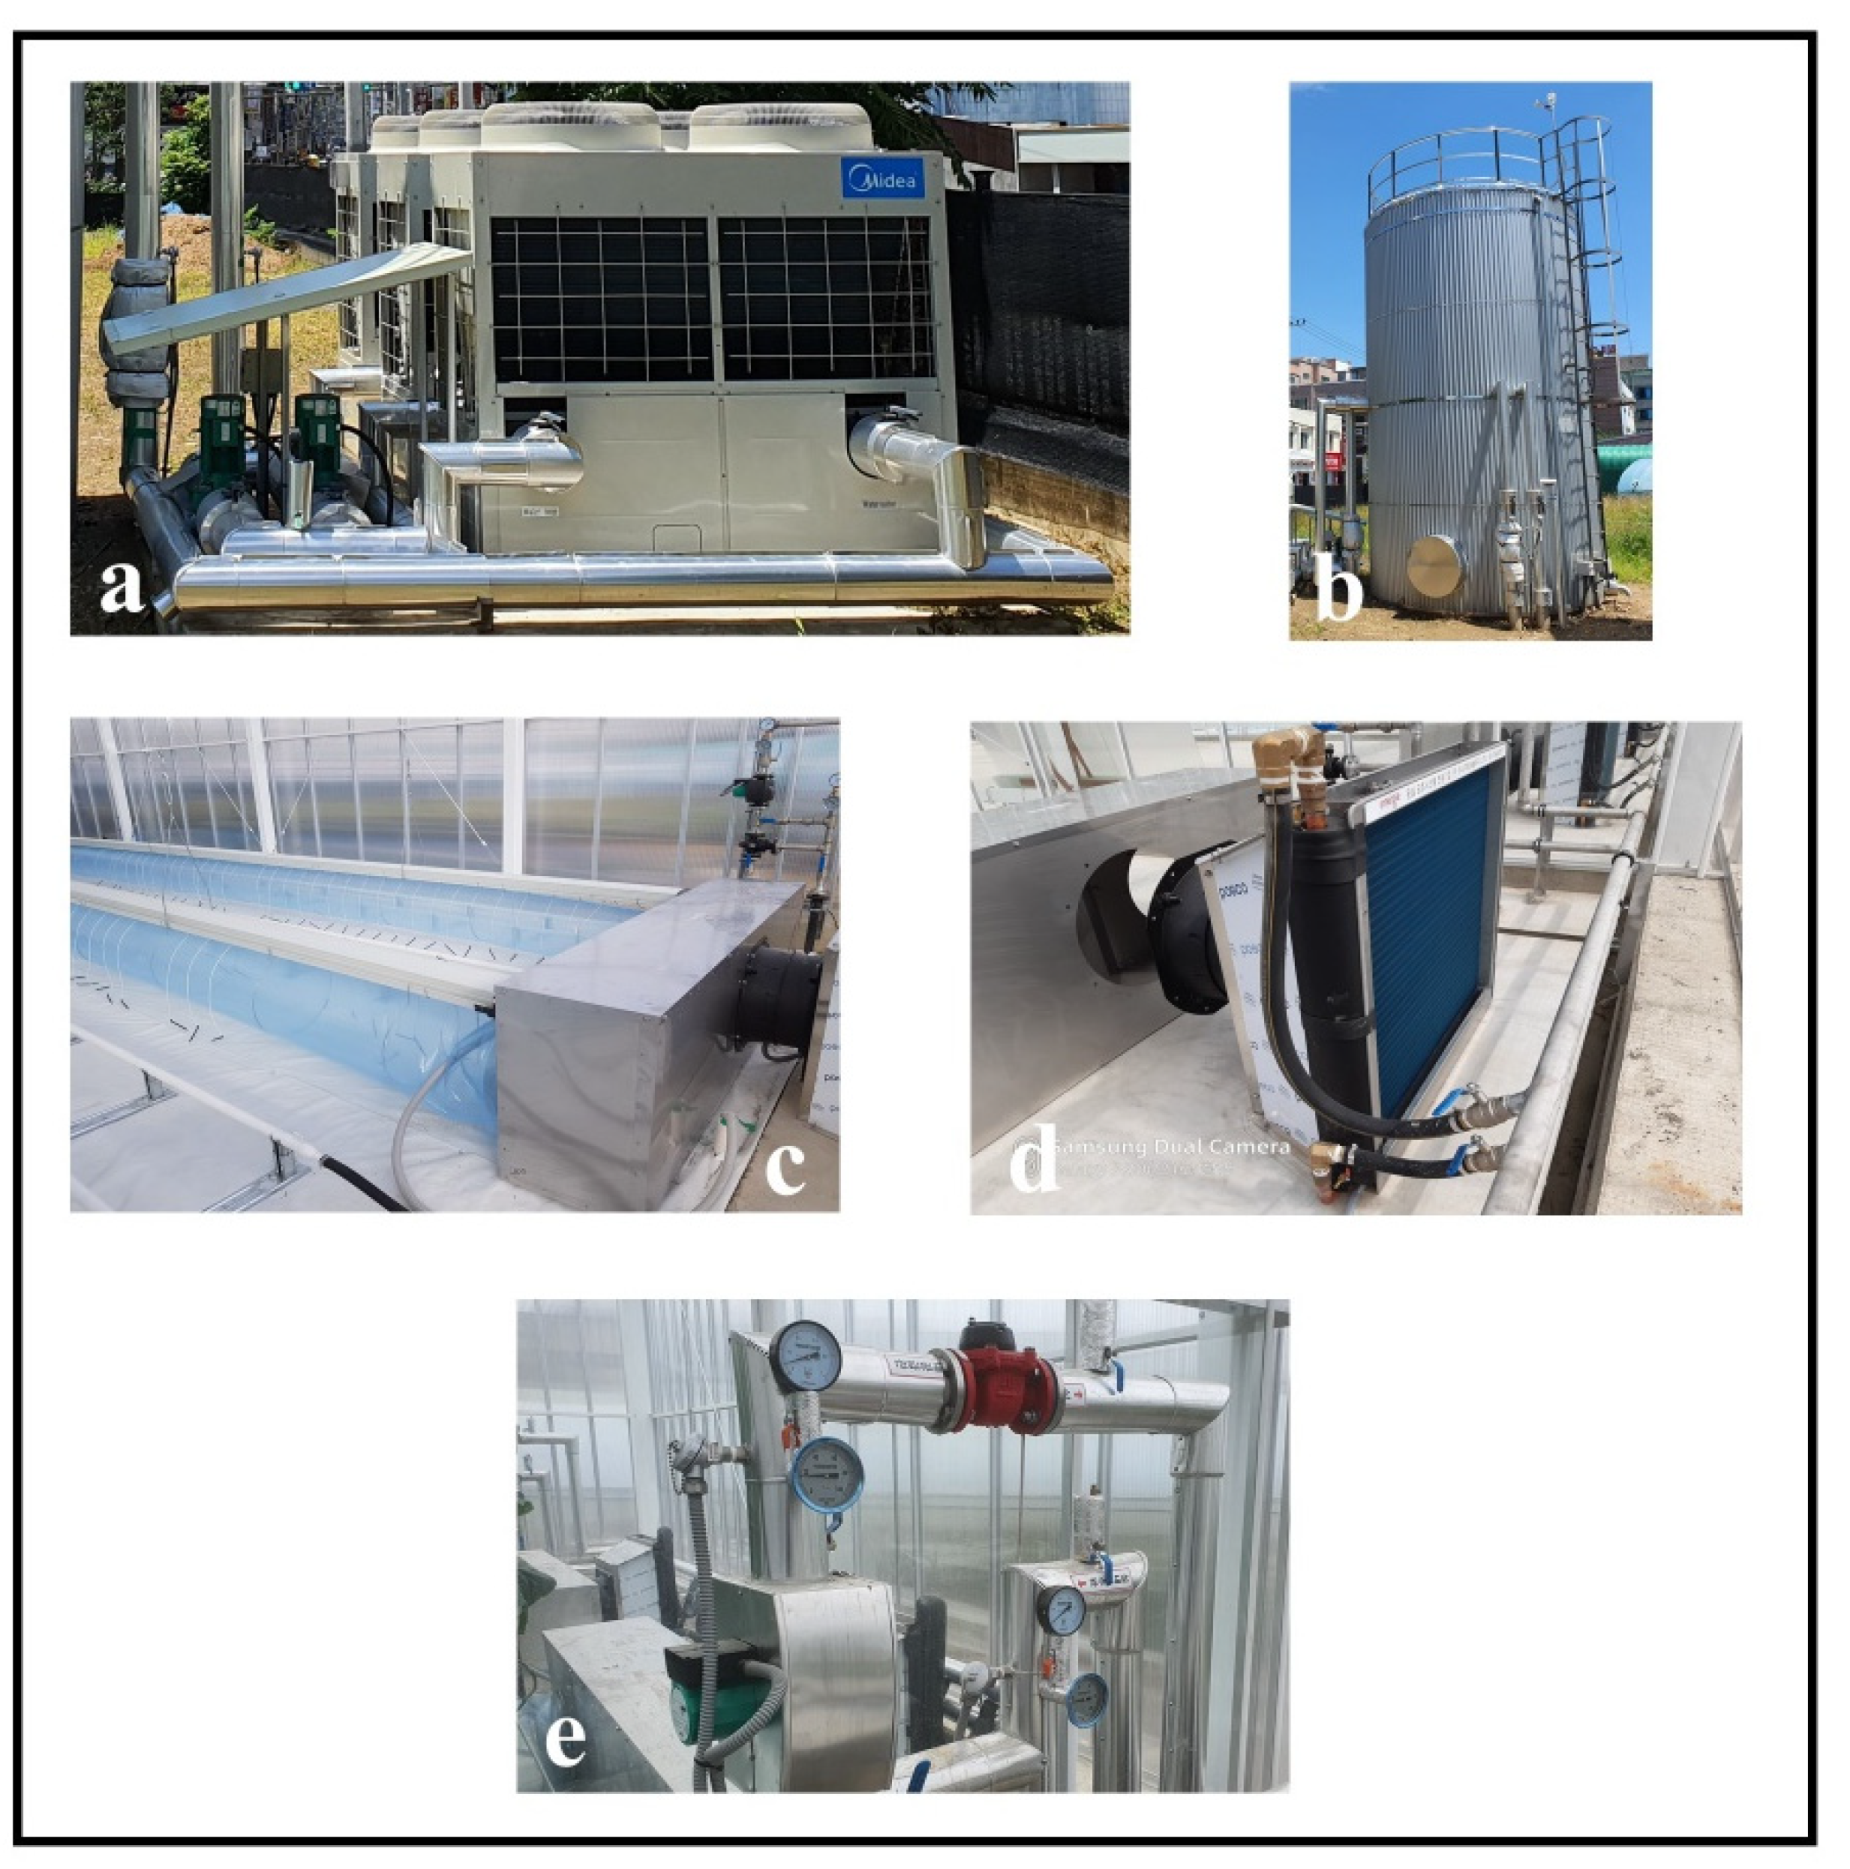
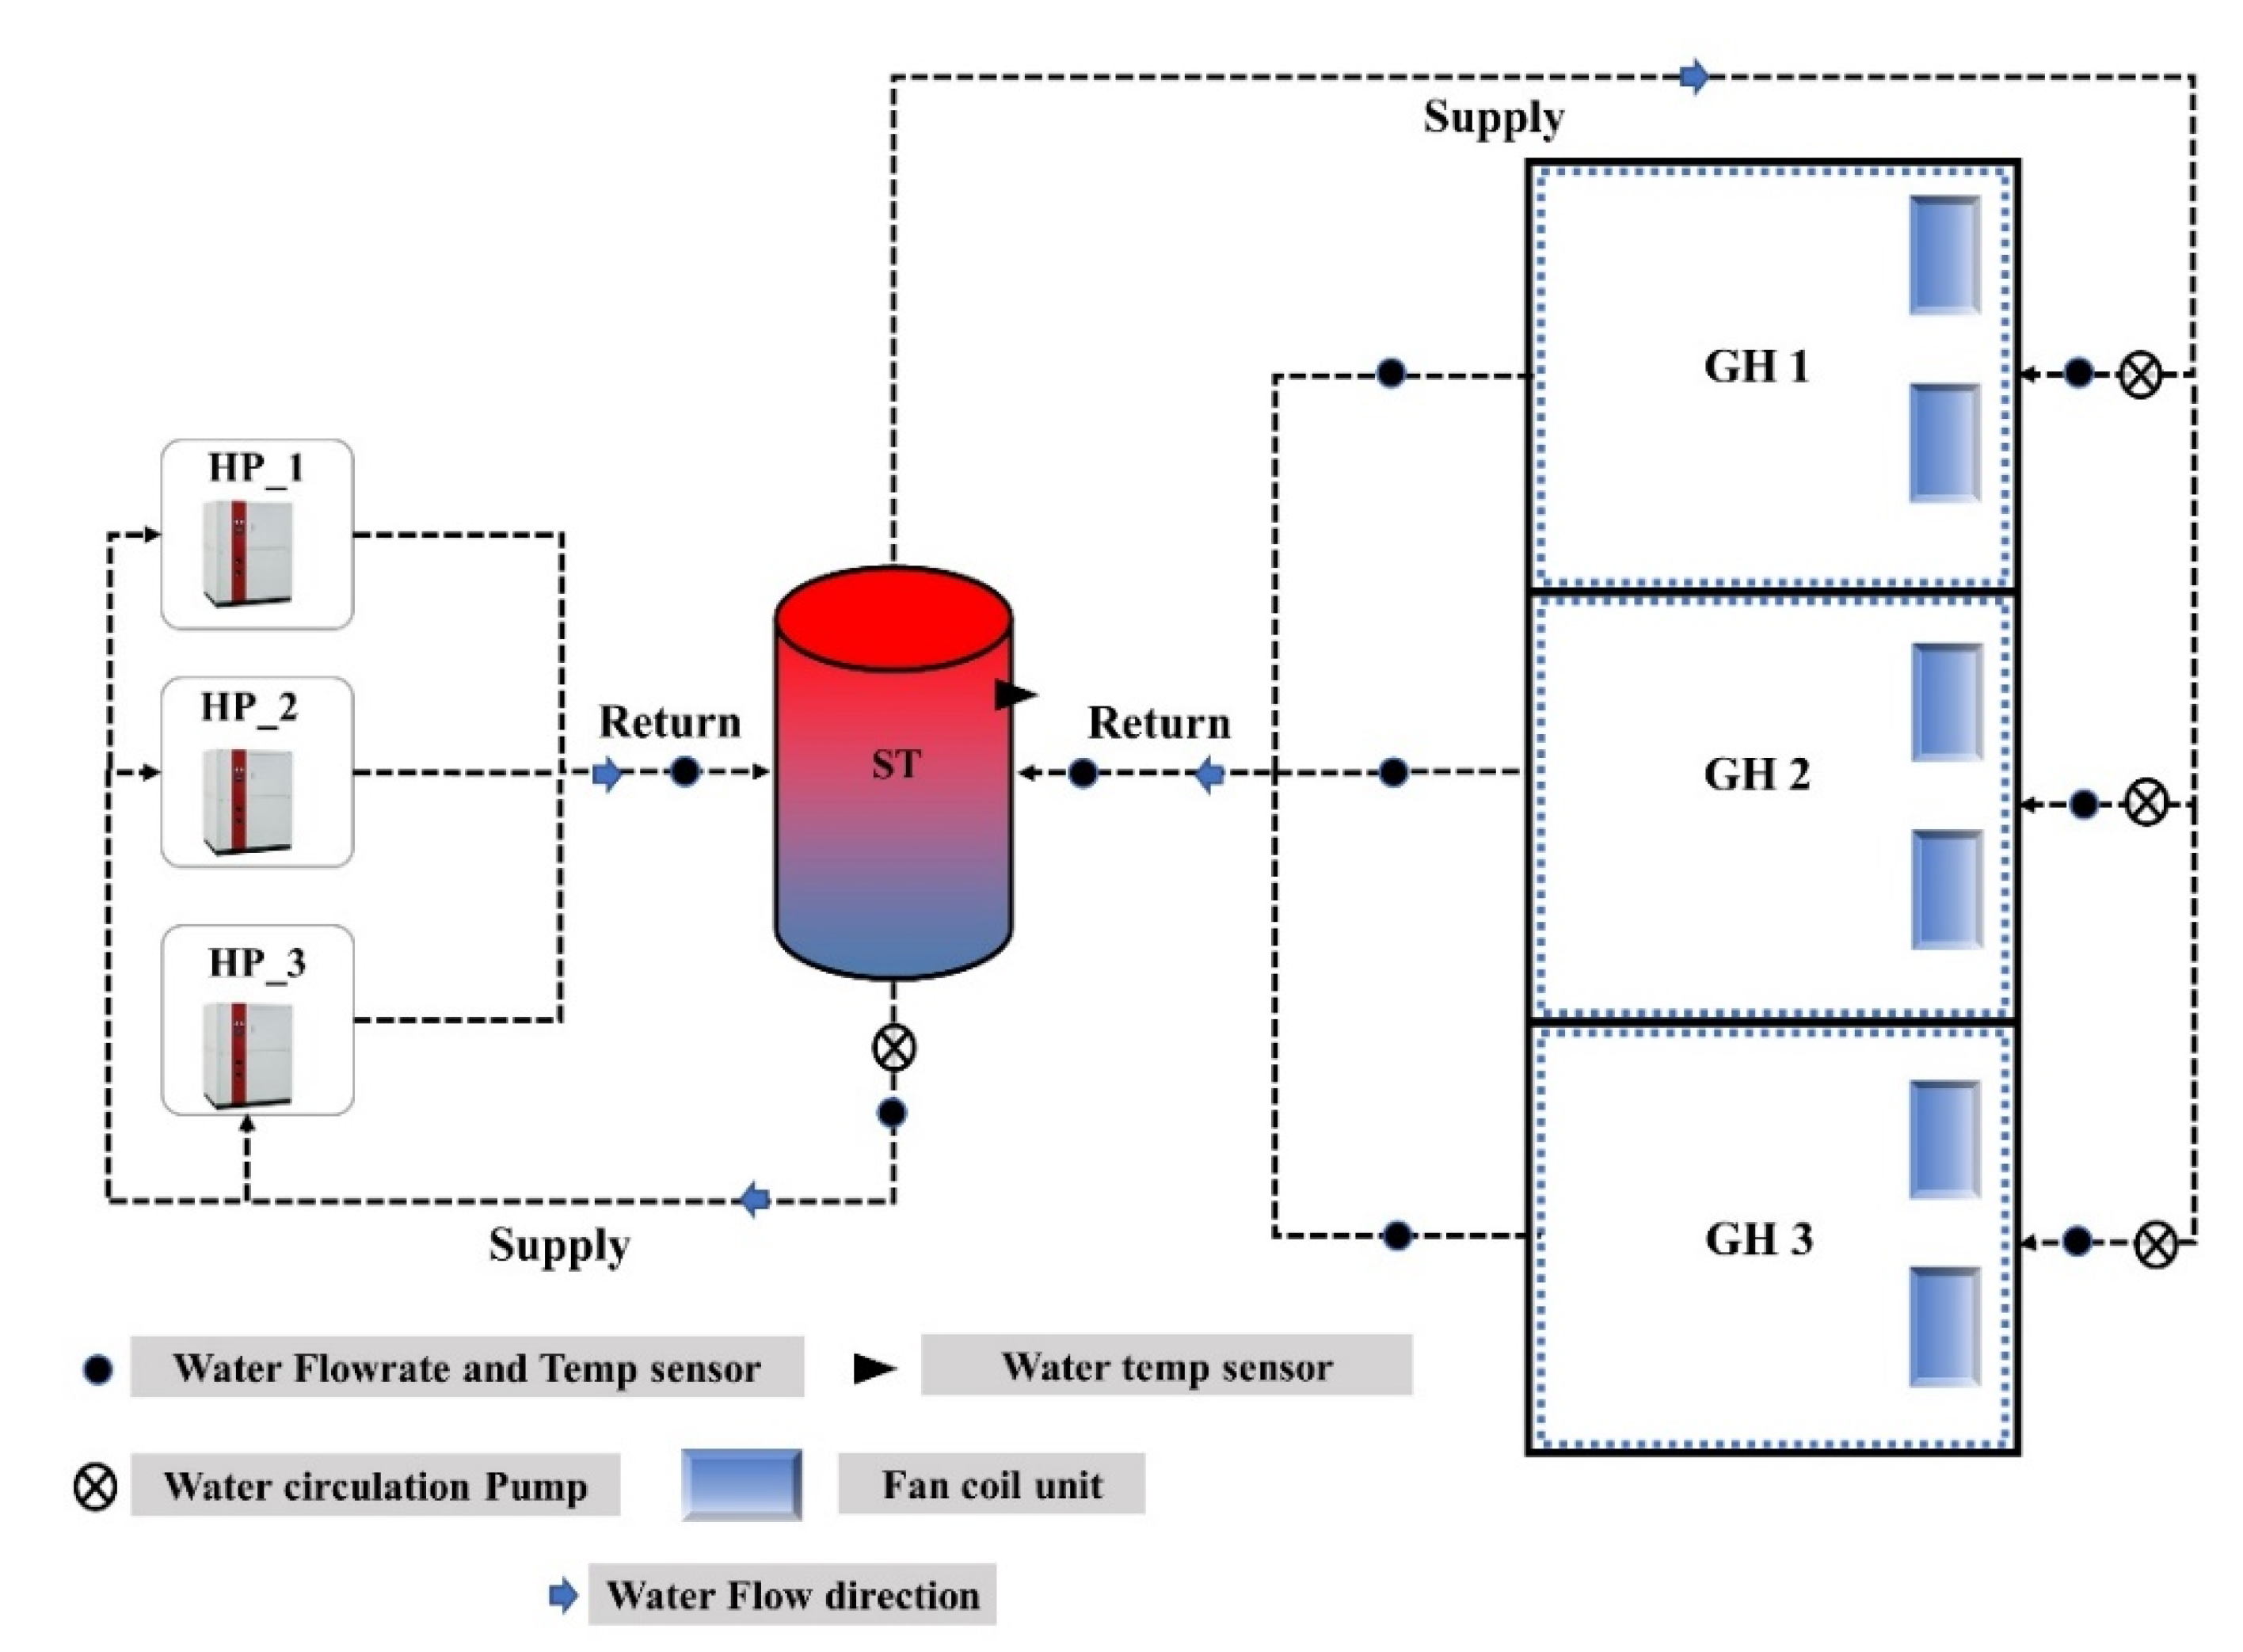
The AWHP system consists of three PSET-C60W (MIDEA) AWHP units with water storage tanks (STs), water circulation pumps, and six fan coil units (FCU). Two FCUs were used in each section of the greenhouse to exchange energy inside the greenhouse. The specifications of all equipment are detailed in Table 1. Figure 3a–e shows the field pictures of: (a) AWHP; (b) ST; (c) FCU blower; (d) FCU; and (e) water circulation pump and gauges. The ST stores cold and hot water and supplies it to the greenhouse when cooling or heating is required, respectively. We calculated the ST capacity of 50 m3 by using surplus energy demand per day compared with the AWHP capacity by using Equation (1). The peak heating load was determined by calculating the heat loss through the external walls of the greenhouse. We monitored the water temperature and flow rate at various locations, namely the ST to AWHP and greenhouse (GH) supply and return water temperature and flow rate. The automatic control program used in this study was Ridder Synopta (Ridder, Harderwijk, The Netherlands), which controls all the heat pump and greenhouse operations automatically. A HortiMax Omni Transducer, Ridder sensors, and FS-WLH 40 FLSTRONIC sensors were used to acquire the water temperature and flow rate, respectively. The details of the sensor locations are shown in Figure 4 to calculate the cooling and heating energy supply from the AWHP to the ST and from the ST to the GH using Equation (1).
where Q is the amount of energy transfer or cooling/heating capacity of the AWHP (kcal), ṁ is the mass flow rate (kg s−1), cp is the specific heat capacity of water (kcal kg−1 °C−1), and ΔT is the change in water temperature (°C).
Q = ṁ × cp × ΔT
Further, the COP of the heat pump was calculated using Equation (2)
where PHP is the power usage of AWHP in kcal.
3. Results and Discussion
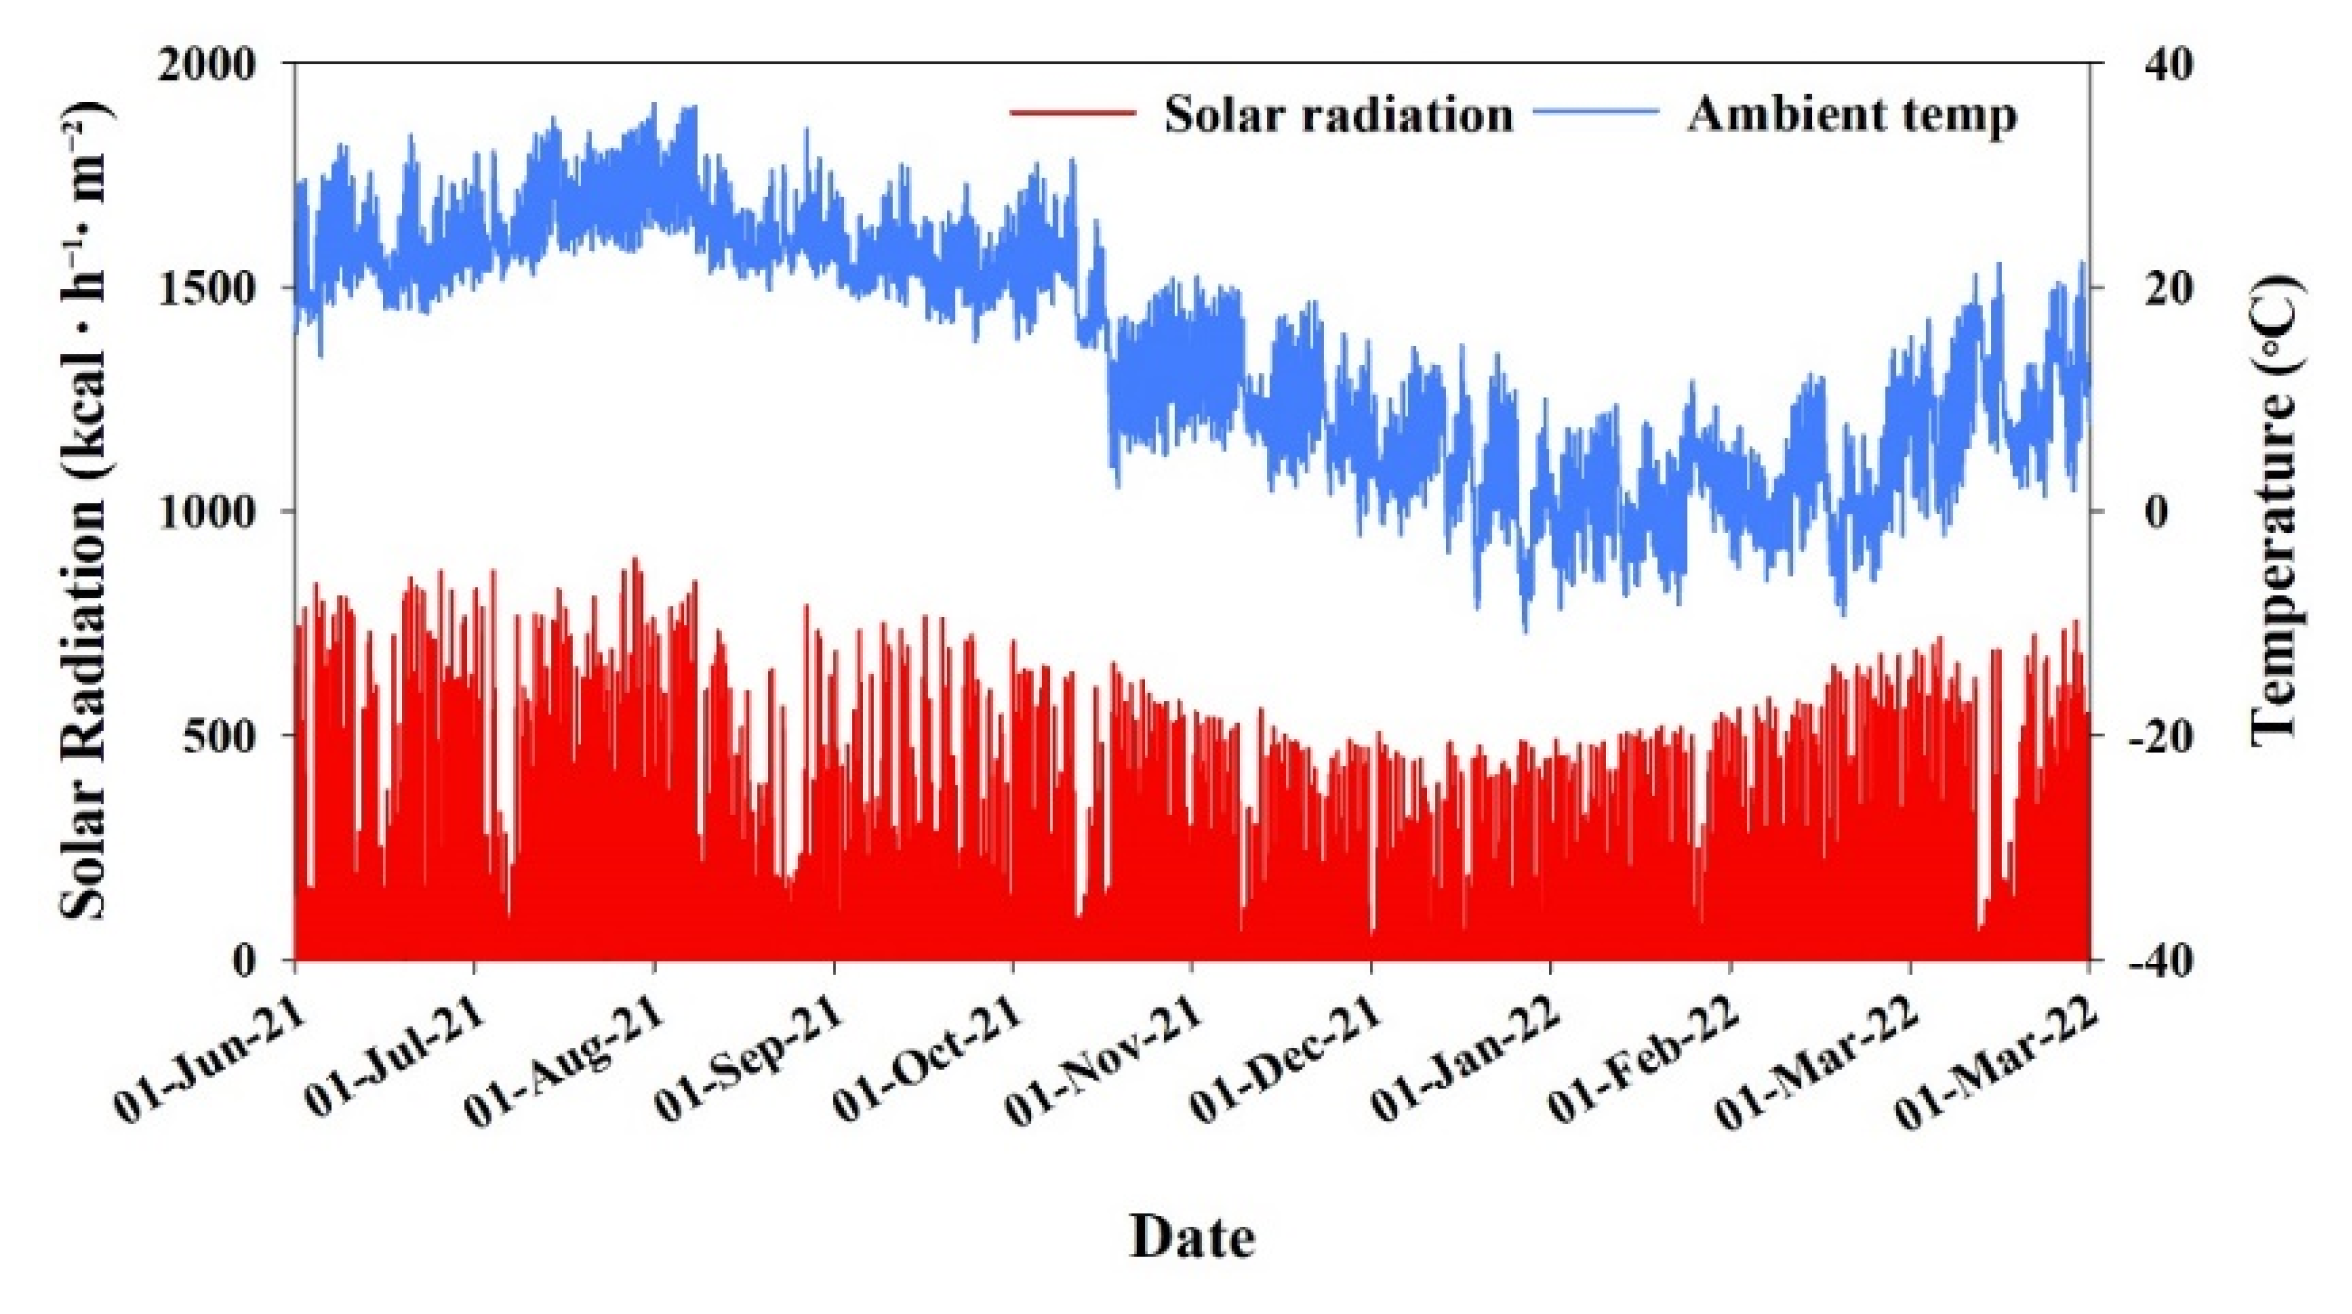
The microclimate of the greenhouse and the efficiency of the heat pump system depend on the greenhouse structural design, including shape, cladding, and energy screen material. Ambient climate, especially solar radiation and temperature, are the key parameters that affect the cooling and heating energy demand of the greenhouse. From a passive energy saving point of view, in our previous studies, we detailed the optimum structural design and materials used [30,31,32,33]. The current greenhouse design (discussed in the Experimental Greenhouse section) was built as per our previous results. Moreover, air temperature and solar radiation are key parameters for evaluating the sustainability of a region for protected cropping [34]. Figure 5 shows the local weather conditions, including outside air temperature and solar radiation from 1 June 2021 to 31 March 2022 in Daegu, South Korea (latitude 35.53° N, longitude 128.36° E, elevation 48 m), where greenhouse and AWHP systems are installed. During the analysis period, the maximum air temperature and solar radiation were 38 °C and 836 kcal h−1 m−2, respectively, and the minimum air temperature was −10 °C.
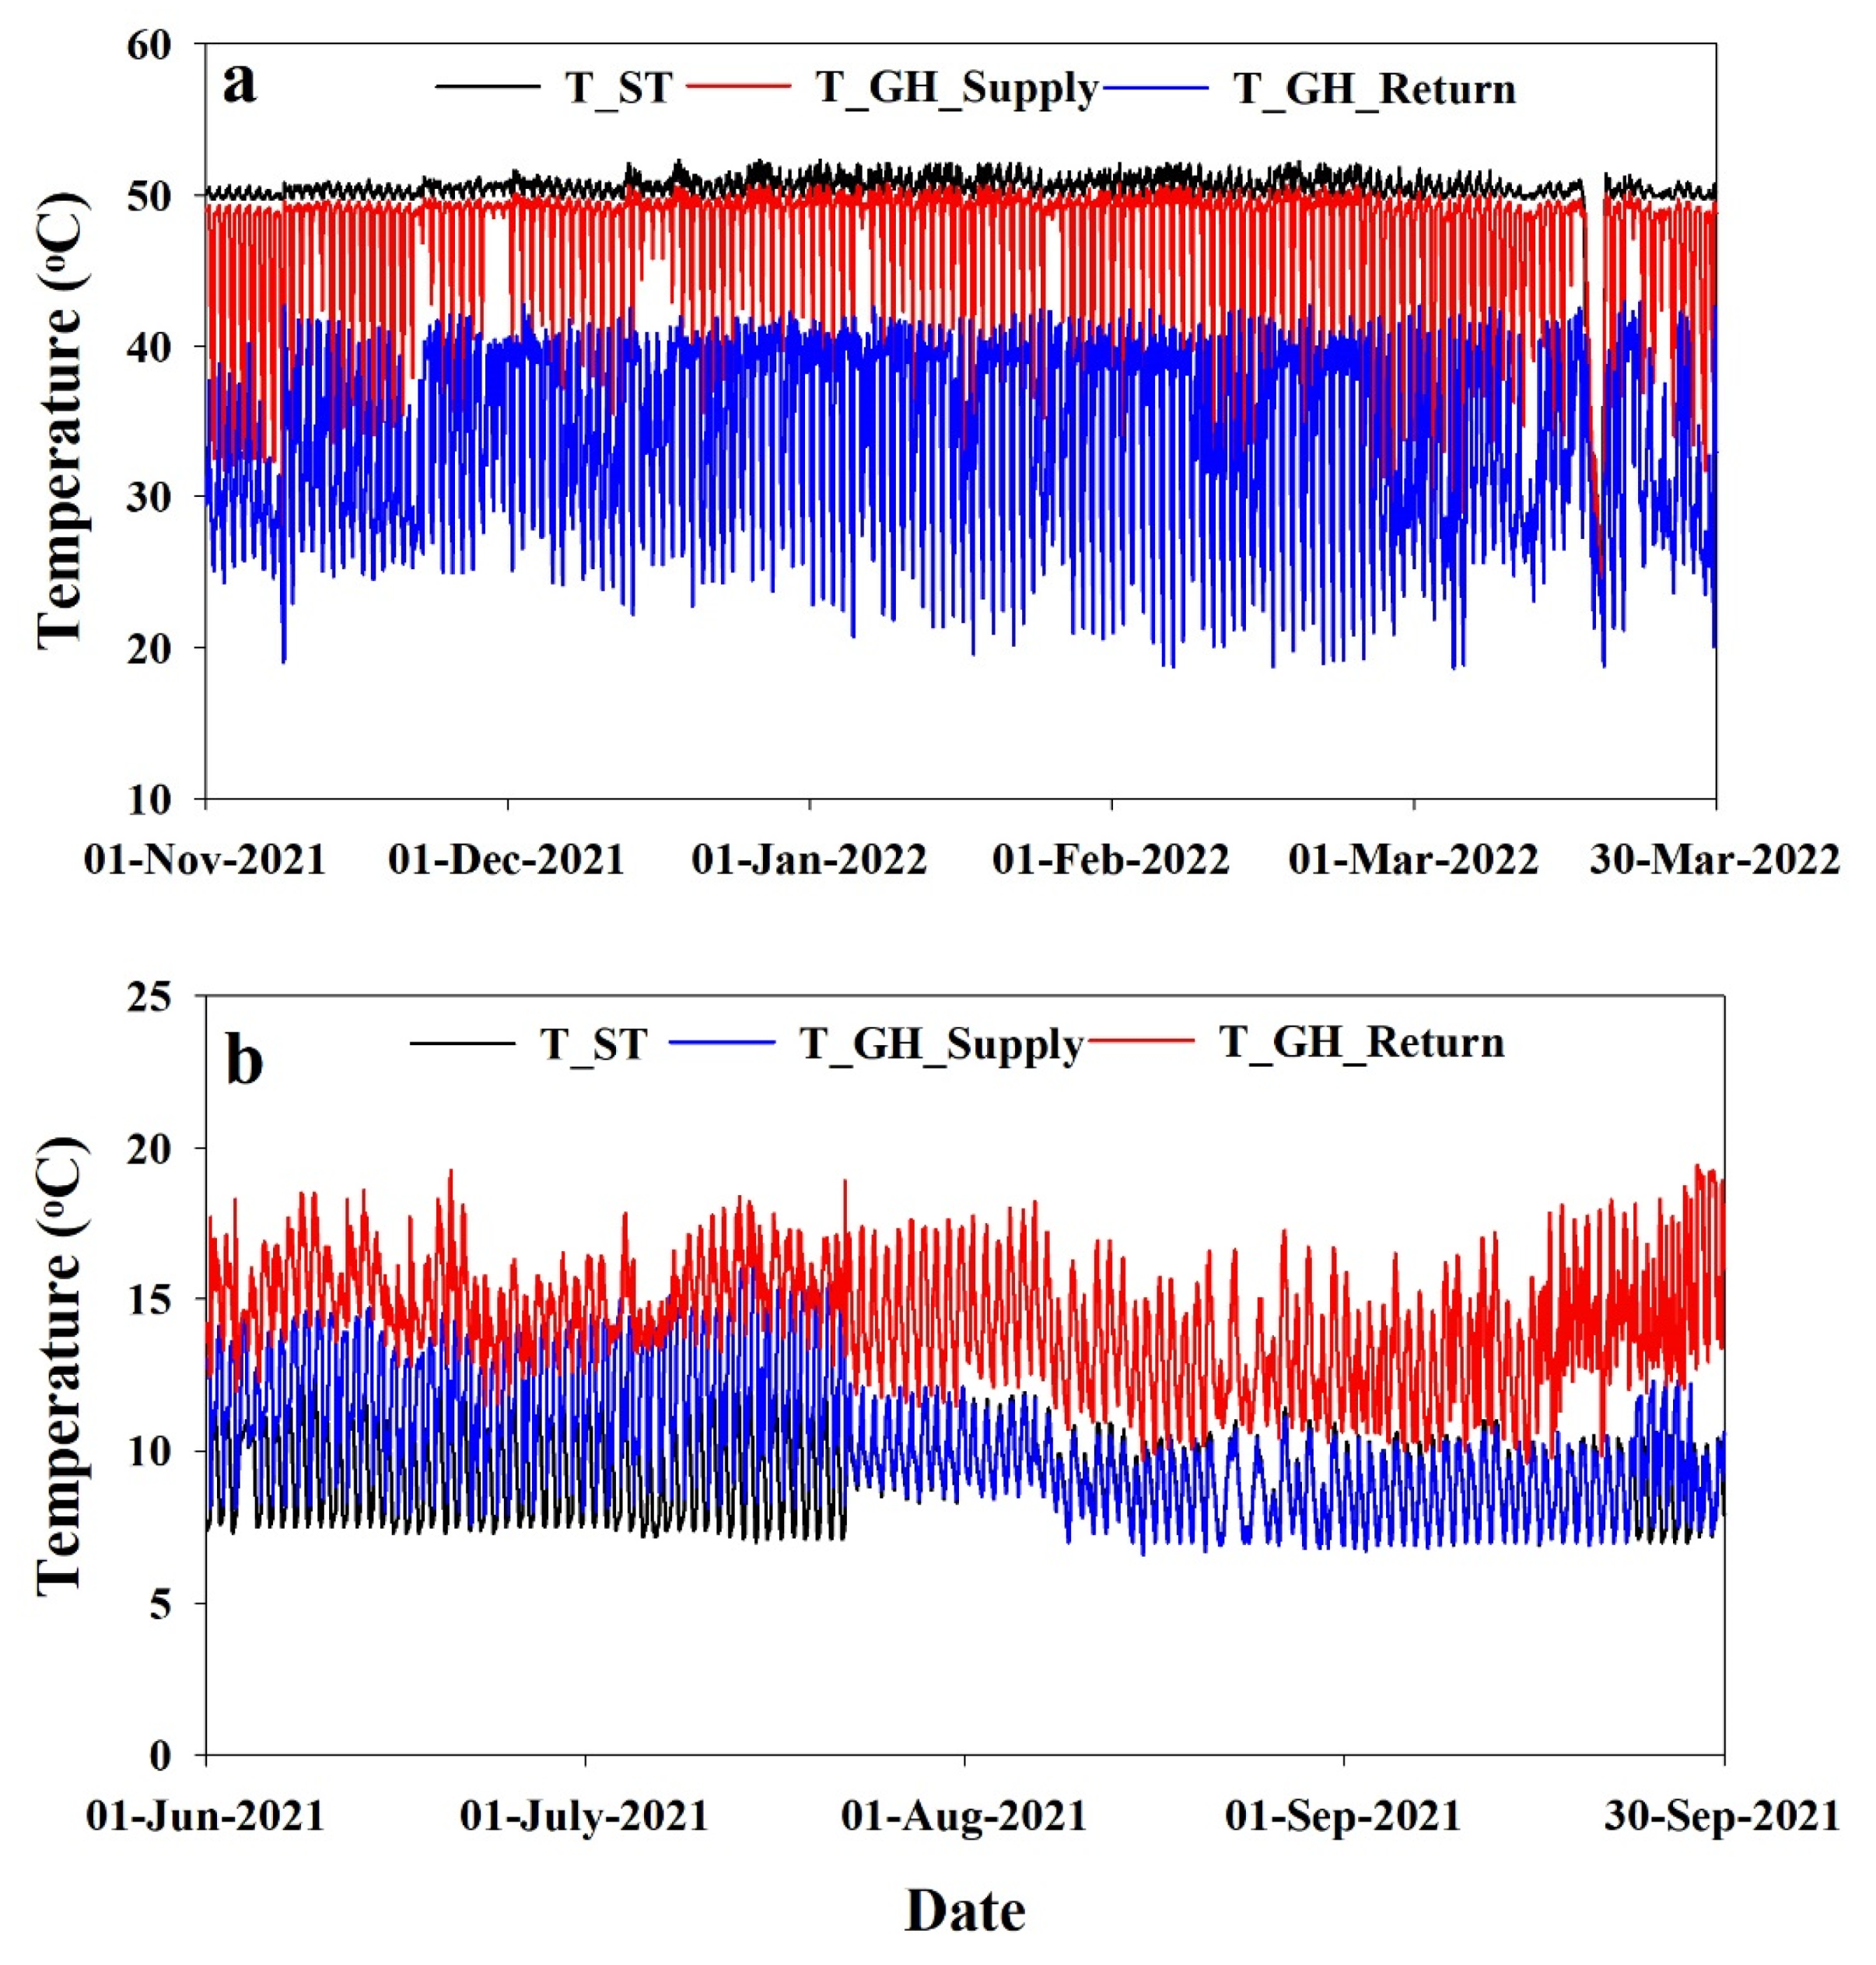
The AWHP system was designed to fulfil the heating and cooling energy demands of a field greenhouse. To calculate the required heating and cooling energy supply to the greenhouse, we measured the water temperature and flow rate at different locations for the complete winter and summer periods. First, we measured the water temperature from the ST and GH supply and the return temperatures. Figure 6a shows the water ST temperature controlled in the tank at 50 °C during the complete winter period from 1 November 2021 to 31 March 2022. Only one sensor was installed on the top of the ST; therefore, the average water temperature was not acquired. Moreover, 48 °C, which is the average water temperature inside the ST, was supplied to the FCUs inside the greenhouse to provide heating. The results also showed that the supply water temperature was 48 °C and we can also see that the water temperature returning to the ST after heating the greenhouse was 38–40 °C, which is 10 °C less than the supply temperature. Moreover, it can also be seen in the Figure 6a that there was a return temperature lower than 40 °C, which was the temperature when the circulation pump was off and there was no water supply to the greenhouse as no heating was required, it only the sensor’s given reading which should be ignored. Figure 6b shows the results of the ST, greenhouse supply, and return water temperature for the summer period from 1 June to 30 September 2021. The ST water temperature was maintained at 10 °C. The results also revealed that during June and July, the supply and return water temperatures were 14 °C and 16 °C, respectively, with a difference of 2 °C. During June and July, only daytime cooling was required, as we can see from the results. Moreover, the supply water temperature was higher than 10 °C, and the return temperature was more than 16 °C, which is the temperature that was not supplied to the FCU; it is the sensor’s given water temperature reading when the circulation pump is off and there is no supply to the greenhouse. Furthermore, during the months of August and September, 24 h cooling was required because both day and nighttime temperatures were higher, as can be seen in Figure 6. The results also revealed that the supply and return water temperatures during August and September were 12 °C and 18 °C, respectively, with a difference of 6 °C during daylight and 8 °C and 14 °C with a difference of 6 °C during the night. Overall, the results during both the winter and summer show that ST temperatures were successfully maintained to provide energy to the greenhouse.
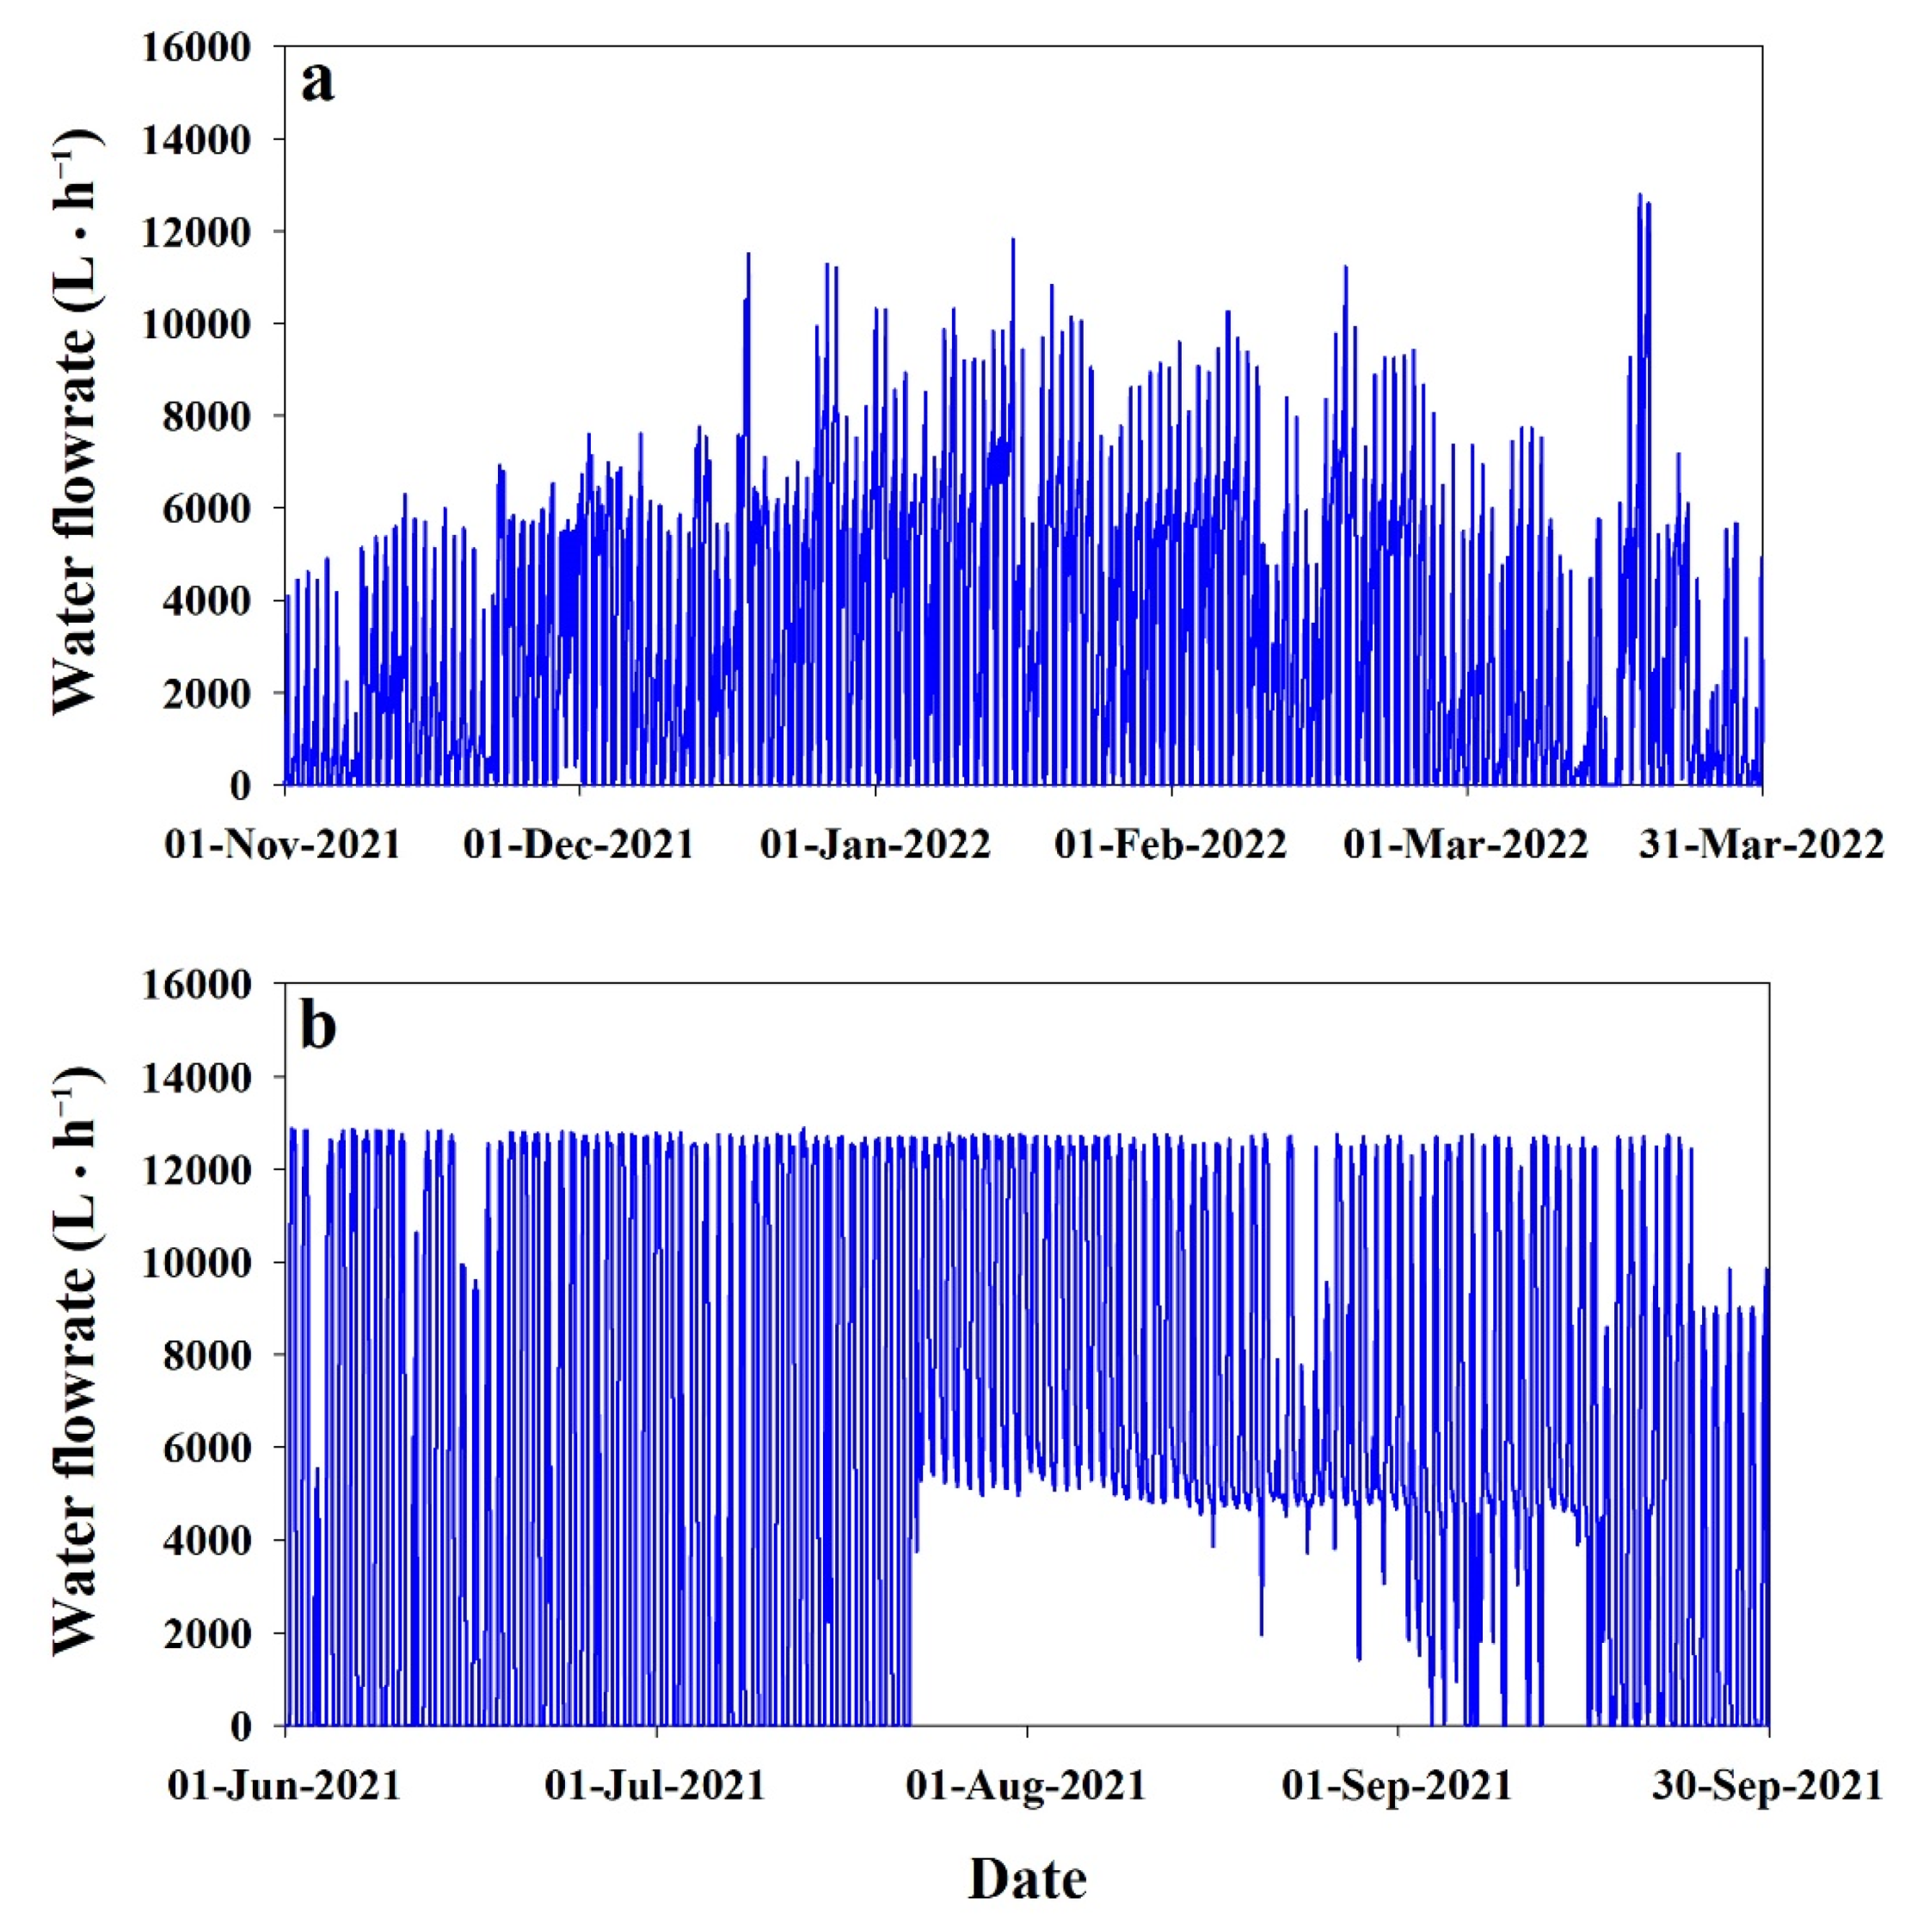
Figure 7a presents the water flow rate from ST to GH during the winter period. The water flow rate was regulated from the ST to the FCU using a proportional–integral (PI) controller depending on the internal air temperature of the GH. The PI controller adjusts the rate of the incoming water from the ST to the FCU depending on the need to maintain the air temperature of the greenhouse at the desired level. Because of the PI controller, we can see the daily and monthly varying water flow rate. The circulation pump increased and decreased the flow rate according to the heating required, with the maximum flow rate of 12,000 L∙h−1.
Figure 7b shows the water flow rate from the ST to the GH during the summer period. We can see from the results that the maximum flow of water was delivered whenever cooling was needed. This is due to the fact that greenhouse cooling demand was higher than the maximum supply energy during the whole summer period. The results also depict that from the end of July to the middle of September, water was supplied constantly for 24 h as both the day and the nighttime temperature was higher than the setpoint and cooling was needed. The water circulation pump provided the water from the ST to the FCU at its full capacity of 12,000 L∙h−1.
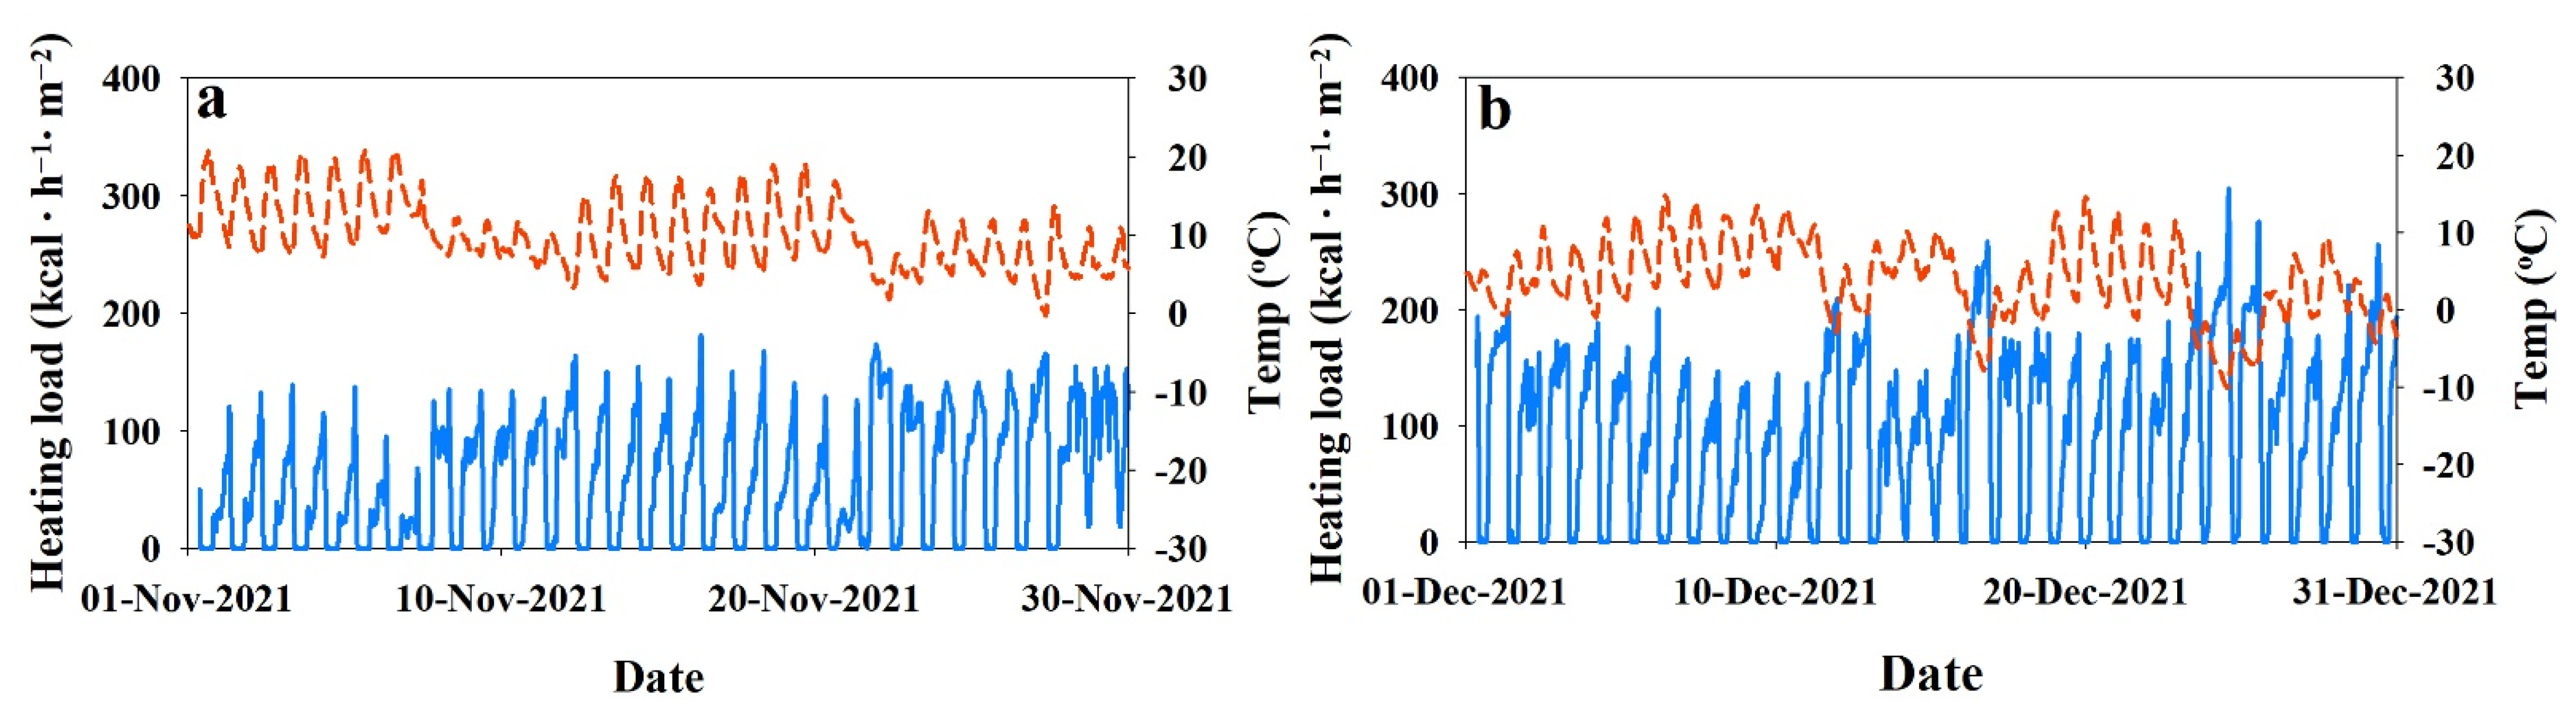
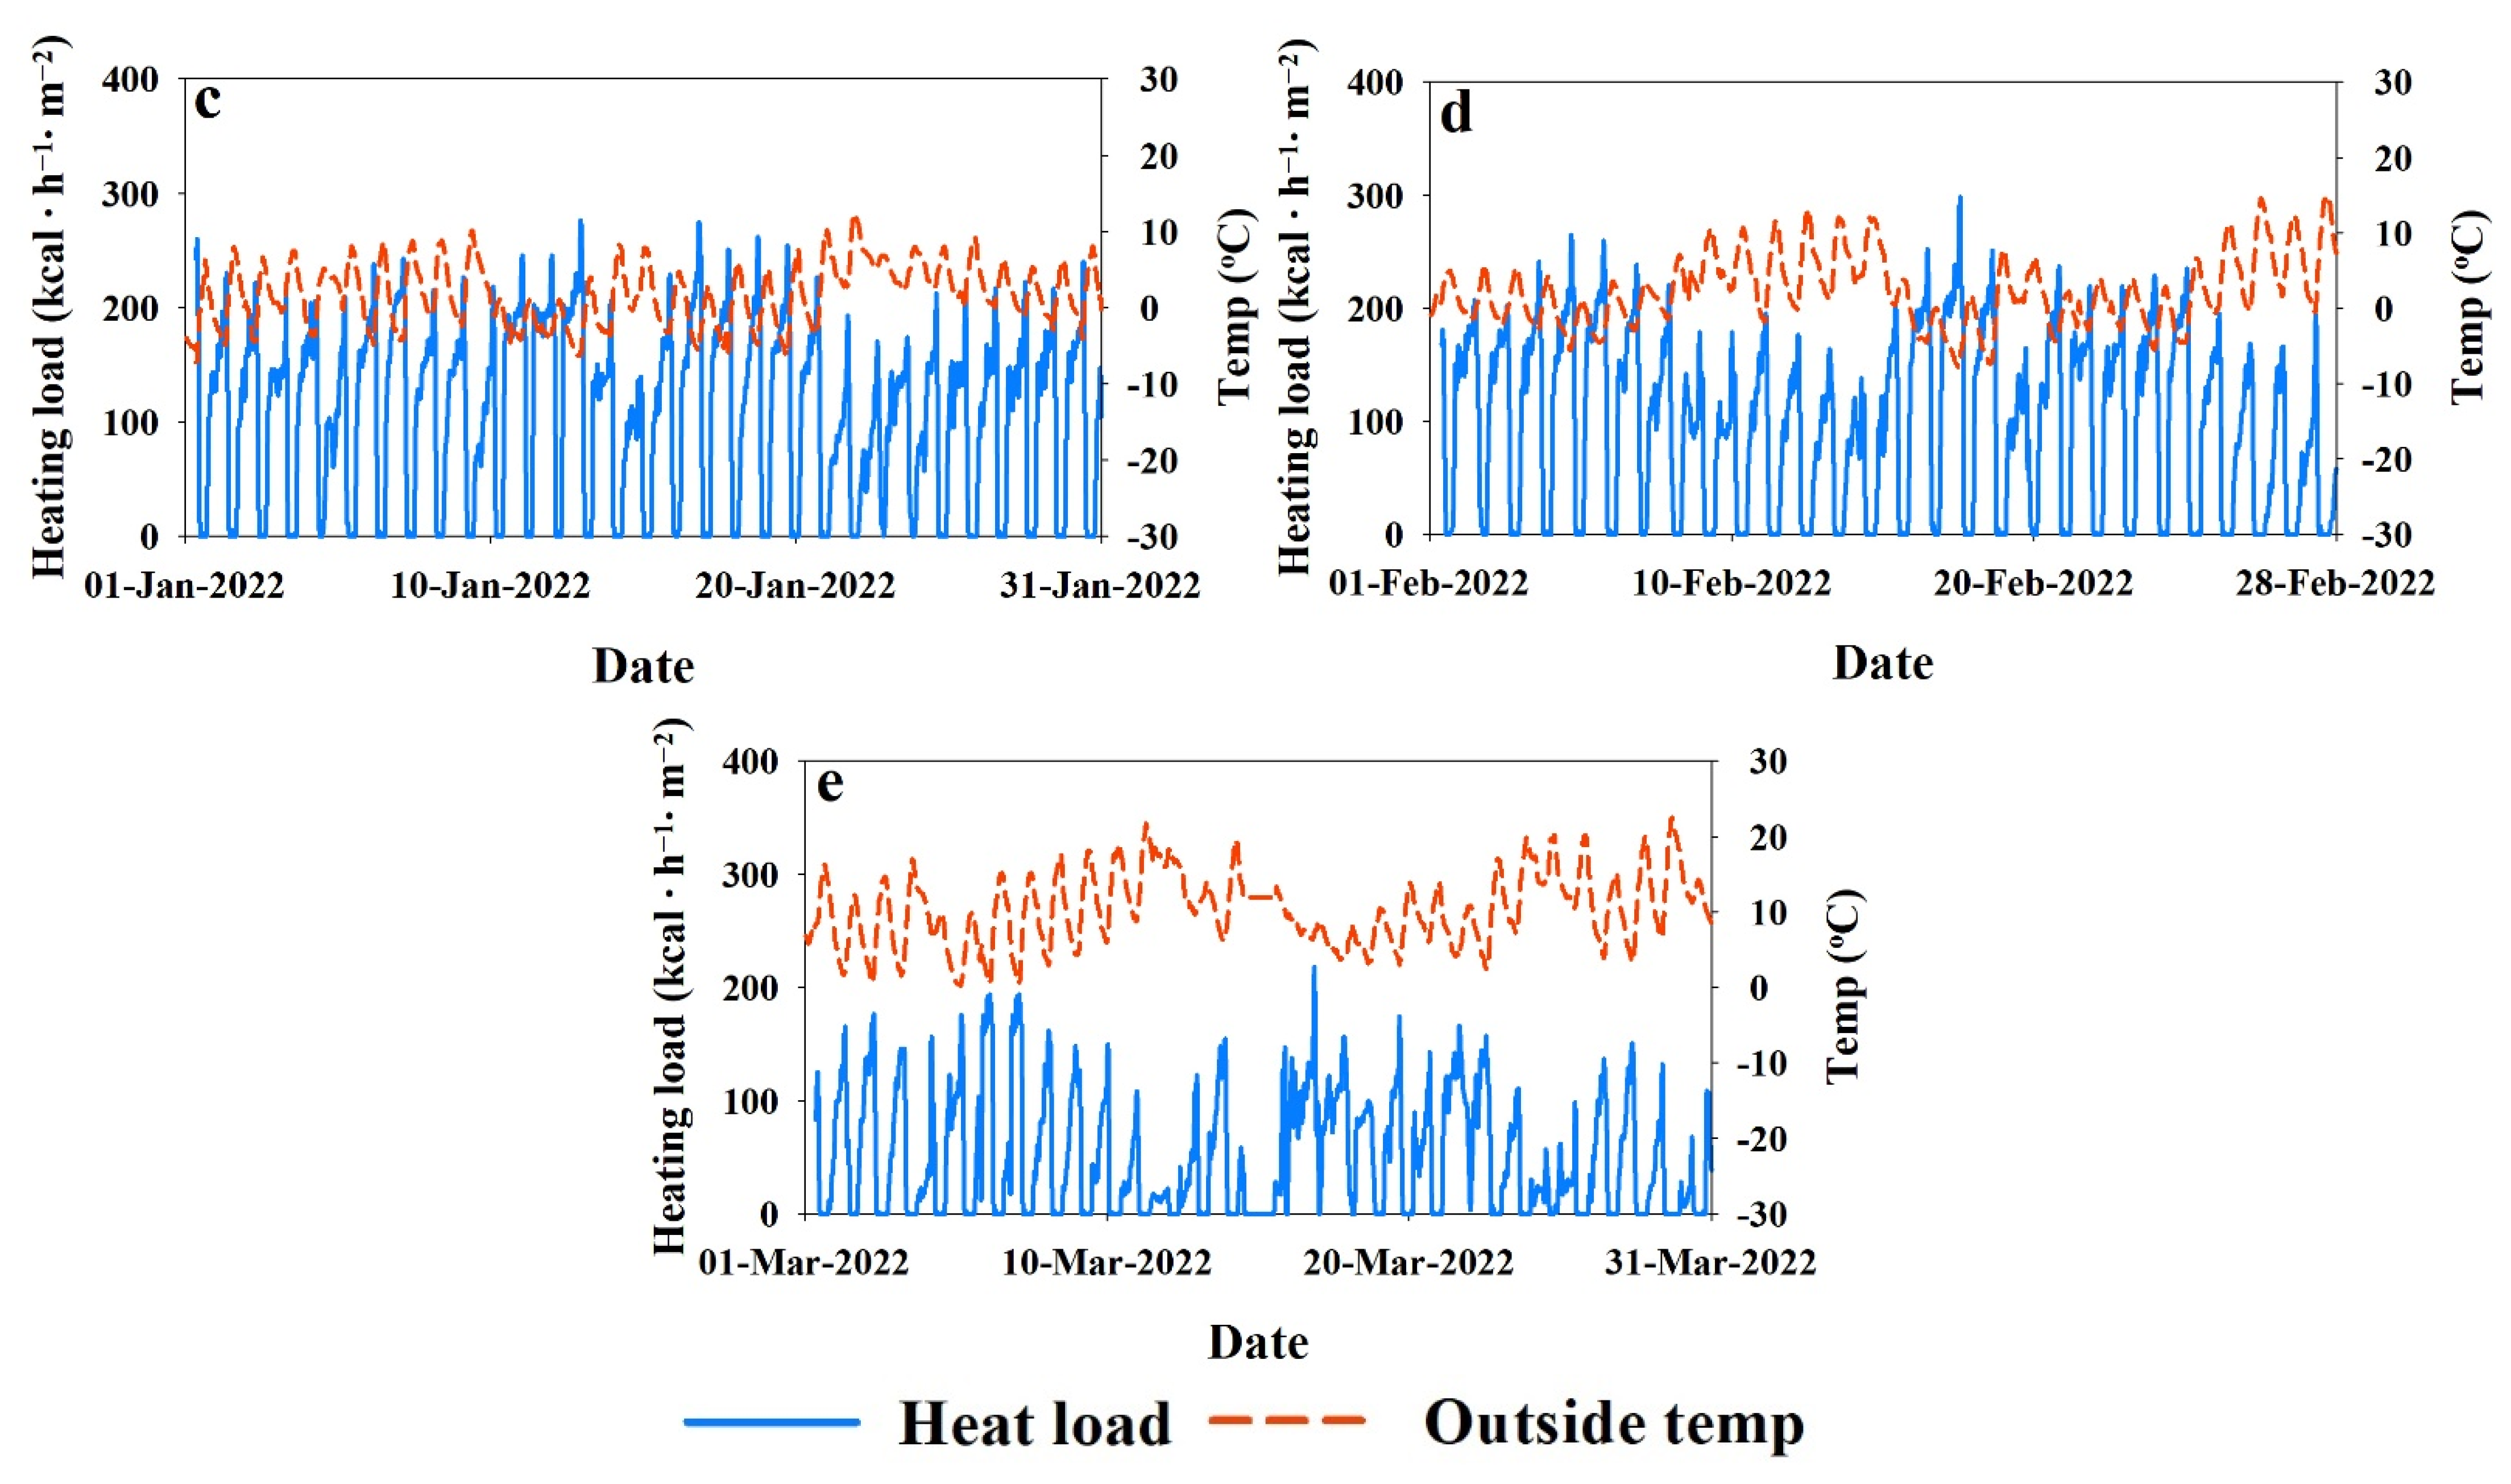
The greenhouse supply and return water temperature and water flow rate were further used to calculate the heating and cooling energy supply to the greenhouse using Equation (1) for both the winter and summer seasons. Figure 8a–e displays the heating energy supply to the GH as well as the outside air temperature from November 2021 to March 2022. The heating load per unit area of the greenhouse was calculated. The results depict that the maximum heat energy supply to the greenhouse was 210 kcal∙h−1∙m−2 on 26 December 2021 when the outside air temperature was at −10 °C, the lowest of the entire time. The overall trend of the heating energy demand was correlated with the results of previous studies conducted for the heating load calculation [25].
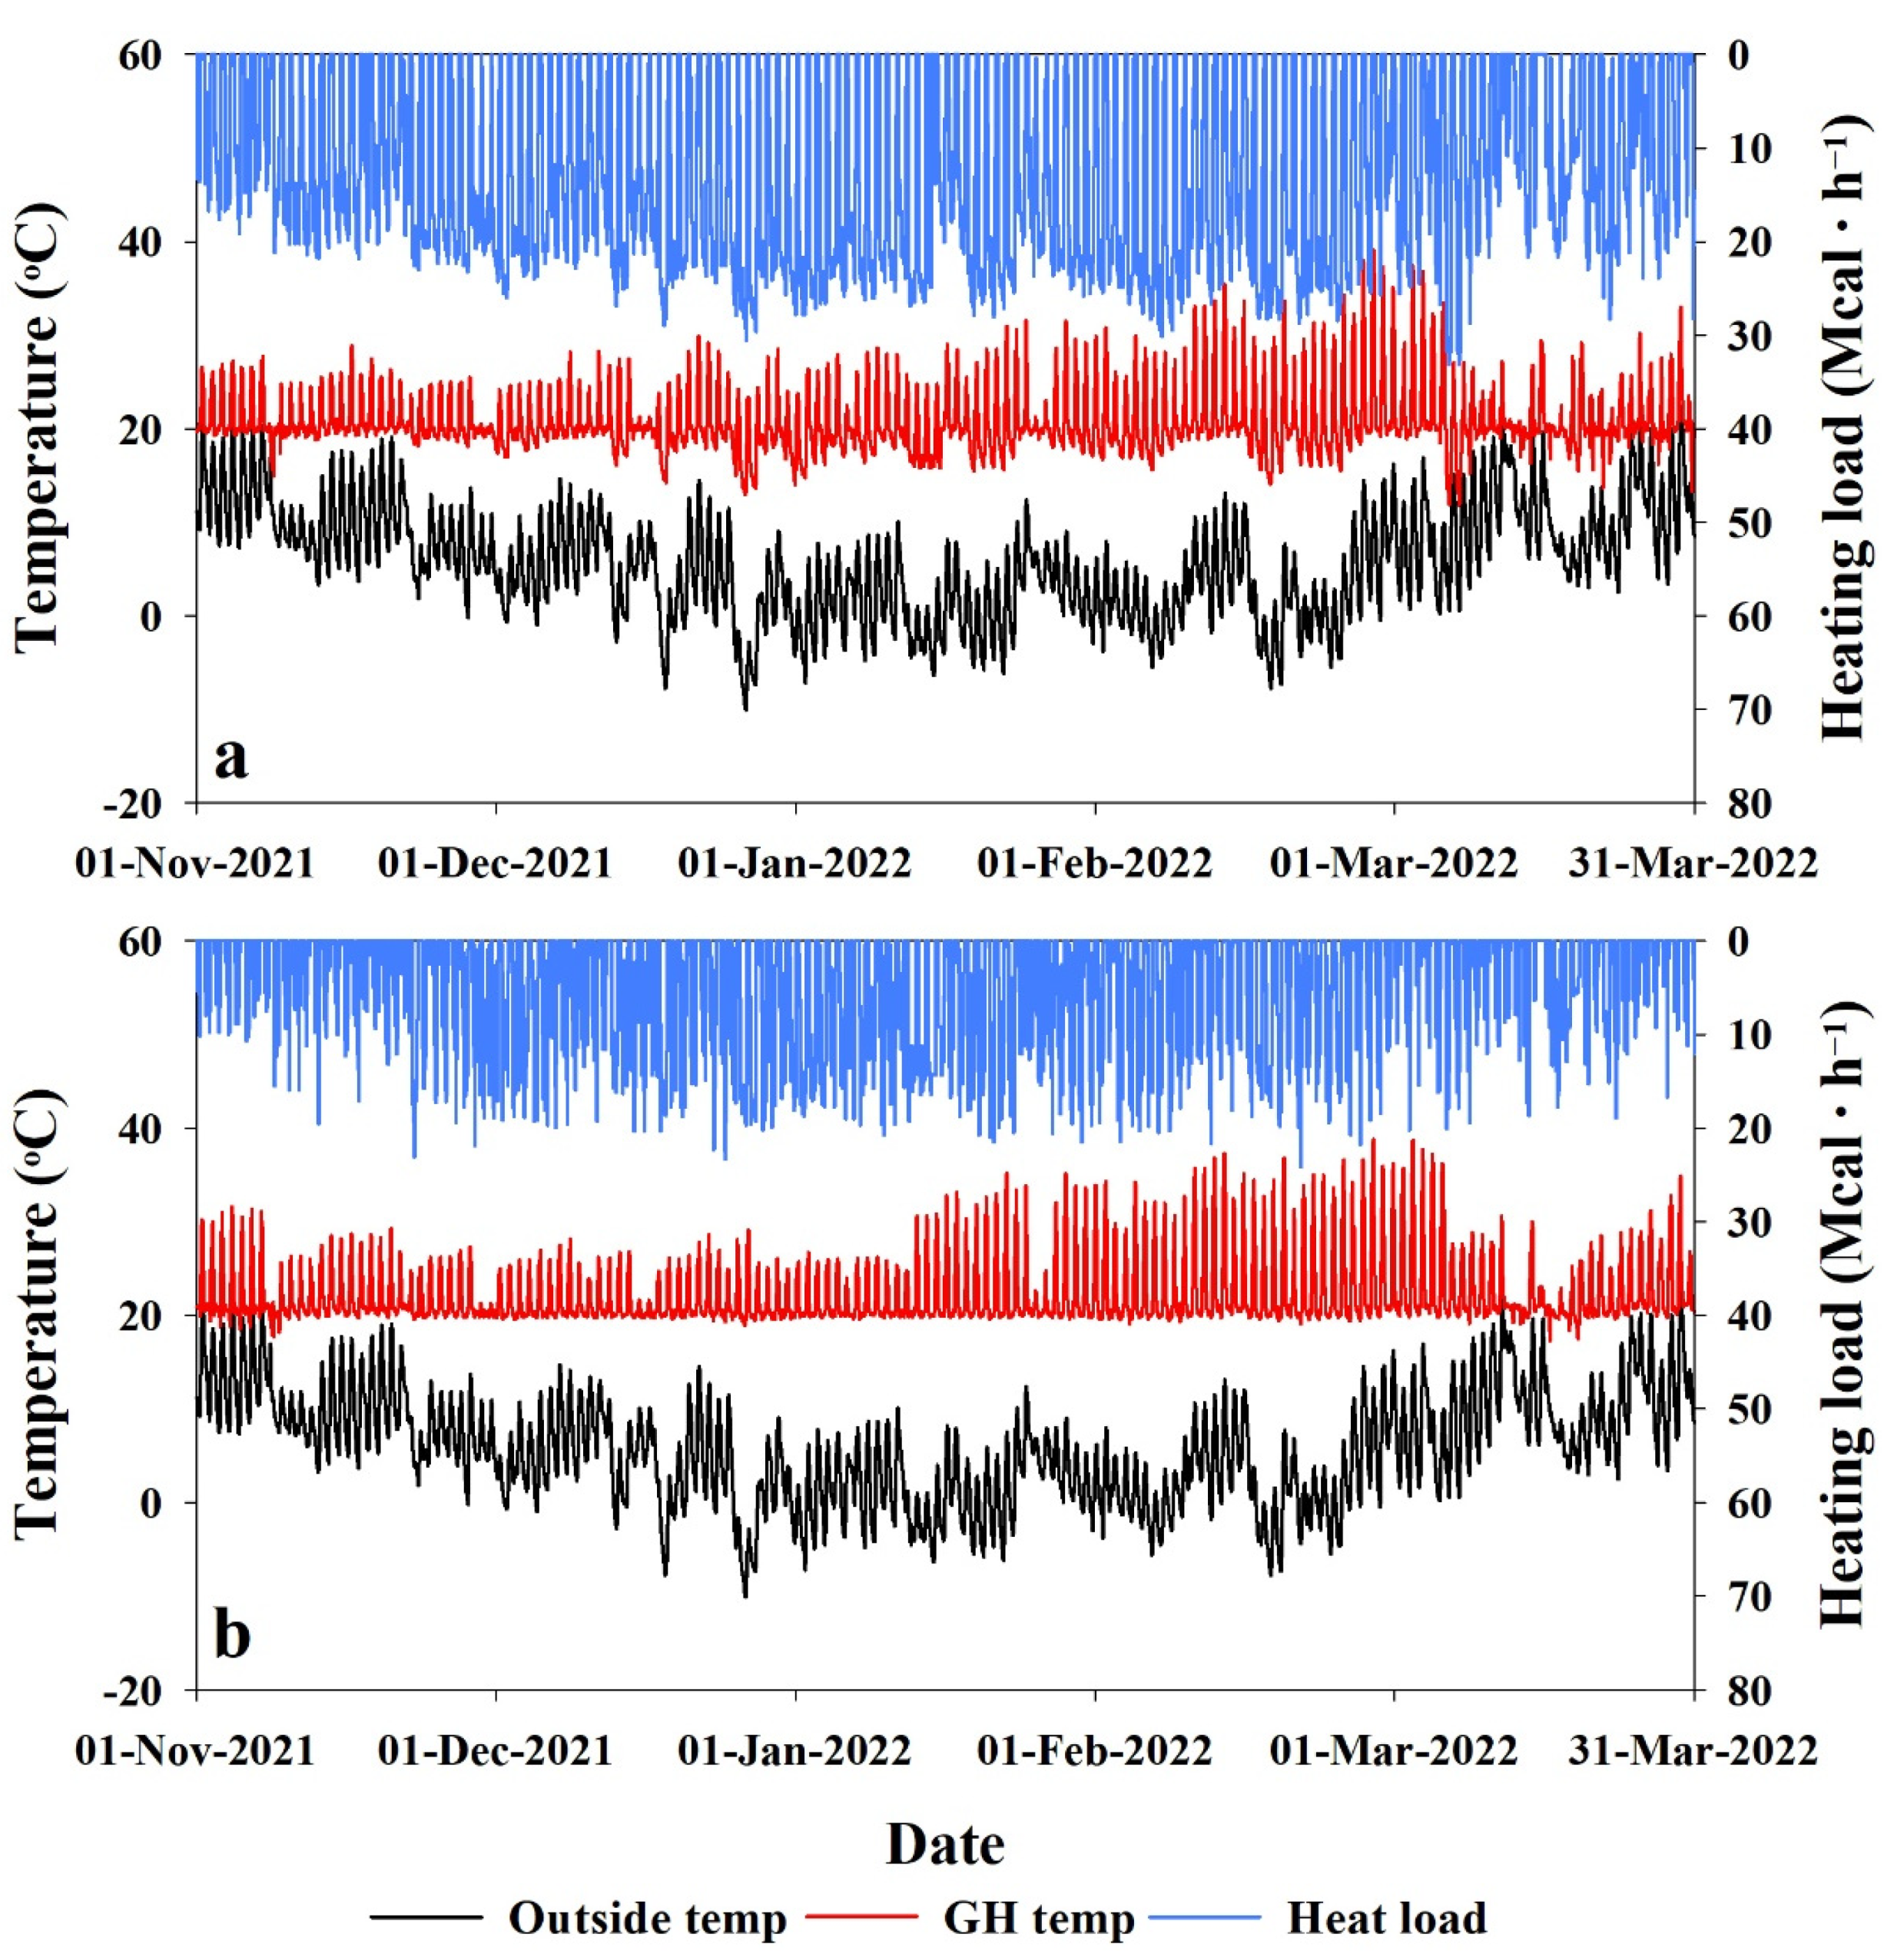
Among the three sections of the greenhouse, experiments were carried out in two sections; the third section was not considered as there was no energy supply from the heat pump system because no crop was grown at that time. Figure 9a,b presents the internal greenhouse temperature along with the ambient temperature and heating load for two different greenhouse sections, GH 1 and GH 2, respectively. The results showed that in each section, an air temperature setpoint of 20 °C was achieved throughout the winter season. The results also revealed that the maximum heat energy supply to the greenhouse section 1 (GH 1) and section 2 (GH 2) was 33 and 24 Mcal∙h−1, respectively. In addition, the total heat energy supply during the complete winter season to the greenhouse section 1 (GH 1) and section 2 (GH 2) was 46,225 and 17,438 Mcal∙h−1, respectively. GH 2 needed less heating compared to GH 1 for the same heating setpoint because GH 2 is a section between two other GH sections, and therefore heat loss from the external walls was less due to the smaller area exposed to ambient weather. In GH 2, only one side wall was exposed to ambient weather, causing very low heat loss.
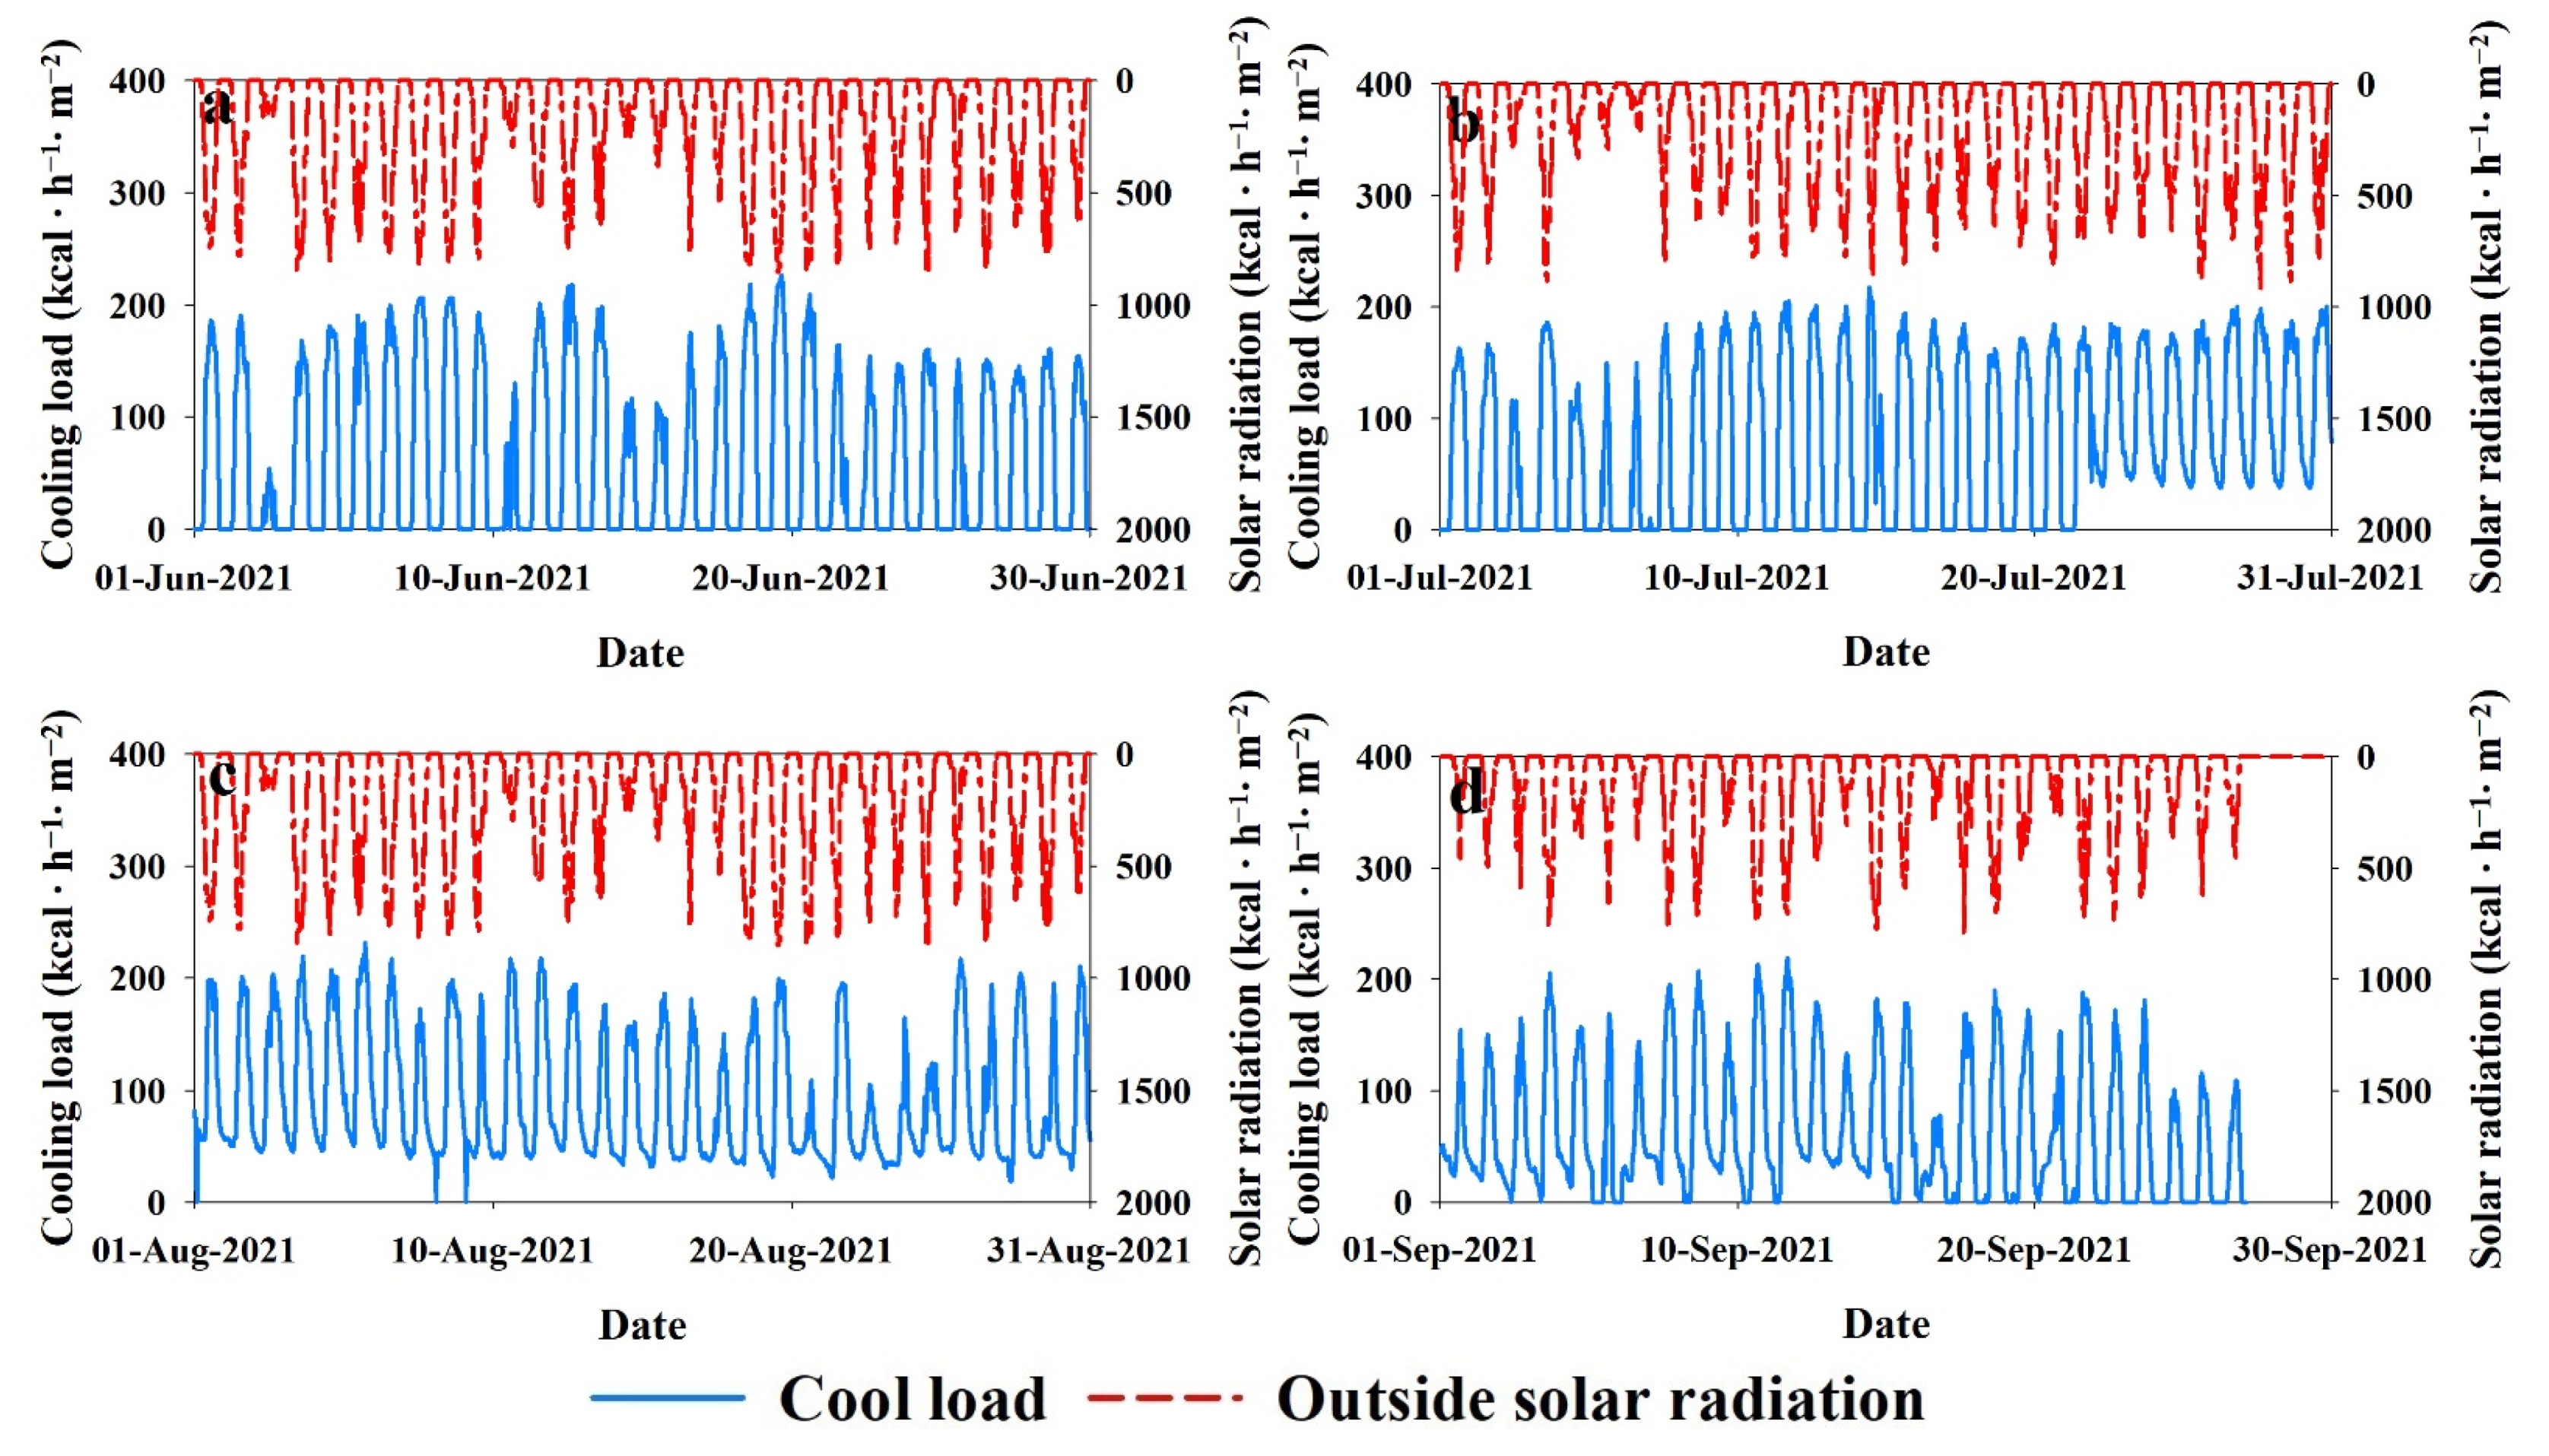
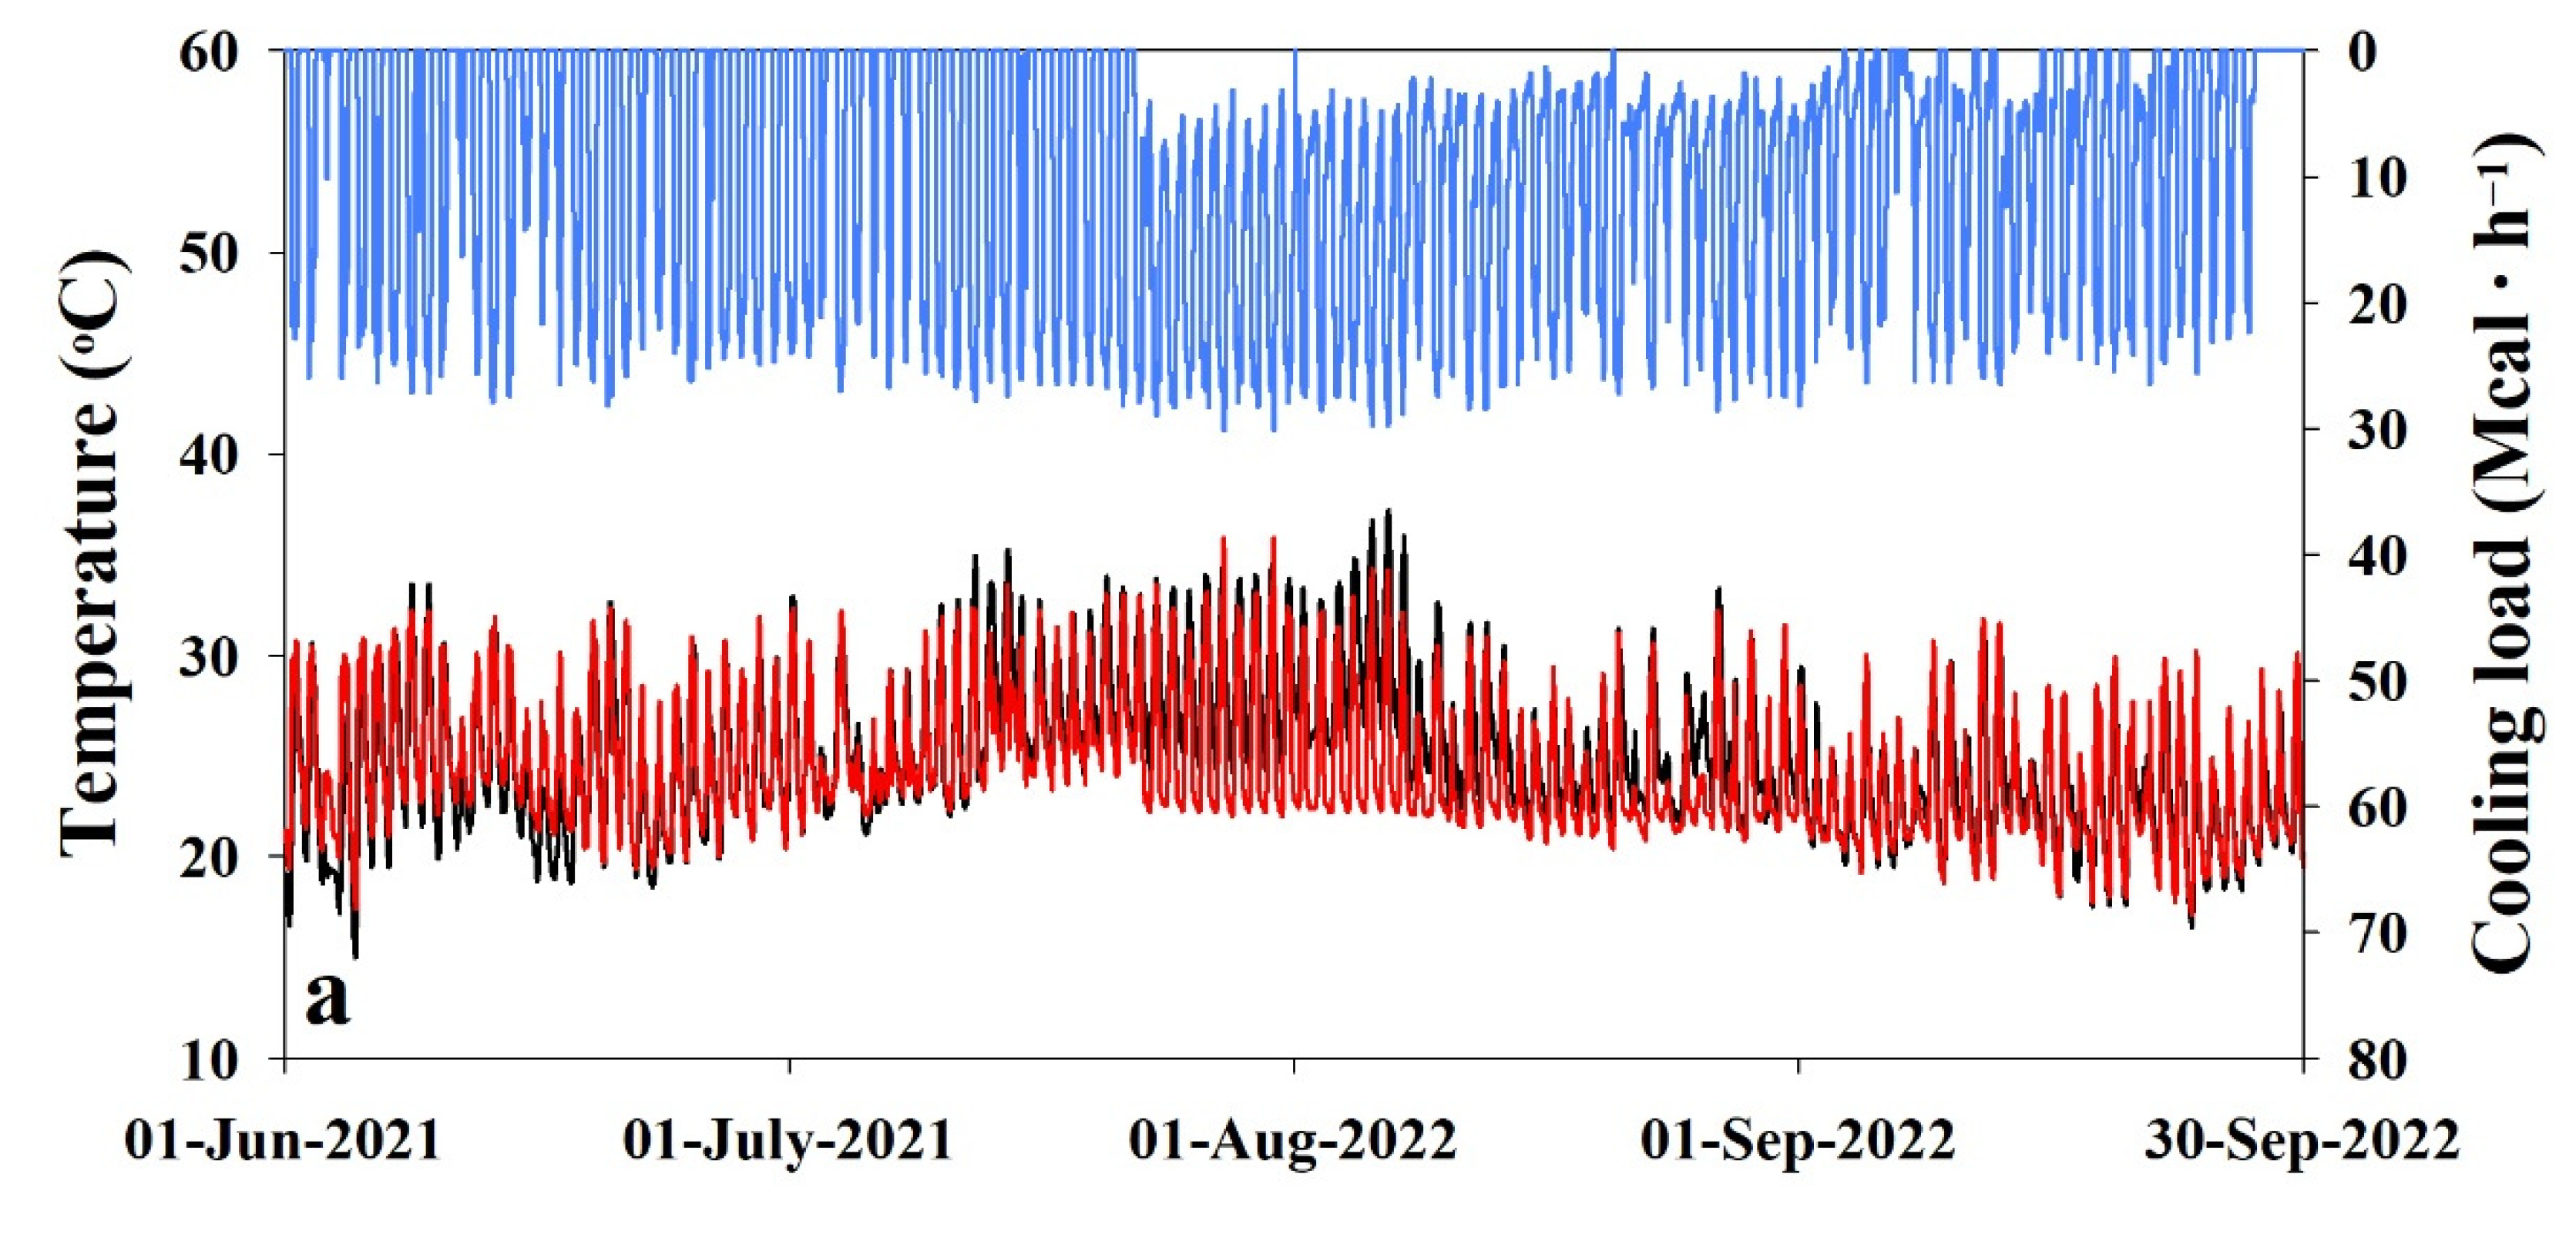
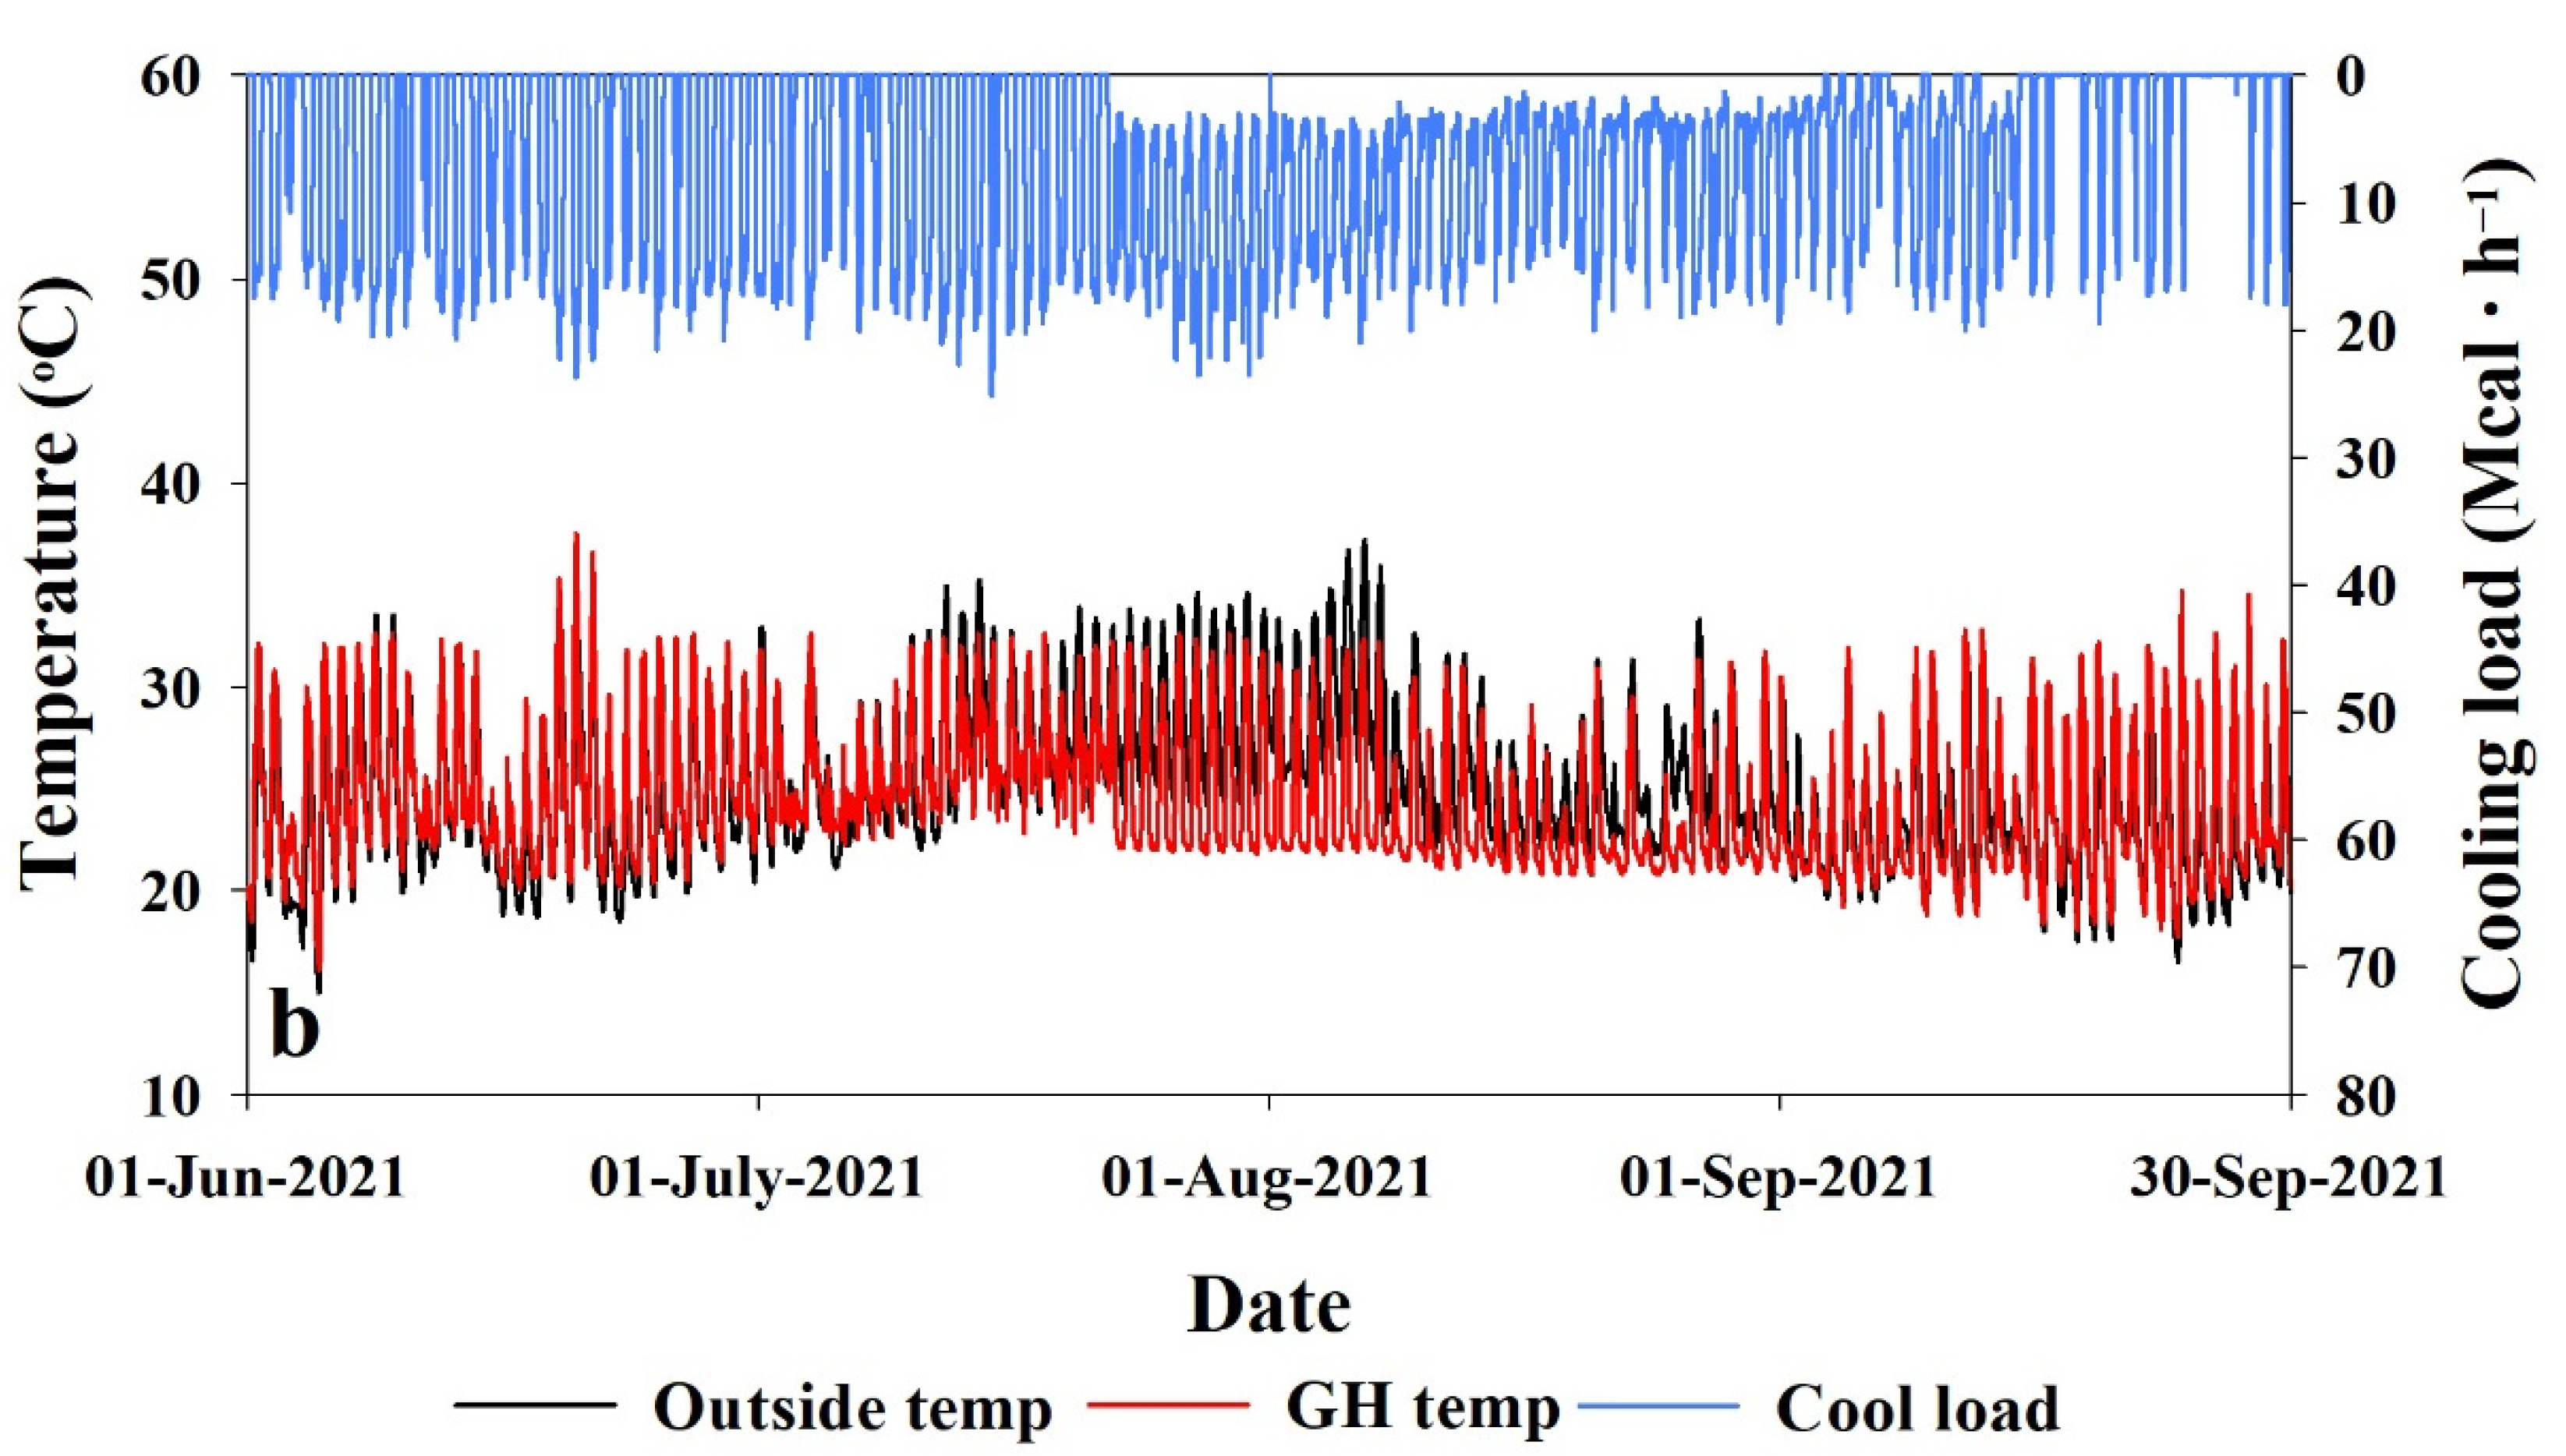
Figure 10a–d shows the cool energy supply per unit area of the greenhouse along with the outside solar radiation for the months of June–September 2021, respectively. The maximum cool energy supply to the greenhouse was 230 kcal∙h−1∙m−2 on 6 August 2021 when ambient solar radiation was the highest (850 kcal∙h−1∙m−2) of the whole experimental period analysis during summer. The overall trend of the cooling energy demand corelated with results from previous studies conducted using the cooling load calculation [26]. Figure 11a,b presents the greenhouse internal temperature along with the ambient air temperature and cooling load for the two different greenhouse sections GH 1 and GH 2, respectively during the summer period. The maximum cool energy supply to the GH 1 and GH 2 was 30 and 25 Mcal∙h−1. Moreover, the total cool energy supply during the summer season to GH 1 and GH 2 was 29,916 and 20,239 Mcal∙h−1. During the summer period only one HP was working with a cooling capacity of 55 Mcal∙h−1 to store cold water in the ST with the capacity of 50 m3. This was sufficient to achieve the desired controlled environment inside all the greenhouse sections. In contrast, the maximum cooling capacity of the two FCUs was 30 Mcal∙h−1. The temperature setpoint inside the greenhouse was 22 °C. It can be seen in Figure 11a,b that we were unable to achieve the desired temperature inside the greenhouse. This is because FCU capacity was much lower. The AWHP system was designed to achieve the heating load for the greenhouse but not the cooling load. It can be concluded that to achieve the desired setpoint temperature inside the greenhouse, the FCU capacity or the number of FCUs should be increased.
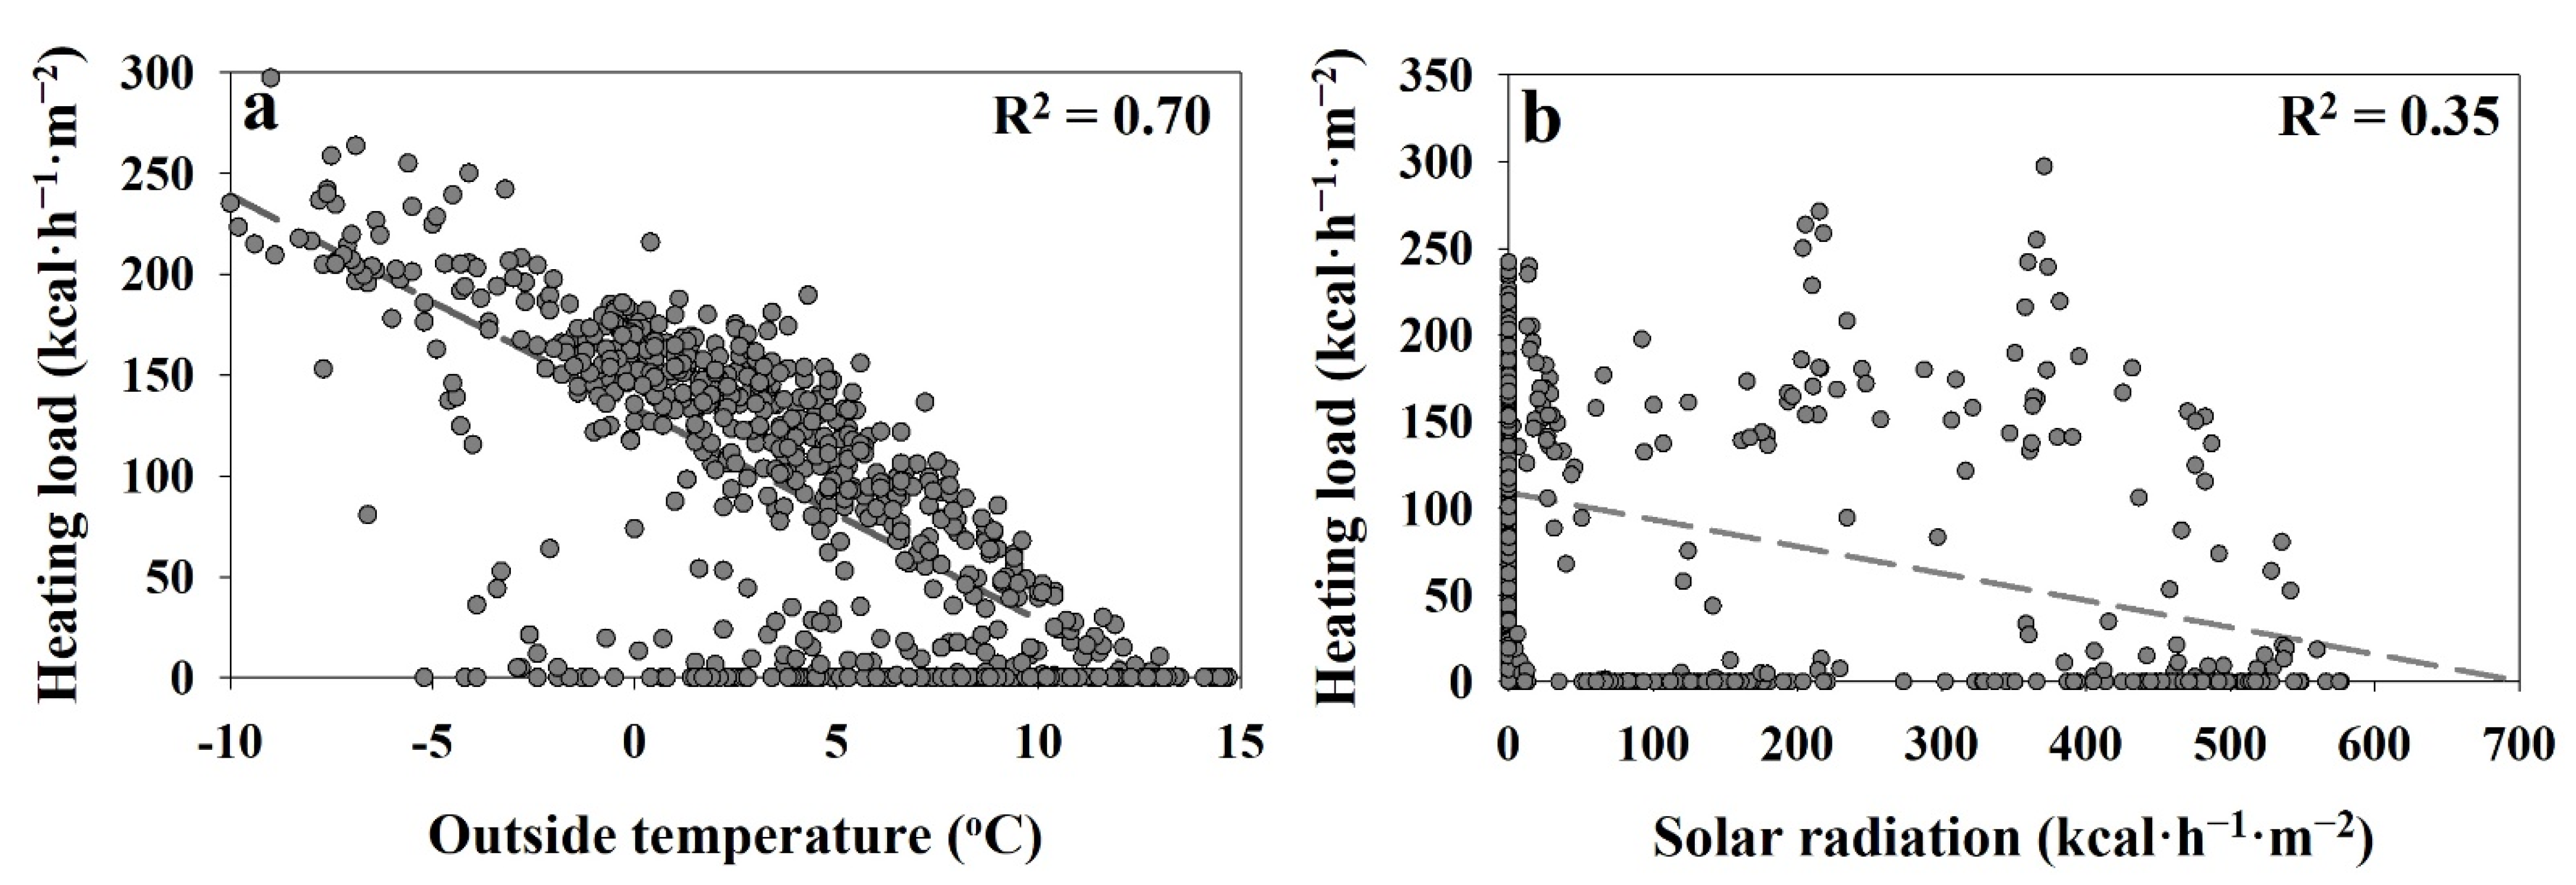
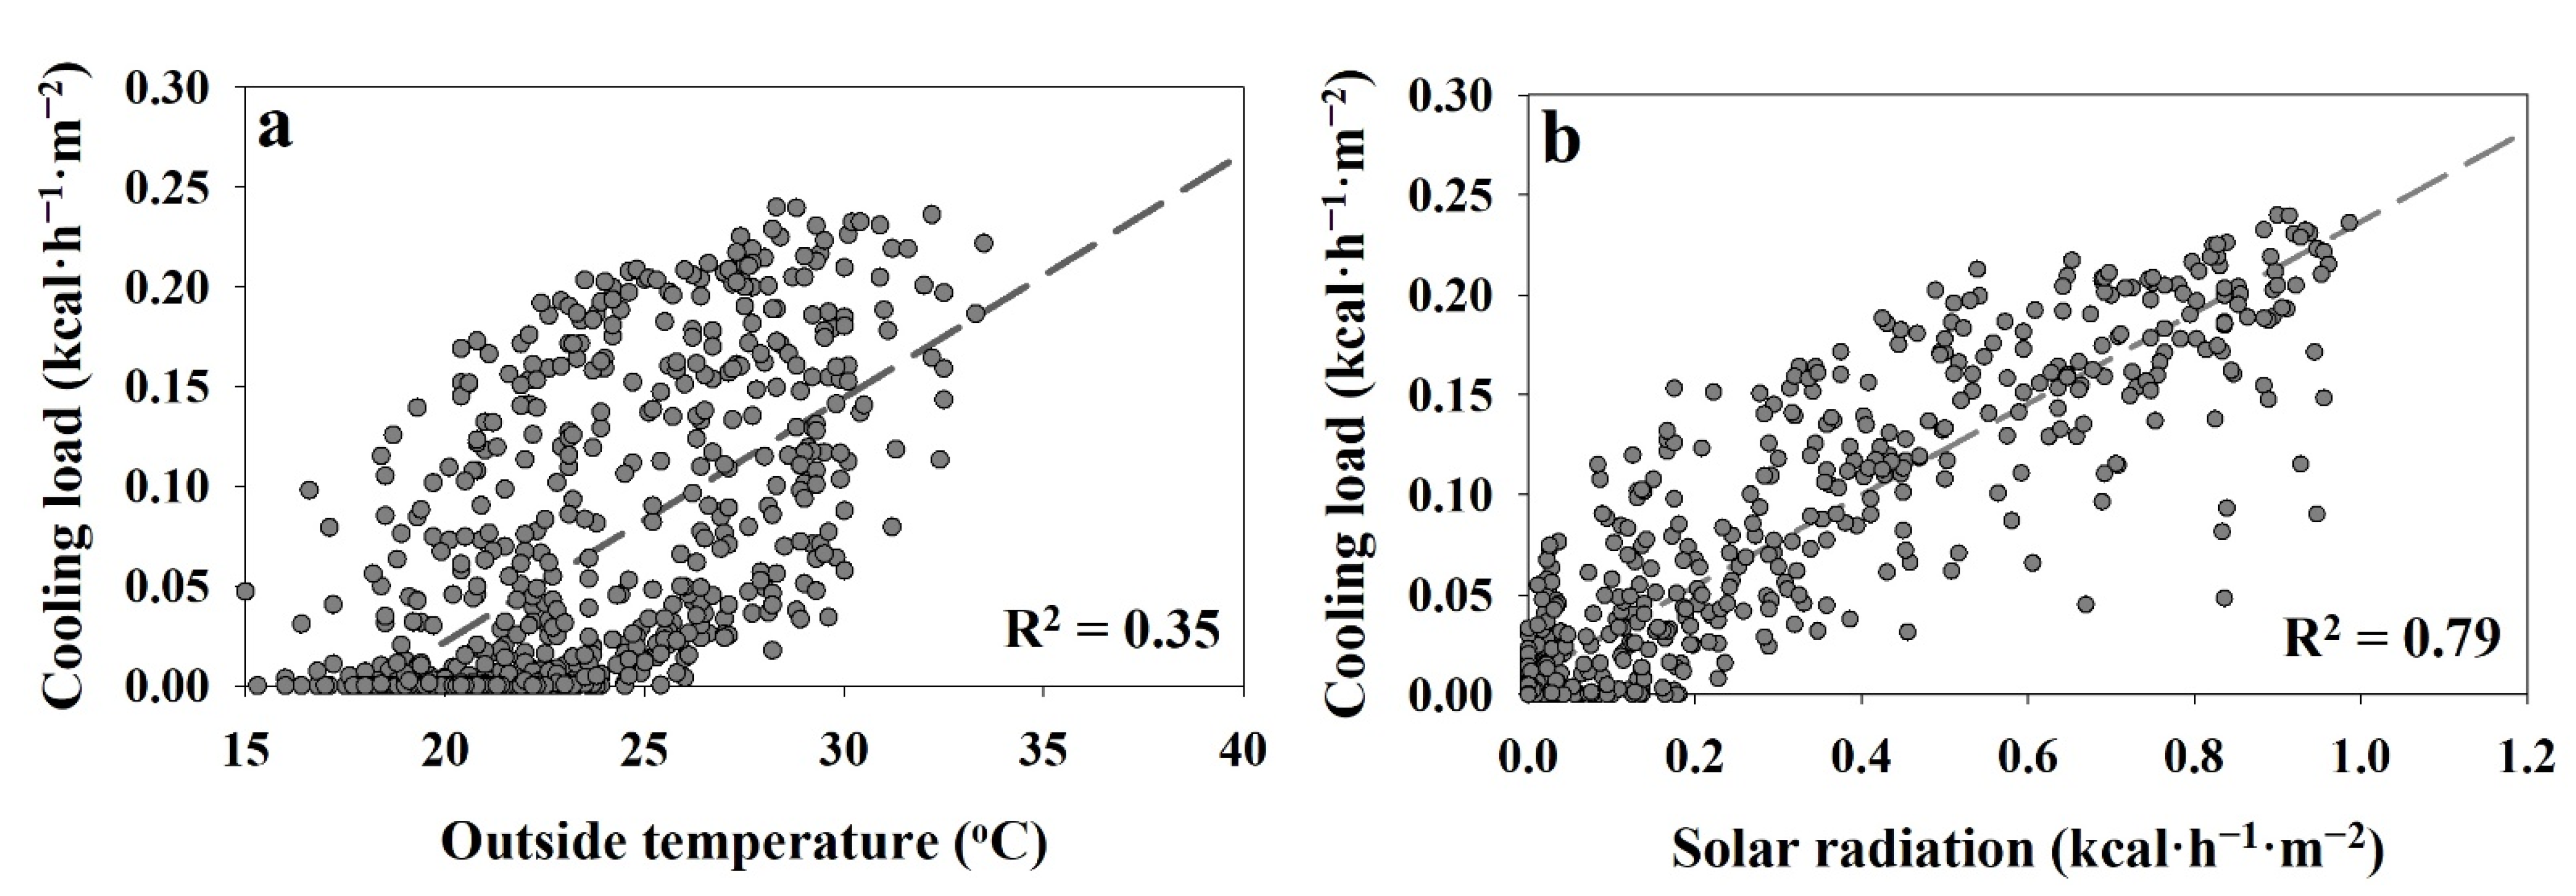
Further analyses were performed by comparing the calculated heating and cooling loads with the ambient air temperature and solar radiation. Linear regression (R2) analysis for the comparison was performed to determine the relationship between heating and cooling load with ambient weather parameters following the approach proposed by Safa et al. [35]. Figure 12a,b shows the results of the linear regression analysis of the heating load with ambient temperature and solar radiation, respectively. The results of the analysis show R2 values of 0.70 and 0.35, respectively, indicating that the heating load is more dependent on the ambient air temperature. Moreover, as shown in Figure 13a,b, the R2 values for cooling load compared with outside temperature and solar radiation were found to be 0.79 and 0.35, respectively, indicating that the solar radiation has more influence on cooling load of the greenhouse.
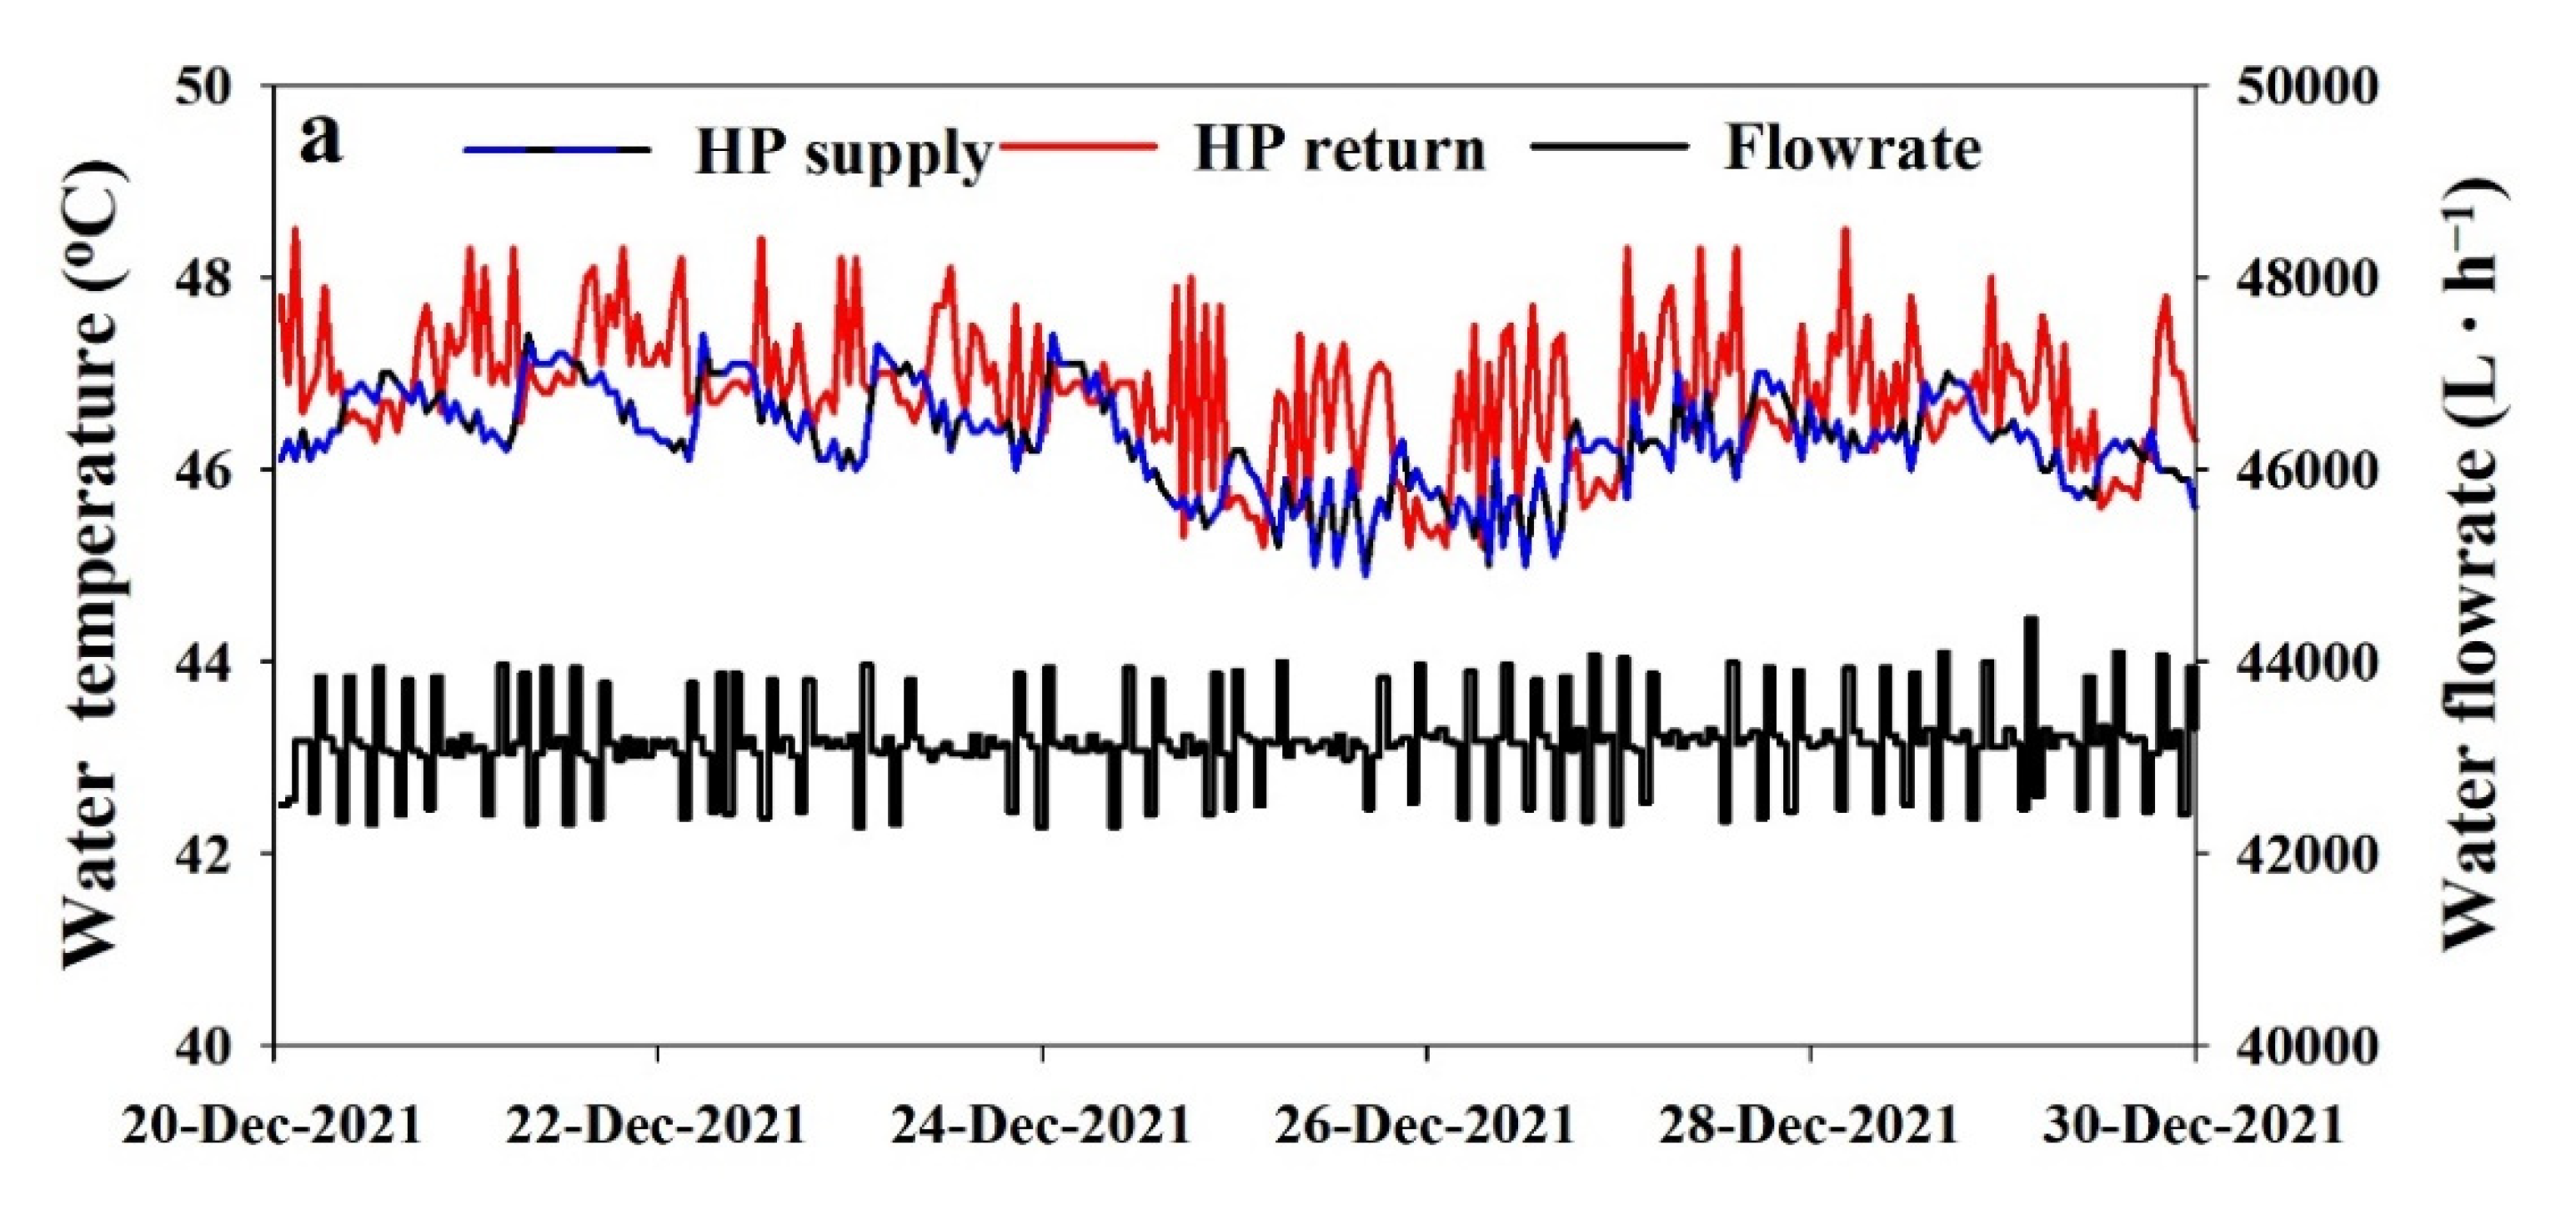
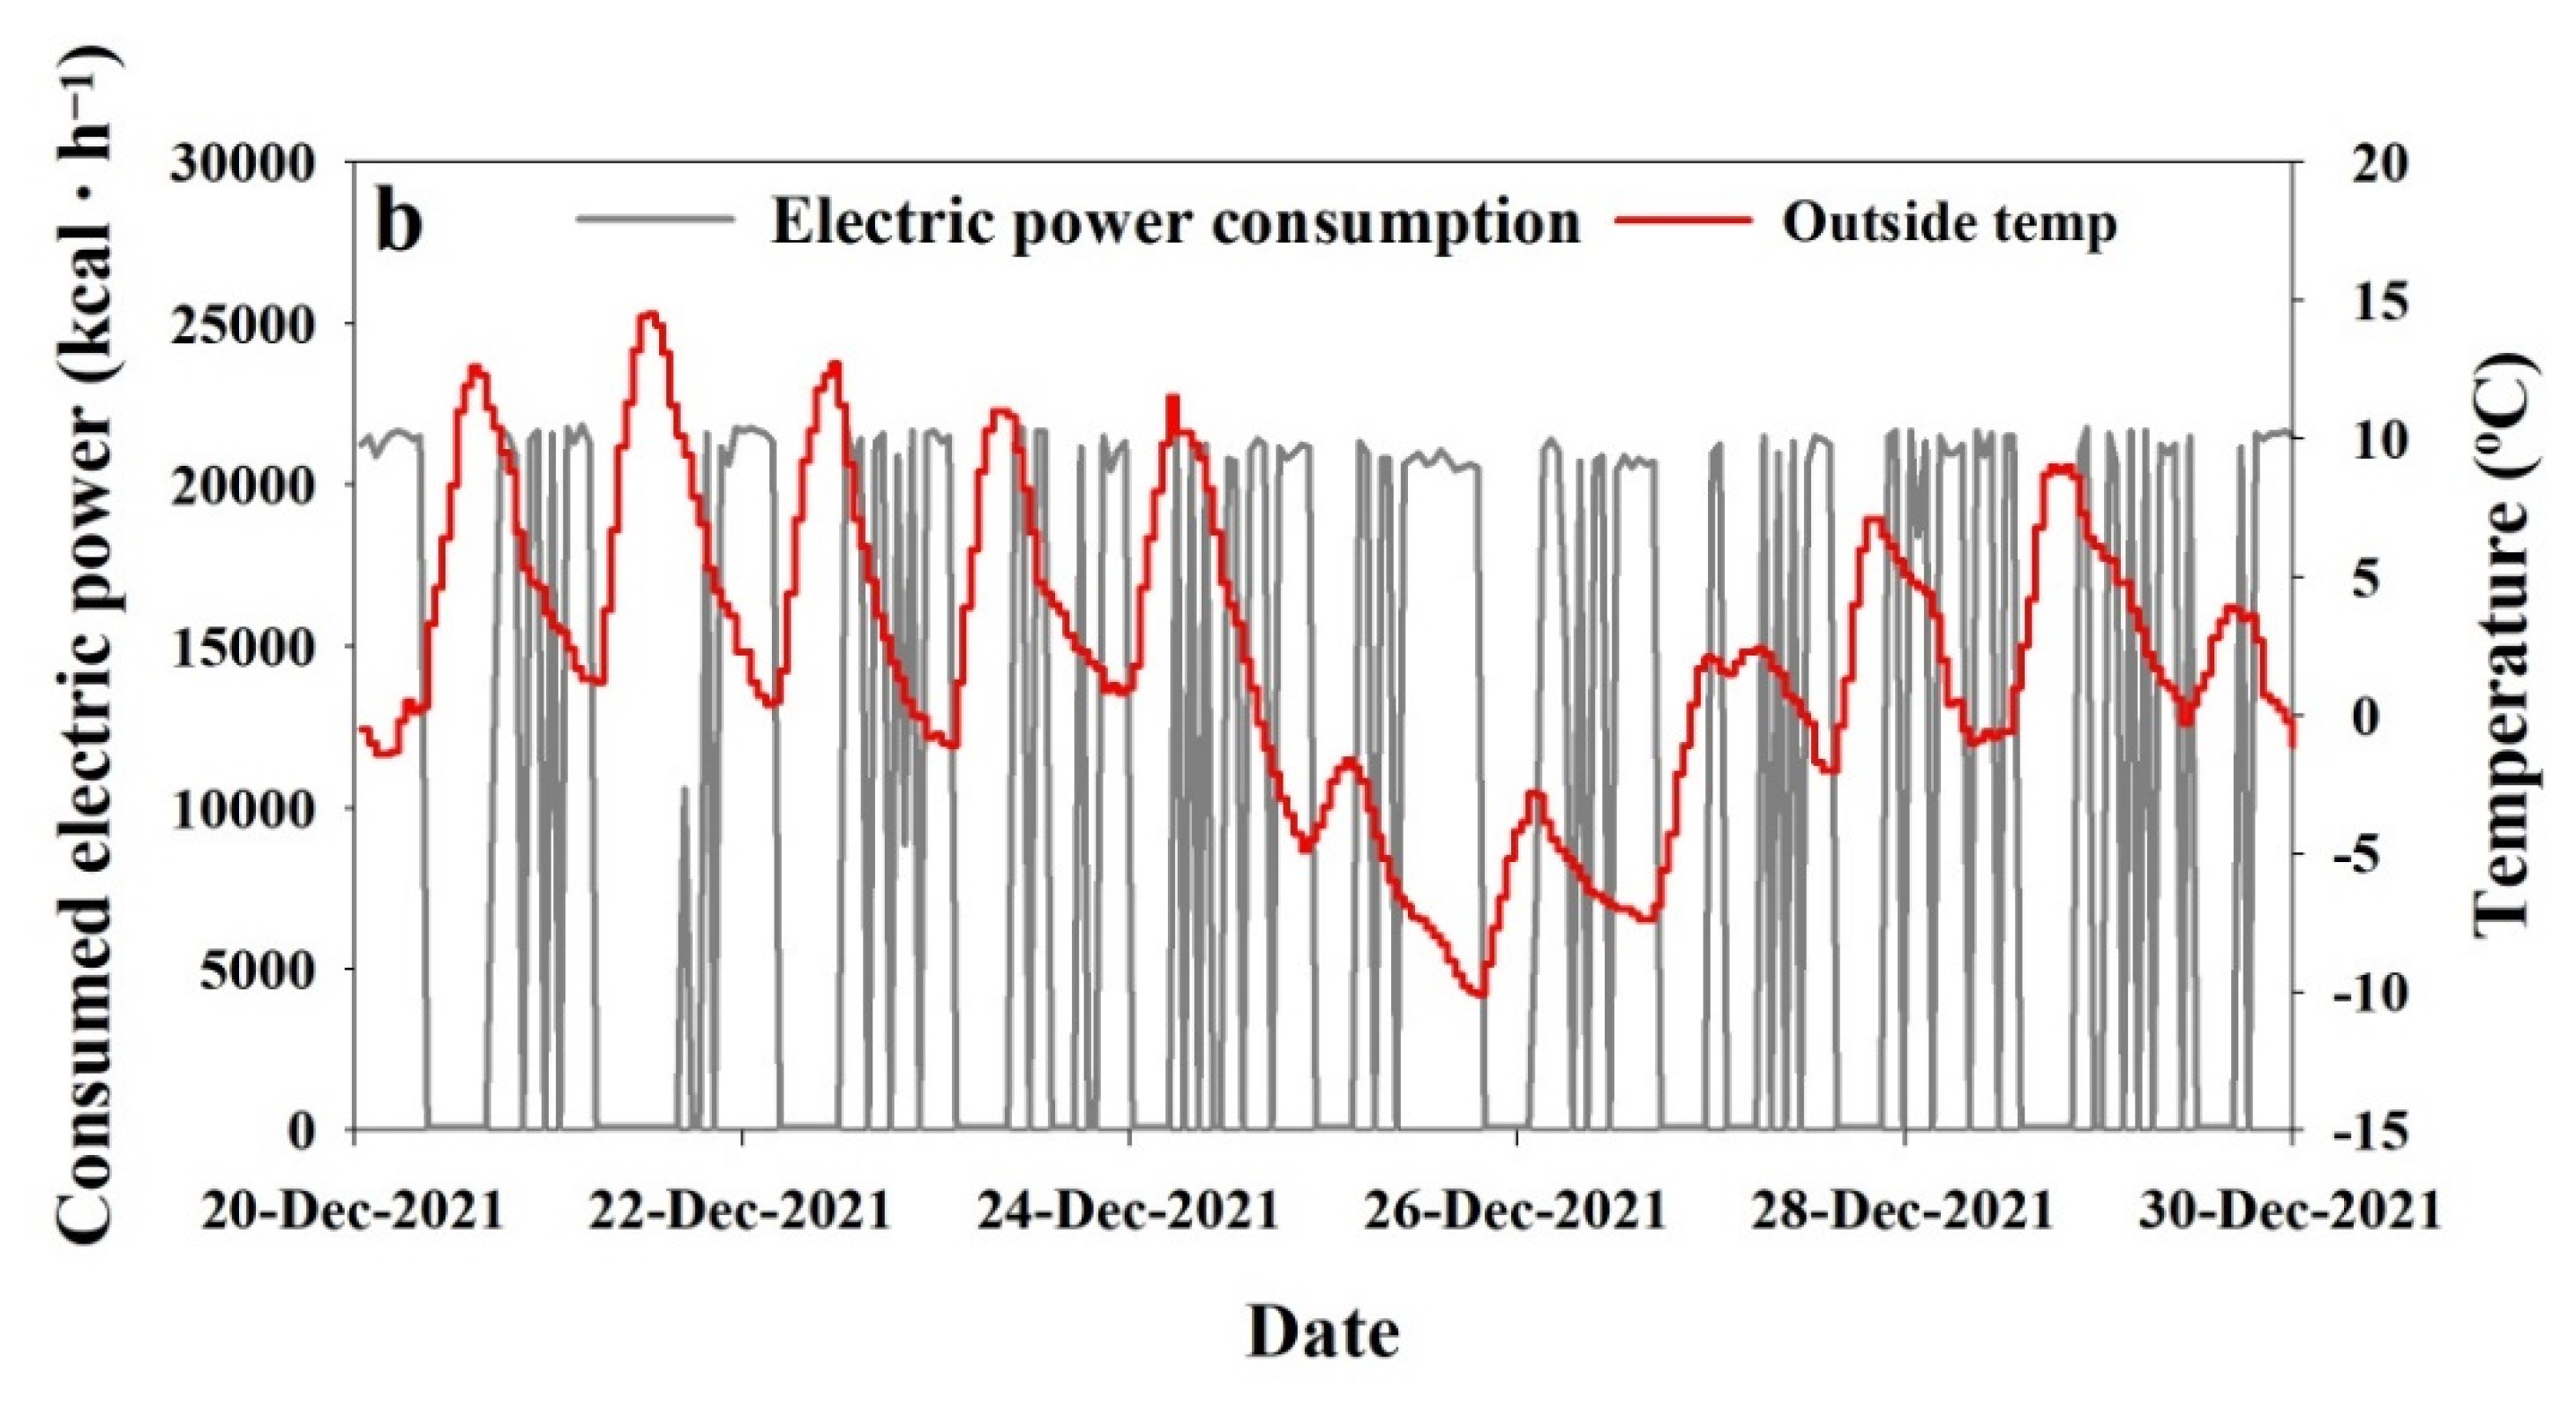
After analyzing the energy supply from the ST to the GH, further analyses were carried out with AWHP and ST thermal energy exchange. As the daily and seasonal operation of the heat pump was the same, some sample days of analysis from 20–30 December 2021 from winter period are presented here. Figure 14a shows the water flow rate of 4200 L∙h−1 from the ST to the AWHP during winter. Moreover, water flowed through the heat pump and ST continuously, even when the AWHP was not in operating mode. A temperature difference of 1.5 °C was found between the water supply and return supply from the AWHP when it was operating in full heating mode. The ST temperature was controlled using the on/off setting of the AWHP. Figure 14b shows the electric power consumption of the AWHP. During the operating mode, the AWHP was working at full capacity by utilizing a power consumption of approximately 18,000 kcal∙h−1. It can be observed from the results that when the ambient temperature decreases, the AWHP remains switched on.
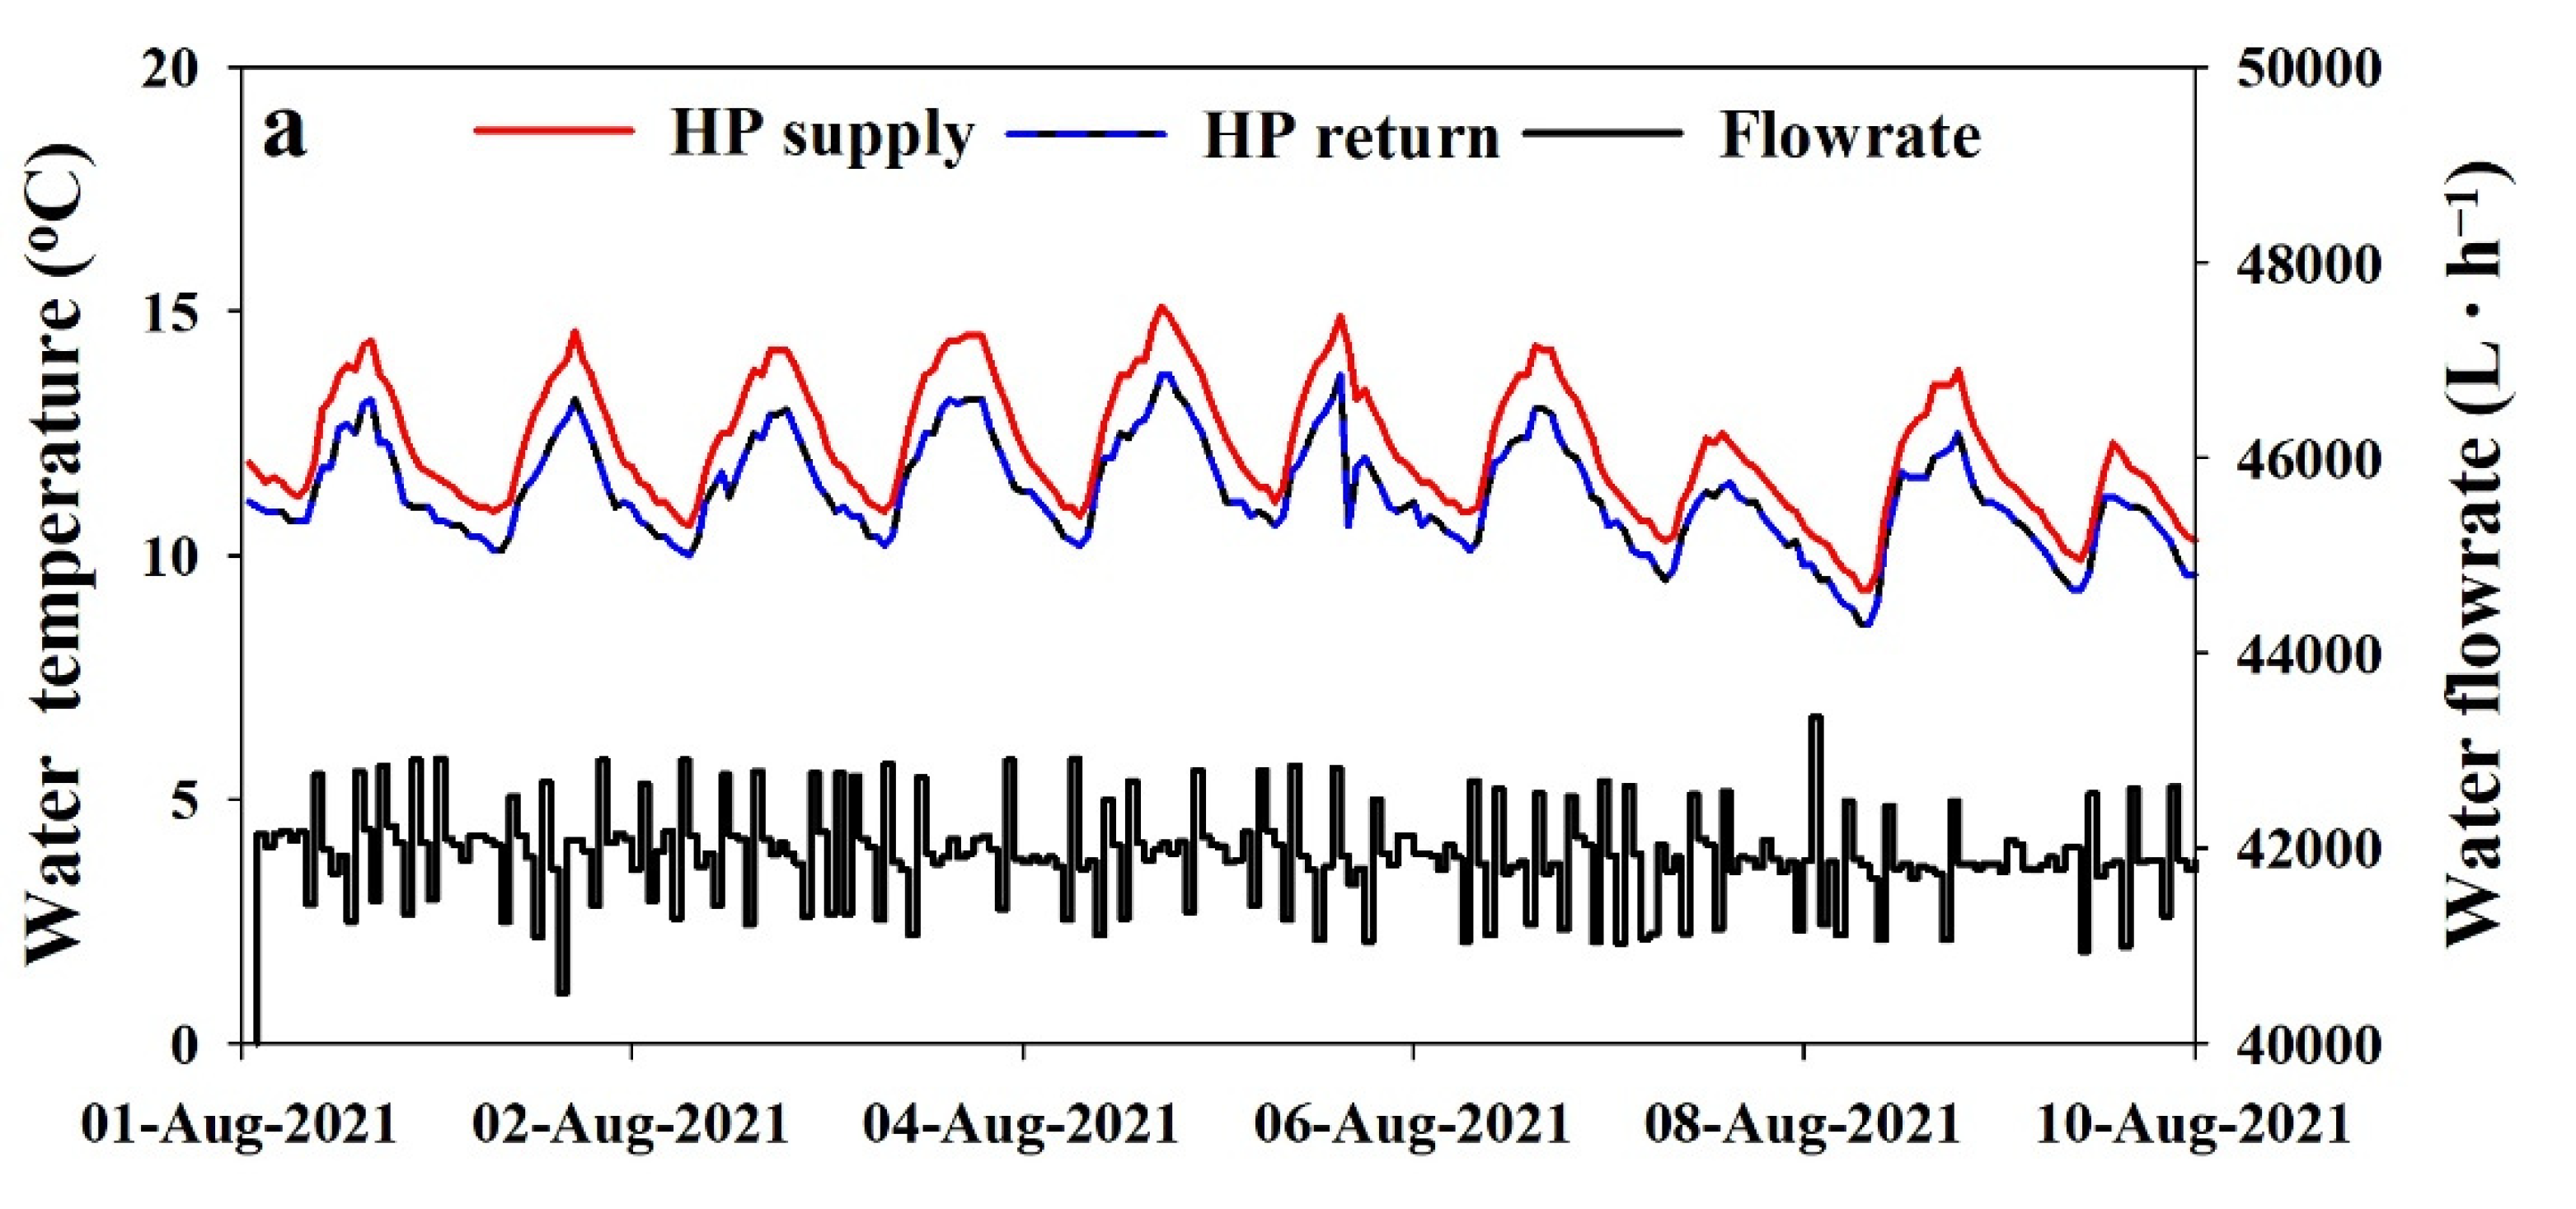
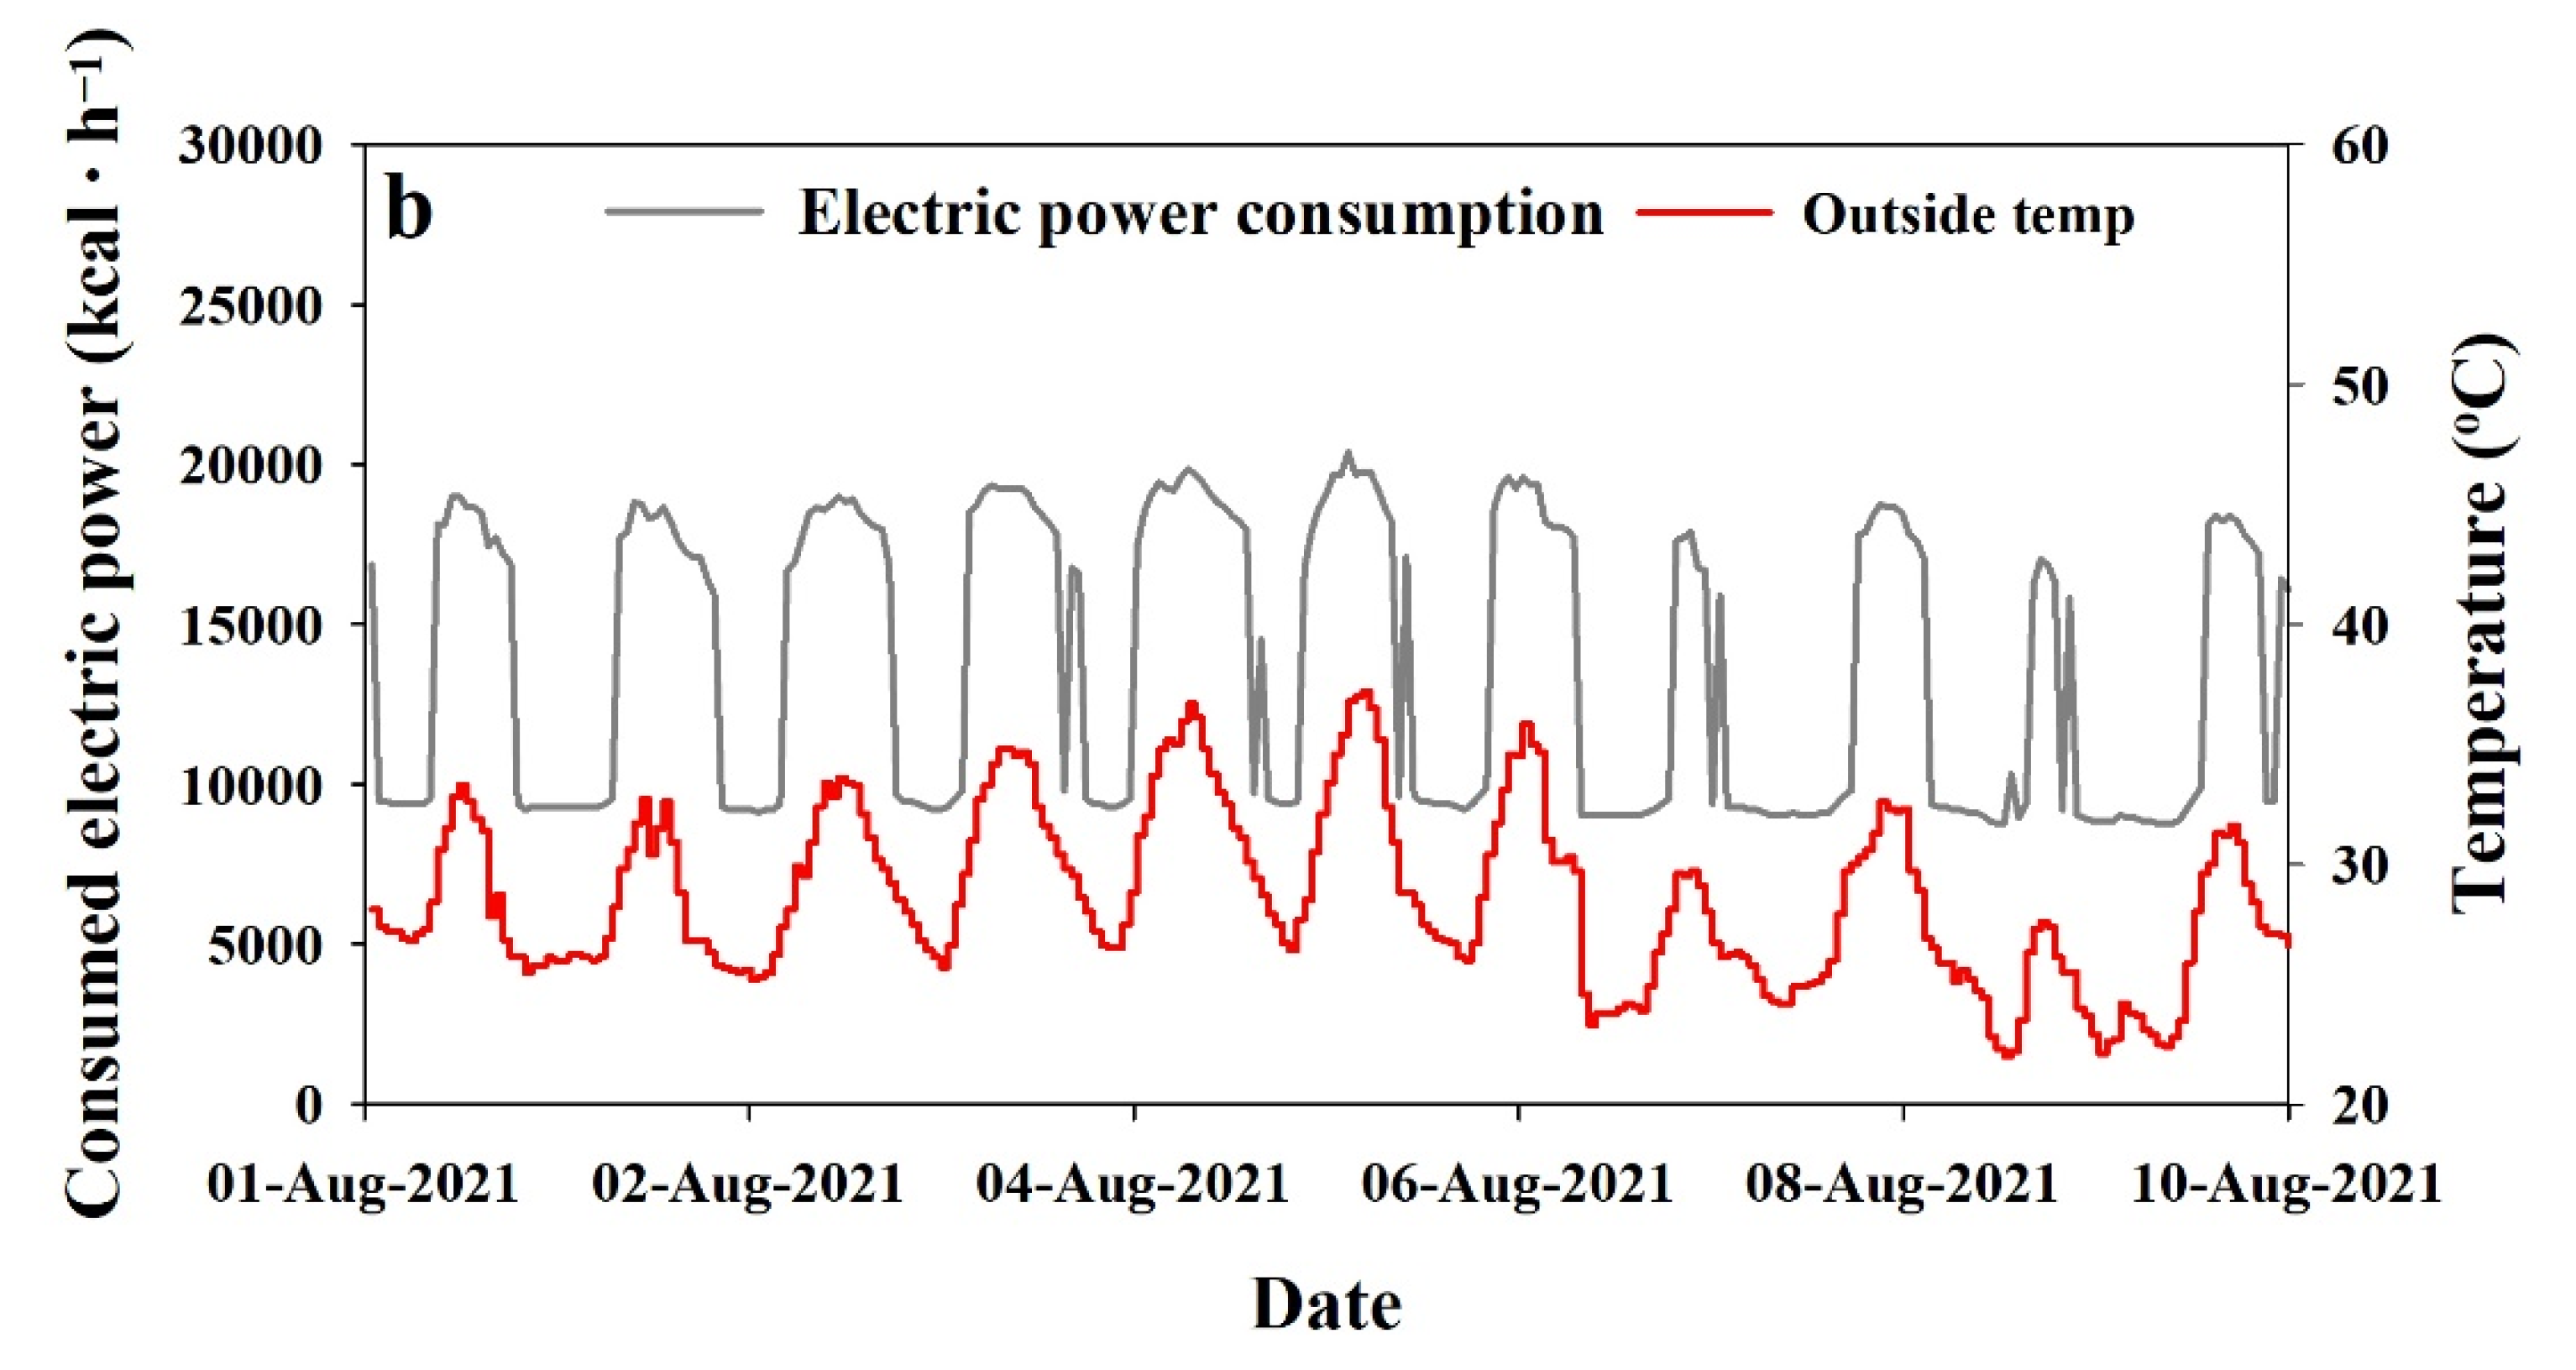
Figure 15a shows the supply and return temperature results presented for 1–10 August 2021 during the extreme summer period when 24-h cooling was required. The maximum supplied water temperature was 12.5 °C, and the return temperature after cooling was 14 °C. A temperature difference of 0.75–1.5 °C was found between the water supply and return from AWHP when it was operated on full cooling mode. In Figure 11b, the results showed that during daytime when maximum cooling was required, the AWHP consumed the maximum power of 18,000 kcal∙h−1 and approximately half the maximum power (8600 kcal∙h−1) during nighttime when less cooling was required. Moreover, it can be seen from the results that AWHP operation was well synchronized with the ambient temperature. When the ambient temperature goes up and more cooling is required, the AWHP works at its full capacity and at half capacity during the lower temperature condition when significantly less cooling is required.
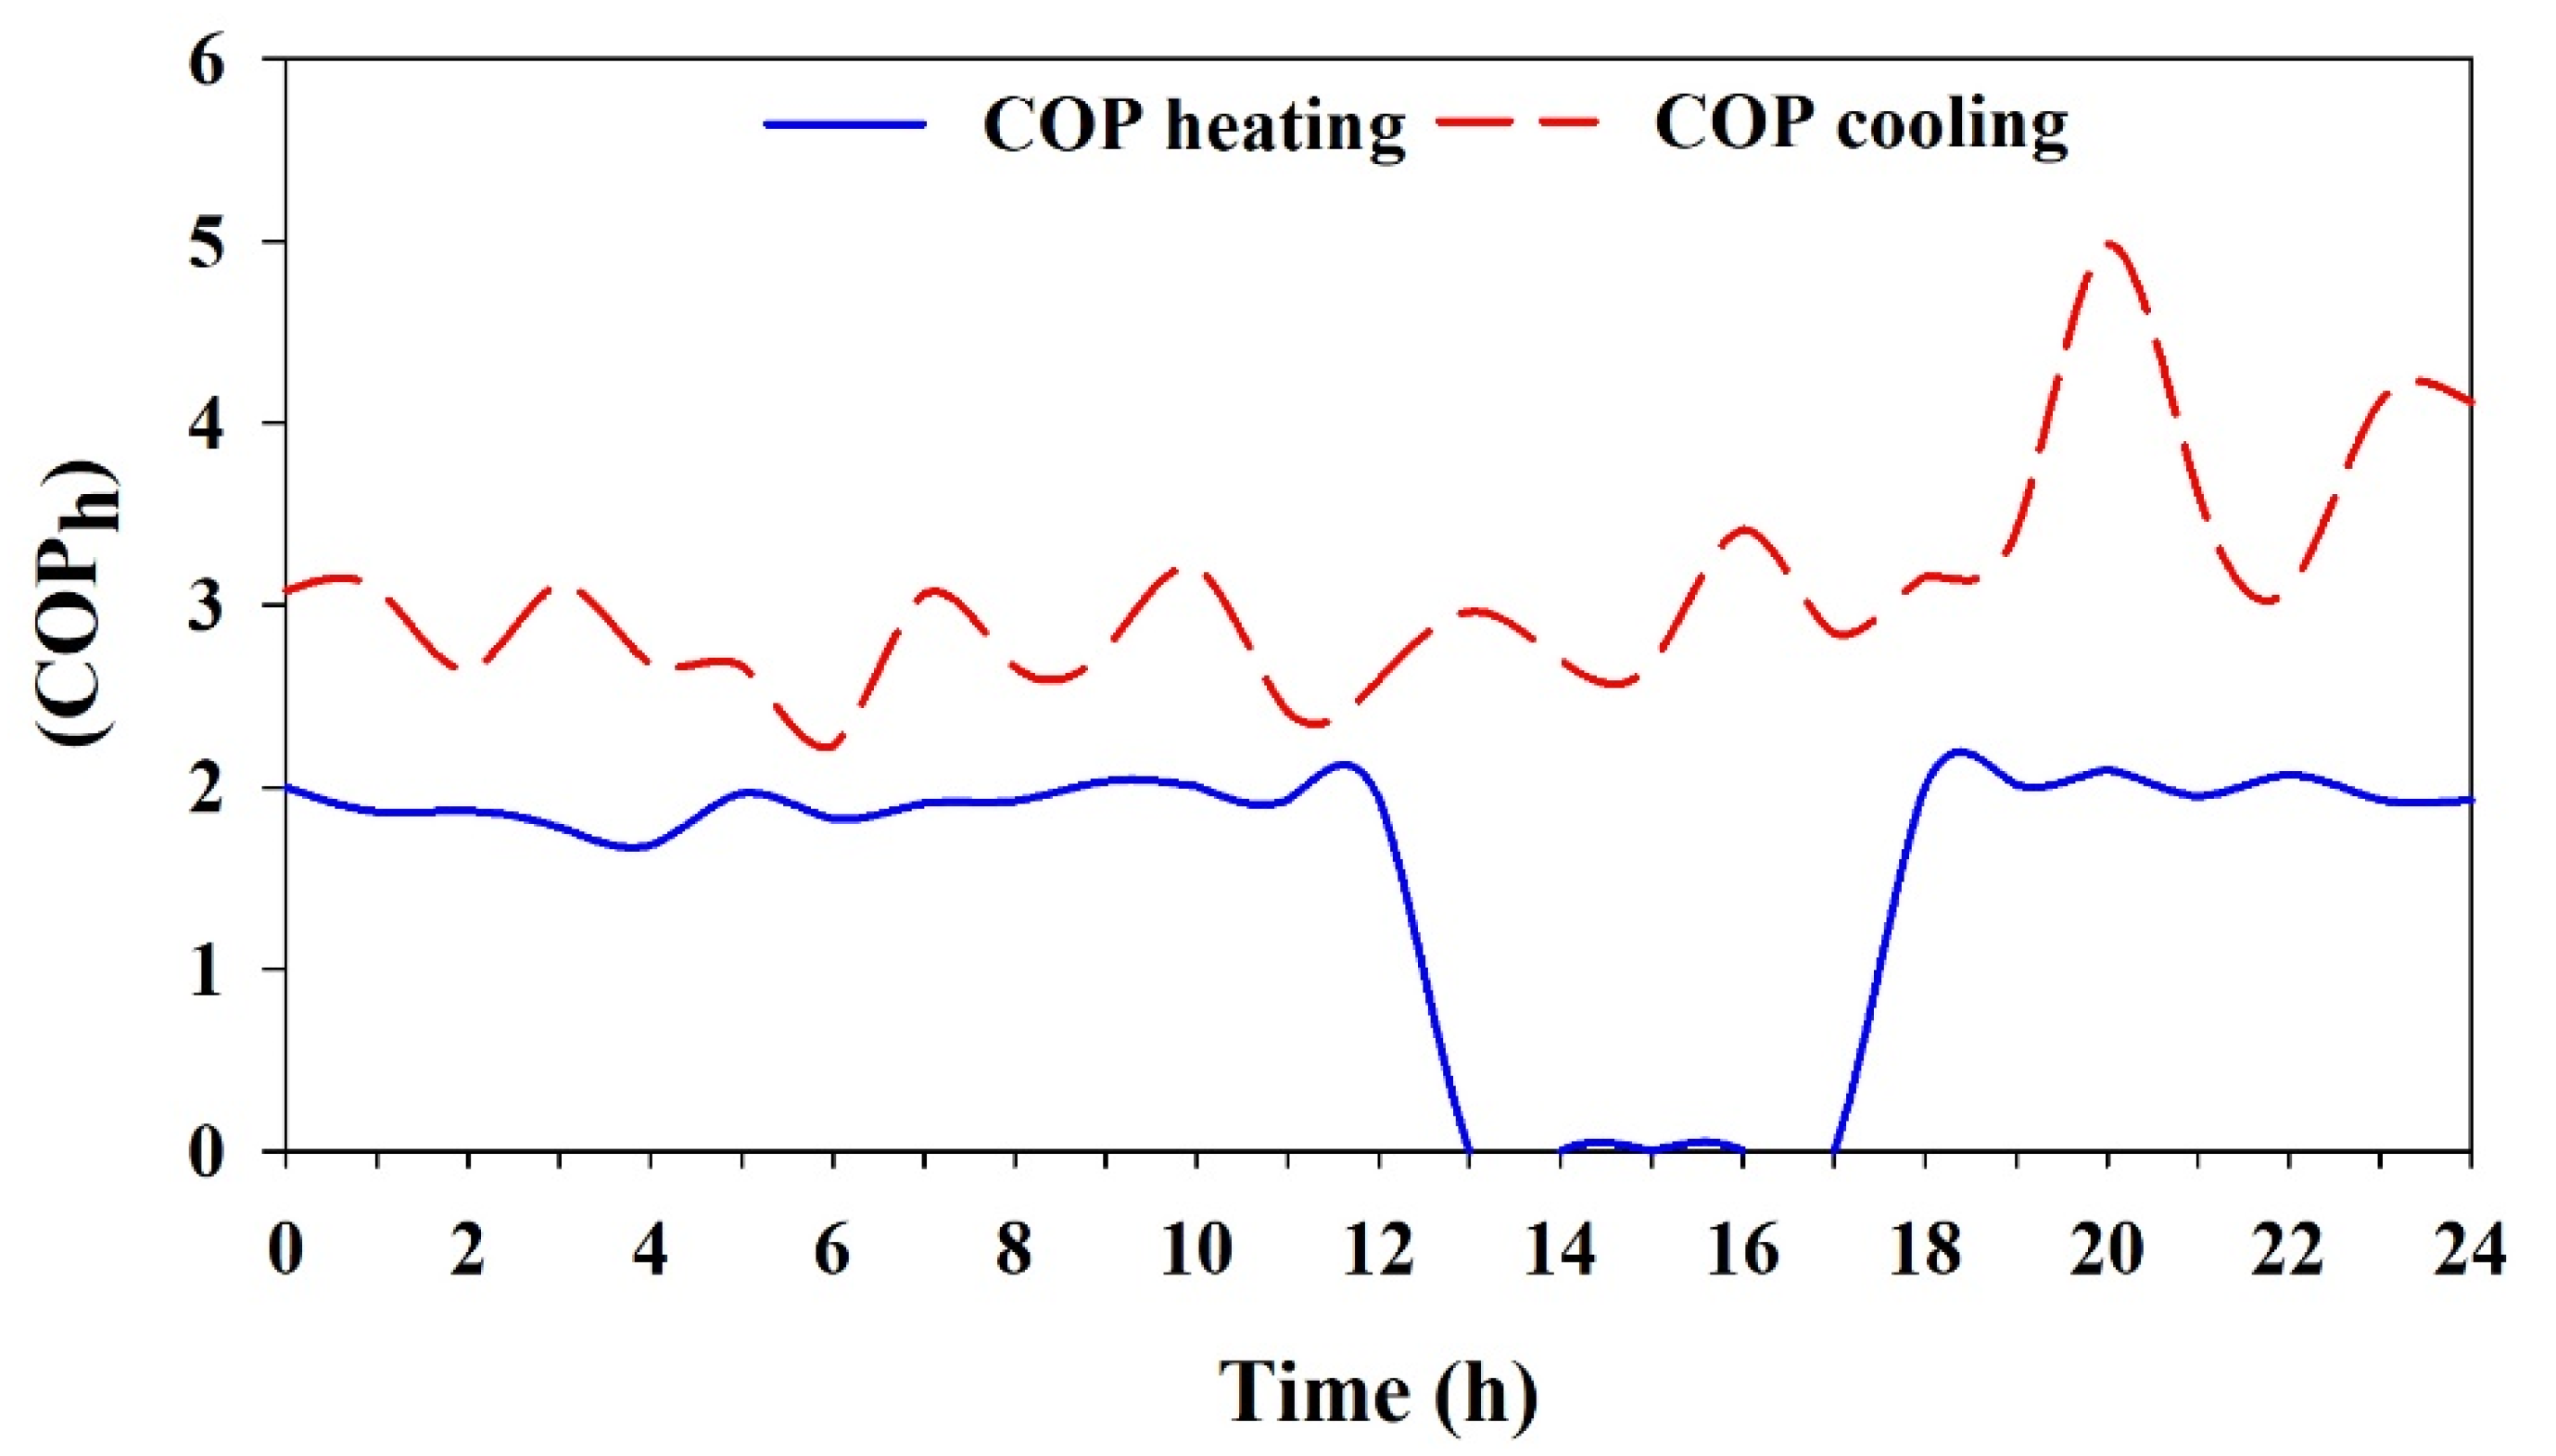
The heat-pump performance was evaluated by calculating the COP during the maximum heating and cooling periods over 24 h. The COP of the HP was calculated based on the cooling/heating capacity and electricity consumption, using Equation (2). The results presented in Figure 16 show that the average COP of the AWHP during the extreme winter period in the heating mode was 2.2 when operating at full capacity, and the calculated values were the same as those recommended by the manufacturer. The average amount of heating energy produced by the heat pump was 84,088 kcal∙h−1, and the consumed electric power was 38,718 kcal∙h−1. Moreover, the average amount of cooling energy produced by the heat pump was 29,030 kcal∙h−1, and the consumed electric power was 9286 kcal∙h−1, while the average COP was found to be 3.1 when operating at full capacity during the day featuring the highest temperature during summer. A previous study conducted by Jeon et al. also confirmed this trend of low COP in winter and high COP in summer in South Korea [36]. The COP of the heat pump was sensitive to the ST temperature. In Figure 6, we can see that, during winter, the water supply and return temperature difference between the ST and greenhouse is higher than that in the summer season, which affects the average temperature of the ST. This is because during winter, the FCU utilized more energy and during the summer season less because the FCU capacity was insufficient to provide the required energy to the greenhouse. Another factor that also caused the higher COP during summer and lower COP in winter was the air temperature difference between ambient and greenhouse microclimates at 30 °C (Figure 9) during winter, which also confirms that the air source heat pump decreases due to the much colder outside temperature [23,37]. During summer, it was difficult to cool the greenhouse to below the ambient temperature of 35 °C (Figure 10) because of the low FCU capacity, and the temperature difference was less, so the COP was higher than in winter.
4. Conclusions
In this study, the configuration and performance of an air-to-water heat pump system were evaluated to fulfil the heating and cooling energy requirements of a three-spanned greenhouse located in Daegu, South Korea. The system consisted of three air-to-water heat pumps (AWHP), a water storage tank (ST), and two fan coil units in each part of the greenhouse. The analyses were carried out during the summer season (1 June 2021 to 30 September 2021) and winter season (1 November 2021 to 31 March 2022). The results of this study are presented as a case study of the system under local weather conditions at the studied location. The results of this study are detailed below:
- The maximum cool energy supply to the greenhouse was 230 kcal∙h−1∙m−2 on 6 August 2021 when the ambient solar radiation was the highest at 850 kcal∙h−1∙m−2. Moreover, the maximum cooling energy supply to greenhouse section 1 (GH 1) and section 2 (GH 2) was 30 and 25 Mcal∙h−1, and the total cool energy supply during the summer period to greenhouse section 1 (GH 1) and section 2 (GH 2) was 29,916 and 20,239 Mcal∙h−1.
- The maximum heat energy supply to the greenhouse was 210 kcal∙h−1∙m−2 on 26 December 2021 when the ambient temperature was the lowest (−10 °C). In addition, the maximum heat energy supplied to greenhouse sections 1 (GH 1) and 2 (GH 2) was 33 and 24 Mcal∙h−1 and the total heat energy supplied during the winter season to the greenhouse section 1 (GH 1) and section 2 (GH 2) was 46,225 and 17,438 Mcal∙h−1.
- The desired air temperature of 20 °C was achieved during the winter season, while during the summer season, a setpoint temperature of 22 °C was achieved during the night. However, during the daytime, the air temperature was 30 °C, which was higher than the desired air temperature.
- The linear regression R2 analysis of the heating load with ambient temperature and solar radiation was 0.70 and 0.35, respectively, showing that the heating load is more dependent on the outside air temperature. Moreover, the R2 values for cooling load compared with outside air temperature and ambient solar radiation were found to be 0.35 and 0.79, respectively, indicating the fact that the cooling load is more dependent on the outside solar radiation.
- The average COP of the AWHP in heating mode was 2.2 when operating at full capacity. The average amount of heating energy produced by the heat pump was 84,088 kcal∙h−1, and the consumed electric power was 38,718 kcal∙h−1. The average COP of the AWHP in cooling mode was 3.1 when operating at full capacity; the average amount of cooling energy produced by the heat pump was 29,030 kcal∙h−1, and the consumed electric power was 9286 kcal∙h−1.
In summary, a step toward making greenhouse farming fossil-free to achieve the zero-emission goal has been made. The results discussed above show that the studied AWHP system can provide heating during winter. During summer, the FCU capacity was not sufficient to provide the desired cooling to achieve the setpoint air temperature inside the greenhouse. To achieve the desired microclimate during the summer season, the capacity of the FCU or number of FCUs must be increased. Moreover, one AWHP capacity of 55,900 and 60,200 kcal∙h−1 along with an ST capacity of 50 m3 were sufficient to provide cooling and heating, respectively, in both seasons. Two additional AWHPs can be used to provide energy to more greenhouse areas in the future. Furthermore, these results could be useful when utilizing renewable energy in greenhouses to reduce energy costs. The results of the study and analysis of the system’s operation can be used as a competitive method to provide heating and cooling of greenhouses when compared to the other energy providing sources and other locations. The study will increase reliance on sustainability and renewable energy to ensure more stable, reliable, and resilient energy sources of greenhouse heating and cooling. Moreover, the work will promote and advance the development work toward use of renewable energy sources in greenhouse farming and maximize the economic benefit by increasing the profitability of the greenhouse farming. Future studies will focus on economic assessment along with the payback period and environmental feasibility of the studied AWHP system. Moreover, a comparison study could be conducted with other renewable energy systems, such as solar, geothermal, hybrid, and integrated renewable energy systems
Author Contributions
Conceptualization, A.R., J.W.L. and H.W.L.; methodology, A.R.; validation, A.R. and H.T.K.; formal analysis, A.R. and J.W.L.; investigation, A.R. and J.W.L.; resources, H.W.L. and H.T.K.; data curation, A.R., J.W.L. and H.T.K.; writing—original draft preparation, A.R.; writing—review and editing, A.R., J.W.L., H.T.K. and H.W.L.; visualization, H.T.K. and H.W.L.; supervision, H.W.L.; project administration, H.W.L.; funding acquisition, H.W.L. All authors have read and agreed to the published version of the manuscript.
Funding
This work was supported by the Korea Institute of Planning and Evaluation for Technology in Food, Agriculture, Forestry (IPET) through Agriculture, Food and Rural Affairs Convergence Technologies Program for Educating Creative Global Leader, funded by the Ministry of Agriculture, Food and Rural Affairs (MAFRA) (717001-7). This research was supported by the Basic Science Research Program through the National Research Foundation of Korea (NRF) funded by the Ministry of Education (NRF-2019R1I1A3A01051739). This work was supported by the Korea Institute of Planning and Evaluation for Technology in Food, Agriculture and Forestry (IPET) through Agricultural Energy Self-Sufficient Industrial Model Development Program, funded by Ministry of Agriculture, Food and Rural Affairs (MAFRA) (120096-3).
Institutional Review Board Statement
Not applicable.
Informed Consent Statement
Not applicable.
Data Availability Statement
Not applicable.
Conflicts of Interest
The authors declare no conflict of interest regarding the publication of this research.
Nomenclature
| Symbols | |
| Q | Cooling capacity of the AWHP (kcal·h−1) |
| Mass flow rate of air (kg·h−1) | |
| cp | Specific heat capacity of water (kcal·kg−1·°C−1), |
| Convective heat transfer (kcal·h−1·m−2·k−1) | |
| PHP | Power usage of AWHP (kcal) |
| Abbreviations | |
| HP | Heat pump |
| GH | Greenhouse |
| AWHP | Air-to-water heat pump |
| GSHP | Ground source heat pump |
| AAHP | Air-to-air heat pump |
| CEA | Controlled environment agriculture |
| FCU | Fan coil unit |
| COP | Coefficient of performance |
| ST | Water storage tank |
| PI | Proportional–integral |
References
- Gilbert, N. One-third of our greenhouse gas emissions come from agriculture. Nature 2012, 31, 10–12. [Google Scholar] [CrossRef]
- Arora, N.K.; Mishra, I. United nations sustainable development goals 2030 and environmental sustainability: Race against time. Environ. Sustain. 2019, 2, 339–342. [Google Scholar] [CrossRef] [Green Version]
- Bartzanas, T.; Tchamitchian, M.; Kittas, C. Influence of the heating method on greenhouse microclimate and energy consumption. Biosyst. Eng. 2005, 91, 487–499. [Google Scholar] [CrossRef]
- Tong, Y.; Kozai, T.; Nishioka, N.; Ohyama, K. Greenhouse heating using heat pumps with a high coefficient of performance (cop). Biosyst. Eng. 2010, 106, 405–411. [Google Scholar] [CrossRef]
- Rasheed, A.; Kwak, C.S.; Kim, H.T.; Lee, H.W. Building energy an simulation model for analyzing energy saving options of multi-span greenhouses. Appl. Sci. 2020, 10, 6884. [Google Scholar] [CrossRef]
- Lee, J.-Y. Current status of ground source heat pumps in korea. J Renew. Sustain. Energy Rev. 2009, 13, 1560–1568. [Google Scholar] [CrossRef]
- Benli, H.; Durmuş, A. Evaluation of ground-source heat pump combined latent heat storage system performance in greenhouse heating. Energy Build. 2009, 41, 220–228. [Google Scholar] [CrossRef]
- Benli, H. Energetic performance analysis of a ground-source heat pump system with latent heat storage for a greenhouse heating. Energy Convers. Manag. 2011, 52, 581–589. [Google Scholar] [CrossRef]
- Cuce, E.; Harjunowibowo, D.; Cuce, P.M. Renewable and sustainable energy saving strategies for greenhouse systems: A comprehensive review. Renew. Sustain. Energy Rev. 2016, 64, 34–59. [Google Scholar] [CrossRef]
- Ozgener, O.; Hepbasli, A. Experimental investigation of the performance of a solar-assisted ground-source heat pump system for greenhouse heating. Int. J. Energy Res. 2005, 29, 217–231. [Google Scholar] [CrossRef]
- Ozgener, O. Use of solar assisted geothermal heat pump and small wind turbine systems for heating agricultural and residential buildings. J. Energy 2010, 35, 262–268. [Google Scholar] [CrossRef]
- Wang, X.; Zheng, M.; Zhang, W.; Zhang, S.; Yang, T. Experimental study of a solar-assisted ground-coupled heat pump system with solar seasonal thermal storage in severe cold areas. Energy Build. 2010, 42, 2104–2110. [Google Scholar] [CrossRef]
- Ataei, A. Performance optimization of a combined solar collector, geothermal heat pump and thermal seasonal storage system for heating and cooling greenhouses. J. Appl. Eng. Sci. 2016, 14, 296–305. [Google Scholar] [CrossRef] [Green Version]
- Kim, M.-H.; Lee, D.-W.; Yun, R.; Heo, J. Operational energy saving potential of thermal effluent source heat pump system for greenhouse heating in jeju. Int. J. Air-Cond. Refrig. 2017, 25, 1750030. [Google Scholar] [CrossRef]
- Yildirim, N.; Bilir, L. Evaluation of a hybrid system for a nearly zero energy greenhouse. Energy Convers. Manag. 2017, 148, 1278–1290. [Google Scholar] [CrossRef]
- Boughanmi, H.; Lazaar, M.; Guizani, A. A performance of a heat pump system connected a new conic helicoidal geothermal heat exchanger for a greenhouse heating in the north of tunisia. Sol. Energy 2018, 171, 343–353. [Google Scholar] [CrossRef]
- Hassanien, R.H.E.; Li, M.; Tang, Y. The evacuated tube solar collector assisted heat pump for heating greenhouses. Energy Build. 2018, 169, 305–318. [Google Scholar] [CrossRef]
- Xiao, B.; He, L.; Zhang, S.; Kong, T.; Hu, B.; Wang, R. Comparison and analysis on air-to-air and air-to-water heat pump heating systems. Renew. Energy 2020, 146, 1888–1896. [Google Scholar] [CrossRef]
- Safa, A.A.; Fung, A.S.; Kumar, R. Buildings. Performance of two-stage variable capacity air source heat pump: Field performance results and trnsys simulation. Energy Build. 2015, 94, 80–90. [Google Scholar] [CrossRef]
- Gram-Hanssen, K.; Christensen, T.H.; Petersen, P.E. Air-to-air heat pumps in real-life use: Are potential savings achieved or are they transformed into increased comfort? Energy Build. 2012, 53, 64–73. [Google Scholar] [CrossRef] [Green Version]
- Song, M.; Deng, S.; Mao, N.; Ye, X. An experimental study on defrosting performance for an air source heat pump unit with a horizontally installed multi-circuit outdoor coil. Appl. Energy 2016, 165, 371–382. [Google Scholar] [CrossRef] [Green Version]
- Zhang, Y.; Ma, Q.; Li, B.; Fan, X.; Fu, Z. Application of an air source heat pump (ashp) for heating in harbin, the coldest provincial capital of china. Energy Build. 2017, 138, 96–103. [Google Scholar] [CrossRef]
- Wang, Z.; Luther, M.B.; Amirkhani, M.; Liu, C.; Horan, P. State of the art on heat pumps for residential buildings. Buildings 2021, 11, 350. [Google Scholar] [CrossRef]
- Shrivastava, A.P.; Chandrakishor, C. Evaluation of refrigerant r290 as a replacement to r22. Int. J. Innov. Res. Sci. Eng. 2016, 2, 739–747. [Google Scholar]
- Rasheed, A.; Na, W.H.; Lee, J.W.; Kim, H.T.; Lee, H.W. Development and validation of air-to-water heat pump model for greenhouse heating. Energies 2021, 14, 4714. [Google Scholar] [CrossRef]
- Rasheed, A.; Kim, H.T.; Lee, H.W. Modeling-based energy performance assessment and validation of air-to-water heat pump system integrated with multi-span greenhouse on cooling mode. Agronomy 2022, 12, 1374. [Google Scholar] [CrossRef]
- Aye, L.; Fuller, R.J.; Canal, A. Evaluation of a heat pump system for greenhouse heating. Int. J. Therm. Sci. 2010, 49, 202–208. [Google Scholar] [CrossRef] [Green Version]
- Moon, J.; Kwon, J.; Kim, S.; Kang, Y.; Park, S.; Lee, J. Effect on yield increase and energy saving in partial heating for high-bed strawberries by using an air to water heat pump. In Proceedings of the 2019 ASABE Annual International Meeting, Boston, MA, USA, 7–10 July 2019; American Society of Agricultural and Biological Engineers: Saint Joseph, MI, USA, 2019; p. 1. [Google Scholar]
- Lim, T.; Baik, Y.-K.; Kim, D.D. Heating performance analysis of an air-to-water heat pump using underground air for greenhouse farming. Energies 2020, 13, 3863. [Google Scholar] [CrossRef]
- Rasheed, A.; Lee, J.; Lee, H. Development and optimization of a building energy simulation model to study the effect of greenhouse design parameters. Energies 2018, 11, 2001. [Google Scholar] [CrossRef] [Green Version]
- Rasheed, A.; Lee, J.W.; Lee, H.W. Development of a model to calculate the overall heat transfer coefficient of greenhouse covers. Span. J. Agric. Res. 2017, 15, e0208. [Google Scholar] [CrossRef] [Green Version]
- Rasheed, A.; Lee, J.W.; Lee, H.W. Evaluation of overall heat transfer coefficient of different greenhouse thermal screens using building energy simulation. Prot. Hortic. Plant Fact. 2018, 27, 294–301. [Google Scholar] [CrossRef]
- Rabiu, A.; Na, W.-H.; Akpenpuun, T.D.; Rasheed, A.; Adesanya, M.A.; Ogunlowo, Q.O.; Kim, H.T.; Lee, H.-W. Determination of overall heat transfer coefficient for greenhouse energy-saving screen using trnsys and hotbox. Biosyst. Eng. 2022, 217, 83–101. [Google Scholar] [CrossRef]
- Soussi, M.; Chaibi, M.T.; Buchholz, M.; Saghrouni, Z. Comprehensive review on climate control and cooling systems in greenhouses under hot and arid conditions. Agronomy 2022, 12, 626. [Google Scholar] [CrossRef]
- Safa, A.A.; Fung, A.S.; Kumar, R. Comparative thermal performances of a ground source heat pump and a variable capacity air source heat pump systems for sustainable houses. Appl. Therm. Eng. 2015, 81, 279–287. [Google Scholar] [CrossRef]
- Jeon, J.G.; Lee, D.G.; Paek, Y.; Kim, H.G. Study on heating performance of hybrid heat pump system using geothermal source and solar heat for protected horticulture. J. Korean Sol. Energy Soc. 2015, 35, 49–56. [Google Scholar] [CrossRef] [Green Version]
- Bertsch, S.S.; Groll, E.A. Two-stage air-source heat pump for residential heating and cooling applications in northern us climates. Int. J. Refrig 2008, 31, 1282–1292. [Google Scholar] [CrossRef]
Figure 1.
(a) Experimental greenhouse; (b) inside view of greenhouse partition; (c) installed energy screens.
Figure 1.
(a) Experimental greenhouse; (b) inside view of greenhouse partition; (c) installed energy screens.

Figure 2.
Experimental greenhouse’s layout.

Figure 3.
(a) AWHP; (b) ST; (c) FCU blower; (d) FCU; (e) water circulation pump and gauges inside the greenhouse.
Figure 3.
(a) AWHP; (b) ST; (c) FCU blower; (d) FCU; (e) water circulation pump and gauges inside the greenhouse.

Figure 4.
Diagram of AWHP system.

Figure 5.
Ambient solar radiation and temperature at Kyungpook National University, Daegu, South Korea (latitude 35.53° N, longitude 128.36° E, elevation 48 m).
Figure 5.
Ambient solar radiation and temperature at Kyungpook National University, Daegu, South Korea (latitude 35.53° N, longitude 128.36° E, elevation 48 m).

Figure 6.
Storage tank and greenhouse supply and return water temperature in (a) winter and (b) summer.
Figure 6.
Storage tank and greenhouse supply and return water temperature in (a) winter and (b) summer.

Figure 7.
Storage tank to greenhouse water flow rate in (a) winter and (b) summer.

Figure 8.
Greenhouse heat load with ambient weather air temperature in (a) November 2021, (b) December 2021, (c) January 2022, (d) February 2022, and (e) March 2022.
Figure 8.
Greenhouse heat load with ambient weather air temperature in (a) November 2021, (b) December 2021, (c) January 2022, (d) February 2022, and (e) March 2022.


Figure 9.
Analysis of greenhouse internal environment during winter: (a) GH 1 and (b) GH 2.

Figure 10.
Greenhouse cool load with ambient weather air temperature in (a) June, (b) July, (c) August, and (d) September.
Figure 10.
Greenhouse cool load with ambient weather air temperature in (a) June, (b) July, (c) August, and (d) September.

Figure 11.
Analysis of greenhouse internal environment during summer: (a) GH 1 and (b) GH 2.


Figure 12.
Linear regression analyses of monthly heating load vs. (a) ambient temperature and (b) solar radiation.
Figure 12.
Linear regression analyses of monthly heating load vs. (a) ambient temperature and (b) solar radiation.

Figure 13.
Linear regression analyses of monthly cooling load vs. (a) solar radiation and (b) ambient temperature.
Figure 13.
Linear regression analyses of monthly cooling load vs. (a) solar radiation and (b) ambient temperature.

Figure 14.
Analysis of heat pump on heating mode (a) water temperature and flow rate (b) power consumption.
Figure 14.
Analysis of heat pump on heating mode (a) water temperature and flow rate (b) power consumption.


Figure 15.
Analysis of heat pump input and output on cooling mode (a) water temperature and flow rate (b) power consumption.
Figure 15.
Analysis of heat pump input and output on cooling mode (a) water temperature and flow rate (b) power consumption.


Figure 16.
COP of heat pump on heating and cooling mode.


Table 1.
Specification of AWHPs.
| Component | Properties | Specification |
|---|---|---|
| Heat pump | Model | PSET-C60W (MIDEA) |
| Heating capacity | 60,200 kcal·h−1 | |
| Cooling Capacity | 55,900 kcal·h−1 | |
| Power consumption heating/cooling | 18,843/18,326 kcal·h−1 | |
| Voltage | 380–415 V, 3-phase, 60 Hz | |
| Refrigerant | R-410a | |
| Fan coil unit | Model | IN-FCG0016-L |
| Heating capacity | 23,231 kcal·h−1 | |
| Cooling Capacity | 15,488 kcal·h−1 | |
| Power consumption | 383 kcal·h−1 | |
| Airflow rate | 83 m3·m−1 | |
| Water circulation pump | Model | Wilo TOP-S 40/7 |
| Max. fluid temperature | 130 °C | |
| Min. fluid temperature | −20 °C | |
| Power consumption | 335 kcal·h−1 | |
| Water storage tank | Storage capacity | 50 m3 |
Publisher’s Note: MDPI stays neutral with regard to jurisdictional claims in published maps and institutional affiliations. |
© 2022 by the authors. Licensee MDPI, Basel, Switzerland. This article is an open access article distributed under the terms and conditions of the Creative Commons Attribution (CC BY) license (https://creativecommons.org/licenses/by/4.0/).
Share and Cite
MDPI and ACS Style
Rasheed, A.; Lee, J.W.; Kim, H.T.; Lee, H.W. Study on Heating and Cooling Performance of Air-to-Water Heat Pump System for Protected Horticulture. Energies 2022, 15, 5467. https://0-doi-org.brum.beds.ac.uk/10.3390/en15155467
AMA Style
Rasheed A, Lee JW, Kim HT, Lee HW. Study on Heating and Cooling Performance of Air-to-Water Heat Pump System for Protected Horticulture. Energies. 2022; 15(15):5467. https://0-doi-org.brum.beds.ac.uk/10.3390/en15155467
Chicago/Turabian StyleRasheed, Adnan, Jong Won Lee, Hyeon Tae Kim, and Hyun Woo Lee. 2022. "Study on Heating and Cooling Performance of Air-to-Water Heat Pump System for Protected Horticulture" Energies 15, no. 15: 5467. https://0-doi-org.brum.beds.ac.uk/10.3390/en15155467
Note that from the first issue of 2016, this journal uses article numbers instead of page numbers. See further details here.