Article

The Effect of Urban Form on the Heat Island Phenomenon and Human Thermal Comfort: A Comparative Study of UAE Residential Sites

Department of Architecture, College of Architecture, Art, and Design, Ajman University, Ajman 20550, United Arab Emirates
*
Author to whom correspondence should be addressed.
Submission received: 6 June 2022 / Revised: 13 July 2022 / Accepted: 22 July 2022 / Published: 28 July 2022
(This article belongs to the Special Issue Environment and Urban Systems: Simulation, Modeling and Analysis)

Abstract

:
The Urban Heat Island (UHI) has a detrimental impact on human thermal comfort and the health of city dwellers through raising average temperatures. Urban geometry is one of the factors that affect the intensity of the UHI phenomena. The purpose of this research is to evaluate and compare traditional vs. modern urban forms with respect to temperature and thermal comfort in the United Arab Emirates. Three of each were chosen based on their densities and form. Traditional buildings in the UAE differ from others in the Middle East in that they are primarily single-story, while in the surrounding countries of the region, such as Iran, Iraq, and Saudi Arabia, they are mainly two stories. The UAE climate also has its distinct characteristics. Each configuration was investigated using the ENVI-met urban microclimate simulation software. The comparisons were made for three seasons: summer, winter, and spring. Each configuration was evaluated through four parameters: building shape, street geometry, orientation, and urban density. The results revealed that the low-density traditional urban form exhibited the lowest air temperature in August because it has a low sky view factor (SVF), high height-to-width ratio, and less density. The highest ambient temperature was observed in the sites with low-medium density, lowest height/width ratio, and maximum SVF. The high-density modern urban form displayed lower air temperatures in the summer season than the low and low-medium-density modern urban sites due to the building form, high height-to-width ratio, low SVF, and wind corridors. The traditional compact urban form in Al Fahidi, which has the highest urban density of the six configurations, achieved the best thermal comfort levels in the summer due to the sizable height-to-width ratio and lowest SVF.

1. Introduction

Urban areas with warmer ambient temperatures than the nearby rural areas are known as Urban Heat Islands (UHI) [1]. Another definition was declared by Kolokotroni [2] that the UHI phenomenon is affected by human-made modifications and interference with the natural environment. Nagano and Wanphen stated that the differences between rural and urban temperatures could reach 5 to 15 °C [3], which significantly impacts human thermal comfort. The UHI phenomenon also indirectly affects energy consumption and can lead to high costs for cooling and heating buildings [4]. Urban geometries, ground covers, material properties, and human activities are the main factors that raise the temperatures of metropolitan or urban areas compared to rural areas [4].
The UHI effect is one of urbanization’s most noticeable changes to the atmosphere [1]. Urbanized cities have higher air temperatures than their surroundings, which leads to a drop in human thermal comfort in hot regions [5]. Most middle eastern countries face environmental issues related to the UHI effect, heat release, and air pollution, which can lead to human health issues [6].
The United Nations reports [7] that by 2050, 68% of the world’s population, up from 55% today, is anticipated to reside in urban regions. According to projections, there could be an additional 2.5 billion people living in urban areas by 2050 due to urbanization. Meanwhile, as the process continues, the scope and severity of the UHI effect will intensify. With this transition, urban configurations, ground covers, and land use all suffer change to accommodate the population’s expectations and needs.
Nuruzzaman [8] identified the significant effects of the UHI on human thermal comfort, health, and the environment and indicated that there are many effective strategies to mitigate the UHI intensity. Much work has been done on studying the traditional building designs in the UAE [9] and providing solutions to reduce energy consumption [10]. The design of urban areas and the resultant heat island can be moderated using climate-responsive strategies [11]. The urban form is a fundamental factor in defining human settlements. Golany [12] stated that the urban form has many parameters that significantly impact the microclimate. Form refers to the shape, size, and urban density of specific areas with their building shapes, street geometries, and spatial layout.
This research aims to study the impact of different urban forms on the UHI in the hot arid region of the UAE and to identify them and utilize ENVI-met simulations to assess their impact. The residential neighborhoods in the UAE vary from traditional to modern, with various densities. The urban parameters that were investigated through the simulations were as follows:
Street geometry: winding or linear roads, street orientation (i.e., NE-SW, N-S, E-W, NW-SE), height-to-width ratio (H/W), roads, and walkway materials.
Building form: courtyard houses, square blocks, low-rise villas, mid-rise building blocks, attached and detached blocks.
Urban density: built-up area and total floor area relative to the site.
To achieve the aims of this paper, other factors such as vegetation, proximity to water bodies, and albedo were excluded from the simulation and deliberately marginalized. Had they been included, they would have masked the effect of form. While the traditional neighborhoods use largely predictable materials whose reflectivity is well known, the modern ones use a variety of materials and colors.
Another reason to exclude the albedo effect in particular would have been the air quality. The study compares the form during three weather seasons. The air quality in the UAE in summer is characterized not only by high temperatures but also by high levels of air particulates in all the relevant size ranges 2.5, 5, and 10 µg/m³, which is not the case in winter. Table 1 demonstrates the particulate measurements for Dubai air on 25 June 2022.
These are very high numbers. The dust is sure to influence the albedo significantly and distort the comparison further. Our literature review did not yield any study that investigates traditional vs. modern configurations in the UAE. It should be noted that traditional buildings in Dubai are largely single-story. This is quite different from the remainder of the MENA regions such as Iraq, Syria, Egypt, and Saudi Arabia for instance. In those countries, traditional buildings were mostly two stories. Needless to say, this constitutes a significant difference.

2. Literature Review

Several studies have examined the UHI in different cities across the globe over the past decades, and UHI investigations have contributed to a significant portion of modern urban climatology studies. The evaluation of air and surface temperatures at a particular level is typically used to measure the UHI impact.
Thapar and Yannas [14], who investigated the effect of different urban configurations on temperature variations, found that the lowest air temperature occurred in courtyards due to greater shading. They also found that higher air temperatures could be acceptable to pedestrians when wind movement is high. Alobaydi et al. [15] investigated the impact of three different urban forms in the city center on UHI, including modern detached, modern attached, and traditional compact forms. The researchers highlighted that the lowest air temperatures were observed for the cases of high H/W ratio in compact urban forms by maximizing shaded areas and minimizing exposure to solar radiation. The most elevated air temperatures were recorded in shallow urban canyons in modern attached and detached urban forms. Golany [12] investigated the relationships between the urban morphology and the thermal comfort for different climate zones and reported that a compact urban form and zigzagging roads are more suitable for hot arid cities. Tong et al. [16] evaluated the effect of urban morphology on UHI intensity and thermal comfort. They demonstrated that the areas close to high-rise buildings with narrow streets are usually more shaded and have a lower sky view factor (SVF). SVF refers to the amount of visible sky above a specific point as seen from a 2D depiction, which affects the heating of the microclimate due to solar radiation.
Street geometry also has a significant impact on the UHI. Ali-Toudert and Mayer [17], as well as Bourbia and Boucheriba [18], investigated the effects of street design and orientation on the microclimate. They concluded that the H/W ratio and air temperature are correlated. As the H/W aspect ratio increases, then the SVF value and air temperature decrease due to the resulting shade, and vice versa. Shareef S, Abu-Hijleh B [19], developed multiple scenarios of an urban block with height diversity to increase the shading effect and investigate their impact on the microclimate. The results revealed that there was more reduction in air temperature in models with significant height variations compared to other models with moderate height variations. Bakarman MA, Chang JD, conducted a study examining the microclimate and human thermal comfort in KSA: a deep traditional canyon (H/W = 2.2) and a shallow modern canyon (H/W = 0.42). It was concluded that the UHI intensity increased with the decrease in H/W ratios. In comparison to the rural surroundings, the air temperature in deep and shallow urban canyons is 5 and 15% warmer, respectively. Due to the shallow canyon’s extreme exposure to intense solar radiation, there was a noticeable rise in temperature there [20]. Studies by Zakhour [21], Johansson [22], and Andreou E. [23] compared older and newer city urban forms. The results revealed that a high H/W ratio and low SVF could decrease the maximum air temperature in the older configurations during the summer days. The highest airspeeds were exhibited in the newer urban canyons; as a result, the authors recommended using compact urban forms in hot, dry climates. Contrary to the previous studies, Boukhabla et al. [24] investigated the impact of street geometry on the UHI effect and concluded that open streets with a low H/W ratio recorded lower air temperatures than narrow streets with a high H/W ratio and recommended avoiding compact and dense buildings.
Another microclimate variable impacted by the (H/W) ratio and urban design is wind speed [25]. In long, deep canyons with a high (H/W) ratio, heat is trapped, resulting in rising temperature. The airflow is effectively increased by (H/W) ratios of less than 0.3. A significant amount of outdoor air flowing through the canyon helps decrease the air temperature. In addition, having a mid-high rise building adjacent to a row of low buildings will accelerate the wind by 90% and reduces air temperature by 1% [26].
Other researchers investigated the impact of urban density on the UHI. Elnahas [27] concluded that higher density configurations have higher air temperatures during the day and early morning due to heat absorption and thermal storage by the building blocks, thus increasing the cooling load on buildings. Hu et al. [28] investigated the relationship between density and the UHI and also concluded that the UHI intensity would rise with higher density configurations if the SVF is high, whereas compact and dense urban forms with low SVF values might be more beneficial for lowering the intensity. Ridwan et al. [29] investigated the relationship between the UHI and urban density using Landsat imagery data in Makassar city and concluded that the results of the UHI and building density relationship test indicate a high coefficient of determination, indicating that the link between UHI and building density has a very strong correlation. Case studies and software simulation methods are the most popular techniques used to examine the effect of urban design parameters on the microclimate in urban design studies [30,31,32].
According to the literature review, there are limitations when choosing only one point in the street to reflect the behavior of the whole area. The urban configuration is defined as the relationships and ratios that connect the spaces with the surrounding elements. Previous studies did not analyze large enough areas or neighborhoods along with their surroundings in sufficient detail. Furthermore, most of the studies collected their field measurements in one season only, which will not give a complete depiction of the UHI phenomenon. In some studies, the review was done hypothetically, not with actual urban configurations. In real cases, the buildings may respond to unforeseen external forces, which will impact the actual performance. Moreover, few studies examined gulf cities. Therefore, this research will attempt to fill these gaps by investigating urban forms in the UAE holistically as a comprehensive configuration.

3. Research Framework and Methodology

3.1. Research Site Selection

To achieve the goals of this study, three traditional and three modern residential settlements with high, medium, and low densities were selected to represent the relevant configurations. These sites, which have varying urban canyons, orientations, building forms, heights, and urban densities, will be used in six case studies. We selected these urban configurations because they are urbanized areas that differ considerably in their design, characteristics, and layout.
The six sites are located in Dubai, Sharjah, and Ras Al Khaimah. The sites are close enough to each other geographically that they fall within the same climate zone. Three of these sites represent older traditional configurations with different densities: Al Marija in Sharjah is low density, Sidroh in Ras Al Khaimah is low-medium density, and Al Fahidi in the south of Dubai is high density. These sites have similar urban configurations, as illustrated below. The other three sites represent a modern grid type, again with different densities: Al Mamzar in Dubai is low density, Jumeirah in Dubai is low-medium density, and Al Safa I in Dubai is high density. These sites have similar urban configurations, as illustrated below in Table 2.

3.2. Method of Investigation

ENVI-met software version 4.4.5 was used to analyze the urban areas. This software has been used in previous studies related to the urban microclimate and human thermal comfort for its proven accuracy [35]. ENVI-met is capable of calculating large urban microclimates and comparing the different urban configurations. It can calculate humidity, temperature variations, radiation inflow, wind flows, and physiologically equivalent temperature (PET) values. Wind speed and direction, average temperature, and relative humidity (RH) need to be provided as input for the investigated site. The software is also capable of simulating the urban thermal conditions in 2D and 3D forms [36].
The main parameters that will be investigated though ENVI-met are the following:
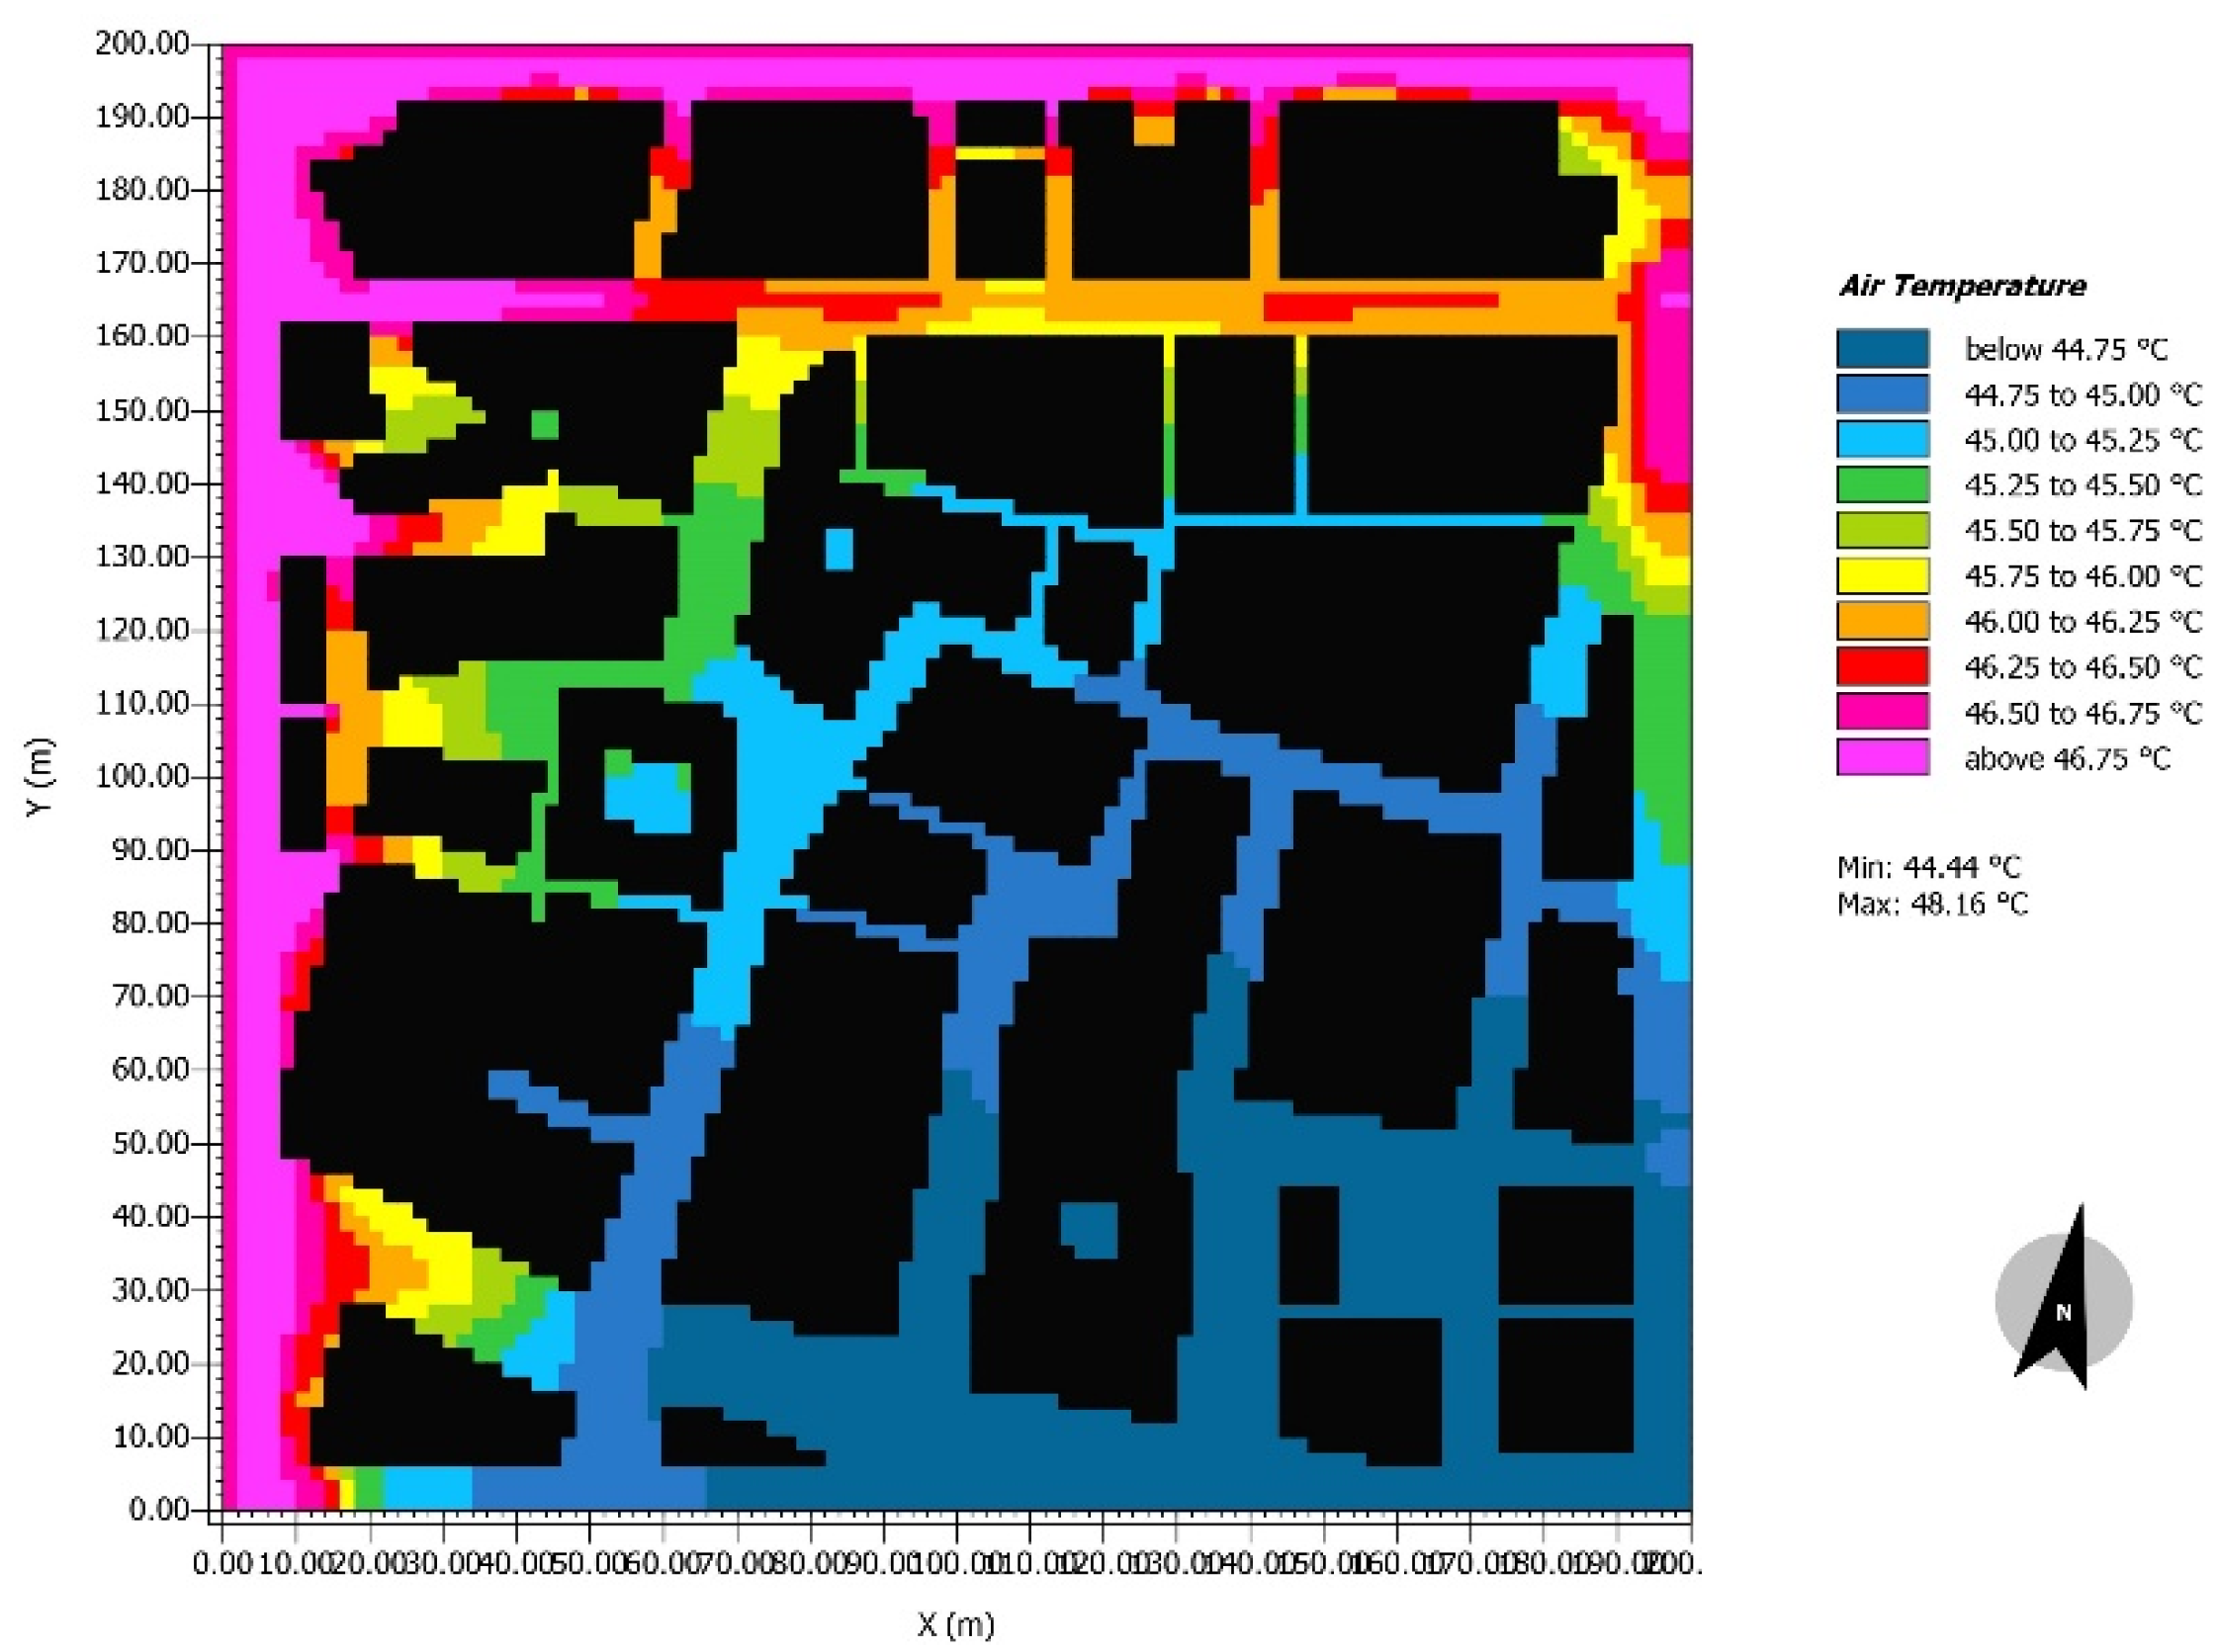
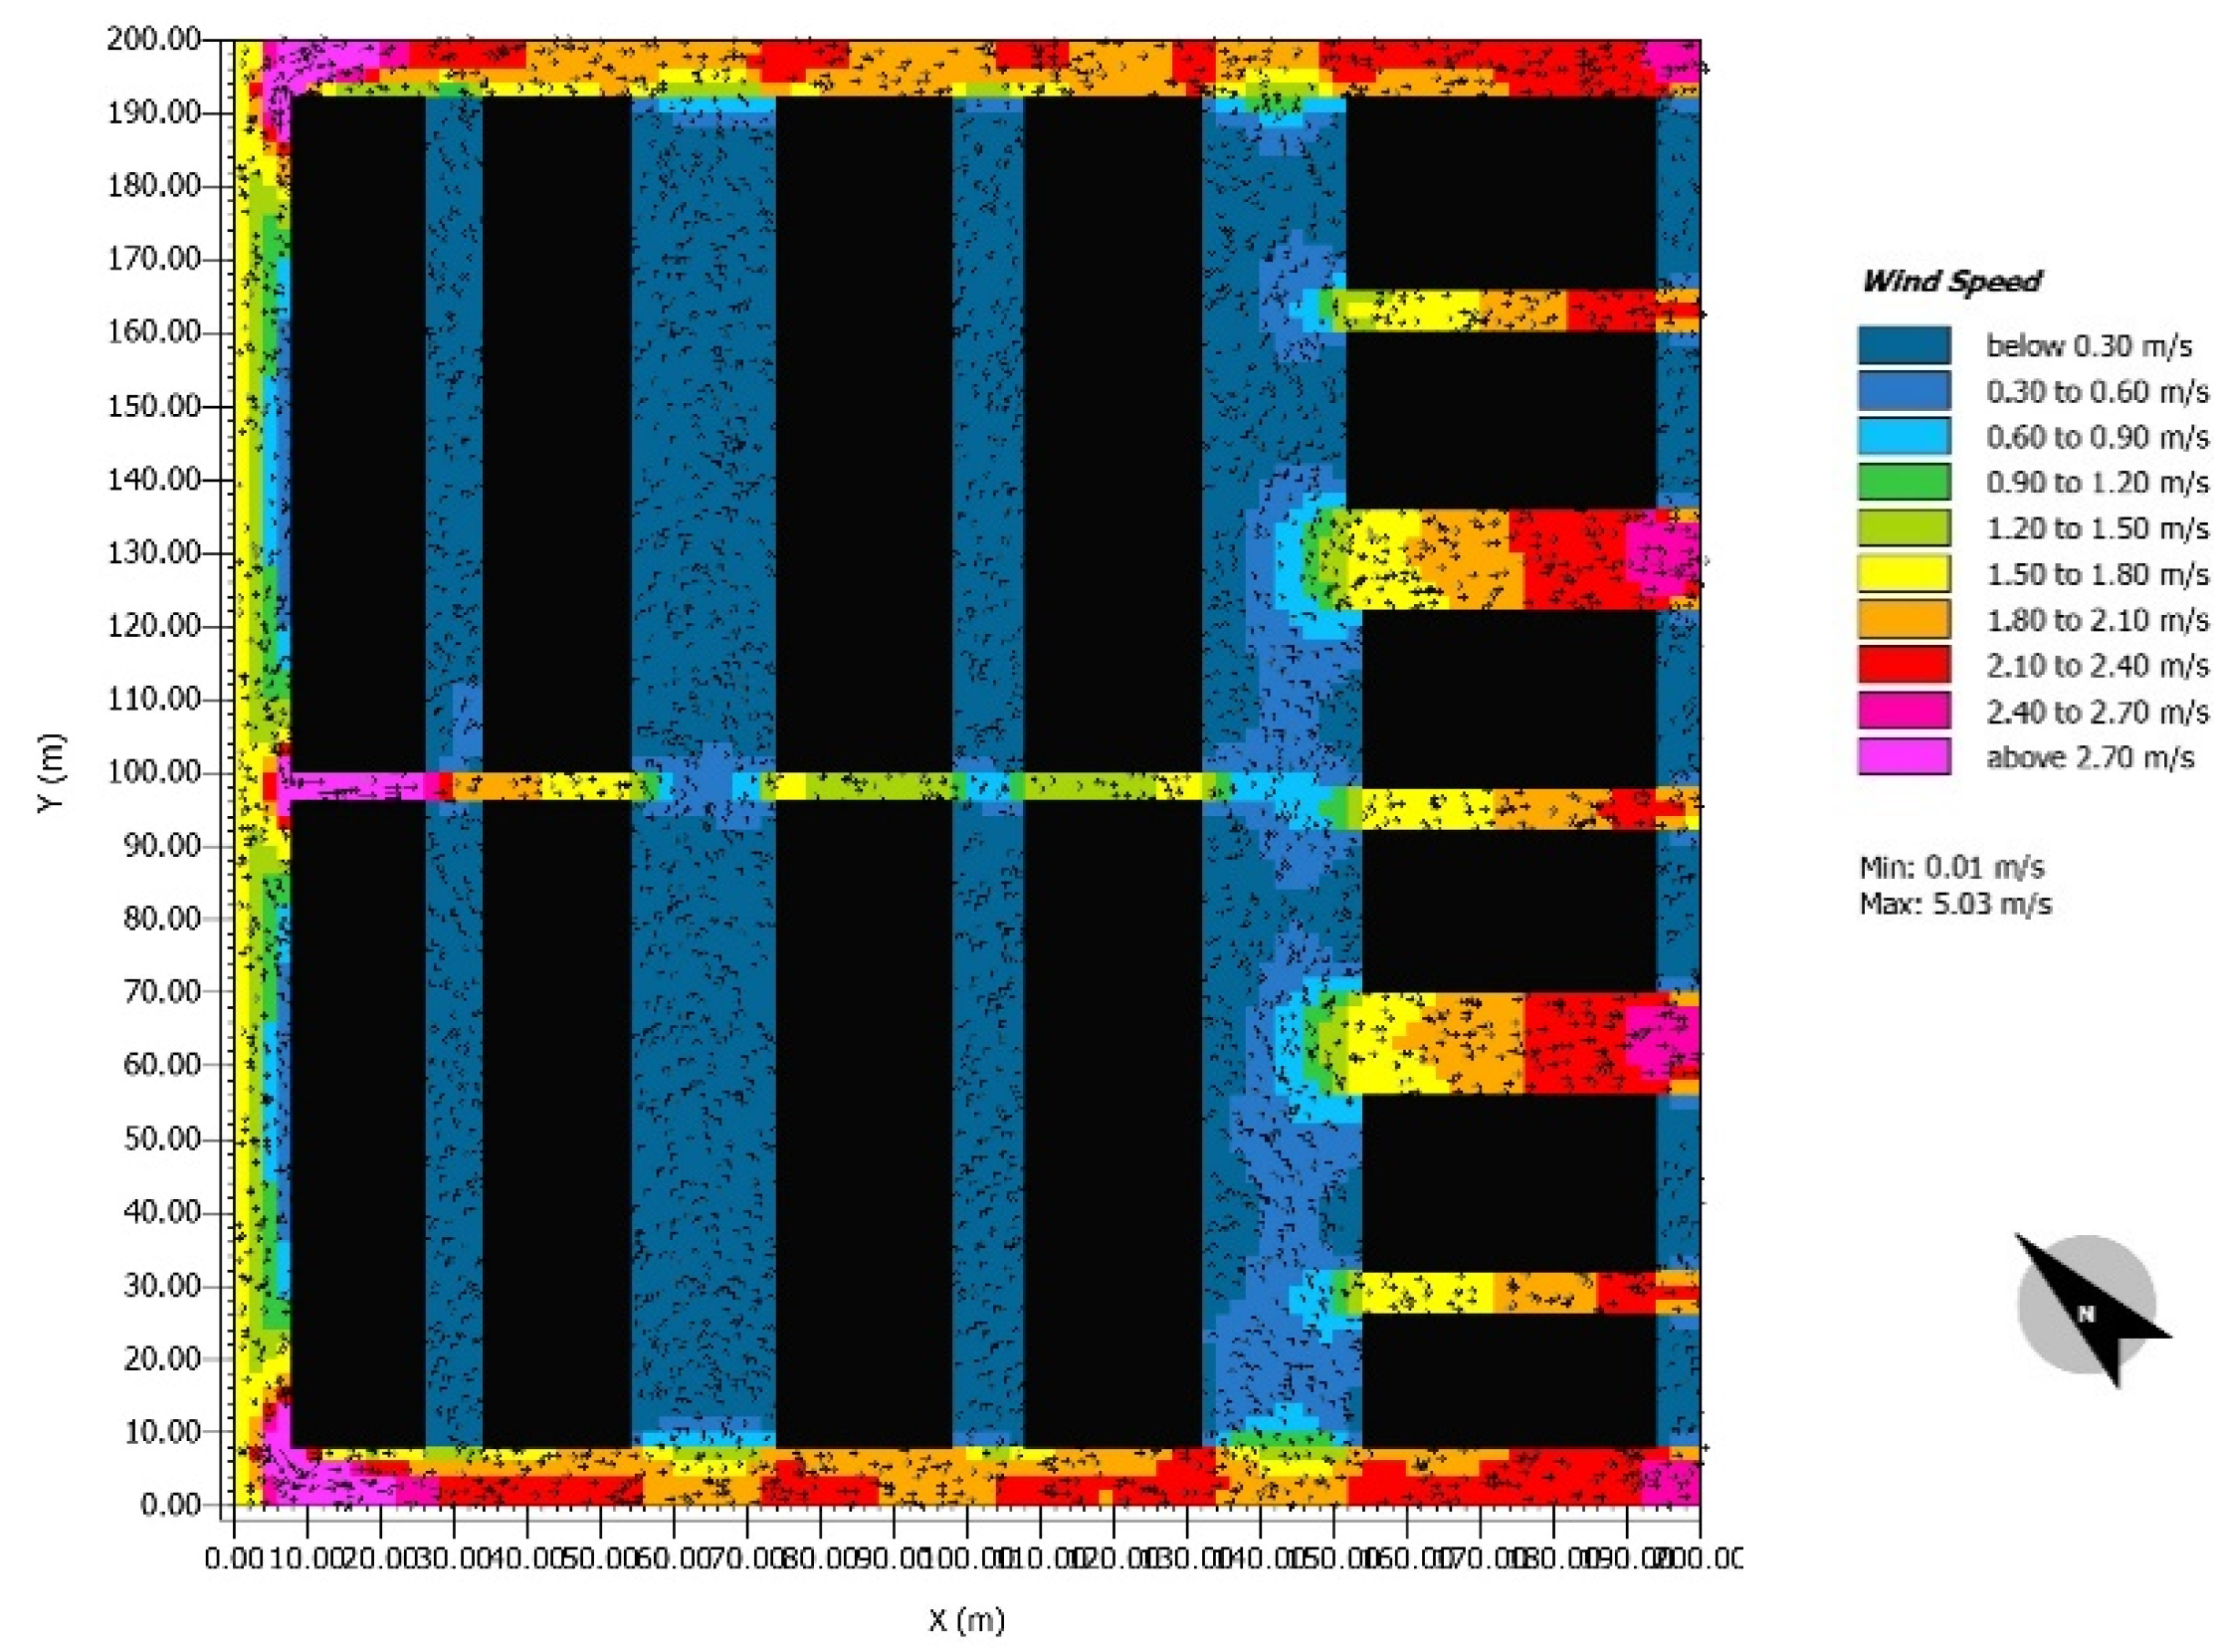
  • The air temperature, wind speed, and RH in the microclimates for the traditional and modern urban forms.
  • The thermal comfort using the predicted mean vote (PMV). Several factors have an impact on thermal comfort and are evaluated by ENVI-met. These are classified into two categories as follows:
    Environmental factors: air temperature, air velocity, mean radiant temperature, and RH.
    Physiological factors: the body’s metabolic rate, personal activity, age, and type of clothing.
ENVI-met will calculate the PMV based on the range of-4 to +4, as shown in Figure 1, where the values closer to zero represent more optimum conditions in terms of human thermal comfort. According to ASHRAE Standard 55, the recommended thermal limit on the PMV scale is between −0.5 and 0.5 [37].

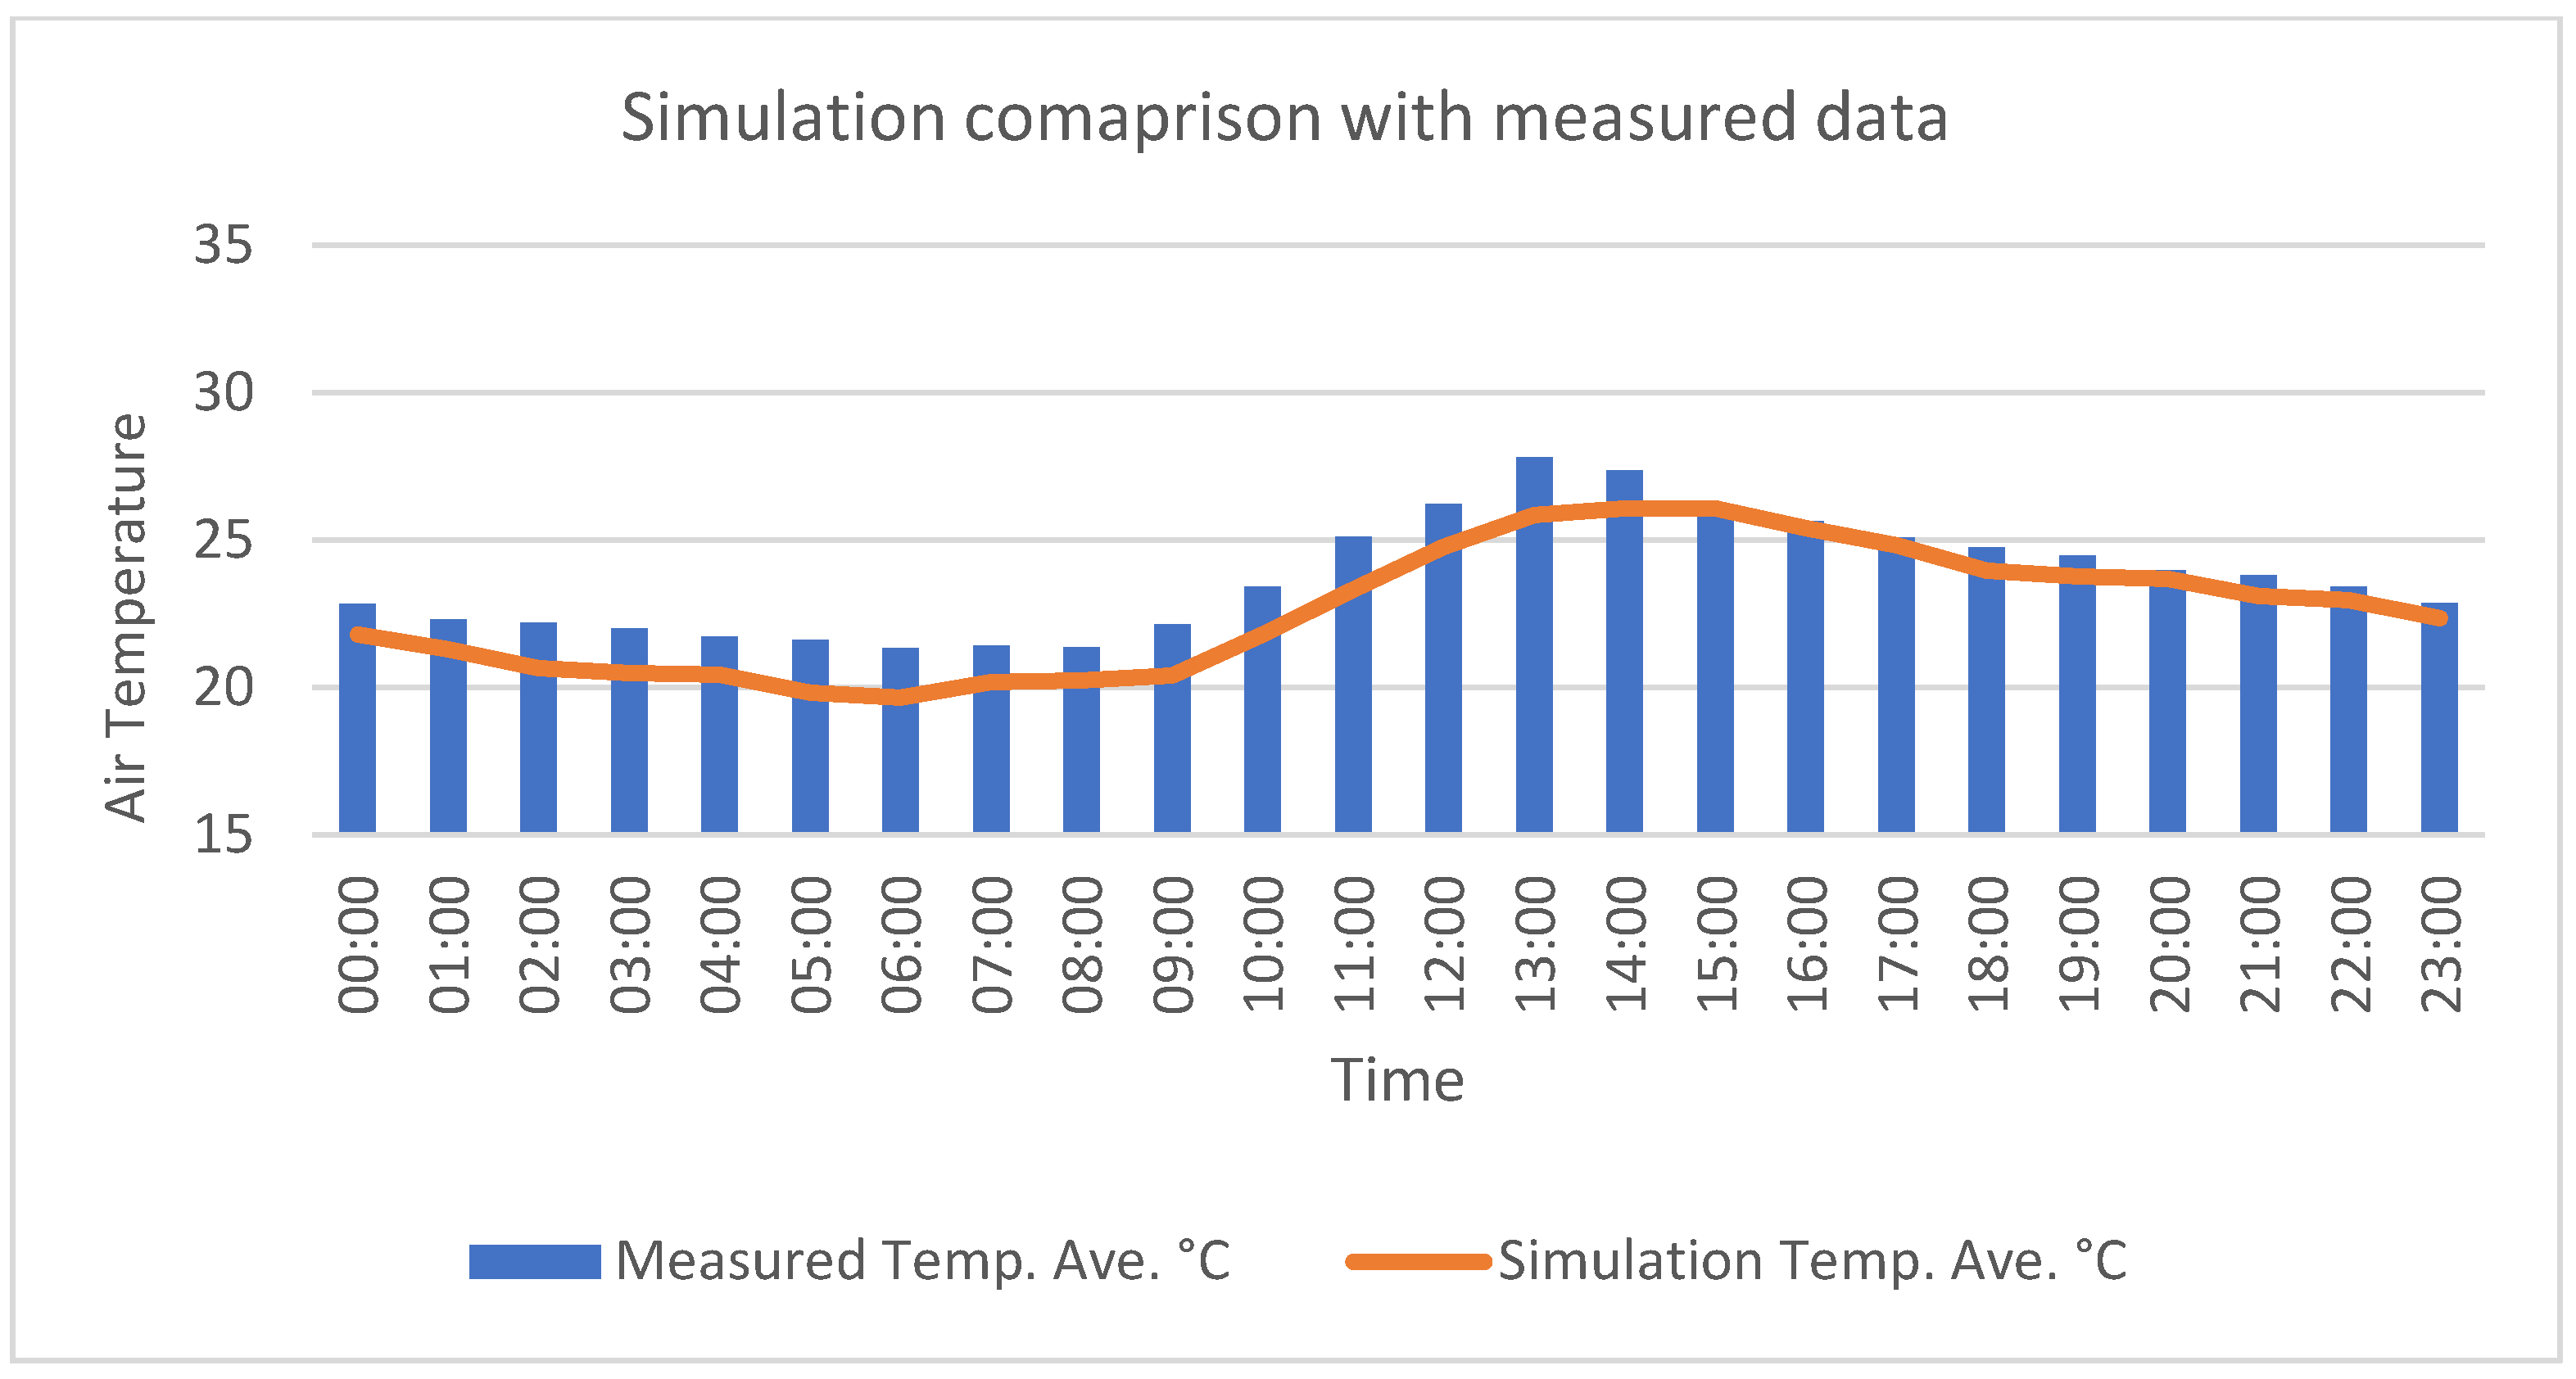
3.3. Software Validation

Al Taawun area in Sharjah was selected for ENVI-met validation. a HOBO data logger was used to record the thermal data in the area. The site consists of residential high-rise buildings. The weather data was received from the UAE National Center for Meteorology by special request on February 11th. The Onset HOBO UX100-003 data logger can measure the air temperature between 0 to 50 °C and RH with a range of 1 to 90% [39]. The device is easy to handle due to its small size and light weight, with an LCD that shows the data concurrently. The unit was placed on a level surface at 14 m from the ground, and the data were compared to the simulated model at the same height and specific location (Figure 2a). Figure 3 shows the simulated air temperature results at 2:00 pm, corresponding with the selected point “A” which is marked in (Figure 2a). Figure 4 shows the 24-h air temperature results for the simulated and measured case on 11 February 2022. Some temperature variations were observed in the midday hours from 10:00 am to 1:00 pm, and the measured air temperatures were slightly higher than the simulated ones. The rise in midday air temperature could be due to increased vehicle traffic, solar radiation, and heat emission, which currently cannot be calculated by the ENVI-met software. Nevertheless, the simulated and measured results showed a 98.92% match.
The validity of previous versions of ENVI-met has been addressed in several scientific studies as [19,40,41]. They also showed a good correlation between the simulated and the measured data.

3.4. Dubai Overview

Geographically, Dubai is located on the Arabian Gulf and has a hot, mildly humid, and sunny climate. The diagram in Figure 5 shows the average monthly air temperature based on Dubai airport reports from 1985–2015. The highest temperatures are usually recorded in July and August with an average of 41 °C, and it could reach 46 °C on sunny days [42], while the lowest is generally in December and January with an average of 15 °C [42].
The RH is primarily consistent throughout the year in Dubai and ranges between 40–60%, as shown in Figure 6 The lowest humidity averages were recorded between April and August, while the highest were from January to March and September to December [42].
As can be seen in Figure 7, the dominant wind direction in the country is the N-W direction, and it has the highest speed as well, so the simulations were run based on this fixed direction while other wind directions and the impact of the sea breeze were marginalized for consistency in the results. Most of the air movement has a speed ranging from 5–10 mph, which is equivalent to 2.2–4.47 m/s, and there are higher wind speeds that can reach up to 20 mph. The remainder of the wind exhibits a very low speed, ranging from 2–5 mph [43].

4. ENVI-Met Setup

4.1. Simulation Methodology

The urban forms of the six sites investigated with ENVI-met correspond to two types, traditional and modern, with varying densities. All sites were examined through simulations, which were set for August 15th, December 21st, and April 15th of 2019. These dates represent the three main thermal periods of the year, spring and fall being relatively similar. The selection of August and April was based on the thermal comfort zone, which ranges from 20–27 °C, as referred to previously [44]. August the 15th represents the hottest day of the year. Figure 5 illustrates the average air temperature in August and April, which is higher than the thermal comfort range, which is the main issue for this hot, arid region. The simulations evaluated the daily behaviors by examining periods of 24 h.
Before starting the simulations, it was necessary to identify the constant, independent, and dependent factors for each simulation. The list is shown in Table 3. Software input parameters for each scenario, such as climate data, orientation, and building and surface materials, are shown in Table 4.

4.2. Urban Form Simulation Model Setup

After defining the independent factors and the climate data for the simulation, the horizontal and vertical grid resolutions in the workspace were set to 2 m.
This grid resolution was used to model the urban form with more realism since the selected sites include narrow and winding alleyways and urban canyons. The selected sites have different urban densities, therefore the size of the urban plots was unified at 200 × 200 m, which equals 40,000 m2.
Table 5 summarizes the six urban configurations, along with their urban densities, street geometries, street orientations, and 3D geometries. The major roads defined the street’s orientation with long axes in the whole neighborhood since they have more impact on the urban configuration.

5. Results, Analysis and Discussion

5.1. Simulation Results Analysis

After running all the simulations in the three seasons, the required numerical data were visualized through images and extracted using excel. The collected data were on a cutting plane level of k = 4, which is equal to 1.8 m in the software, as it is highly recommended to consider the human being’s height since it was noticed that there is a big difference between the wind readings on the different cutting plane levels. August air temperature simulation results for the six sites are shown in Figure 8a,b. The graphs show that the six urban configurations have similar behavior throughout the day, with slight differences between day and night-time. The results revealed that the newer residential settlements in Al Mamzar, Al Safa I, and Jumeirah had recorded air temperatures around 1–2 °C higher than the older urban forms in Al Fahidi, Sidroh, and Al Marija during the peak hours from 1:00 to 2:00 p.m., with higher temperatures in more dense areas. It was noticed that the modern configurations have higher air temperature than the traditional configurations except for the modern high-density configuration at night-time.
The wind diagram in Figure 9 shows that the highest wind speed was recorded in Al Fahidi, which was 1.7 m/s higher than the initial wind input, and 2.7 to 3.8 m/s higher than the other configurations. The graph shows that the lowest wind speed of 1.5 m/s was recorded in Jumeirah.
The RH results in Figure 10 show high humidity levels during the early morning and late evening when the air temperature is lowest since the RH and air temperatures have an inverse relationship. During the day, the six sites have similar behavior and unnoticeable differences in the readings. In the early morning, Al Marija recorded the lowest RH, 1–3% lower than the other configurations. In comparison, Al Safa I recorded higher humidity levels than the others, with a reading of 55% at 8:00 a.m.
December air temperature simulation results for the six sites are shown in Figure 11a,b. The graphs show that the six urban configurations follow similar behavior throughout the day, with only slight air temperature differences. The older urban areas of Al Marija and Sidroh exhibited the highest air temperatures in the early morning and evening, reaching 23.1 and 20.76 °C, respectively, while the newer urban configurations of Al Mamzar, Jumeirah, and Al Safa I displayed lower air temperatures at these times, reaching 17.6 °C. During the peak hours, Jumeirah had the highest recorded air temperature, 25.6 °C, while Al Fahidi had the lowest air temperature, 24 °C. Moreover, the lower air temperatures were recorded with high density sites in the daytime, while the highest air temperature was found in the low and medium densities configurations.
The wind speed results in Figure 12 show that Al Fahidi had the highest wind speed, 1.8 m/s more than the initial wind input and 2.7 to 4 m/s higher than the other configurations. Due to the existence of midrise blocks, only in the Al Fahidi area, on the edges, was the wind speed recorded at a maximum of 10 m/s, as concluded by Priyadarsini R. and Wong N.H. [26]. Thus, the wind speed average was higher than in the other neighborhoods that have only 1–2 floors. On the other hand, the lowest wind speed was recorded in Jumeirah, 1.5 m/s.
The RH results in Figure 13 show that the highest humidity levels were recorded during the early morning and late evening when the air temperature is low, reaching 52.28%. The humidity levels in the early morning fluctuated. During the day, the six sites have similar behavior with only slight differences in the readings. Al Marija and Sidroh configurations had the lowest RH, with measurements 3–4% lower than the other configurations, reaching 38%. In comparison, Al Safa I and Jumeirah districts had higher humidity levels than the others, measuring 52% at 4:00 a.m. and 7:00 a.m.
April air temperature simulation results for the six sites are shown in Figure 14a,b. The simulation revealed results similar to December since the three older sites recorded higher air temperatures during the early morning and late evening and the lowest air temperatures during the daytime and peak hours, while the modern sites of Al Safa I, Jumeirah, and Al Mamzar recorded the highest air temperatures during peak hours. Al Safa I and Jumeirah configurations recorded higher air temperatures than Al Mamzar because they are denser. At the peak hour, which was 1:00 pm, the highest air temperature recorded was 30.1 °C at Jumeirah, while the lowest air temperature recorded was 28.5 °C at Al Marija. Furthermore, the lower air temperatures were recorded with traditional sites in the daytime while recording the higher air temperatures in the night-time.
The wind speed results in Figure 15 show that the highest wind speed occurred in Al Fahidi,1.8 m/s more than the initial wind input and 2.7 to 4 m/s higher than the other configurations. The results also revealed that the lowest wind speed was recorded in Jumeirah, as in December. Notably, Al Fahidi had a higher wind speed than the other five configurations.
The RH results in Figure 16 reveal that, during the day, the six sites have similar behavior, with slight differences in the readings and only 3% variation for the whole day. The higher readings were recorded in the early morning and late evening. Al Marija’s RH was 1–3% lower than the other configurations. In comparison, Jumeirah had higher humidity levels than the others, recording 73% during the early morning and late evening. On the other hand, during the day, all configurations recorded similar results, with the highest humidity level at Al Fahidi.
Table 6 shows the SVF calculated by ENVI-met for the selected sites. The SVF ranges from 0 to 1; as the value gets closer to one, more of the street is exposed to the upper hemisphere [45]. SVF and potential air temperature are expressed to have a linear relationship (R2 = 0.55) by [46]. As a result, shallow urban canyons have more thermal stress since they have more open sky and solar radiation.

August In-Depth Analysis

After analyzing the six scenarios over the three seasons, it was noted that in December and April the air temperature and RH levels were relatively close. In December the air temperature and RH had maximum variations of 2% and 6%, respectively, and in April the air temperature and RH had maximum variations of 1% and 3%, respectively. In August and April, during the daytime, the higher air temperatures were found at the newer urban configurations and the lower air temperatures were recorded at the older urban configurations, with temperatures increasing as urban density increased. In December, during the early morning and late evening, the highest air temperatures were recorded at the older urban configurations of Sidroh and Al Marija.
The highest air temperatures and greatest differences were recorded in August. Hence, the analysis was focused on this period when the UHI effect was at its peak. The following are the results for wind speed and direction and air temperature behavior at the peak hour of the day, 2:00 p.m., for high-density traditional and modern areas.
All the scenarios will be illustrated with images representing the wind speed and direction and air temperature behavior at the peak hour of the day 2:00 p.m. to conclude the results (Table 7).
Al Fahidi, the old high-density area, showed 44.44 °C as the lowest temperature and 48.16 °C as the highest temperature, which is higher than Al Marija and Sidroh. The lower air temperatures were recorded in the areas that have the highest H/W ratio and deepest canyons, which provide more shaded areas, and lack vehicular roads, as shown in Figure 17. Despite Al Fahidi having the lowest SVF of the six configurations, it had a higher maximum air temperature than the other old traditional sites due to its higher density, which increases the number of surfaces exposed to solar radiation. The higher air temperatures were found in the areas with the lowest H/W ratios, like open urban canyons, and near asphalt roads, which are located on the upper left corner and the edges of the simulated area. In comparison to its density, which is the highest of the six configurations, Al Fahidi had a lower average air temperature than the newer grid configurations with low and low-medium densities.
The average wind speed was 5.15 m/s, which is an increase of 1.55 m/s from the original wind speed, as shown in Figure 18. The highest wind speed, 9.76 m/s, was recorded around the mid-rise blocks and within the main gaps of the blocks located on the edges of the simulated area before being reoriented by the urban blocks.
Figure 19 shows that the modern high-density area, Al Safa I, recorded 44.67 °C as the lowest temperature and 48.80 °C as the highest temperature, with an average of 46.70 °C at 2:00 p.m., which is lower than the low-medium density area, Jumeirah. These results contradict the hypothesis that higher-density urban areas have higher air temperature values, which could be due to the following factors:
  • Building form: Due to the use of attached villas, the number of surfaces exposed to solar radiation and the heat released by the blocks has been reduced, resulting in a temperature decrease, as concluded by Okeil [47].
  • H/W ratio: The high H/W ratio produced more shaded areas between building blocks, which decreased the temperature, as concluded by Ali-Toudert and Mayer [17].
  • SVF: The SVF value has an impact on the air temperature variations; with a low SVF value, air temperature decreases, as concluded by Hu et al. [28]. Al Safa I had a lower SVF value than the low and low-medium new configurations, which decreased the air temperature.
The highest air temperatures were recorded at the edges of the configuration and were lower inside the configuration due to the resulting shade. The average wind speed of 2.63 m/s is the second-highest wind speed after that for Al Fahidi and is a decrease of 0.97 m/s from the original wind speed. The highest wind speed reached 5.39 m/s and was recorded around the blocks on the edges of the simulated area. In addition, the spots located in open spaces with less obstruction from buildings were windier than the others; as the wind penetrates the site, the blocks will change the wind direction while reducing its speed, as concluded by Golany [12] and shown in Figure 20.
Table 7A illustrates the air temperature distribution on August 15th for all the sites at 2:00 p.m. Notably, all the older organic configurations recorded lower air temperatures than the newer grid forms. The older configurations are compact and have narrow and winding alleyways that provide more shaded areas, which helped decrease the air temperature and reduce the solar gain, whereas the newer configurations have shallow and open streets and detached buildings that decrease the shaded areas and increase the solar gain and the exposure to the sun radiation. The Jumeirah area recorded the highest air temperature due to these factors. In addition, the air temperature increases in certain areas due to the increase of the urban density in the older and newer configurations, except for the Al Safa I area discussed earlier. Table 7B shows the histogram for the air temperature distribution on August 15th for the older and newer urban forms. The histogram for the older configurations had lower air temperatures than the newer urban forms, with a maximum reading of 47 °C, and most of the air temperature was centered around 45 °C. Notably, the lowest air temperatures were found in the courtyards. On the other hand, the histogram of the newer urban configurations showed air temperatures directed towards higher levels, with a maximum reading of 49 °C, and most of the air temperature was centered around 45.5–46 °C. The histograms revealed that the highest air temperature was recorded in the Jumeirah area at 49 °C.
Table 7C illustrates the wind speed distribution on August 15th for all the sites at 2:00 p.m. Notably, the highest wind speed was recorded in the older high-density urban form on the edges of the simulated area before being reoriented by the urban blocks of the site, which has midrise buildings. The maximum wind speed reached 9.76 m/s. Furthermore, it was noticed that the highest wind speeds in the simulated areas were recorded at the open urban canyon, which has blocks on both sides and a clear axis oriented toward the NW-SE, which is the dominant wind direction. On the other hand, the lowest wind speeds were recorded in the courtyards and between the building blocks in both the traditional and modern urban forms.
Table 7D shows the histogram for the wind speed distribution on August 15th for the older and the newer urban forms. The histogram of low and medium density in the traditional and the modern areas showed that the wind speed ranges from 1–3 m/s, and most of the wind speed was centered around 1.5–2 m/s. Notably, the Al Safa I area showed that 41% of the cells recorded low wind speeds ranging from 0.1–0.2 m/s, which could be due to the continuation of the attached villas that block the upcoming winds from the N/W. However, the second-highest wind speed reached 5.39 m/s and was recorded around the blocks on the edges of the simulated area. Furthermore, the highest wind speed was recorded in the Al Fahidi area around the mid-rise blocks on the edge, which reach 9.76 m/s.

5.2. Human Thermal Comfort

5.2.1. The Mean Radiant Temperature

The mean radiant temperature (MRT) was calculated for the six sites over three seasons to determine the PMV and help compare the other environmental and physiological factors.
The MRT refers to the surface average temperature that surrounds a specific point and the received radiation [48]. The MRT results are shown in Figure 21, Figure 22 and Figure 23 for the six sites during the three seasons. The graphs show that the six urban configurations have similar behavior during the early morning and night-time, while during the daytime there are significant differences.
The results revealed that Al Fahidi and Al Safa I areas, which represent the highest density forms in both categories, have recorded the lowest MRTs, lower than the other configurations by 15–20 °C at 2:00 p.m., which could be due to the low SVF ratios. Furthermore, the compactness of the urban forms intercepts the radiation and reduces the amount of heat absorbed by hard surfaces. Al Marija, Sidroh, Al Mamzar, and Jumeirah areas, which represent the low and low-medium density forms, recorded the highest MRT values during the three seasons, and this could be due to the low air velocity averages and high SVF ratios that increase the amount of the heat absorbed by the surfaces.

5.2.2. PMV Results Analysis

The fixed software input parameters for each season are the clothing insulation (Clo) and activity rate. The Clo values are 0.5 in August, 1.0 in December, and 0.7 in April, while the activity rate was fixed in all scenarios at 1.5 to represent a standing person. The thermal comfort in the PMV tool ranges from −4 to +4, where the closest values to zero are optimum for human thermal comfort. Figure 24 illustrates the PMV average values for the six configurations over the three seasons. The results show that all the configurations experienced high PMV values and 100% dissatisfaction during the high air temperatures in August, which were out of the human comfort zone. However, Al Fahidi had the lowest PMV of the six configurations, with 4.8, while Al Mamzar and Jumeirah had the highest, with 5.4.
In December, the dissatisfaction percentages were 5% for all the configurations with slight differences in PMV levels. The results show that Al Marija, Al Mamzar, and Jumeirah configurations exhibited optimum thermal comfort in December, while the other configurations had negative results, with −0.2 maximum, which means colder temperatures and less thermal comfort.
In April, Al Fahidi registered the lowest PMV value of 0.5 and 10% human dissatisfaction. On the other hand, the Al Marija configuration recorded the highest PMV value of 1.1 and 29% human comfort dissatisfaction.
Furthermore, PMV simulation results for August were extracted at 2:00 p.m. since it represents the peak hour, as shown in Table 8. The images support the average results that were analyzed in the previous chart. The old high-density district achieved the best human thermal comfort due to the high H/W ratio, which provides more shaded areas and alleyways, and the lowest SVF, which decreases the amount of exposure to the sunlight and reduces the air temperature and MRT. A summary of the PMV values for all the sites can be seen in Figure 24.
Table 9 The images support the average results that were analyzed in the previous chart. The PMV values range from −4 to +4, where the closest values to zero are optimum for human thermal comfort. Hence, the optimum urban form in terms of human thermal comfort is the traditional high-density and modern high-density configurations respectively. There are common parameters in both sites, the high H/W ratio, deep urban canyons, and low s.v.f. All these factors lead to having more shaded areas, a reduction in air temperature, a decrease in the amount of exposure to the sunlight, and reduced MRT. On the other hand, the worst thermal comfort levels were exhibited in districts with shallow urban canyons, low H/W ratio, high exposure to the upper hemisphere, and high MRT values as Al Marija, Al Mamzar, and Jumeirah districts respectively.

6. Discussion

In order to mitigate the UHI intensity in the Gulf region, the most impactful urban form parameters (Urban layout, building form, building density, and street geometry) for reducing the air temperature were analyzed. The results revealed that traditional compact urban forms recorded lower day-time air temperatures than the modern urban forms while recording higher air temperatures at night and early morning, except for the high-density urban form (Alfahidi), which recorded lower air temperatures, and this could be due to the building form and height. Zakhour S. [21] concluded that the traditional city recorded lower air temperature than the new city with air temperature differences reaching 4 °C. Contrary to our research, the results were analyzed without considering the building density since the study was just a sample of new and traditional districts.
The most elevated air temperatures were recorded in shallow urban canyons in modern detached urban forms due to the high exposure to solar radiation. The aspect ratio, or the ratio of height to width (h/w), was the one that had the most significant impact on temperature reduction among the parameters that were simulated. The results showed that in the deep canyons (H/W = 4), almost 8-10% of the street width is exposed to solar radiation, while around 85% of street width in shallow canyons (H/W = 0.37) is exposed to sunlight. Bourbia F, Awbi HB [49] observed that in a deep canyon (H/W = 1.5), almost 35% of the street width receives direct solar radiation, whereas around 65% of the street width in a shallow canyon (H/W = 0.5) is exposed to direct sunlight. Consequently, the effect of the high H/W ratio provided a high reduction in air temperature.
The building form does have an impact on reducing the air temperature, as the results showed that the lowest air temperatures in the peak hours were recorded in the inner courtyards with H/W = 1.3. These were 1–2 °C lower than those recorded in the street canyon. While Thapar H, Yannas S. [14] recorded lower air temperature in courtyards with H/W = 1.8 as well, he maintained that they could reach 4–6 °C. This variance could be due to the difference in the H/W ratios. Thus, it could be concluded that the H/W ratio has an impact on reducing the air temperature within the same building type, the higher the H/W ratio the lower the air temperature will be.
Another critical parameter is the building density. In contrast to Elnahas MM [27], who concluded that higher density configurations have higher air temperatures due to heat absorption and thermal storage by the building blocks. The research revealed unexpectedly, that the high-density urban form recorded lower air temperature in (Alsafa I area) and was more thermally comfortable in (Al Fahidi area) than other configurations and this could be due to the villas being attached, low SVF, the decrease in the number of surfaces exposed to solar radiation, and the lowering of heat released by the building blocks. It could be noted that the H/W ratio parameter has more impact than the urban density on the reduction of air temperature and UHI intensity mitigation, as seen in the aforementioned sites.
The study revealed that the highest wind speeds were recorded around the midrise blocks [5] floors) that are located on the edges, which is higher than the other configurations by 2.7 to 3.8 m/s and 94% higher than the inner wind speeds in the same area. However, the existence of high wind speeds around mid-rise blocks couldn’t reduce the air temperature in this area. Furthermore, the open urban canyons, which have blocks on both sides and a clear axis oriented toward the NW-SE recorded higher wind speeds than other canyons in the same area reaching 2.4 m/s. Priyadarsini R and Wong N H stated that having a high-rise building adjacent to a row of low buildings will accelerate the wind by 90% and reduces air temperature by 1% [26].
This study shows that the highest density traditional urban form achieved the best thermal comfort values due to the street geometries, high H/W ratio which is =4, more shade, lowest MRT values, and less exposure to solar radiation compared with the other configurations. The thermal condition significantly varies within the areas as shown in Table 8 and Table 9. In narrow and shaded canyons, the pmv values may reach optimum levels even in the late afternoon, especially during the cooler months, despite the high density. Yahia et al. [46] concluded that districts with low-rise buildings have urban environments that are more stressful than neighborhoods with high towers. However, the maximum height in Al Fahidi area was 5 Floors and the majority of the buildings are within 2–3 floors.

7. Conclusions

This research investigated the urban form parameter’s impact on the UHI intensity. The parameter’s results were extracted and analyzed in terms of their efficiency in temperature reduction and thermal comfort.
The results revealed that in August, traditional urban configurations with high H/W ratios and low SVFs exhibited the lowest average daily and peak hours air temperatures by maximizing shaded areas and minimizing solar radiation exposure, while the highest average daily air temperatures were recorded in modern urban configurations with low H/W ratios and high SVFs. The traditional urban forms recorded 1–2 °C less than the modern forms in the daytime peak hours. Moreover, the traditional urban configurations showed the highest air temperatures during the early morning and late evening. In December. The traditional urban areas of Al Marija and Sidroh had the highest air temperature in the early morning and evening. During the day, Al Fahidi had the lowest air temperature. In April and August, the highest air temperatures during the daytime were recorded at Jumeirah, which is a modern, detached, and low-medium density urban form with a low H/W ratio and high SVF.
The study revealed that the higher the H/W ratio, the lower the air temperature will be since Al Fahidi area recorded lower air temperature and achieved the optimum human thermal comfort. According to the study, Mid-rise building locations lead to less stressful urban environments than low-rise building regions. In addition, compact urban morphologies cut down on both the amount of solar radiation that reaches the ground surface as well as the duration that people are exposed to the sun. The highest wind speeds were found in the NW-SE and near the mid-rise blocks recorded at 9.76 m/s.
The urban building form, H/W ratio, SVF, and density distribution layout play significant roles in mitigating the UHI phenomenon. The following issues were noted regarding the effect of urban form with respect to density:
  • While higher density urban areas typically have higher air temperatures, Al Safa I had lower air temperatures than the low and low-medium density areas.
  • This could occur due to several factors, including the use of attached villas that reduce heat gain, the high H/W ratio that provides more shaded areas, the low SVF value that results in a temperature decrease, and wind corridors between the rows of the attached villas that increase wind movement.
  • In Al Fahidi, the densest traditional form recorded lower air temperature than the less dense modern forms by 1 °C. Notably, High H/W ratio and low SVF have a more significant impact on reducing air temperature, increasing the shaded areas, and enhancing human thermal comfort, despite the effect of high urban density.
A strong correlation was found between the SVF, H/W ratio, and MRT on one side and PMV levels on the other. Shading significantly decreased MRT values as solar radiation decreased in the urban forms with a high H/W ratio and low SVF. Consequently, the best PMV values were consistently observed in these urban forms, such as Al Fahidi and Al Safa I, in August. Accordingly, this study shows that traditional high-density urban forms with high H/W ratios, narrow canyons, low SVFs, and low MRT values, such as Al Fahidi, are more thermally comfortable compared to the modern urban forms that have open canyons with less density.
This study shows that compact traditional urban forms can enhance thermal conditions and sustainability in hot, dry regions regardless of the density. The results reveal that the highest density traditional urban form achieved the best thermal comfort values due to the street geometries and less exposure to solar radiation compared with the other configurations. Despite this, the compact urban form needs to be adapted with consideration of winter conditions. By compromising and taking advantage of each urban form feature, urban designers can achieve an optimized urban form that behaves most favorably throughout the year. In addition, UHI intensity could be optimized and mitigated by several strategies, such as distributing layouts of the urban blocks, using the most suitable building form and orientation, and utilizing the prevailing wind, high H/W ratios, and low SVF to mitigate the UHI effect. The findings also give a better understanding of the key variables that affect UHIs, which must be taken into consideration by urban planning legislation and policy in order to create livable cities and promote social welfare.

Author Contributions

Conceptualization, A.E. and S.N.K.; methodology, A.E. and S.N.K.; software, A.E.; validation, A.E., S.N.K.; formal analysis, A.E. and S.N.K.; investigation, A.E.; resources, A.E., S.N.K. and M.S.A.; data curation, A.E. and S.N.K.; writing—original draft preparation, A.E.; writing—review and editing, A.E. and S.N.K.; visualization, A.E., S.N.K.; supervision, A.E. and S.N.K.; project administration, A.E. and S.N.K. All authors have read and agreed to the published version of the manuscript.

Funding

This research received no external funding.

Institutional Review Board Statement

Not applicable.

Informed Consent Statement

Not applicable.

Data Availability Statement

Not applicable.

Acknowledgments

The authors would like to acknowledge the support received from the University of Ajman and the Healthy and Sustainable Built Environment Research Center.

Conflicts of Interest

The authors declare no conflict of interest.

Abbreviations

H/WHeight-to-width ratio
SVFSky view factor
PMVPredicted mean vote
RHRelative humidity
MRTMean radiant temperature
UHIUrban heat island
CloClothing insulation

References

  1. Roth, M.; Chow, W.T.L. A historical review and assessment of urban heat island research in Singapore. Singap. J. Trop. Geogr. 2012, 33, 381–397. [Google Scholar] [CrossRef]
  2. Kolokotroni, M.; Giannitsaris, I.; Watkins, R. The effect of the London urban heat island on building summer cooling demand and night ventilation strategies. Sol. Energy 2006, 80, 383–392. [Google Scholar] [CrossRef]
  3. Wanphen, S.; Nagano, K. Experimental study of the performance of porous materials to moderate the roof surface temperature by its evaporative cooling effect. Build Environ. 2009, 44, 338–351. [Google Scholar] [CrossRef]
  4. Kaboré, M.; Bozonnet, E.; Salagnac, P.; Abadie, M.; Perrin, R. Cool roof and natural ventilation for UHI mitigation and indoor comfort—Cooling indicators for a commercial building. In Proceedings of the 33rd PLEA Int Conf Des to Thrive, Edinburgh, UK, 2–5 July 2017; Volume 2, pp. 1749–1756. [Google Scholar]
  5. Qaid, A.; Bin Lamit, H.; Ossen, D.R.; Raja Shahminan, R.N. Urban heat island and thermal comfort conditions at micro-climate scale in a tropical planned city. Energy Build. 2016, 133, 577–595. [Google Scholar] [CrossRef]
  6. Sanagar Darbani, E.; Monsefi Parapari, D.; Boland, J.; Sharifi, E. Impacts of urban form and urban heat island on the outdoor thermal comfort: A pilot study on Mashhad. Int. J. Biometeorol. 2021, 65, 1101–1117. [Google Scholar] [CrossRef]
  7. United Nations. 68% of the World Population Projected to Live in Urban Areas by 2050, Says UN. 2018. Available online: https://www.un.org/development/desa/en/news/population/2018-revision-of-world-urbanization-prospects.html (accessed on 10 July 2022).
  8. Nuruzzaman, M. Urban Heat Island: Causes, Effects and Mitigation Measures—A Review. Int. J. Environ. Monit. Anal. 2015, 3, 67–73. [Google Scholar] [CrossRef] [Green Version]
  9. Kharrufa, S.N.; Noori, F. A Review of Thermal Design for Buildings in Hot Climates. Pertanika J. Sci. Technol. 2022, 30, 813–837. [Google Scholar] [CrossRef]
  10. Kharrufa, S.; Makky, S. Effect of a Secondary Building Envelope on Cooling Loads in Hot Climates. J. Archit. Eng. 2022, 28, 04022008. Available online: https://ascelibrary.org/doi/abs/10.1061/%28ASCE%29AE.1943-5568.0000535 (accessed on 12 July 2022). [CrossRef]
  11. Xuan, Y.; Yang, G.; Li, Q.; Mochida, A. Outdoor thermal environment for different urban forms under summer conditions. Build. Simul. 2016, 9, 281–296. [Google Scholar] [CrossRef]
  12. Golany, G.S. Urban design morphology and thermal performance. Atmos. Environ. 1996, 30, 455–465. Available online: https://0-www-sciencedirect-com.brum.beds.ac.uk/science/article/abs/pii/1352231095002669 (accessed on 5 January 2022). [CrossRef]
  13. World Health Organization. WHO Air Quality Guidelines. 2022. Available online: https://www.who.int/ (accessed on 12 July 2022).
  14. Thapar, H.; Yannas, S. Microclimate and urban form in Dubai. In Proceedings of the 25th PLEA International Conference on Passive and Low Energy Architecture, Conference Proceedings, Dublin, Ireland, 22–24 October 2008; pp. 1–6. Available online: https://www.researchgate.net/publication/263658296_Microclimate_and_Urban_Form_in_Dubai (accessed on 5 January 2022).
  15. Alobaydi, D.; Bakarman, M.A.; Obeidat, B. The Impact of Urban Form Configuration on the Urban Heat Island: The Case Study of Baghdad, Iraq. Procedia Eng. 2016, 145, 820–827. Available online: https://0-www-sciencedirect-com.brum.beds.ac.uk/science/article/pii/S1877705816301126 (accessed on 20 March 2022). [CrossRef]
  16. Tong, S.; Wong, N.H.; Tan, C.L.; Jusuf, S.K.; Ignatius, M.; Tan, E. Impact of urban morphology on microclimate and thermal comfort in northern China. Sol. Energy 2017, 155, 212–223. Available online: https://www.researchgate.net/publication/317792222_Impact_of_urban_morphology_on_microclimate_and_thermal_comfort_in_northern_China (accessed on 1 July 2022). [CrossRef]
  17. Ali-Toudert, F.; Mayer, H. Numerical study on the effects of aspect ratio and orientation of an urban street canyon on outdoor thermal comfort in hot and dry climate. Build. Environ. 2006, 41, 94–108. [Google Scholar] [CrossRef]
  18. Bourbia, F.; Boucheriba, F. Impact of street design on urban microclimate for semi arid climate (Constantine). Renew. Energy 2010, 35, 343–347. Available online: https://0-www-sciencedirect-com.brum.beds.ac.uk/science/article/abs/pii/S0360132305000120 (accessed on 20 April 2021). [CrossRef]
  19. Shareef, S.; Abu-Hijleh, B. The effect of building height diversity on outdoor microclimate conditions in hot climate. A case study of Dubai-UAE. Urban Clim. 2020, 32, 100611. Available online: https://0-doi-org.brum.beds.ac.uk/10.1016/j.uclim.2020.100611 (accessed on 1 July 2022). [CrossRef]
  20. Bakarman, M.A.; Chang, J.D. The Influence of Height/width Ratio on Urban Heat Island in Hot-arid Climates. Procedia Eng. 2015, 118, 101–108. Available online: https://www.researchgate.net/profile/Mohammed_Bakarman/publication/283172688_The_Influence_of_Heightwidth_Ratio_on_Urban_Heat_Island_in_Hot-arid_Climates/links/56a13a9e08ae27f7de265de8/The-Influence-of-Height-width-Ratio-on-Urban-Heat-Island-in-Hot-arid-C (accessed on 20 March 2022). [CrossRef]
  21. Zakhour, S. The Impact of Urban Geometry on Outdoor Thermal Comfort Conditions in Hot-arid Region. J. Civ. Eng. Archit. Res. 2015, 2, 862–875. Available online: https://www.researchgate.net/publication/322330055_The_impact_of_urban_geometry_on_outdoor_thermal_comfort_conditions_in_hot-arid_region (accessed on 17 February 2022).
  22. Johansson, E. Influence of urban geometry on outdoor thermal comfort in a hot dry climate: A study in Fez, Morocco. Build. Environ. 2006, 41, 1326–1338. Available online: https://0-www-sciencedirect-com.brum.beds.ac.uk/science/article/abs/pii/S0360132305001952 (accessed on 5 January 2022). [CrossRef]
  23. Andreou, E. The effect of urban layout, street geometry and orientation on shading conditions in urban canyons in the Mediterranean. Renew. Energy 2014, 63, 587–596. [Google Scholar] [CrossRef]
  24. Boukhabla, M.; Alkama, D.; Bouchair, A. The effect of urban morphology on urban heat island in the city of Biskra in Algeria. Int. J. Ambient. Energy 2013, 34, 100–110. Available online: https://www.researchgate.net/publication/263674934_The_effect_of_urban_morphology_on_urban_heat_island_in_the_city_of_Biskra_in_Algeria (accessed on 15 April 2022). [CrossRef]
  25. Shishegar, N. Street Design and Urban Microclimate: Analyzing the Effects of Street Geometry and Orientation on Airflowand Solar Access in Urban Canyons. J. Clean Energy Technol. 2013, 1, 52–56. [Google Scholar] [CrossRef]
  26. Priyadarsini, R.; Wong, N.H. Parametric studies on urban geometry, air flow and temperature. Int. J. Archit. Sci. 2005, 6, 114–132. Available online: https://www.researchgate.net/publication/266370420_Parametric_studies_on_urban_geometry_airflow_and_temperature#fullTextFileContent (accessed on 3 June 2022).
  27. Elnahas, M.M. The effects of urban configuration on urban air temperatures. Archit. Sci. Rev. 2003, 46, 135–138. Available online: https://www.academia.edu/5148798/THE_EFFECTS_OF_URBAN_CONFIGURATION_ON_URBAN_AIR_TEMPERATURES (accessed on 7 April 2021). [CrossRef]
  28. Hu, Y.; White, M.; Ding, W. An Urban Form Experiment on Urban Heat Island Effect in High Density Area. Procedia Eng. 2016, 169, 166–174. Available online: https://0-www-sciencedirect-com.brum.beds.ac.uk/science/article/pii/S1877705816332222 (accessed on 15 April 2022). [CrossRef]
  29. Rasyidi, E.S.; Rahman, R.; Okviyani, N.; Ma’rief, A.A. Assessment of the relationship between building density and urban heat island using Landsat images in Makassar City. IOP Conf. Ser. Earth Environ. Sci. 2021, 7, 012042. [Google Scholar]
  30. Taleb, H.M. Using passive cooling strategies to improve thermal performance and reduce energy consumption of residential buildings in U.A.E. buildings. Front. Archit. Res. 2014, 3, 154–165. [Google Scholar] [CrossRef] [Green Version]
  31. Tumini, I.; Higueras García, E.; Baereswyl Rada, S. Urban microclimate and thermal comfort modelling: Strategies for urban renovation. Int. J. Sustain. Build. Technol. Urban Dev. 2016, 7, 22–37. [Google Scholar] [CrossRef] [Green Version]
  32. Minella, F.O.; Krüger, E.L. Using Computer Simulations for Assessing Microclimatic Impacts of Urban Interventions. In Proceedings of the PLEA 2013 Sustain Archit a Renew Futur, Munich, Germany, 10–12 September 2013; pp. 3–8. [Google Scholar]
  33. Google. Google Earth. 2022. Available online: https://earth.google.com/web/@25.18174191,55.24203256,6.05498693a,38669.0765956d,35y,338.38260801h,0t,0r (accessed on 15 June 2022).
  34. Google. Google Maps. 2022. Available online: https://www.google.com/maps (accessed on 15 June 2022).
  35. Salata, F.; Golasi, I.; de Lieto Vollaro, R.; de Lieto Vollaro, A. Urban microclimate and outdoor thermal comfort. A proper procedure to fit ENVI-met simulation outputs to experimental data. Sustain. Cities Soc. 2016, 26, 318–343. [Google Scholar] [CrossRef]
  36. Simon, H. Modeling Urban Microclimate-Development, Implementation and Evaluation of New and Improved Calculation Methods for the Urban Microclimate Model ENVI-met. 2016. (MICROSCALE MODELS) Thesis: 233. Available online: https://openscience.ub.uni-mainz.de/handle/20.500.12030/4044 (accessed on 15 July 2022).
  37. Taleghani, M.; Tenpierik, M.; Kurvers, S.; Van Den Dobbelsteen, A. A review into thermal comfort in buildings. Renew Sustain Energy Rev. 2013, 26, 201–215. [Google Scholar] [CrossRef]
  38. Ahmed, K.S. Comfort in urban spaces: Defining the boundaries of outdoor thermal comfort for the tropical urban environments. Energy Build 2003, 35, 103–110. Available online: 222022178_Comfort_in_urban_spaces_Defining_the_boundaries_of_outdoor_thermal_comfort_for_the_tropical_urban_environments (accessed on 15 June 2022). [CrossRef]
  39. Humidity R, Point D. HOBO ® MX1101 Data Logger. 2015. Available online: https://assets.omega.com/spec/HOBO_MX1101_Datasheet.pdf (accessed on 20 July 2022).
  40. Tsoka, S.; Tsikaloudaki, A.; Theodosiou, T. Analyzing the ENVI-met microclimate model’s performance and assessing cool materials and urban vegetation applications–A review. Sustain. Cities Soc. 2018, 43, 55–76. [Google Scholar] [CrossRef]
  41. López-Cabeza, V.P.; Galán-Marín, C.; Rivera-Gómez, C.; Roa-Fernández, J. Courtyard microclimate ENVI-met outputs deviation from the experimental data. Build. Environ. 2018, 144, 129–141. [Google Scholar] [CrossRef]
  42. Development of Global Typical Meteorological Years (TMYx). 2019. Available online: https://climate.onebuilding.org/WMO_Region_2_Asia/ARE_United_Arab_Emirates/index.html (accessed on 15 May 2022).
  43. Iowa State University. Lowa Enviromental Mesonet. 2020. Available online: https://mesonet.agron.iastate.edu/sites/windrose.phtml?station=OMDB&network=AE__ASOS (accessed on 2 July 2022).
  44. Vadoudi, K.; Marinhas, S. Development of Psychrometric diagram for the energy efficiency of Air Handling Units. Int. J. Vent. 2018, 3, 491–500. [Google Scholar]
  45. Unger, J. Connection between urban heat island and sky view factor approximated by a software tool on a 3D urban database. Int. J. Environ. Pollut. 2009, 36, 59–80. [Google Scholar] [CrossRef] [Green Version]
  46. Yahia, M.W.; Johansson, E.; Thorsson, S.; Lindberg, F.; Rasmussen, M.I. Effect of urban design on microclimate and thermal comfort outdoors in warm-humid Dar es Salaam, Tanzania. Int. J. Biometeorol. 2018, 62, 373–385. [Google Scholar] [CrossRef] [Green Version]
  47. Okeil, A. A holistic approach to energy efficient building forms. Energy Build. 2010, 42, 1437–1444. Available online: https://www.researchgate.net/publication/257226601_A_Holistic_approach_to_energy_efficient_building_forms (accessed on 2 July 2022). [CrossRef]
  48. Perini, K.; Chokhachian, A.; Auer, T. Green streets to enhance outdoor comfort. In Nature Based Strategies for Urban and Building Sustainability; Elsevier Inc.: Amsterdam, The Netherlands, 2018; pp. 119–129. [Google Scholar] [CrossRef]
  49. Bourbia, F.; Awbi, H.B. Building cluster and shading in urban canyon for hot dry climate Part 1: Air and surface temperature measurements. Renew. Energy 2004, 29, 249–262. [Google Scholar] [CrossRef]
Figure 1. Classification of PMV levels based on nine comfort scales. Image generated by the author from reference [38].
Energies 15 05471 g001
Figure 2. (a) The location of the selected point for validation by the simulation and measurements. (Google Earth) [33]; (b) the onset data logger, shown on the right (image by author).
Energies 15 05471 g002
Figure 3. Air temperature simulation result of the selected area in Al Taawun at 2:00 pm. (Image generated by ENVI-met).
Energies 15 05471 g003
Figure 4. Measured and simulated air temperature in Al Taawun on 11 February 2022.
Energies 15 05471 g004
Figure 5. The average monthly air temperature in Dubai, UAE. Graph generated by the author from reference [42].
Energies 15 05471 g005
Figure 6. The average monthly RH, in Dubai, UAE. Graph generated by the author from reference [42].
Energies 15 05471 g006
Figure 7. Wind speed and direction in Dubai, UAE [43].
Energies 15 05471 g007
Figure 8. (a) Hourly variations of air temperature (°C) for Al Marija, Sidroh, Al Fahidi, Al Mamzar, Jumeirah, and Al Safa I in August. (b) Average air temperature (°C) for daytime, nighttime, and the whole 24 h in August.
Energies 15 05471 g008aEnergies 15 05471 g008b
Figure 9. Hourly variations of wind speeds (m/s) for Al Marija, Sidroh, Al Fahidi, Al Mamzar, Jumeirah, and Al Safa I in August.
Energies 15 05471 g009
Figure 10. Hourly variations of relative humidity (%) for Al Marija, Sidroh, Al Fahidi, Al Mamzar, Jumeirah, and Al Safa I in August.
Energies 15 05471 g010
Figure 11. (a) Hourly variations of air temperature (°C) for Al Marija, Sidroh, Al Fahidi, Al Mamzar, Jumeirah, and Al Safa I in December. (b) Average air temperature (°C) for daytime, nighttime, and the whole 24 h in December.
Energies 15 05471 g011
Figure 12. Hourly variations of wind speeds (m/s) for Al Marija, Sidroh, Al Fahidi, Al Mamzar, Jumeirah, and Al Safa I in December.
Energies 15 05471 g012
Figure 13. Hourly variations of relative humidity (%) for Al Marija, Sidroh, Al Fahidi, Al Mamzar, Jumeirah, and Al Safa I in December.
Energies 15 05471 g013
Figure 14. (a) Hourly variations of air temperature (°C) for Al Marija, Sidroh, Al Fahidi, Al Mamzar, Jumeirah, and Al Safa I in April. (b) Average air temperature (°C) for daytime, nighttime, and the whole 24 h in April.
Energies 15 05471 g014
Figure 15. Hourly variations of wind speeds (m/s) for Al Marija, Sidroh, Al Fahidi, Al Mamzar, Jumeirah, and Al Safa I in April.
Energies 15 05471 g015
Figure 16. Hourly variations of relative humidity (%) for Al Marija, Sidroh, Al Fahidi, Al Mamzar, Jumeirah, and Al Safa I in April.
Energies 15 05471 g016
Figure 17. Air temperature for Al Fahidi urban form at 2:00 p.m. on 15 August. (ENVI-met).
Energies 15 05471 g017
Figure 18. Wind speed and direction for Al Fahidi urban form at 2:00 p.m. on 15 August. (ENVI-met).
Energies 15 05471 g018
Figure 19. Air temperature for Al Safa I urban form at 2:00 pm on August 15 (ENVI-met).
Energies 15 05471 g019
Figure 20. Wind speed and direction for Al Safa I urban form at 2:00 pm on August 15 (ENVI-met).
Energies 15 05471 g020
Figure 21. Average mean radiant temperature (°C) for Al Marija, Sidroh, Al Fahidi, Al Mamzar, Jumeirah, and Alsafa I in August.
Energies 15 05471 g021
Figure 22. Average mean radiant temperature (°C) for Al Marija, Sidroh, Al Fahidi, Al Mamzar, Jumeirah, and Alsafa I in December.
Energies 15 05471 g022
Figure 23. Average mean radiant temperature (°C) for Al Marija, Sidroh, Al Fahidi, Al Mamzar, Jumeirah, and Alsafa I in April.
Energies 15 05471 g023
Figure 24. PMV average values for Al Marija, Sidroh, Al Fahidi, Al Mamzar, Jumeirah, and Al Safa I during the three different seasons.
Energies 15 05471 g024
Table 1. Particulate matter concentrations in Dubai on 25 June 2022 (measurements by author).
PM µmDubai µg/m³WHO Recommendations 2021 24-h [13]
1124.1
2.5511.0315
5470.53
10810.8645
Table 2. Geographical locations and urban configurations for modern and traditional sites.
NameGeographical MapUrban Configuration
Building FormBuilding HeightsRoads and Walkways
Al Marija Energies 15 05471 i001
(Google Earth) [33]
Old low-density traditional urban form with courtyard clusters.Building blocks are low rises with one story in height.Narrow alleyways, cul-de-sacs, and zigzagging road networks range from 1 to 3 m wide. No vehicular asphalt roads cross the site, and there are paved pedestrian walkways.
Energies 15 05471 i002
(Photos taken by the author)
Sidroh Energies 15 05471 i003
(Google Earth) [33].
Old low-medium density and traditional urban form
with compact
courtyard clusters
Building blocks are low rises with one story in height.Narrow alleyways, cul-de-sacs, and zigzagging road networks range from 2 to 3 m wide.
No vehicular asphalt roads nor paved pedestrian walkways cross the site. Only sandy soil covers the whole area.
Energies 15 05471 i004
(Google Maps) [34].
Al Fahidi Energies 15 05471 i005
(Google Earth) [33].
Old high density and traditional urban form that has very dense and compact urban clusters.Building blocks are all low and mid-rise, ranging between two and seven stories in height.Narrow alleyways and zigzagging road
networks range from
2 to 3 m wide. Main vehicular asphalt roads are on the periphery of the site, and paved
pedestrian walkways without vehicular distraction run through the whole site.
Energies 15 05471 i006
(Author and Google Maps) [34]
Al Mamzar Energies 15 05471 i007
(Google Earth) [33]
Low-density modern grid detached urban form, which has detached low-rise villas.
The distances between the residential blocks range from 10 to 20 m.
Buildings are one or two stories in height.Gridded street systems are as wide as 6 m. Roads are made of asphalt, with side walkways made of pavers.
Energies 15 05471 i008
(Photos taken by the author.)
Jumeirah Energies 15 05471 i009
(Google Earth) [33]
Low-medium density modern grid detached
urban form,
which has
detached low-
rise villas. The distances between the residential blocks range
from 8 to10 m.
Buildings are one
or two stories in
height.
Gridded street
systems are as wide
as 6 m. Roads are made of asphalt, with side walkways made of pavers.
Energies 15 05471 i010
(Photos taken by the author)
Al Safa I Energies 15 05471 i011
(Google Earth) [33]
High-density modern grid attached urban form has
attached low-rise villas.
Buildings are two stories in height.Gridded street systems range from 6 to 8 m wide. The roads are made of
asphalt, with side
walkways made of pavers.
Energies 15 05471 i012
(Photos taken by the author)
Table 3. Constant, independent, and dependent factors used in the simulation.
Research Factors
Constant factors
-
Building materials–Timing-Climatic data (e.g., air temperature, wind speed and direction, and humidity) based on the desired season
Independent factors
-
Urban form orientation-Building Form-Street geometry and material-Walkways and alleyways geometry, width, and materials-Urban density
Dependent factors
-
Air temperature
-
Wind speed and direction
-
Humidity
-
Mean radiant temperature
-
Thermal comfort (predicted mean vote; PMV)
Table 4. Software parameters and their values.
Site Specifications
LocationDubai, UAE [25]. 25 latitudes, 55.33 longitudes).
Simulation duration24 h [00]:00–23:59).
Resolution1:2
Simulated days15 April 2019, 15 August 2019, 21 December 2019,
Building Specifications
WallConcrete (hollow block)
RoofConcrete slab (hollow block)
Soil and Surface Specifications
WalkwaysConcrete pavement-light
Vehicular roadsAsphalt black road
Climate Input Data: Season and Date Dependent
Wind direction315 N-W
Wind speed7 kts, 3.6 m/s
Air Temperature [42]
15 August
21 December
15 April
Max. 46 °C/min 35 °C
Max. 25 °C/min 18 °C
Max. 29 °C/min 21 °C
Relative Humidity [42]
15 August
21 December
15 April
Max. 56%/min 11%
Max. 49 °C/min 26 °C
Max. 73 °C/min 37 °C
Table 5. Urban sites characteristics (author), ground and 3d geometry images generated by (ENVI-met).
Energies 15 05471 i013 Energies 15 05471 i014
Ground and built up areaAl Marija areaSidroh areaAl Fahidi areaAl Mamzar areaJumeirah areaAl Safa I
Energies 15 05471 i015Built up area = 14,000 m2 Energies 15 05471 i016Built up area = 17,500 m2 Energies 15 05471 i017Built up area = 67,000 m2 Energies 15 05471 i018Built up area = 7200 m2 Energies 15 05471 i019Built up area = 11,000 m2 Energies 15 05471 i020Built up area = 39,500 m2
Plot Area200 × 200 = 40,000 m2200 × 200 = 40,000 m2200 × 200 = 40,000 m2200 × 200 = 40,000 m2200 × 200 = 40,000 m2200 × 200 = 40,000 m2
Urban DensityBuilt up area m2/Plot area m2 = 0.35Built up area m2/Plot area m2 = 0.45Built up area m2/Plot area m2 = 1.68Built up area m2/Plot area m2 = 0.18Built up area m2/Plot area m2 = 0.28Built up area m2/Plot area m2 = 0.99
Urban LayoutOrganic LayoutOrganic LayoutOrganic LayoutGrid LayoutGrid LayoutGrid Layout
Building Height4 m4 m8–20 m4–8 m4–8 m8 m
Urban & Street
Geometry
Energies 15 05471 i021 Energies 15 05471 i022 Energies 15 05471 i023 Energies 15 05471 i024 Energies 15 05471 i025 Energies 15 05471 i026
H/W = 1.3H/W = 1.5H/W = 4H/W = 0.4H/W = 0.37H/W = 0.7
Street Orientation Energies 15 05471 i027 Energies 15 05471 i028 Energies 15 05471 i029 Energies 15 05471 i030 Energies 15 05471 i031 Energies 15 05471 i032
NW-SEE-WN-SNE-SWNE-SWNE-SW
3D Geometry Energies 15 05471 i033 Energies 15 05471 i034 Energies 15 05471 i035 Energies 15 05471 i036 Energies 15 05471 i037 Energies 15 05471 i038
Table 6. Sky view factor for the six sites. (Images generated by ENVI-met).
Sky View Factor
Energies 15 05471 i039
Old Organic Configurations
Al Marija Area-Low DensitySidroh Area-Low-Medium DensityAl Fahidi Area-High Density
Energies 15 05471 i040 Energies 15 05471 i041 Energies 15 05471 i042
New Grid Configurations
Al Mamzar Area-Low DensityJumeirah Area-Low-Medium DensityAl Safa I area-High Density
Energies 15 05471 i043 Energies 15 05471 i044 Energies 15 05471 i045
Table 7. Air temperature and wind distribution for the six sites on the 15 August. (Images generated by ENVI-met).
A.Air temperature
Energies 15 05471 i046
Old organic configurationsNew grid configuration
Al Marija area-Low densitySidroh area-Low-Medium densityAl Fahidi area-High densityAl Mamzar area-Low densityJumeirah area-Low-Medium
density
Al Safa I-High density
Energies 15 05471 i047 Energies 15 05471 i048 Energies 15 05471 i049 Energies 15 05471 i050 Energies 15 05471 i051 Energies 15 05471 i052
B. Histogram Energies 15 05471 i053 Energies 15 05471 i054 Energies 15 05471 i055 Energies 15 05471 i056 Energies 15 05471 i057 Energies 15 05471 i058
C. Wind speed
Energies 15 05471 i059
Energies 15 05471 i060 Energies 15 05471 i061 Energies 15 05471 i062 Energies 15 05471 i063 Energies 15 05471 i064 Energies 15 05471 i065
D. Histogram Energies 15 05471 i066 Energies 15 05471 i067 Energies 15 05471 i068 Energies 15 05471 i069 Energies 15 05471 i070 Energies 15 05471 i071
Table 8. ENVI-met maps of the PMV values for Al Marija, Sidroh, Al Fahidi, Al Mamzar, Jumeirah, and Al Safa I in August at 2:00 pm (Images generated by ENVI-met).
PMV values at 2:00 p.m.
Energies 15 05471 i072
Old Organic Configurations
Al Marija Area-Low DensitySidroh Area-Low-Medium DensityAl Fahidi Area-High Density
Energies 15 05471 i073 Energies 15 05471 i074 Energies 15 05471 i075
New Modern Configurations
Al Mamzar Area-Low DensityJumeirah Area-Low-Medium DensityAl Safa I-High Density
Energies 15 05471 i076 Energies 15 05471 i077 Energies 15 05471 i078
Table 9. ENVI-met maps of the PMV values for Al Marija, Sidroh, Al Fahidi, Al Mamzar, Jumeirah, and Al Safa I in April at 2:00 pm (Images generated by ENVI-met).
PMV values at 2:00 pm
Energies 15 05471 i079
Old Organic Configurations
Al Marija Area-Low DensitySidroh Area-Low-Medium DensityAl Fahidi Area-High Density
Energies 15 05471 i080 Energies 15 05471 i081 Energies 15 05471 i082
New Modern Configurations
Al Mamzar Area-Low DensityJumeirah Area-Low-Medium DensityAl Safa I-High density
Energies 15 05471 i083 Energies 15 05471 i084 Energies 15 05471 i085
Publisher’s Note: MDPI stays neutral with regard to jurisdictional claims in published maps and institutional affiliations.

