Article

Low Carbon Economic Dispatch Optimization of Regional Integrated Energy Systems Considering Heating Network and P2G

1
Faculty of Electric Power Engineering, Kunming University of Science and Technology, Kunming 650500, China
2
Faculty of Electric Power Engineering, Oxbridge College, Kunming University of Science and Technology, Kunming 650101, China
3
Kunming Bureau of CSG EHV Transmission Company, Kunming 650217, China
*
Author to whom correspondence should be addressed.
Submission received: 24 June 2022 / Revised: 20 July 2022 / Accepted: 25 July 2022 / Published: 29 July 2022

Abstract

:
Against a background of the energy internet and low-carbon electricity, regional integrated energy system (RIES) has become a key way to achieve sustainable energy development, leading to reduced operating costs and system carbon emissions, and improved system operating efficiency. This paper puts forward a low-carbon economic dispatching optimization method for RIES with a heating network and power-to-gas (P2G). First, the heating network model and the mathematical model of P2G were constructed. Second, the carbon trading mechanism was introduced, the objective function being: to minimize the sum of the system operating cost and carbon trading cost; and ensure that the balance of cooling, heating, electric power, and the operating constraints—of RIES and the heating network—were comprehensively considered. Finally, the CPLEX optimization software simulation was used. The results show that the proposed method can take into account both low-carbon and economic factors, and can provide a reference for RIES low-carbon economic dispatch.

1. Introduction

Depleted fossil fuels and the global environmental crisis have driven the transformation of the energy industry. How to optimize the energy industry structure, improve energy productivity, reduce pollution, and achieve sustainable development is a major focus point, currently. The unified dispatch of RIES electric power, natural gas and distributed energy is a feasible way to realize energy complementation; alleviate the waste of renewable energy; and increase the economic and environmental benefits of the system [1,2,3,4].
RIES is the combination of area distribution and system traits of IES. A variety of energy sources, electrical networks, and loads are deeply integrated into RIES [5,6]. In RIES, the complementarity of electricity and heat is better utilized, further reducing the working capital and carbon footprint of the system [7,8,9]. Somadutta et al. [10], taking the northern Netherlands as an example, studied the national integrated energy system (which, in the Netherlands, is regionalized), and the regional differences in available energy sources, with their potential or limitations. Zhu et al. [11] studied the trading behavior of energy market participants in RIESs. Clegg et al. [12] reported the impinging of the gas pipe networks on the elasticity of systems in the electric combined-operation system. Bagheri et al. [13] noted a novel market-clearing scheme for RIES, including both conventional-, and clean- energy-generation units. Zhang et al. [14] established the multi-energy storage and double-layer planning configuration model, with multi-energy complementation, to diminish the running cost of the RIES. At present, a large number of literatures show research carried out in RIES from the perspectives of modeling and economy of system operation. However, the environmental impact of RIES operations have not been considered. The contradiction between the rapid development of renewable energy and the difficulty of RIES consumption is gradually deepening.
The P2G technology, with energy conversion and space-time conversion characteristics, is an important way to realize the bidirectional coupling of gas and electricity, and it is also an important means with which to regulate wind energy and solar energy [15]. Clegg et al. [16] demonstrated the impact of a P2G model on IES and assessed the possibility of applying P2G technology to existing energy networks. Zhang et al. [17] proposed a bi-level optimal model, considering P2G to improve the utilization of wind energy. Ancona et al. [18] systematically analyzed the thermal economy of P2G, containing renewable energy, high temperature co-electrolysis, and methanation. Sun et al. [19] proposed an optimal scheduling method, including P2G and a carbon trading mechanism, with minimum operating cost as the objective function. The above literature studies the influence of P2G technology on the operation of IES, but it has not yet been introduced into RIES.
The electric-thermal-gas coupled IES provides new ideas for improving energy efficiency and reducing carbon emissions. The P2G technology couples the electrical energy and gas energy in IES to realize the bidirectional flow of energy. The introduction of a thermal network provides a feasible way for the coupling of electrical energy and thermal energy. Qin et al. [20] considered the effects of a thermodynamic process, mesh network topology, multiple DER, and variable mass flow on system operation, and put forward a generalized quasi-dynamic model of electro-thermal coupling IES, and an iterative decomposition solution method. Putna et al. [21] used linear programming to carry out a technical and economic evaluation of investment plans in the area of heating energy for district heating systems, and to analyze the dependence between improvements in model accuracy and fluctuations in heating demand. Zhang et al. [22] presented a new pattern of the regional heating network, including the uniform pipeline model and the parsed heat-shoulder function. The specific methods and models in three kinds of heat load redistribution attacks against indoor temperature, and secondary heating network temperature, were put forward by Ding et al. [23], laying a foundation for related research on the attack and defense of electrothermal cooperative networks in IES in the future. To enhance the coupling between energy sources and reduce energy loss, Zhang et al. [24] studied the ultra-short-term dispatching energy management mode, giving thought to the characteristics of the heating network. Based on the transmission characteristics of the heating network, and considering the load uncertainty, Chen et al. [25] proposed a novel RIES strategy, which reduces the operating cost of the system. At present, some researchers have applied the heating network to the optimal dispatching in RIES, which has improved the economy of the system operation, but they have not paid attention to the carbon emission of the system.
With the deepening of the low-carbon concept, the carbon trading mechanism has gradually matured, and reducing carbon emissions has now become an important measure in IES. Wang et al. [26] established an IES scheduling model with carbon capture technology, considering the carbon trading mechanism, which reduces the carbon emissions of the system. Wang et al. [27] and Sun et al. [28] applied the carbon trading mechanism to optimal scheduling of IES, to solve the environmental pollution problem caused by IES.
To sum up, few literatures consider the impact of the combined operations of heat network, P2G and carbon trading mechanism on the optimal scheduling of RIES. Therefore, on the basis of the above research, this paper proposes a RIES optimization scheduling method, including heat network, carbon trading mechanism, and P2G technology. First, considering the loss in the heat network, a model of the heat network is established. Second, the P2G technology and carbon trading mechanism are modeled. Finally, some examples are given to verify the effectiveness of the proposed model.
The primary aims of this work can be summarized as follows:
(1)
Construct the heating network and P2G models. The heating network model is composed of: the Sukhov cooling formula, the velocity of the heat medium in the pipe, and the interactive heat power of the pipe network. The P2G model is divided into the chemical reaction process and a mathematical model.
(2)
Determine the carbon trading mechanism, constructing the objective function from: the minimum sum of system operating costs, plus the cooling, electricity and heat balance equations, and the known constraints in each piece of equipment in the system.
(3)
Analyze the influence of P2G, the heating network and the carbon trading mechanism on system operation. The results demonstrate that the model of the heating network, P2G and carbon trading mechanism can elevate the economic and environmental benefits of the system.

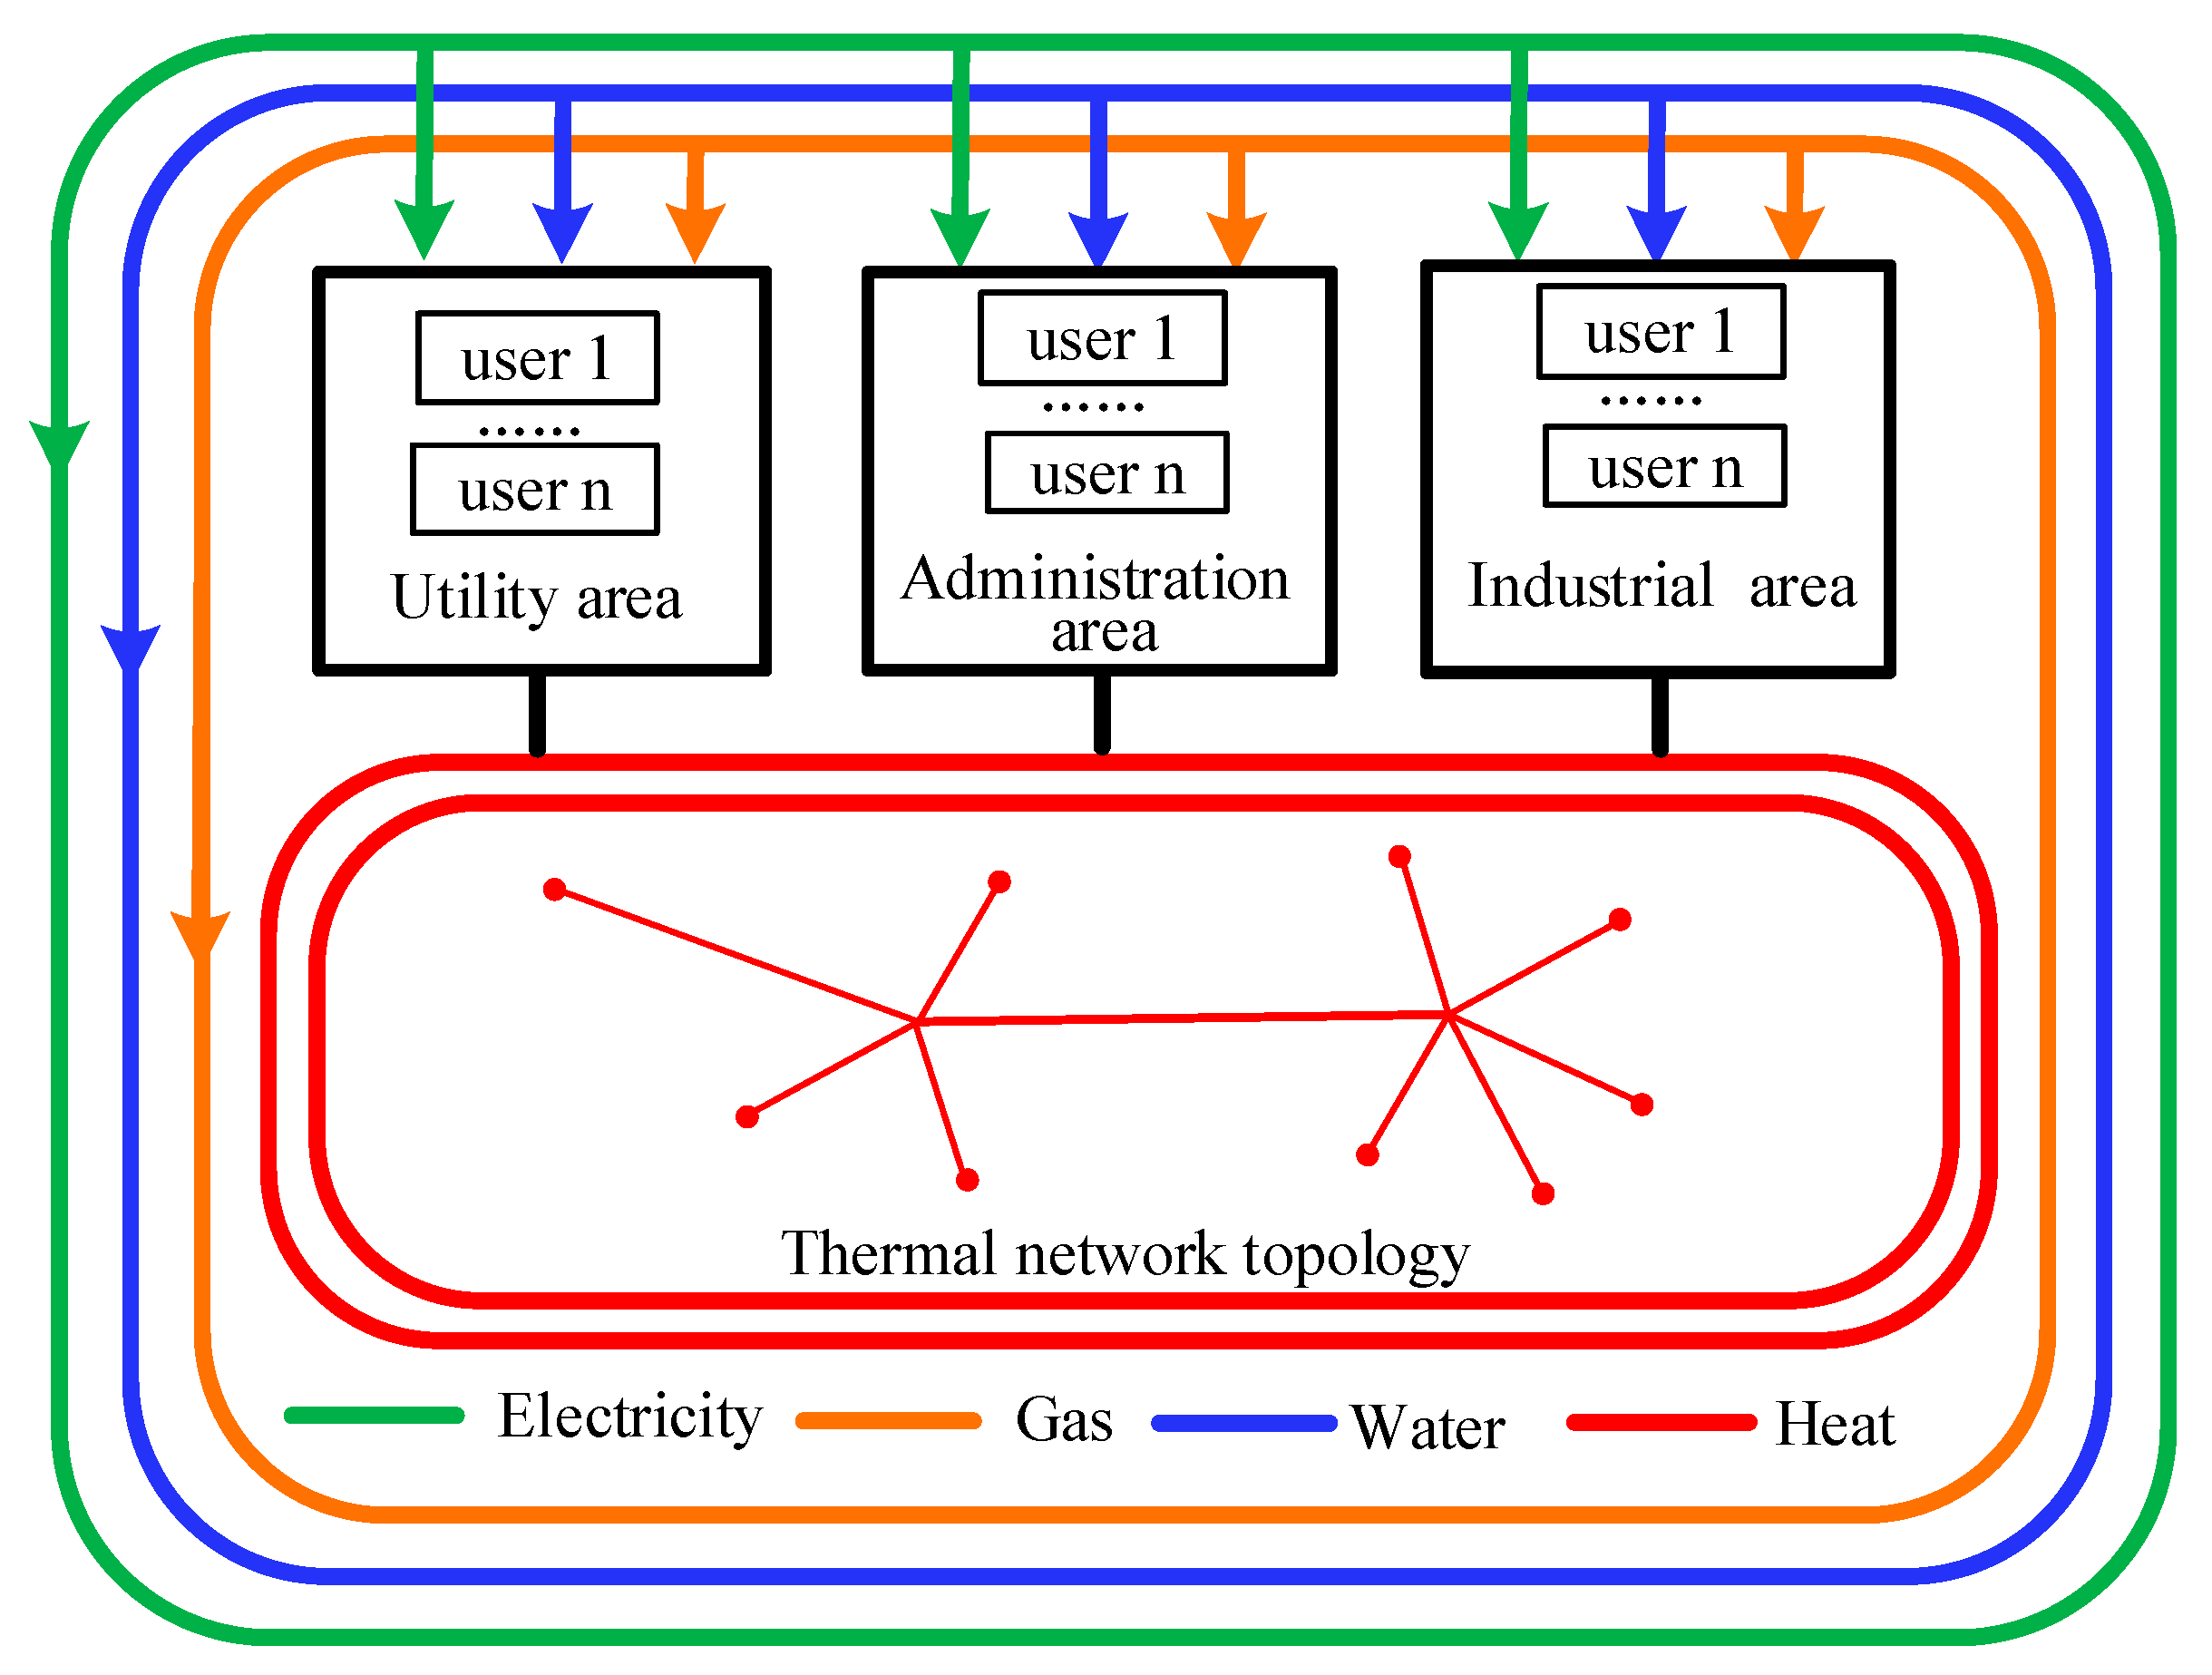
2. Heating Network Model

2.1. The Ordinary Model of Heat Energy Transmission in the Network

The ordinary model of heat energy transmission in the network is composed of a pipe section that describes the loss of heat energy in the pipe network and a node section that describes the energy conservation. Assuming that the number of pipe sections in the heating network is M, the number of nodes is N, the connection point between RIES and the heat supply network is I, and the temperature of the heating medium in the pipeline is T:
The Sukhov cooling formula is expressed by (1).
T = T 0 e 2 π k q R l + ( 1 e 2 π k q R l ) T e
where T0 is the original temperature of the heating medium; q is the heat-medium flow rate; K is a proportional constant; Te is the medial temperature of the medium around the pipeline; ∑R is the total heat transfer resistance from the heat medium in the pipeline, to the surrounding medium, per kilometer; l is the pipe length [29,30]. In this paper, the temperature field of the heat supply network is assumed to be steady, so Te and ∑R are constant.
The heat-medium flow rate in the pipeline is calculated by (2).
| q i , i j | v i j max S i j
where qi,ij is the heat-medium flow rate flowing out of node i in pipeline ij; v i j max is the maximum allowable heat-medium flow rate in pipeline ij; Sij is the cross-sectional space of the pipeline ij.
The interactive thermal power between i-th RIES and the pipeline network is shown by (3).
R s , i = k q R , i ( T R , i T b )
where qR,i is the heat-medium flow rate from node i to RIES; TR,i is the heat-medium temperature from node i to RIES; Tb is the system return water temperature.
The general model of heat energy transmission in the network is composed of Formulas (1)–(3), which accurately reflect the state of each parameter in the running process of the heating network.

2.2. Network Heat Loss Equation

Based on the scientific theory of thermal transmission, heat loss is obtained by (4).
Δ Q 2 π T w T e R l
where Tw is the inlet water temperature.
The heat loss balance constraint of the pipeline is given by (5).
Q i j , t = ( Q i j , t t delay Δ Q i j , t delay )
Q i j , t min Q i j , t Q i j , t max
where Qij,t is the interactive heating power of pipeline ij at time t; Qij,t-tdelay is the heat power flowing into pipeline ij at time t-tdelay; ΔQij,tdelay is the heat loss during transmission of the heating network in tdelay time; Q i j , t min and Q i j , t max are the minimum available thermal power, and the maximum available thermal power, delivered in the heating network pipeline at time t.

3. P2G Model

P2G refers to the technology that can convert electrical energy into hydrogen or natural gas, and can store electrical power flexibly and in a large capacity. To cope with the increasingly serious energy problem, the proportion of renewable energy, such as wind power, in the multi-park integrated energy system, will continue to increase. Due to the inherent shortcoming of volatility in renewable energy power generation, it will inevitably lead to large scale wind and light abandonment. P2G technology can transform surplus electrical energy into natural gas, which provides a new solution for renewable energy consumption.

3.1. Chemical Process Analysis of P2G

The chemical reaction process of P2G technology consists of two steps: electro-hydrogen conversion and hydrogen-natural gas conversion. In the electro-hydrogen conversion stage, water is electrolyzed into hydrogen and oxygen by using abundant electrical energy. The chemical reaction process is described in (7).
2 H 2 O e 2 H 2 + O 2
In methanation, the hydrogen produced by the electrolysis of water reacts with CO2 at high-temperature and high-pressure to produce methane and water. The chemical reaction process is described in (8).
4 H 2 + CO 2 High   Pressure High   Temperature   CH 4 + 2 H 2 O

3.2. Mathematical Model of P2G

The Mathematical model of P2G is expressed by (9).
P P 2 G , t gas = η P 2 G , t P P 2 G , t V gas , t = P P 2 G , t gas HHV gas P P 2 G , t , min P P 2 G , t P P 2 G , t , max
where P P 2 G , t gas is the natural gas power synthesized by P2G equipment at time t; ηP2G is the productivity of converting electrical energy into natural gas; this paper takes it that: 0.7, PP2G,t is the electrical power required by P2G to synthesize natural gas at time t, Vgas,t is the volume of natural gas synthesized at time t; HHVgas is the high calorific value of natural gas; PP2G,t,min and PP2G,t,max are the caps and floors of power output for P2G equipment at time t.

4. Carbon Trading Mechanism

4.1. Carbon Emission Quota

The allocation of carbon emission rights can be split into paid and unpaid. In this paper, the unpaid distribution method, based on forecasting electric load and thermal load, is adopted.
The carbon emission quota is calculated by (10).
N CO 2 * = x = 1 N t = 1 M ( ε e P e , x , t + ε h P h , x , t )
where εe is the emissions quota of regional unit electricity; this paper takes it that: 0.7 kg/kWh; εh is the emissions quota for regional unit heat, this paper takes it that: 0.4 kg/kWh; Pe,x,t is the electrical load of system x at time t; Ph,x,t is the heating load of system x at time t [31].

4.2. Carbon Transaction Cost

The total realistic carbon emissions of RIES are reckoned by (11).
N CO 2 = g t a g t x g , t
where agt is the CO2 emission corresponding to the unit of electricity; xg,t is the export of cell g at time t.
The carbon transaction cost of RIES is shown by (12).
C CO 2 = ( N CO 2 N CO 2 * ) λ CO 2
where λCO2 is the carbon trading price, this paper takes: CNY 0.15/kg.

5. Optimization Model and Constraint Conditions

5.1. Objective Function

In this paper, various RIES are connected by heat networks. Carbon trading mechanism and P2G technology are introduced, and the smallest sum of carbon trading expenditure CCO2 plus the system operating expenditure CIES is taken as the targeting function:
The targeting function is defined as (13).
min F = C CO 2 + C IES
The running expense is described as (14).
C IES = C e , b C e , s + C g + C H + C om
where Ce,b is the purchased electricity cost of RIES; Ce,s is the profits from the sale of electricity by RIES; Cg is the expenditure of purchasing gas; CH is the operating expenditure of the heating network; Com is the equipment maintenance and operation cost.
Including these, the cost of electricity purchase is described as (15).
C e , b = i = 1 N i = 1 M ( C e , b , t P e , b , i , t Δ t )
where N is the quantity of RIES subsystems; Ce,b,t is the electricity buying price at time t; Pe,b,i,t is the power purchase of the i-th RIES subsystem in t time period.
The proceeds from the sale of electricity by RIES is described as (16).
C e , s = i = 1 N i = 1 M ( C e , s , t P e , s , i , t Δ t )
where Ce,s,t is the electricity selling price in t time period; Pe,s,i,t is the electricity sales of the i-th RIES subsystem in t time period.
The gas cost is described as (17).
C g = c g i = 1 N t = 1 M ( P MT , i , t η MT , i + Q GB , i , t η GB , i P PaG , t gas ) Δ t
where cg is the unit calorific value price of purchased natural gas; PMT,i,t and QGB,i,t are the generation power of a micro gas turbine and heat generation power of a gas boiler in the i-th RIES system in t time period; ηMT,i and ηGB,i are the productivity of the micro gas turbine and the gas boiler in the i-th RIES system, respectively.
The running expense of the heat pipe network is described as (18).
C H = R M ( E H R z c e , b , t H z , t Δ t )
where R is the amount of cycling water pumps; EHRz is the power consumption and heat transfer ratio of the z-th water pump; Ce,b,t is the electricity purchase price at time t; Hz,t is the heat delivered by the z-th water pump at time t.
The running and safety expense of the equipment is described as (19).
C om = i = 1 N t = 1 M ( η om P i , t Δ t )
where ηom is the maintenance expense of output unit power for the core equipment in the system; Pi,t is the output of equipment in the i-th RIES.

5.2. Constraint Condition

The constraints of the system are composed of the equilibrium equations of cooling, heating and electricity, the run restrictions of various RIES equipment, the interactive power constraints with the power network and the operational constraints of the heating grid.
(1)
The cold power equilibrium is shown by (20).
η EC P EC , t + η AC H AC , t = L C , t
where PEC,t is the electric power input by the electric refrigerator at time t; ηEC is the refrigeration coefficient of the electric refrigerator; HAC,t is the thermal power input of the absorption chiller at time t; ηAC is the refrigeration coefficient of the absorption chiller; LC,t is the cooling load of users at time t.
(2)
The thermal power equilibrium is shown by (21).
η HE H HE , t H EX , t H AC , t = L H , t
where ηHE is the efficiency of the afterheat recovery device; HHE,t is the heat power recovered by the afterheat recovery device at time t; HEX,t is the coupling heat loss between RIES system and the heating network at time t; LH,t is the heating load of users at time t.
(3)
The electric power balance is shown by (22).
( P grid , s , t P grid , b , t + P WT , t + P MT , t P EC , t P ES , C , t + P ES , D , t P P 2 G , t ) = L E , t
where Pgrid,s,t is the selling power at time t; Pgrid,b,t is the buy power at time t; PWT,t is the output of wind turbine at time t; PMT,t is the electric power output by the micro gas turbine at time t; PEC,t is the power input for the electric refrigerator at time t; PES,C,t and PES,D,t are the charge and discharge power of storage battery at time t; LE,t is the electric load of users at time t.
(4)
The steam bus balance is given by (23).
H REC , t + H GB , t H HE , t H AC , t = 0
where HREC,t is the heat power output by the waste heat boiler at time t; HGB,t is the heat power output by the gas boiler at time t; HHE,t is the heat power recovered by the waste heat recovery equipment at time t; HAC,t is the thermal power input for the absorption chiller at time t.
(5)
The thermoelectric balance of natural gas turbines is given by (24).
α MI P MT , t 1 η REC H REC , t = 0
where αMT is the heat-to-electric ratio of the gas turbine; PMT,t is the electric power output by the gas turbine at time t; ηREC is the productivity of the afterheat boiler; HREC,t is the thermal power output by the waste heat boiler at time t.
(6)
The gas turbine constraint is given by (25) and (26).
P MT , t = F MT , t η MT
U MT , t p MT , t min P MT , t U MT , t p MT , t max
where ηMT is the gas efficiency of gas turbine; FMT,t is the depleting fuel of a natural gas turbine at time t; UMT,t is the mark bit for gas turbine startup and shutdown, 0 means shutdown and 1 means startup; P MT , t max and P MT , t min are the caps and floors of gas turbine power.
(7)
The electrical and thermal power constraints of other equipment are given by (27).
{ P i , min P i , t P i , max Q i , min Q i , t Q i , max
where Pi,t is the electric power of equipment i at time t; Qi,t is the thermal power output by equipment i at time t; Pi,min, Pi,max is the caps and floors of electric power of equipment I; Qi,min and Qi,max are the caps and floors of the heating power of equipment i.
(8)
The interactive pow constraint with the power grid is given by (28).
{ 0 P grid , b , t U grid , b , t P grid   max 0 P grid , s   , t U grid , s   , t P grid   max U grid ,   b , t + U grid ,   s   , t 1
where Pgrid,b,t and Pgrid,s,t are the purchase and sell electric power from the grid at time t; Ugrid,b,t is the status flag bit of purchasing electricity from the power grid at time t, 1 to start purchasing electricity, 0 to stop purchasing electricity; Ugrid,s,t is the status flag bit of selling electricity to the power grid at time t, 1 to start selling electricity, 0 to stop selling electricity.

5.3. Solution Method

The refinement model constructed in this paper is a 0–1 mixed-integer linear programming model. The decision variables are composed of the output of the gas turbine and other equipment, the output of storage battery, power grid purchase, the output value of auxiliary equipment and input, and the output value of the heat network. The optimization model is solved by CPLEX.

6. Case Study

Taking a comprehensive park as an example, the park is composed of three sub-areas, namely, the living area, office area and industrial area, and each sub-area is connected with other buildings through a heating network. The construction of the park is revealed in Figure 1.

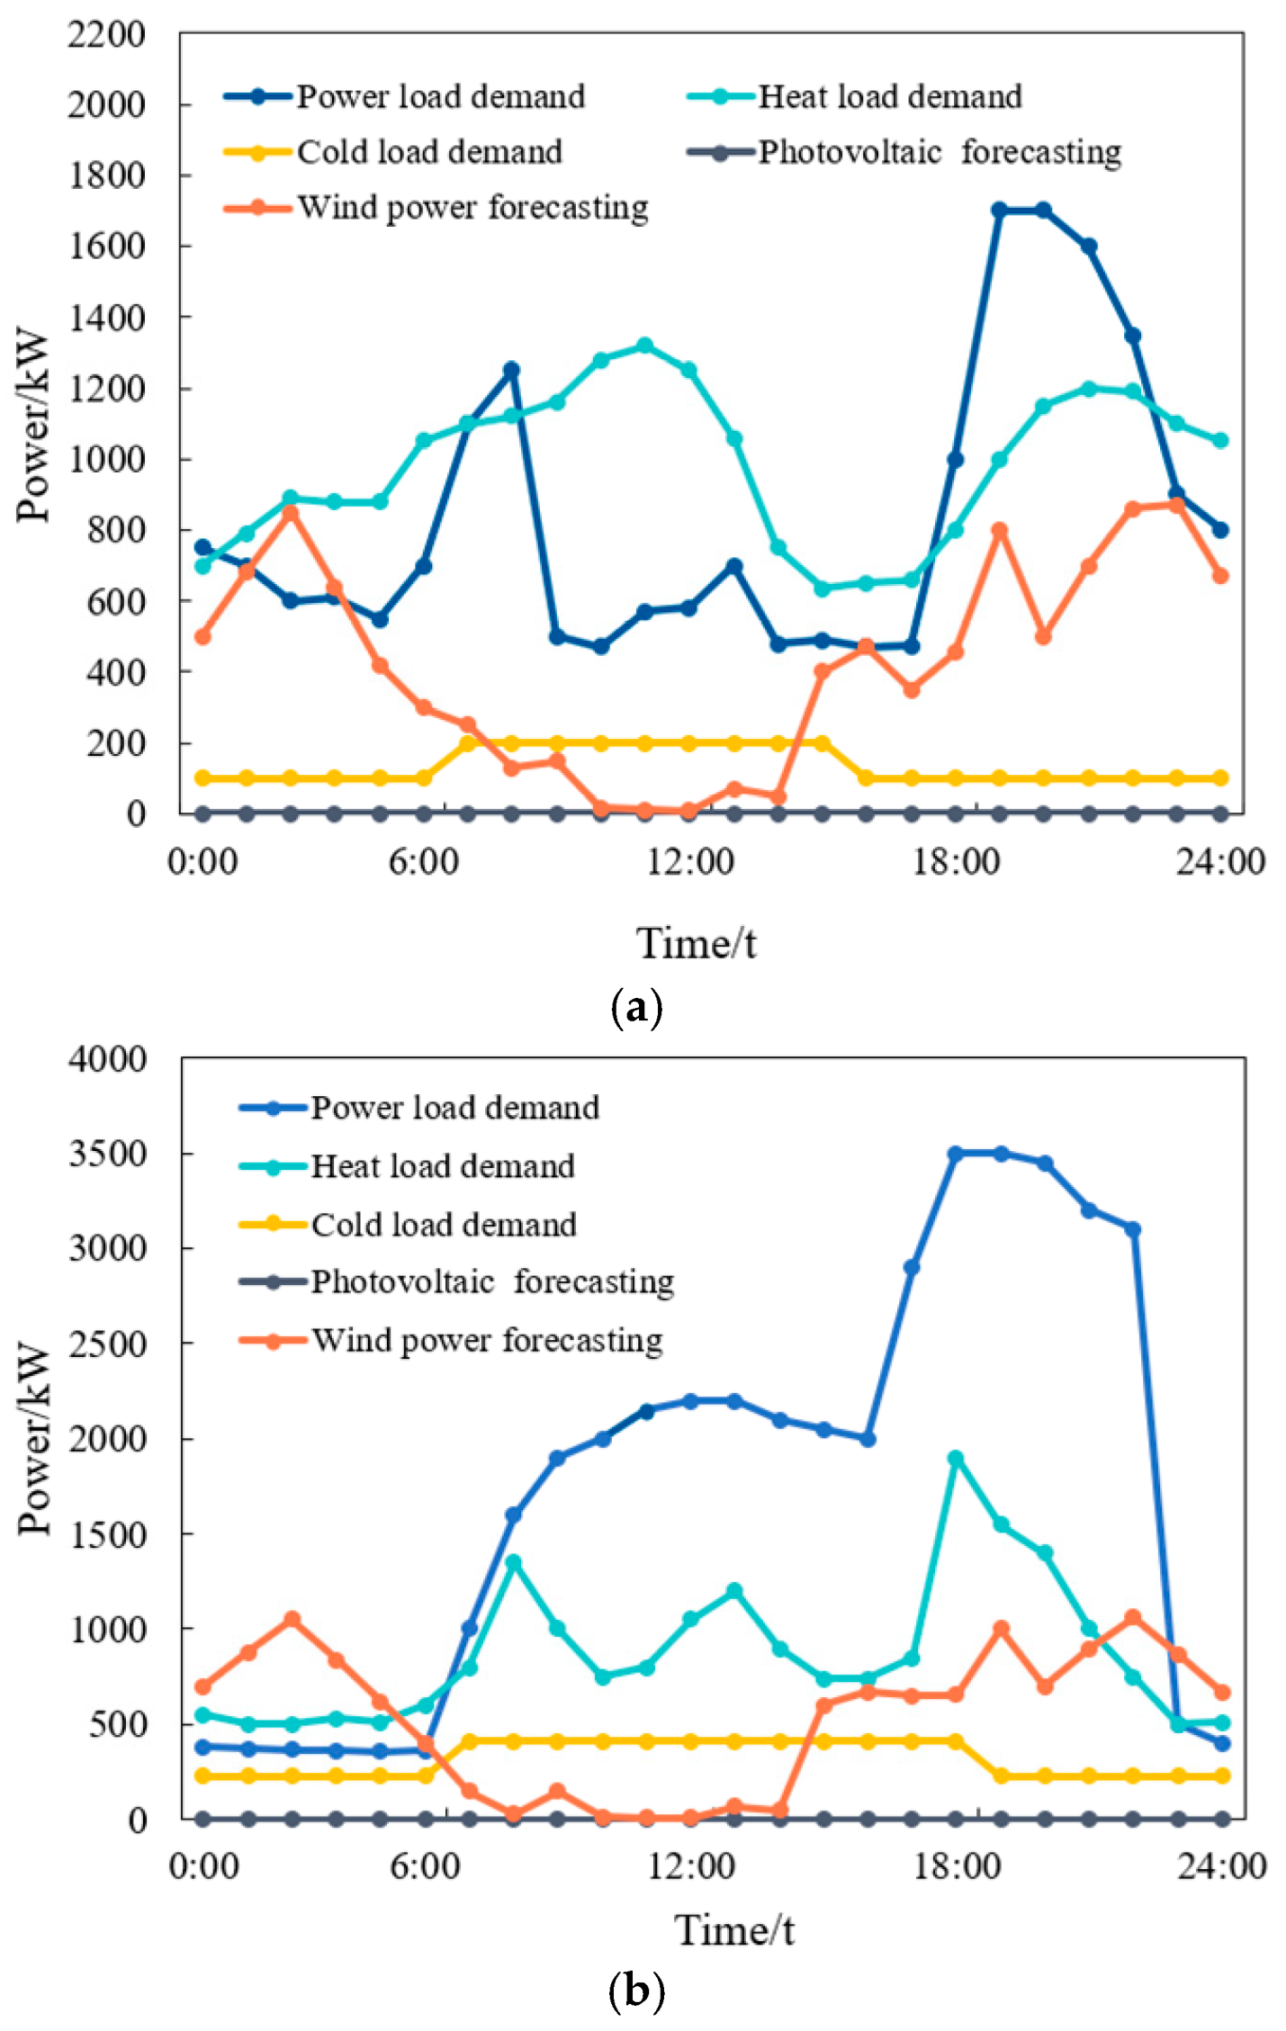
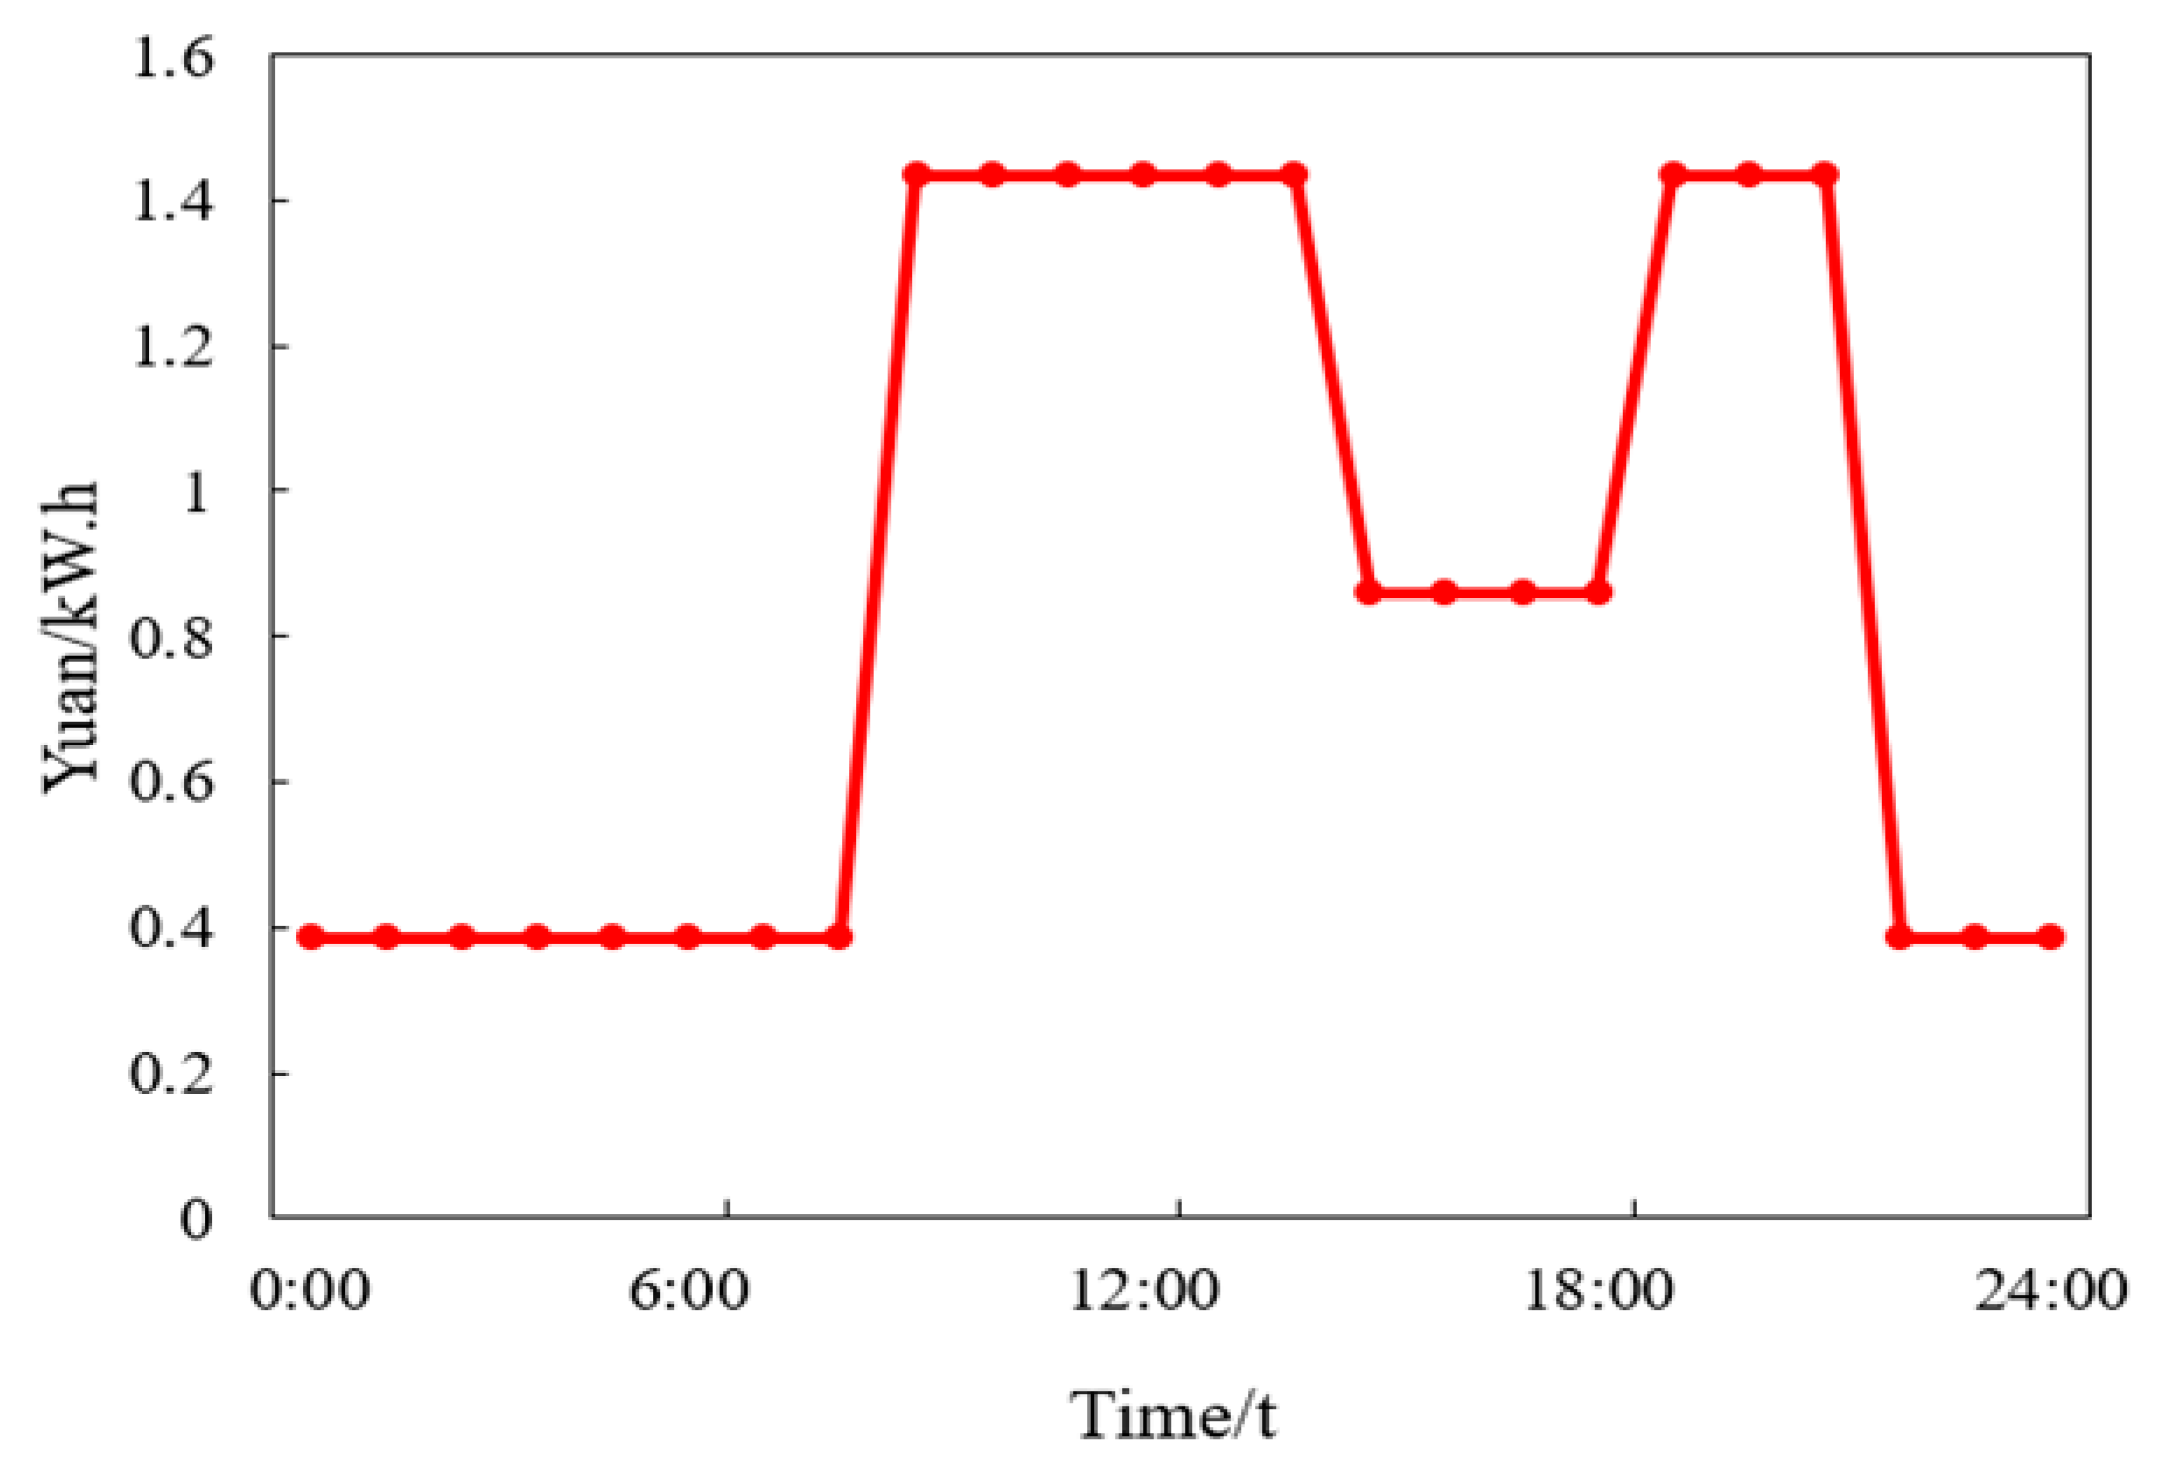
6.1. Load and System Parameters

The load demand data of a comprehensive park and the data of various RIES are taken as examples to test the proposed optimization method. The detailed parameters of the facilities are shown in Table 1, Table 2 and Table 3.
The load demand on the comprehensive park on typical winter days and the predicted output value of wind and solar generator sets are shown in Figure 2. The electricity price in the park, living area and office area is CNY 0.49 and CNY 0.9 respectively, and the time-of-use electrovalence in the industrial area is displayed in Figure 3. The value of gas is CNY 0.283.

6.2. The Setup of the Simulation

6.2.1. Comparison of Four Models

To study the rationality of the RIES economic dispatch model with the heating network and P2G, four models were established.
Model 1: RIES without heat network and P2G.
Model 2: RIES with P2G, without heat network.
Model 3: RIES with heat network, without P2G.
Model 4: RIES with heat network and P2G.
The simulation results of the four models are displayed in Table 4.
  • Analysis of economic benefits of heat network
From Table 4, comparing model 1 and model 3, it can be seen that after the introduction of the heating network in model 3, the gas purchase cost decreased from CNY 38,737 to CNY 27,874, a decrease of 28.04%; carbon trading income increased from CNY 8416 to CNY 12,651, an increase of 33.48%; and the total operating cost of the system decreased from CNY 117,263 to CNY 114,201, a decrease of 2.61%. It can be seen from the above analysis that after the thermal network is introduced into the RIES, the thermal network begins to coordinate and optimize the thermal links in the RIES, which effectively reduces the use of electricity and gas in the system, thereby reducing the carbon emissions of the system.
2.
Analysis of P2G economic benefit
From Table 4, comparing model 1 and model 2, it can be seen that after the introduction of P2G technology in model 2, the gas purchase cost was reduced from CNY 38,737 to CNY 37,772, a decrease of 2.5%; The carbon transaction is CNY 8416, which remains unchanged; The total operating cost of the system is reduced from CNY 117,263 to CNY 116,223, a decrease of 0.88%. The P2G converts abundant electrical energy into natural gas to supply gas equipment, which reduces the gas purchase cost of the system, thus reducing the total operating cost of the system to a certain extent and improving the economy of the system operation.
3.
Economic benefit analysis of P2G and heating network combined operation
From Table 4, comparing model 1 and model 4, it can be seen that after the introduction of the heating network and P2G technology in model 4, the gas purchase cost has been reduced from CNY 38,737 to CNY 26,795, a decrease of 30.83%; carbon trading income increased from CNY 8416 to CNY 12,651, an increase of 33.48%; The total operating cost of the system is reduced from CNY 117,263 to CNY 113,157, a decrease of 3.5%. Therefore, when the integrated energy system contains both the heating network and P2G, the system has the best operating state, the lowest operating cost and the highest carbon trading income.
To sum up, in model 4, the heating network and P2G are jointly operated. Compared with models 1, 2, and 3, the total operating cost of the system is the lowest, and the carbon trading income is the highest. It can be seen that, compared with the common model, the RIES optimization scheduling model with heat network and P2G proposed in this paper is more economical.

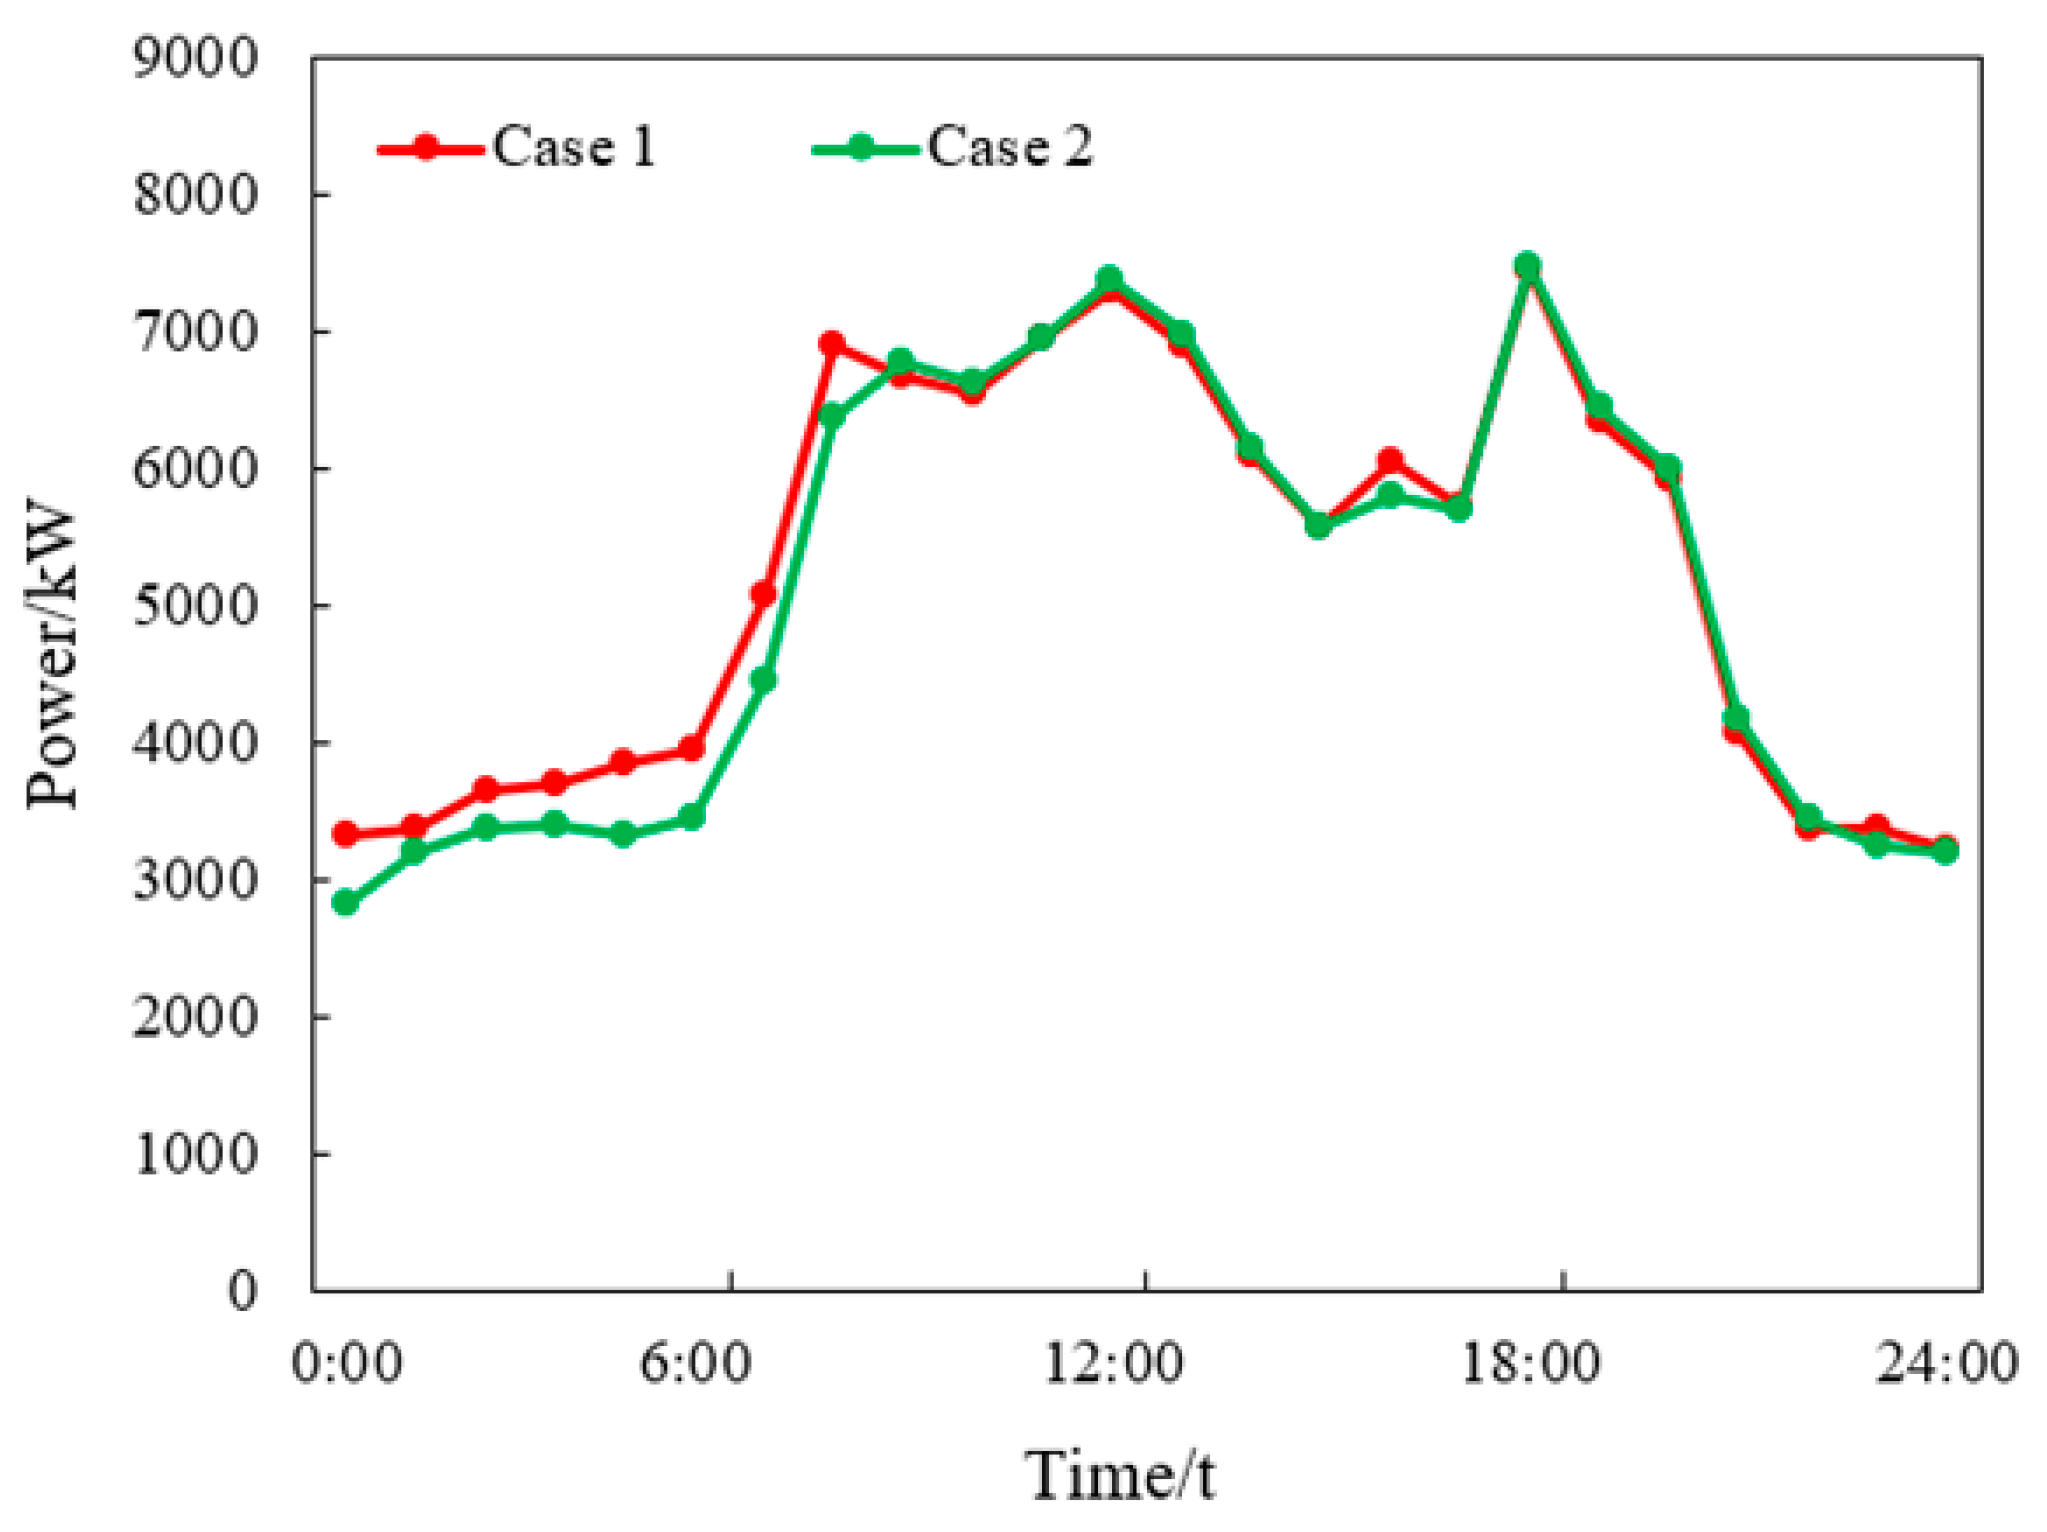
6.2.2. Benefit Analysis of the Carbon Trading Mechanism

To study the superiority of the RIES model considering the carbon trading mechanism, this paper compares and analyzes the dispatch results of two cases based on the RIES model, which comprehensively considers the heating network and P2G.
Case 1: Model 4 without carbon trading.
Case 2: Model 4 with carbon trading.
The scheduling results of the two cases are displayed in Table 5.
From Table 5, comparing case 1 and case 2, it can be seen that after the introduction of the carbon trading mechanism in case 2, the carbon emission decreased from 117,307 kg to 87,449 kg, and the emission reduction rate reached 25.45%; The gas purchase cost decreased from CNY 35,195 to CNY 26,795, a decrease of 23.87%; The total operating cost of the system decreased from CNY 125,210 to CNY 113,157, a decrease of 9.63%. It can be seen that, compared with the ordinary RIES optimal scheduling model, the RIES optimal scheduling model with the carbon trading mechanism has lower carbon emissions and lower total operating cost of the system, which is more conducive to promoting the low-carbon economic operation of the system.
Figure 4 shows the output of the main carbon emission equipment (gas turbine and gas boiler) in two cases. It can be perceived from Figure 4 that the total output of the gas turbine and gas boiler in case 1 is 125,444.8 kW, and that of the gas turbine and gas boiler in case 2 is 122,256.1 kW. Compared with case 1, the total output of major carbon emission equipment in case 2 decreased by 2.6% year on year. Combined with Table 5 and Figure 4, when RIES adopts a carbon trading mechanism, the system will strengthen the output constraints of carbon emission devices such as gas turbines and gas boilers, and the energy supply system will reduce the use of natural gas, thus effectively ensuring the reduction of carbon emissions.

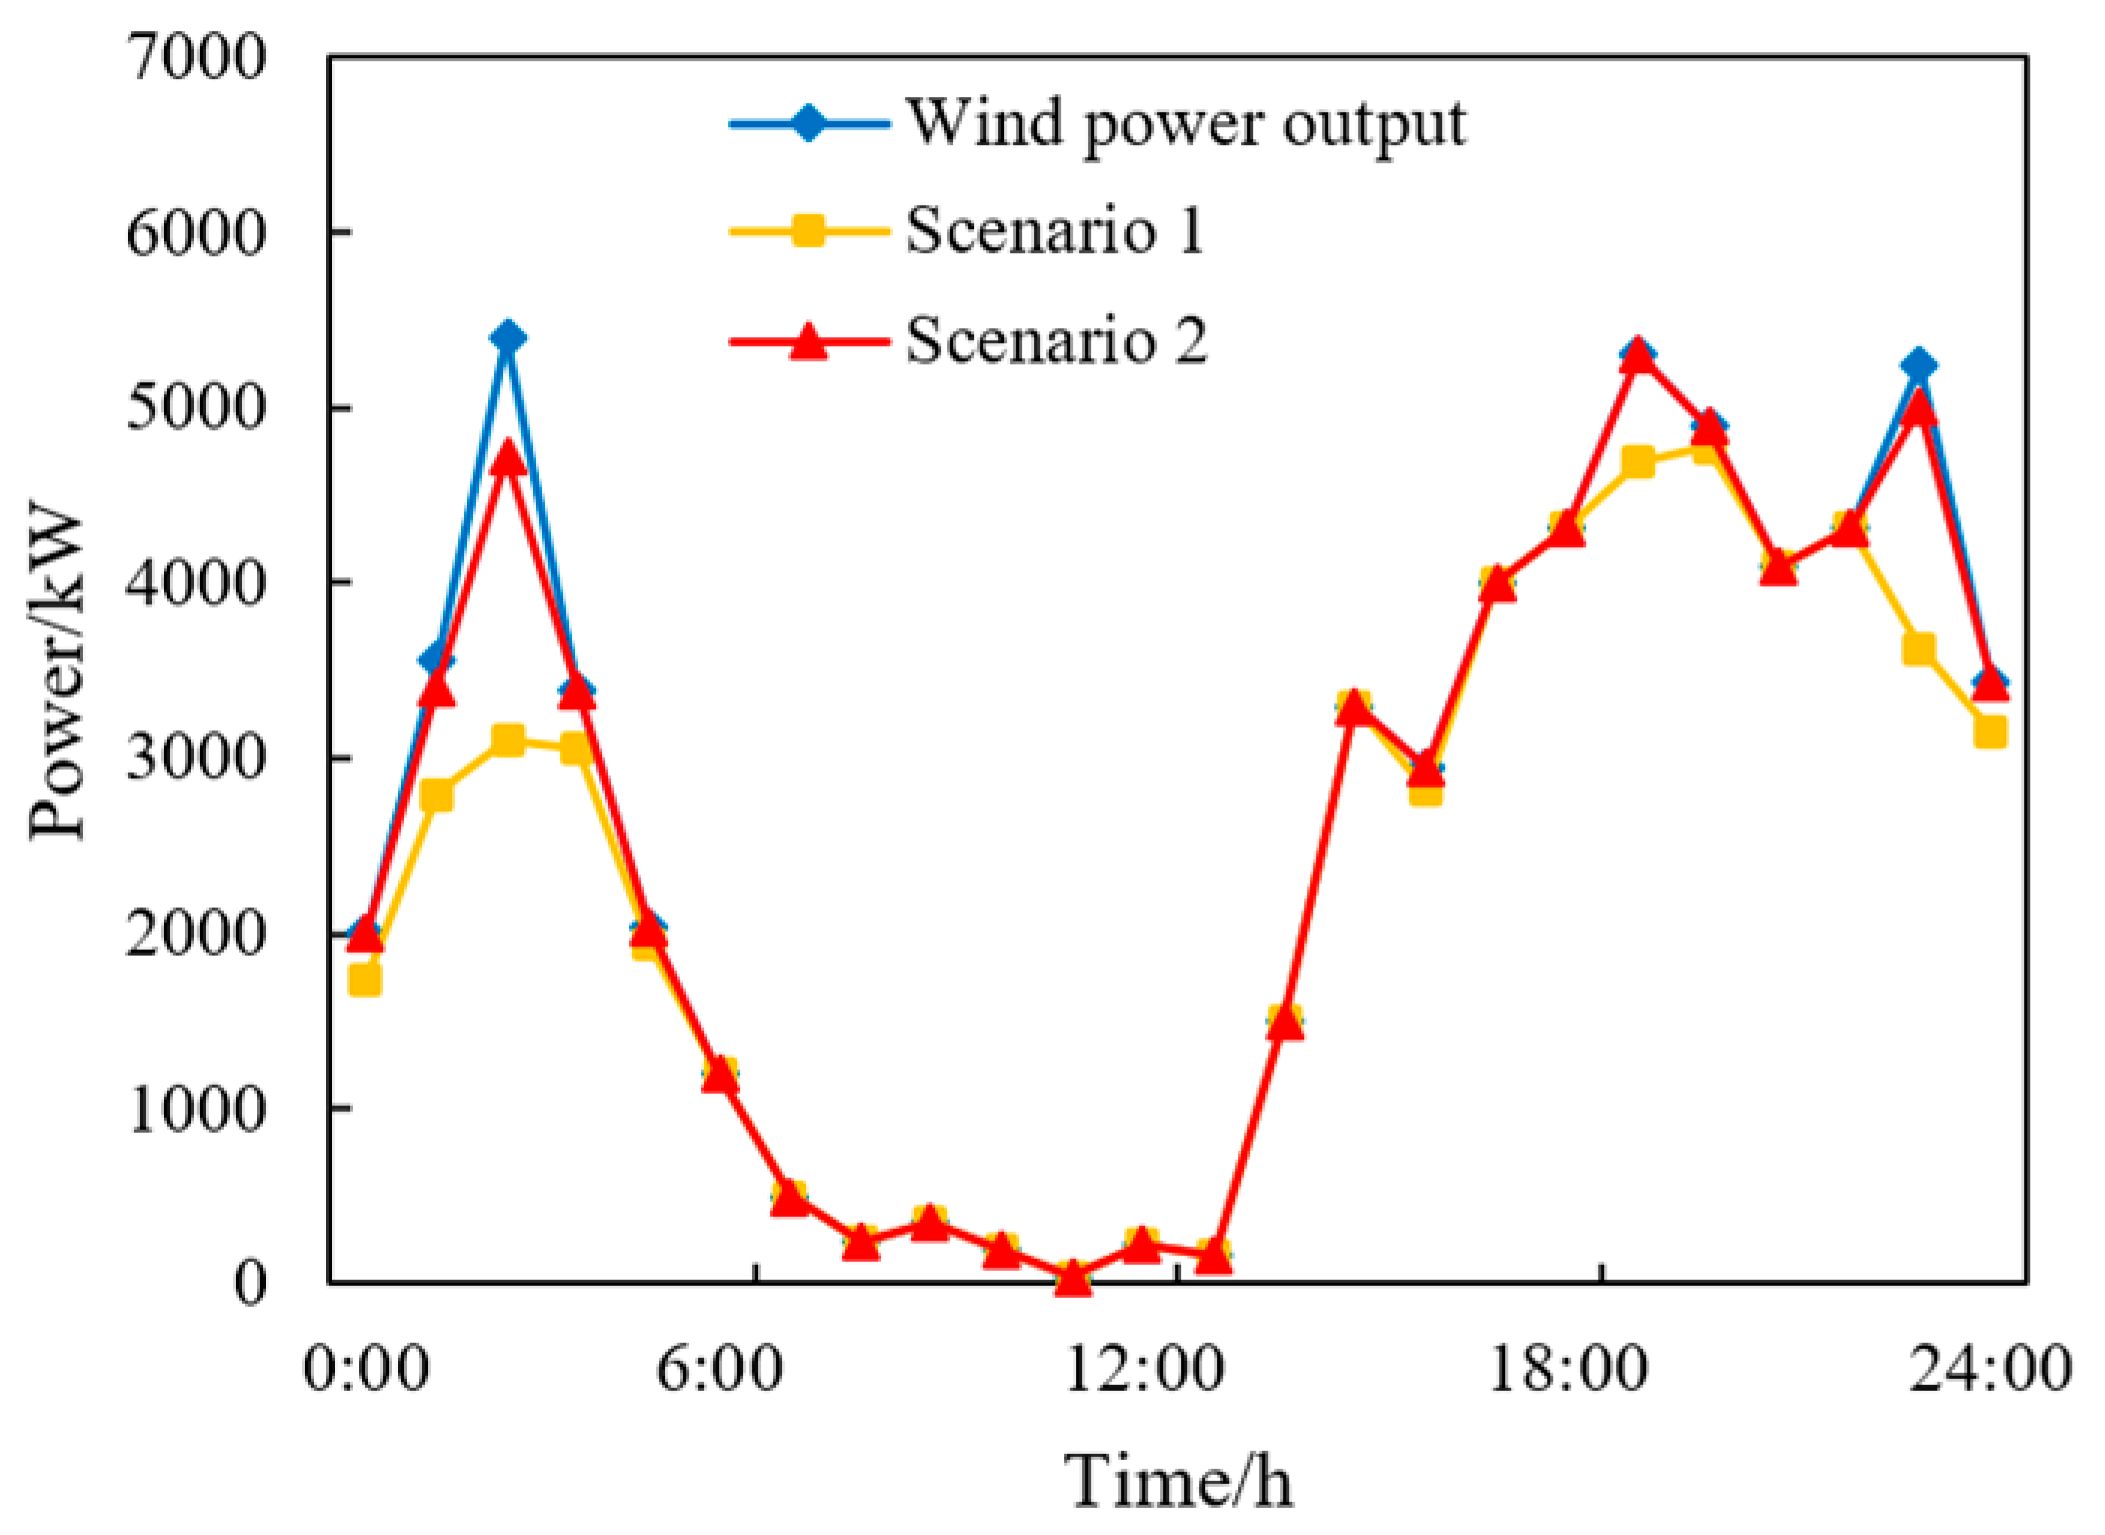
6.2.3. Analysis of the Influence of P2G on the Consumption Rate of Renewable Energy

To verify that the optimization model containing P2G can effectively promote wind power consumption, it is proposed to take the total wind power consumption of each park as an example to analyze the wind power consumption in two typical scenarios.
Scenario 1: RIES optimization model without considering P2G;
Scenario 2: RIES optimization model considering P2G.
The wind energy consumption in each scenario is shown in Figure 5.
The total wind power output of RIES is 62,635 kW; In scenario 1, the actual consumption of wind power is 56,129.9 kW, and the actual consumption rate is 89.6%; The actual consumption of wind power in scenario 2 is 61,575 kW, and the actual consumption rate is 98.3%. Compared with scenario 1, the wind energy consumption rate of scenario 2 increased by 8.7%. As can be seen from Figure 5, there is plenty of wind power during the periods of 0:00–6:00 and 18:00–24:00. P2G units are put into operation during this period, and the surplus wind power is converted into natural gas, some of which is supplied to gas turbines and gas boilers, and the rest is stored in gas storage tanks.
It can be seen from the above that RIES containing P2G can convert surplus wind power into natural gas when wind power resources are abundant, which reduces the phenomenon of wind abandonment, improves the consumption of wind power, and is of great significance for promoting the development of energy saving and emission reduction and new-energy power generation.

7. Conclusions

This paper studies the low-carbon economic dispatch of RIES with heating networks and P2G. First, the heating network model and the mathematical model of the P2G unit were established, and the mechanism of carbon trading was analyzed. Then, the model variables and constraints were introduced in detail. From this, the following conclusions can be drawn, through theoretical analysis and numerical examples:
(1)
The RIES are connected through the heat network, which realizes the coordinated use of heat energy in each park, reduces the consumption of electrical energy and gas, and the income from carbon trading is increased by 49.5%, thus achieving the purpose of energy saving and emission reduction.
(2)
Applying P2G technology to the optimal scheduling of RIES not only improves the economy of system operation, but also increases the wind energy consumption rate by 8.7%, thus easing the contradiction between the rapid development of renewable energy and the difficulty of consumption.
(3)
Compared with RIES without a carbon trading mechanism, the optimal scheduling model of RIES, based on the carbon trading mechanism proposed in this paper, reduces carbon emissions by 25.45% and the total system cost by 9.63%, thus improving the low carbon economy of the system operation.
In order to improve the operation efficiency of RIES, based on the carbon trading mechanism, a low-carbon economic dispatch optimization method of RIES, combining a heat network and P2G, is proposed. Thermal grids are used to connect the RIES, to coordinate thermal energy, thereby reducing energy losses. The introduction of P2G improves the economy, environmental protection, and renewable energy consumption rate of the system operation. In addition, in order to further improve the operating efficiency of the system, the carbon source, load fluctuation and energy price required for P2G will become the next focus of research.

Author Contributions

Conceptualization, Z.L. and T.L.; writing—original draft preparation, J.W.; writing—review and editing, J.W., J.G., N.X., W.Z., L.Y., M.L. and C.D. All authors have read and agreed to the published version of the manuscript.

Funding

This research was funded by the National Natural Science Foundation of China, grant number 51907084 and the Applied Basic Research Foundation of Yunnan Province, grant number 202101AT070080.

Conflicts of Interest

The authors declare no conflict of interest.

References

  1. Abu-Rayash, A.; Dincer, I. Development of an integrated energy system for smart communities. Energy 2020, 202, 117683. [Google Scholar] [CrossRef]
  2. Gu, W.; Wang, Z.H.; Wu, Z.; Luo, Z.; Tang, Y.Y.; Wang, J. An Online Optimal Dispatch Schedule for Microgrids Based on Model Predictive Control. IEEE Trans. Smart Grid 2017, 8, 2332–2342. [Google Scholar] [CrossRef]
  3. Lorestani, A.; Ardehali, M.M. Optimization of autonomous combined heat and power system including PVT, WT, storages, and electric heat utilizing novel evolutionary particle swarm optimization algorithm. Renew. Energy 2018, 119, 490–503. [Google Scholar] [CrossRef]
  4. Khani, H.; Farag, H.E.Z. Optimal day-ahead scheduling of power-to-gas energy storage and gas load management in wholesale electricity and gas markets. IEEE Trans. Sustain. Energy 2018, 9, 940–951. [Google Scholar] [CrossRef]
  5. Gao, J.W.; Yang, Y.; Gao, F.G.; Wu, H.Y. Two-Stage Robust Economic Dispatch of Regional Integrated Energy System Considering Source-Load Uncertainty Based on Carbon Neutral Vision. Energies 2022, 15, 1596. [Google Scholar] [CrossRef]
  6. Guo, W.Q.; Xu, X.Y. Comprehensive Energy Demand Response Optimization Dispatch Method Based on Carbon Trading. Energies 2022, 15, 1796. [Google Scholar] [CrossRef]
  7. Zhou, C.; Zheng, J.; Liu, S.; Liu, Y.; Mei, F.; Pan, Y.; Shi, T.; Wu, J. Operation Optimization of Multi-District Integrated Energy System Considering Flexible Demand Response of Electric and Thermal Loads. Energies 2019, 12, 3831. [Google Scholar] [CrossRef] [Green Version]
  8. Zang, H.X.; Xu, X.Q.; Cheng, L.L. Residential load forecasting based on LSTM fusing self-attention mechanism with pooling. Energies 2021, 229, 120682. [Google Scholar] [CrossRef]
  9. Zang, H.X.; Cheng, L.L.; Ding, T. Day-ahead photovoltaic power forecasting approach based on deep convolutional neural networks and meta learning. Int. J. Electr. Power Energy Syst. 2020, 118, 105790. [Google Scholar] [CrossRef]
  10. Sahoo, S.; van Stralen, J.N.; Zuidema, C.; Sijm, J.; Yamu, C.; Faaij, A. Regionalization of a national integrated energy system model: A case study of the northern Netherlands. Appl. Energy 2022, 306, 118035. [Google Scholar] [CrossRef]
  11. Zhu, X.; Sun, Y.Z.; Yang, J.; Dou, Z.L.; Li, G.J.J.; Xu, C.Y.; Wen, Y.X. Day-ahead energy pricing and management method for regional integrated energy systems considering multi-energy demand responses. Energy 2022, 251, 123914. [Google Scholar] [CrossRef]
  12. Clegg, S.; Mancarella, P. Integrated Electrical and Gas Network Flexibility Assessment in Low-Carbon Multi-Energy Systems. IEEE Trans. Sustain. Energy 2016, 7, 718–731. [Google Scholar] [CrossRef]
  13. Bagheri, A.; Jadid, S. A Robust Distributed Market-Clearing Model for Multi-Area Power Systems. Int. J. Electr. Power Energy Syst. 2020, 124, 106275. [Google Scholar] [CrossRef]
  14. Zhang, Q.M.; Ren, Z.C.; Ma, R.G.; Tang, M.; He, Z.X. Optimized Configuration of Multi-Energy Storage in Regional Integrated Energy System with Connected Distributed Wind Power. Energies 2019, 12, 3964. [Google Scholar] [CrossRef] [Green Version]
  15. Mukherjee, U.; Maroufmashat, A.; Narayan, A.; Elkamel, A.; Fowler, M. A Stochastic Programming Approach for the Planning and Operation of a Power to Gas Energy Hub with Multiple Energy Recovery Pathways. Energies 2017, 10, 868. [Google Scholar] [CrossRef] [Green Version]
  16. Clegg, S.; Mancarella, P. Integrated Modeling and Assessment of the Operational Impact of Power-to-Gas (P2G) on Electrical and Gas Transmission Networks. IEEE Trans. Sustain. Energy 2015, 6, 1234–1244. [Google Scholar] [CrossRef]
  17. Zhang, R.F.; Jiang, T.; Li, G.Q.; Chen, H.H.; Li, X.; Ning, R.X. Bi-level Optimization Dispatch of Integrated Electricity-natural Gas Systems Considering P2G for Wind Power Accommodation. Proc. CSEE 2018, 38, 5668–5678. [Google Scholar]
  18. Ancona, M.A.; Antonucci, V.; Branchini, L.; Catena, F.; De Pascale, A.; Di Blasi, A.; Ferraro, M.; Italiano, C.; Melino, F.; Vita, A. Parametric Thermo-Economic Analysis of a Power-to-Gas Energy System with Renewable Input, High Temperature Co-Electrolysis and Methanation. Energies 2022, 15, 1791. [Google Scholar] [CrossRef]
  19. Sun, X.; Zhang, Y.D.; Zhang, Y.Y.; Xie, J.D.; Sun, B. Operation Optimization of Integrated Energy System considering Power-to-Gas Technology and Carbon. Int. Trans. Electr. Energy Syst. 2022, 2022, 5026809. [Google Scholar] [CrossRef]
  20. Qin, X.; Sun, H.B.; Shen, X.W.; Guo, Y.; Guo, Q.L.; Xia, T. A generalized quasi-dynamic model for electric-heat coupling integrated energy system with distributed energy resources. Appl. Energy 2019, 251, 113270. [Google Scholar] [CrossRef]
  21. Putna, O.; Kůdela, J.; Krňávek, M.; Pavlas, M.; Ondra, K. Modelling of Change in Fuel Mix within a District Heating Network. Energies 2022, 15, 2879. [Google Scholar] [CrossRef]
  22. Zhang, S.H.; Gu, W.; Lu, S.; Yao, S.; Zhou, S.Y.; Chen, X.G. Dynamic Security Control in Heat and Electricity Integrated Energy System with an Equivalent Heating Network Model. IEEE Trans. Smart Grid 2021, 12, 4788–4798. [Google Scholar] [CrossRef]
  23. Ding, S.X.; Gu, W.; Lu, S.; Yu, R.Z.; Sheng, L.N. Cyber-attack against heating system in integrated energy systems: Model and propagation mechanism. Appl. Energy 2022, 311, 118650. [Google Scholar] [CrossRef]
  24. Zhang, Z.Y.; Wang, P.G.; Jiang, P.; Liu, Z.H.; Fu, L. Energy management of ultra-short-term optimal scheduling of integrated energy system considering the characteristics of heating network. Energy 2022, 240, 122790. [Google Scholar] [CrossRef]
  25. Chen, H.P.; Gao, L.; Zhang, Y.L.; Zhao, C. Optimal scheduling strategy of a regional integrated energy system considering renewable energy uncertainty and heat network transmission characteristics. Energy Rep. 2022, 8, 7691–7703. [Google Scholar] [CrossRef]
  26. Wang, R.T.; Wen, X.Y.; Wang, X.Y.; Fu, Y.B.; Zhang, Y. Low carbon optimal operation of integrated energy system based on carbon capture technology, LCA carbon emissions and ladder-type carbon trading. Appl. Energy 2022, 311, 118664. [Google Scholar] [CrossRef]
  27. Wang, R.; Shan, C.; Zuo, X.W.; Liu, Y. Optimal management of multi stakeholder integrated energy system considering dual incentive demand response and carbon trading mechanism. Int. J. Energy Res. 2021, 46, 6246–6263. [Google Scholar] [CrossRef]
  28. Sun, P.R.; Hao, X.J.; Wang, J.; Shen, D.; Tian, L. Low-carbon economic operation for integrated energy system considering carbon trading mechanism. Energy Sci. Eng. 2021, 9, 2064–2078. [Google Scholar] [CrossRef]
  29. Chen, Y.W.; Liu, Y.F.; Wang, D.J.; Li, T.; Wang, Y.Y.; Li, Y. Numerical study of heat transfer performance of helical coiled tubes for heating high-solids slurry in household biogas digester. Appl. Therm. Eng. 2019, 166, 114666. [Google Scholar] [CrossRef]
  30. Liu, X.R.; Zhang, F.J.; Sun, Q.Y.; Zhong, W.Y. Multi-Objective Optimization Strategy of Integrated Electric-Heat System Based on Energy Storage Situation Division. IEEE Access 2021, 9, 19004–19024. [Google Scholar] [CrossRef]
  31. Yan, Q.Y.; Ai, X.B.; Li, J.M. Low-Carbon Economic Dispatch Based on a CCPP-P2G Virtual Power Plant Considering Carbon Trading and Green Certificates. Sustainability 2021, 13, 12423. [Google Scholar] [CrossRef]
Figure 1. Multi-regional integrated energy system structure diagram.
Energies 15 05494 g001
Figure 2. Load parameters and photovoltaic predicted power of each park: (a) Utility area; (b) Administration area; (c) Industrial area.
Energies 15 05494 g002aEnergies 15 05494 g002b
Figure 3. Time-of-use electricity price in the industrial area.
Energies 15 05494 g003
Figure 4. The output of turbine and gas boiler under two cases.
Energies 15 05494 g004
Figure 5. The wind energy consumption of each scenario.
Energies 15 05494 g005
Table 1. Equipment capacity in each park.
Equipment NameSymbolEquipment Capacity/(kW)
Utility AreaAdministration AreaIndustrial Area
Wind turbine WT130031004800
Photovoltaic unitPV150017004500
Storage batteryES3005001500
MicroturbineMT1200250015,000
Gas-fired boilerGB100015004000
Electric refrigeratorEC2005001000
Absorption refrigeratorAC3005001000
Waste heat boilerREC100015003000
Waste heat recovery deviceHE10,00020,00030,000
Table 2. Scope of middle pipe section in each park.
Segment RangeSection Length/kmDiameter/mMaximum Flowrate (km/s)Thermal Resistance (km.°C/kW)Power Consumption and Heat Transfer Ratio
1–21.20.70.250.00621.2
2–310.70.250.00591
3–10.80.70.250.00570.8
Table 3. Other equipment parameters of RIES.
ParametersUtility AreaAdministration AreaIndustrial Area
ηMT0.30.30.3
αMT2.32.32.3
ηREC0.730.730.73
ηGB0.90.90.9
ηEC444
ηAC1.21.21.2
ηHE0.90.90.9
Table 4. Operating cost of regionally integrated energy system under four models.
ModelsGas Purchase Cost/YuanOperation Cost of RIES/YuanCarbon Trading Income/YuanCost/Yuan
138,73786,9428416117,263
237,77286,8678416116,223
327,87498,97812,651114,201
426,79599,01312,651113,157
Table 5. Scheduling results in two cases.
CasesCO2 Emissions/kgGas Purchase Cost/YuanCost/Yuan
1117,30735,195125,210
287,44926,795113,157
Publisher’s Note: MDPI stays neutral with regard to jurisdictional claims in published maps and institutional affiliations.

