Article

Insights into Nanoparticles, Electrokinetics and Hybrid Techniques on Improving Oil Recovered in Carbonate Reservoirs

Petroleum Engineering Department, Khalifa University of Science and Technology, Abu Dhabi P.O. Box 127788, United Arab Emirates
*
Author to whom correspondence should be addressed.
Submission received: 24 May 2022 / Revised: 20 July 2022 / Accepted: 22 July 2022 / Published: 29 July 2022
(This article belongs to the Special Issue Advanced Research and Techniques on Enhanced Oil Recovery Processes)

Abstract

:
Use of nanoparticles as a method for enhancing oil recoveries has become an attractive prospect. Experimental evidence has shown that this technique possesses the ability to improve recoveries via wettability alteration and interfacial tension reduction amongst other strategies. In this study, we analyze the potential of nanoparticles employed in coreflood experiments. Low concentration acid was added to aid in the dispersion of the nanoparticles in the brine by protecting them from being aggregated, while enhancing the stimulation of the tight porous media. Electrokinetics was also implemented following a sequential as well as a simultaneous approach to further stimulate the fluids injected, controlling their mobility, and therefore, increasing the depth of penetration within the porous media. Several coreflood experiments were carried out on highly heterogeneous carbonate samples of Middle Eastern origin with permeabilities of around 0.1 mD. Zeta potential measurements were conducted on the inlet side of the preserved core-plugs after the conclusion of each coreflood. The findings indicated a close connection between the rate of wettability alteration observed over the duration of nano-acid fluid injection and mode of electrokinetic application. The best performing nano-acid fluids correlated with the highest shift in the magnitude of the zeta potential across all tested strategies. Results show that oil recovered via this hybrid technique was mostly 10–15% higher than that derived when only smart brine was employed.

1. Introduction

Reduction of residual oil saturation beyond secondary recovery levels is critical to the success of chemically enhanced oil recovery methods. Numerous chemicals have thus been employed in this quest. Nanoparticles (NPs) have emerged as a possible chemical which could improve oil production [1,2,3,4]. Nanotechnology, the umbrella under which nanoparticles fall under, involves the application of nanoscale principles in science and engineering. In particular, NPs are particles which possess a small diameter but a large surface area. It is believed that this large surface area gives these particles larger surface energies which enhances their interaction efficiency when applied in solvents [1]. Upstream oil processes in general have seen NPs being applied in drilling fluids for reduction of formation damage [5,6], bit productivity enhancement [7,8], seismic characterization [9], wax/scale control [10,11], etc. Their investigation for use in enhanced oil recovery is based on the premise that these particles have the capability to alter the wettability towards more water wet, reduce interfacial tension (IFT) between water and oil, and enhance sweep efficiencies by improving the viscosity of displacing fluids.
The influence of NPs on wettability alteration has been a subject of interest to researchers. Ju and Fan [3] demonstrated the ability of NPs to improve oil production via an experimental and numerical study. They used two kinds of NPs: lipophobic and hydrophilic polysilicon nanoparticles (LHPN) and hydrophobic and lipophilic polysilicon nanoparticle (HLPN), to study their impact on a sandstone sample. Wetting angles were changed to a more water-wet sandstone by the LHPN nanoparticle ensuring oil recovered was improved. The HLPN nanoparticle on the other hand was able to enhance the water injectivity in the samples. In a similar study, Li and Torsæter [4] used two NPs, i.e., hydrophilic silica Nano-Structure Particles (NSP) and hydrophilic silica Colloidal Nanoparticles (CNP), to investigate their wettability alteration potential in oil-wet Berea sandstones. Their results showed the potential of NPs as both particles were able to change the wettability and suggested that higher concentrations of NPs could lead to further improvement in wettability alteration. Olayiwola and Dejam [12,13,14] also reviewed the variation of wettability alteration by different concentrations of silica NPs, the variation in interfacial tension of solutions of surfactant and NPs, and how salinity of injected fluid affects the contact angle, which results in variation of oil recovery. The nanoparticles’ interaction with aqueous solutions in the reservoir pores was also investigated along with their effect on formation damage and their performance during alternating gas injection. Roustaei et al. [15] concluded that interfacial tension reduction and wettability alteration were responsible for oil recovery improvements via NPs. This conclusion was arrived at after IFT, contact angle, and coreflood experiments were performed with two types of NPs i.e., hydrophobic and lipophilic polysilicon (HLP) and naturally wet polysilicon (NWP). Hendraningrat et al. [2] performed extensive coreflood experiments on sandstone samples to investigate nanoparticle performance. As with other studies, this investigation also showed the potential of NPs in reducing interfacial tension and altering wettability. Furthermore, they observed that increased concentrations of NPs led to further reduction in IFT and wettability alteration. They noted however that the enhanced performance of NPs at higher concentrations may not necessarily lead to improved oil recovery in the corefloods. Literature has shown some studies with respect to the potential of NPs as a method for enhancing oil recovery in carbonate samples and potential mechanism(s) of how the NPs alter the wettability of oil-wet media [16,17,18,19,20,21,22,23]. Sun et al. [16] conducted an extensive review on how NPs have been considered as potential agents to enhance oil recovery. Zhang et al. [17] showcased how engineered carbon nanosheet can recover about 20% more oil than the base brine, demonstrating their potential as effective EOR agents. Previous studies by Deng [18] and Osamah et al. [19], which investigated nanoparticles such as CuO ,   NiO ,   TiO 2 , Al 2 O 3 , and SiO 2 have shown significant potential for the application of nanoparticles for improved oil recovery. The nanoparticles of interest for this investigation are; SiO 2 , Al 2 O 3 , and ZnO which are summarized in Table 1.
It is reported that fumed silica particles may influence wettability on the surface and potentially lead to enhanced oil recovery [20]. It is imperative to note that organic fluids such as distilled water and brine can be only used to disperse silicon oxide ( SiO 2 ) as they cannot be mixed with polar fluids. Furthermore, dispersion in ethanol also indicated better results as compared to brine and distilled water. Studies by Nares et al. [21] have shown that aluminum oxide ( Al 2 O 3 ) is effective to decrease the oil viscosity. This is advantageous in terms of mobility control and its correlated effect on sweep efficiency. Additional studies by Ayatollahi et al. [22] have shown that zinc oxide (ZnO) have significant potential as it reduced bonds between fine grain particles even if it results in permeability problem and makes the fluid flowing difficult by agglomerating particles to larger particles and finally blocking the way inside a rock.
Therefore, the above mentioned research led the authors to also consider the potential of electrokinetics, which is defined as a term applied to physicochemical phenomena covering the transport of charges, impacts of electrical potential, and fluid transport, aiming for a desired migration [23]. In Abu Dhabi, where huge amounts of residual hydrocarbons exist in an advanced stage, low concentration acidizing facilitates the acid to accurately access to the targeted production well, therefore not only minimizing HSE concerns and acid corrosion but also providing economic feasibility reducing CAPEX and OPEX [24]. EK assisted and transported acids to go deeper in the reservoir and induced around 26% more in displacement efficiency and 30% increment in permeability with a little injected pore volume compared to conventional IOR [24]. This research, however, coped with either case of nanofluids flooding with EK or low concentration acid flooding with EK by comparing conventional water flooding. Deng [18] first tried to integrate LCA and nanoparticles with electrokinetics and demonstrated that silica low acid fluid with EK generated high displacement efficiency.
In this study, we investigate the impact of different NPs and nano-hybrid solutions on oil recovery using coreflooding experiments. Unlike most other studies, this study targets carbonate reservoirs and considers low concentration acids added to the NPs to aid in its dispersion in the brine and to enhance permeability. Hence, the primary objectives and novelty of the investigation are as follows:
  • Investigate the effect of hybrid nano-acid fluids (HNAFs) pulsed with EK in a tight carbonate reservoir rock by optimized concentration of the fluid to improve effective permeability, depth of penetration, and residence time of stimulation fluid in a reservoir, thus increasing oil displacement efficiency.
  • Apply a variety of the coreflooding experiment strategies both sequentially and simultaneously with EK to demonstrate the relative effect of each stage and comprehend optimum current to effectively mobilize by-passed oil in micro pore throats for representative carbonate reservoir rocks.

2. Materials and Methods

2.1. Fluids

Light crude oil, 0.7753 (g/cc) in density, 1.0615 cp in viscosity at 90 °C, and 39.83 in API ° at 60 , produced from a candidate Middle Eastern field, is going to be employed to render core plugs from water-wet to oil-wet condition by oil saturation. The density and viscosity under varying temperature is shown in Table 1.
The composition of formation water and seawater was based on field data [25] and is depicted in Table 2. Seawater is represented in the below figure and is used as a base fluid of hybrid nano-acid brines and water flooding and is made up of Na + ,   Ca 2 + ,   Mg 2 + ,   K + ,   Cl ,   SO 4 2 ,   and   HCO 3 .

2.2. Petrophysical Data of Rock Samples

Representative core plugs based on field data were used to demonstrate performance of both increased oil recovery and permeability in tight formations. The diameter and length of core plugs are each around 1.5 inches and 3 inches, respectively. Absolute permeability was measured using formation water of 157k TDS. Table 3 summarizes the petrophysical properties of core samples.

2.3. Nanoparticle Formulations

For this investigation, hydrochloric acid (HCl), which was synthetized as 37 weight percent aqueous solution with water, was used to formulate the nano-acid brines. The Middle Eastern regions are renowned for their carbonate formation and hence they easily react with acid along with causing adverse effects to the reservoirs and environment. Hence, unlike conventional acidizing which usually applies 15% to 30% acid concentration, it was diluted with brines and modified to the range of concentration, 3% to 6%, such that the detrimental effects are minimal while being able to contribute to overall recovery.
In this investigation, nanoparticles Si O 2 ,   Al 2 O 3 ,   and   ZnO , as mentioned in Table 4, are selected to make HNAFs with a different concentration of hydrochloric acid to examine an optimal scenario. Previous studies applied low concentration of acid from 0.1 wt.% to 3 wt.% and low concentration of nanoparticles from 0.01 wt.% to 0.5 wt.% without suggestion of the way the concentration and acid and nanoparticles were set. Therefore, according to the precipitation/compatibility test results conducted keeping slightly higher acid concentration due to tight core samples, 48 scenarios of hybrid nano-acid fluids (HNAFs) were prepared and tested as indicated in Table 5. Moreover, the scenario fixed was assumed to be not an optimum concentration range but an acceptable concentration so that there is no representative methodology that helps to identify optimum concentration of nanoparticles and acid. Lastly, it was noted that since even 3% acid concentration easily caused corrosion of equipment by reacting with titanium, which is a major component of the equipment, an industrial corrosion inhibitor was used along with the HNAFs.

2.4. Coreflooding Experiment

The coreflooding system (illustrated in Figure 1) largely consists of hydrodynamic flow pumps controlled automatically by a software in computer, two core holders which are rotatable from horizontal, 30 ° , and 45 ° to vertical inside oven, three accumulators, pressure transducers, pH and redox probe, conductor, and collector.
Firstly, six hydrodynamic flow pumps equipped with a fluid fill/drain system make it possible to inject fluids through the cores which are inside rubber sleeves of the core holder by setting constant pressure or constant flow, or double flow. One of the pumps for confining pressure, most likely to be kept at least 1000 psi higher than the injection pressure, and the other one for back pressure play an important role in reproducing reservoir conditions. Two core holders are designed for easy assembly, disassembly, core sample installation, dual performance, and cleaning. In addition to the rotation of the core holder, a variety of core sample lengths can be used (1 inch to 12 inch) due to changeable stainless tubing. Three accumulators are present in the system and provide a capacity of 1 L in the oven. Liquids such as high salinity water, high concentration of acids, and crude oil can be stored in the accumulator without corrosion as the materials are made up of titanium and Hastelloy. Pressure transducers monitor confining pressure, inlet pressure, outlet pressure, and back pressure. A fraction collector exists at the outlet of the system to enable easy collection and storage of effluent during coreflooding. The effluent can be automatically stored at every 0.1 pore volume injected by the fraction collector. In addition, other essential parameters such as pH change, conductivity, and redox data can be obtained by probes and conductor from the produced fluids. All piping is well connected to each part and the valves can both be manually and automatically controlled by safety mode. Lastly, experimental data can be saved in a spreadsheet in real time.

2.5. Coreflooding Procedure

  • Accumulators were filled with fluids including formation water, injection fluid, and oil prepared.
  • Once loading the core plug inside the core holder was completed, annulus between the core holder and rubber sleeves was filled with the distilled water to provide confining pressure.
  • Confining pressure was increased to ensure no leakage after which piping was connected to inlet and outlet parts.
  • Temperature probes were inserted to the core holder and anode/cathode electrodes were applied to both inlet and outlet sides by using power supply (Figure 1).
  • Temperature was set at 90 . Experiments only started after the pressure had stabilized.
  • Coreflooding was performed from the secondary water flooding to tertiary hybrid nano-acid fluid by increasing flow rate to check incremental displacement efficiency while reading the result of experiments including differential pressure change and produced volume of oil (in case, increase flow rate at the point that oil is not produced).
  • Experiments were repeated following the coreflooding strategies to prove relative impact of nanoparticles, acid, electrokinetics, and combined effect.
For this investigation, the experiment was conducted in horizontal orientation under reservoir conditions, overburden pressure of 3500 psi, back pressure of 1500 psi to capture CO 2 gas, and 90   . The core samples aged for 2 to 4 weeks were loaded before the experiment, and nano-acid fluid was prepared and dispersed by sonicator. A corrosion inhibitor (acquired from Schlumberger) was added to prevent the accumulators and injection lines from being corroded with acid. Throughout the experiments, the injection rate was kept at the same flow rate (0.5 cc / min ) till the pressure stabilized regardless of any injection fluids. Afterwards, it was bumped up to 0.75 and 1 cc / min to overcome the capillary end effect. Table 6 and Table 7 represent core and brine properties and an overview of coreflooding strategies used in the manuscript.

2.6. Zeta Potential Measurement

The Electrokinetic Analyzer is intended to analyze zeta potential at the interface between solid and liquid. There are two principles in determining zeta potential: the streaming potential and the streaming current method (herein, we used the streaming potential method since surface conductance of the sample influenced it unlike the streaming current measurement). Zeta potential is going to be measured at different stages followed by dry, saturation, aging (static), and after CF experiments to comprehend how effectively zeta potential is changed.
A basic principle of the Electrokinetic Analyzer is based on the Fairbrother–Mastin approach. Fairbrother–Mastin (FM) approach was developed by the Helmholtz–Smoluchowski (HS) method which can apply planar type of samples for zeta potential in order to acquire real zeta potential by measuring the electrolyte conductivity and resistance inside the streaming channel at high ionic strength.
ζ = dU dp η ε ε 0 1 R κ high R high
where, ζ = zeta potential, dU dp = the measured streaming current coefficient, η = the viscosity, ε ε 0 = dielectric coefficient of the electrolyte solution, R = the electrical resistance inside the streaming channel, κ high = the electrolyte conductivity, R high = resistance at high ionic strength.
The procedure for the measurement is as follows:
  • Cleaning the electrolyte hose was conducted first by disconnecting outlet hose and dipping it into a beaker filled with DI (repeat several times till pH reaches pH = 6).
  • Sample was loaded onto the mount (the sample should be centered, and the gasket should be invisible).
  • Beaker was filled with 500 mL of 0.001 mol/L Na 2 CO 3 and the system to remove the air in the electrolyte hose by reconnecting outlet hose to the beaker and clicking on the green Fill button.
  • System was rinsed with electrolyte solution by setting 300 mbar target pressure and 300 s time.
  • Flow check was performed by setting target pressure of 400 mbar to check if the fluid is properly flowing through the sample.
  • Start standard zeta potential measurement by changing limit of pH.

3. Results

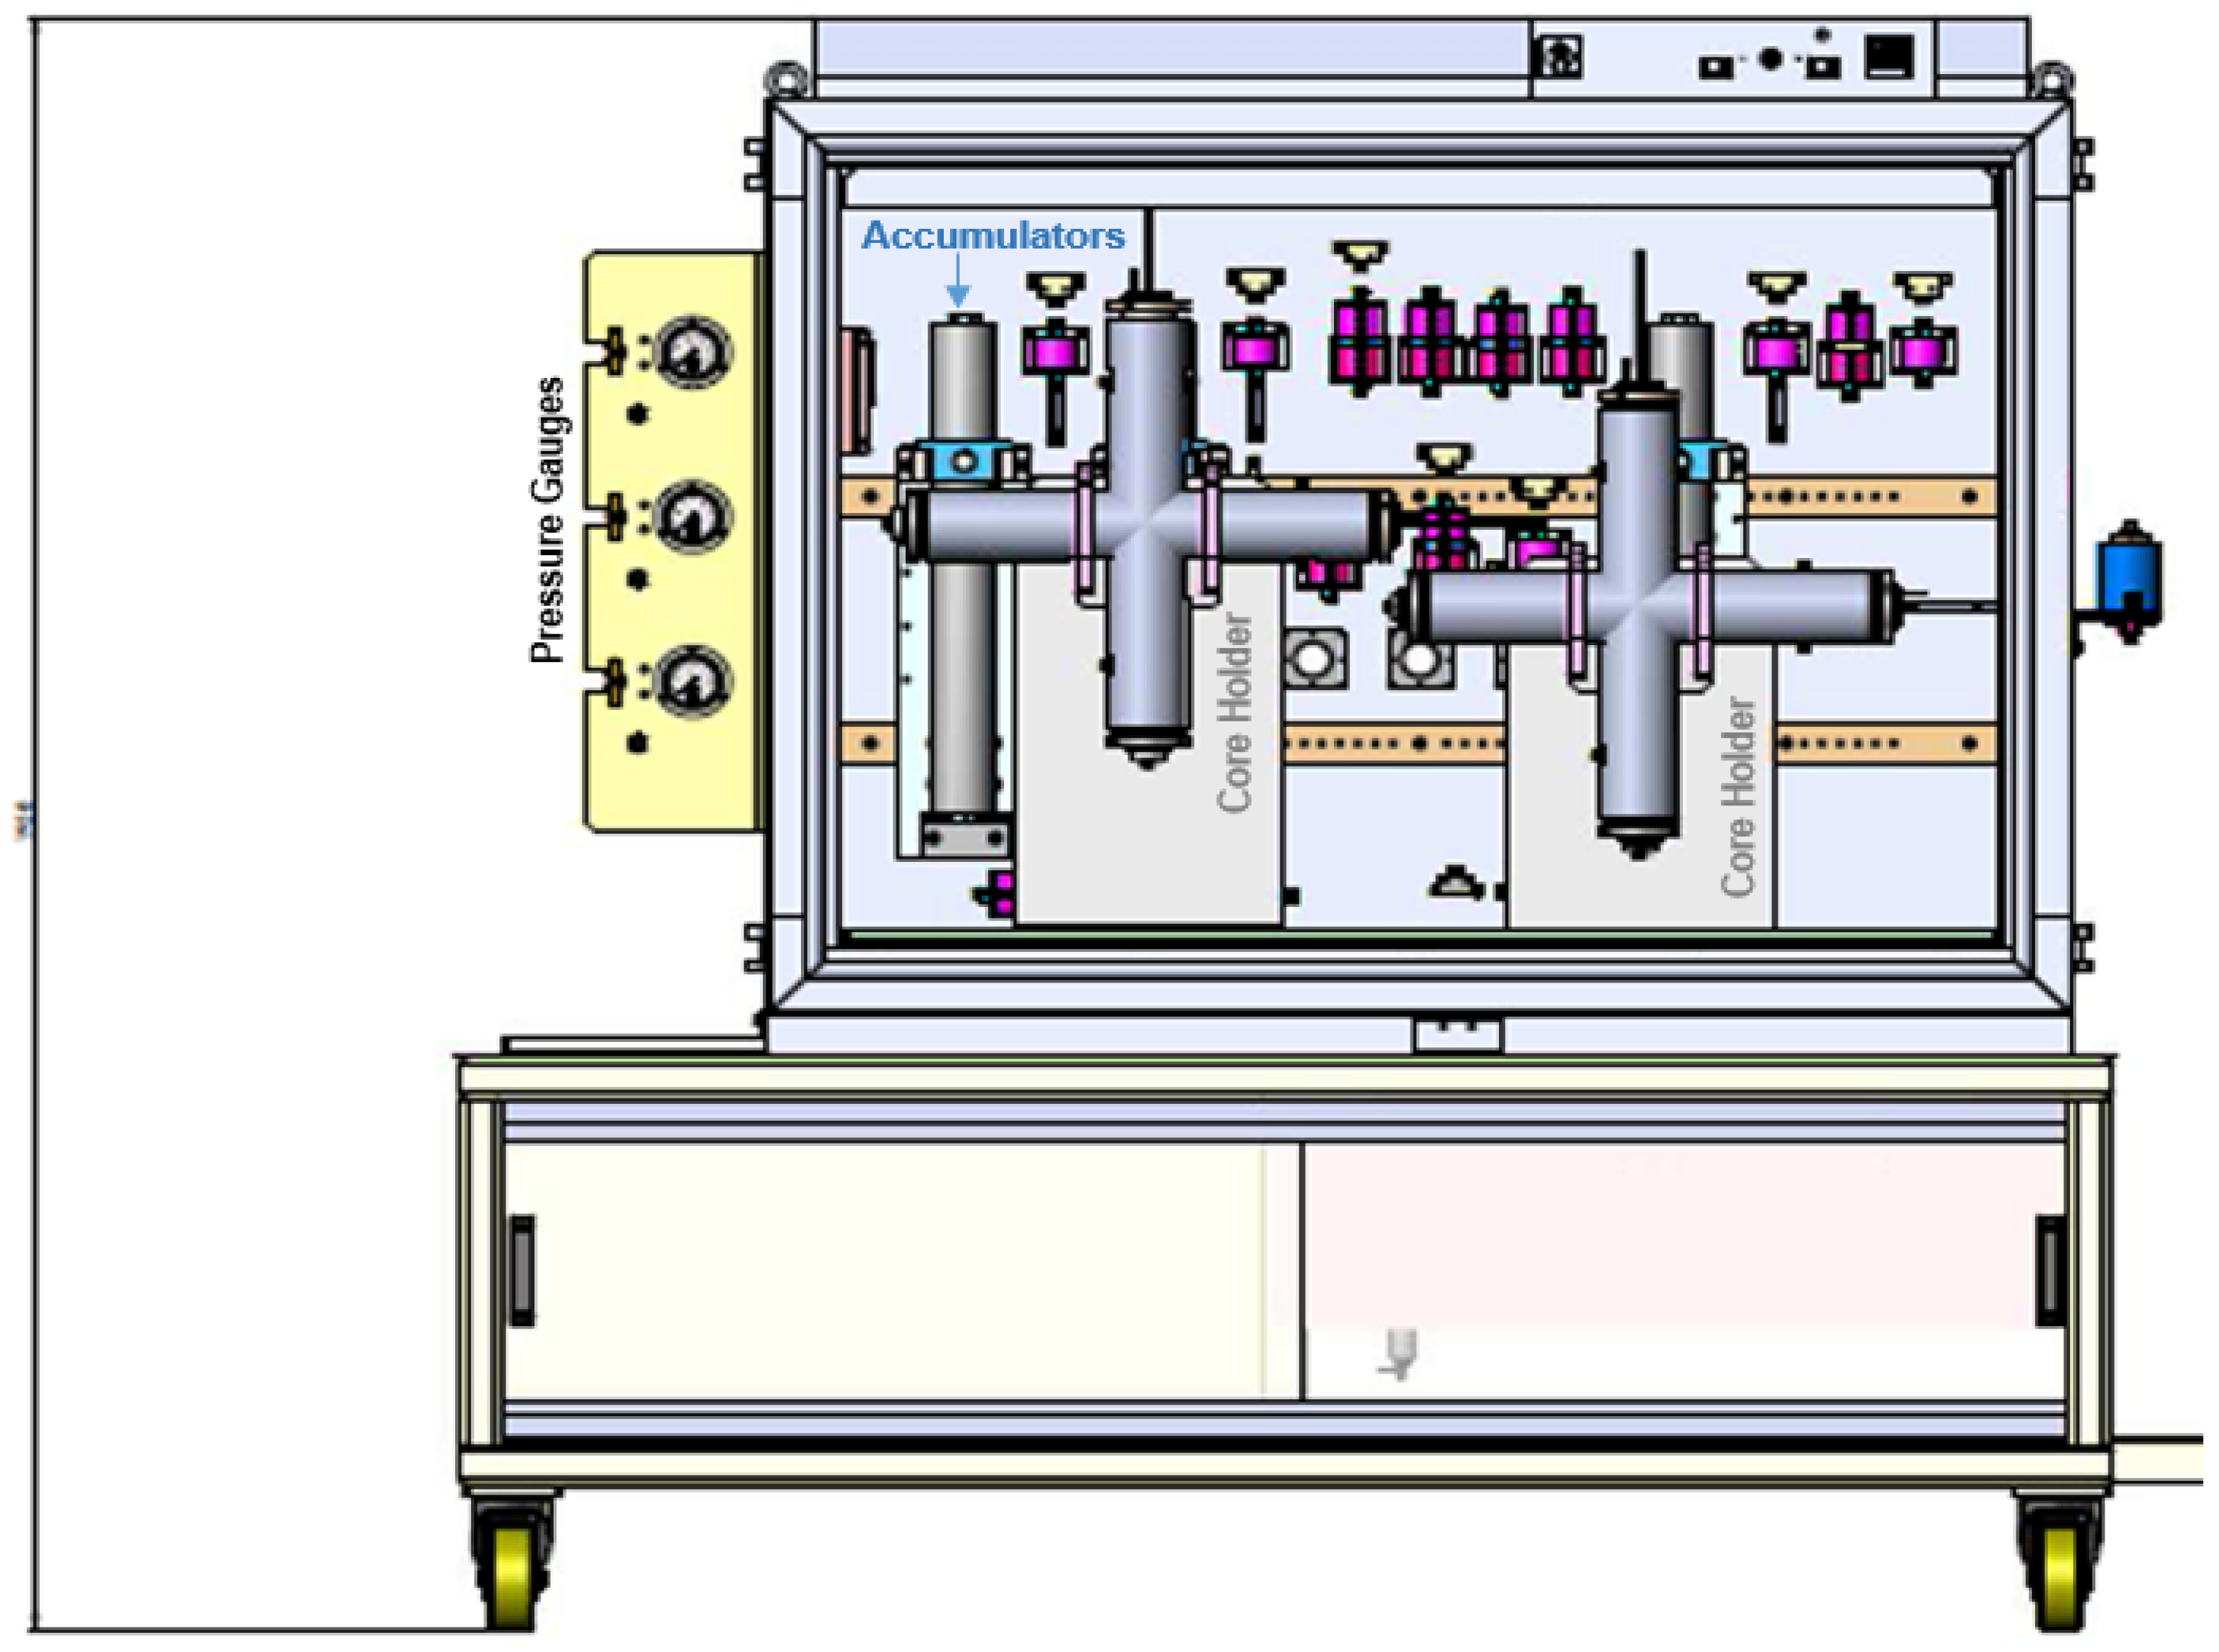
Coreflood experiments were performed to comprehend the impact of nano-acid brines on tight reservoirs, and to demonstrate the effect of EK current density both sequentially and simultaneously. Following coreflood strategies described in tables below, the objective was to determine the relative influence on oil recovery and identify the stages where each of the hybrid brines were efficiently working.
CF1
Before the use of a hybrid brine of NPs and acid, it was decided that relative effect of representative components should be shown first. Previous study [14,
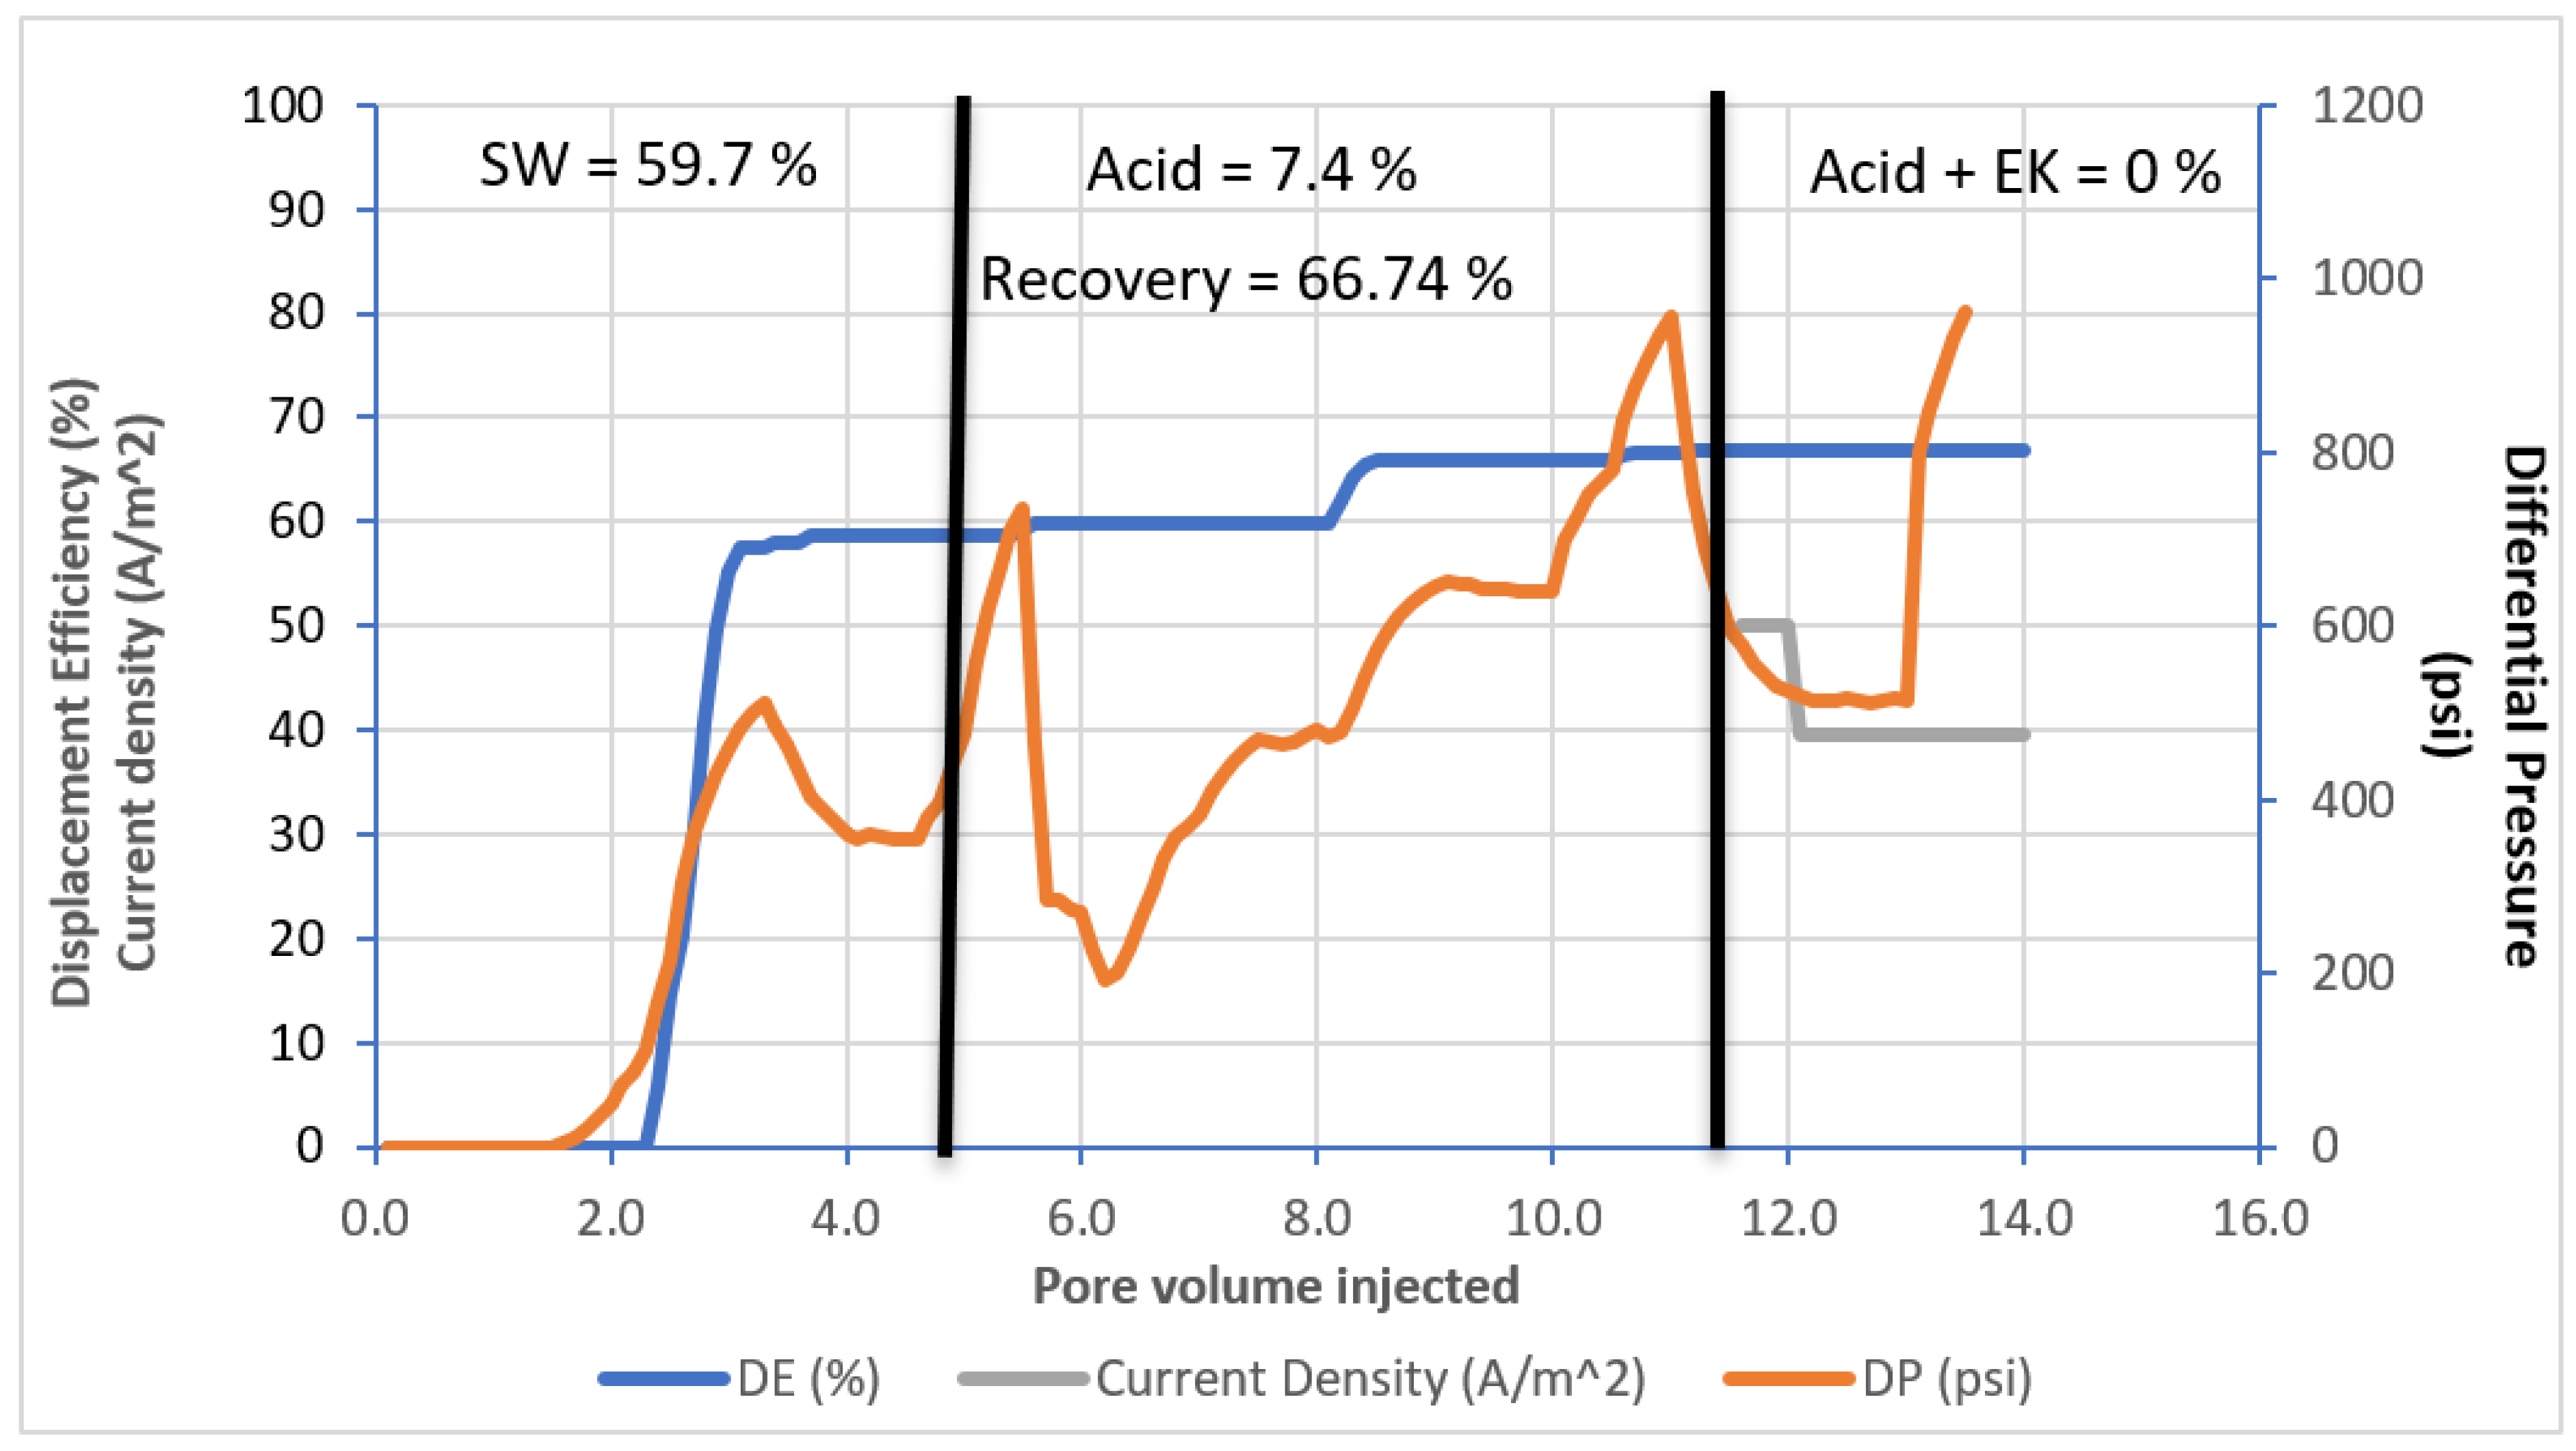
15] showcased that low concentration acid from 0.5% to 3% was weak to dissolve such a highly permeable core sample. This implies that the effect of acid may be distinct when compared to the NPs and hence, coreflooding 1 was implemented with 6% acid diluted in seawater to study the effect of diluted acid brine. In the case of NPs, compatibility with tight core plugs when employed alone made it impossible to use as an injection fluid. However, the particles were used in Amott tests to investigate further. The summary of CF1 is depicted in Table 8 and Figure 2.
At the secondary stage, a total 5.5 pore volumes of seawater were injected initially, producing 59.7% of oil. Afterwards, the injection fluid was switched to 6% acid diluted in seawater, showing a 7.4% incremental displacement efficiency in tertiary stage. EK with acid effect was applied in quaternary stage. Maximum current density was set to 50 A / m 2 to prevent precipitation observed in previous studies. However, there was no oil production at this stage. This might be because pre-flushes make relative oil permeability reach almost zero. Furthermore, CO 2 gas generated by the reaction between acid and carbonate formation may have trapped the oil by blocking the pore throats. Oil saturation at the end of injecting sea water, 6% acid brine, 6% acid brine with EK was 27.2%, 22.5%, and 22.5%, respectively.
CF2
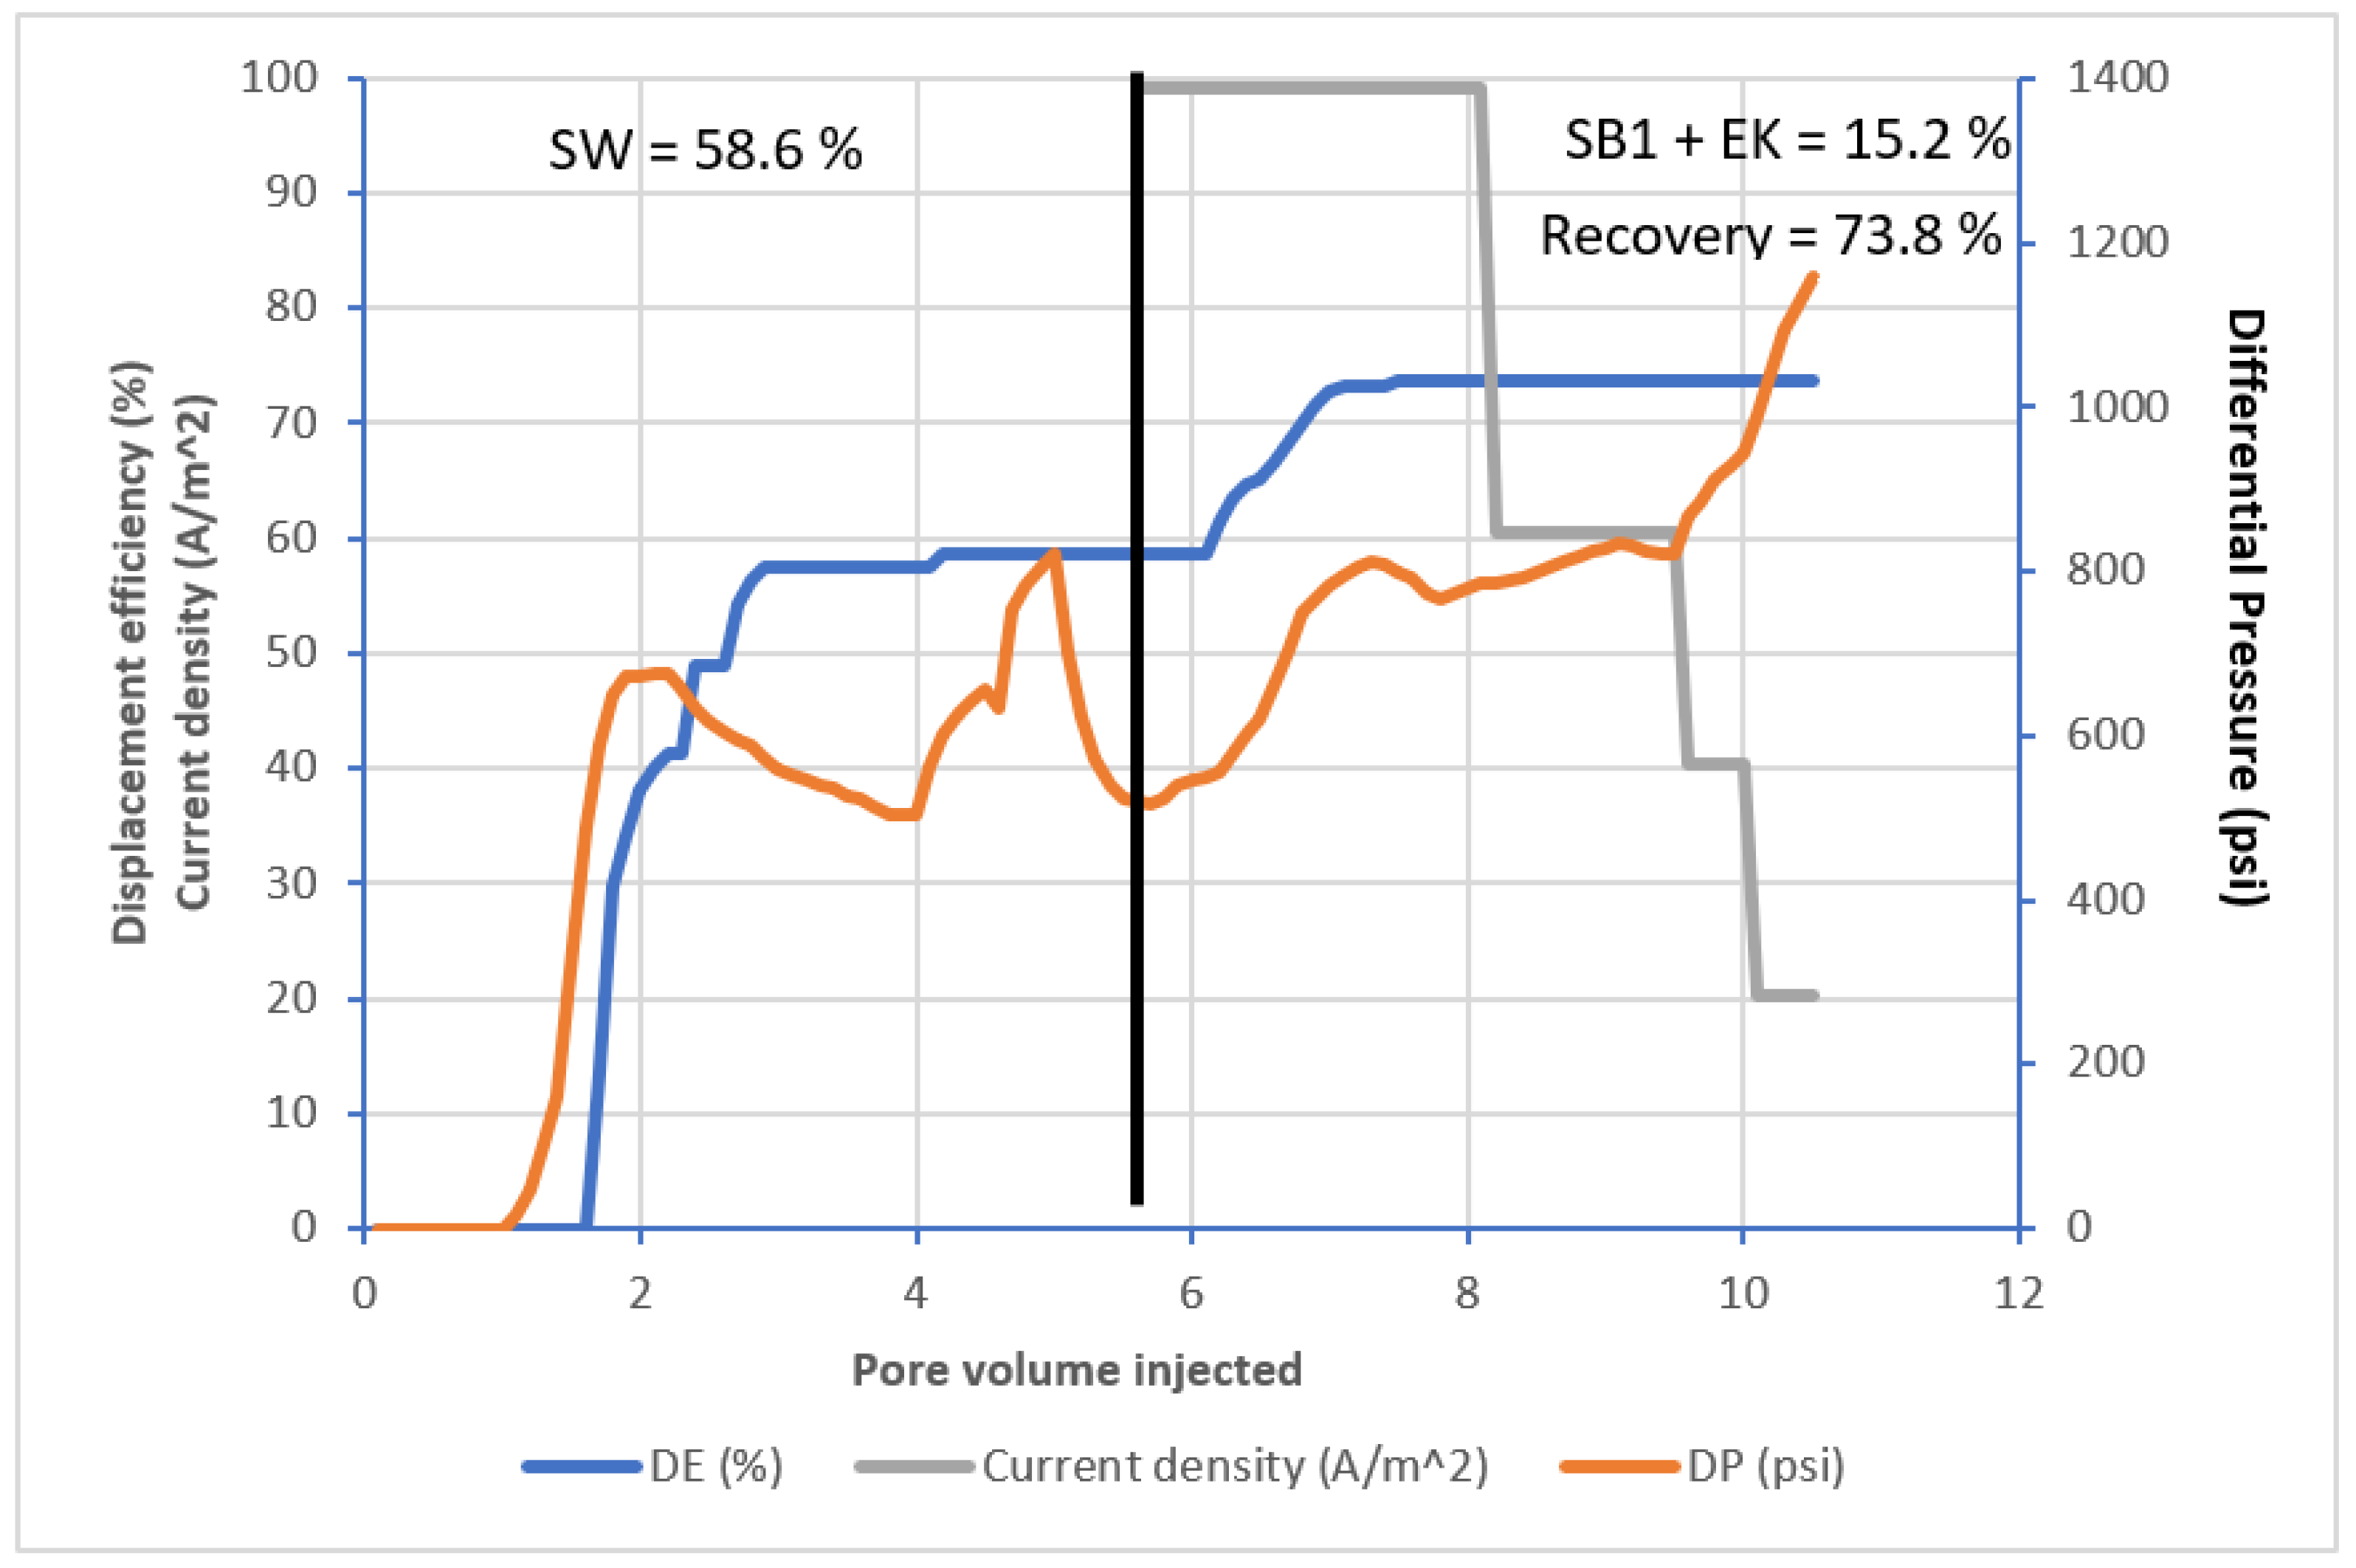
From CF2 to CF4, smart brines selected as candidates were applied depending on the type of NPs, and the experiments were conducted sequentially with EK to see the effect of nano-acid fluid and the integrated effect of nano-acid with EK. Smart brine 1 and silica dioxide acid brine, were used. The summary of CF2 is depicted in Table 9 and Figure 3.
Seawater injection as pre-flush drew 58.91% in displacement efficiency. After two pore volumes injected of smart brine 1, oil begun to be produced up to 17.66% more than secondary. Once EK was switched on, though, the oil production stopped. Even though high current density was applied, there was no oil expelled. Here, it was noted that above 100 A / m 2 of current density, a short circuit occurred thus EK application was put to a halt. Maximum current density was set to 100 A / m 2 . Oil saturation at the end of injecting sea water, 0.4% SiO 2 with 6% acid, 0.4% SiO 2 and 6% acid with EK was 26.3%, 15.1%, and 15.1% respectively.
Comparison of results between CF1 and CF2 indicates that there was 17.3% decrease of oil saturation after 11 pore volumes injected during CF1, while there was 42.6% decrease of oil saturation after 11 pore volumes injected during CF2. This indicates that silica NPs used in the formulation of CF2 have shown a significant potential in enhancing the oil recovery.
Flowrate increased from 0.5 to 0.75 and to 1 cc/min during each flooding stage. Therefore, the capillary number may have increased by up to 100 percent due to induced increased viscous forces. Capillary forces may have been reduced by up to 300% due to IFT reduction.
CF3
This CF3 was aimed to prove how effectively aluminum oxide acid brine diluted in seawater created incremental oil recovery. EK was sequentially applied in quaternary stage. The summary of CF3 is depicted in Table 10 and Figure 4.
There was 61.8% of original oil in place in the secondary stage at around two pore volumes injected. The following tertiary stage shows 11% incremental oil recovery produced by aluminum oxide acid brine. As with CF2 and CF3, current density was within the range from 40 to 100 A / m 2 applied but it was not effective to produce more oil in quaternary stage. Oil saturation at the end of injecting sea water, 0.1% Al 2 O 3 with 6% acid, 0.1% Al 2 O 3 , and 6% acid with EK was 25.7%, 18.3%, and 18.3%, respectively.
CF4
The objective of coreflood 4 was to prove the impact of zinc oxide acid brine sequentially with EK. Unlike other smart brines, zinc oxide acid fluid contains not 6% but 3% acid. EK was applied to find the optimum current density ranges which did not result in precipitation by changing it from 40 to 100 A / m 2 . The summary of CF4 is depicted in Table 11 and Figure 5 below.
Oil production commenced after around two pore volumes had been injected. Total production for this injection was up to 60.38%. Subsequently, zinc oxide acid brine was injected, and only 2.3% of oil was generated in this stage. In spite of the fact that it did not increase oil recovery, compared to silica dioxide and aluminum oxide acid brines, zinc oxide reduced the delay time of oil recovery. Oil saturation at the end of injecting sea water, 0.4% ZnO with 3% acid, 0.4% ZnO , and 3% acid with EK was 25.8%, 24.5%, and 24.5%, respectively.
CF5
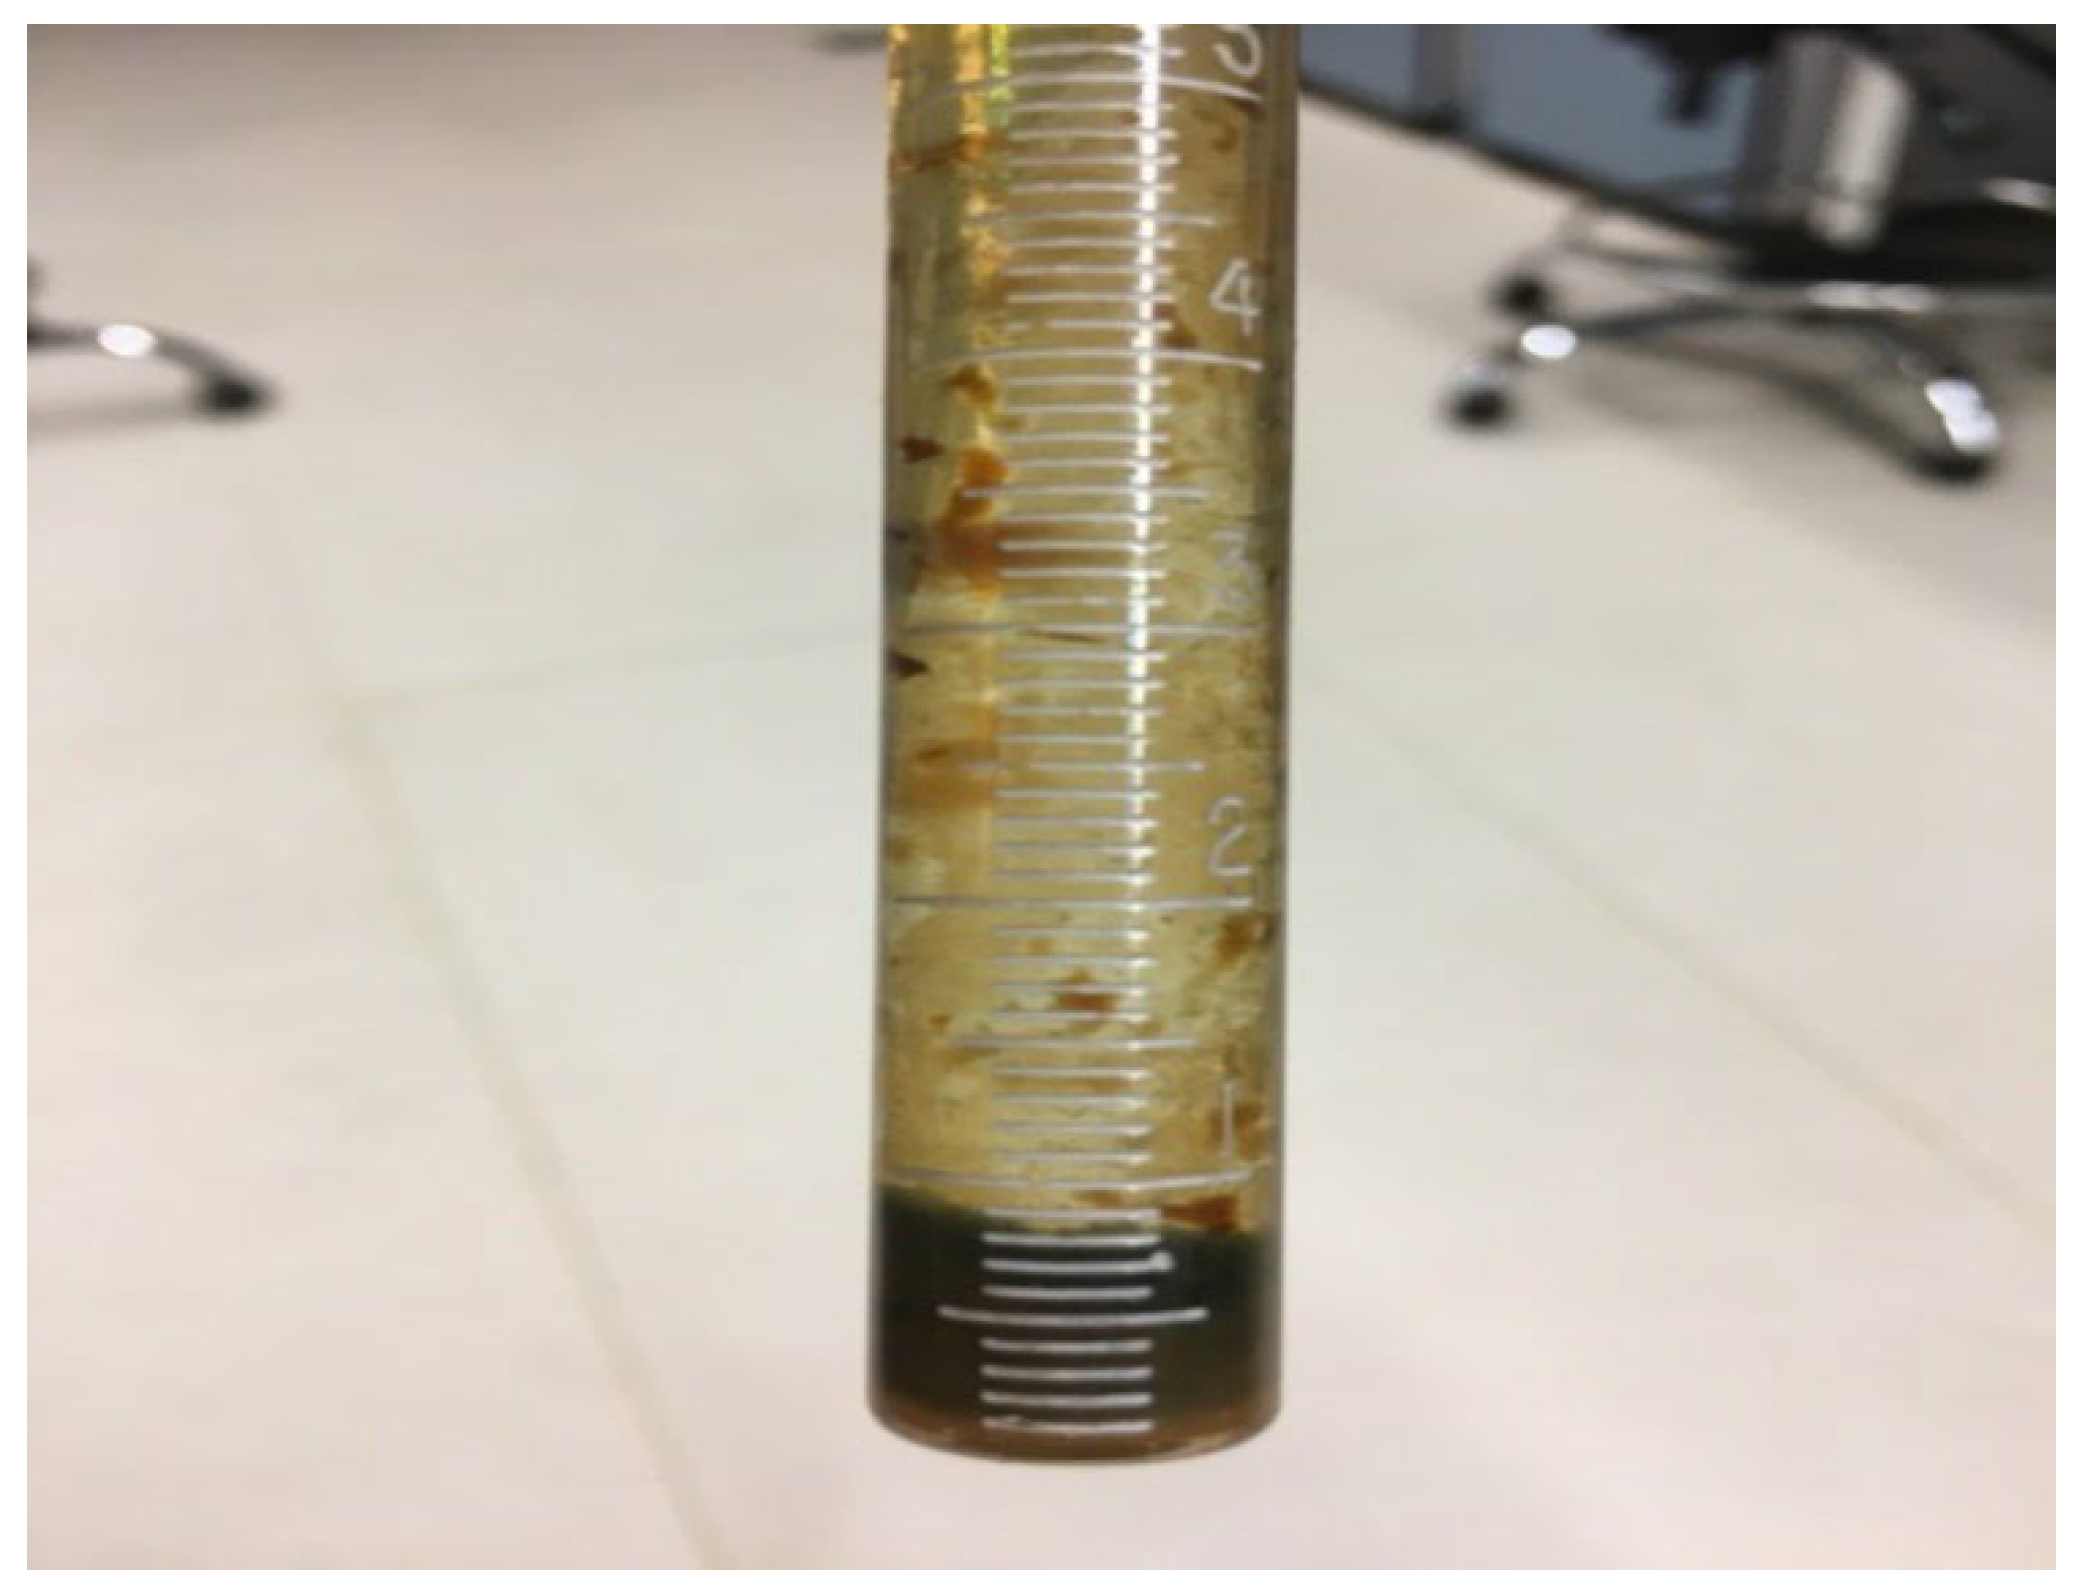
From CF5 to CF7, the experiments were simultaneously done with EK. Coreflood strategy only includes secondary and tertiary stages in which current density was applied. However, the optimum range of current density could not be observed from the previous experiments unless precipitation takes place. For this reason, current density was set as the same as previous experiments, but it ended up resulting in precipitation observed in the affluent as displayed in Figure 6.
The summary of CF5 is depicted in Table 12 and Figure 7. The result of CF5 can be compared to CF2. Incremental recovery in tertiary is quite similar between CF2 and CF5. However, the reason why CF5 presents slightly lower displacement efficiency than CF2 is because high current density was applied, causing precipitation as mentioned above. Since there was oil production, range of current density which does not generate precipitation was founded by reducing it. In addition, the application of EK rendered oil production earlier than CF2 without EK, thus decreasing the number of pore volumes injected. Oil saturation at the end of injecting sea water, 0.4% SiO 2 and 6% acid with EK was 26.3% and 16.6%, respectively.
Ansari [14] proposed a number of drawbacks of electrokinetics when applied in conventional acidizing; precipitation of heavy metal in cathode prevented fluids from flowing, limited desorption of injection fluid due to its solubility, and long or stagnant zones built by migration of electrolytes reduced migration rate of fluids. Desired goals of electrokinetics are to increase depth of penetration and effective permeability by removing formation damage and controlling mobility of injection fluids. Thus, smart EK acidizing was developed to reduce disadvantages acquired from conventional methods such as precipitation taking place by modifying the acid concentration and current density applied.
CF6
The summary of CF6 is depicted in Table 13 and Figure 8.
Although this coreflood only produced 0.6% more oil in tertiary mode when compared to CF3, production had started within 0.5 pore volumes injected. The recovery rate was four times faster than when EK was not applied. It was demonstrated that current density applied below 40 A / m 2 stimulated injection fluids to produce oil faster without deposition of heavy metals. Oil saturation at the end of injecting sea water, 0.1% Al 2 O 3 and 6% acid with EK was 27.5% and 20%, respectively.
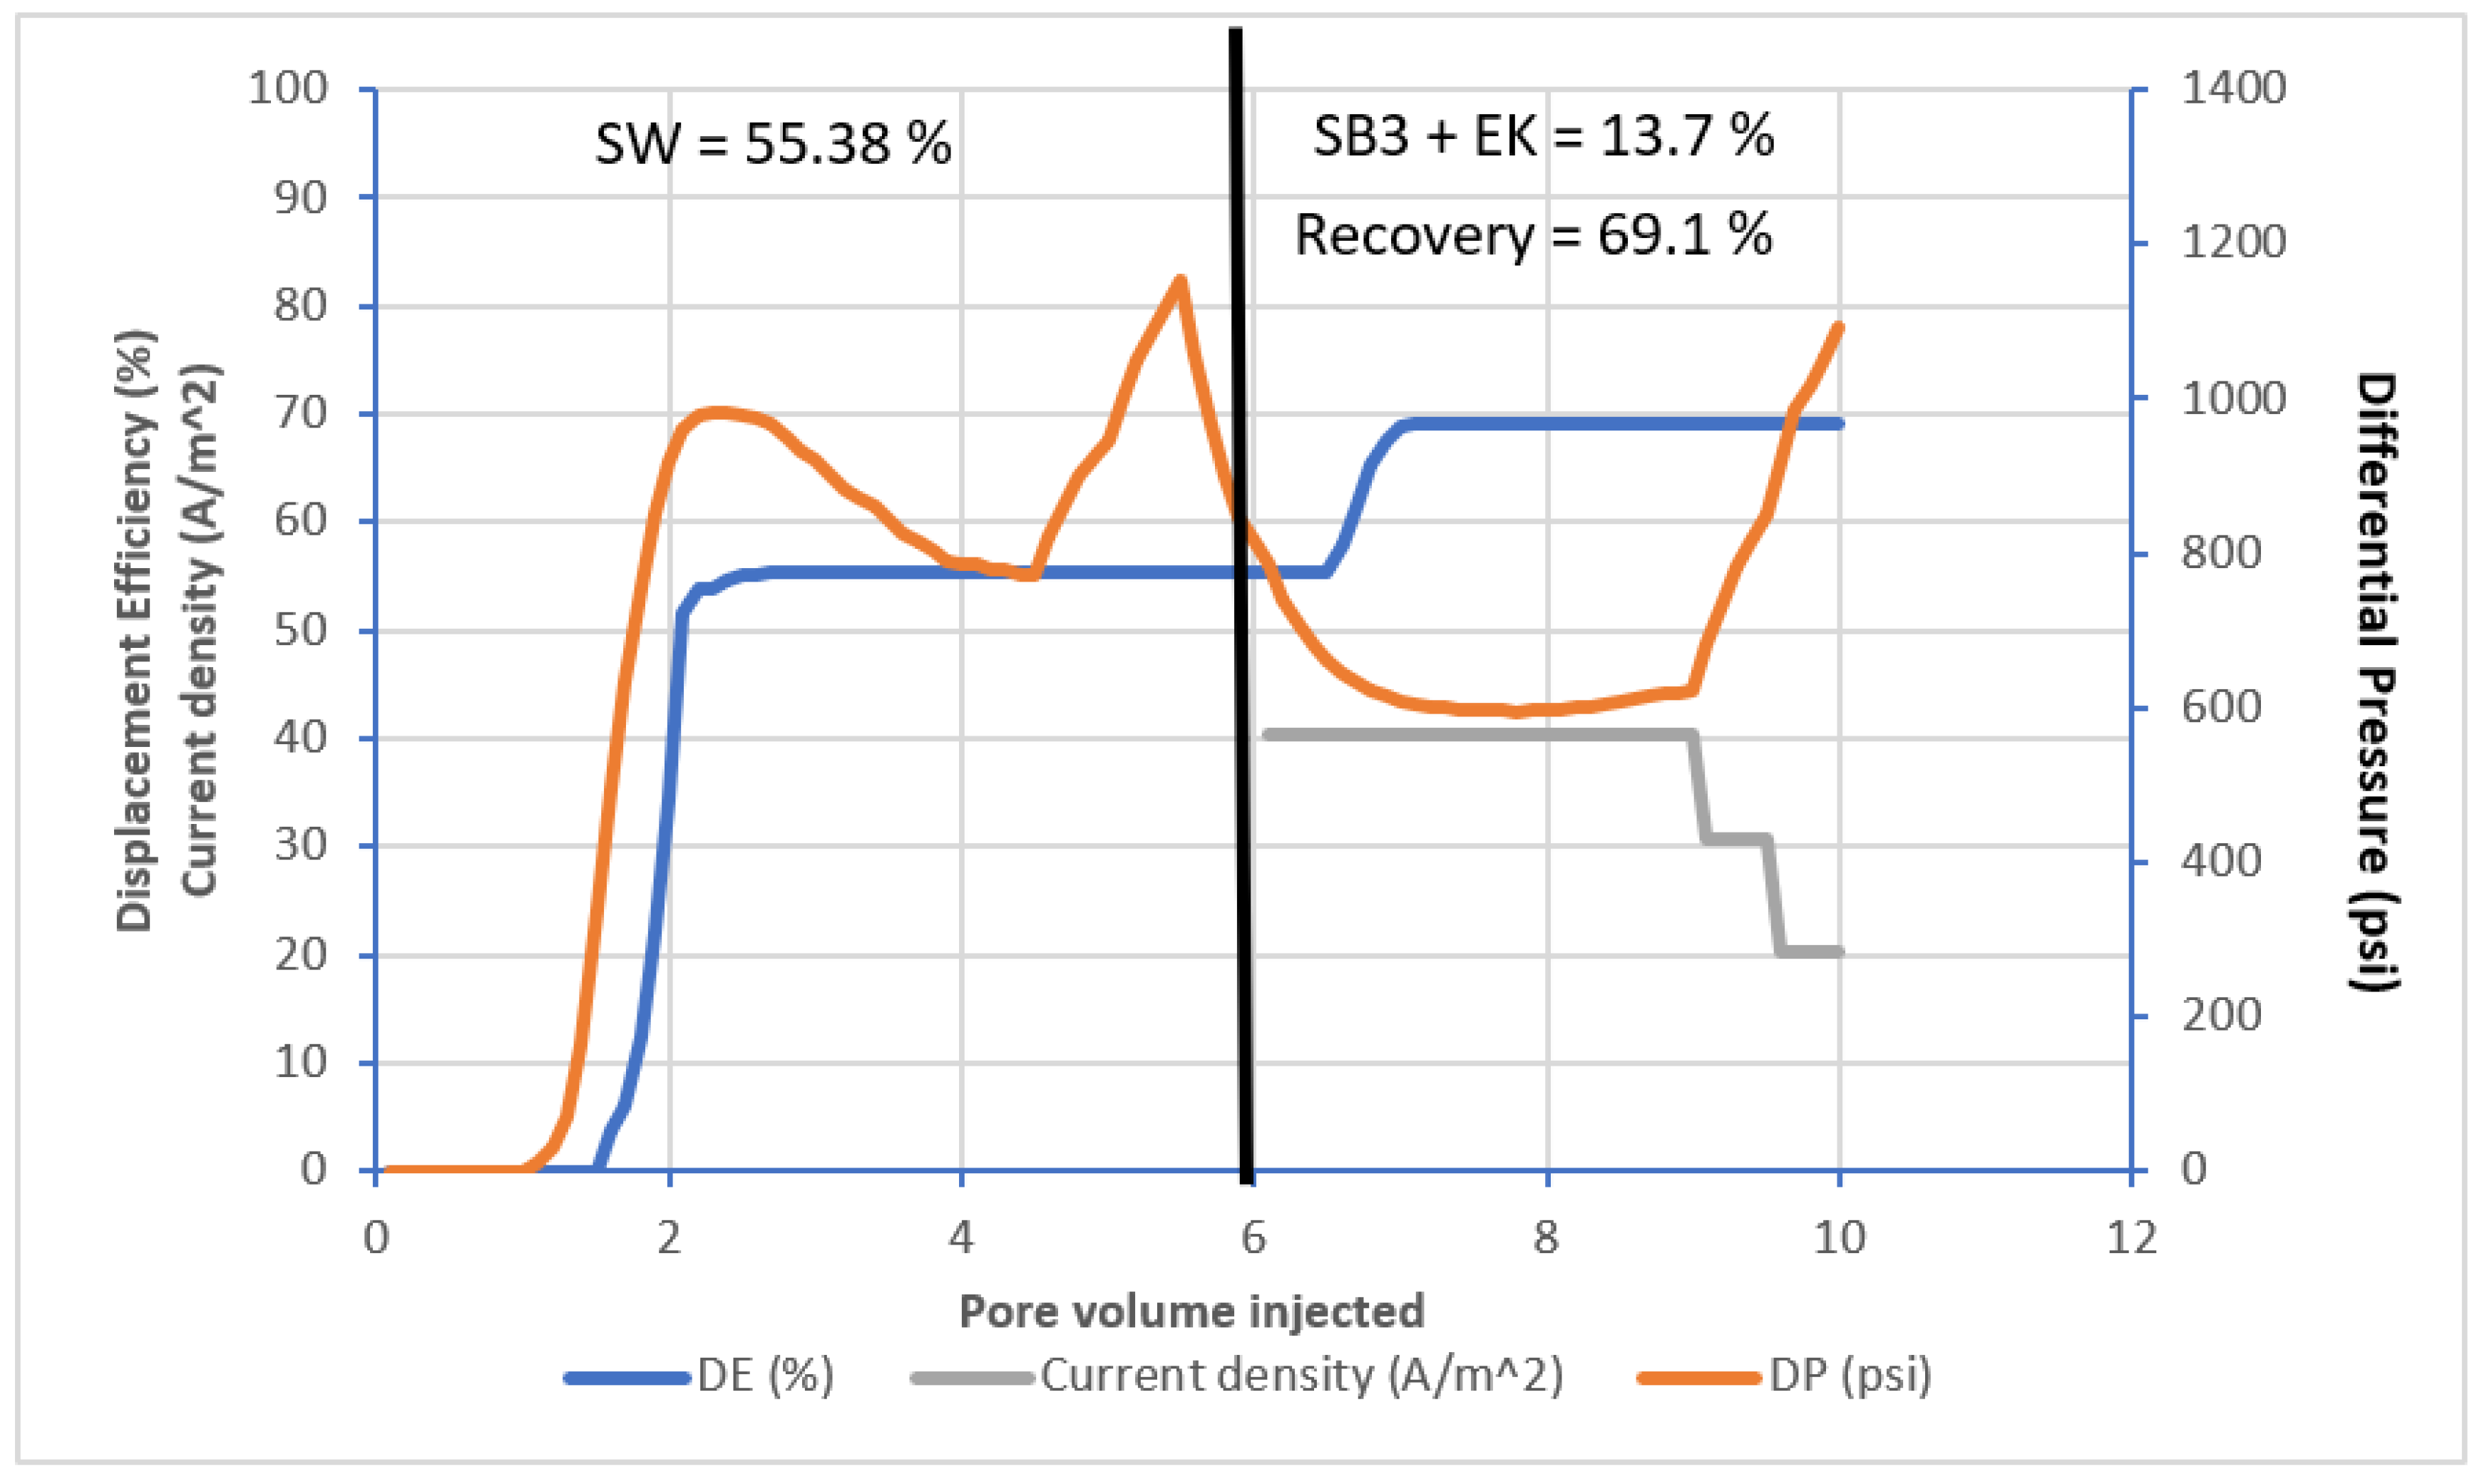
CF7
The summary of CF7 is depicted in Table 14 and Figure 9.
When it comes to application of electrokinetics, zinc oxide acid fluids yielded a distinct difference. CF4 shows solely 2% augmented displacement efficiency, and CF7 simultaneously done with EK presented 13.7% increased recovery. As stated earlier, this smart brine reduced the time production started, which implies that it is unnecessary to inject a lot of pore volumes. Oil saturation at the end of injecting sea water, 0.4% ZnO and 3% acid with EK was 28.7% and 19.9%, respectively.
CF8
Among the results of the coreflood experiment, the CF strategy which showed the best result when it comes to pore volume injected and displacement efficiency was selected to be reproduced by following the same method. Based on the results obtained, CF5, smart brine 1 simultaneously with EK, was chosen as the best CF method. Thus, coreflooding 8 was conducted to prove whether reproduced results could be obtained under the same conditions. The summary of CF8 is depicted in Table 15 and Figure 10 below.
CF2, CF5, and CF8 can be compared to each other and categorized as a group. These experiments verified the effect of silica dioxide acid brine. When combined with EK, oil was being produced within a short time. In CF5, it was mentioned that high current density set had a bad effect on oil recovery. Thus, CF8 indicates improved displacement efficiency since modified current density was applied. Oil saturation at the end of injecting sea water, 0.4% SiO 2 , and 6% acid with EK was 27.1% and 16.8%, respectively.
CF9
It was observed that not only did the individual effect of acid, NPs, coupled with and without EK influence oil recovery, but also an integrated impact of nano-acid brine and nano-acid with EK efficiently contributed as well. For corefloods CF9 through CF12, two different nanoparticles’ acid brines, called hybrid smart brine or HYSB, were used for the coreflood experiment.
Based on the concentration of NPs used above, the concentration was modified by diluting the brine so that two NPs were mixed together. When 0.1% silica dioxide was mixed with 0.1% aluminum oxide in 6% acid brine, they precipitated and settled to the bottom. However, when both were two times diluted to 0.05%, precipitation did not take place. In case of hybrid smart brine 2, while 0.1% SiO 2 was diluted to 0.05%, 0.2% ZnO was continuously used because it did not make brine opaque but clear. Hybrid smart brine 3 was also modified in a similar manner to HYSB2. The summary of CF9 is depicted in Table 16 and Figure 11 below.
HYSB1 stimulated oil production up to 16.2% in the tertiary stage. Compared to CF8, though, there was no obvious difference regarding incremental oil recovery. For this reason, we can hypothesize that the effect of SiO 2 is dominant even though the same amount of Al 2 O 3 was included in the same brine. Oil saturation at the end of injecting sea water, HYSB1 was 29.4% and 19%, respectively.
CF10
The summary of CF10 is depicted in Table 17 and Figure 12. Referring to CF7 and CF8 results, it was discovered that silica dioxide and zinc oxide may not be compatible so that oil displacement efficiency slightly reduced. Oil saturation at the end of injecting sea water, HYSB2 was 29.7% and 21.7%, respectively.
CF11
The summary of CF11 is depicted in Table 18 and Figure 13. Here, Al 2 O 3 and ZnO were mixed and used as injection fluid. Like CF10, they might not have had a good interaction which increased oil recovery especially in this combination. Oil saturation at the end of injecting sea water, HYSB3 was 30.2% and 22.9%, respectively.
CF12
CF12 was conducted with the best strategy among CF9 to CF11. Hybrid smart brine 1 was selected as the ideal candidate to repeat the experiment. The summary of CF12 is depicted in Table 19 and Figure 14. Oil saturation at the end of injecting sea water, HYSB1 was 28.2% and 18.9%, respectively.
The similar trend and oil recovery observed in CF9 was acquired. Therefore, it can be concluded that it is effective but it is recommended to use one nanoparticle which results in higher oil recovery, and thus it is more economical.
To better understand the responses, zeta potential is a critical parameter that was analyzed as it describes the charging behavior at solid–liquid surface. Furthermore, it helps to understand not only the effect of electrokinetics but also the determination of wettability alteration. Oil recovery has a huge relationship with wettability alteration determined by zeta potential on the rock surface. The core sample flooded by smart brine leads to a variation in zeta potential from inlet to outlet of the plug. Herein, as proposed in methodology, zeta potential of post-flushed sample was measured at the different pH and stages by flow of the solution of 0.001 mol/L Na 2 CO 3 . The following graphs (Figure 15, Figure 16, Figure 17, Figure 18, Figure 19 and Figure 20) representing zeta potential from pH 3 to pH 10 were categorized by coreflooding strategy.
In this study, smart brines that include hydrochloric acid (pH 1) penetrated carbonate rock (which originally indicates pH 6 to pH 7), and they prevailed throughout the whole parts of the sample. For this reason, it is assumed that pH of zeta potential would be in between pH 3 to pH 6. In this regard, the average zeta potential between pH 3 to pH 6 was obtained and compared with the aged sample in original oil in place and additional displacement efficiency. It is expected that the higher is the zeta potential of the sample, the higher extra displacement efficiency it should have.
Zeta potential measurements were conducted on the inlet side of the preserved core-plugs after the conclusion of each coreflood. The findings indicated a close connection between the rate of wettability alteration observed over the duration of nano-acid fluid injection and mode of electrokinetic application, in terms of duration in sequential (category I) and simultaneous (category II).
Among the samples that CF were sequentially conducted with (CF1 to CF4), CF2 and CF3 have the expected behavior, the higher zeta potential and a higher displacement efficiency. The best performing nano-acid fluids (SB1) correlated with the highest shift in the magnitude of the zeta potential across all tested strategies, as can be seen in CF2, yielded the highest IRF (Incremental Recovery Factor) of Category I at 17.6%, while impacting the maximum shift in zeta potential of +10 mV.
Although there was obvious alteration of zeta potential in the case of CF1, it shows quite low displacement efficiency. This might be because pure acid injected was not well guided and distributed, and it only created less channels, resulting in formation damage.
In comparison with CFs sequentially conducted, CF5 to CF8 largely present quite low zeta potential due to the application of EK which makes injection fluids quickly pass through the plugs before they are absorbed in the plug, though, DE is as high as group 1. From this point of view, it can be derived that the number of pore volume injected is one parameter affecting zeta potential. CF5 and CF8 under exactly the same condition indicated a similar trend. Smart brine 2 used in CF3 and CF6 had zeta potential values similar to smart brine 1, but did not produce a lot of the oil due to blockage by the precipitation of aluminum oxide. Similarly the best performing nano-acid fluids (SB1) observed in CF5 and CF8 also yielded the highest IRF of category II ranging around 15.2–16.3%, also corresponding to the maximum shift in zeta potential of +6 mV. It is evident that the shorter duration of 2.5 PVi required to achieve the ultimate recovery in category II resulted in almost half the shift in magnitude of zeta potential when compared to the longer duration of 9 Pvi required to achieve the ultimate recovery in category I. This provides an indication of the rate of wettability alteration on the magnitude of the shift in zeta potential.
Hybrid smart brines were used as injection fluid in group 3. Unlike the expected trend, CF10, that has the highest zeta potential, is not high in DE. It is required to study and discuss this with regard to hybrid smart fluids. CF9 strategy was selected as the successful candidate for repetition in CF12, therefore, it demonstrated the zeta potential of CF9 in aligning with CF12.
Figure 18, Figure 19 and Figure 20 presents the relation between permeability enhancement and zeta potential from pH3 to pH6 including average zeta potential. As expected, the high alteration in zeta potential corresponded with the higher permeability enhancement. Comparison between category 1 and category 2 verified that the application of EK prevents nano-acid fluids from being absorbed, and enhanced the permeability in the case of CF5. In category 3, however, the reason why CF10 and CF11, which contain zinc oxide and have a high zeta potential and show low permeability enhancement, is assumed to be because the valence of zinc oxide changes depending on pH by adsorbing on the surface of the plug.
Furthermore, to better understand the underlying behavior and the experimental responses, the depth of penetration was analyzed. It was calculated by the length of continuous channel created of primary length of core plug based on CT scanning images. In analyzing depth of penetration of HNAFs, there are two important properties: acid concentration applied and the number of pore volume injected. This is because smart brine 3 containing 3% acid produced a weak penetration rate, and CF2 and CF3 presented deeper penetration than CF5 and CF6. Regardless of those two factors, though, whereas the acid brine resulted in face dissolution and unguided pathways, smart brines with EK application were well guided and brought about deeper penetration (Figure 21). Among hybrid smart brines, combination of silica and aluminum nanoparticles represented quite low depth of penetration compared to other compounds.
Via analysis of CT scan data, the rate of dissolution depends on how tight the core is and acid concentration. According to Figure 21, while the left image suggests the case where 6% acid brine was applied as injection fluid for CF1, the right figure presents the application of SiO 2 acid brine with EK for CF2. From the left image, it was observed that there was face dissolution and fracture near the outlet part. Moreover, the areas which turned into light color throughout the core indicate that acid randomly and irregularly went through the core and moved about in confusion regarding where to go by creating many branches. On the other hand, the right figure demonstrated a continuous channel from inlet to outlet although both cores shown above the figure look similar in tightness based on the color interpretation and the same number of pore volumes which were injected. Since all CF cases did not produce the same result due to the heterogeneity of rock, it might not be able to insist that SBs are definitely effective to create a continuous channel. Though, it may be concluded that SBs with EK was well guided by either mobility control of nanoparticles mixed with acid or stimulation of acid in comparison with pure acid.
It is imperative to highlight that the breakthrough time for nanoparticles was not assessed in this study. However, it was observed that during multiple corefloods that the response in incremental oil recovery was observed after approximately two pore volumes of injection of the tested nano-acid fluids.
Based on the coreflooding experiments conducted with hybrid smart brine 1 (0.05% SiO 2 + 0.05% Al 2 O 3 + 6% acid), (coreflood 9 and 12), the combination of alumina and silica with 6% HCl yielded the highest incremental oil recovery ranging from 14.3% to 16.2%. Whereas hybrid smart brine 2 (0.05% SiO 2 + 0.2% ZnO + 6% acid) and hybrid smart brine 3 (0.05% Al 2 O 3 + 0.2% ZnO + 6% acid) prepared with various types of nanoparticles including low concentration of zinc oxide, yielded the lowest incremental recovery among the hybrid nano-acid fluids tested, ranging from 11% to 12.1%. This might be a further indication of potential in situ reactions causing the possible consumption of the nano-acid fluids. However, this would require further investigation and analysis of effluent samples to confirm reactions and breakthrough.

4. Conclusions

Principally, this study investigated the effect of nanoparticles on improving oil recovered in carbonate reservoirs. From the results of the experiments, the following are the key conclusions:
  • Among three smart brines, silica dioxide acid brine (SB1) produced the highest oil displacement efficiency around 17% in tertiary mode, irrespective of the coreflooding strategy applied. It was observed that while aluminum oxide acid brine (SB2) brought about similar results in both sequential and simultaneous strategies, zinc oxide acid brine (SB3) enhanced 10% more oil recovery when EK was simultaneously applied.
  • CT scanning analysis proved that smart brine with EK built continuous channels and increased depth of penetration unlike pure acid brine. This might be attributed to either the presence of nanoparticles or stimulation by application of EK.
  • Application of EK reduced the number of pore volumes injected to produce the oil at the same flow rate of injection fluid. Although hybrid smart brines increased displacement efficiency higher than oil recovery created by smart brines, it was not efficient to be used considering economical perspective.
  • Both (SB1) (0.4% SiO 2 + 6% acid) and (SB2) (0.1% Al 2 O 3 + 6% acid) indicated a significant shift in zeta potential as observed in both categories 1 and 2.
  • Highest incremental oil recovery under each category correlated with the highest shift in zeta potential observed, respectively, indicating the impact of rate of wettability alteration as a function of pore volumes injected.
  • Further analysis would be required to investigate the sole impact of nanoparticles on wettability alteration, interfacial tension, and oil recovery potential in carbonate reservoirs.

Author Contributions

Conceptualization, M.M.R., M.H., M.A.K. and M.K.; Data curation, M.M.R., M.H. and M.K.; Formal analysis, M.M.R., M.H., M.A.K. and M.K.; Funding acquisition, M.M.R. and M.H.; Investigation, M.M.R., M.H., M.A.K. and M.K.; Methodology, M.M.R., M.H., M.A.K. and M.K.; Project administration, M.M.R. and M.H.; Resources, M.M.R. and M.K.; Supervision, M.M.R., M.H. and M.A.K.; Validation, M.M.R., M.H., M.A.K., M.K., B.S., J.A.P. and S.P.; Visualization, M.K. and A.S.; Writing—original draft, M.K.; Writing—review and editing, M.K., S.P. and A.S. All authors have read and agreed to the published version of the manuscript.

Funding

This research received no external funding.

Institutional Review Board Statement

Not applicable.

Informed Consent Statement

Not applicable.

Data Availability Statement

Not applicable.

Acknowledgments

The authors sincerely thank Petroleum Engineering Department of Khalifa University, Abu Dhabi, UAE, for the support to conduct and publish this work.

Conflicts of Interest

The authors declare no conflict of interest.

References

  1. El-Diasty, A.I.; Aly, A.M. Understanding the mechanism of nanoparticles applications in enhanced oil recovery. In Proceedings of the SPE North Africa Technical Conference and Exhibition, Society of Petroleum Engineers, Cairo, Egypt, 14–16 September 2015. [Google Scholar]
  2. Hendraningrat, L.; Li, S.; Torsæter, O. A coreflood investigation of nanofluid enhanced oil recovery. J. Pet. Sci. Eng. 2013, 111, 128–138. [Google Scholar] [CrossRef]
  3. Ju, B.; Fan, T. Experimental study and mathematical model of nanoparticle transport in porous media. Powder Technol. 2009, 192, 195–202. [Google Scholar] [CrossRef]
  4. Li, S.; Torsæter, O. Experimental investigation of the influence of nanoparticles adsorption and transport on wettability alteration for oil wet Berea sandstone. In Proceedings of the SPE Middle East Oil & Gas Show and Conference, Society of Petroleum Engineers, Manama, Bahrain, 8–11 March 2015. [Google Scholar]
  5. Cai, J.; Chenevert, M.E.; Sharma, M.M.; Friedheim, J.E. Decreasing water invasion into Atoka shale using nonmodified silica nanoparticles. SPE Drill. Completion 2012, 27, 103–112. [Google Scholar] [CrossRef]
  6. Sayyadnejad, M.; Ghaffarian, H.; Saeidi, M. Removal of hydrogen sulfide by zinc oxide nanoparticles in drilling fluid. Int. J. Environ. Sci. Technol. 2008, 5, 565–569. [Google Scholar] [CrossRef] [Green Version]
  7. Chakraborty, S.; Agrawal, G.; DiGiovanni, A.; Scott, D.E. The Trick Is The Surface-Functionalized Nanodiamond PDC Technology. In Proceedings of the SPE International Oilfield Nanotechnology Conference and Exhibition, Society of Petroleum Engineers, Noordwijk, The Netherlands, 12–14 June 2012. [Google Scholar]
  8. Sengupta, S.; Kumar, A. Nano-Ceramic Coatings-a Means of Enhancing Bit Life and Reducing Drill String Trips. In Proceedings of the IPTC 2013: International Petroleum Technology Conference, Beijing, China, 26–28 March 2013. [Google Scholar]
  9. Abousleiman, Y.N.; Tran, M.; Hoang, S.; Bobko, C.; Ortega, A.; Ulm, F.-J. Geomechanics Field and Laboratory Characterization of the Woodford Shale: The Next Gas Play. In Proceedings of the SPE Annual Technical Conference and Exhibition, Anaheim, CA, USA, 11–14 November 2007. [Google Scholar]
  10. Haindade, Z.M.W.; Bihani, A.D.; Javeri, S.M.; Jere, C.B. Enhancing Flow Assurance Using Co-Ni Nanoparticles for Dewaxing of Production Tubing. In Proceedings of the SPE International Oilfield Nanotechnology Conference and Exhibition, Noordwijk, The Netherlands, 12–14 June 2012. [Google Scholar]
  11. Kumar, D.; Chishti, S.S.; Rai, A.; Patwardhan, S.D. Scale Inhibition Using Nano-Silica Particles. In Proceedings of the SPE Middle East Health, Safety, Security, and Environment Conference and Exhibition, Abu Dhabi, United Arab Emirates, 2–4 April 2012. [Google Scholar]
  12. Olayiwola, S.O.; Dejam, M. A comprehensive review on interaction of nanoparticles with low salinity water and surfactant for enhanced oil recovery in sandstone and carbonate reservoirs. Fuel 2019, 241, 1045–1057. [Google Scholar] [CrossRef]
  13. Olayiwola, S.O.; Dejam, M. Synergistic interaction of nanoparticles with low salinity water and surfactant during alternating injection into sandstone reservoirs to improve oil recovery and reduce formation damage. J. Mol. Liq. 2020, 317, 114228. [Google Scholar] [CrossRef]
  14. Olayiwola, S.O.; Dejam, M. Comprehensive experimental study on the effect of silica nanoparticles on the oil recovery during alternating injection with low salinity water and surfactant into carbonate reservoirs. J. Mol. Liq. 2021, 325, 115178. [Google Scholar] [CrossRef]
  15. Roustaei, A.; Moghadasi, J.; Bagherzadeh, H.; Shahrabadi, A. An Experimental Investigation of Polysilicon Nanoparticles’ Recovery Efficiencies through Changes in Interfacial Tension and Wettability Alteration. In Proceedings of the SPE International Oilfield Nanotechnology Conference and Exhibition, Noordwijk, The Netherlands, 12–14 June 2012. [Google Scholar]
  16. Sun, X.; Zhang, Y.; Chen, G.; Gai, Z. Application of nanoparticles in enhanced oil recovery: A critical review of recent progress. Energies 2017, 10, 345. [Google Scholar] [CrossRef] [Green Version]
  17. Zhang, B.; Mohamed, A.I.; Goual, L.; Piri, M. Pore-scale experimental investigation of oil recovery enhancement in oil-wet carbonates using carbonaceous nanofluids. Sci. Rep. 2020, 10, 17539. [Google Scholar] [CrossRef] [PubMed]
  18. Deng, Y.H.; Haroun, M.R.; Rahman, M.M. “Novel Hybrid Nano-Acid Fluid (HNAF) Assisted by Electrokinetics for Improved Oil Recovery in Tight Carbonates”. In Proceedings of the 3rd International Congress on Nanoscience & Nanotechnology for Oral Presentation, Istanbul, Turkey, 2–3 July 2015. [Google Scholar]
  19. Alomair, O.A.; Matar, K.M.; Alsaeed, Y.H. Experimental Study of Enhanced-Heavy-Oil Recovery in Berea Sandstone Cores by Use of Nanofluids Applications. In Proceedings of the SPE 171539, SPE Asia Pacific Oil & Has Conference and Exhibition, Adelaide, Australia, 14 July 2015. [Google Scholar]
  20. McElfresh, P.; Olguin, C.; Ector, D. The Application of Nanoparticle Dispersions to Remove Paraffin and Polymer Filter Cake Damage. In Proceedings of the SPE-151848-M, SPE International Symposium and Exhibition on Formation Damage Control, Louisiana, LA, USA, 15–17 February 2012. [Google Scholar]
  21. Nares, H.R.; Schachat, P.; Ramirez-Garnica, M.A.; Cabrera, M.; Noe-Valencia, L. Heavy-Crude-Oil Upgrading with Transition Metals. In Proceedings of the Latin American & Caribbean Petroleum Engineering Conference, Buenos Aires, Argentina, 15–18 April 2007. [Google Scholar]
  22. Ayatollahi, S.; Zerafat, M.M. Nanotechnology-Assisted EOR Techniques: New Solutions to Old Challenges. In Proceedings of the SPE International Oilfield Nanotechnology Conference and Exhibition, Noordwijk, The Netherlands, 12–14 June 2012. [Google Scholar]
  23. Chilingar, G.V.; Haroun, M. Electrokinetics for Petroleum and Environmental Engineers; John and Wiley and Sons: Hoboken, NJ, USA, 2014. [Google Scholar]
  24. Ansari, A.A.; Haroun, M.R.; Rahman, M.M.; Chilingar, G.V. Increasing Depth of Penetration by Electrokinetic Driven Low-Concentration Acid IOR in Abu Dhabi Tight Carbonate Reservoirs. In Proceedings of the Abu Dhabi International Petroleum Exhibition and Conference, Abu Dhabi, United Arab Emirates, 10–13 November 2014. [Google Scholar]
  25. Kim, M. Investigating Hybrid Nanoparticle Acid Application for EOR in Abu Dhabi Tight and Shale Reservoirs. Master’s Thesis, Khalifa University of Science and Technology, Abu Dhabi, United Arab Emirates, 2017. [Google Scholar]
Figure 1. Schematic of coreflooding machine with Hastelloy wetted parts.
Energies 15 05502 g001
Figure 2. DE, DP (ΔP), Current Density vs. Pore Volume Injected for CF1.
Energies 15 05502 g002
Figure 3. DE, DP (ΔP), Current Density vs. Pore Volume Injected for CF2.
Energies 15 05502 g003
Figure 4. DE, DP (ΔP), Current Density vs. Pore Volume Injected for CF3.
Energies 15 05502 g004
Figure 5. DE, DP (ΔP), Current Density vs. Pore Volume Injected for CF4.
Energies 15 05502 g005
Figure 6. Observation of precipitation from the application of EK.
Energies 15 05502 g006
Figure 7. DE, DP (ΔP), Current Density vs. Pore Volume Injected for CF5.
Energies 15 05502 g007
Figure 8. DE, DP (ΔP), Current Density vs. Pore Volume Injected for CF6.
Energies 15 05502 g008
Figure 9. DE, DP (ΔP), Current Density vs. Pore Volume Injected for CF7.
Energies 15 05502 g009
Figure 10. DE, DP (ΔP), Current Density vs. Pore Volume Injected for CF8.
Energies 15 05502 g010
Figure 11. DE, DP (ΔP), Current Density vs. Pore Volume Injected for CF9.
Energies 15 05502 g011
Figure 12. DE, DP (ΔP), Current Density vs. Pore Volume Injected for CF10.
Energies 15 05502 g012
Figure 13. DE, DP (ΔP), Current Density vs. Pore Volume Injected for CF11.
Energies 15 05502 g013
Figure 14. DE, DP (ΔP), Current Density vs. Pore Volume Injected for CF12.
Energies 15 05502 g014
Figure 15. Average zeta potential (pH 3–pH 6) compared to DE (category 1).
Energies 15 05502 g015
Figure 16. Average zeta potential (pH 3–pH 6) compared to DE (category 2).
Energies 15 05502 g016
Figure 17. Average zeta potential (pH 3–pH 6) compared to DE (category 3).
Energies 15 05502 g017
Figure 18. Zeta potential (pH3 to pH6) vs. permeability enhancement (category1).
Energies 15 05502 g018
Figure 19. Zeta potential (pH3 to pH6) vs. permeability enhancement (category2).
Energies 15 05502 g019
Figure 20. Zeta potential (pH3 to pH6) vs. permeability enhancement (category 3).
Energies 15 05502 g020
Figure 21. Comparison between applications of acid brine and SBs with EK.
Energies 15 05502 g021
Table 1. The density and viscosity of the oil at each temperature.
Temperature ( )2025507590
Density (g/cc)0.82320.81970.80230.78460.7753
Viscosity (cp)3.84143.32881.96371.26031.0615
Table 2. Concentration of ions of seawater.
IonsConcentration (g/L)
Na + 19.054
Ca 2 + 0.69
Mg 2 + 2.132
K + 0.672
Cl 30.924
SO 4 2 3.944
HCO 3 0.123
TDS   ( ppm ) 57.539
Ionic Balance1.104
Ionic Strength1.15
Table 3. Summary of core properties used for coreflooding.
No.Core IDAvg Diameter (cm)Avg Length (cm)Liquid Pore Volume (cc)Liquid Porosity (%) K a b s ( mD ) OIIP Volume (cc)Soi (%)
CF11-13.7677.55513.12315.590.1378.8767.59
CF21-33.7447.46914.30617.390.1889.16664.1
CF31-43.7707.30314.32117.570.1759.62667.22
CF42-13.7787.61214.04816.460.1389.14265.07
CF53-13.7677.40714.51517.580.1769.21463.48
CF63-23.7577.37112.29815.050.1137.93364.51
CF72-33.7537.38012.67215.780.1478.16264.42
CF82-43.7537.33313.12116.210.2148.27963.13
CF94-33.7647.23813.0317.080.1888.32963.92
CF105-23.7576.96011.83515.470.1557.86966.48
CF115-33.7587.21612.35515.530.1788.18266.23
CF124-23.7567.03012.39616.180.2098.04764.91
Table 4. Properties of nanoparticles (as per manufacturer).
Products S i O 2 A l 2 O 3 Z n O
FormPowdersPowdersPowders
Particle size (nm)10–2030–60 100
Molecular weight (g/mol)60.08101.9681.37
Density (g/cc)2.23.275.61
pH3.7–4.56–76–9
Surface   area   ( m 2 / s )30013015–25
Surface ChargePositivePositivePositive
Table 5. Scenarios of Hybrid Nano-Acid Fluids (HNAF).
S i O 2 ( wt . % ) Acid (wt.%) A l 2 O 3 ( wt . % ) Acid (wt.%) Z n O ( wt . % ) Acid (wt.%)
0.130.0130.43
0.240.0440.64
0.350.0750.85
0.460.1616
4 × 4 = 164 × 4 = 164 × 4 = 16
The number of scenarios = 48
Table 6. Summary of brine properties injected for coreflooding.
Brine IDProperties
Acid Brine6% hydrochloric acid
Smart Brine 1 0.4 %   SiO 2 + 6% acid
Smart Brine 2 0.1 %   Al 2 O 3 + 6% acid
Smart Brine 3 0.4 %   ZnO + 3% acid
Hybrid Smart Brine 1 0.05 %   SiO 2   +   0.05 %   Al 2 O 3 + 6% acid
Hybrid Smart Brine 2 0.05 %   SiO 2   +   0.2 %   ZnO + 6% acid
Hybrid Smart Brine 3 0.05 %   Al 2 O 3   +   0.2 %   ZnO + 6% acid
Table 7. Summary of coreflooding strategies.
No.Core IDSecondaryTertiaryQuaternary
Sequentially (in-succession) with EK
CF11-1SW6% Acid brine6% Acid brine + EK
CF21-3SWSB1SB1 + EK
CF31-4SWSB2SB2 + EK
CF42-1SWSB3SB3 + EK
No.Core IDSecondaryTertiary
Simultaneously (in-parallel) with EK
CF53-1SWSB1 + EK
CF63-2SWSB2 + EK
CF72-3SWSB3 + EK
CF82-4SWSB1 + EK (winner among CF2 to CF7)
CF94-3SWHYSB1 + EK
CF105-2SWHYSB2 + EK
CF115-3SWHYSB3 + EK
CF124-2SWHYSB1 + EK (winner among CF9 to CF11)
Table 8. Summary of CF1.
Injection FluidFlooding StageDisplacement Efficiency %
1SWSecondary59.7
26% AcidTertiary7.4
36% Acid + EKQuaternary0
Table 9. Summary of CF2.
Injection FluidFlooding StageDisplacement Efficiency %
1SWSecondary58.91
2 0.4 %   SiO 2 + 6% acidTertiary17.66
30.4% SiO 2 + 6% acid + EKQuaternary0
Table 10. Summary of CF3.
Injection FluidFlooding StageDisplacement Efficiency %
1SWSecondary61.8
2 0.1 %   Al 2 O 3 + 6% acidTertiary11
3 0.1 %   Al 2 O 3 + 6% acid + EKQuaternary0
Table 11. Summary of CF4.
Injection FluidFlooding StageDisplacement Efficiency %
1SWSecondary60.38
2 0.4 %   ZnO + 3% acidTertiary2.3
3 0.4 %   ZnO + 3% acid + EKQuaternary0
Table 12. Summary of CF5.
Injection FluidFlooding StageDisplacement Efficiency %
1SWSecondary58.6
2 0.4 %   SiO 2 + 6% acid + EKTertiary15.2
Table 13. Summary of CF6.
Injection FluidFlooding StageDisplacement Efficiency %
1SWSecondary57.35
2 0.1 %   Al 2 O 3 + 6% acid + EKTertiary11.6
Table 14. Summary of CF7.
Injection FluidFlooding StageDisplacement Efficiency %
1SWSecondary55.38
2 0.4 %   ZnO + 3% acid + EKTertiary13.7
Table 15. Summary of CF8.
Injection FluidFlooding StageDisplacement Efficiency %
1SWSecondary57
2 0.4 %   SiO 2 + 6% acid + EKTertiary16.3
Table 16. Summary of CF9.
Injection FluidFlooding StageDisplacement Efficiency %
1SWSecondary54.03
2Hybrid Smart Brine 1
0.05 %   SiO 2 +
0.05 %   Al 2 O 3 +
6% acid
Tertiary16.2
Table 17. Summary of CF10.
Injection FluidFlooding StageDisplacement Efficiency %
1SWSecondary55.28
2Hybrid Smart Brine 2
0.05 %   SiO 2 +
0.2 %   ZnO +
6% acid
Tertiary12.1
Table 18. Summary of CF11.
Injection FluidFlooding StageDisplacement Efficiency %
1SWSecondary54.39
2Hybrid Smart Brine 3
0.05 %   Al 2 O 3 + 0.2 %   ZnO +
6% acid
Tertiary11
Table 19. Summary of CF12.
Injection FluidFlooding StageDisplacement Efficiency %
1SWSecondary56.54
2Hybrid Smart Brine 1
0.05 %   SiO 2   +   0.05 %   Al 2 O 3 + 6% acid
Tertiary14.3
Publisher’s Note: MDPI stays neutral with regard to jurisdictional claims in published maps and institutional affiliations.

