
Global Warming Potential of New Gaseous Refrigerants Used in Chillers in HVAC Systems


Faculty of Environmental Engineering, Wrocław University of Science and Technology, 50377 Wrocław, Poland
*
Authors to whom correspondence should be addressed.
Energies 2022, 15(16), 5999; https://0-doi-org.brum.beds.ac.uk/10.3390/en15165999
Submission received: 15 July 2022
/
Revised: 16 August 2022
/
Accepted: 16 August 2022
/
Published: 18 August 2022
(This article belongs to the Special Issue Climate Change and Sustainable Energy Transition)
Abstract
:Due to the global warming and resulting problems, attention has been paid to greenhouse gases released into the atmosphere since the 1980s and 1990s. For this reason, the Montreal Protocol and the Kyoto Protocol have tightened regulations on the use of gaseous refrigerants in both HVAC systems and industrial refrigeration. Gradually, new generations of gaseous refrigerants, that theoretically have much less negative environmental impact than their predecessors, are introduced into the market. The key parameter describing environmental impact is the GWP index, which is most often defined on a time horizon of 100 years. The long-term use of new generations of gaseous refrigerants in HVAC systems reduces CO2 emissions into the atmosphere; however, given that new generation gases often have a short lifetime, it seems that the adopted assessment may not be applicable. The aim of the article was to show how emissions of CO2 equivalent to the atmosphere differs in the short and long time horizon. The article presents the results of calculations of equivalent CO2 emissions to the atmosphere caused by the operation of compressor cooling devices used in HVAC systems, where cooling is done with the use of water or a water-glycol solution. The analysis was carried out for 28 commonly used devices on the world market. The analyzed devices work with refrigerants: R513A, R454B, R290, R1234ze, R32, R134a, R410A. The equivalent emissions values for GWP 100 and GWP 20 were analyzed in relation to the unit power of the devices depends on refrigerant mass and number of fans. The study showed that in the case of new generation refrigerants with a very short lifetime, the use of GWP 100 indicators is misleading and does not fully reflect the effects of environmental impact, especially in the area of refrigeration equipment application. The article shows that the unit value of the cooling load related to the number of fans or the unit would be helpful in assessing the environmental impact of a cooling device.
1. Introduction
1.1. The Idea of Determining the Impact of Different Substances on the Climate
There has been a debate [1,2,3,4,5,6,7,8,9] about the impact of pollutants emitted into the atmosphere for decades about when changes in typical weather patterns began to be noticed. Substances that are able to retain the Sun’s energy within the Earth’s atmosphere as a result of their physical and chemical properties are called greenhouse gases. They have a direct impact on the temperature rise observed on the globe, as they absorb the infrared radiation emitted from our planet. Because it cannot be released into space, the resulting energy enters the atmosphere, causing its temperature to rise, which in turn increases the temperature of the Earth’s surface. Greenhouse gases include: water vapor, carbon dioxide (CO2), CFCs, refrigerant gases (HCFCs, HFCs), halons, methane (CH4), nitrous oxide (N2O), ozone (O3), and various industrial gases (e.g., perfluorocarbons (PFCs)). One of the primary pollutants that have a great impact on the increase in the temperature of the Earth’s surface and atmosphere are gaseous refrigerants [10,11,12,13,14,15,16].
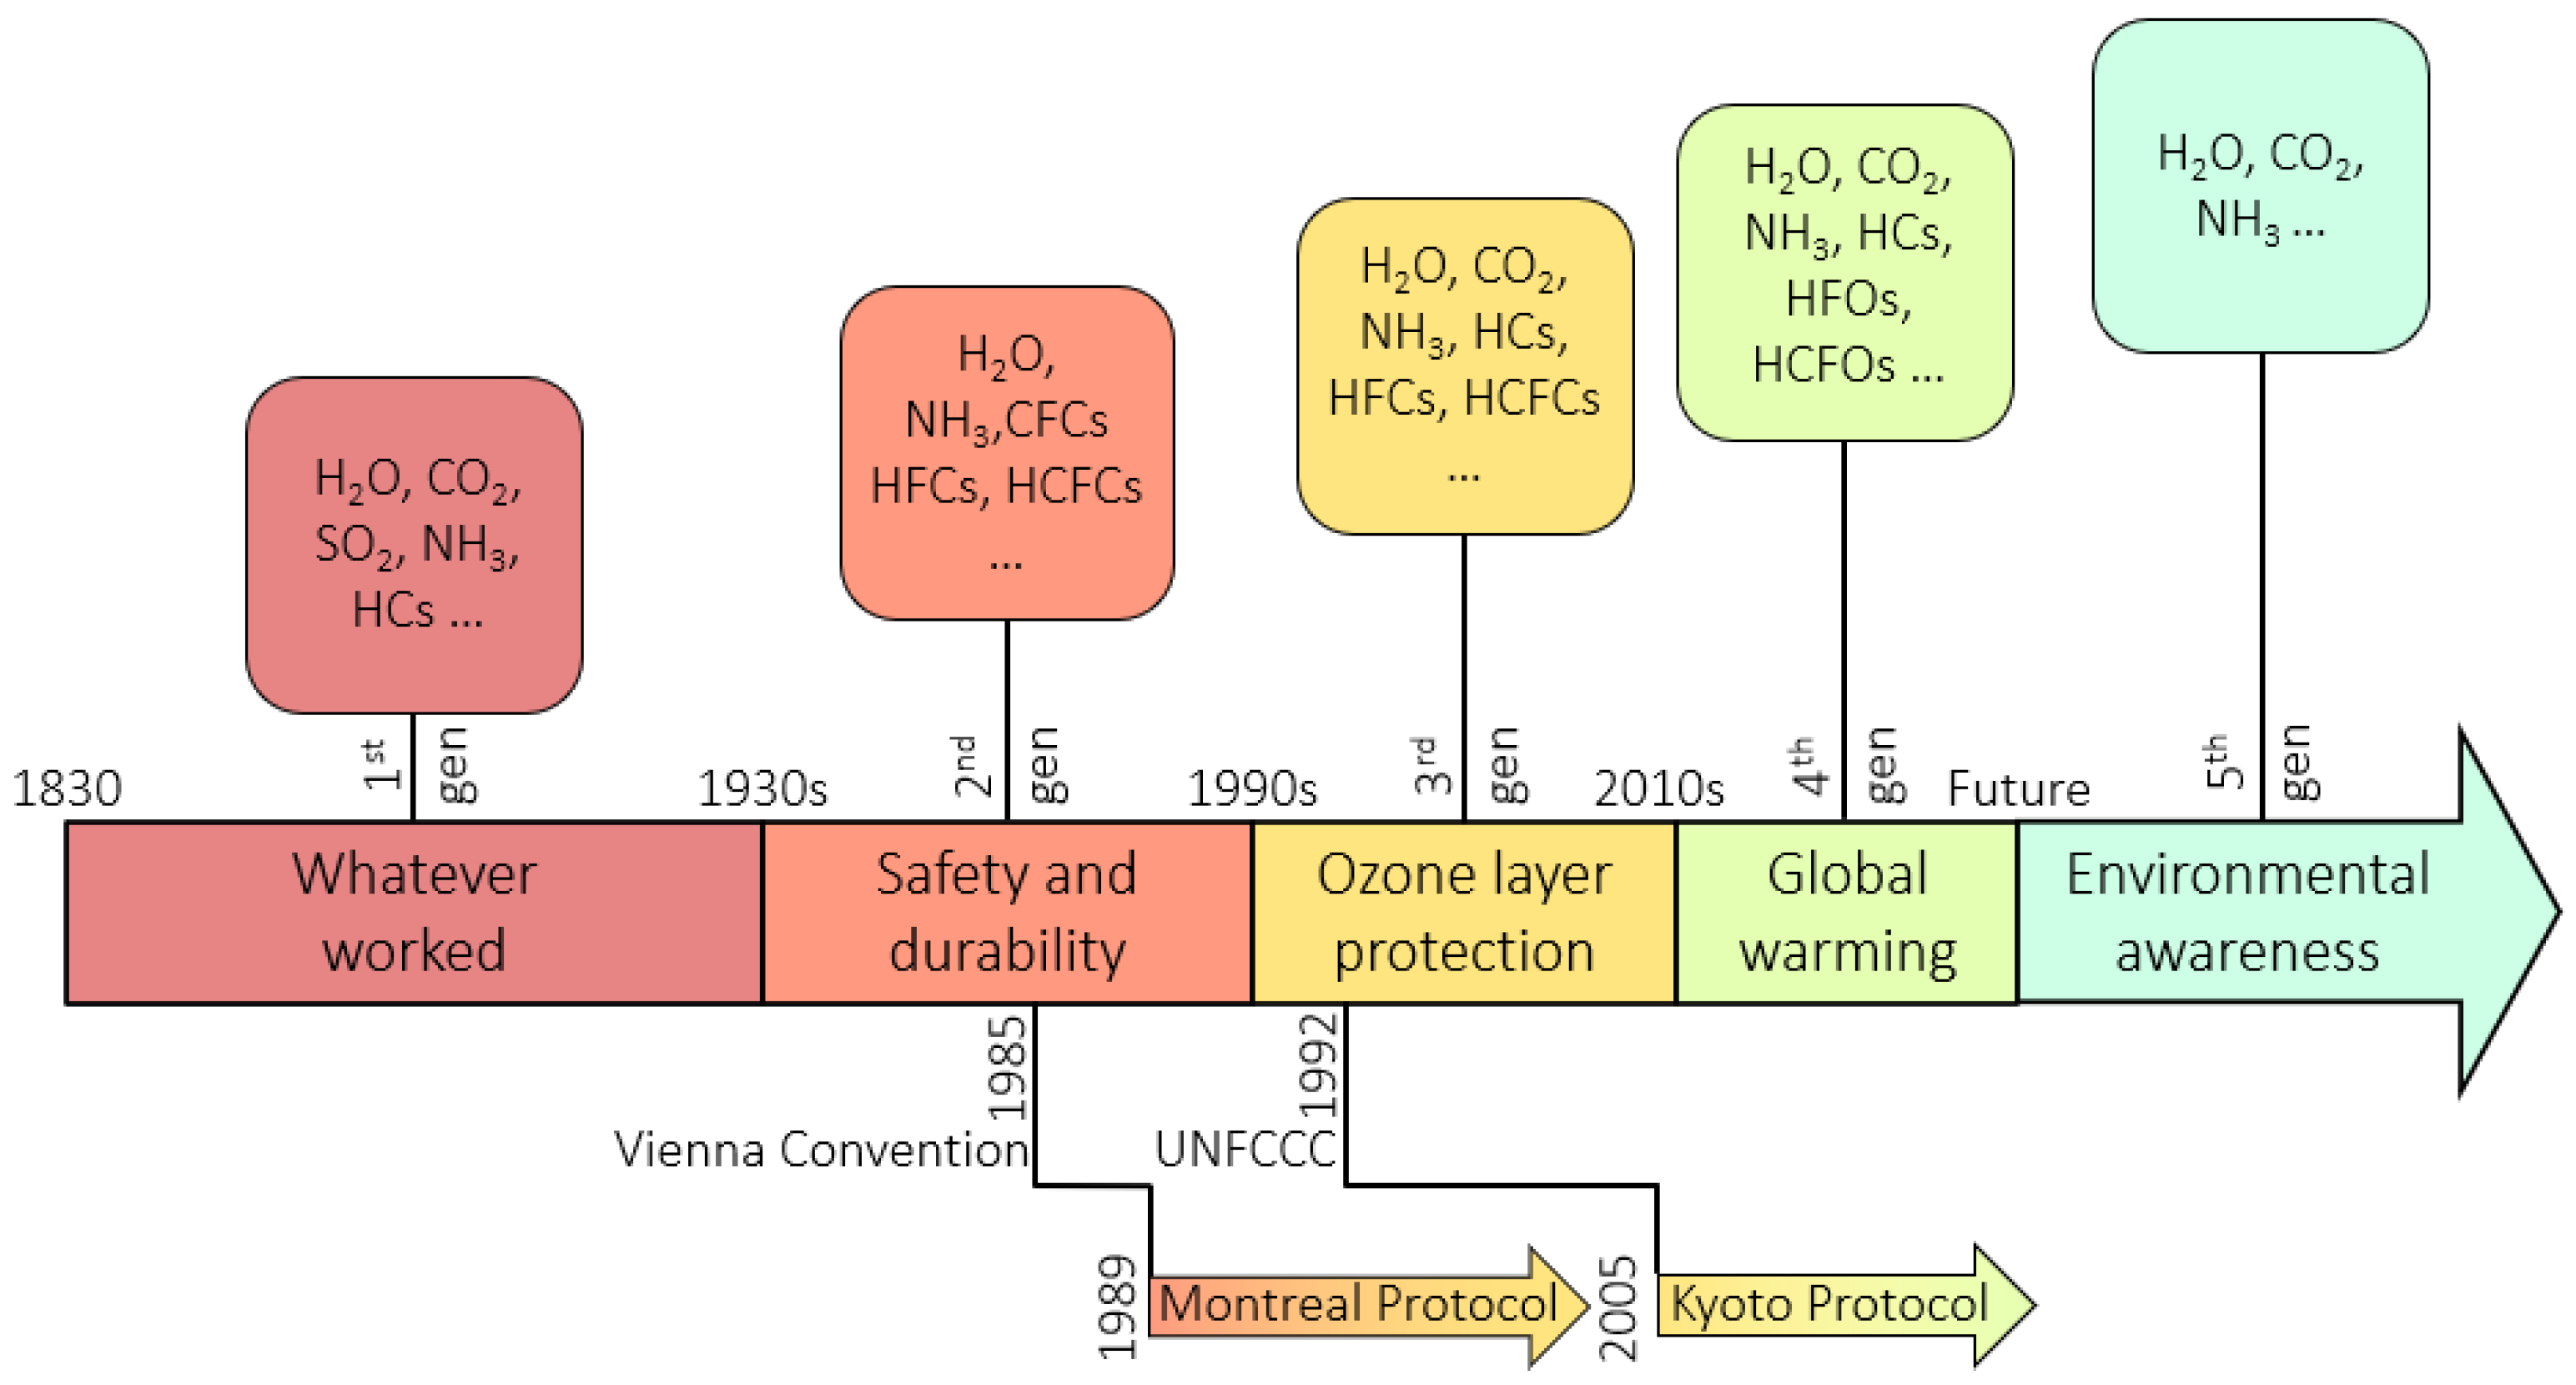
It was not until the 1970s that an attempt was made to determine to what extent greenhouse gases of different chemical compositions affected the temperature of the atmosphere and thus the Earth’s surface. The use of refrigerants with the potential to destroy the ozone layer (OL) and create the greenhouse effect has been done in the nineteenth century [17]. Figure 1 shows the development of refrigerants in a historical context. Refrigerants are illustrated here with reference to their successive generations from 1 to 5. The introduction of each successive generation of refrigerants is related to a reduction in CO2 equivalent emissions into the atmosphere.
The growing awareness of environmental issues has led the World Meteorological Organization (WMO) to conduct an international assessment of the OL on a global scale [12]. As a result, the need arose to organize measures to protect the Earth by protecting the OL. It was established in 1985 in the Vienna Convention, which dealt with the issue of protecting the OL. The Convention was signed by 28 countries at the time and currently has 198 members [18]. The convention resulted in the Montreal Protocol on substances that contribute to the so-called depletion of the OL, which entered into force in 1989. According to the idea of protecting the OL, 8 substances with a high Ozone Depletion Potential (ODP) were controlled [14]. The gaseous refrigerants were then divided into two groups: chlorofluorocarbons (group I) and halons (group II). This breakdown is shown in Table 1. This was also the time when the next third generation of refrigerants appeared, for which the ODP index takes the value of 0 (group III—refrigerants analyzed in the paper).
The second study that indicated that anthropogenic factors affect not only the OL but also climate change was a report published in 1990 by the Intergovernmental Panel on Climate Change (IPCC) [10]. The purpose of the report was to assess the negative impact of human activities on the climate [10,20]. In response to the results of this assessment, the United Nations Framework Convention on Climate Change was adopted in 1992 [16]. The most important protocol of this convention became the Kyoto Protocol, negotiated in 1997, which introduced specific provisions on, among other things, the emission of greenhouse gases, including gaseous refrigerants, into the atmosphere [15]. This protocol did not enter into force until 2005 and with it the next fourth generation of refrigerants is presented in Figure 1. Article 5 of the Kyoto Protocol uses the Global Warming Potential (GWP) value introduced in 1990 by the IPCC. The use of the GWP index was to allow the determination of the impact of various greenhouse gases on the climate in relation to the equivalent of carbon dioxide accumulated in the atmosphere [10,21].
1.2. Indicators for Assessing the Impact of Different Refrigerants on Climate
One of the most popular indicators of environmental pollutants is the Global Warming Potential (GWP). The use of the GWP index was to allow determination of the impact of various greenhouse gases on the climate in relation to the equivalent of carbon dioxide accumulated in the atmosphere [10,21]. The GWP index describes the change in the quotient of the global mean surface temperature for a given time horizon (TH) after a number of years caused by the emission of the substance related to the reference substance. The introduction of the GWP index was innovative and interesting because it takes into account both global mean Radiative Forcing (RF), a so-called disturbance in the radiation balance of the Earth’s climate system [22], and the length of time that a substance remains in the atmosphere [10]. It has become the default measure for converting the emissions of different gases into an equivalent emission value of a reference gas (usually CO2) into the atmosphere [22]. The following periods have been established by default as TH: 500, 100 or 20 years [22]. The GWP index relating to the equivalent emission of CO2 in the atmosphere was introduced in 1990 and was already considered in terms of climate policy on a 100-year time horizon, which was written as GWP 100 [23]. The IPCC [10] indicated that long time horizons are adequate for evaluating sea level rise, while for terrestrial areas, where the effects of changes in energy emissions from the atmosphere are much faster, short time horizons are much more important. For gaseous refrigerants with a long atmospheric life, it was reasonable to consider GWP 100 [21]. Meanwhile, with the introduction to the market of gaseous refrigerants with a short life (VSL) in the atmosphere (with a life of less than a month [11]), the use of GWP 100 is no longer justified.
This long time period (TH = 100) ignores the fact that it has an effect on RF disturbance at short intervals [24], especially at the local scale. Effective mixing with air at a global level for refrigerants of short lifetime is impossible, and thus their distribution in the troposphere is uneven. As a result, one needs to consider the real three-dimensional distribution of refrigerants in the atmosphere at the local level. Combining this knowledge with the infrared absorption value for a given refrigerant makes it possible to calculate the GWP in the local area. These data depend, among other things, on the composition of the atmosphere in the emission area at a given time [21] and are not popularized and easily accessible, making it difficult to standardize them on a global scale. However, it is certain that global GWP values for short-lived refrigerants will be significantly lower compared to those with long-life refrigerants, because, despite the local impact, this index has a global reference. Therefore, the article attempts to determine the actual differences in these values of CO2 equivalent emissions for cooling devices filled with stock refrigerants.
Due to the need to assess the risk of global warming and the more commonly used substances with a very short life, a new approach to GWP was presented in 2018 [25]. Crucial is that in 2016 [7] and in 2019 [26] it was mentioned that the long-term GWP index does not relate cumulative CO2 emissions to date with the current rate of emission of short-lived climate pollutants (SLCPs). Allen [7] proposed a new, broader GWP index, designated as GWP*. It relates the CO2 emissions accumulated so far to the current stream of refrigerants with a short lifetime. Studies [25,26,27] confirmed that the new idea of GWP* is better on assessing the impact on the climate in both long- and short-term modes. Therefore, it is suitable to show the effect of greenhouse gas emissions on radiative forcing and temperature for long- and short-lived refrigerants in the atmosphere [23,27]. This also applies to the refrigerants used in compressor systems. Potentially, the GWP* values will be presented in the Sixth IPCC Report of 2022, which already exists but cannot be cited and distributed. The part that is possible to cite does not contain any GWP* values, thus no further consideration of GWP* is performed. Nevertheless, the article compares the values of CO2 equivalent emissions for GWP 100 and GWP 20.
Climate reports and scientific articles include alternative indicators of the impact of greenhouse gases on climate. Shortly after the GWP, in 1991, the Total Equivalent Warming Impact (TEWI) index was proposed [28]. It is a measure of the direct and indirect effects of the device during operation and later during storage and processing [29]. It also includes fossil fuels energy used during device operation. The TEWI is dedicated for installations or systems and depends on the GWP index value, the annual percentage rate of leakage from the system, the lifetime of the system and the energy consumed during the year, equivalent of emission CO2 (g CO2 kWh−1) and system uptime [30]. Due to the fact that the TEWI index does not take into account the emissions related to the production of refrigerants and refrigeration equipment, in 1999, the United Nations Environment Program (UNEP) presented the Life Cycle Climate Performance Index (LCCP) [31]. It takes both direct and indirect emissions during the life cycle of the device and its components into account.
In summary, the GWP index is used to evaluate the environmental impact of e.g., refrigerants used in HVAC devices in a global meaning. To determine the environmental impact of refrigeration systems or installations, the TEWI and LCCP indicators are more applicable. This is due to considering not only the influence of the refrigerant emitted to the atmosphere, but also, e.g., energy consumption in the working cycle [30,32,33]. No indicators take the environmental impact caused by the use of various materials in the production process, e.g., metals, into account.
1.3. Refrigerants Used in Air Conditioning and Space Cooling
The increasing quality of life has forced the widespread use of air conditioning systems in both Europe and the United States, in which cold air or cold surfaces in Thermally Activated Building Systems (TABS) are obtained through the operation of direct or indirect cooling devices. The common denominator for these devices, installations, and systems is always a gaseous refrigerant, which have a crucial influence on the climate of the Earth. They are one of the basic factors that contribute to climate change. In the case of single-component refrigerants, the entire mass of substances undergoes the same processes and cycles of changes in the atmosphere. In the case of multicomponent mixtures, the behavior of each component in the atmosphere should be considered individually.
The introduction of substitutes is, of course, aimed at reducing the negative impact of emissions on the climate. It should be related to an environmentally and energetically rational and justified decision. As understood by the widely used GWP 100, the introduced substitutes significantly reduce threats to the human environment. When switching from R410A with a GWP 100 of 2100 to R454B with a GWP 100 of 490, the decrease in GWP 100 is 1610. For comparison, the change of the R134a refrigerant with GWP 100 = 1360 to R513A, for which GWP 100 = 600, the decrease is 760. Although this is a good direction of change in terms of climate policy, the opposite is true for the transformation processes of the constituent substances in the atmosphere. For example, as mentioned, by changing refrigerant R134a to R513A, both components (R134a and R1234yf) are decomposed, among others, into Trifluoroacetic acid (TFA). After decomposition in the atmosphere, up to 92–100% of R1234yf mass emissions will become TFA, and for R134a this percentage is only 7–20% of mass [29]. In the case of R1234ze, the formation of TFA does not occur [34].
There are a number of replacements for old generation refrigerants (because of high GWP and ODP). There is a visible tendency to change refrigerants in the A1 class to other refrigerants that are more dangerous in terms of flammability. This is directly related to the shorter decay time in the atmosphere. It allows to obtain a lower GWP index, but at the same time promotes easier decomposition in contact with ignition sources [29,35]. Table 2 presents the substitutes for selected refrigerants commonly used in air conditioning systems and compressor refrigeration devices with their safety classes. For those substances, all calculations were done in this article (excluding R123, R22, R404A and R507). Table 3 presents the method of classification of refrigerants in terms of flammability and toxicity according to ASHRAE Standard 34 [36] and ISO 817:2014 [37].
1.4. Which GWP Index Should Be Used to Assess the Real Impact on Local and Global Environment
As can be seen from the above considerations, it seemed that a better alternative to the 100-year period is the 20-year period, for which GWP 20 is considered [40]. It should be noted that the use of shorter time periods results in an increase of GWP value of gases with a short lifetime in the atmosphere [41] and in a decrease of safety classes. For gases with a long atmospheric lifetime, such a treatment reduces the GWP value and provides greater toxic safety. This is closely related to the uniformity of the distribution of the concentration of a given refrigerant in a narrow emission area and a wide spreading area. This observation is widely used in the refrigeration equipment and plant market. Unfortunately, there is no clear indication of which time horizon GWP index should be used and for what purposes [42,43]. This choice should depend on the negative short-term or long-term effects on the environment that are to be shown. GWP 20 is suitable for use in understanding climate policy, where the timescale covers the next decades, not centuries. Using GWP 20 together with GWP 100 can give a broader view of the environmental impact of greenhouse gases (especially short-lived ones) [44] with regard to short-term and long-term effects. It seems that a balance should be struck with regard to both short-term and long-term impact.
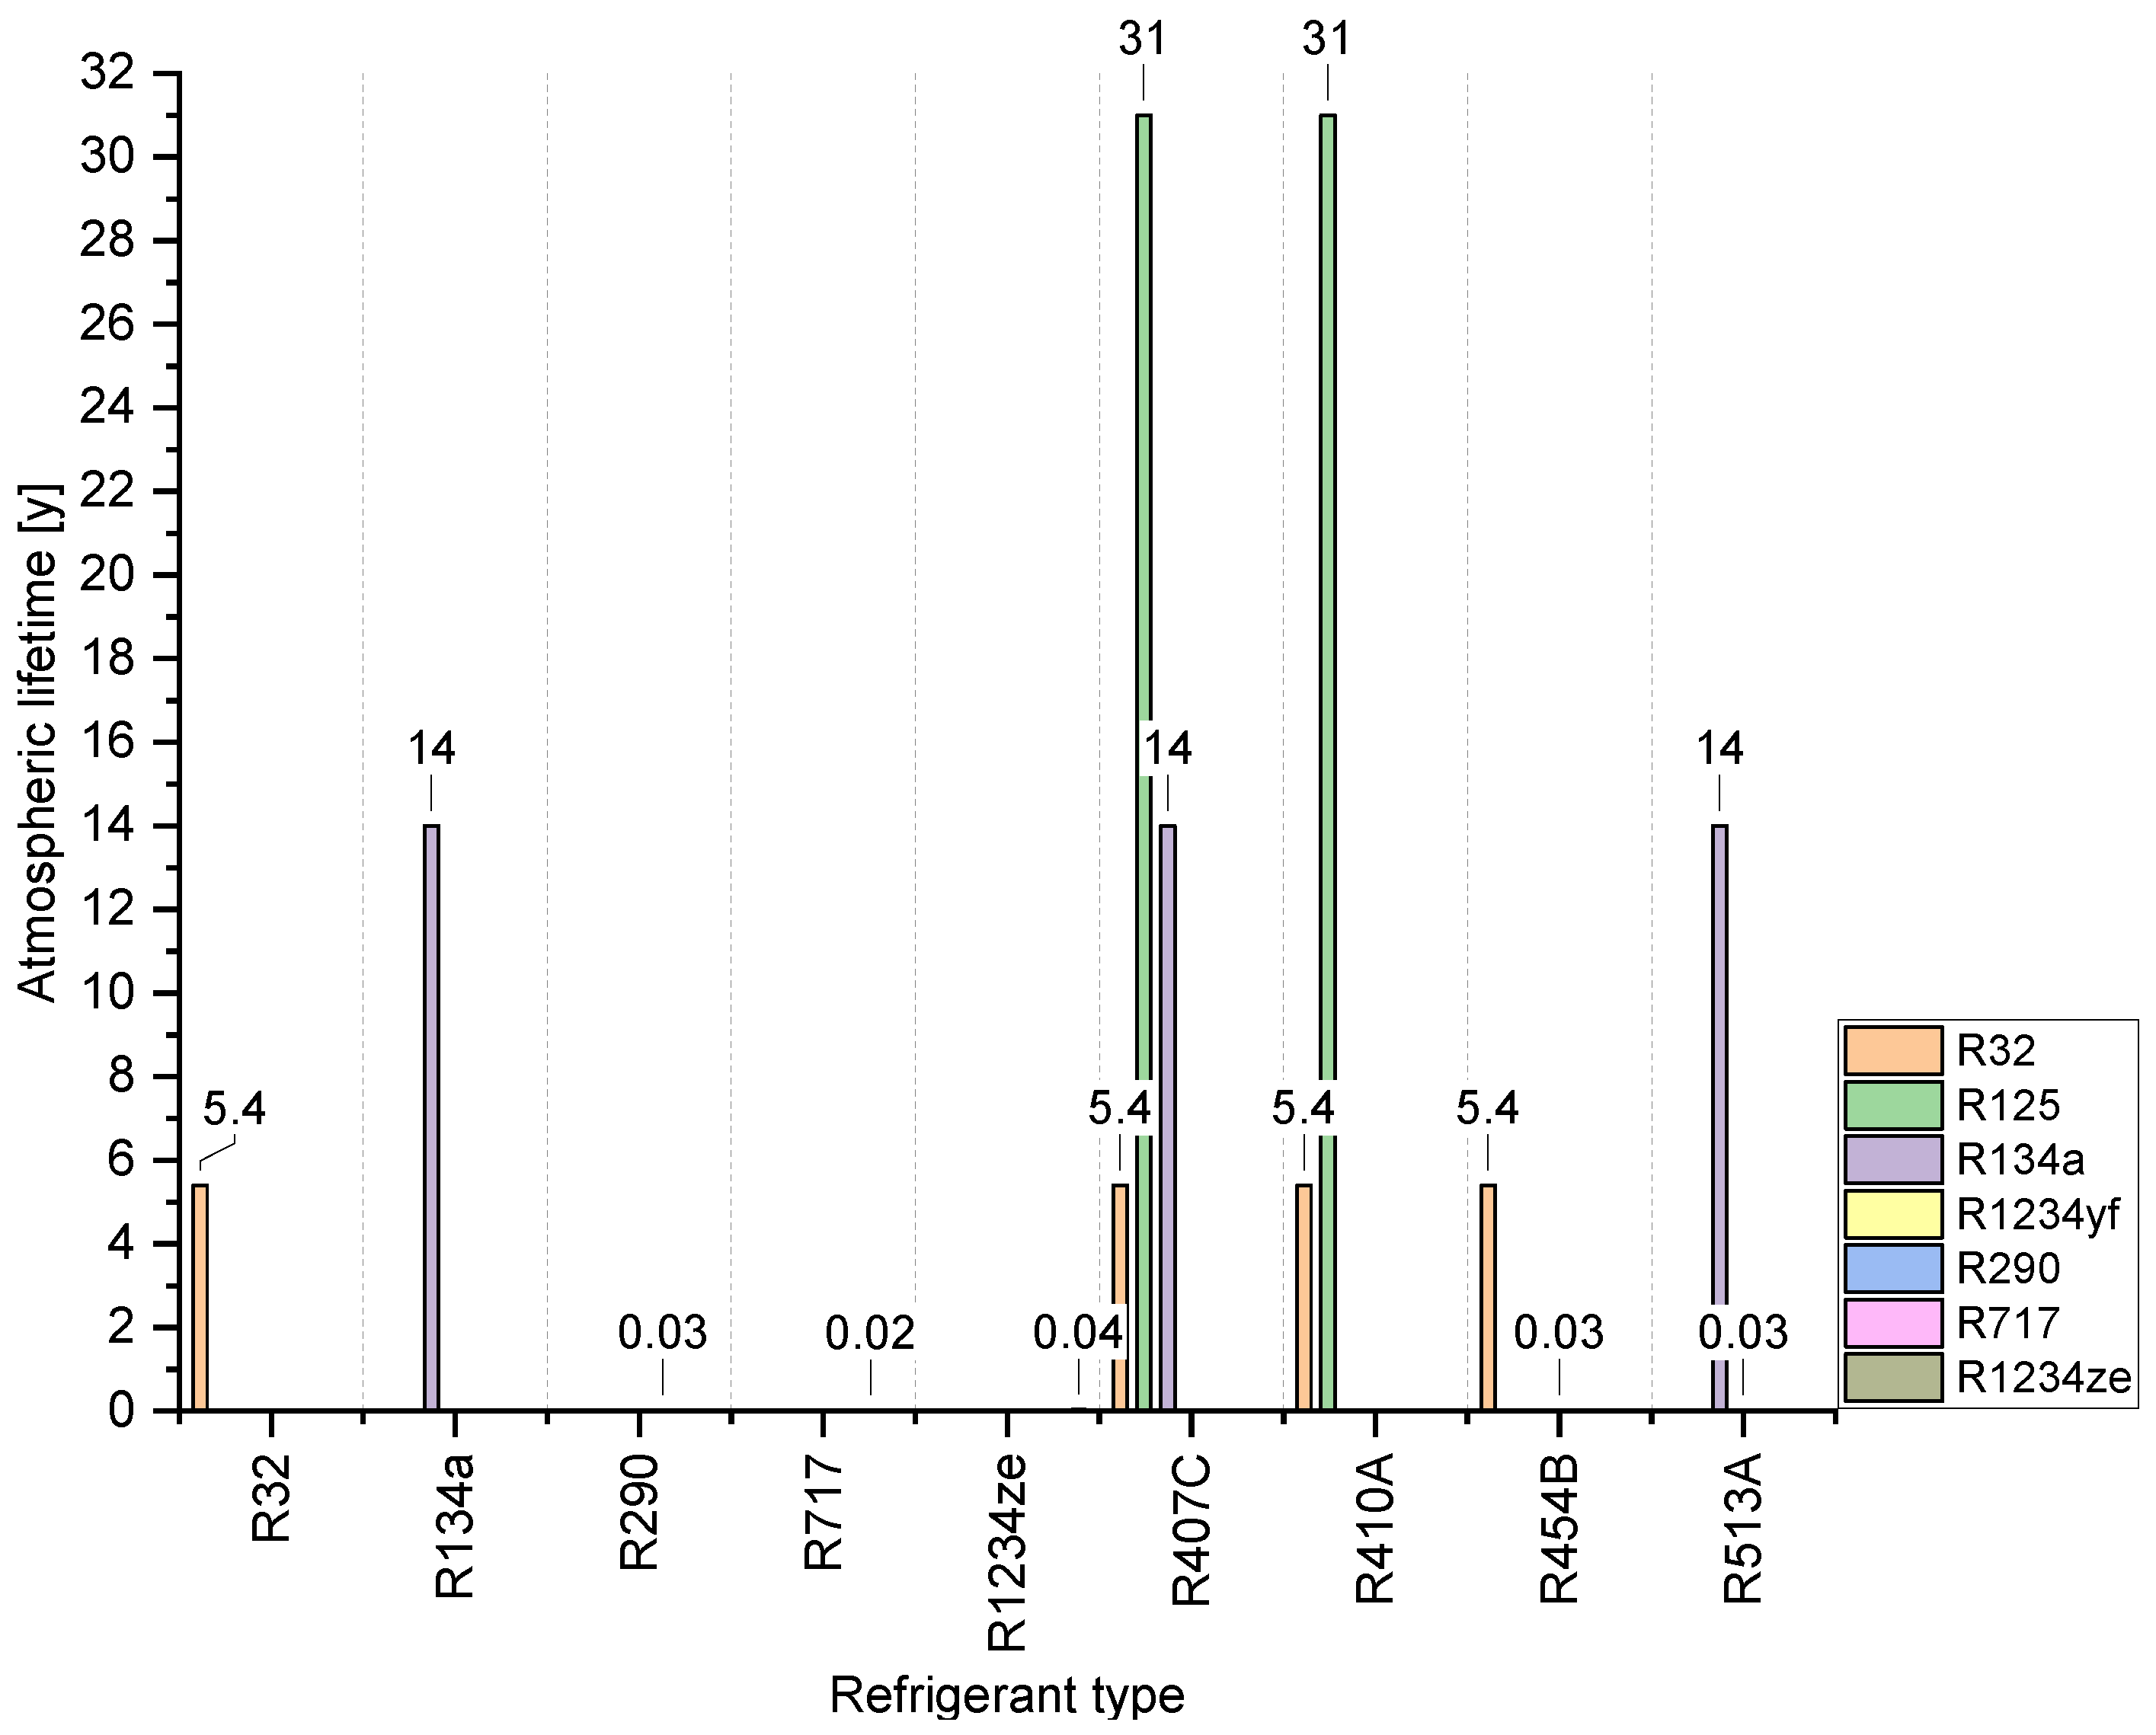
To illustrate differences in the lifetime of each refrigerant and to emphasize where the discussion on their local accumulation in the atmosphere came from, in Figure 2, the lifetime of selected gaseous refrigerants are shown.
The graph shows how significantly different lifetimes of the next generations of gaseous refrigerants are. The longest-lived refrigerant is R125 (component R407C and R410A) with an atmospheric life of 31 years. For the shortest time, live R717 (less than 7 days) and R1234yf (10.5 days). Therefore, considering the GWP 100 index for refrigerants that remain in the atmosphere for several or several dozen years has logical justifications. However, for refrigerants that are degraded in the atmosphere in several days or even hours, such a long time horizon is no longer relevant.
Despite all criticism and discussions around the GWP index [1,2,3,4,5,6,7,8,9] it is continuously used in the field of climate policy [45] and in trade. The assumed time horizon is crucial, as it is always considered over a 100-year time horizon. Recent studies indicate uncertainties in the GWP 100 value of the order of ±50% for methane and short-lived gases in the atmosphere and ±40% for non-CO2 gases with a longer lifetime (in particular, this applies to gases with a lifetime of more than 20 years) [46]. Despite these discrepancies, it remains the primary tool for reporting emissions within the meaning of the United Nations Framework Convention on Climate Change.
One must remember that 100 year time horizon affects at least one generation, thus values of the GWP index are mainly based on calculations and simulations instead of experimental data. Taking the rapid growth of cooling systems in warm or moderate climate and illegal refrigerant markets into account, an examination of the GWP index is needed in terms of short and long time horizons.
The literature and policy review in the article present recent data on the GWP index and its assumptions that are crucial for understanding the implementation of the GWP index and which are not widely presented in the literature. Results based on theoretical review reveal that, along with placing new gaseous refrigerants with VSL on the market, it requires revision and update of the approach to emissions reports.
1.5. The Basic Framework of Work
In this paper, we present a significant difference in GWP 100 and GWP 20 values and further influence on actual CO2 equivalent emissions to the atmosphere by the implementation of GWP 20/GWP 100 index. Actual masses of CO2 equivalent emissions have been calculated with reference to data of compressor cooling devices used in HVAC systems. Both short and long time horizons have been considered. The article reveals major disproportions while reporting CO2 equivalent emissions for 100 and 20 year time horizons for chosen compressor refrigeration units used in Europe and the United States. The purpose of this article is to indicate whether the selection of a cooling device operating with a specific refrigerant has similar consequences for the climate. If not, on what those differences depend. Due to the above, in the article the equivalent of kg of CO2 emission into the atmosphere was determined using the GWP 100 and GWP 20 indexes. No research has been done in the field of GWP index values related to the load of refrigerants in cooling devices. Therefore, in the paper, a broad description of the GWP index itself was provided to fully present the dependent variables and assumptions. Along with the calculation of the CO2 equivalent and the establishment of the GWP 20/ GWP 100 index, the paper represents a new approach to climate policy regulations in the context of new refrigerants that are implemented in the market.
2. Materials and Methods
To assess the impact of various refrigeration devices on the climatic conditions in terms of the new refrigerants introduced, 50 devices (commonly used in HVAC systems) were selected from 12 leading companies. The list of devices is presented in Table 4. Eventually, devices working with seven different refrigerants were accepted for analysis: R513A, R454B, R290, R1234ze, R32, R134a, R410A. This choice was made because the refrigerants under consideration are currently in use in existing devices, belong to generations 3–6, i.e., those that were created by the climate policy referred to in this paper (Figure 1). The determining factor was also the availability and completeness of the cooling device catalog data. Due to the different method of presenting data in catalogs, as well as technological differences related to the design of devices, and above all heat exchangers, all the considered data are presented in relation to the unit power of the cooling module (kW/n).
The unit power of the cooling module (kW/n) where the reference unit was an exchanger cooled with a single fan was calculated from the formula:
where Qc is the cooling power; kW, n is the number of fans.
The unit power of the refrigerant fill weight (kW/kg) was calculated from the formula:
where Qc is the cooling power; kW, m is the refrigerant charge; kg.
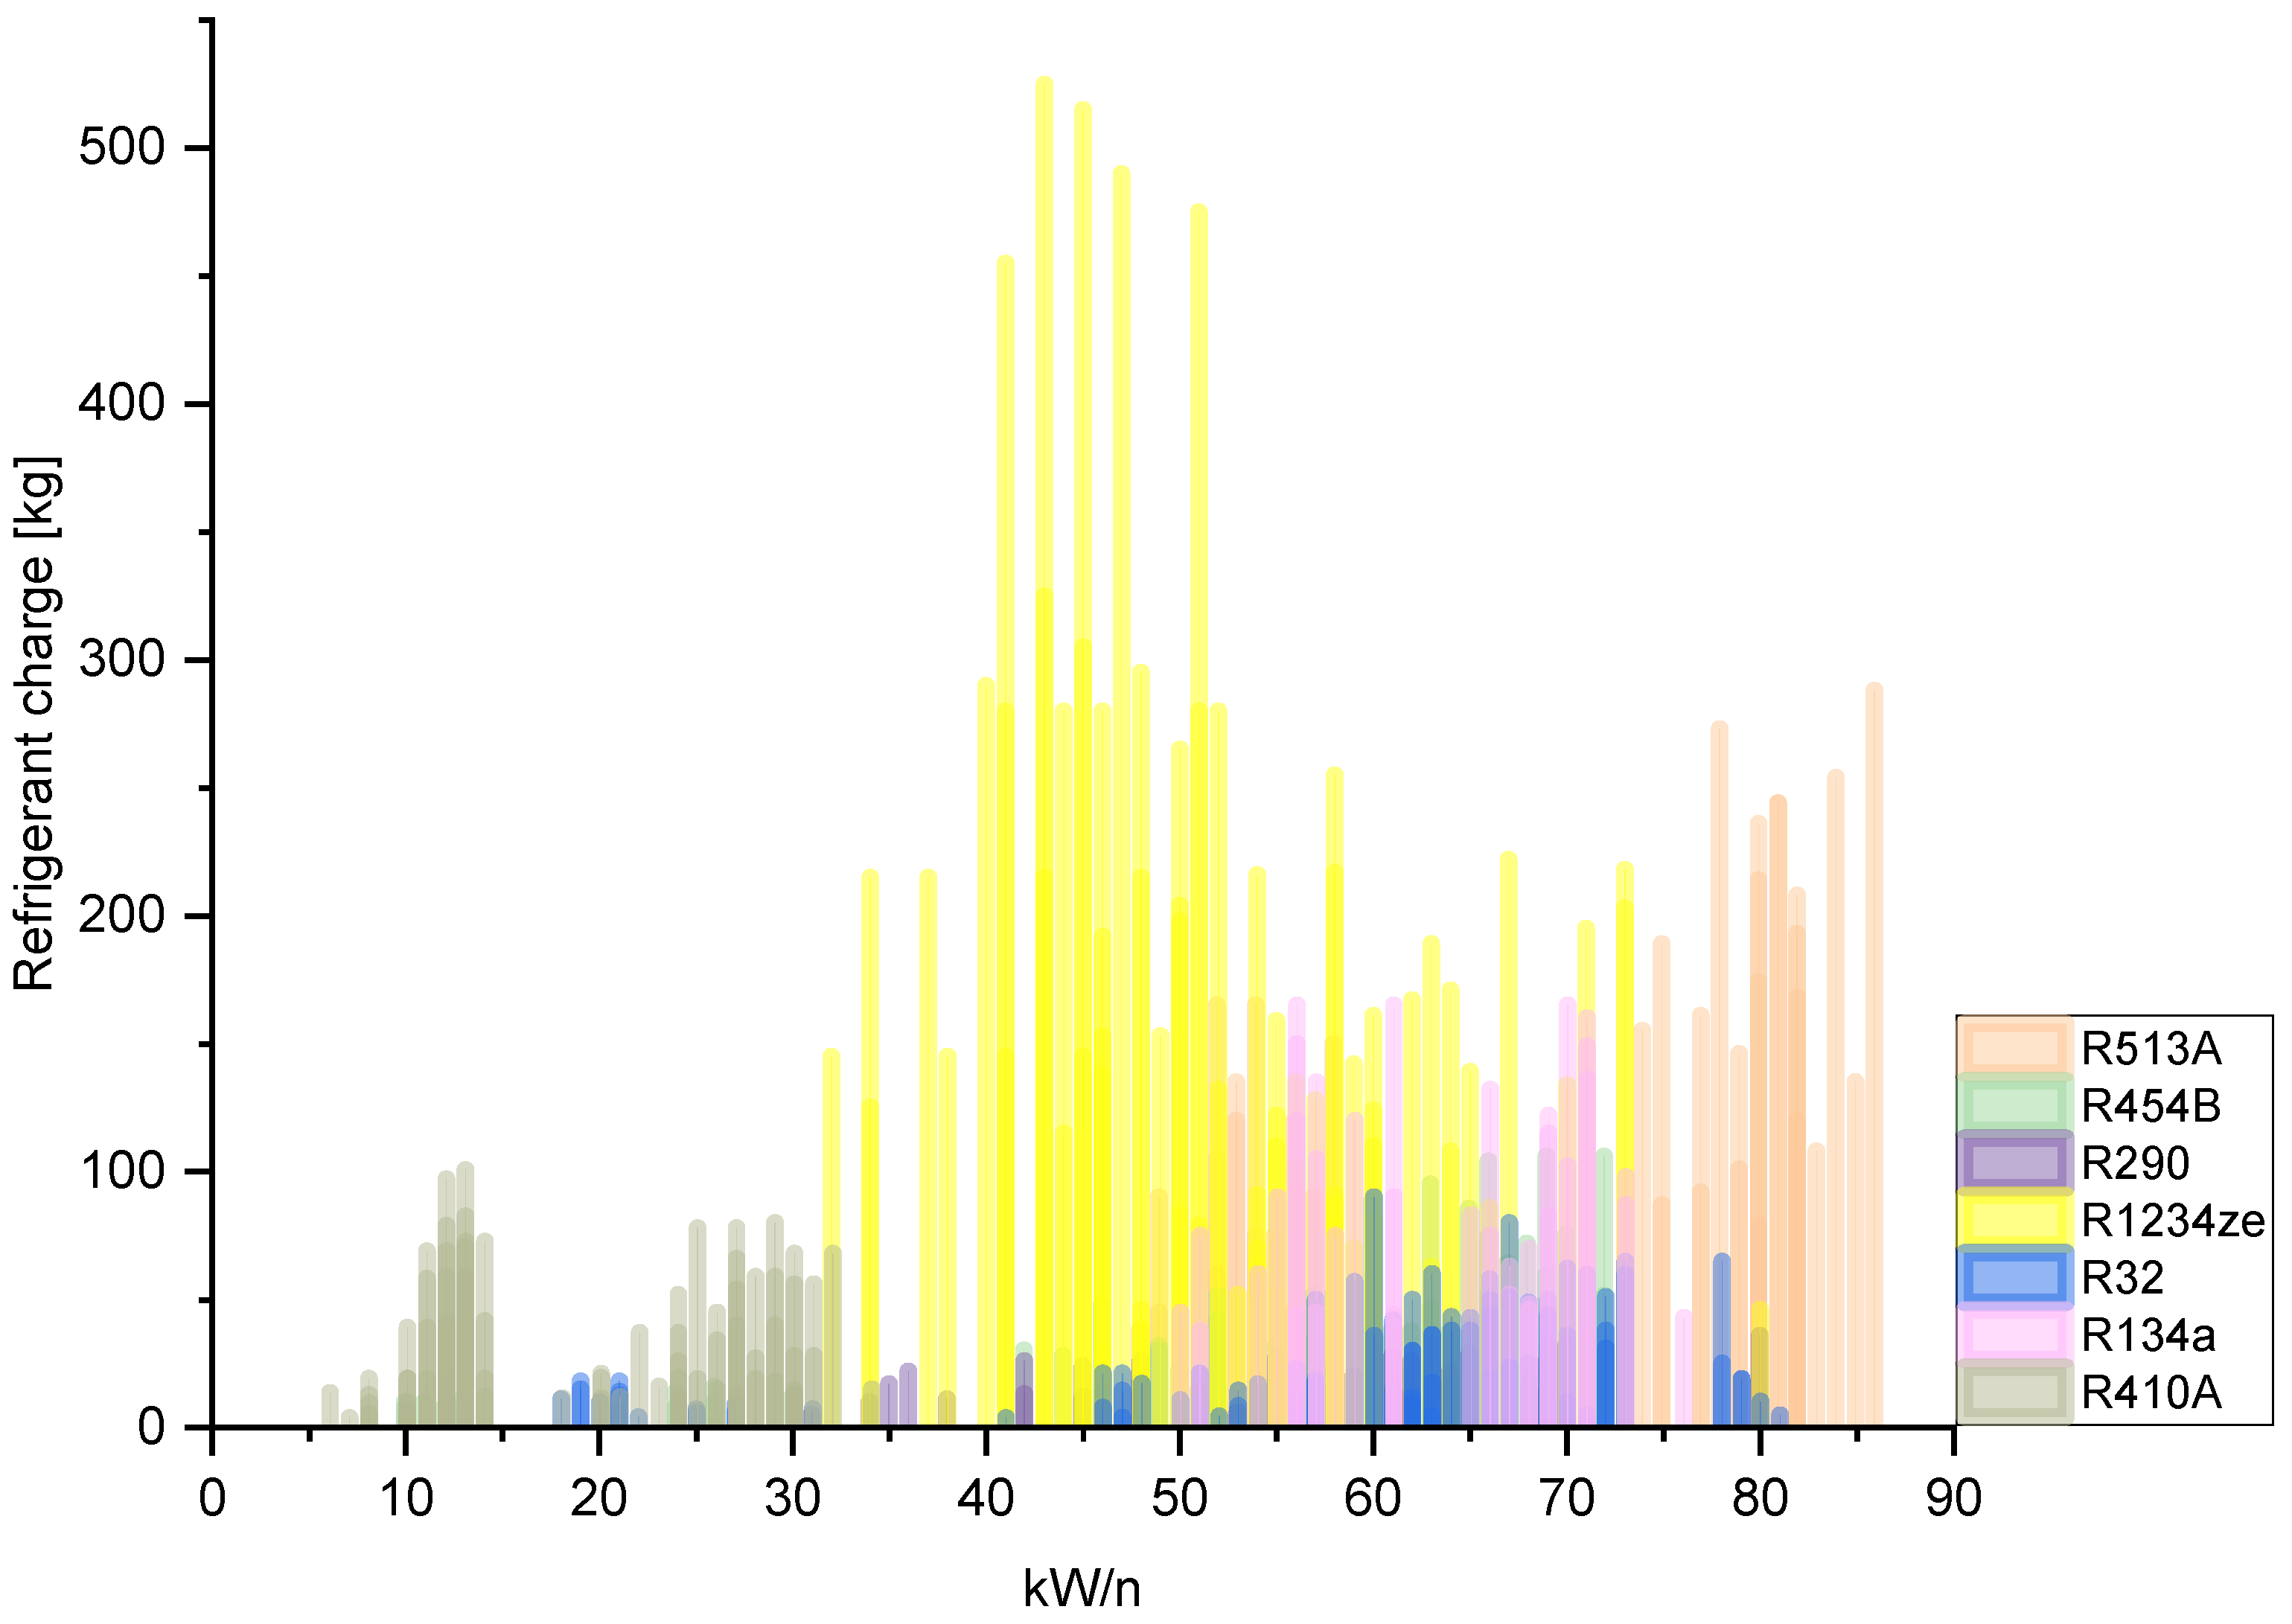
All devices considered in the analysis below are equipped with the Microchannel Heat Exchanger (MCHX). Due to the lack of detailed data and a much smaller number of devices with lamella exchangers and a small power range, they were not included in the analysis. Figure 3 shows the refrigeration unit capacity for the selected gaseous refrigerants as a function of the unit cooling capacity for the seven selected refrigerants.
In the range of 5–30 kW/n, devices filled with refrigerant 410A and R32 dominate. In turn, from 40 kW/n to more than 85 kW/n, the R1234ze, R134a, R454B, R513A, and R290 refrigerants dominate. The largest charge (load greater than 100 kg) is found in devices with R513A, R1234ze, and R134a, with R1234ze dominating with loads exceeding 500 kg. Charges not exceeding 100 kg refer to the refrigerants R454B, R32, R290, and R410A. It is worth paying attention to the small loads (<50 kg) of refrigerants throughout the range of the kW/n ratio for R290.
For Q/mr ratio, the highest values are for R290 (6.5–18 kW/kg), R410A (5–13 kW/kg) and R134a (5–11 kW/kg). As a result, higher charges for similar power are required for other investigated refrigerants. The lowest ratios are observed for R513A and R32.
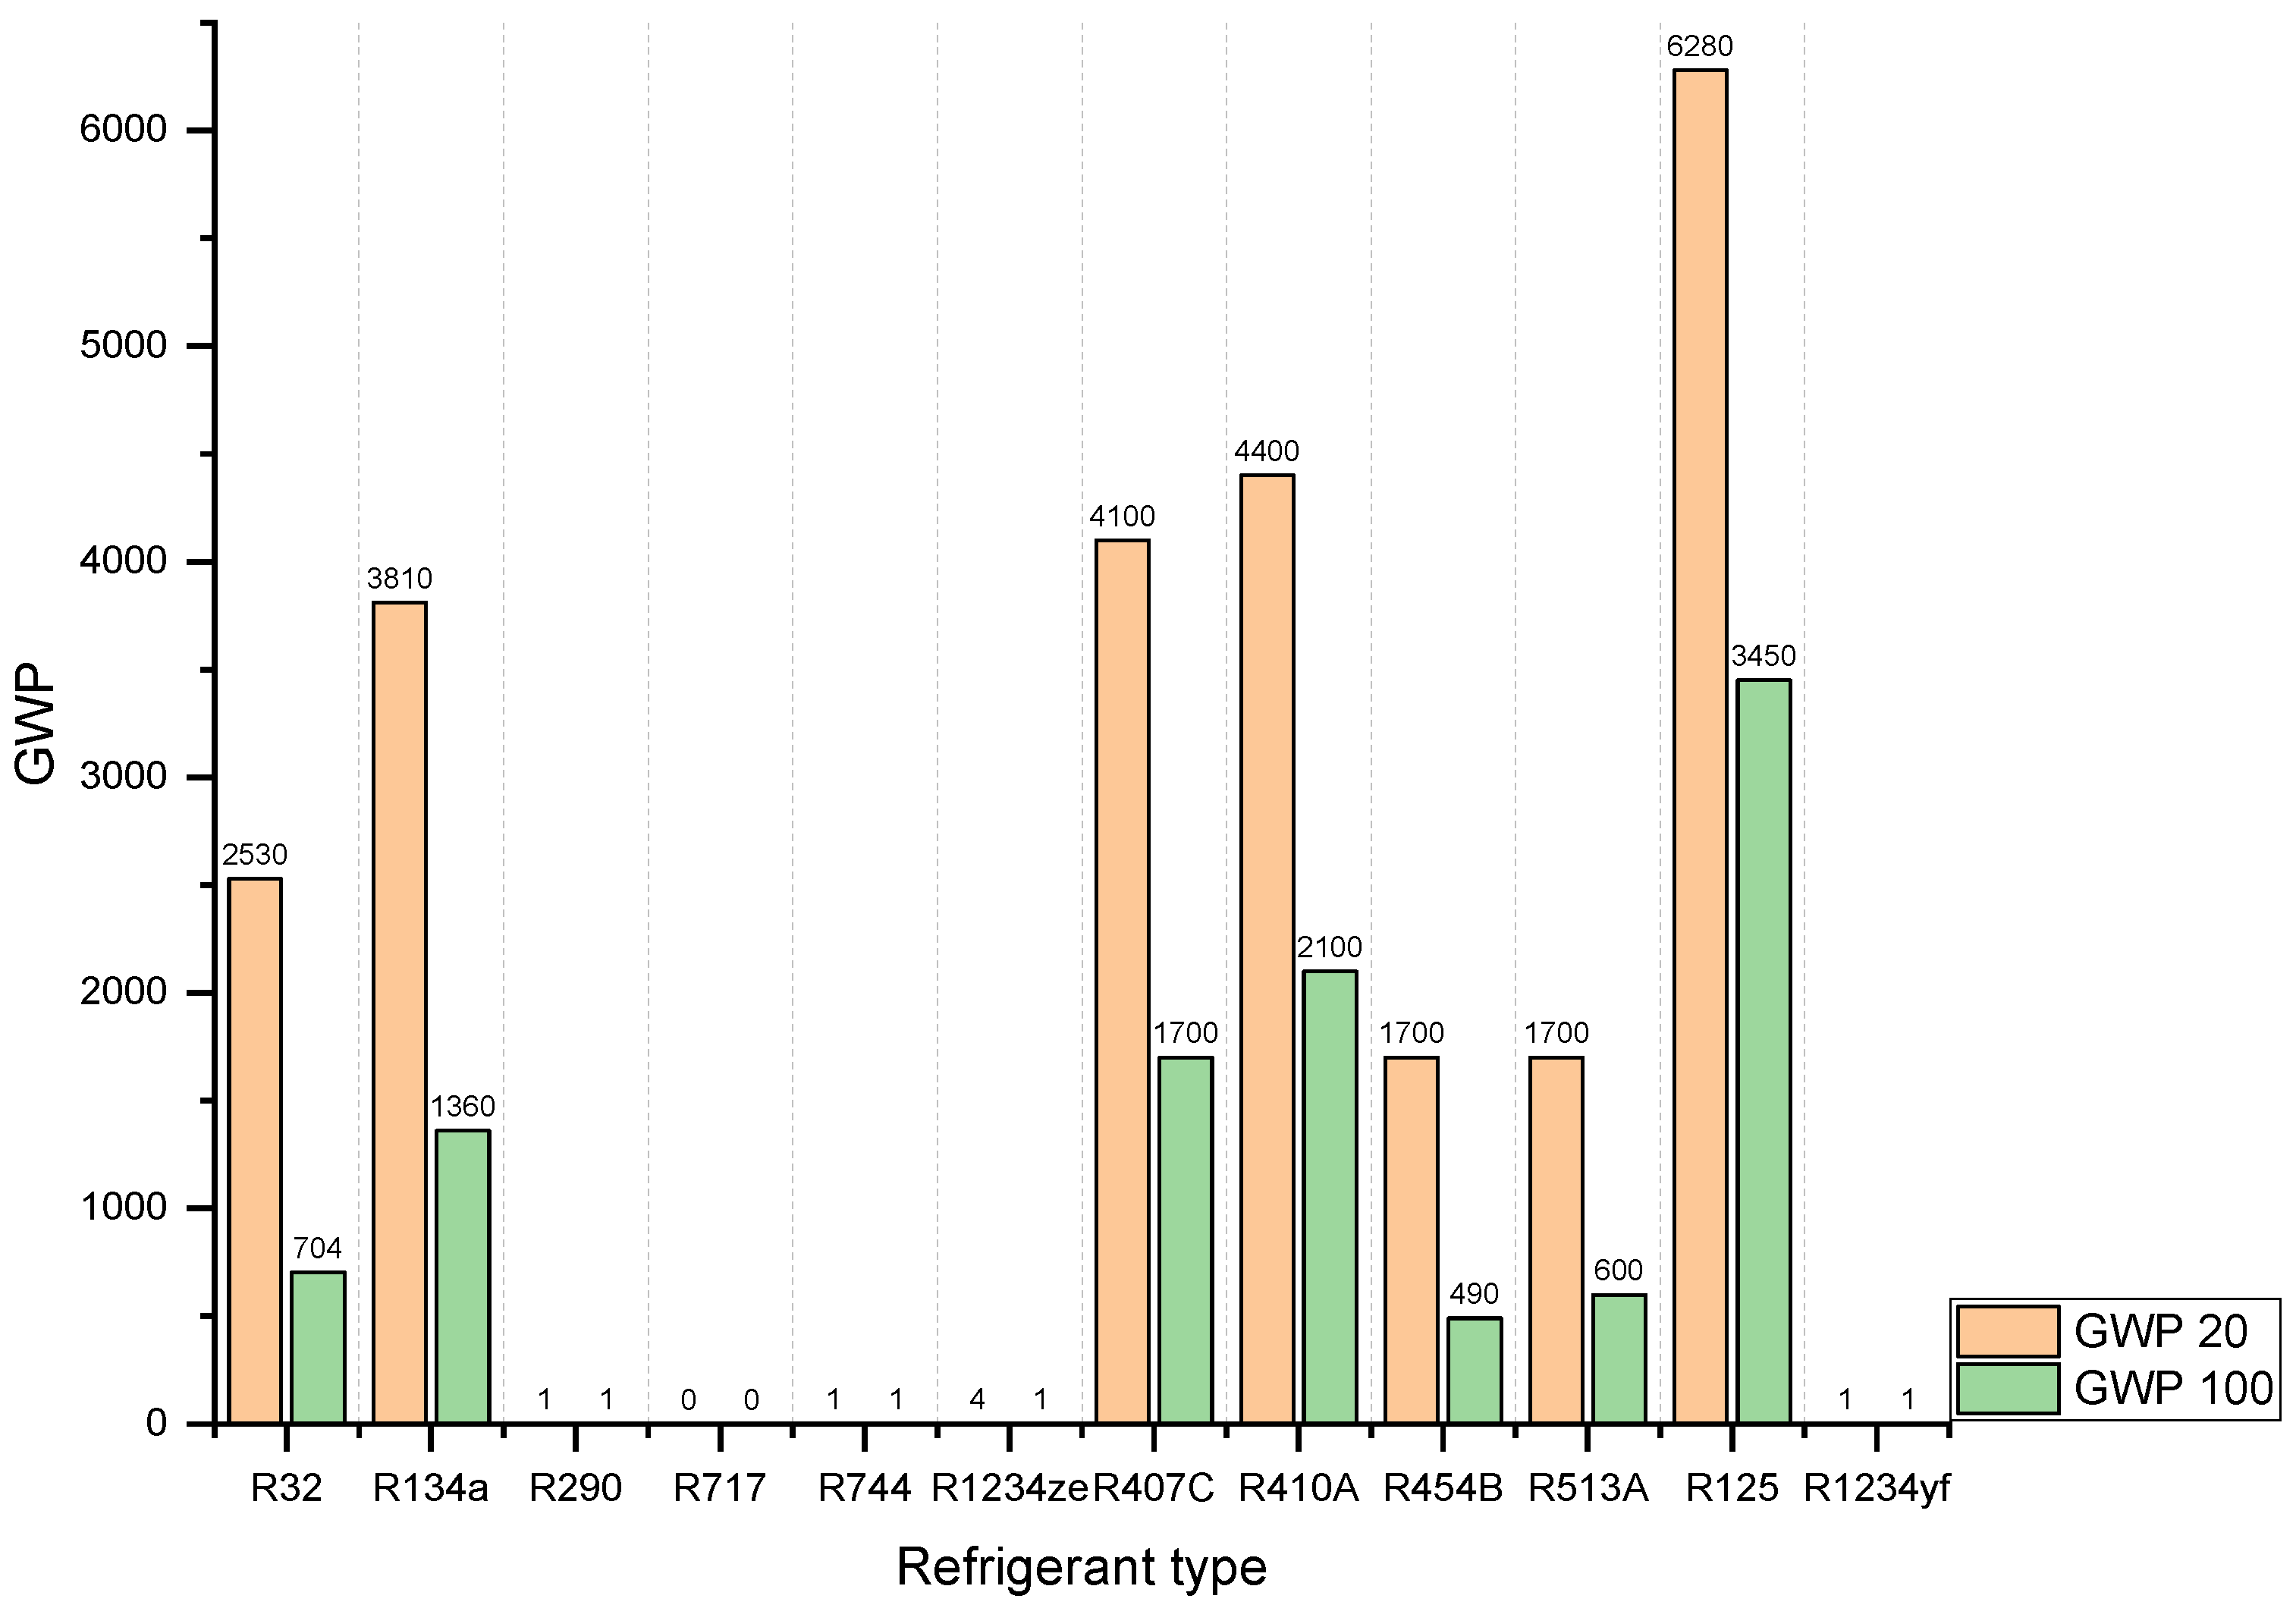
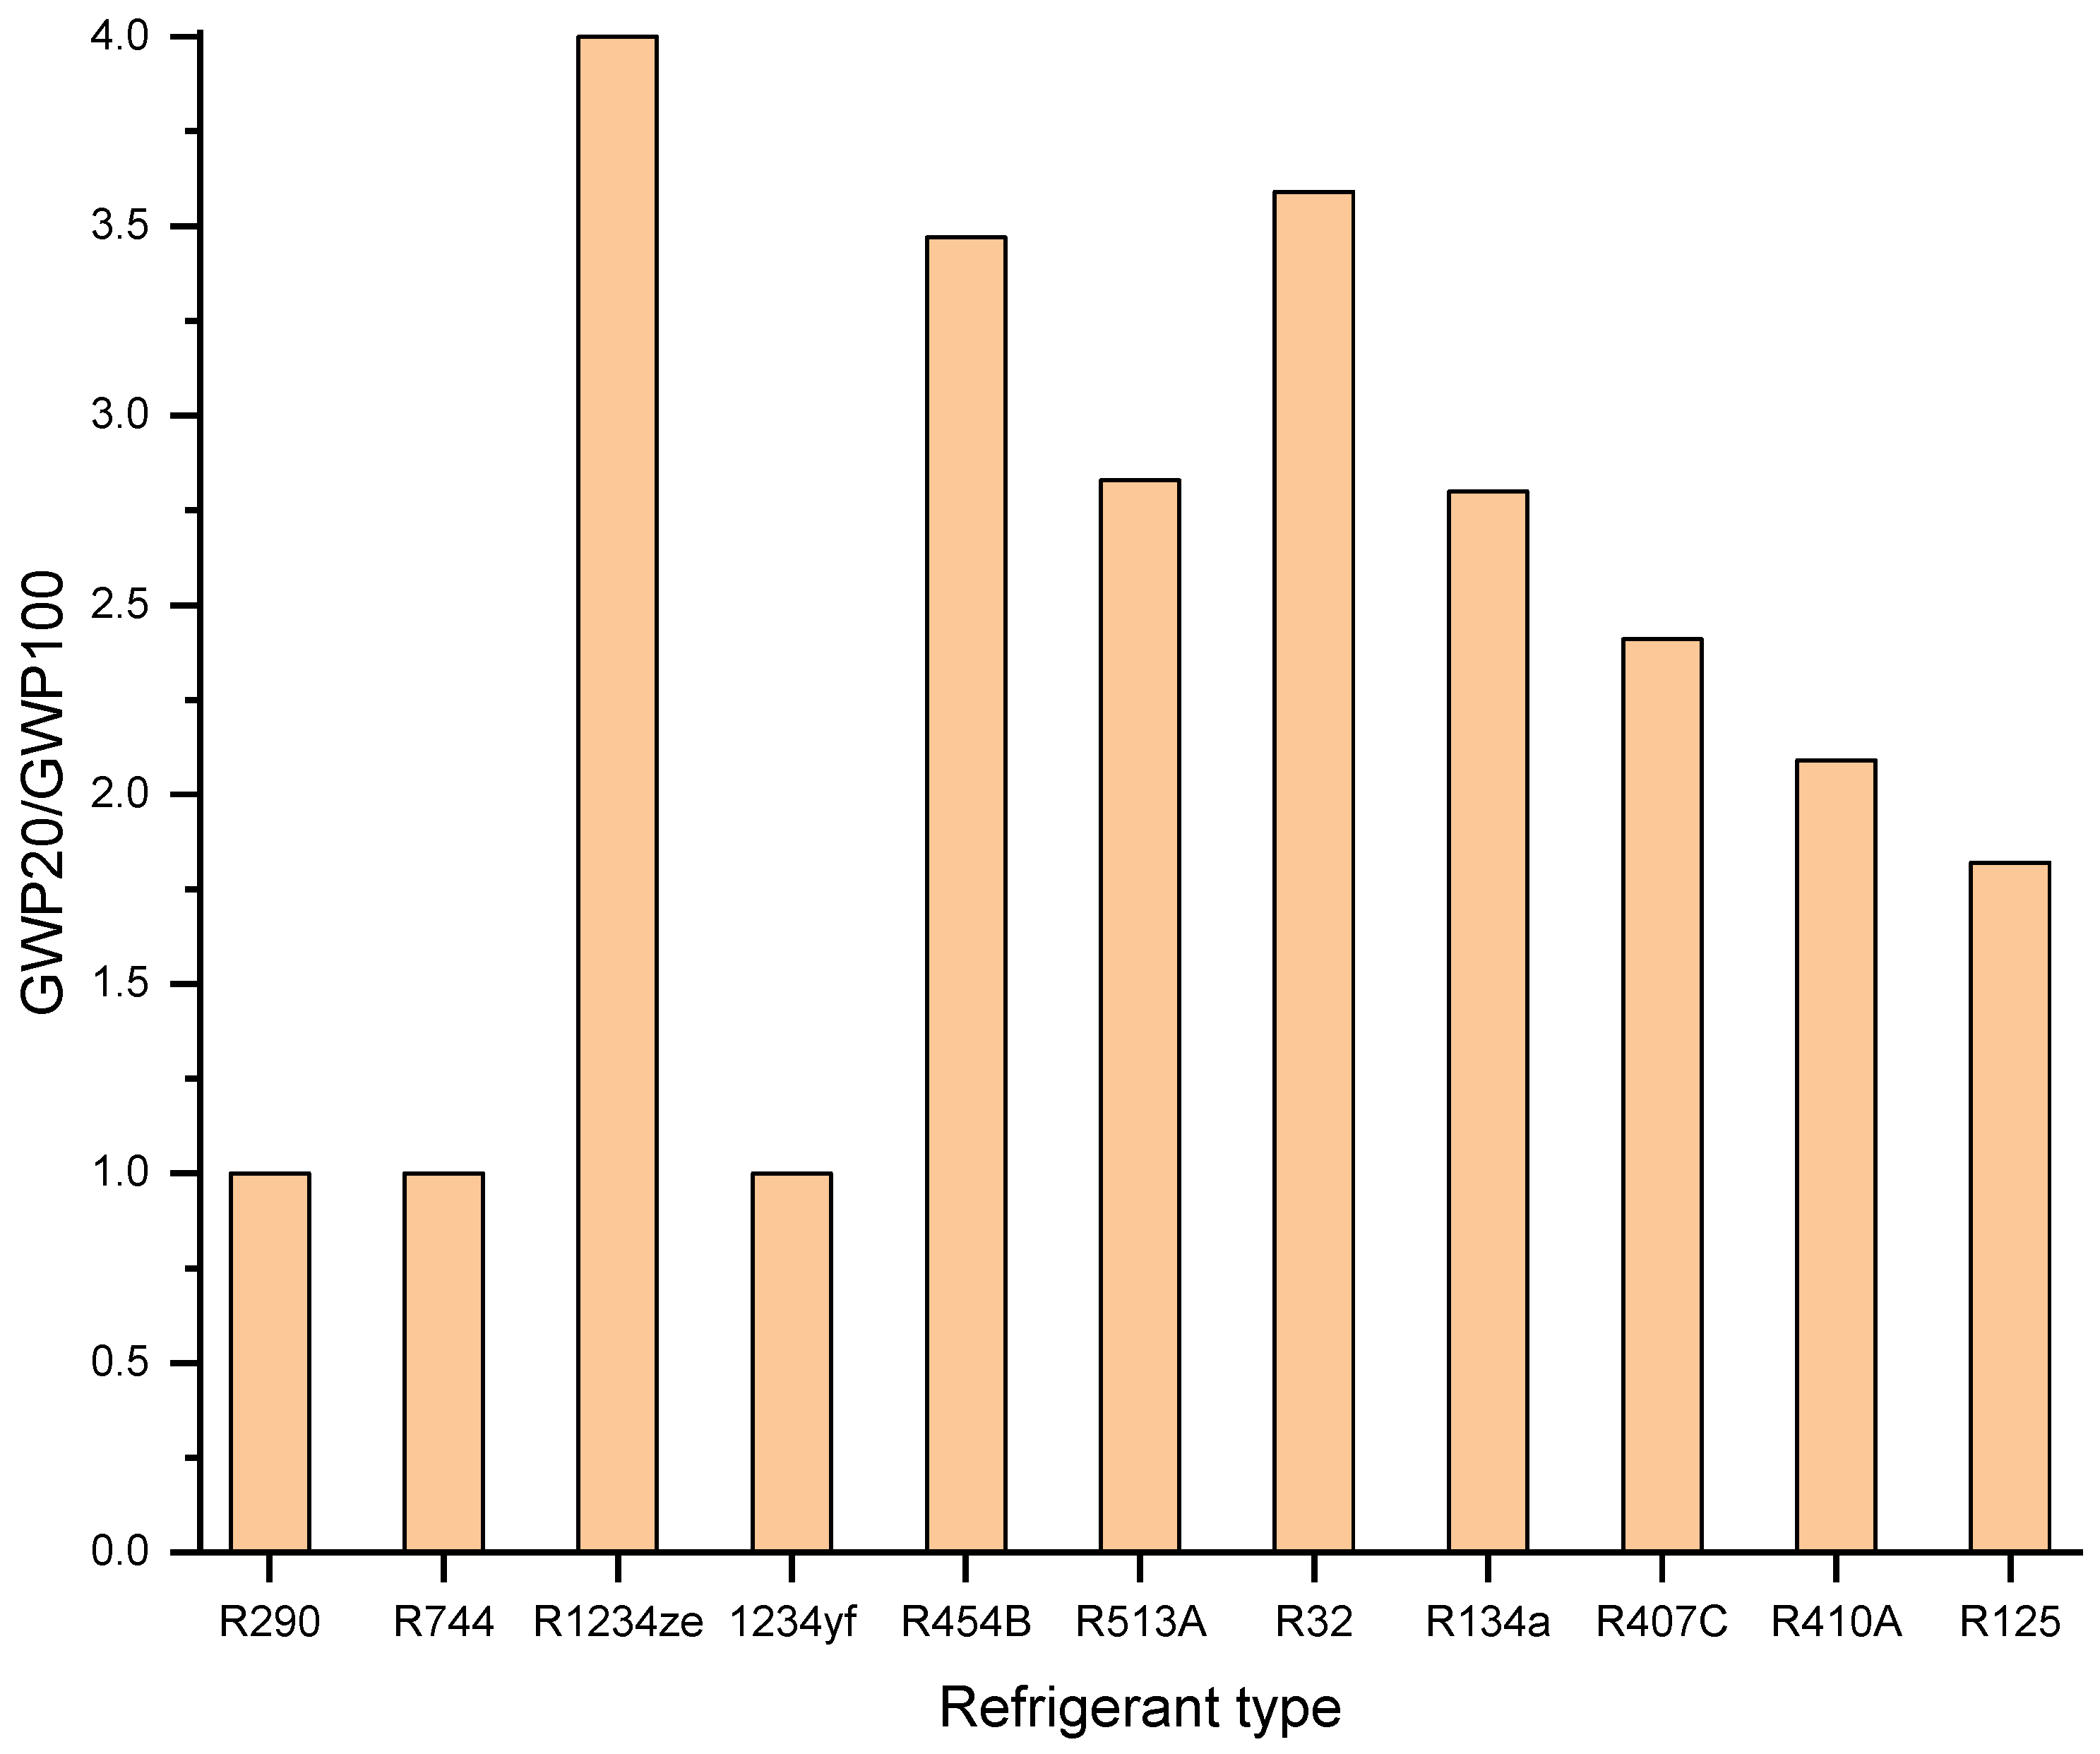
To calculate CO2 equivalent emissions for refrigerants, it is necessary to know the GWP index for each refrigerant and for a specific time horizon. Therefore, in Figure 4, GWP 20 and GWP 100 index values for selected refrigerants and their components are presented.
The CO2 emission equivalent for each homogeneous refrigerant was calculated based on the formula:
where: i—time horizon (20 and 100 years); GWPi—GWP index specified for the 20 and 100-year time horizon, m—refrigerant charge, kg;
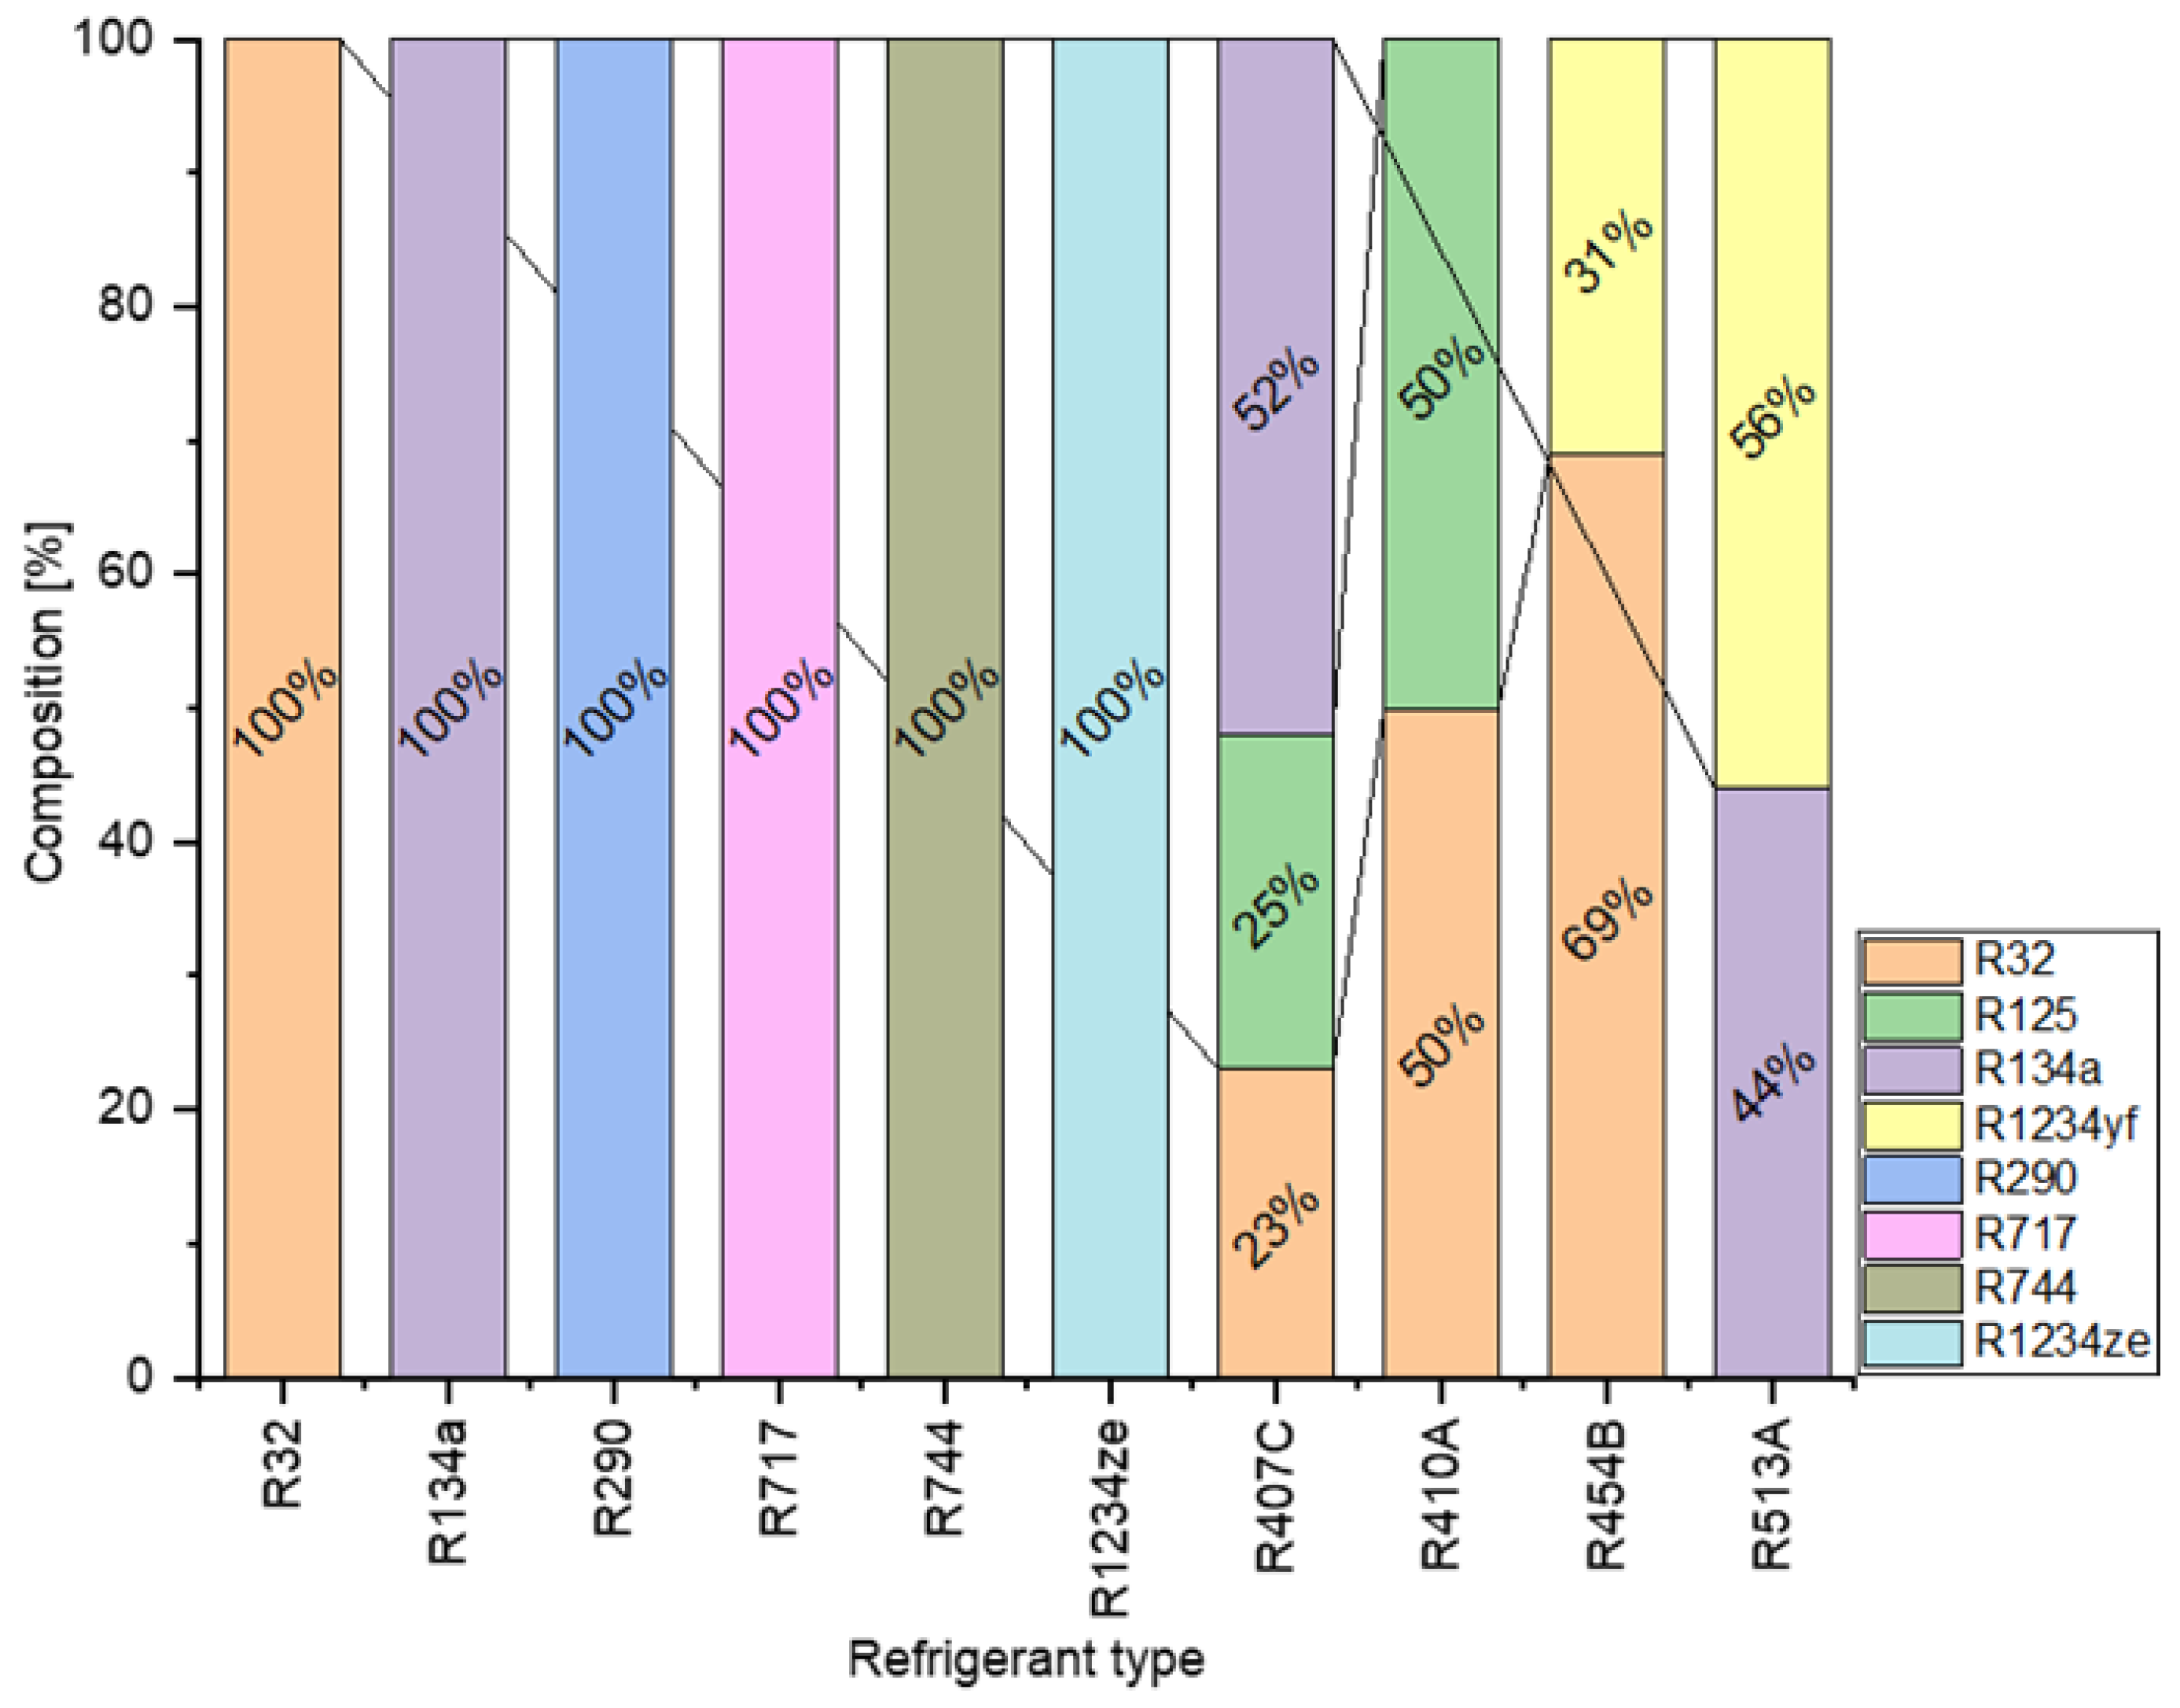
As shown in Figure 4, the GWP index is defined for a homogeneous substance. Currently, heterogeneous substances are usually used as substitutes for the so-called old generation. Composition of selected refrigerants is shown in Figure 5. For example, R513A refrigerant is a substitute for installations using R134a refrigerant. The R513A refrigerant still contains R134a (44%) while the dopant is R1234yf (56%). Replacement for R410A is currently R454B. The R410A refrigerant included R32 (50%) and R125 (50%). The R454B refrigerant contains more R32 (69%), while R1234yf (31%) was introduced instead of R125.
Therefore, the equivalent of CO2 emission must be determined for each component separately. For nonhomogeneous refrigerants, the CO2 equivalent emission value was determined based on the percentage composition and the GWP value for the homogeneous substance. The calculations were made based on the following formula:
where: —GWP index defined for the time horizon i and the homogeneous substance j; mj—loading mass of a homogeneous substance, kg; j—defined homogeneous refrigerant, i—time horizon.
3. Results and Discussion
The article compares the value of equivalent CO2 emissions for two time horizons of 100 and 20 years. The relative values of GWP 20 with respect to the values of GWP 100 are shown in Table 5 and Figure 6.
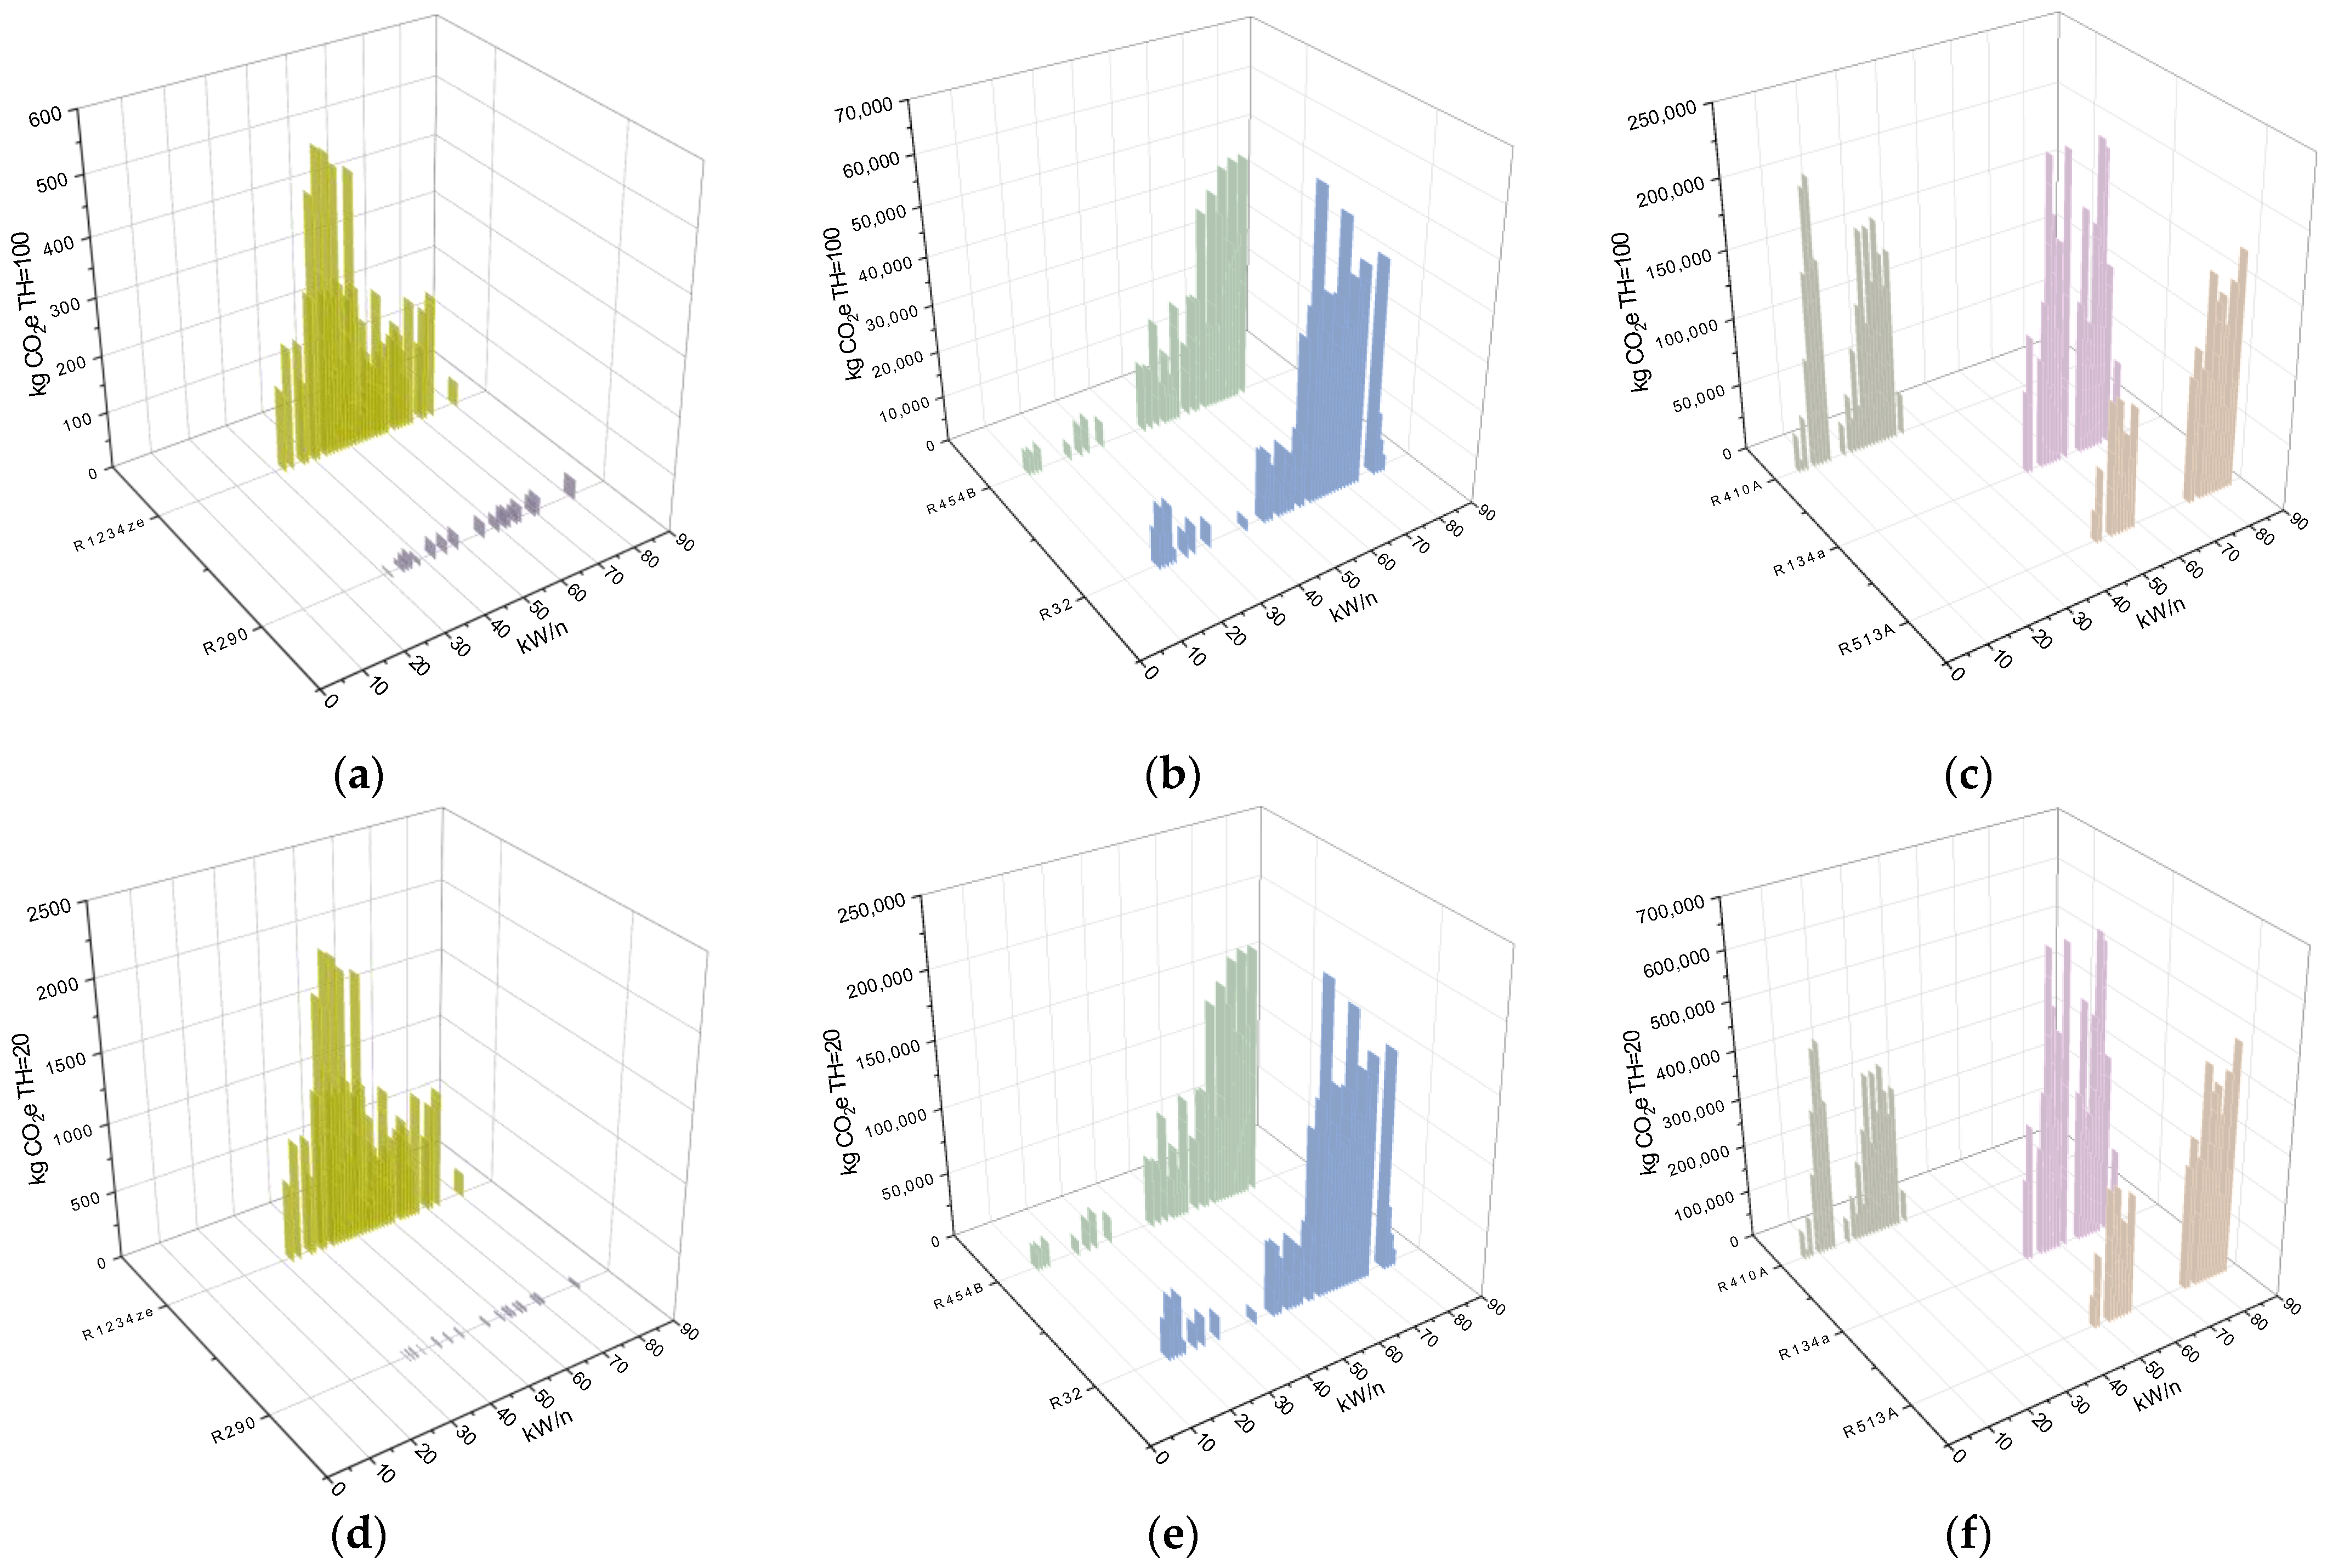
To illustrate the actual environmental impact of refrigerants of various generations, the refrigerant masses presented in Figure 3 were converted into CO2 equivalent (kg CO2e) released into the atmosphere for the GWP 100 and GWP 20 indexes. Due to the differences in GWP values (both for the 20 and 100 years period) and the large range of masses of refrigerants used in the devices, it was decided to present the results in graphs for the following ranges specified in Table 6.
This division makes it easier to compare refrigerants in terms of their actual impact on climate in a 100- and 20-year time horizon, taking the total mass of the refrigerant contained in the device into account. This is crucial in terms of the GWP index, which is kg of CO2 equivalent to 1 kg of a given substance. Therefore, when analyzing the choice of a given refrigerant, it is not possible to consider only its GWP, because it does not inform about the actual impact of a given device or system on climate. Only considering GWP taking the mass of the refrigerant into account gives a real picture of the emission of pollutants into the atmosphere. The results of the calculations of the equivalent CO2 emissions to the atmosphere for the time horizon of TH = 100 and TH = 20, respectively, for the devices analyzed as a function of the unit thermal power of the module are presented in Figure 7.
The lowest equivalent kg CO2e values were obtained in a 100-year time horizon for R290 and R1234ze. For R290, the emission values are almost uniform with a slight increase towards higher unit powers of the module. In the ranges of 30 ÷ 40 kW/n and 55 ÷ 75 kW/n, these values are similar. For the unit power of the 80 kW/n module, the kg CO2e values for the R290 and R1234ze refrigerants are similar and are 36 kg and 46 kg CO2e, respectively. Despite the use of a large mass of R1234ze refrigerant (29 kg ÷ 525 kg), as shown in Figure 3, the kg CO2e index for this refrigerant is in the range I for GWP 100 and amounts to a maximum of 525 kg CO2e. However, Figure 7a presents a wide range of kg CO2e values (from 29 kg CO2e to more than 525 kg CO2e). The GWP 100 index for both R290 and R1234ze is 1. Such a large range of values is the result of differences in the design and construction of refrigerating units, as well as thermodynamic and chemical parameters. In the case of R290, a small mass of the medium (5 ÷ 36 kg) proportionally translates into negligible values of kg CO2e (5 ÷ 36 kg) as shown in Figure 7a. However, it should be remembered that this refrigerant contributes to the formation of summer smog [47].
Higher values of kg CO2e in a 100-year time horizon were obtained for the R454B and R32 refrigerants (visible in Figure 7b), for which the GWP 100 indexes are 490 kg CO2e and 704 kg CO2e, respectively. There are no devices with R513A refrigerant in this range, with a GWP 100 index of 600, which is lower than that of R32. Importantly, the R513A refrigerant is a replacement for R134a. The lowest of the kg CO2e value for the range II was achieved by devices filled with R454B (3400 kg CO2e ÷ 51,500 kg CO2e). Slightly higher values of this index apply to devices filled with R32 refrigerant (2600 kg CO2e ÷ 63,400 kg CO2e). The highest values for R454B and R32 were obtained in the range of 55 ÷ 79 kW/n. Beyond and above this range of the unit power of the module, the equivalent of carbon dioxide emission for the atmosphere was significantly lower. This is again influenced by the design and construction of the individual units and the thermodynamic and chemical parameters of the refrigerants.
As shown Figure 7c, the highest kg CO2e values were obtained in a 100-year time frame for R513A refrigerants and withdrawn R134a and R410A. Values of the GWP 100 index for these refrigerants are, respectively, 600, 1360 and 2100. The lowest values for the range III were achieved by devices filled with R513A (22,800 kg CO2e 172,500 kg CO2e). Higher values are noticeable for unit power of the module within the range of 78 ÷ 85 kW/n, while lower values are noted for the ranges of 48 ÷ 55 kW/n and 74 ÷ 78 kW/n. Higher values of this index apply to devices filled with R410A refrigerant (7700 kg CO2e ÷ 209,200 kg CO2e). It should be noted that for this refrigerant, units achieved unit power for the module in the range of 5 ÷ 35 kW/n, with the highest equivalent CO2e obtained for the unit power of the module in the range of 10 ÷ 15 kW/n. The most negative impact on the environment is caused by devices filled with R134a, for which the maximum CO2e values are 224,400 kg CO2e, while the minimum values are 51,680 kg CO2e.
Comparing the values of CO2 equivalent emissions to the atmosphere related to the cooling devices for which the analysis was carried out, on a 20-year time horizon and a 100-year time horizon, it can be noticed that despite completely different values of GWP 20 compared to GWP 100, the devices were again in the range I group filled with R290 and R1234ze. For R290, kg CO2e values were exactly the same as the values determined for the time horizon TH = 100. This is due to the equal values of GWP 100 = GWP 20 = 1. Therefore, both short- and long-term effects are the same.
Range II includes R32 and R454B, for which the values of the GWP 20 index are respectively 359% and 347% higher than the GWP 100 index (Table 6). In the range III there are R513A, R134a and R410A again. The increase in equivalent CO2 emissions into the atmosphere is 283% (R513A), 280% (R134a), and 209% (R410A), respectively (Table 6). Here, a dependence appears where the increase in equivalent CO2 emissions is smaller in percentage for refrigerants with higher GWP 100 values. The exception is R32, for which this increase is higher (359%) compared to R513A (283%).
The equivalent kg of CO2 emissions for the least harmful refrigerants presented in Figure 7d clearly show a significant difference in the emission values related to the use of R290 (CO2e = 10 ÷ 36 kg) and R1234ze (CO2e = 116 ÷ 2100 kg). It should be noted that for R290 the values are similar across the entire power range of the unit. On the other hand, for R1234ze, the highest values were obtained for unit powers in the middle range, i.e., from 40 ÷ 60 kW/n.
For refrigerants R454B (CO2e = 12,200 ÷ 184,800 kg) and R32 (CO2e = 9400 ÷ 227,700 kg), the highest values of equivalent CO2 emissions to the atmosphere were obtained for the highest unit power, 60 ÷ 80 kW/n (Figure 7e). However, for the R32 refrigerant in the range of maximum unit power, the equivalent value is significantly lower. This also depends on the device’s construction.
In the range III, where refrigerants have the greatest impact on the environment, R410A (CO2e = 16,230 ÷ 443,600 kg), R134a (CO2e = 144,800 ÷ 628,600 kg) and R513A (CO2e = 63,700 ÷ 483,000 kg) were again found (Figure 7f). Among them, the R134a refrigerant has the highest values of CO2 equivalent emissions to the atmosphere. However, it should be noted that the difference in the maximum values related to individual refrigerants increased significantly compared to the values related to GWP 100. In this case, the effect of the R134a refrigerant is significantly worse compared to R513A and R410A. However, it is worth paying attention to the fact that for R410A (6–34 kW/n) the unit power range is incomparable to the range obtained for R134a (50–76 kW/n) and R513A (48–86 kW/n).
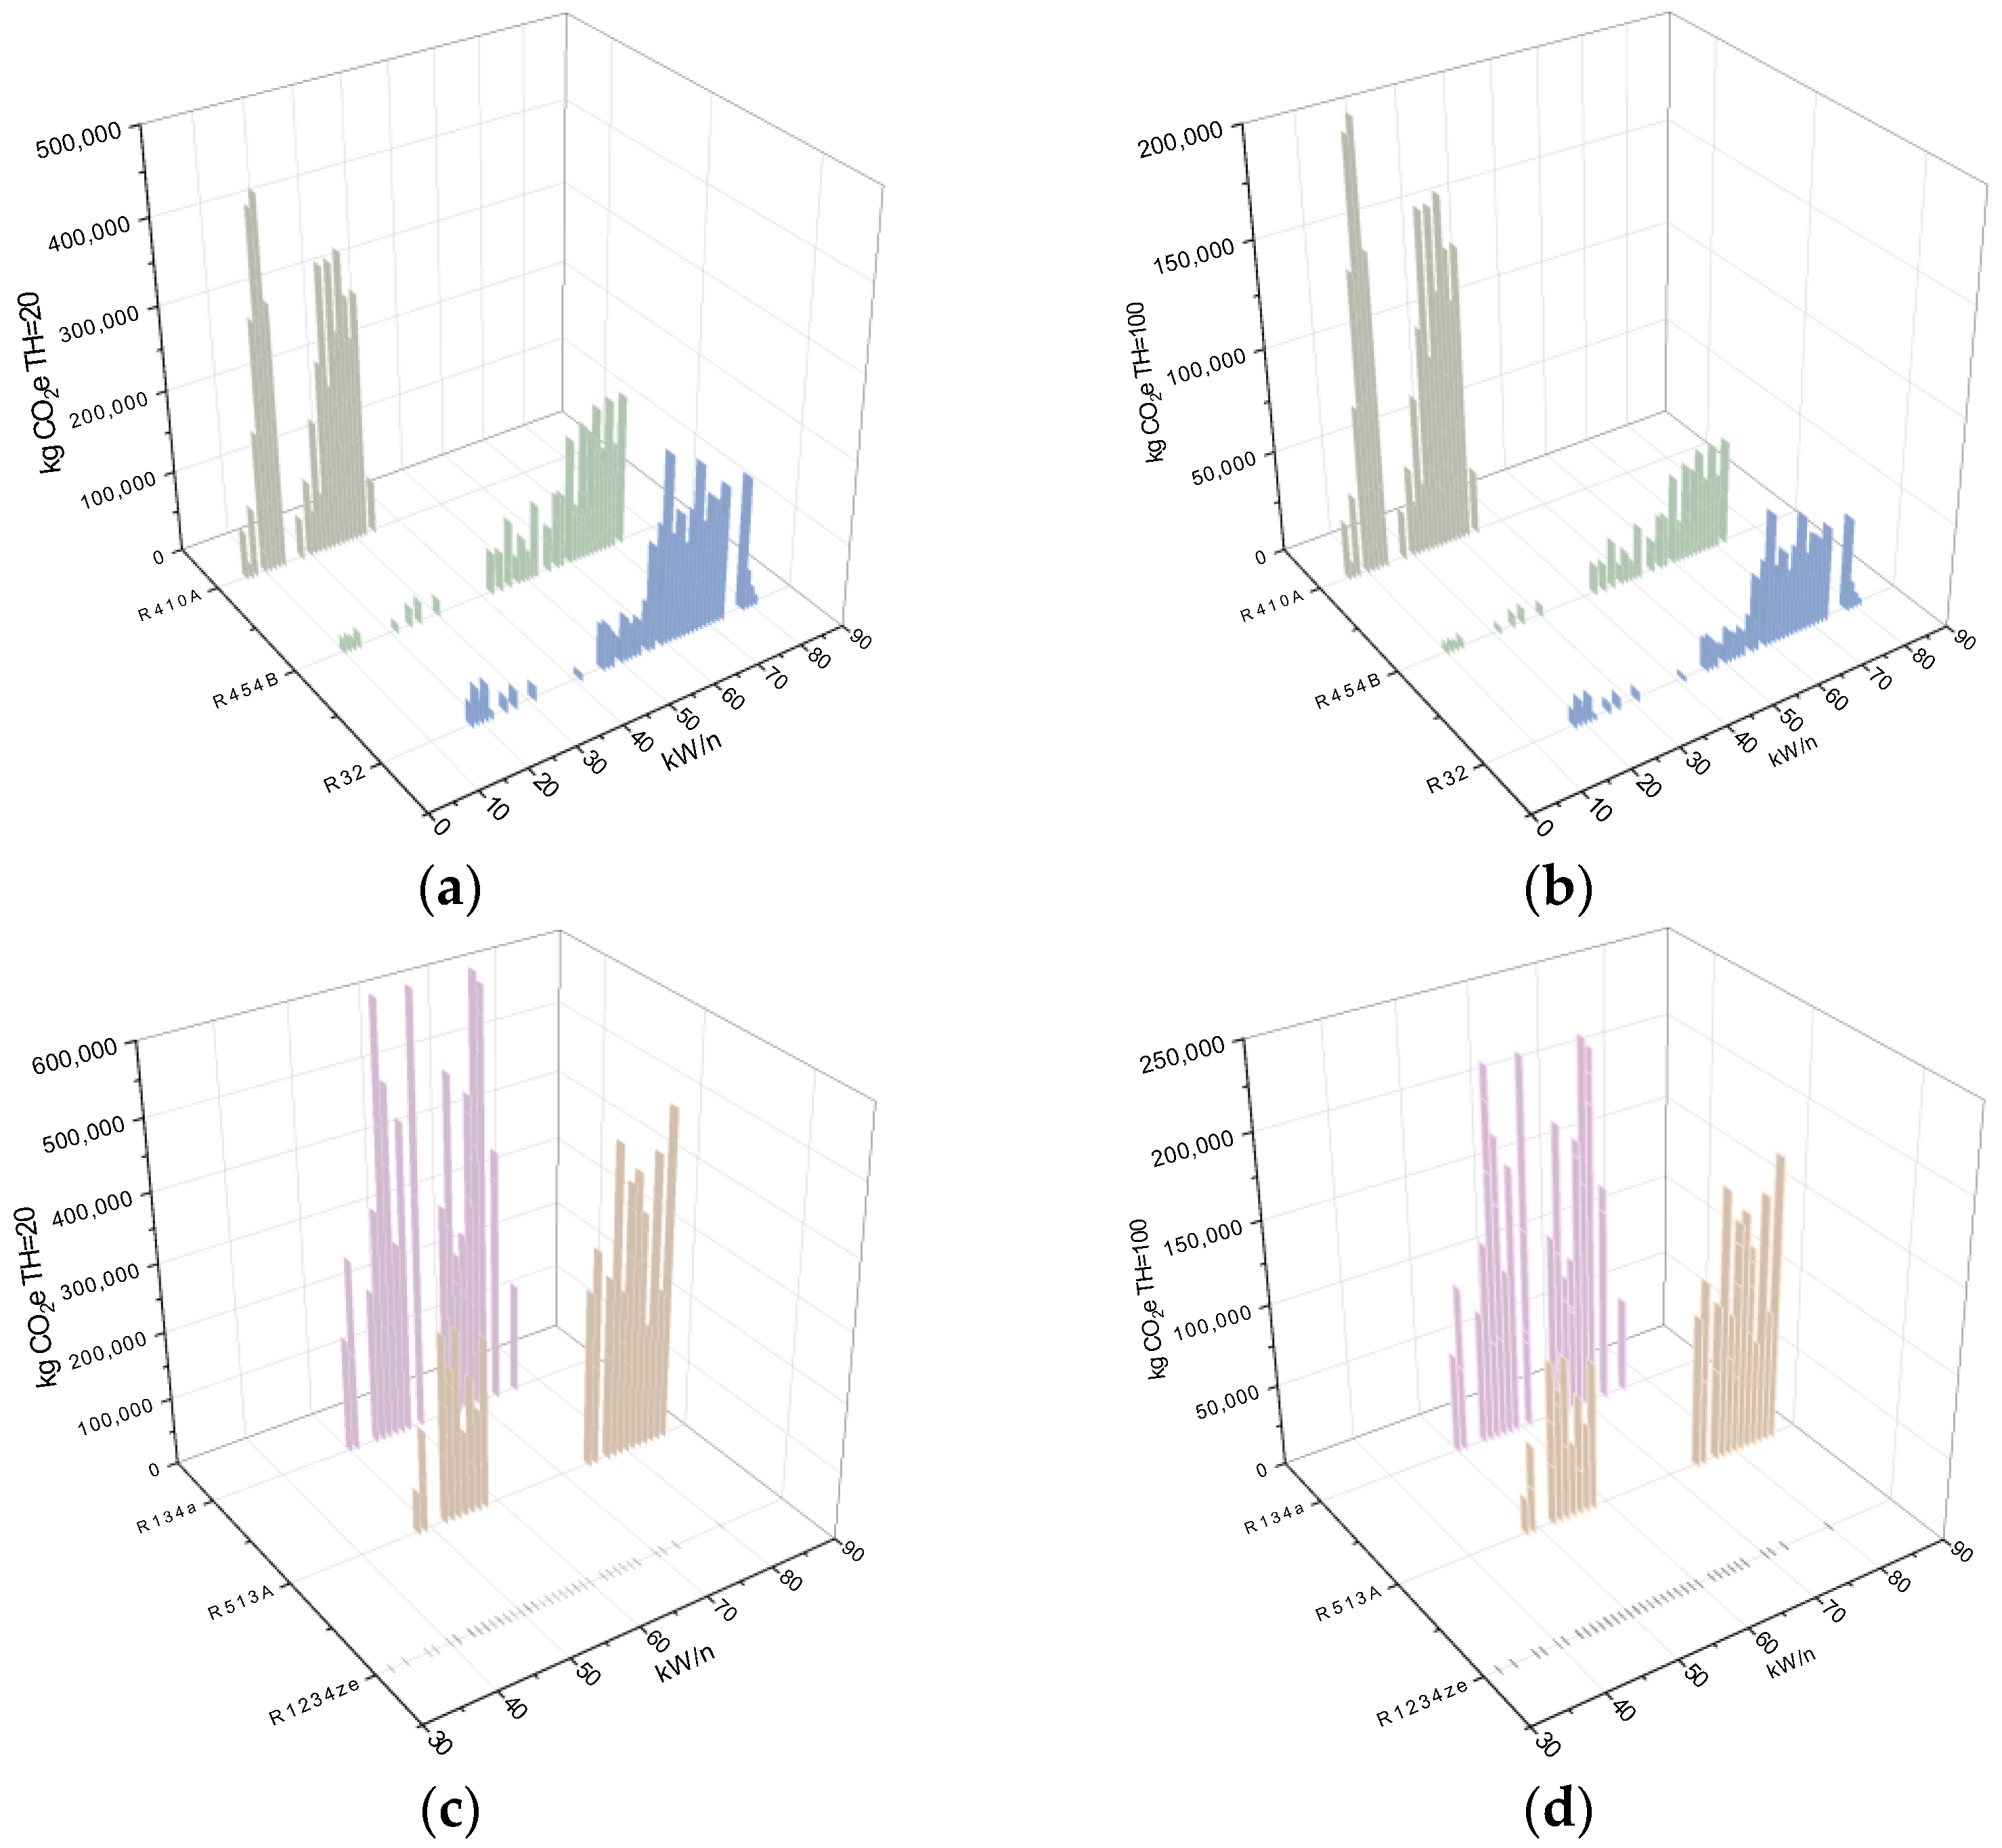
To show how the changes into next-generation refrigerants, Figure 8 presents graphs of kg CO2e emissions into the atmosphere for both time horizons, i.e., TH = 20 and TH = 100, for selected substitutes for refrigerants. It is essential to understand that some of the new refrigerants are simply mixtures of some old refrigerants. Therefore, Figure 4 together with Figure 5 presents the composition and GWP index values of investigated refrigerants. Those comprise basic information that is required to understand the overall idea of the GWP 20 and GWP 100 comparison. Replacement for R410A a mixture of R32 (50%) and R125 (50%) is R454B, which contains R32 (59%) and 1234yf (41%) (according to Figure 5). The second substitute is R32, which is homogeneous. The placement on the market of a substitute in the form of the R454B refrigerant significantly reduces the equivalent emission of CO2 into the atmosphere compared to R410A. However, it should be noted that the unit power obtained in devices that work with R410A and R454B is completely different. Comparison of R32 and R454B does not yield such obvious conclusions. In this case, the values of CO2 equivalent emissions are similar across the entire range of unit capacity. Substitutes for R134a are: R513A made of R134a (44%) and R1234yf (56%) and R1234ze, which is homogeneous, as shown in Figure 5. As can be seen, bringing R1234ze to market yields disproportionately better results compared to R513A refrigerant. CO2 equivalent emissions to the atmosphere are negligible for R1234ze and significantly high for R513A and R134a, respectively. It should also be noted that the unit power of the module obtained for devices filled with R1234ze is in a much wider range than for R513A and R134a. There is also a substantial difference in the values obtained for the 20- and 100-year time horizons in both refrigerants that are decommissioned from the market.
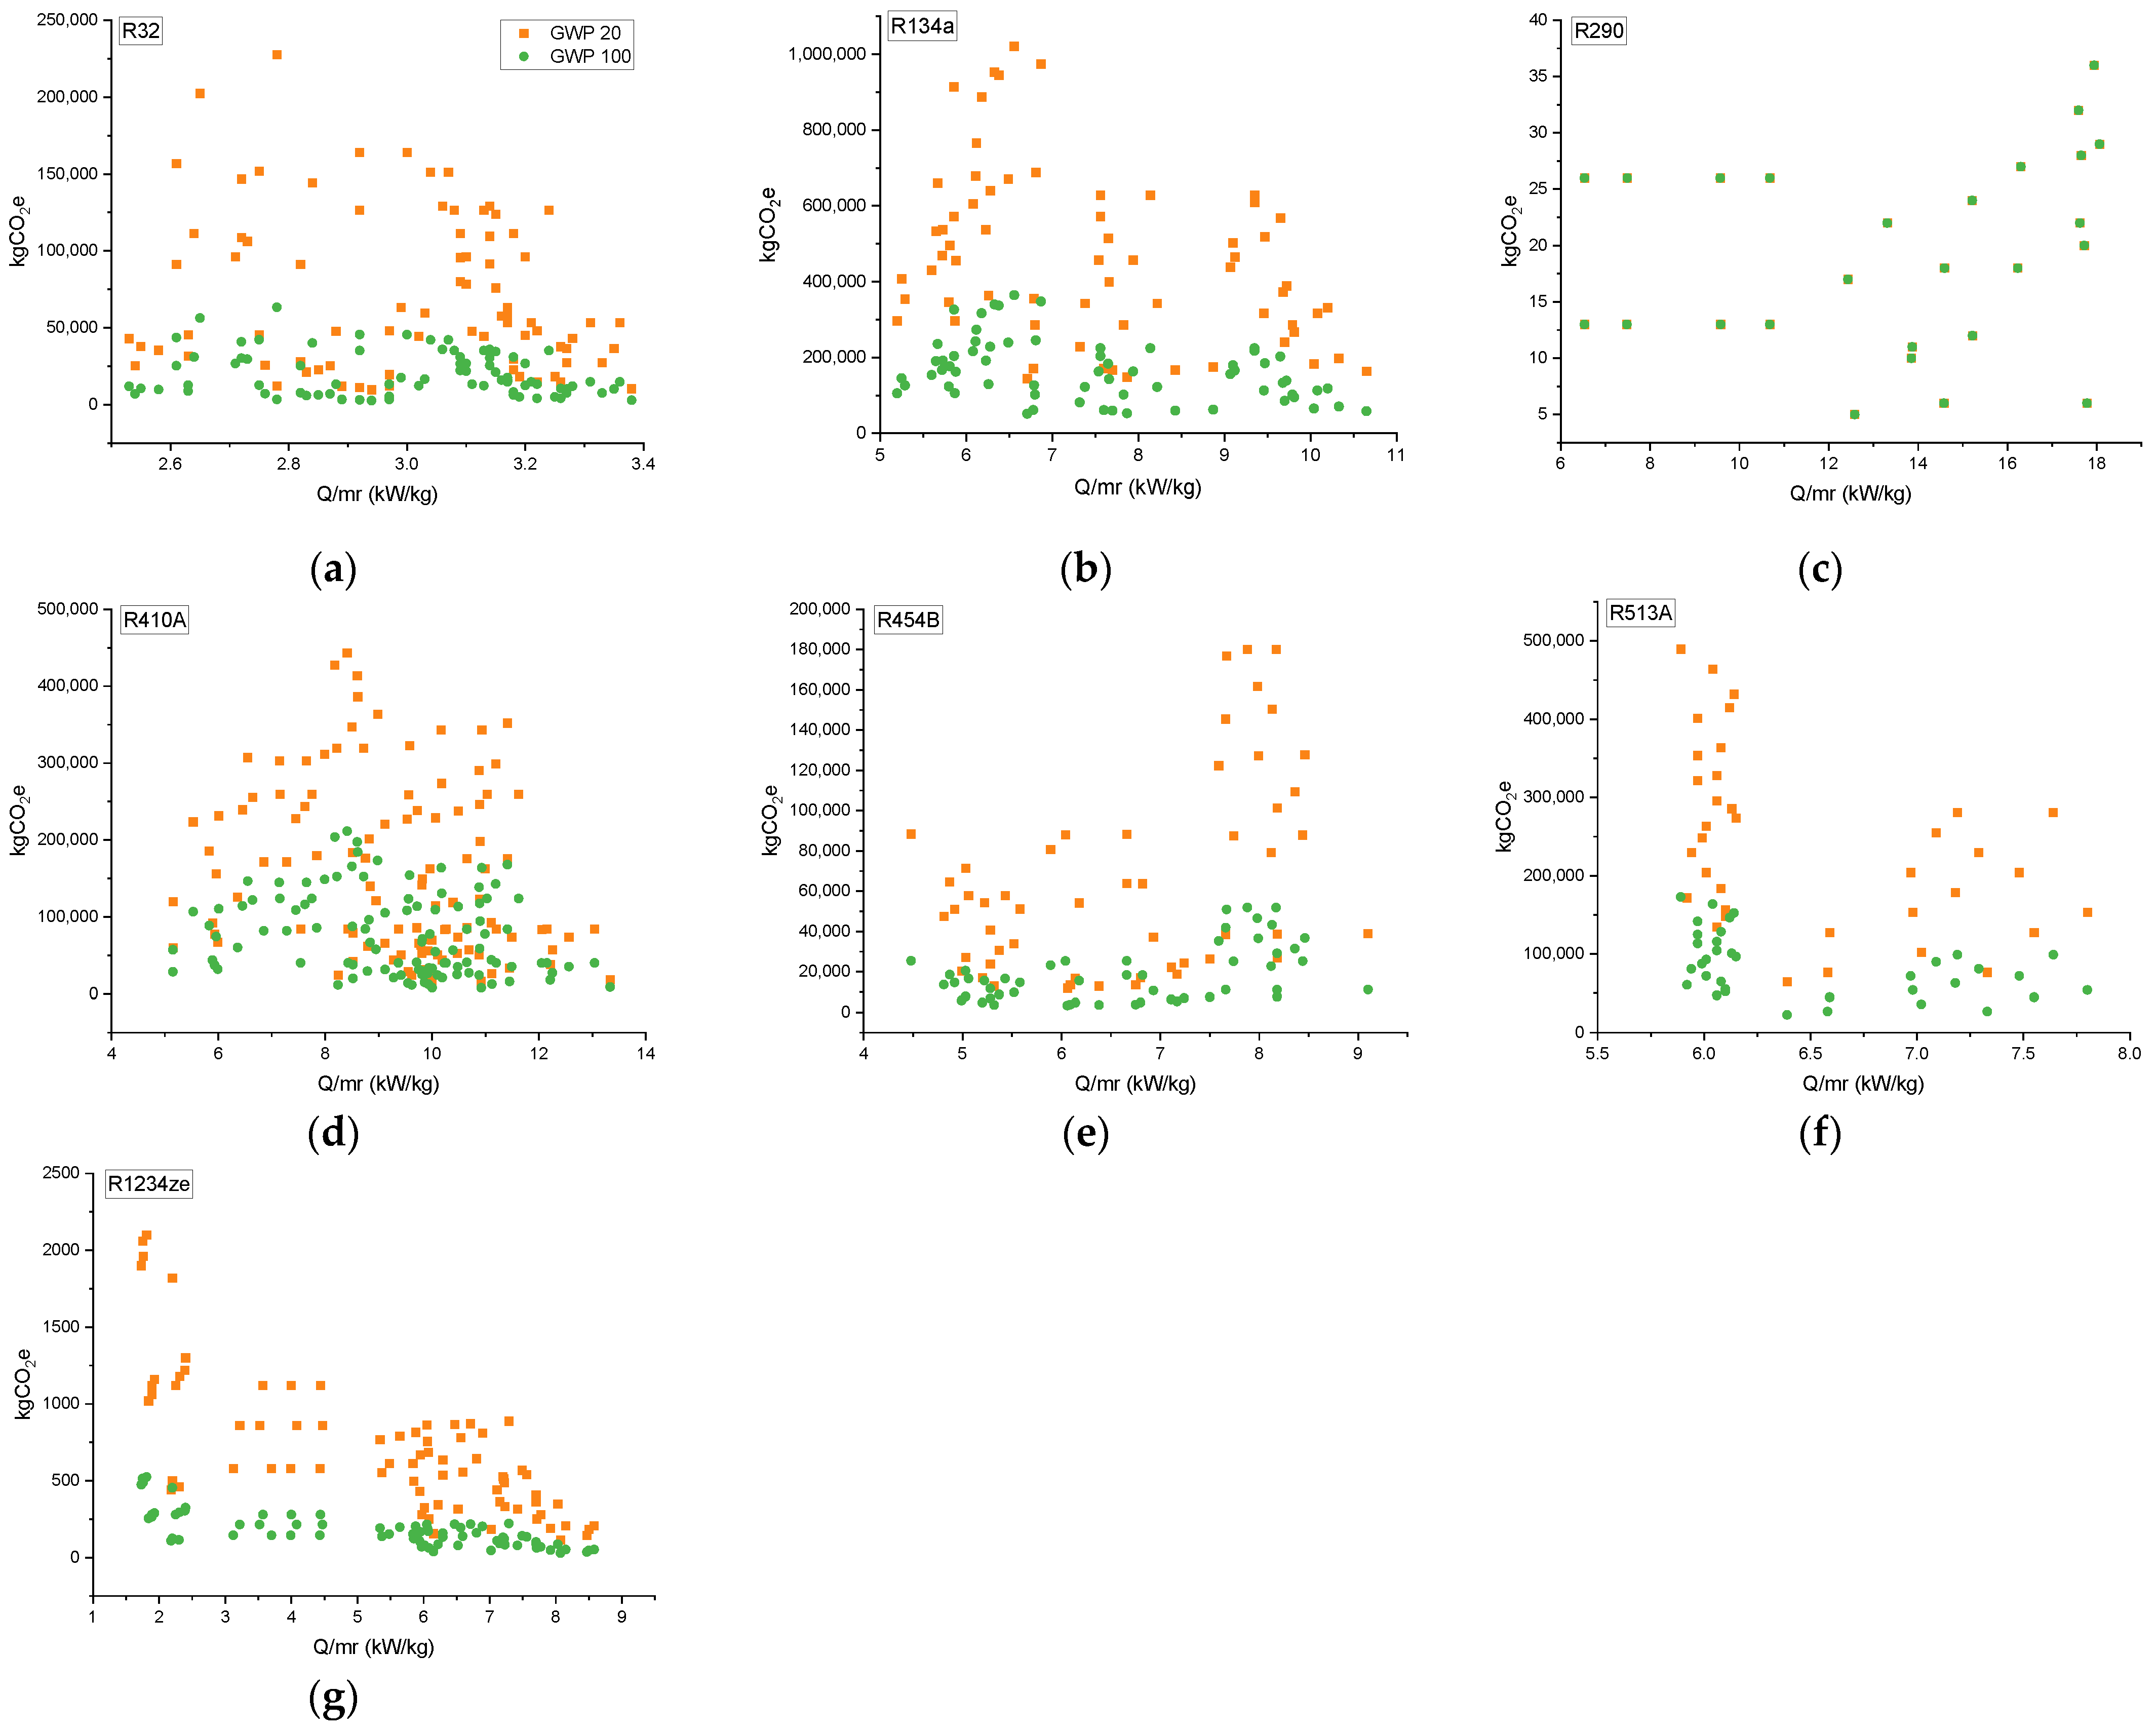
Figure 9 presents the results of the values of the equivalent CO2 emissions as a function of the unit power of the refrigerant charge (kW/kg). Only for R290, the values of equivalent CO2 emissions to the atmosphere, both in the 20 and 100-year time horizon, are at the same level (Figure 9c). For other refrigerants, values calculated for a shorter time horizon are always of a higher value than for a longer time horizon. The higher the Qc/m value, the lower the refrigerant mass used in the system. As shown in Figure 9, higher powers with less filling are obtained for the R290, R410A, and R134A refrigerants. When selecting cooling devices, we should follow the unit cooling power for which, with the required cooling power, the lowest possible emission values are obtained, i.e., for R32 Qc/m = 3.2 ÷ 3.4 kW/kg, dla R134A Qc/m = 8.5 ÷ 9.0 kW/kg oraz Qc/m = 10 ÷ 11.0 kW/kg, dla R410A Qc/m = 12.0 ÷ 14.0 kW/kg, dla 454B Qc/m = 4.5 ÷ 7.5 kW/kg, dla R513A Qc/m = 6.25 ÷ 6.75 kW/kg, dla R1234ze Qc/m = 7.5 ÷ 9.0 kW/kg.
Along with the environmental impact, chosen properties of R410A, R134a and their constituents are shown in Table 7 and Table 8.
In both cases physical properties are similar however, R410A and its substituents have almost identical physical properties. It is strictly connected to the use of some refrigerants as drop-in replacement, so they must share similar physical properties. Nevertheless, one must take into consideration the change in transport properties as well. The comparison of the density and viscosity values in Table 7 does not reveal significant differences between refrigerants. It is worth to note that thermal conductivity values are higher by 20% (R410A to R454B comparison) and by 43% (R410A to R32 comparison). The use of refrigerants with higher thermal conductivity values may result in improved heat transfer characteristics in heat exchangers. R134a substituents have 10–20% lower thermal conductivity and similar densities. However, there is a substantial drop of viscosity value for R513A as a replacement, those may result in reduced viscous losses within compressor system and further on reduce, e.g., pressure drop.
It should be remembered that not only the GWP index but also the toxicity and practical limit of concentration are factors that determine the environmental impact of a given refrigerant. Table 9 lists all refrigerants spoken in this article with their respective GWP 20/GWP 100 ratio, safety class, and practical concentration limit.
Data in Table 9 reveal that only homogeneous refrigerants such as R290, R717 and R744 have the same impact on global warming regardless of the time horizon. Each one has however the lowest practical concentration limit; thus, its implementation requires additional effort like mechanical ventilation. In addition, they have low safety classes (beside R744). R1234ze and R32 have the greatest environmental impact in a short time horizon. Furthermore, R32 also requires a mechanical ventilation system due to the low practical concentration level. R1234ze is not toxic and there are no data of the practical concentration limit yet; nevertheless, additional safety systems are also required.
4. Conclusions
In most cases, placing to market new generation refrigerants to replace the older ones allows to reduce their impact on the greenhouse effect observed on Earth. This is true for both the GWP 100 and the GWP 20 indexes. For shorter time horizons, the reduction of the negative impact on the atmosphere is not as strong as for long time horizons. In the shorter time horizons, the differences are much lower, and the environmental impact is starting to be significant also for new generations of refrigerants. It can be safely assumed that for very short time horizons, it may turn out that the use of older but single component refrigerants may be safer with regard to local climate change. It has been proved by comparison of GWP 20 and GWP 100. However, still in the global and long-term perspective, new refrigerants that replace older ones are much less harmful in terms of CO2e emissions. Therefore, with the gradual shift to low-GWP refrigerants and with a short or very short lifetime, the way of considering the effects generated by emissions of these refrigerants must also be changed. More attention should be paid to the analysis of the harmfulness of these refrigerants in relation to a climate of local scope.
It should be noted that for all three considered ranges of CO2e emissions to the atmosphere, there are always ranges of minimum and maximum values and they do not directly depend on the unit power value of the module as well as on the power value of individual devices. It means that in all cases the design and construction of the cooling device, including the air flows used to cool the condensers, which are different for individual devices, have an impact on the cooling values. The thermodynamic and chemical values of individual refrigerants are also important.
Furthermore, the values of CO2e emissions to the atmosphere are closely related to the refrigerant charge. It is necessary to consider the determination and evaluation of cooling devices in terms of the unit capacities obtained the so that, as a result, the greenhouse effect is actually and realistically reduced.
Another factor ensuring the reduction of harmfulness of the refrigerants used is the use of homogeneous gases, or mixtures with regard to their composition. It is important especially in relation to their decomposition into individual chemical compounds, including acids such as, for example, trifluoroacetic acid (TFA), which is a decomposition product of R134a and R1234ze, which are components of the mixture that forms R513A.
The thermodynamic parameters of the introduced refrigerants are also important aspects as they determine the possibility of obtaining adequate cooling with the use of electrical power supplied to compressors and fans.
Catalogue data for refrigerants and cooling devices typically provide values for GWP 100 only. The results of the research carried out suggest that the values for GWP 20 should also be obligatory. It would allow to select devices with more awareness in terms of environment protection.
Future work should focus on both the global and local impact of greenhouse gases expressed in a simple index so that the tool for reporting emissions will be applicable to new types of refrigerants. It is possible to obtain by GWP* index implementation. Currently, no data are available to use and insufficient research and discussion have been done to clearly assess GWP* index.
Author Contributions
Conceptualization, S.S. and Ł.S.; methodology, S.S.; software, Ł.S.; validation, S.S.; formal analysis, S.S. and Ł.S.; investigation, S.S. and Ł.S.; resources, S.S. and Ł.S.; data curation, Ł.S.; writing—original draft preparation, S.S. and Ł.S.; writing—review and editing, S.S. and Ł.S.; visualization, S.S. and Ł.S. All authors have read and agreed to the published version of the manuscript.
Funding
This research received no external funding.
Institutional Review Board Statement
Not applicable.
Informed Consent Statement
Not applicable.
Data Availability Statement
Not applicable.
Conflicts of Interest
The authors declare no conflict of interest.
References
- Smith, S.J.; Wigley, M.L. Global Warming Potentials: 1. Climatic Implications of Emissions Reductions. Clim. Chang. 2000, 44, 445–457. [Google Scholar] [CrossRef]
- Fuglestvedt, J.S.; Berntsen, T.K.; Godal, O.; Sausen, R.; Shine, K.P.; Skodvin, T. Metrics of Climate Change: Assessing Radiative Forcing and Emission Indices. Clim. Chang. 2003, 58, 267–331. [Google Scholar] [CrossRef]
- Shine, K.P. The Global Warming Potential—The Need for an Interdisciplinary Retrial. Clim. Chang. 2009, 96, 467–472. [Google Scholar] [CrossRef]
- Pierrehumbert, R.T. Short-Lived Climate Pollution. Annu. Rev. Earth Planet. Sci. 2014, 42, 341–379. [Google Scholar] [CrossRef]
- Kleinberg, R. The Global Warming Potential Misrepresents the Physics of Global Warming Thereby Misleading Policy Makers; Insitute for Sustainable Energy, Boston University: Boston, MA, USA, 2020. [Google Scholar]
- Edwards, M.R.; McNerney, J.; Trancik, J.E. Testing Emissions Equivalency Metrics against Climate Policy Goals. Environ. Sci. Policy 2016, 66, 191–198. [Google Scholar] [CrossRef]
- Allen, M.R.; Fuglestvedt, J.S.; Shine, K.P.; Reisinger, A.; Pierrehumbert, R.T.; Forster, P.M. New Use of Global Warming Potentials to Compare Cumulative and Short-Lived Climate Pollutants. Nat. Clim. Chang. 2016, 6, 773–776. [Google Scholar] [CrossRef]
- Shine, K.P.; Fuglestvedt, J.S.; Hailemariam, K.; Stuber, N. Alternatives to the Global Warming Potential for Comparing Climate Impacts of Emissions of Greenhouse Gases. Clim. Chang. 2005, 68, 281–302. [Google Scholar] [CrossRef]
- Tanaka, K.; Peters, G.P.; Fuglestvedt, J.S. Policy Update: Multicomponent Climate Policy: Why Do Emission Metrics Matter? Carbon Manag. 2014, 1, 191–197. [Google Scholar] [CrossRef]
- IPCC. Climate Change: The IPCC Scientific Assessment; Cambridge University Press: Cambridge, UK, 1990. [Google Scholar]
- IPCC; TEAP. Special Report: Safeguarding the Ozone Layer and the Global Climate System; Cambridge University Press: Cambridge, UK, 2018. [Google Scholar]
- InforMEA The Vienna Convention for the Protection of the Ozone Layer—Overview of the Negotiation Process, Main Obligations and Development of the Vienna Convention. Available online: https://globalpact.informea.org/sites/default/files/documents/The%20Vienna%20Convention%20for%20the%20protection%20of%20the%20Ozone%20Layer.pdf (accessed on 6 May 2022).
- United Nations Environment Programme. Handbook for the International Treaties for the Protection of the Ozone Layer: The Vienna Convention (1985); The Montreal Protocol (1987), 6th ed.; UNEP: Nairobi, Kenya, 2003. [Google Scholar]
- United Nations. Montreal Protocol on Substances That Deplete the Ozone Layer (with Annex); United Nations: Geneva, Switzerland, 1987. [Google Scholar]
- United Nations. Kyoto Protocol to the United Nations Framework Convention on Climate Change; United Nations: Geneva, Switzerland, 1998. [Google Scholar]
- United Nations. United Nations Framework Convention on Climate Change; United Nations: Geneva, Switzerland, 1992. [Google Scholar]
- James, M. Calm Refrigeration Transitions … Again. In Moving Towards Sustainability, Proceedings of the ASHRAE/NIST Conference, Gaithersburg, MD, USA, 29–30 October 2012; ASHRAE: Atlanta, GA, USA, 2012. [Google Scholar]
- UNTC. Available online: https://treaties.un.org/pages/ViewDetails.aspx?src=IND&mtdsg_no=XXVII-2&chapter=27&clang=_en#1 (accessed on 13 May 2022).
- Decision I/9: ODP for Halon 2402|Ozone Secretariat. Available online: https://ozone.unep.org/treaties/montreal-protocol/meetings/first-meeting-parties/decisions/decision-i9-odp-halon-2402 (accessed on 12 May 2022).
- UNFCCC. What Is the United Nations Framework Convention on Climate Change. Available online: https://unfccc.int/process-and-meetings/the-convention/what-is-the-united-nations-framework-convention-on-climate-change (accessed on 6 May 2022).
- Forster, P.; Ramaswamy, V.; Artaxo, P.; Berntsen, T.; Betts, R.; Fahey, D.W.; Haywood, J.; Lean, J.; Lowe, D.C.; Myhre, G.; et al. Changes in Atmospheric Constituents and in Radiative Forcing. In Climate Change 2007: The Physical Science Basis. Contributuin of Working Group I to the Fourth Assessment Report of the Intergovernmental Panel on Climate Change; Cambridge University Press: Cambridge, NY, USA, 2007. [Google Scholar]
- IPCC. Climate Change 2013: The Physical Science Basis. Contribution of Working Group I to the Fifth Assessment Report of the Intergovernmental Panel on Climate Change; Cambridge University Press: Cambridge, NY, USA, 2013. [Google Scholar]
- Lynch, J.; Cain, M.; Pierrehumbert, R.; Allen, M. Demonstrating GWP*: A Means of Reporting Warming-Equivalent Emissions That Captures the Contrasting Impacts of Short- and Long-Lived Climate Pollutants. Environ. Res. Lett. 2020, 15, 044023. [Google Scholar] [CrossRef]
- Zhang, H.; Wu, J.; Lu, P. A Study of the Radiative Forcing and Global Warming Potentials of Hydrofluorocarbons. J. Quant. Spectrosc. Radiat. Transf. 2011, 112, 220–229. [Google Scholar] [CrossRef]
- Allen, M.R.; Shine, K.P.; Fuglestvedt, J.S.; Millar, R.J.; Cain, M.; Frame, D.J.; Macey, A.H. A Solution to the Misrepresentations of CO2-Equivalent Emissions of Short-Lived Climate Pollutants under Ambitious Mitigation. npj Clim. Atmos. Sci. 2018, 1, 16. [Google Scholar] [CrossRef]
- Cain, M.; Lynch, J.; Allen, M.R.; Fuglestvedt, J.S.; Frame, D.J.; Macey, A.H. Improved Calculation of Warming-Equivalent Emissions for Short-Lived Climate Pollutants. Npj Clim. Atmos. Sci. 2019, 2, 29. [Google Scholar] [CrossRef] [PubMed]
- Costa, C.; Wironen, M.; Racette, K.; Wollenberg, E. Global Warming Potential* (GWP*): Understanding the Implications for Mitigating Methane Emissions in Agriculture; CCAFS: Wageningen, The Netherlands, 2021. [Google Scholar]
- Fischer, S.K.; Hughes, P.J.; Fairchild, P.D.; Kusik, C.L.; Dieckmann, J.T.; McMahon, E.M.; Hobday, N. Energy and Global Warming Impacts of CFC Alternative Technologies. Executive Summary; U.S. Department of Energy: Washington, DC, USA, 1991.
- United Nations Environment Programme. Montreal Protocol on the Substances That Deplete the Ozone Layer: 2018 Report of the Refrigeration, Air Conditioning and Heat Pumps Technical Options Comittee; United Nations: Geneva, Swietzerland, 2018. [Google Scholar]
- Makhnatch, P.; Khodabandeh, R. The Role of Environmental Metrics (GWP, TEWI, LCCP) in the Selection Of Low GWP Refrigerant. Energy Procedia 2014, 61, 2460–2463. [Google Scholar] [CrossRef]
- Troch, S.; Lee, H.; Hwang, Y.; Radermacher, R. Harmonization of Life Cycle Climate Performance (LCCP) Methodology. In Proceedings of the International Refrigeration and Air Conditionign Conference, West Lafayette, IN, USA, 11–14 July 2016. [Google Scholar]
- Wang, Z.Y.; Wang, H.Q.; Liu, C.R. LCCP Evaluation on Environmental Impact of Air-Conditioning Cold and Heat Source. Appl. Mech. Mater. 2013, 291–294, 1789–1794. [Google Scholar] [CrossRef]
- Andersen, S.O.; Wolf, J. Improved Life-Cycle Climate Performance (LCCP) Metrics: Room AC Carbon Footprint. Vienna OEWG Side Event; UNEP: Nairobi, Kenya, 2018. [Google Scholar]
- WMO. Scientific Assesment of Ozone Depletion: 2014, Global Ozone Research Monitoring Project—Repoert No. 55; WMO: Geneva, Switzerland, 2014. [Google Scholar]
- WMO; UNEP. World Meteorological Organization Global Ozone Research and Monitoring Project-Report No. 58 Scientific Assesment of Ozone Depletion: 2018; WMO: Geneva, Switzerland, 2018. [Google Scholar]
- UNEP; ASHRAE. FACTSHEET 1: Update on New Refrigerants Designations and Safety Classifications; UNEP: Nairobi, Kenya, 2020. [Google Scholar]
- ISO 817:2014; Refrigerants—Designation and Safety Classification. International Organization for Standardization: Geneva, Switzerland, 2014.
- Czynniki Chłodnicze::Schiessl Polska. Available online: https://www.schiessl.pl/pl/czynniki-chlodnicze (accessed on 16 May 2022).
- Mota-Babiloni, A.; Makhnatch, P.; Khodabandeh, R. Recent Investigations in HFCs Substitution with Lower GWP Synthetic Alternatives: Focus on Energetic Performance and Environmental Impact. Int. J. Refrig. 2017, 82, 288–301. [Google Scholar] [CrossRef]
- Vallero, D.A. Air Pollution Biogeochemistry. In Air Pollution Calculations; Elsevier: Amsterdam, The Netherlands, 2019; pp. 175–206. [Google Scholar] [CrossRef]
- Danny Harvey, L.D. A Guide to Global Warming Potentials (GWPs). Energy Policy 1993, 21, 24–34. [Google Scholar] [CrossRef]
- IPCC. Climate Change 1994: Radiative Forcing of Climate Change and an Evaluation of the IPCCIS92 Emission Scenarios; Reports of Working Groups I and III of the Intergovernmental Panel on Climate Change, Forming Part of the IPCC Special Report to the First Session of the Conference of the Parties to the UN Framework Convention on Climate Change; Cambridge University Press: Cambridge, UK, 1995. [Google Scholar]
- Mate, J.; Kanter, D. The Benefits of Basing Policies on the 20 Year GWP of HFCs; Greenpeace: Amsterdam, The Netherlands, 2020. [Google Scholar]
- Walravens, F. Autor Opinii: Environmental Investigation Agency; European Commission: Brussels, Belgium, 2020. [Google Scholar]
- The European Parliment and the Council of the European Union. Regulation (EU) no 517/2014 of the European Parliment and of the Council of 16 April 2014 on Fluorinated Greenhouse Gases and Repealing Regulation (EC) No 842/2006. Off. J. Eur. Union 2014, 150, 195–230. [Google Scholar]
- Minx, J.C.; Lamb, W.F.; Andrew, R.M.; Canadell, J.G.; Crippa, M.; Döbbeling, N.; Forster, P.M.; Guizzardi, D.; Olivier, J.; Peters, G.P.; et al. A Comprehensive and Synthetic Dataset for Global, Regional, and National Greenhouse Gas Emissions by Sector 1970-2018 with an Extension to 2019. Earth Syst. Sci. Data 2021, 13, 5213–5252. [Google Scholar] [CrossRef]
- BITZER. Refrigerant Report|Enhanced Reader; BITZER: Sindelfingen, Germany, 2020. [Google Scholar]
Figure 1.
Historical development of refrigerants [17].
Figure 1.
Historical development of refrigerants [17].

Figure 2.
Lifetime in the atmosphere of selected refrigerants [29].
Figure 2.
Lifetime in the atmosphere of selected refrigerants [29].

Figure 3.
Dependence of the refrigerant mass in the device on kW/n for the selected refrigerants.

Figure 4.
GWP 20 and GWP 100 index values for selected refrigerants and their components [29].
Figure 4.
GWP 20 and GWP 100 index values for selected refrigerants and their components [29].

Figure 5.
Percentage composition of selected refrigerants [29].
Figure 5.
Percentage composition of selected refrigerants [29].

Figure 6.
Relative values of GWP 20 with respect to values of GWP 100.

Figure 7.
Equivalent of kg CO2 releases into the atmosphere (for the GWP 100 index); (a) GWP 100 index range I, (b) GWP 100 index range II, (c) GWP 100 index range III, (d) GWP 20 index range I, (e) GWP 20 index range II, (f) GWP 20 index range III.
Figure 7.
Equivalent of kg CO2 releases into the atmosphere (for the GWP 100 index); (a) GWP 100 index range I, (b) GWP 100 index range II, (c) GWP 100 index range III, (d) GWP 20 index range I, (e) GWP 20 index range II, (f) GWP 20 index range III.

Figure 8.
Equivalent of kg CO2e released to the atmosphere for selected refrigerants and their substitutes for: (a) R410A, TH = 20; (b) R410A TH = 100, (c) R134a TH = 20, (d) R134a TH = 100.
Figure 8.
Equivalent of kg CO2e released to the atmosphere for selected refrigerants and their substitutes for: (a) R410A, TH = 20; (b) R410A TH = 100, (c) R134a TH = 20, (d) R134a TH = 100.

Figure 9.
Equivalent CO2 emissions in released to unit power of the refrigerant charge (kW/kg) for: (a) R32, (b) R134a, (c) R290, (d) R410A, (e) R454B, (f) R513A, (g) R1234ze. Green dots—kg CO2 e TH = 100, Orange dots—kg CO2 e TH = 20.
Figure 9.
Equivalent CO2 emissions in released to unit power of the refrigerant charge (kW/kg) for: (a) R32, (b) R134a, (c) R290, (d) R410A, (e) R454B, (f) R513A, (g) R1234ze. Green dots—kg CO2 e TH = 100, Orange dots—kg CO2 e TH = 20.


Table 1.
Controlled substances with ODP values based on Annex A of the Montreal Protocol [14] and analyzed refrigerants.
Table 1.
Controlled substances with ODP values based on Annex A of the Montreal Protocol [14] and analyzed refrigerants.
| Group | Substance | Ozone Depletion Potential |
|---|---|---|
| I * | R11 R12 R113 R114 R115 | 1.0 1.0 0.8 1.0 0.6 |
| II * | CF2BRCl (halon-1211) CF2BR (halon-1301) C2F4Br2 (halon-2402) | 3.0 10.0 6.0 ** |
| III *** | R32 R134a R290 R717 R744 R1234ze R407C R410A R454B R513A R125 R1234yf | 0 |
* Groups implemented by Montreal Protocol. ** Value assumed under the Decisions of the Meetings of the Parties to the Montreal Protocol—Decision I/9: ODP for halon 2402 [19]. *** Analyzed refrigerants.
Table 2.
Substitutes for selected refrigerants commonly used in air-conditioning systems and in compressor refrigeration devices with their safety classes [38,39].
| Substitute | Current Refrigerant |
|---|---|
| R513A (A1) | R134a (A1) |
| R454B (A2L) | R410A (A1) |
| R32 (A2L) | R410A (A1) |
| R1234ze (A1) | R134a (A1), R123 (B1) |
| R290 (A3) | R22 (A1), R404A (A1), R507 (A1) |
Table 3.
Safety classes for refrigerants according to ASHRAE Standard 34 [36] and ISO 817:2014 [37].
| Flammability | Lower Toxicity | Higher Toxicity |
|---|---|---|
| Higher Flammability | A3 | B3 |
| Lower Flammability | A2 A2L * | B2 B2L * |
| No Flame Propagation | A1 | B1 |
* Refrigerants with maximum burning velocity of ≤10 cm/s.
Table 4.
List of devices with the scope of the declared power, the number of fans, and a refrigerant load.
Table 4.
List of devices with the scope of the declared power, the number of fans, and a refrigerant load.
| Refrigerant | Producer | Model | Qc min | Qc max | mr min | mr max | No. Fans |
|---|---|---|---|---|---|---|---|
| R32 | Carrier | 30RB | 42 | 380 | 3.7 | 36.2 | 1–6 |
| Swegon | Zeta SKY | 46 | 238 | 4.1 | 18.9 | 2–3 | |
| Daikin | EWAt-B-SS | 81 | 665 | 10.0 | 90.0 | 4–11 | |
| Carrier | 30RBP | 172 | 943 | 17.8 | 64.8 | 3–12 | |
| Swegon | Tetris SKY | 200 | 535 | 19.0 | 50.0 | 3–8 | |
| R134a | Swegon | Kappa SKY | 255 | 1343 | 38.0 | 165.0 | 5–22 |
| Swegon | Kappa REV | 307 | 1542 | 39.0 | 165.0 | 5–22 | |
| TRANE | Sintesis | 404 | 1758 | 77.7 | 255.8 | 10–28 | |
| Carrier | 30XV | 492 | 1758 | 93.0 | 268.0 | 8–22 | |
| R290 | Skadec | VCG | 63 | 365 | 5.0 | 24.0 | 6–8 |
| Hitema | PRP | 85 | 278 | 13.0 | 26.0 | 2–4 | |
| Skadec | VCGV | 292 | 646 | 18.0 | 36.0 | 2–8 | |
| R1234ze | Swegon | Kappa SKY | 234 | 1063 | 29.0 | 142.0 | 5–18 |
| Airdale | Turbo Chill | 240 | 1000 | 110.0 | 525.0 | 4–24 | |
| Swegon | Kappa Rev | 240 | 1020 | 39.0 | 135.0 | 5–18 | |
| Flakt | FGAC | 383 | 1463 | 63.0 | 218.0 | 6–20 | |
| TRANE | GVAF XP-G | 453 | 1243 | 145.0 | 280.0 | 14–24 | |
| TRANE | RTAF HSE | 741 | 1618 | 138.0 | 222.0 | 16–24 | |
| R410A | Carrier | Aqua Snap 30RAP | 38 | 527 | 3.8 | 54.2 | 1–10 |
| Swegon | Beta Rev | 40 | 233 | 3.7 | 21.0 | 2–4 | |
| TRANE | CGAM | 70 | 457 | 13.6 | 69.8 | 2–10 | |
| Swegon | TETRIS 2 | 108 | 913 | 11.5 | 80.0 | 2–12 | |
| Daikin | Trailblazer | 109 | 847 | 12.7 | 100.7 | 4–14 | |
| TRANE | Ascend | 492 | 808 | 51.6 | 94.0 | 8–12 | |
| R454B | Flakt | FGAC DG | 40 | 866 | 13.8 | 276.8 | 4–12 |
| Swegon | Zeta SKY | 42 | 233 | 13.4 | 84.2 | 2–4 | |
| R513A | Swegon | Kappa Sky | 243 | 1260 | 38.0 | 165.0 | 5–22 |
| Flakt | FGAC AE2 | 479 | 1697 | 79.0 | 288.0 | 6–20 |
Table 5.
Relative values of GWP 100 and GWP 20 with respect to the reference value of GWP 100.
| Refrigerant | γ100 = GWP 100/GWP 100 | Γ20 = GWP 20/GWP 100 |
|---|---|---|
| R717 | - * | - * |
| R290 | 1.00 | 1.00 |
| R744 | 1.00 | 1.00 |
| R1234ze | 1.00 | 4.00 |
| 1234yf | 1.00 | 1.00 |
| R454B | 1.00 | 3.47 |
| R513A | 1.00 | 2.83 |
| R32 | 1.00 | 3.59 |
| R134a | 1.00 | 2.80 |
| R407C | 1.00 | 2.41 |
| R410A | 1.00 | 2.09 |
| R125 | 1.00 | 1.82 |
* Not presented because GWP 20 and GWP 100 equals 0.
Table 6.
Ranges used for presenting the values of CO2 equivalent released to the atmosphere for GWP 100 and GWP 20.
Table 6.
Ranges used for presenting the values of CO2 equivalent released to the atmosphere for GWP 100 and GWP 20.
| Range | GWP 100 CO2e (kg) | GWP 20 CO2e (kg) |
|---|---|---|
| I | <1000 | <10,000 |
| II | <100,000 | <250,000 |
| III | >100,000 | >250,000 |
Table 7.
Transport and physical properties for R410A and its substituents.
| Transport Properties * | Physical Properties | |||||
|---|---|---|---|---|---|---|
| Refrigerant | Density [kg/m3] | Viscosity [µPa·s] | Thermal Conductivity [W/m·K] | Critical Temp. [°C] | Evaporation Temp. [°C] | Condensation Temp. [°C] |
| R410A | 1062 | 119 | 0.0880 | 72 | −51 | 43 |
| R454B | 985 | 115 | 0.1055 | 77 | −51 | 47 |
| R32 | 959 | 114 | 0.1259 | 78 | −52 | 42 |
* Saturated liquid at 25 °C.
Table 8.
Transport and physical properties for R134a and its substituents.
| Transport Properties * | Physical Properties | |||||
|---|---|---|---|---|---|---|
| Refrigerant | Density [kg/m3] | Viscosity [µPa·s] | Thermal Conductivity [W/m·K] | Critical Temp. [°C] | Evaporation Temp. [°C] | Condensation Temp. [°C] |
| R134a | 1206 | 200 | 0.0830 | 101 | −26 | 80 |
| R513A | 1171 | 166 | 0.0699 | 97 | −30 | 78 |
| R1234ze | 1163 | 190 | 0.0742 | 110 | −18 | 92 |
* Saturated liquid at 25 °C.
Table 9.
Comparison between the GWP 20/GWP 100 ratio, safety class, and practical concentration limit for refrigerants commonly used in air-conditioning systems.
Table 9.
Comparison between the GWP 20/GWP 100 ratio, safety class, and practical concentration limit for refrigerants commonly used in air-conditioning systems.
| Transport Properties | |||
|---|---|---|---|
| Refrigerant | GWP 20/GWP 100 | Safety Classes | Practical Concentration Limit [kg/m3] |
| Homogeneous substances | |||
| R32 | 3.59 | A2L | 0.061 |
| R134A | 2.8 | A1 | 0.25 |
| R290 | 1 | A3 | 0.008 |
| R717 | - * | B2 | 0.00035 |
| R744 | 1 | A1 | 0.07 |
| R1234ze | 4 | A1 | N/A ** |
| Heterogeneous substances | |||
| R407C | 2.41 | A1 | 0.31 |
| R410A | 2.09 | A1 | 0.44 |
| R454B | 3.47 | A2L | N/A |
| R513A | 2.83 | A1 | 0.35 |
* Not presented because GWP 20 and GWP 100 equals 0. ** N/A the data is not yet available.
Publisher’s Note: MDPI stays neutral with regard to jurisdictional claims in published maps and institutional affiliations. |
© 2022 by the authors. Licensee MDPI, Basel, Switzerland. This article is an open access article distributed under the terms and conditions of the Creative Commons Attribution (CC BY) license (https://creativecommons.org/licenses/by/4.0/).
Share and Cite
MDPI and ACS Style
Szczęśniak, S.; Stefaniak, Ł. Global Warming Potential of New Gaseous Refrigerants Used in Chillers in HVAC Systems. Energies 2022, 15, 5999. https://0-doi-org.brum.beds.ac.uk/10.3390/en15165999
AMA Style
Szczęśniak S, Stefaniak Ł. Global Warming Potential of New Gaseous Refrigerants Used in Chillers in HVAC Systems. Energies. 2022; 15(16):5999. https://0-doi-org.brum.beds.ac.uk/10.3390/en15165999
Chicago/Turabian StyleSzczęśniak, Sylwia, and Łukasz Stefaniak. 2022. "Global Warming Potential of New Gaseous Refrigerants Used in Chillers in HVAC Systems" Energies 15, no. 16: 5999. https://0-doi-org.brum.beds.ac.uk/10.3390/en15165999
Note that from the first issue of 2016, this journal uses article numbers instead of page numbers. See further details here.