
Thermal Degradation and Organic Chlorine Removal from Mixed Plastic Wastes

1
Department of Mechanical Engineering, Michigan Technological University, Houghton, MI 49931, USA
2
Department of Forest, Rangeland and Fire Sciences, University of Idaho, Moscow, ID 83844, USA
*
Author to whom correspondence should be addressed.
Energies 2022, 15(16), 6058; https://0-doi-org.brum.beds.ac.uk/10.3390/en15166058
Submission received: 1 August 2022
/
Revised: 18 August 2022
/
Accepted: 18 August 2022
/
Published: 21 August 2022
(This article belongs to the Topic Waste-to-Energy)
Abstract
:Plastic waste accumulation has been growing due to the increase in plastic generation and the lack of infrastructure for recycling. One of the approaches is to treat the mixed plastic waste (MPW) through thermal processes to produce feedstocks for other applications. However, the presence of polyvinyl chloride (PVC) in MPW would produce HCl during processing and has negative impacts (emission, catalyst poisoning, etc.). In addition, due to the high heterogeneity of MPW, it is difficult to generate consistent experimental data. In this study, MPW was homogenized through double compounding–extrusion and then formed into a sheet to be treated at 400 °C. The solid products at various mass losses were characterized by heat and chlorine content, Fourier-transform infrared (FTIR) spectroscopy, and elemental composition analysis. It was found that the thermal degradation of MPW started at ~260 °C. The chlorine removal efficiency increased with mass loss and reached an asymptotic value of ~84% at ~28% mass loss, and the remaining chlorine can be attributed to inorganic sources. A PVC de-chlorination model was developed for MPW using TGA data for PVC and MPW to determine organic chlorine removal efficiency. These results show that PVC de-chlorination was not affected by other plastics at this temperature. As the mass loss increases, the heat content first increases and then decreases. It was found that mass loss is a universal parameter for organic chlorine removal efficiency and heat content. The elemental composition analysis and FTIR spectroscopy also shed more light into the chemical changes during MPW thermal degradation.
1. Introduction
The generation of plastic has been increasing globally, but the plastic recycling infrastructure is still lacking [1,2]. The current mechanical recycling technologies require multiple steps, which is rather costly, and the efficiency is not satisfactory for mixed plastic wastes (MPW) [3]; for example, the overall plastic recycling rate in the United States was 8.7% in 2018 [4]. The majority of the non-recycled MPW is landfilled, with some being recovered for energy [5], or they end up in the ocean and inland, which is causing significant damage to both environment and human health [6]. Therefore, it is essential to find other methods to deal with the accumulation of MPW.
There is a growing interest in treating MPW and using it as feedstock for various applications such as catalytic depolymerization and pyrolysis [7,8,9,10,11,12]. However, for catalytic depolymerization of MPW, it was found that chlorine from polyvinyl chloride (PVC) could deactivate or poison the catalysts [13,14,15]. The negative impact on the catalyst could be attributed to exposure to gaseous HCl that causes changes to surface microstructures [16]. Further, the HCl produced during the combustion/pyrolysis could cause corrosion and emissions that would create negative environmental and public health impacts [17,18]. Since PVC is one of the components of the MPW stream (840,000 tons in the US in 2018 with neglected amounts being recycled), one of the major hurdles of using MPW as feedstock is the existence of PVC due to its high level of chlorine [19].
Various methods of chlorine removal from PVC have been studied. Inoue et al. studied de-chlorination methods through co-grinding PVC with CaO, Fe2O3, SiO2 and Al2O3, followed by water washing to remove the soluble chlorine [20]. However, the grinding process takes up to six hours, and the water needs to be dried after the processes. The thermal decomposition of PVC has been also been proven to be able to remove chlorine and it is less time-consuming [21,22,23,24,25].
Chlorine removal from wastes has also been studied. Kakuta et al. melted plastic wastes with a mixture of converter dust and heavy oil bottom component of coal tar to detach the chlorine from PVC [26]. However, this requires the use of hot water to extract the produced iron chloride, which requires an additional process to treat the water. Cho et al. pyrolyzed MPW at 660–780 °C in a fluidized-bed reactor and used various additives to help remove chlorine in the oil product. It was found that the addition of calcium oxide, calcium hydroxide, and oyster shells into the feedstock could reduce the chlorine from 350 to around 50 ppm [27]. Park et al. used a continuous two-stage reactor to produce oil with low levels of chlorine; the reactor consists of an auger followed by pyrolysis in a fluidized bed device [28]. The auger operates at 300–400 °C, and the HCl produced during the process is removed by a lime hot filter before the pyrolysis zone, and they used blends with 4% PVC and 96% low-density polyethylene (LDPE), reducing chlorine content of the final oil product to 9.25 ppm. This study showed the effectiveness of chlorine removal through thermal treatment; however, it only focused on PVC and LDPE, and the chemical insight into the process is also lacking. Therefore, it can be concluded that further work is required on MPW de-chlorination, which could greatly help to explore its potential use as feedstock for further applications.
The above review dealt with the removal of HCl due to its negative effects on catalytic processes and emission control. Most of the chlorine removal approach is through thermally treating the material to release the chlorine from PVC. Therefore, during the de-chlorination of PVC in MPW, it is essential to study the chemical changes of MPW during thermal degradation. The majority of the existing studies on thermal degradation of MPW focused on MPW pyrolysis [29,30,31,32,33]. These studies mainly focused on the liquid product of MPW pyrolysis, with the remaining solid product being mostly char. In addition, it is unclear if there are any interactions between PVC and other plastics in MPW during the thermal degradation process.
The current study focuses on the thermal degradation and organic de-chlorination of MPW at 400 °C, which is practical for industrial applications. In this study, thermal degradation of MPW was investigated by characterizing the solid products at different extents of thermal treatment, focusing on organic de-chlorination, potential interactions between PVC and other plastics, process parameter optimization, and chemical changes during the process.
2. Materials and Methods
2.1. Materials
MPW was provided by Convergen Energy (CE), Green Bay, WI, which originates from industrial residues in the plastic industry. The MPW was then treated by CE to remove metal, stone, glass and other inert material. After several stages of processing, the MPW was shredded into 100 × 100 mm flakes, with density at around 30–50 kg/m3. The MPW was then sent to our team and shredded into 2–4 mm flakes by a shredder (Allegheny, model 16-75CX, Allegheny Shreeders, Delmont, PA, USA). The shredded MPW (shown in Figure S1 in Supplementary Material—Additional Figures and Tables) small flakes were characterized by FTIR spectroscopy (see Section 2.9). The PVC sample (powder form) used in the study is directly from Shintech Inc. (Houston, TX, USA). (grade SE-950, density = 1.494 g/cm3).
Compounding Extrusion. The obtained MPW consists of a variety of plastic components and has rather high heterogeneity, which results in a large scatter in the characterization. To prepare a uniform MPW sample, we used a previously developed method of compounding–extrusion to significantly increase the homogeneity of the waste material [34]. The shredded MPW (6 kg) was manually fed into a co-rotating twin-screw extruder (Leistritz, L/D ratio of 40, 200 rpm, barrel temperature 160 °C, 4.7 kW motor, base torque 18%) to form rods (9 mm OD). The rods were milled with a plastic granulator with a 6 mm sized screen (Sterling BP608, New Berlin, WI, USA). To produce a homogeneous material, the milled extruded MPW was compounded–extruded a second time, using a K-Tron weight loss feeder (1 kg/h), to form a uniform rod, and then re-granulated, as described above.
2.2. Ash Content
The ash content analysis was performed following the ASTM standard for thermoplastics, D5630-94. The sample (2 g) in a tared crucible was furnaced (Lindenberg/Blue type BF51828C-1) at 900 °C, with air flowing for 20 min and then placed in a desiccator for 5 min to cool. The crucible with the residue was weighed to obtain the ash content.
2.3. Sample Preparation for Thermal Degradation
To prepare a uniform sample for thermal degradation, 100 g of granulated MPW was evenly distributed on a tray made from carbon steel sheet (details in Section 2.4). The sample was then covered by the aluminum foil with an 8 kg steel weight that was placed on top of the sample and inserted into an oven at 210 °C to melt the sample and to produce a uniform sheet (228 × 228 × 3.8 mm); the sample was then cooled for over an hour under nitrogen and used for subsequent experiments.
2.4. Experimental Setup for Thermal Degradation
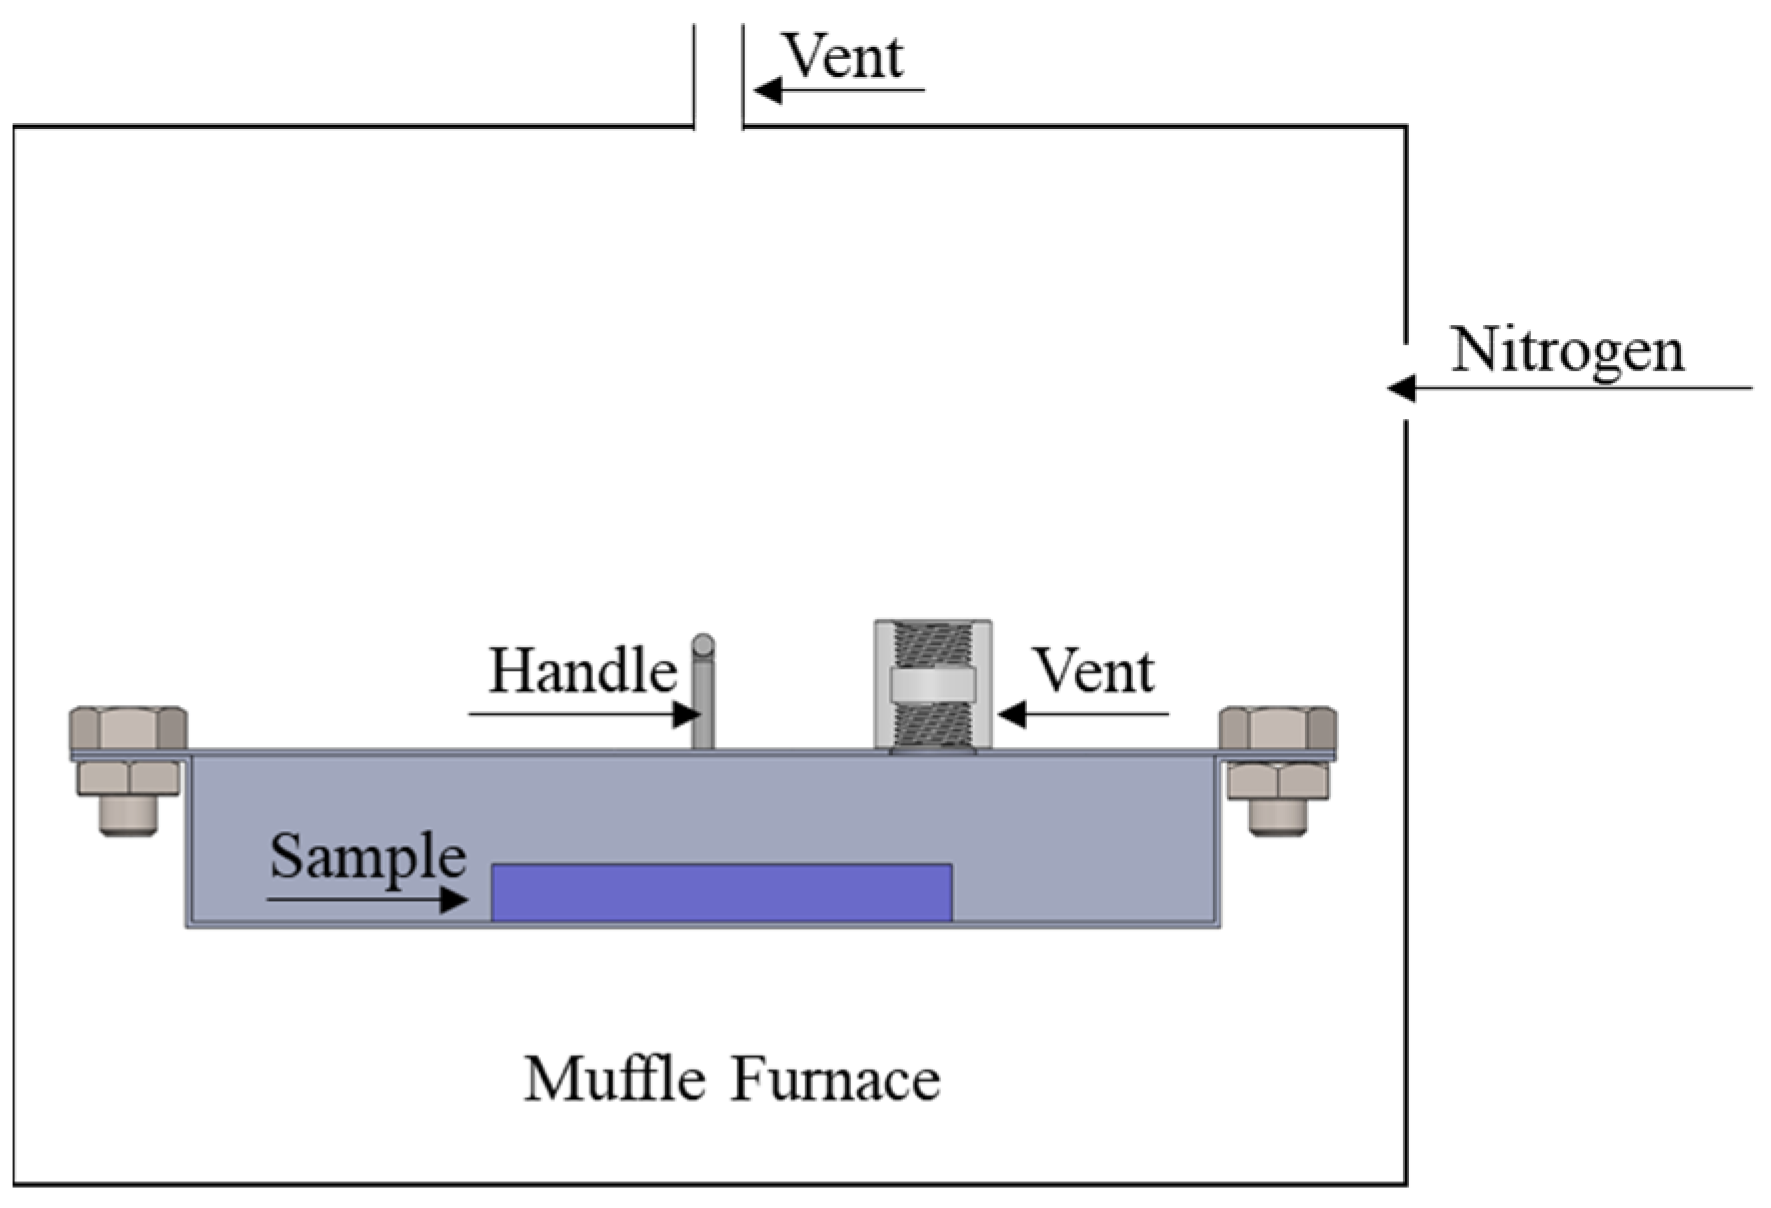
Specimens (147 × 89 × 3.8 mm) of MPW sheet (~20 g) were cut from the prepared sheet and placed in a heated reactor chamber inserted in a muffle furnace at 400 °C for residence times between 0 and 900 min with a nitrogen purge. Limited experiments at 300 and 450 °C were also carried out in the same setup (detailed in Figure S2 in Supplementary Material—Additional Figures and Tables).
The reactor (detailed in Figure 1) was made from carbon steel sheets (1.3 mm thick), which consists of two parts: (i) a lid with a handle and a 19.05 mm diameter stainless steel NPT female straight adapter that were both welded to the lid; and (ii) a box (254 × 254 × 25.4 mm) where the sample was placed. The reactor was sealed with a high-temperature graphite gasket, with a vent on the top of the cover to release all the volatile gases produced during the process. After a pre-determined residence time, the reactor was taken out of the furnace and cooled by forced convection, and the vent was sealed during the process to avoid any potential oxidation. The initial and final masses of the sample were noted to determine the mass loss for each experiment.
2.5. Elemental Composition Analysis
For elemental composition analysis (C/H/N/O), a Costech ECS 4010 CHNSO Analyzer was used. The MPW samples at various mass losses were prepared by pulverizing the sample in a Hardgrove Grindability Tester (Preiser Scientific Z90-9300-01) followed by high-shear grinder (stainless steel blades and 24,000 rpm) with the help of liquid nitrogen. In the analysis, the sample was burned in the combustion chamber of the analyzer, and the gases were then separated in a GC separation column and detected by a thermal conductivity detector, which generates a signal proportional to its amount of elemental composition.
2.6. Thermogravimetric Analysis (TGA)
According to Section 4.2, the heating rate of MPW inside the reactor is around 30 °C/min. Therefore, TGA of PVC powder (~5 mg) was carried out from 25 to 400 °C with a heating rate of 30 °C/min and remained isothermal for 60 min in a nitrogen atmosphere (30 mL/min). The results were analyzed by the Pyris v13 software (Perkin Elmer, Waltham, MA, USA).
2.7. Heat Content
A bomb calorimeter (Parr 6100) was used to measure the heat content of the MPW sample (~1 g). According to ASTM D4208-18, 2% Na2CO3 solution (5 mL) was added in the bottom of the vessel to help dissolve the HCl produced during the combustion. The vessel was then filled with oxygen and submerged motionless inside a jacket filled with 2000 g distilled water. A fuse wire ignited the sample, and the water temperature then increased in the jacket and was continuously recorded until it stabilized. The heat content of the MPW sample was calculated according to the temperature difference.
2.8. Chlorine Content
After the completion of the sample combustion in the bomb calorimeter, the vessel was kept for 15 min to aid in HCl dissolution. The vessel pressure was released gradually over 2 min, then opened, and its internal surface was washed entirely with de-ionized water and transferred into a 100 mL beaker, keeping the total volume in the range of 80–90 mL. Then, 2 mL of ionic strength adjuster (5 M NaNO3) was added to the beaker. The chlorine content of the solution was measured using an Oakton Ion 700 Cl-meter following the ASTM standard D4208-18. The chloride ion-selective electrode was calibrated using three standard solutions that include 1, 10 and 100 ppm chloride, which were prepared by diluting a 1000 ppm chloride standard, stirring it by a magnetic stirrer while adding 2 mL of ionic strength adjuster. The calibration was performed using this standard solution every 1–2 h to minimize experimental errors. The calibrated electrode was used to measure the concentration of chloride in the solution, and the chlorine content of the solid sample was calculated accordingly.
2.9. FTIR Spectroscopy
The spectra of unprocessed MPW (hundreds randomly selected pieces), double extruded MPW, and thermally treated MPW samples at different mass losses were obtained using a Nicolet-iS5 FTIR spectrometer, in the range of 600 to 4000 cm−1 wavelength, with an attenuated total reflectance accessory (ZnSe crystal, iD5); 64 scans were performed for each test, and baseline corrections were performed for the spectra. The spectral data were analyzed using OMNIC v9.8 software (Thermo Fisher Scientific, Waltham, MA, USA) and Aldrich, Hummel, and Nicolet spectral libraries.
3. Heat Transfer Modeling
As discussed in Section 2.4, for the thermal degradation experiments, the setup includes a sample placed in the reactor that was inserted into the muffle furnace. The reactor and sample (initially at 25 °C) were placed into the muffle furnace (pre-heated to the desired temperature), gradually reaching the furnace temperature. Heating was performed by convection from the furnace walls to the reactor walls, followed by sample heating, a combination of convection and conduction. As the sample temperature was not measured in real time, the temperature transients of the reactor and sample were calculated through heat transfer modeling. The details of the heat transfer model development are provided in Supplementary Material—Heat transfer Model Development.
The temperature of the sample could be calculated by the following equation:
where is defined as , and where represent the temperature of the sample, represents the temperature of the reactor wall. is the characteristic time of the sample, defined as , where m is the sample mass, h is the convective heat coefficient, is heat capacity of the sample, is the thermal conductivity of the sample and l is the length of the sample. for the sample was calculated to be 484.2 s.
4. Results and Discussion
4.1. MPW Composition
The shredded MPW was characterized by FTIR spectroscopy. It was shown that the major components in the blend are polyethylene-terephthalate (PET), polyethylene (PE), polyethylene vinyl acetate (PEVA), polypropylene (PP), and polyamide nylon.
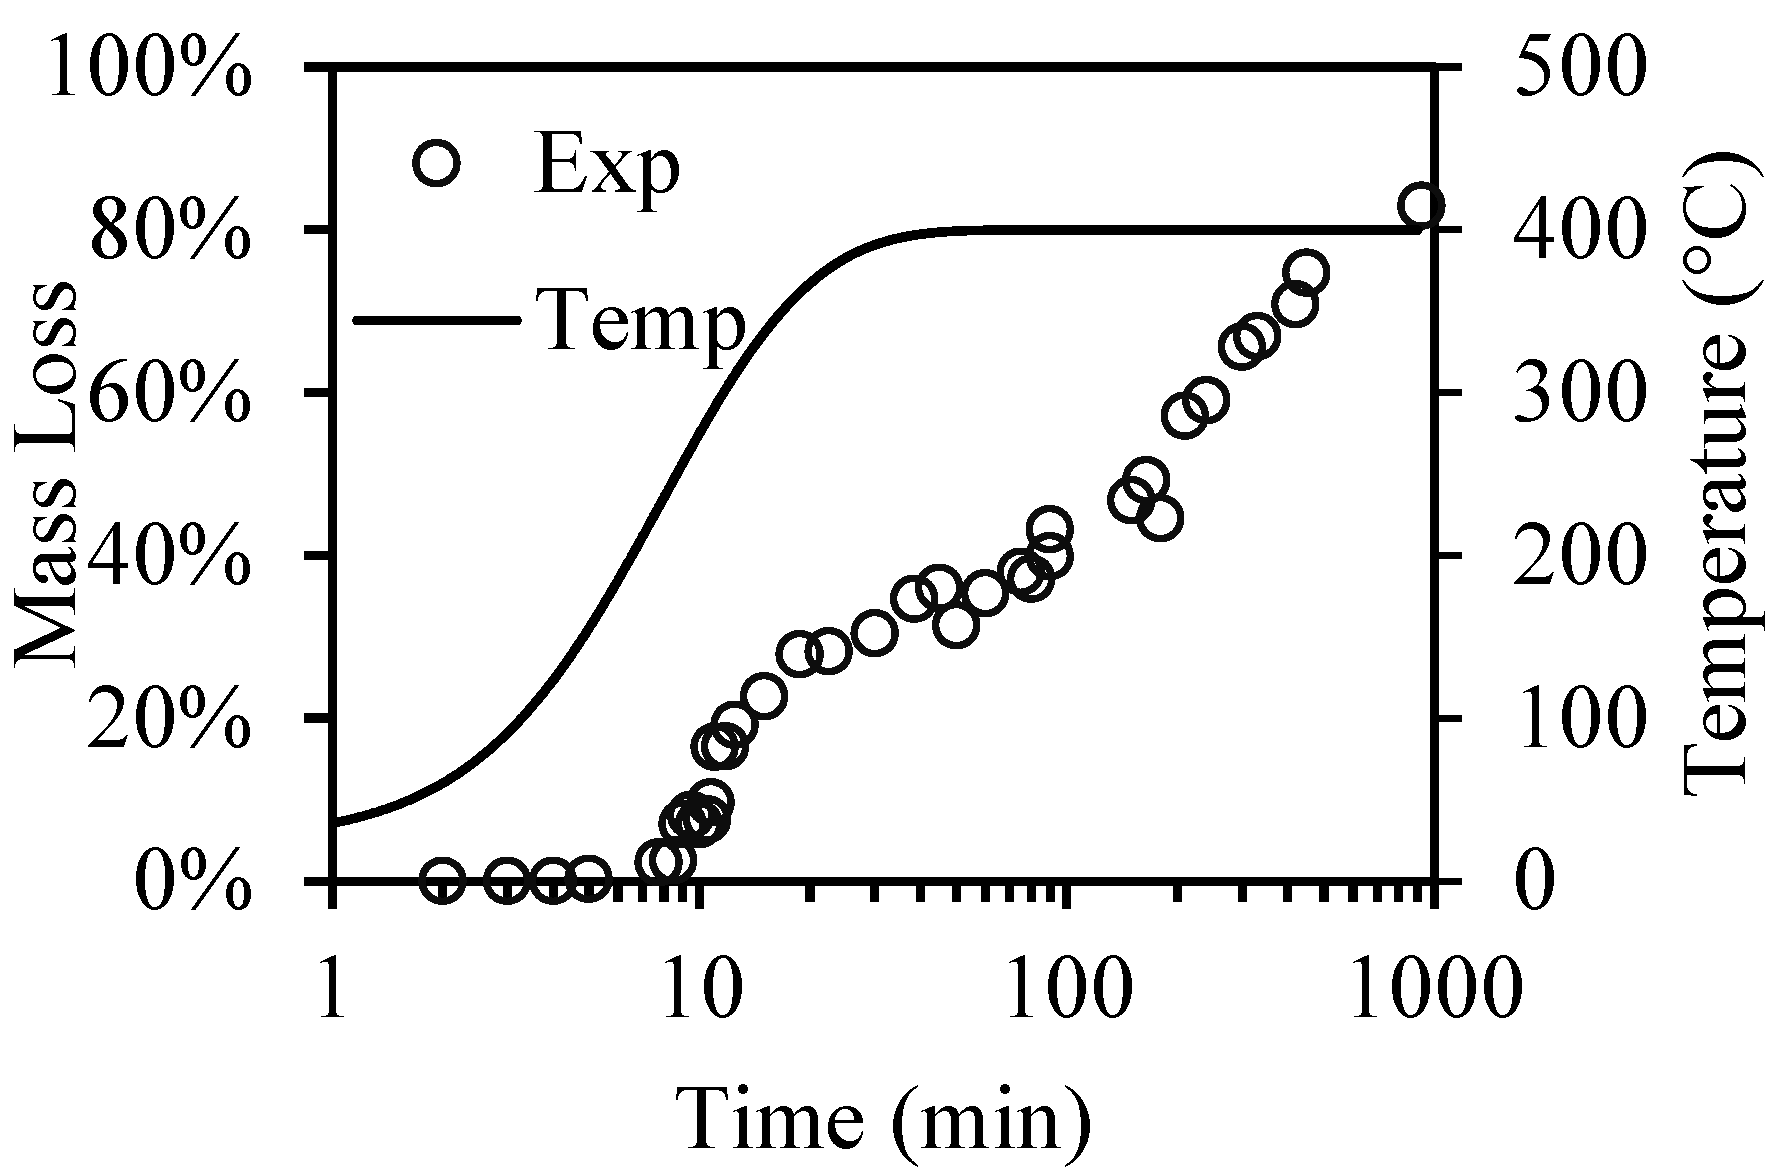
4.2. Mass Loss and Temperature Transient
The mass loss of MPW at 400 °C was measured, and the temperature transient was calculated according to Equation (1) (Figure 2). This shows the calculated temperature transient and mass loss vs. time at 400 °C (in logarithmic scale) for the 400 °C experiments. The temperature increases with time. With most of the transient, the temperature increases linearly with time, at around 30 °C/min. After around 8 min, when the temperature reaches ~260 °C, the mass loss starts to increase due to the release of volatiles. This behavior can be attributed to the thermal degradation of PE or PVC, since these polymers would start to decompose at similar temperatures [21,35], while PP, PEVA and PET would only start decomposing at higher temperatures in the absence of oxygen [35,36,37]. The mass loss increases as time increases and reaches around 83% after 900 min.
4.3. Organic Chlorine Removal
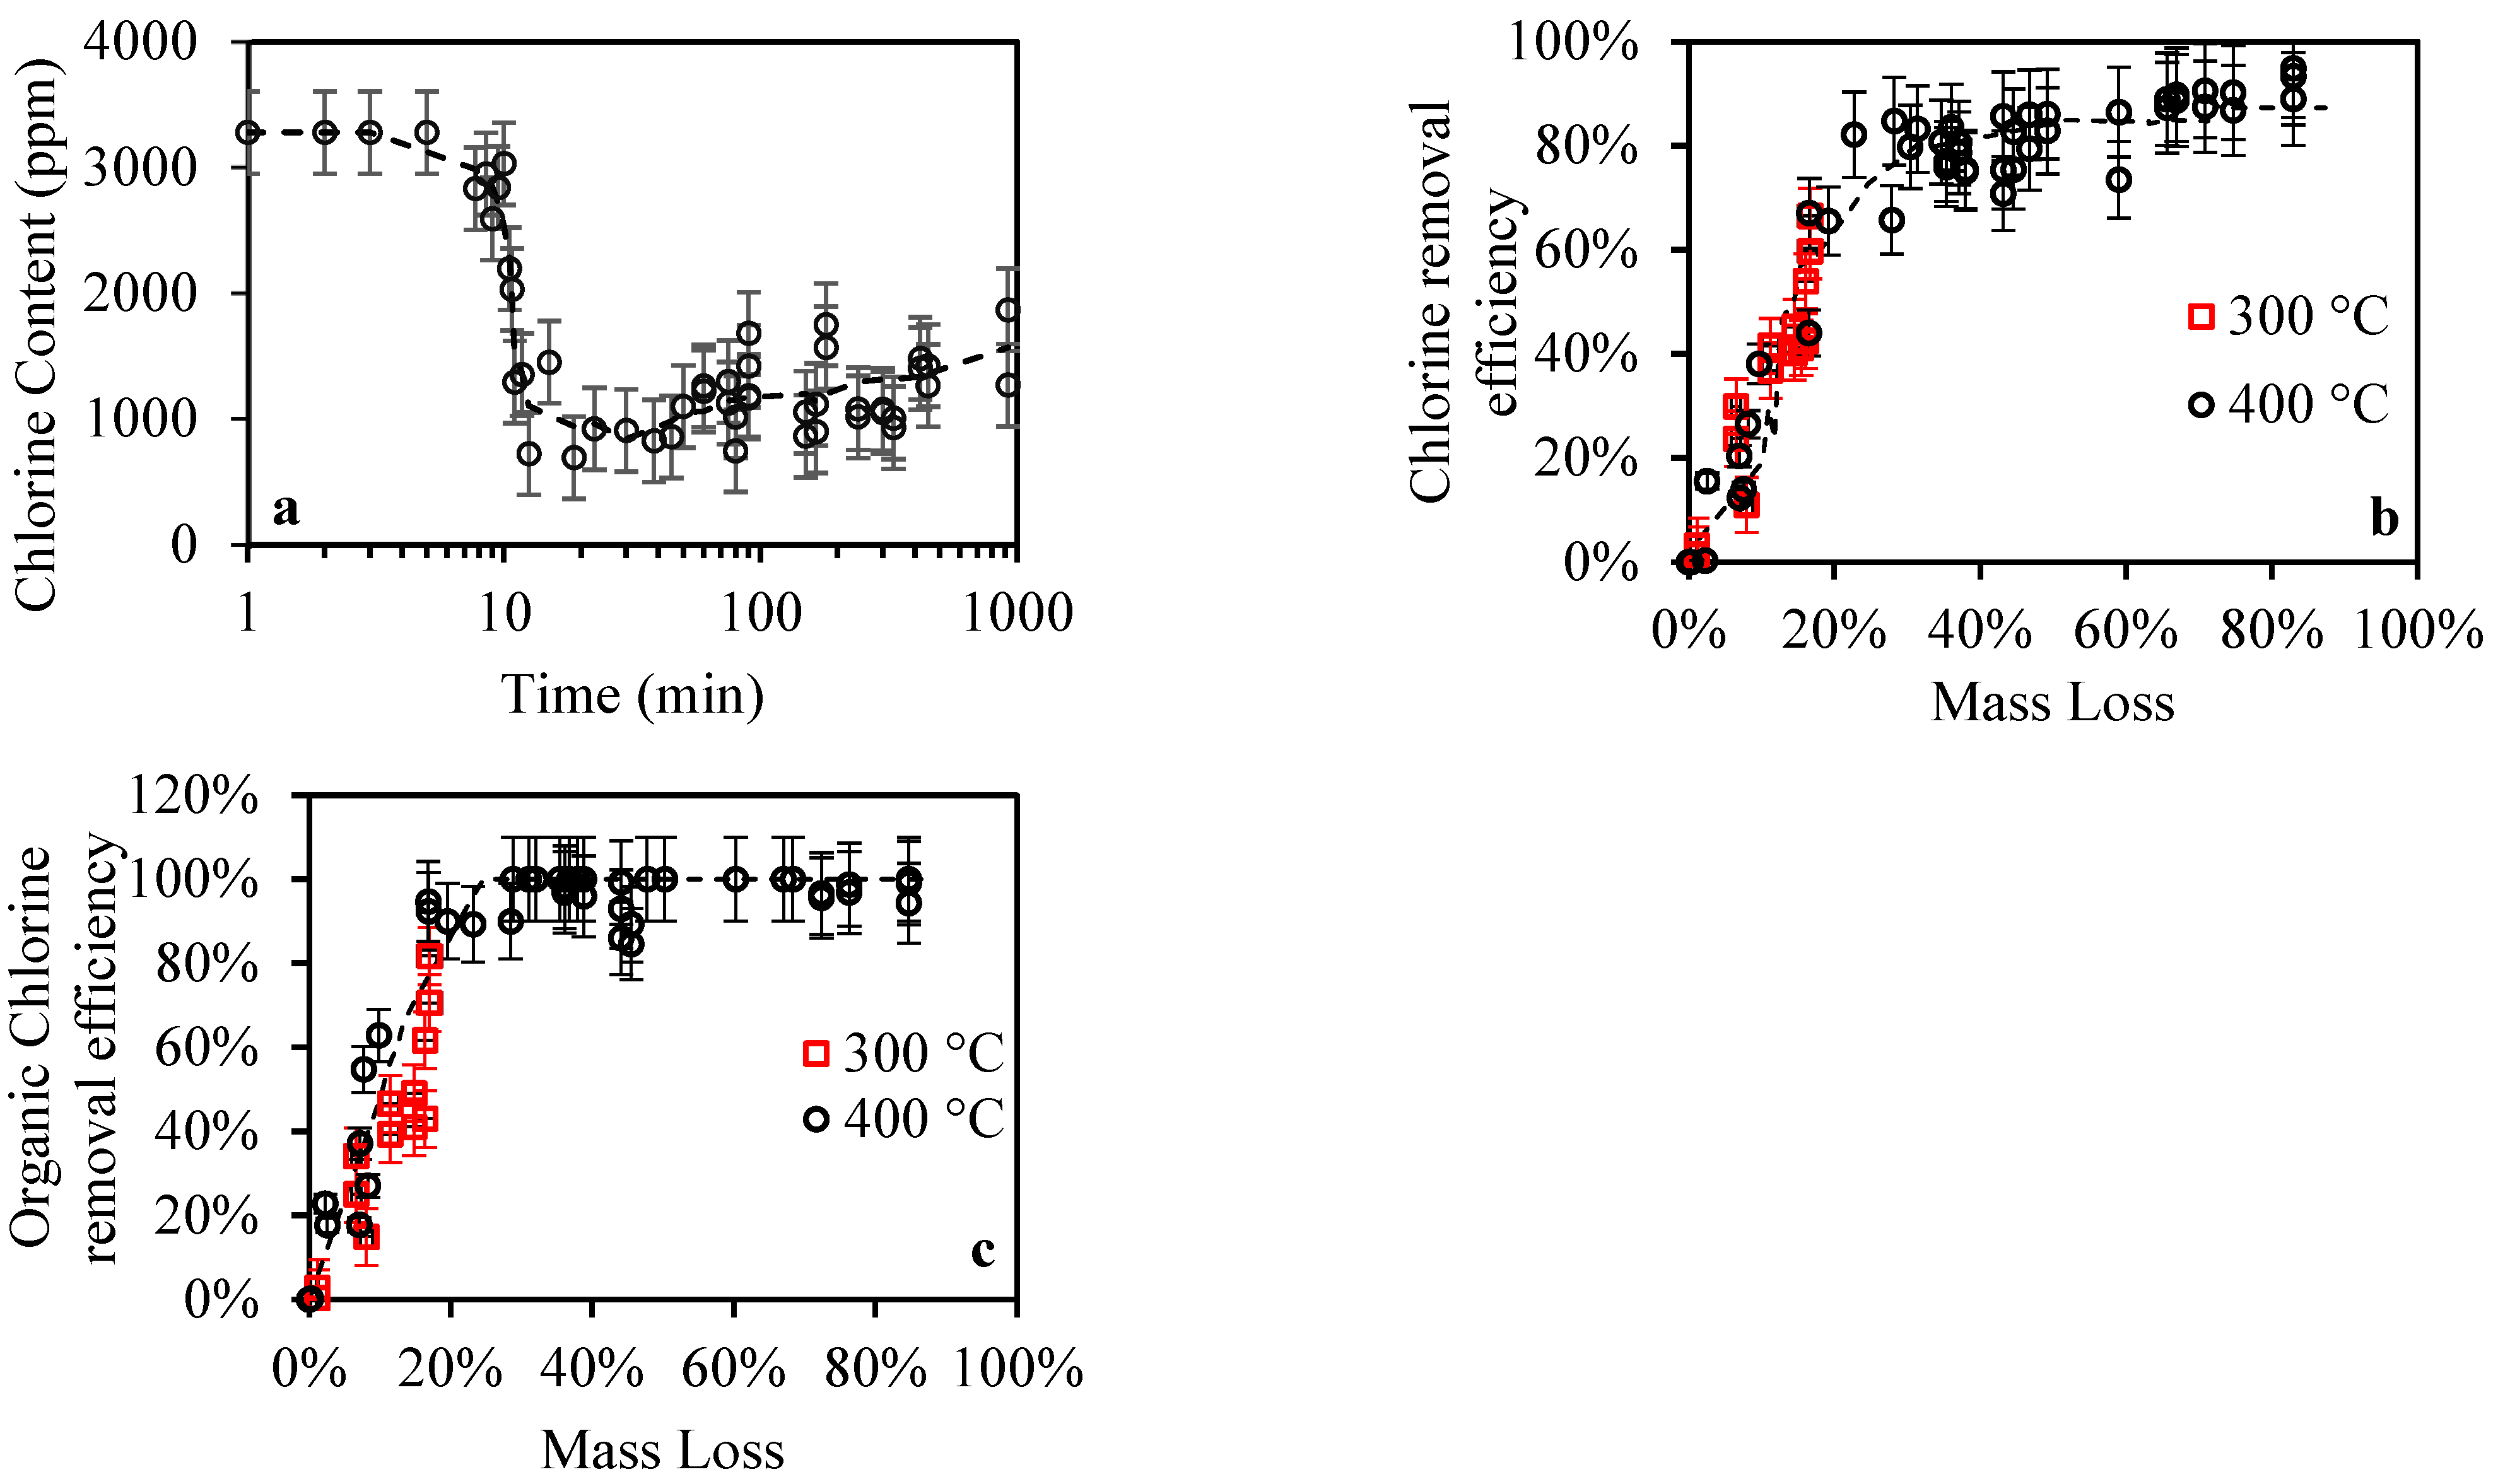
As mentioned above, the existence of chlorine is one of the major hurdles of using MPW as feedstock for various applications. Figure 3a shows the chlorine content in MPW with time at 400 °C, with an initial value of ~3280 ppm, decreasing due to thermal degradation of PVC [18]. Although the initial chlorine content seems rather low, it has been reported that 50 ppm of HCl could poison the catalyst at temperature as low as 200 °C [15]. The chlorine content reduces to ~800 ppm at ~20 min, after which it gradually increases. It was found that during thermal degradation, all the chlorine from PVC is released as HCl, which also indicates that this approach could remove chlorine from organic-chlorinated bound material with high chlorine content [21]. Xu et al. [17] suggested that the behavior observed in Figure 3a can be attributed to two types of chlorine, organically bound that can be released entirely, and inorganically bound that is not released at these temperatures [38]. After the release of all organically bound chlorine (at ~20 min), as the thermal degradation proceeds, more organic material is released to the gas phase, but the chloride remains in the sample (attributed to mineral chlorine), increasing its fraction accordingly.
Figure 3b depicts the total chlorine removal efficiency as a function of mass loss. Most of the results are for 400 °C with some results performed for 300 °C in the same experimental setup, showing that the de-chlorination process depends on mass loss regardless of temperature and residence time. Figure 3b shows that the chlorine removal efficiency increases with mass loss, reaching an asymptotic value of ~84% at ~28% mass loss, and the remaining 16% Cl is attributed to inorganic sources (various salts such as KCl, NaCl, etc.) [39]. This indicates that regardless of reaction temperature and residence time, mass loss is the universal parameter for organic chlorine removal. Although all of the organic chlorine has been released at ~20 min, it has been reported that the inorganic chlorine could also deactivate the catalyst or contribute to the formation of dioxins at higher temperatures [40,41,42]. Therefore, it is also essential to removal the inorganic chlorine from the MPW, and water washing is a promising method of inorganic chlorine removal since the majority of them are water-soluble [43,44].
Ash content of untreated MPW samples was measured, yielding rather consistent results (2.1% ± 0.02%) with less than 1% uncertainty. The results of Figure 3b were re-plotted for organic chlorine removal efficiency on a mineral-free basis, shown in Figure 3c. The results indicate that the removal efficiency reached 100% at around 28% mass loss. The results of chlorine removal efficiency, shown in Figure 3b, are applicable only for the studied MPW, and for a different plastic mixture, this analysis would need to be repeated. Generally, it is expected that the qualitative behavior of organic chlorine removal from MPW should be similar to what was observed in this study.
4.4. Kinetic Modeling of MPW Organic De-Chlorination
To obtain further insights into the de-chlorination process of MPW during thermal degradation, we developed a kinetic model for MPW de-chlorination. According to the limited results from our previous work, no interactions between PVC and its surrounding materials in the wastes at 400 °C were observed during thermal degradation [17]. Therefore, it was assumed that the de-chlorination of MPW can be modeled according to the kinetic model of PVC de-chlorination.
Our previous work developed a comprehensive kinetic model for PVC thermal degradation [21], consisting a four consecutive-reaction mechanisms:
where Si, ki, αi are solid products, reaction coefficients, and stoichiometric parameters for HCl of i-th reaction, respectively; and symbol g denotes gas phase. The rate coefficient ki can be determined by:
where Ai, is the pre-exponential factor, denotes the activation energy of i-th reaction, and R is the gas constant. is the temperature of the sample, which can be determined from the temperature model in Section 3.
The reaction rates of the solid materials are:
where , and , c is the concentration of the specific material, is the stoichiometric parameters for of i-th reaction.
The mass loss can be calculated as:
where y is the mass fraction of the solid material during the reaction. Details of the mass loss model development are presented in our previous work [45]. The fitting was performed by varying , and to achieve the best fit. This model was used to fit PVC TGA results (as indicated in Section 2.6). The heating rate was set at 30 °C/min, as for the MPW thermal degradation experiments described above. Figure 4a shows the temperature transient, the experimental TGA data (in mass loss) and model results, indicating an excellent fit between them. The mass loss started at around 260 °C, and the initial fast increase can be attributed to the release of HCl. Figure 4b shows the reaction rate both for the experimental results and model, with excellent fit. The rate reduced significantly after all the HCl was released (at ~700 s). Xu et al. showed that that the majority of gaseous products is HCl in the beginning, with benzene, naphthalene and other organic compounds being produced with lower rates [21] at a later time.
Since the PVC degradation is not affected by other materials at this temperature, PVC was used as a degradation model to predict the organic chlorine removal efficiency during MPW degradation. For MPW, the reaction rate of HCl release can be written as:
The detailed model development process and parameters determined by [21] were used with slight modification with activation energies due to experimental errors. Since the parameters obtained from fitting the TGA data represent the mass fractions, a scalar was applied to adjust the values for chlorine removal efficiency. To note, Figure 5 shows the organic chlorine removal efficiency with the model data, showing a good fit between the two. The model showed in the current experimental setup that all of the organic chlorine from MPW was released after ~20 min.
The kinetic parameters used to obtain the model shown in Figure 4 and Figure 5. are summarized in Table 1. The activation energies of the first two reactions are 113.2 ± 1.8 and 117.0 ± 0.3 kJ/mol, respectively. These results were close to the data by [46], where the activation energy of PVC thermal degradation was found to be 116.5 kJ/mol at temperatures lower than 280 °C.
From these data, it can be concluded that PVC degradation at 400 °C was not affected by other polymers present in the blend. This conclusion is significant since an excellent prediction of the HCl release from any given MPW composition of PVC degradation is much easier to study. This conclusion is based on a heating rate of 30 °C/min reaching 400 °C, and with other process conditions, this may not be the case.
4.5. Elemental Composition Analysis
As indicated above, at 28% mass loss, the organic chlorine was removed entirely to the gas phase. If further thermal processing is required, for example for pyrolytic products, the elemental composition of the solid material can shed light on the chemical changes of MPW. The elemental composition (C/H/N/O) of the thermally treated MPW sample at various mass losses (between 2.3% to 90.7%) was measured and detailed, and the results are tabulated in Table S1 in Supplementary Material—Additional Figures and Tables.
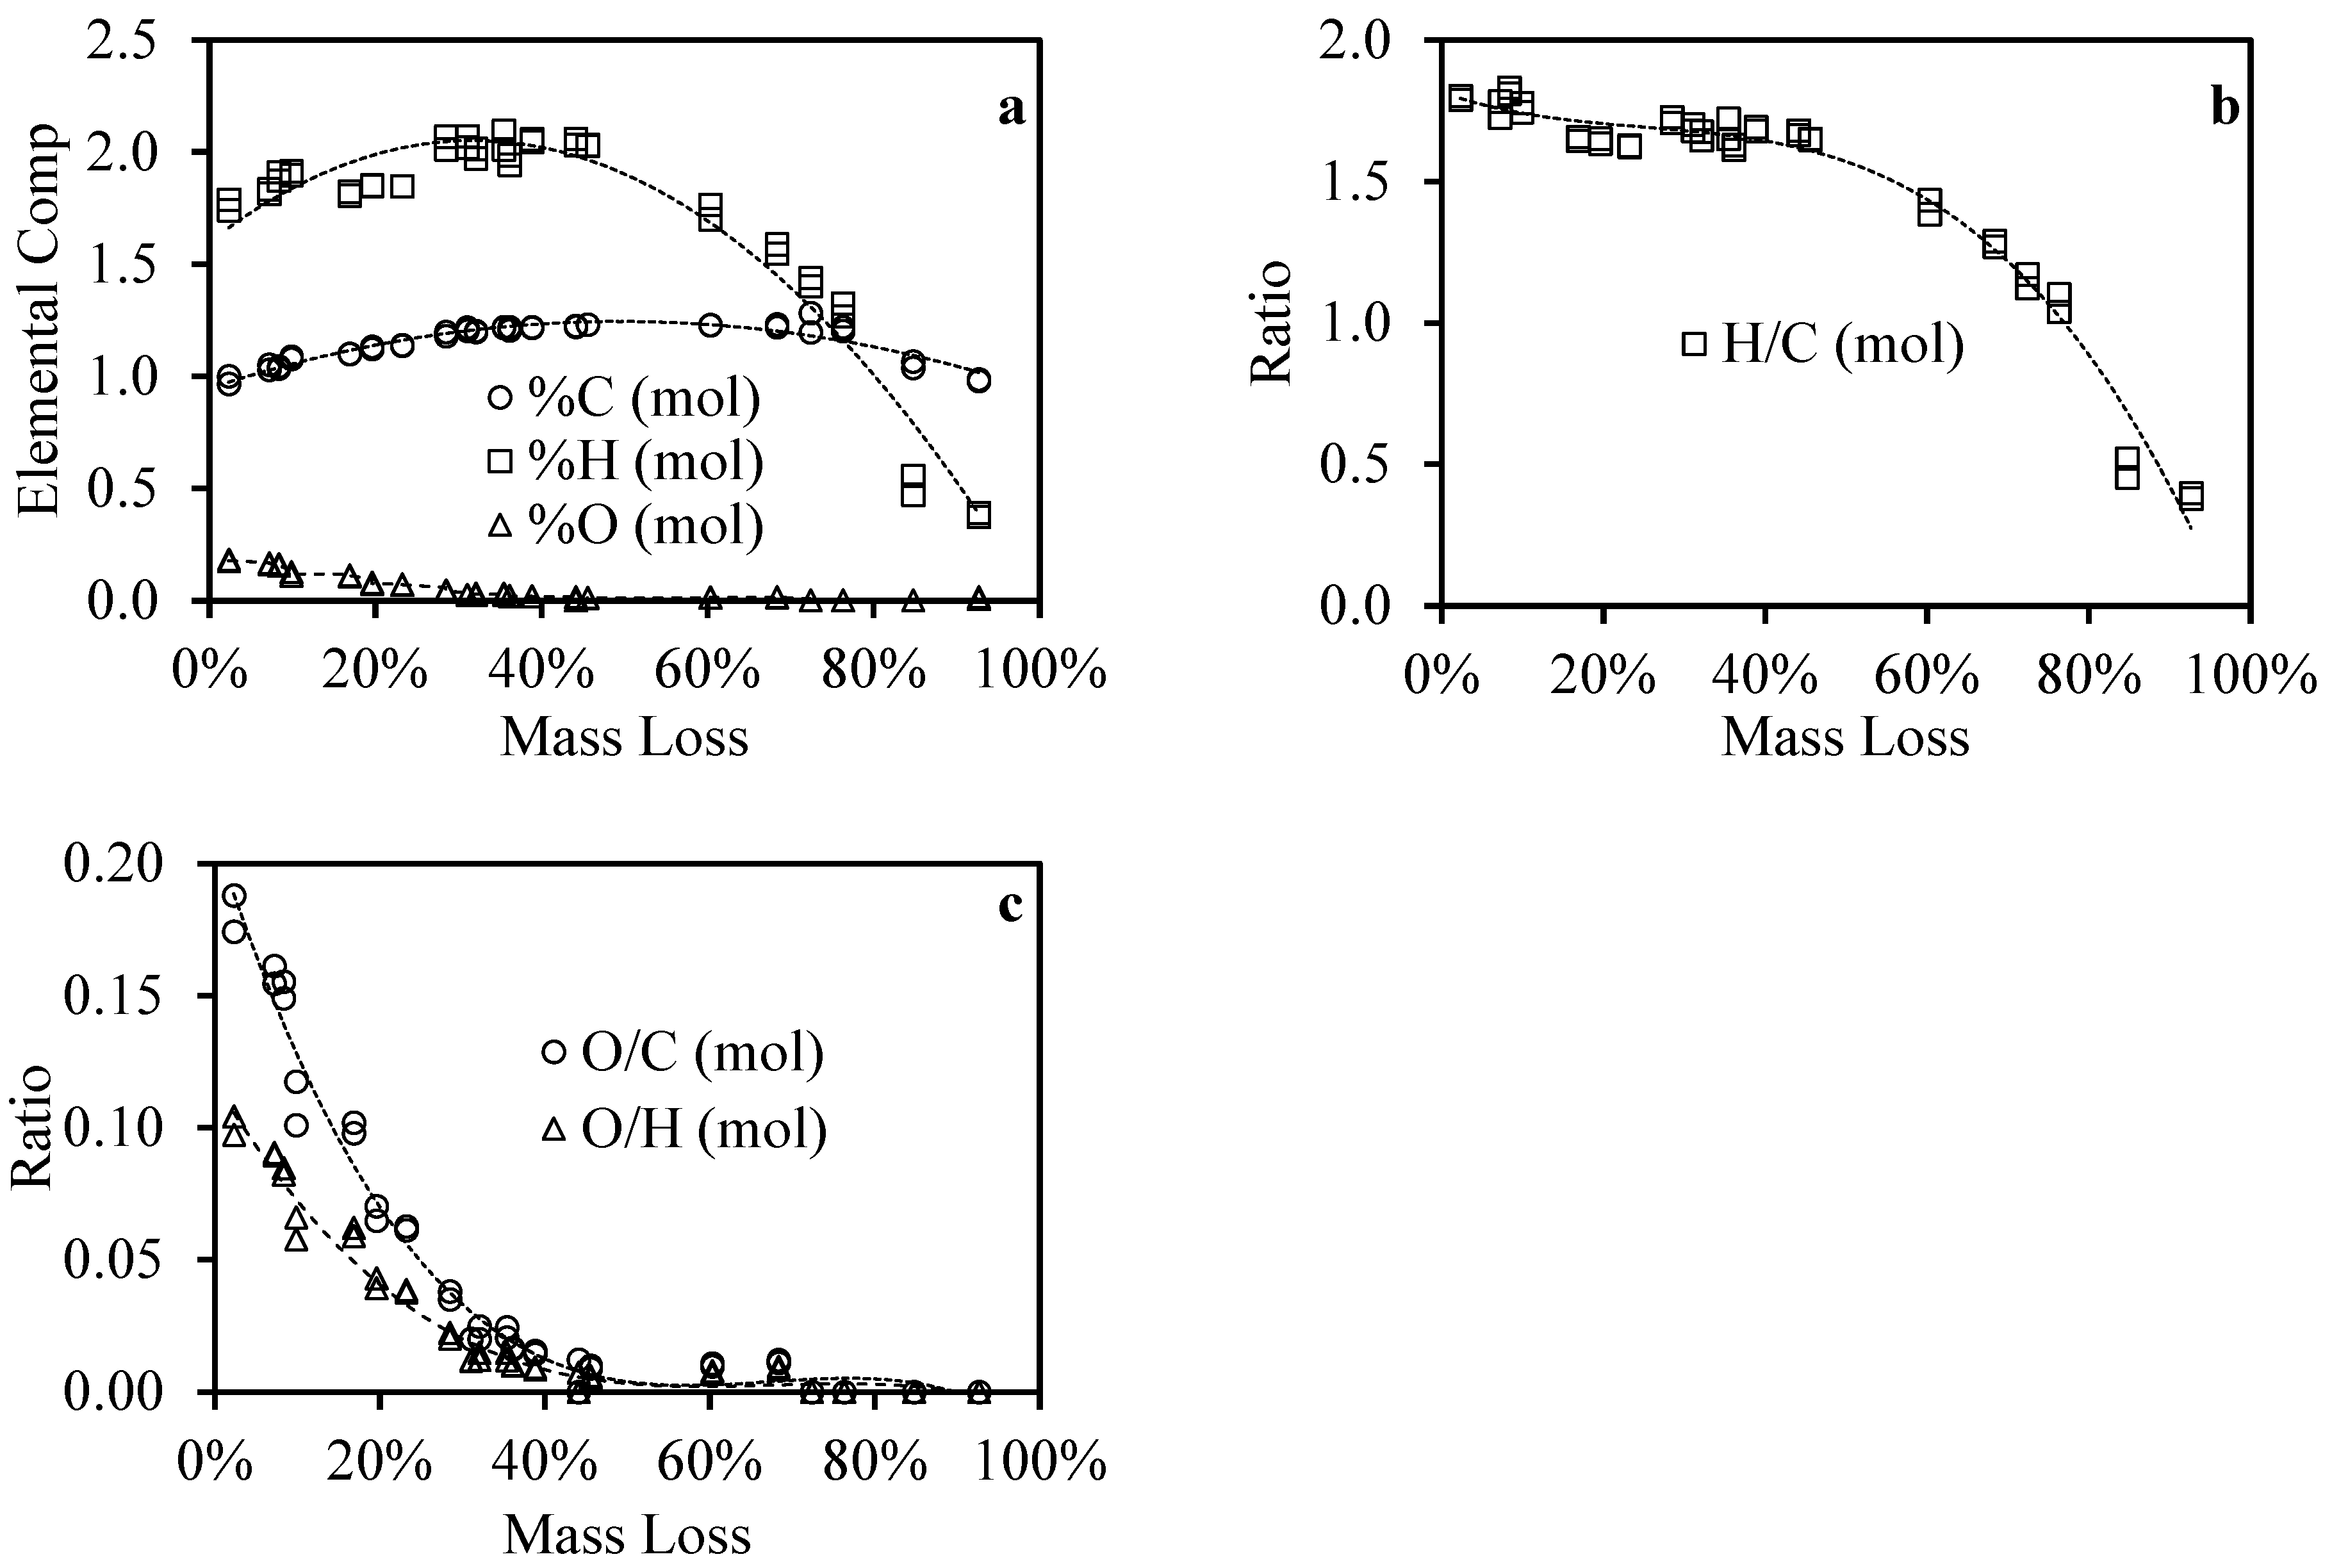
The C/H/O results were plotted in molar, mineral-free basis, and normalized by the initial value of carbon and plotted in Figure 6a. They show that the molar composition of C and H both slightly increased at lower mass loss, and after ~45% mass loss, the H molar composition in solid product reduces faster compared to C. Oxygen (O) is released to the gas phase at the initial stages of the thermal treatment and at around 28% mass loss (where chlorine is already eliminated), most of the O is also released to the gas phase.
The H/C in the solid product was calculated and is plotted in Figure 6b. The H/C ratio starts at ~1.8 and gradually decreases with mass loss; from 40% mass loss, the H/C decreases steeply, reaching the value of ~0.4 at 92.6% mass loss. This means that significant dehydrogenation occurs above 40% mass loss. Figure 6c portrays the results for O/C and O/H ratios, showing significant release of O, indicative by the steep changes in the O/C and O/H ratios in solid phase, starting at ~0.19 and 0.1, respectively, both reaching zero at ~40% mass loss.
4.6. Heat Content
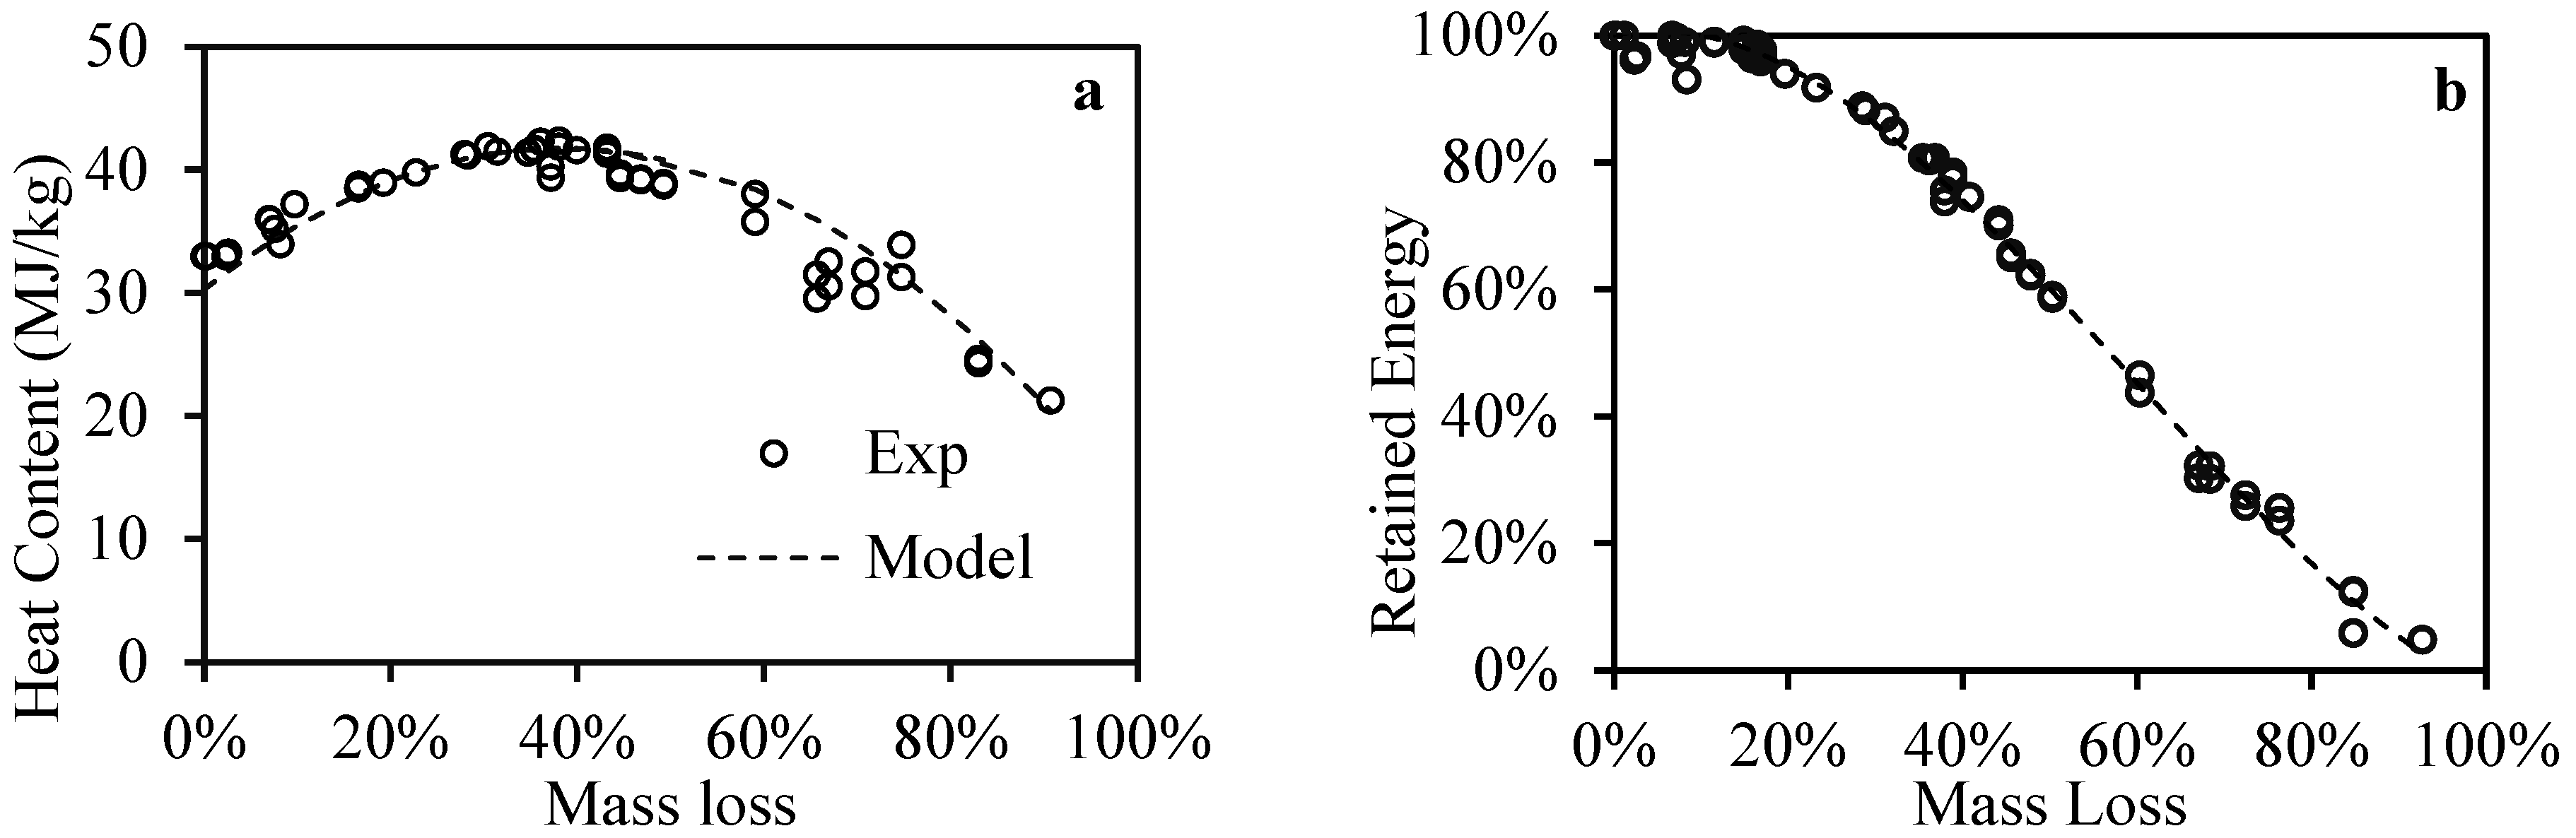
The heat content (HC) provides further insight into the changes in MPW occurring during the thermal treatment. Further, HC was correlated with the elemental composition of the thermally treated MPW samples as proposed in the literature [47]:
where , , , are the calorimetric parameters of the corresponding elements, and , , , are the weight fractions of the corresponding elements at each mass loss.
The parameters in Equation (8) were fitted by non-linear least square analysis, with = 168.5 MJ/kg, = 25.94 MJ/kg, = −12.60 MJ/kg, and = 3.500 MJ/kg. Figure 7a shows the experimental results and the correlation of thermally treated MPW HC at different mass losses; the HC first increases with mass loss due to the release of volatiles containing oxygen, reaching a maximum value of ~44 MJ/kg at ~30% mass loss, after which it is decreased due to the release of hydrocarbons and the increase in mineral content in the remaining solid. The retained energy in the solid (mineral-free basis) was calculated (Figure 7b), illustrating the continuous decrease in the retained energy with mass loss. There was no energy loss up to ~7% mass loss. When all the organic chlorine was released at 28% mass loss, there was still ~89% of energy retained in the solid product.
4.7. FTIR Characterization
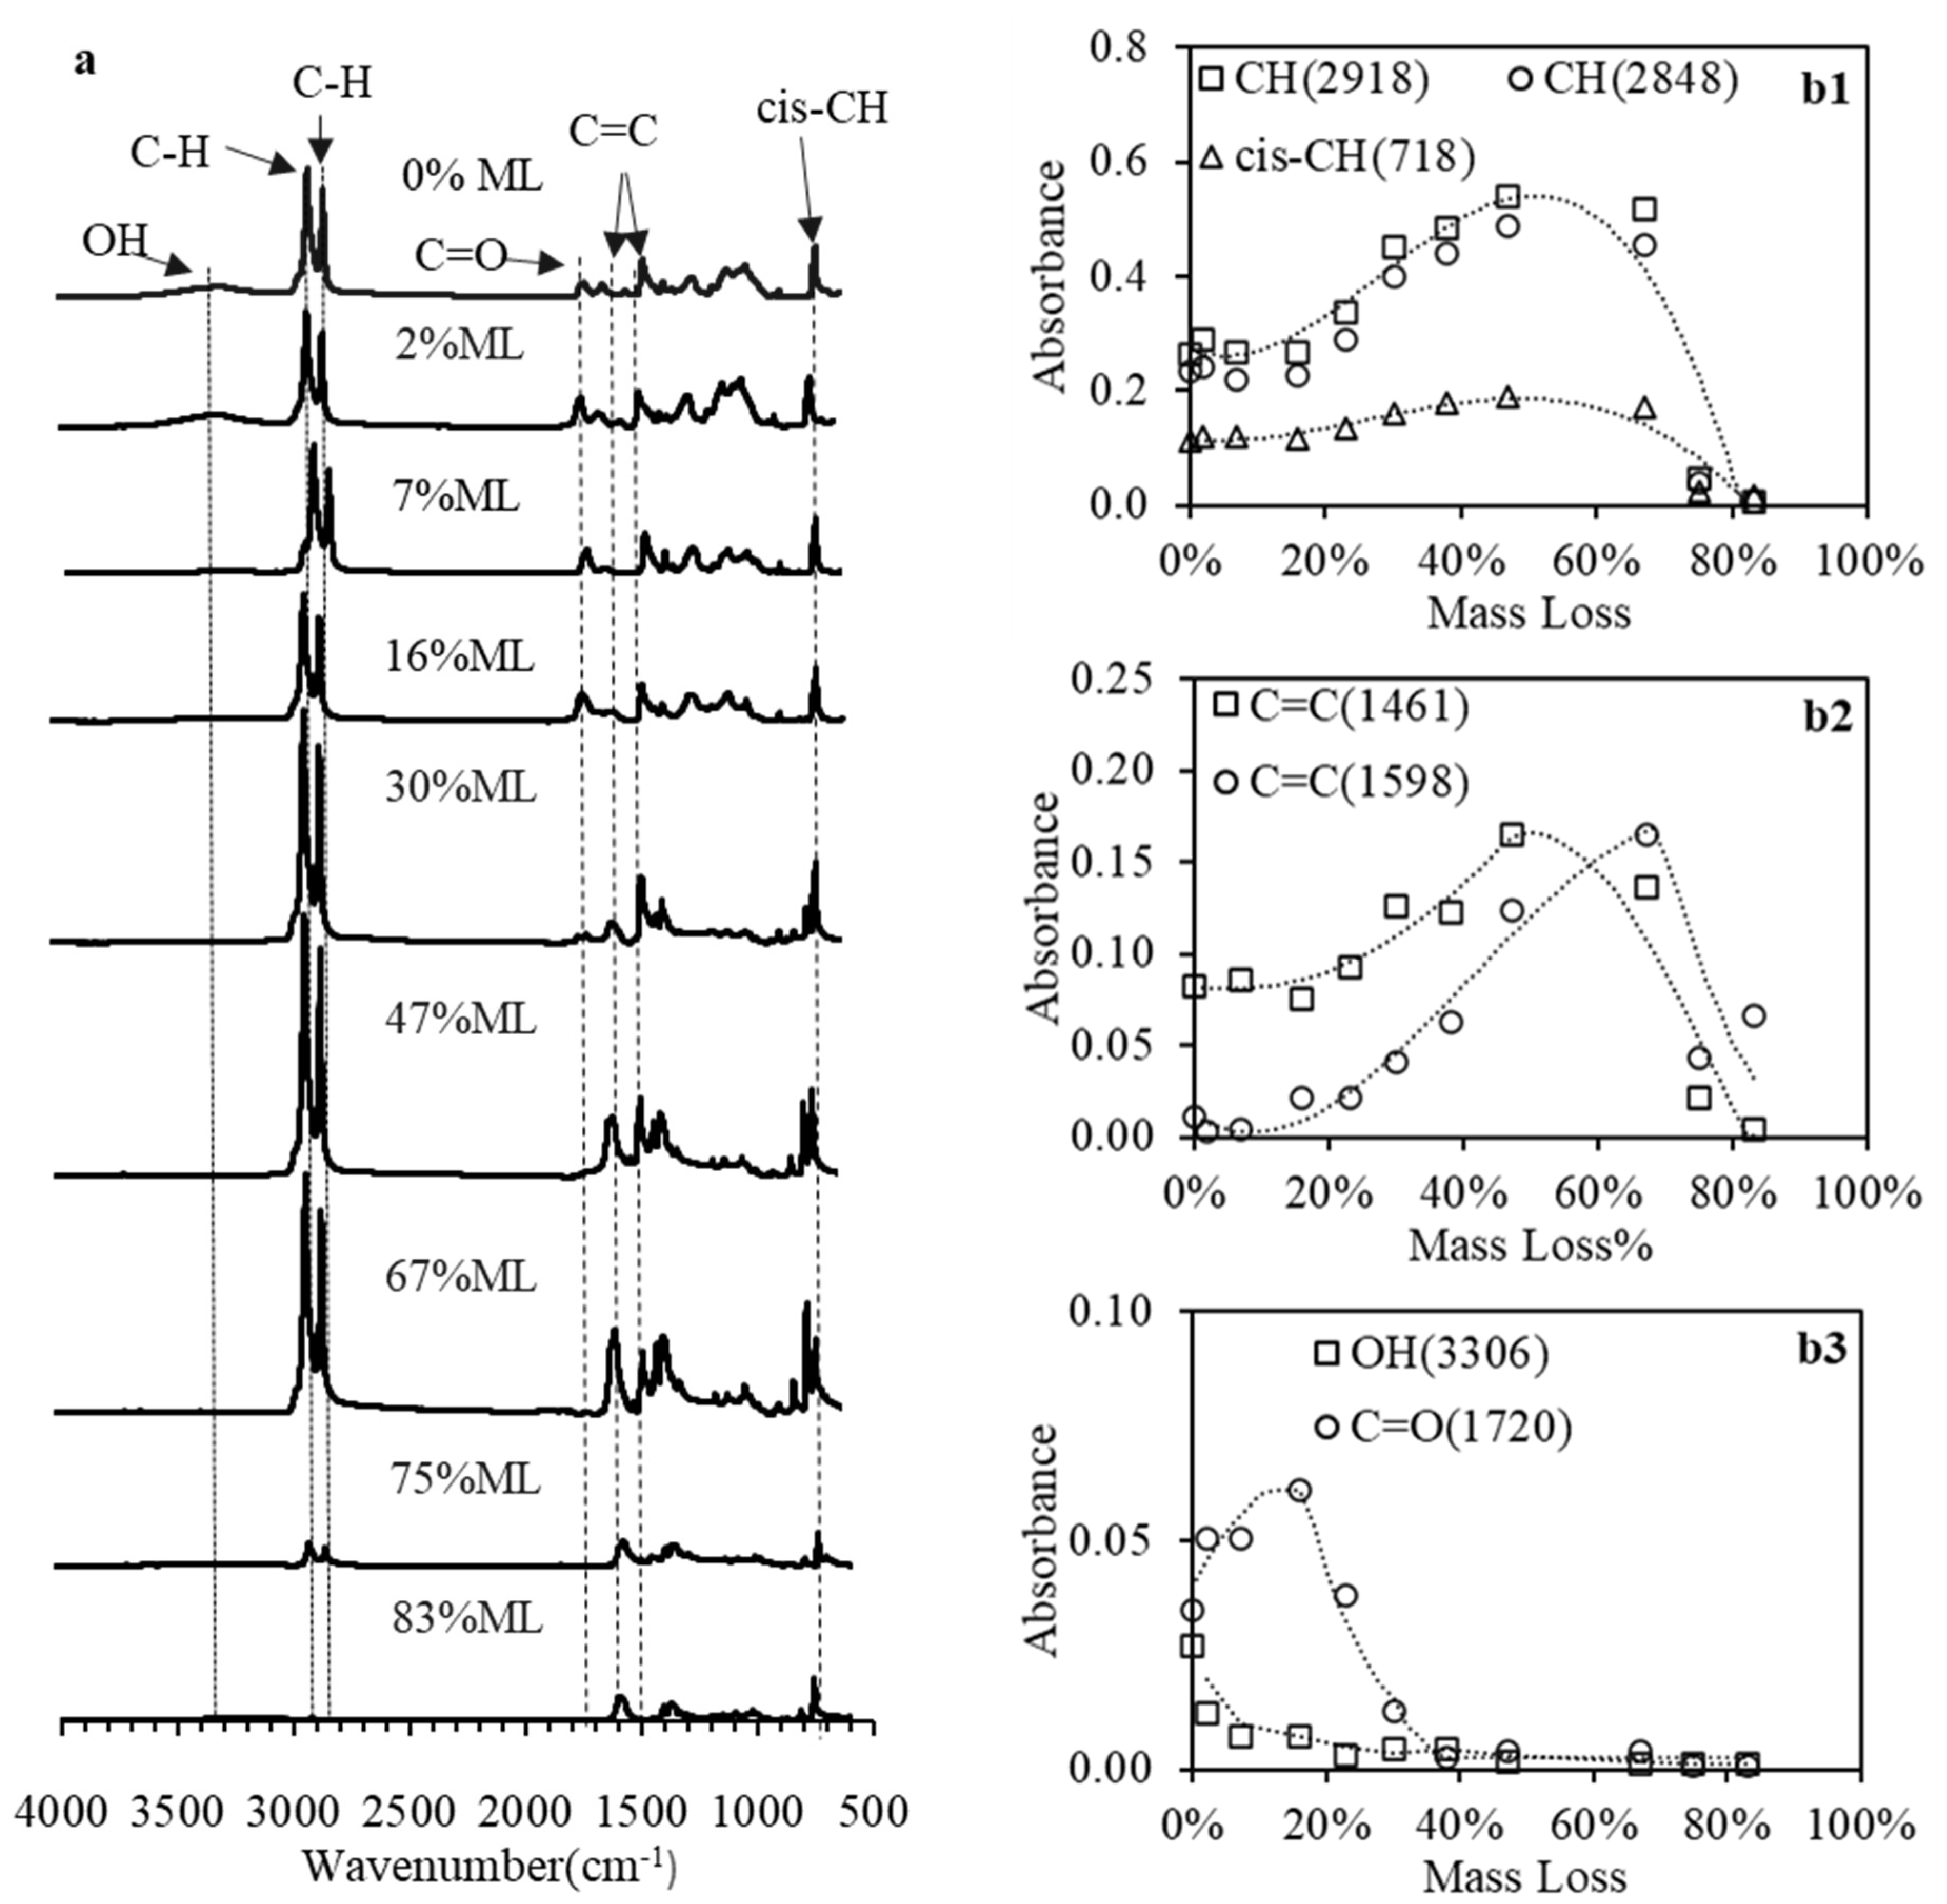
The infrared spectra (after baseline corrections) of the thermally treated MPW samples at various mass losses are shown in Figure 8a. The IR spectra provide an insight into the molecular structural changes of MPW upon treatment. Multiple bands that are related to O-H, C-H, C=O, C=C, CH3, cis–C–H stretching and other bands were observed. The strongest bands observed ion the range of 2800 to 3000 cm−1 are attributed to C–H stretching bands that may belong to methyl (2960 and 2870 cm−1) [48] and methylene groups (2916 and 2850 cm−1) [49] in PP and PE. The cis–C–H out-of-plane bands at 720 to 727 cm−1 could be attributed to alkyl groups [50].
Figure 8b1 shows the absorbance of the three C–H stretching bands vs. mass loss, indicating a similar behavior, where the absorbance of these groups increased with mass loss until ~40% mass loss, after which it decreases monotonically to 0 at ~83% mass loss, indicative to the disappearance of these groups, which resembles the carbon behavior in Figure 8b.
The bands at 1461 and 1598 cm−1 can be attributed to C=C bands from aromatic rings [49]. The initial 1461 cm−1 absorbance of the C=C bands, shown in Figure 8b2, originate primarily from aromatic rings in PET [51]; it increases due to the formation of single and double aromatic rings and then decreases with the release of these aromatics, as mass loss increases.
The O–H stretching bands (3100 to 3600 cm−1) and the carbonyl (C=O) bands (1690 to 1750 cm−1) were also observed in the heated MPW samples [49]. The C=O bands originate from the ester linkage in PET and PEVA of MPW [52]. The continuing reduction in OH and C=O aligns well with the observation from FTIR spectra, indicating that all oxygen was released at ~40% mass loss, mainly due to the release of H2O and CO2 (Figure 8b3).
5. Conclusions
The thermal degradation of MPW was successfully studied to provide data and insight into the processes involving organic chlorine removal and chemical changes. This was accomplished by homogenization of the MPW by compounding–extrusion to produce a uniform material that was then thermally treated at 400 °C for up to 900 min. A PVC de-chlorination model based on four consecutive reaction mechanisms was developed. It was found that one set of parameters could be used to portray the TGA results of PVC de-chlorination and MPW organic chlorine removal efficiency, showing that PVC de-chlorination was not affected by other plastics in the MPW at this temperature. The organic chlorine was fully released at ~28% mass loss, with the remaining attributed to inorganic sources, which can be removed through water washing. The heat content of the treated MPW reached a maximum value of ~44 MJ/kg at ~30% mass loss, after which it was decreased. A correlation of heat content based on C/H/N/O was also developed. It was found that at ~28% mass loss, when all the organic chlorine is released, there is still ~89% energy retained in the solid product. In addition, the results indicated that mass loss is the universal parameter for both organic chlorine removal efficiency and heat content for MPW thermal degradation.
FTIR spectroscopy showed the reduction in O-H stretching bands associated with dehydration and the formation of C=C aromatic bands during MPW thermal degradation. The elemental composition analysis indicated that in the mineral-free basis, C/H/O reduced with mass loss, with hydrogen reducing much faster than carbon and oxygen, and all the oxygen was released at ~40% mass loss. Overall, the present work studied the de-chlorination of PVC in MPW, showing that the process was not affected by other plastics at 400 °C; and after thermal treatment, the properties of the studied MPW can be predicted by its mass loss and elemental composition, which greatly help with its potential to be used as feedstocks for energy and other applications.
Supplementary Materials
The following supporting information can be downloaded at: https://0-www-mdpi-com.brum.beds.ac.uk/article/10.3390/en15166058/s1, Figure S1: MPW material after shredding; Figure S2: Temperature transient and mass loss of MPW vs. time@300°C; Table S1: C/H/N/O composition results in treated MPW. References [53,54,55,56] are cited in the supplementary materials.
Author Contributions
Z.X.: Methodology, Formal analysis, Writing—Original Draft Preparation. V.I.: Investigation. E.B.-Z.: Supervision, Writing—Review and Editing, Funding Acquisition. A.G.M.: Investigation, Writing—Review and Editing, Funding Acquisition. All authors have read and agreed to the published version of the manuscript.
Funding
This research was funded by: (1) National Science Foundation, grant number 1827364; (2) National Science Foundation, grant number 2033366, and (3) M.J. Murdock Charitable Trust for the purchase of the twin-screw extruder.
Acknowledgments
We would like to thank Medhavi Kamran for help in conducting some of MPW thermal treatment experiments and testing.
Conflicts of Interest
The authors declare that they have no known competing financial interests or personal relationships that could have appeared to influence the work reported in this paper.
References
- Hahladakis, J.N.; Iacovidou, E. Closing the loop on plastic packaging materials: What is quality and how does it affect their circularity? Sci. Total Environ. 2018, 630, 1394–1400. [Google Scholar] [CrossRef] [PubMed]
- Yu, S.; Su, W.; Wu, D.; Yao, Z.; Liu, J.; Tang, J.; Wu, W. Thermal treatment of flame retardant plastics: A case study on a waste TV plastic shell sample. Sci. Total Environ. 2019, 675, 651–657. [Google Scholar] [CrossRef] [PubMed]
- Al-Salem, S.M.; Lettieri, P.; Baeyens, J. Recycling and recovery routes of plastic solid waste (PSW): A review. Waste Manag. 2009. [Google Scholar] [CrossRef] [PubMed]
- US EPA. EPA Advancing Sustainable Materials Management: 2018 Fact Sheet; United States Environmental Protection Agency: Washington, DC, USA, 2020. [Google Scholar]
- Sonawane, Y.B.; Shindikar, M.R.; Khaladkar, M.Y. High Calorific Value Fuel from Household Plastic Waste by Catalytic Pyrolysis. Nat. Environ. Pollut. Technol. 2017, 16, 879–882. [Google Scholar]
- He, P.; Chen, L.; Shao, L.; Zhang, H.; Lü, F. Municipal solid waste (MSW) landfill: A source of microplastics? -Evidence of microplastics in landfill leachate. Water Res. 2019, 159, 38–45. [Google Scholar] [CrossRef]
- Kunwar, B.; Moser, B.R.; Chandrasekaran, S.R.; Rajagopalan, N.; Sharma, B.K. Catalytic and thermal depolymerization of low value post-consumer high density polyethylene plastic. Energy 2016, 111, 884–892. [Google Scholar] [CrossRef]
- Fivga, A.; Dimitriou, I. Pyrolysis of plastic waste for production of heavy fuel substitute: A techno-economic assessment. Energy 2018, 149, 865–874. [Google Scholar] [CrossRef]
- Anuar Shafferina, S.D.; Abnisa, F.; Wan Daud, W.M.A.; Aroua, M.K. A review on pyrolysis of plastic wastes. Energy Convers. Manag. 2016, 115, 308–326. [Google Scholar] [CrossRef]
- Sharma, B.K.; Moser, B.R.; Vermillion, K.E.; Doll, K.M.; Rajagopalan, N. Production, characterization and fuel properties of alternative diesel fuel from pyrolysis of waste plastic grocery bags. Fuel Process. Technol. 2014, 122, 79–90. [Google Scholar] [CrossRef]
- Senthil Kumar, P.; Bharathikumar, M.; Prabhakaran, C.; Vijayan, S.; Ramakrishnan, K. Conversion of waste plastics into low-emissive hydrocarbon fuels through catalytic depolymerization in a new laboratory scale batch reactor. Int. J. Energy Environ. Eng. 2017, 8, 167–173. [Google Scholar] [CrossRef] [Green Version]
- Almeida, D.; de Fátima Marques, M. Thermal and catalytic pyrolysis of plastic waste. Polímeros 2016, 26, 44–51. [Google Scholar] [CrossRef]
- Yang, Z.; Zhang, Q.; Luo, G.; Huang, J.-Q.; Zhao, M.-Q.; Wei, F. Coupled process of plastics pyrolysis and chemical vapor deposition for controllable synthesis of vertically aligned carbon nanotube arrays. Appl. Phys. A 2010, 100, 533–540. [Google Scholar] [CrossRef]
- Keane, M.A.; Park, C.; Menini, C. Structure Sensitivity in the Hydrodechlorination of Chlorobenzene Over Supported Nickel. Catal. Lett. 2003, 88, 89–94. [Google Scholar] [CrossRef]
- Lisi, L.; Lasorella, G.; Malloggi, S.; Russo, G. Single and combined deactivating effect of alkali metals and HCl on commercial SCR catalysts. Appl. Catal. B Environ. 2004, 50, 251–258. [Google Scholar] [CrossRef]
- Veksha, A.; Giannis, A.; Oh, W.D.; Chang, V.W.C.; Lisak, G. Upgrading of non-condensable pyrolysis gas from mixed plastics through catalytic decomposition and dechlorination. Fuel Process. Technol. 2018, 170, 13–20. [Google Scholar] [CrossRef]
- Xu, Z.; Albrecht, J.W.; Kolapkar, S.S.; Zinchik, S.; Bar-Ziv, E. Chlorine Removal from U.S. Solid Waste Blends through Torrefaction. Appl. Sci. 2020, 10, 3337. [Google Scholar] [CrossRef]
- Castro, A.; Soares, D.; Vilarinho, C.; Castro, F. Kinetics of thermal de-chlorination of PVC under pyrolytic conditions. Waste Manag. 2012, 32, 847–851. [Google Scholar] [CrossRef] [Green Version]
- US EPA. EPA Advancing Sustainable Materials Management: 2018 Tables and Figures; United States Environmental Protection Agency: Washington, DC, USA, 2020. [Google Scholar]
- Inoue, T.; Miyazaki, M.; Kamitani, M.; Kano, J.; Saito, F. Mechanochemical dechlorination of polyvinyl chloride by co-grinding with various metal oxides. Adv. Powder Technol. 2004, 15, 215–225. [Google Scholar] [CrossRef]
- Xu, Z.; Kolapkar, S.; Zinchik, S.; Bar-Ziv, E.; Mcdonald, A. Comprehensive Kinetic Study of Thermal Degradation of Polyvinylchloride (PVC). Polym. Degrad. Stab. 2020, 176, 109148. [Google Scholar] [CrossRef]
- Marcilla, A.; Beltrán, M. Thermogravimetric kinetic study of poly(vinyl chloride) pyrolysis. Polym. Degrad. Stab. 1995, 48, 219–229. [Google Scholar] [CrossRef]
- Sánchez-Jiménez, P.E.; Perejón, A.; Criado, J.M.; Diánez, M.J.; Pérez-Maqueda, L.A. Kinetic model for thermal dehydrochlorination of poly(vinyl chloride). Polym. Guildf. 2010, 51, 3998–4007. [Google Scholar] [CrossRef] [Green Version]
- Beltrán, M.; Marcilla, A. Fourier transform infrared spectroscopy applied to the study of PVC decomposition. Eur. Polym. J. 1997, 33, 1135–1142. [Google Scholar] [CrossRef]
- Masuda, Y.; Uda, T.; Terakado, O.; Hirasawa, M. Pyrolysis study of poly(vinyl chloride)–metal oxide mixtures: Quantitative product analysis and the chlorine fixing ability of metal oxides. J. Anal. Appl. Pyrolysis 2006, 77, 159–168. [Google Scholar] [CrossRef]
- Kakuta, Y.; Hirano, K.; Sugano, M.; Mashimo, K. Study on chlorine removal from mixture of waste plastics. Waste Manag. 2008, 28, 615–621. [Google Scholar] [CrossRef]
- Cho, M.-H.; Jung, S.-H.; Kim, J.-S. Pyrolysis of Mixed Plastic Wastes for the Recovery of Benzene, Toluene, and Xylene (BTX) Aromatics in a Fluidized Bed and Chlorine Removal by Applying Various Additives. Energy Fuels 2009, 24, 1389–1395. [Google Scholar] [CrossRef]
- Park, K.B.; Oh, S.J.; Begum, G.; Kim, J.S. Production of clean oil with low levels of chlorine and olefins in a continuous two-stage pyrolysis of a mixture of waste low-density polyethylene and polyvinyl chloride. Energy 2018, 157, 402–411. [Google Scholar] [CrossRef]
- Angyal, A.; Miskolczi, N.; Bartha, L. Petrochemical feedstock by thermal cracking of plastic waste. J. Anal. Appl. Pyrolysis 2007, 79, 409–414. [Google Scholar] [CrossRef]
- Miskolczi, N.; Bartha, L.; Deák, G.; Jóver, B. Thermal degradation of municipal plastic waste for production of fuel-like hydrocarbons. Polym. Degrad. Stab. 2004, 86, 357–366. [Google Scholar] [CrossRef]
- Bhaskar, T.; Uddin, M.A.; Murai, K.; Kaneko, J.; Hamano, K.; Kusaba, T.; Muto, A.; Sakata, Y. Comparison of thermal degradation products from real municipal waste plastic and model mixed plastics. J. Anal. Appl. Pyrolysis 2003, 70, 579–587. [Google Scholar] [CrossRef]
- Muhammad, C.; Onwudili, J.A.; Williams, P.T. Thermal degradation of real-world waste plastics and simulated mixed plastics in a two-stage pyrolysis-catalysis reactor for fuel production. Energy Fuels 2015, 29, 2601–2609. [Google Scholar] [CrossRef]
- Nanda, S.; Berruti, F. Thermochemical conversion of plastic waste to fuels: A review. Environ. Chem. Lett. 2021, 19, 123–148. [Google Scholar] [CrossRef]
- Zinchik, S.; Xu, Z.; Kolapkar, S.S.; Bar-Ziv, E.; McDonald, A.G. Properties of pellets of torrefied U.S. waste blends. Waste Manag. 2020, 104, 130–138. [Google Scholar] [CrossRef] [PubMed]
- Peterson, J.D.; Vyazovkin, S.; Wight, C.A. Kinetics of the thermal and thermo-oxidative degradation of polystyrene, polyethylene and poly(propylene). Macromol. Chem. Phys. 2001, 202, 775–784. [Google Scholar] [CrossRef]
- Latifa, B.; Zohra, F.F.; Said, H. Study of Raw and Recycled Polyethylene Terephthalate by Meaning of TGA and Computer Simulation. Adv. Polym. Technol. 2020, 2020, 1–7. [Google Scholar] [CrossRef]
- Rimez, B.; Rahier, H.; Van Assche, G.; Artoos, T.; Biesemans, M.; Van Mele, B. The thermal degradation of poly(vinyl acetate) and poly(ethylene-co-vinyl acetate), Part I: Experimental study of the degradation mechanism. Polym. Degrad. Stab. 2008, 93, 800–810. [Google Scholar] [CrossRef] [Green Version]
- Ma, W.; Hoffmann, G.; Schirmer, M.; Chen, G.; Rotter, V.S. Chlorine characterization and thermal behavior in MSW and RDF. J. Hazard. Mater. 2010, 178, 489–498. [Google Scholar] [CrossRef]
- Lu, P.; Huang, Q.; Bourtsalas, A.T.; Themelis, N.J.; Chi, Y.; Yan, J. Review on fate of chlorine during thermal processing of solid wastes. J. Environ. Sci. 2019, 78, 13–28. [Google Scholar] [CrossRef]
- Dai, Q.; Bai, S.; Wang, Z.; Wang, X.; Lu, G. Catalytic combustion of chlorobenzene over Ru-doped ceria catalysts. Appl. Catal. B Environ. 2012, 126, 64–75. [Google Scholar] [CrossRef]
- Lu, S.Y.; Yan, J.H.; Li, X.D.; Ni, M.J.; Cen, K.F.; Dai, H.F. Effects of inorganic chlorine source on dioxin formation using fly ash from a fluidized bed incinerator. J. Environ. Sci. 2007, 19, 756–761. [Google Scholar] [CrossRef]
- Addink, R.; Espourteille, F.; Altwicker, E.R. Role of Inorganic Chlorine in the Formation of Polychlorinated Dibenzo-p-dioxins/Dibenzofurans from Residual Carbon on Incinerator Fly Ash. Environ. Sci. Technol. 1998, 32, 3356–3359. [Google Scholar] [CrossRef]
- Mazurek, I.; Skawińska, A.; Sajdak, M. Analysis of chlorine forms in hard coal and the impact of leaching conditions on chlorine removal. J. Energy Inst. 2021, 94, 337–351. [Google Scholar] [CrossRef]
- Li, M.; Bi, F.; Xu, Y.; Hao, P.; Xiang, K.; Zhang, Y.; Chen, S.; Guo, J.; Guo, X.; Ding, W. Effect of Residual Chlorine on the Catalytic Performance of Co3O4 for CO Oxidation. ACS Catal. 2019, 9, 11676–11684. [Google Scholar] [CrossRef]
- Xu, Z.; Kolapkar, S.S.; Zinchik, S.; Bar-Ziv, E.; Klinger, J.; Fillerup, E.; Schaller, K.; Pilgrim, C. Kinetic Study of Paper Waste Thermal Degradation. Polym. Degrad. Stab. 2021, 191, 109681. [Google Scholar] [CrossRef]
- Yoshioka, T.; Saitoh, N.; Okuwaki, A. Temperature Dependence on the Activation Energy of Dechlorination in Thermal Degradation of Polyvinylchloride. Chem. Lett. 2005, 34, 70–71. [Google Scholar] [CrossRef]
- Komilis, D.; Evangelou, A.; Giannakis, G.; Lymperis, C. Revisiting the elemental composition and the calorific value of the organic fraction of municipal solid wastes. Waste Manag. 2012, 32, 372–381. [Google Scholar] [CrossRef]
- Xu, Z.; Zinchik, S.; Kolapkar, S.; Bar-ziv, E.; Hansen, T.; Conn, D. Properties of Torrefied U.S. Waste Blends. Front. Energy Res. 2018, 6, 65. [Google Scholar] [CrossRef] [Green Version]
- Nandiyanto, A.B.D.; Oktiani, R.; Ragadhita, R. How to read and interpret ftir spectroscope of organic material. Indones. J. Sci. Technol. 2019, 4, 97–118. [Google Scholar] [CrossRef]
- Vahur, S.; Kriiska, A.; Leito, I. Investigation of the adhesive residue on the flint insert and the adhesive lump found from the pulli early mesolithic settlement site (Estonia) by micro-ATR-FT-IR spectroscopy. Est. J. Archaeol. 2011, 15, 3–17. [Google Scholar] [CrossRef] [Green Version]
- Mialon, L.; Pemba, G.A.; Miller, S.A. Biorenewable polyethylene terephthalate mimics derived from lignin and acetic acid. Green Chem. 2010, 12, 1704–1706. [Google Scholar] [CrossRef]
- Mayo, W.D.; Miller, A.F.; Hannah, W.R. Course Notes on the Interpretation of Infrared and Raman Spectra. In Course Notes on the Interpretation of Infrared and Raman Spectra; John Wiley & Sons: Hoboken, NJ, USA, 2004; pp. 33–72. ISBN 9786468600. [Google Scholar]
- Bergman, T.L.; Incropera, F.P.; DeWitt, D.P.; Lavine, A.S. Fundamentals of Heat and Mass Transfer; Wiley: New York, NY, USA, 2011; pp. 983–1011. [Google Scholar]
- De Carvalho, G.; Frollini, E.; Dos Santos, W.N. Thermal conductivity of polymers by hot-wire method. J. Appl. Polym. Sci. 1996, 62, 2281–2285. [Google Scholar] [CrossRef]
- Peet, M.J.; Hasan, H.S.; Bhadeshia, H.K.D.H. Prediction of thermal conductivity of steel. Int. J. Heat Mass Transf. 2011, 54, 2602–2608. [Google Scholar] [CrossRef] [Green Version]
- Zhao, W.; Liu, D.; Zhang, Y. Study on the Influence of Pressure-Assisted Thermal Processing on PET/PE via the Change of Melting Enthalpy. J. Food Process. Preserv. 2017, 41, e13135. [Google Scholar] [CrossRef]
Figure 1.
Reactor schematics.

Figure 2.
Temperature transient and mass loss vs. time (in logarithm scale) of MPW at 400 °C.

Figure 3.
(a) Chlorine content vs. time (logarithmic scale) of MPW at 400 °C; (b) chlorine removal efficiency of MPW at 300 and 400 °C vs. mass loss; and (c) mineral-free organic chlorine removal efficiency of MPW at 300 and 400 °C vs. mass loss.
Figure 3.
(a) Chlorine content vs. time (logarithmic scale) of MPW at 400 °C; (b) chlorine removal efficiency of MPW at 300 and 400 °C vs. mass loss; and (c) mineral-free organic chlorine removal efficiency of MPW at 300 and 400 °C vs. mass loss.

Figure 4.
(a) Mass loss results and temperature transient of PVC by TGA; and (b) rate results and temperature transient of PVC by TGA.
Figure 4.
(a) Mass loss results and temperature transient of PVC by TGA; and (b) rate results and temperature transient of PVC by TGA.

Figure 5.
Experimental and modeling results of organic chlorine removal efficiency vs. time (logarithmic scale) for MPW.
Figure 5.
Experimental and modeling results of organic chlorine removal efficiency vs. time (logarithmic scale) for MPW.

Figure 6.
(a) Normalized mineral-free C/H/O composition of thermally treated MPW (mol) vs. mass loss; (b) mineral-free H/C ratio in MPW solid product; (c) mineral-free O/C and O/H ratio in MPW solid product.
Figure 6.
(a) Normalized mineral-free C/H/O composition of thermally treated MPW (mol) vs. mass loss; (b) mineral-free H/C ratio in MPW solid product; (c) mineral-free O/C and O/H ratio in MPW solid product.

Figure 7.
(a) Heat content vs. mass loss of MPW and (b) retained energy vs. mass loss of MPW on a mineral-free-basis.
Figure 7.
(a) Heat content vs. mass loss of MPW and (b) retained energy vs. mass loss of MPW on a mineral-free-basis.

Figure 8.
(a) FTIR spectra of thermally treated MPW at various mass losses; (b1–b3) absorbance of various functional groups at various mass losses: (b1) CH, cis-CH; (b2) C=C in aromatics; (b3) OH, C=O.
Figure 8.
(a) FTIR spectra of thermally treated MPW at various mass losses; (b1–b3) absorbance of various functional groups at various mass losses: (b1) CH, cis-CH; (b2) C=C in aromatics; (b3) OH, C=O.


Table 1.
Kinetic parameters for PVC degradation model.
| Ea (kJ/mol) | A | α | |
|---|---|---|---|
| Reaction 1 | 113.6 ± 2.3 | 2.08 × 10⁸ | 0.90 |
| Reaction 2 | 111.3 ± 1.1 | 4.59 × 10⁸ | 0.47 |
| Reaction 3 | 140.3 ± 2.3 | 1.59 × 10¹⁰ | 0.77 |
| Reaction 4 | 144.9 ± 2.1 | 3.48 × 10⁷ | 0.44 |
Publisher’s Note: MDPI stays neutral with regard to jurisdictional claims in published maps and institutional affiliations. |
© 2022 by the authors. Licensee MDPI, Basel, Switzerland. This article is an open access article distributed under the terms and conditions of the Creative Commons Attribution (CC BY) license (https://creativecommons.org/licenses/by/4.0/).
Share and Cite
MDPI and ACS Style
Xu, Z.; Ierulli, V.; Bar-Ziv, E.; McDonald, A.G. Thermal Degradation and Organic Chlorine Removal from Mixed Plastic Wastes. Energies 2022, 15, 6058. https://0-doi-org.brum.beds.ac.uk/10.3390/en15166058
AMA Style
Xu Z, Ierulli V, Bar-Ziv E, McDonald AG. Thermal Degradation and Organic Chlorine Removal from Mixed Plastic Wastes. Energies. 2022; 15(16):6058. https://0-doi-org.brum.beds.ac.uk/10.3390/en15166058
Chicago/Turabian StyleXu, Zhuo, Victor Ierulli, Ezra Bar-Ziv, and Armando G. McDonald. 2022. "Thermal Degradation and Organic Chlorine Removal from Mixed Plastic Wastes" Energies 15, no. 16: 6058. https://0-doi-org.brum.beds.ac.uk/10.3390/en15166058
Note that from the first issue of 2016, this journal uses article numbers instead of page numbers. See further details here.