
Intake System Performance Stability as a Function of Flow Throttling


Institute of Aviation Technology, Faculty of Mechatronics, Armament and Aerospace, Military University of Technology, 00-908 Warszawa, Poland
*
Author to whom correspondence should be addressed.
Energies 2022, 15(17), 6291; https://0-doi-org.brum.beds.ac.uk/10.3390/en15176291
Submission received: 11 July 2022
/
Revised: 24 August 2022
/
Accepted: 25 August 2022
/
Published: 29 August 2022
(This article belongs to the Topic Fluid Mechanics)
Abstract
:This paper presents a numerical analysis of the stability of the flow parameters along the intake duct of an aircraft jet turbine engine. This problem has been investigated by many research teams and was included in the literature analysis. The unstable operation of a turbojet intake system can be the consequence of many adverse factors, including an intake vortex. The investigated intake system, due to its low location to the plane of the airport, is highly susceptible to the formation of an intake vortex. The phenomenon of an intake vortex can, in the worst-case scenario, result in the surging of the turbojet, and even engine stalling. This paper presents a developed model of the forward section of an aircraft, complete with its intake duct, and the method of its discretization. The intake-system model and numerical analysis were performed in Ansys Fluent. The flow parameters adopted for numerical simulations, under specific boundary conditions, corresponded to the operating conditions of the engine cooperating with the investigated intake system. The numerical calculations were performed assuming an air-pressure rise in the end section of the engine-intake system, reflecting the reduction in the pitch angle of the inlet stator blades of the fan. As a result, the pressure distributions in a significant cross section in the intake system were obtained. The results were analyzed with the quantitative distribution of the pressure fields by applying a dimensionless potential-pressure ratio. The pressure ratio enabled a comparative analysis of the nonuniformity of the total-pressure distribution in selected cross sections of the intake system. The results were revealing in terms of growing unstable flows in the flow duct. A major conclusion drawn from the results, by testing the dimensionless potential-pressure ratio, was that, within certain limits, it was possible to improve the flow uniformity by increasing the throttling pressure.
1. Introduction
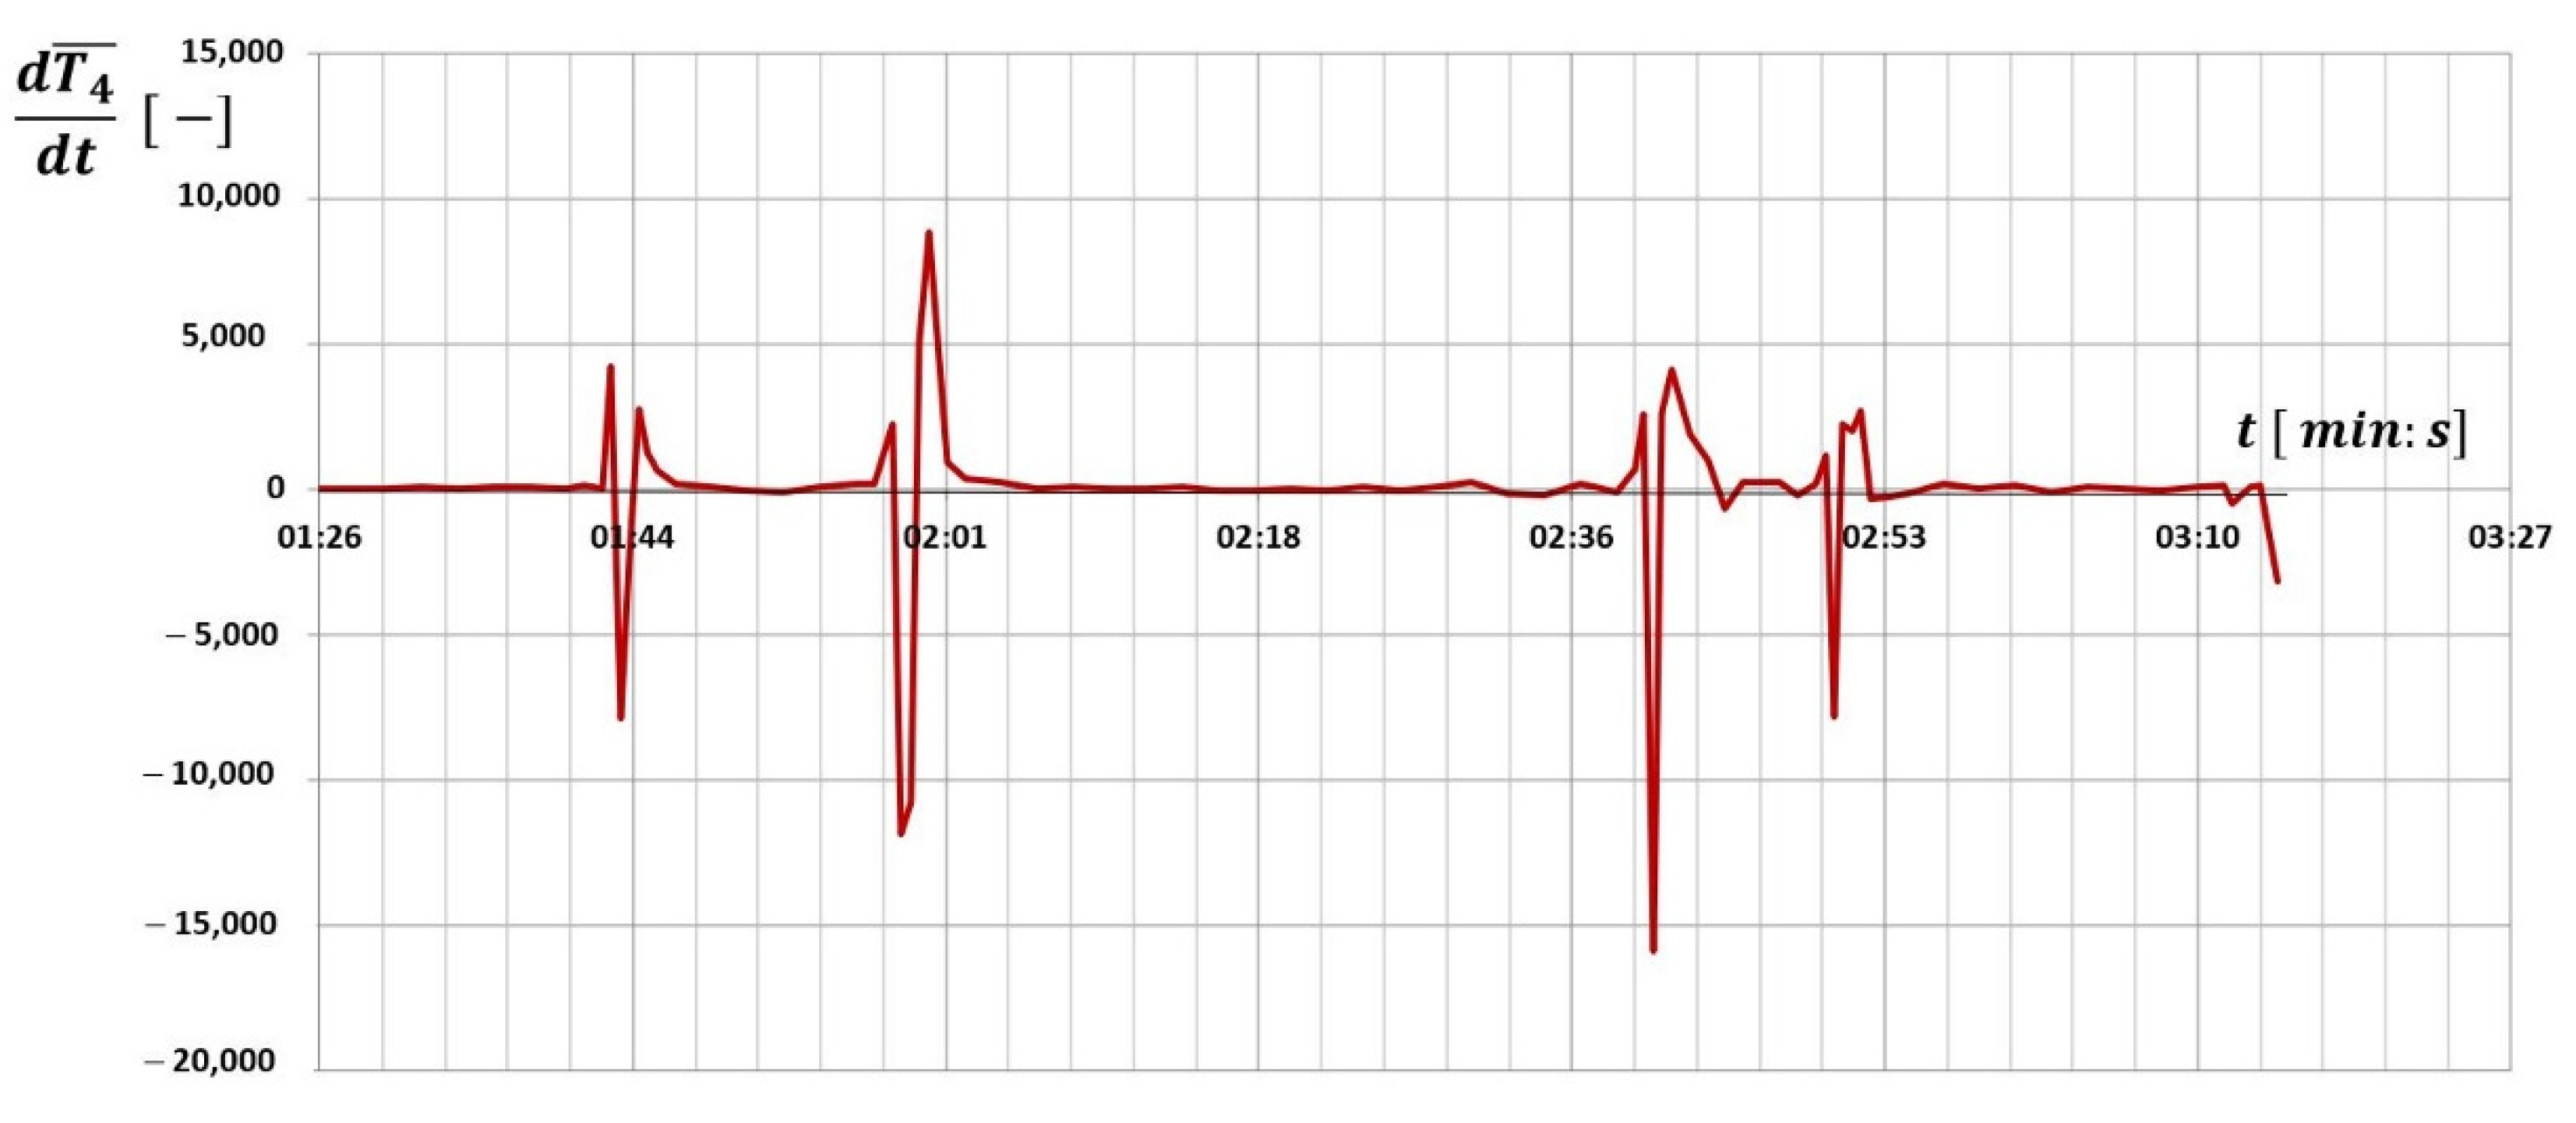
Investigations into the distribution of the flow parameters in the intake systems of turbojet engines remain important due to their impact on the operating efficiency of the entire system of a turbojet engine. The intake system is the first of the assemblies in the turbojet engine system. It has a significant effect on the engine’s performance stability, including changes to the engine operating parameters, as shown in Figure 1. Significant attention has been given to the problem of total-pressure disturbances in the AIP (aerodynamic interface plane) in front of the turbojet fan. A literature analysis concerning the heterogeneity of the flow fields was performed. One paper [1] concerned the optimization of an intake S-duct to reduce the total-pressure loss and limit disturbances. A combination of a genetic algorithm with CFD simulations was used. The Fluent CFD software was used to simulate the flow field in every tested configuration of the intake system, and the resulting calculations became the foundation for the entire optimization process.
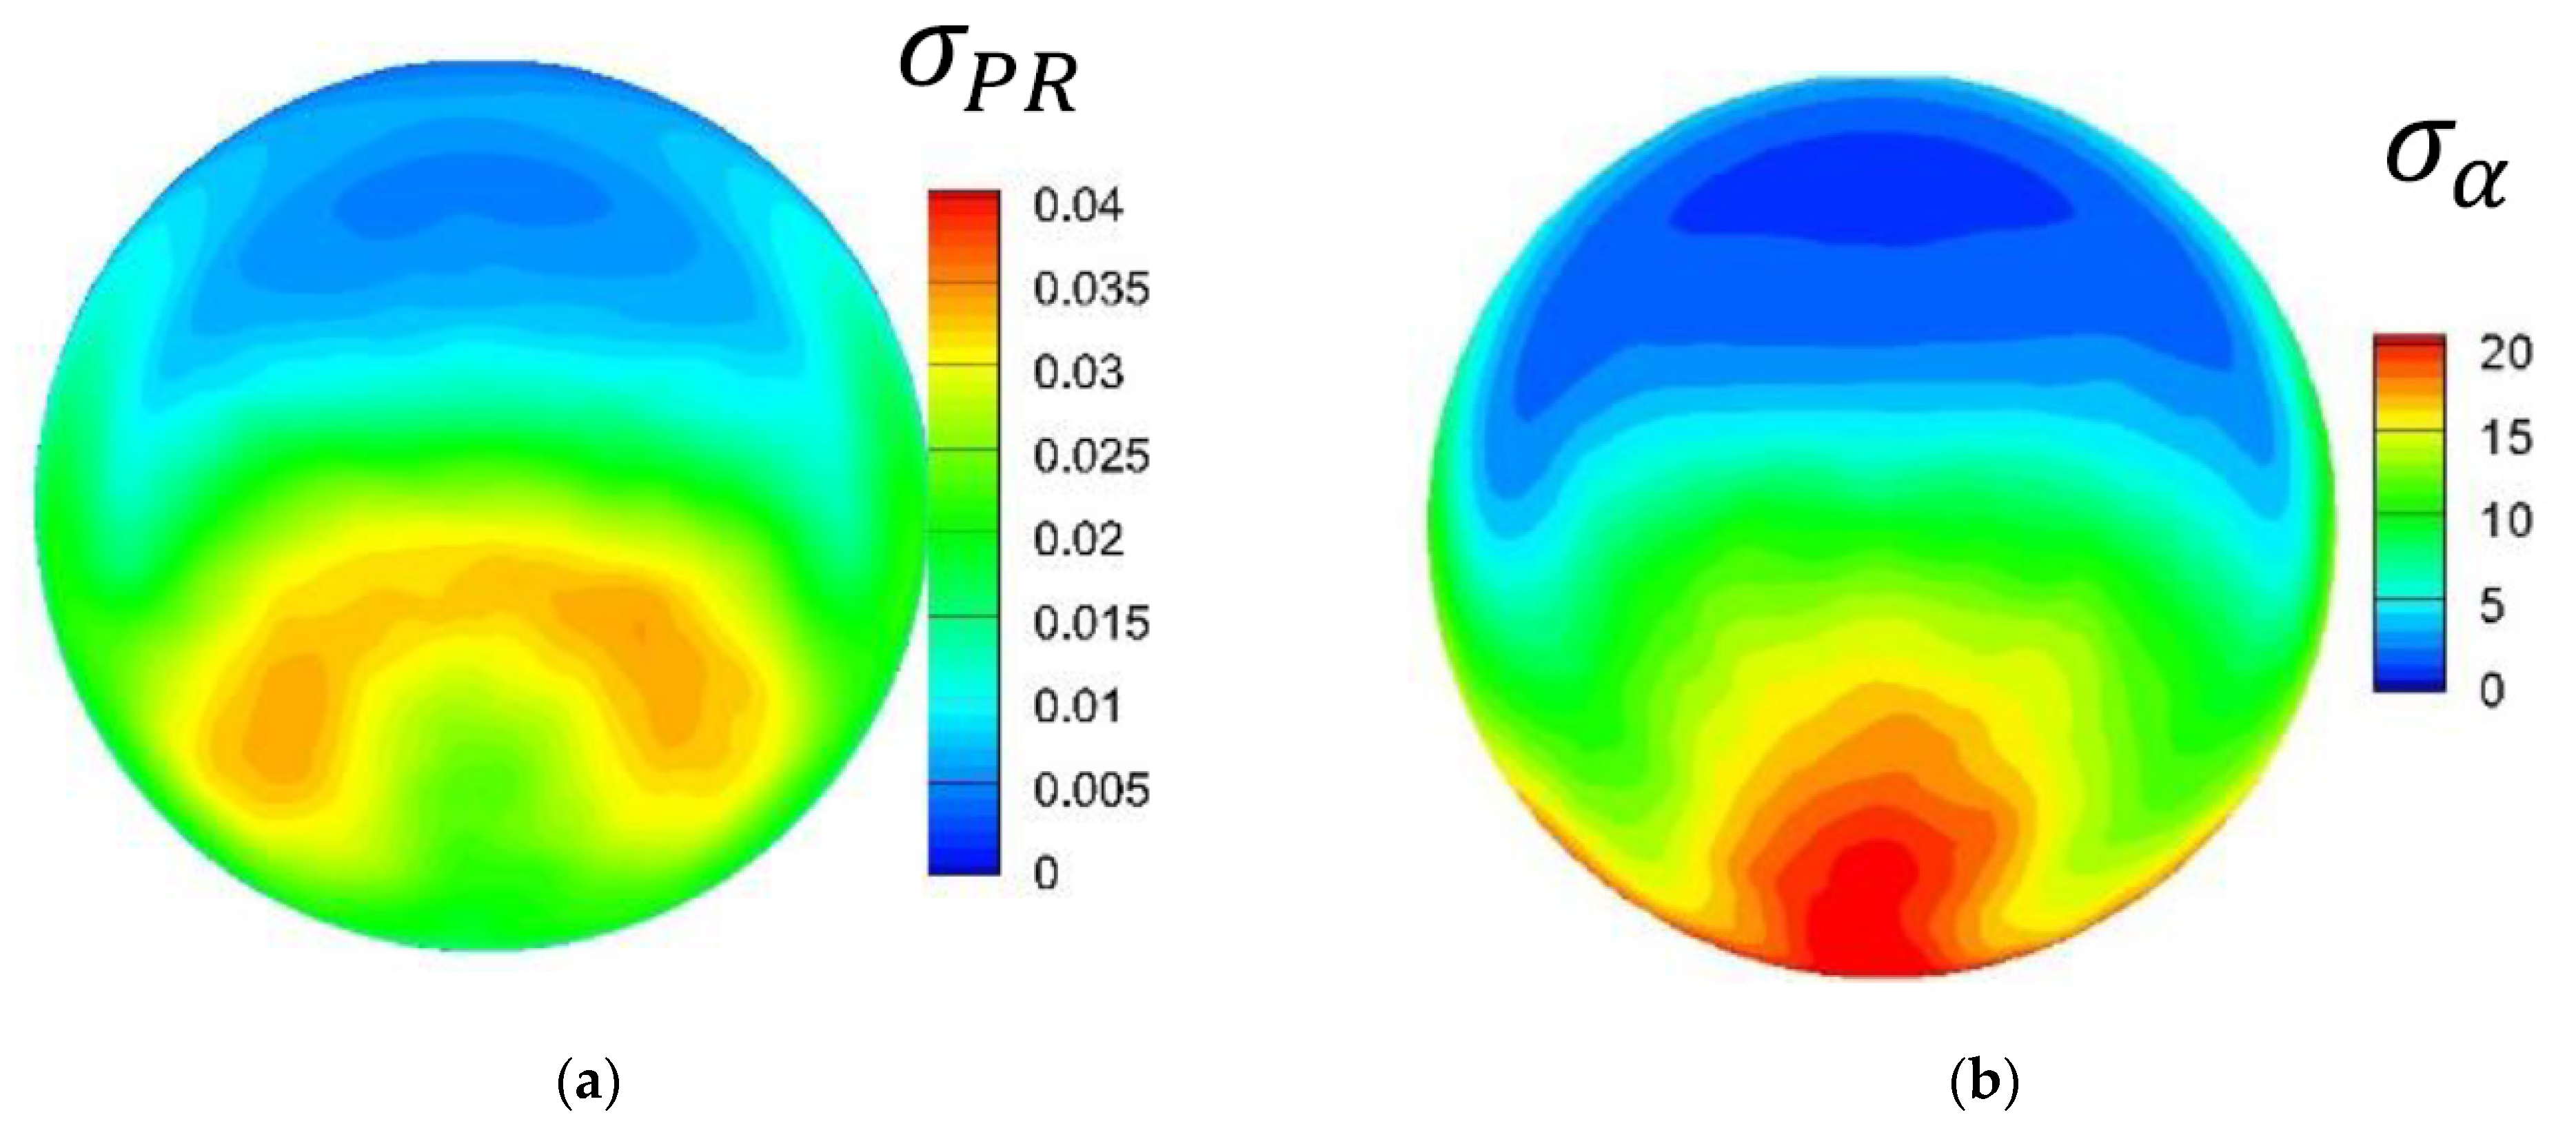
This involved a thorough analysis of the 3D flow, with a focus on the flow fields in characteristic cross sections. An example of the results can be found in Figure 2, which illustrates the distribution of the pressure-rise deviation in the intake duct, and the distribution of the swirl angle of the stream.
The intake S-duct shape was optimized by free deformation combined with a genetic algorithm. At one extreme point, the total-pressure loss was reduced by 20% (using a Pareto front), while, at another extreme point, the average area turbulences were reduced by 10%, with both results deemed to be very good.
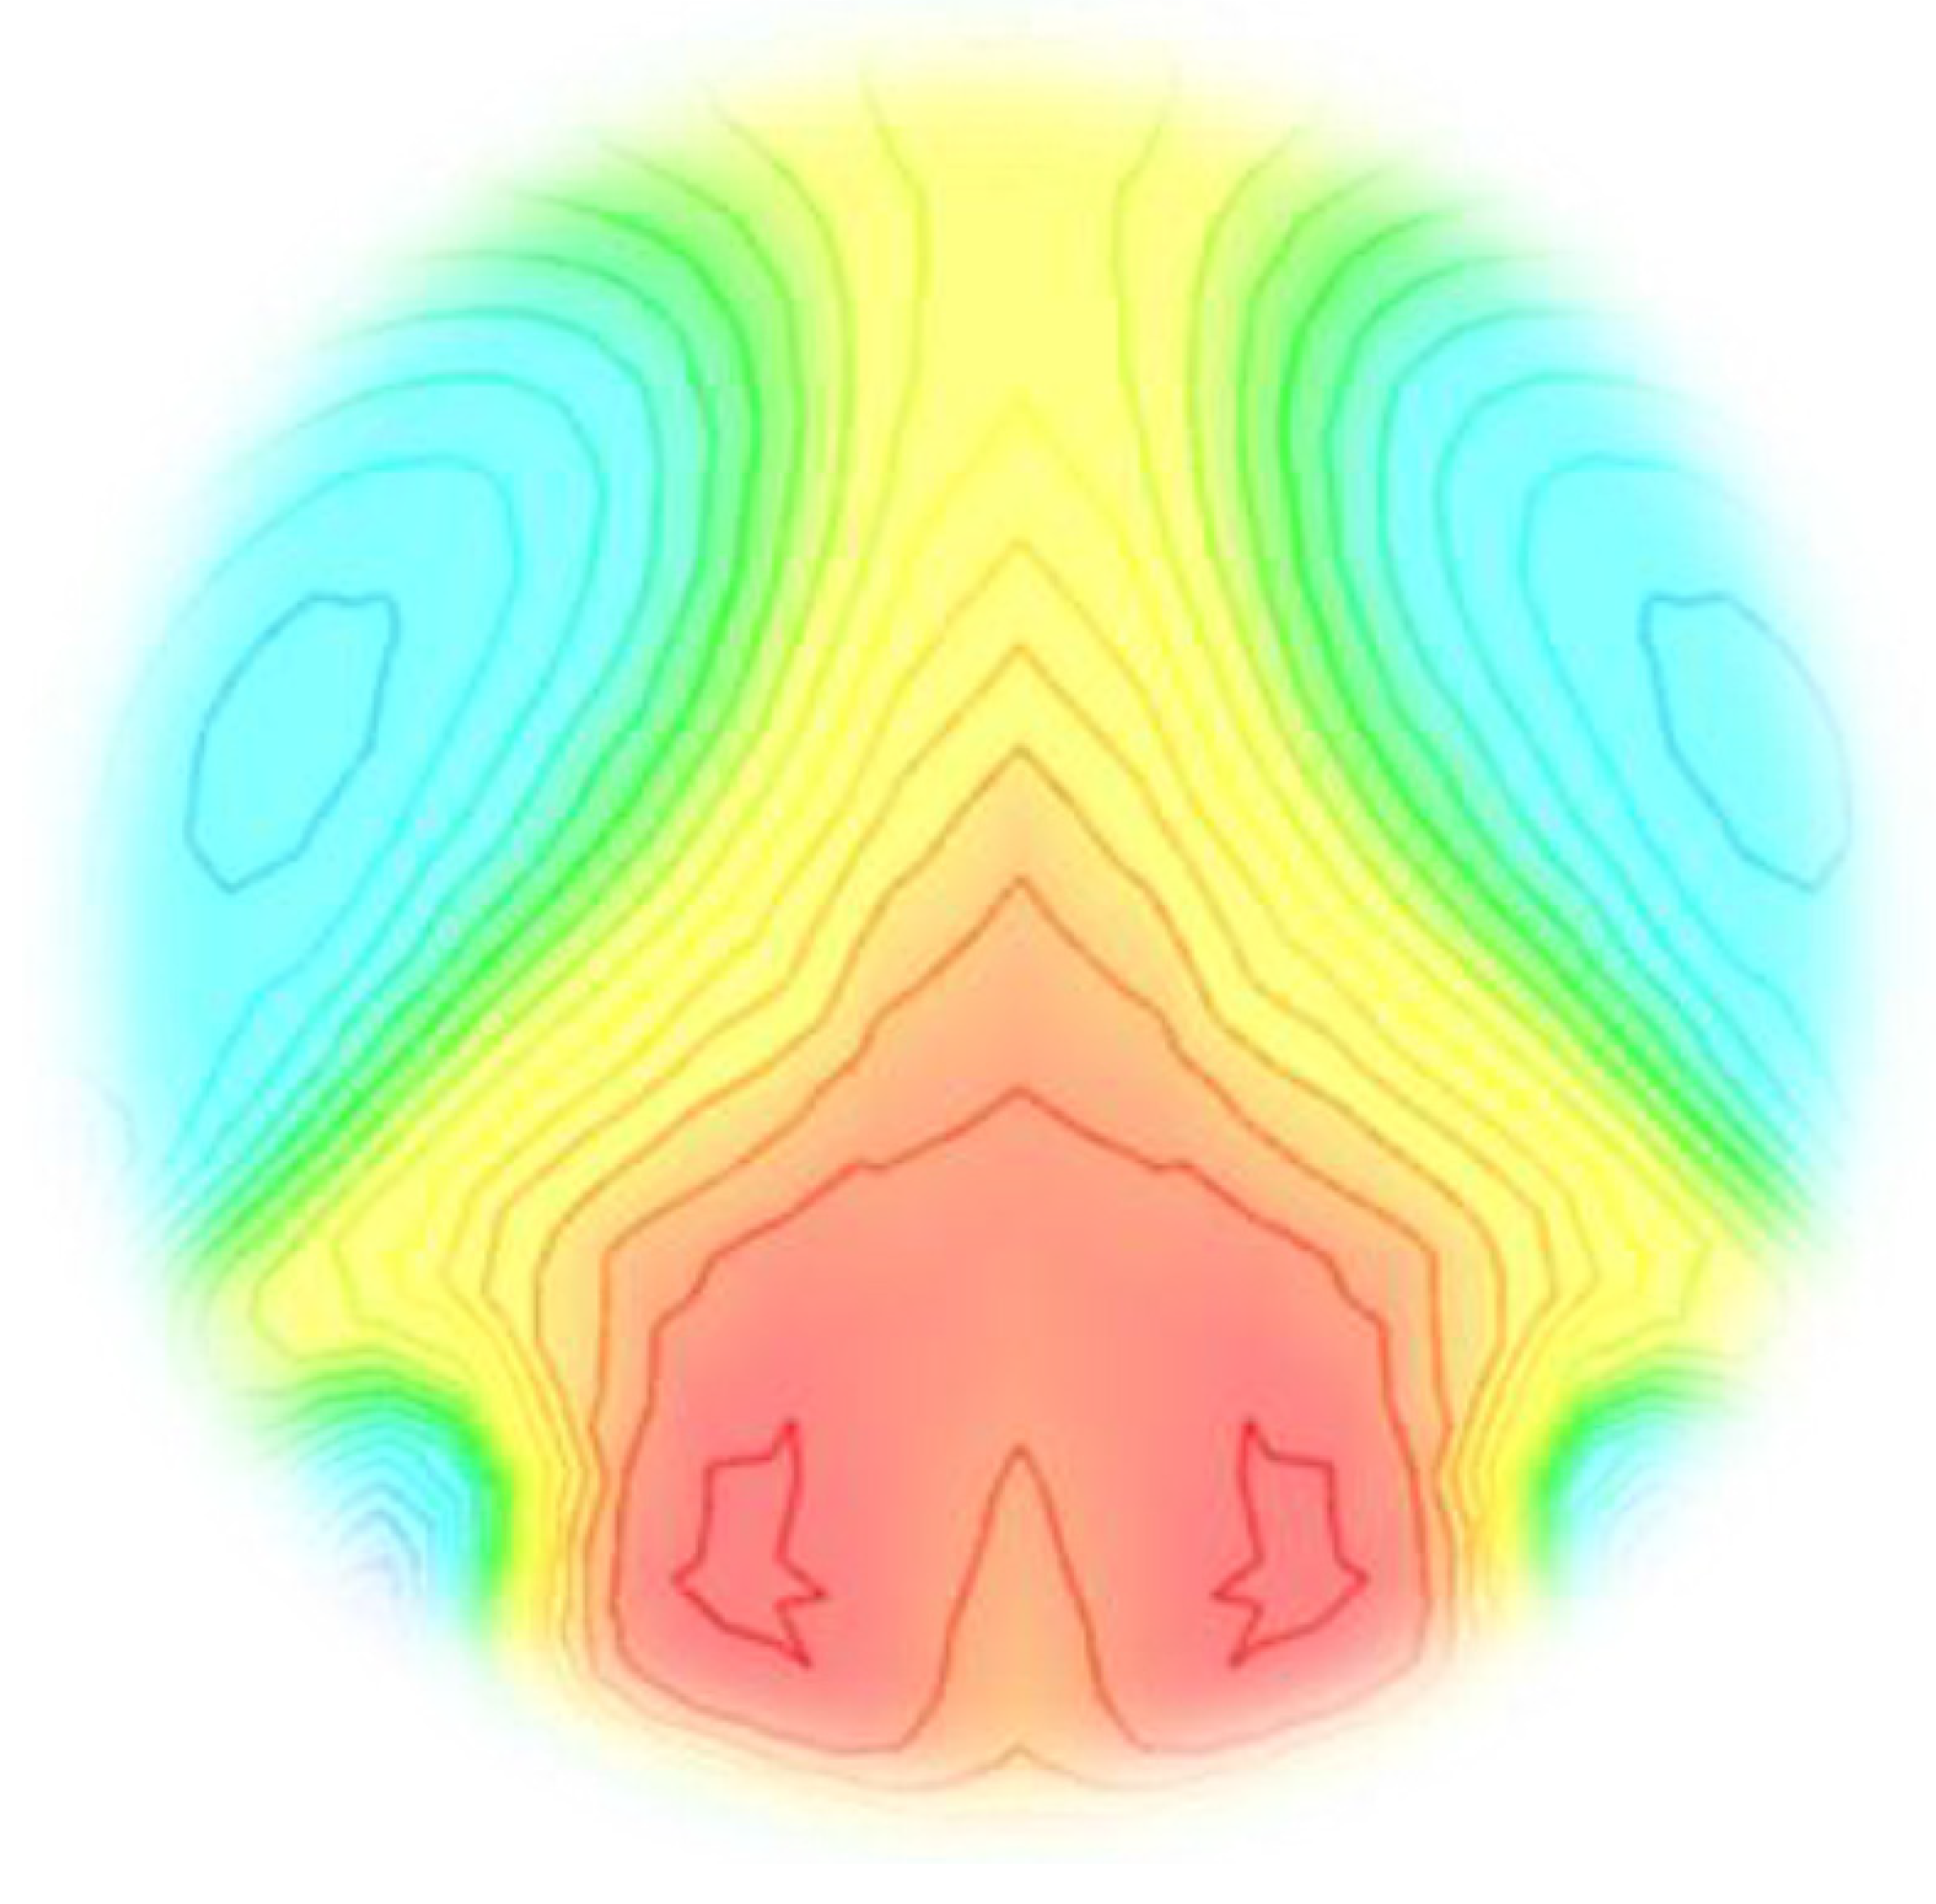
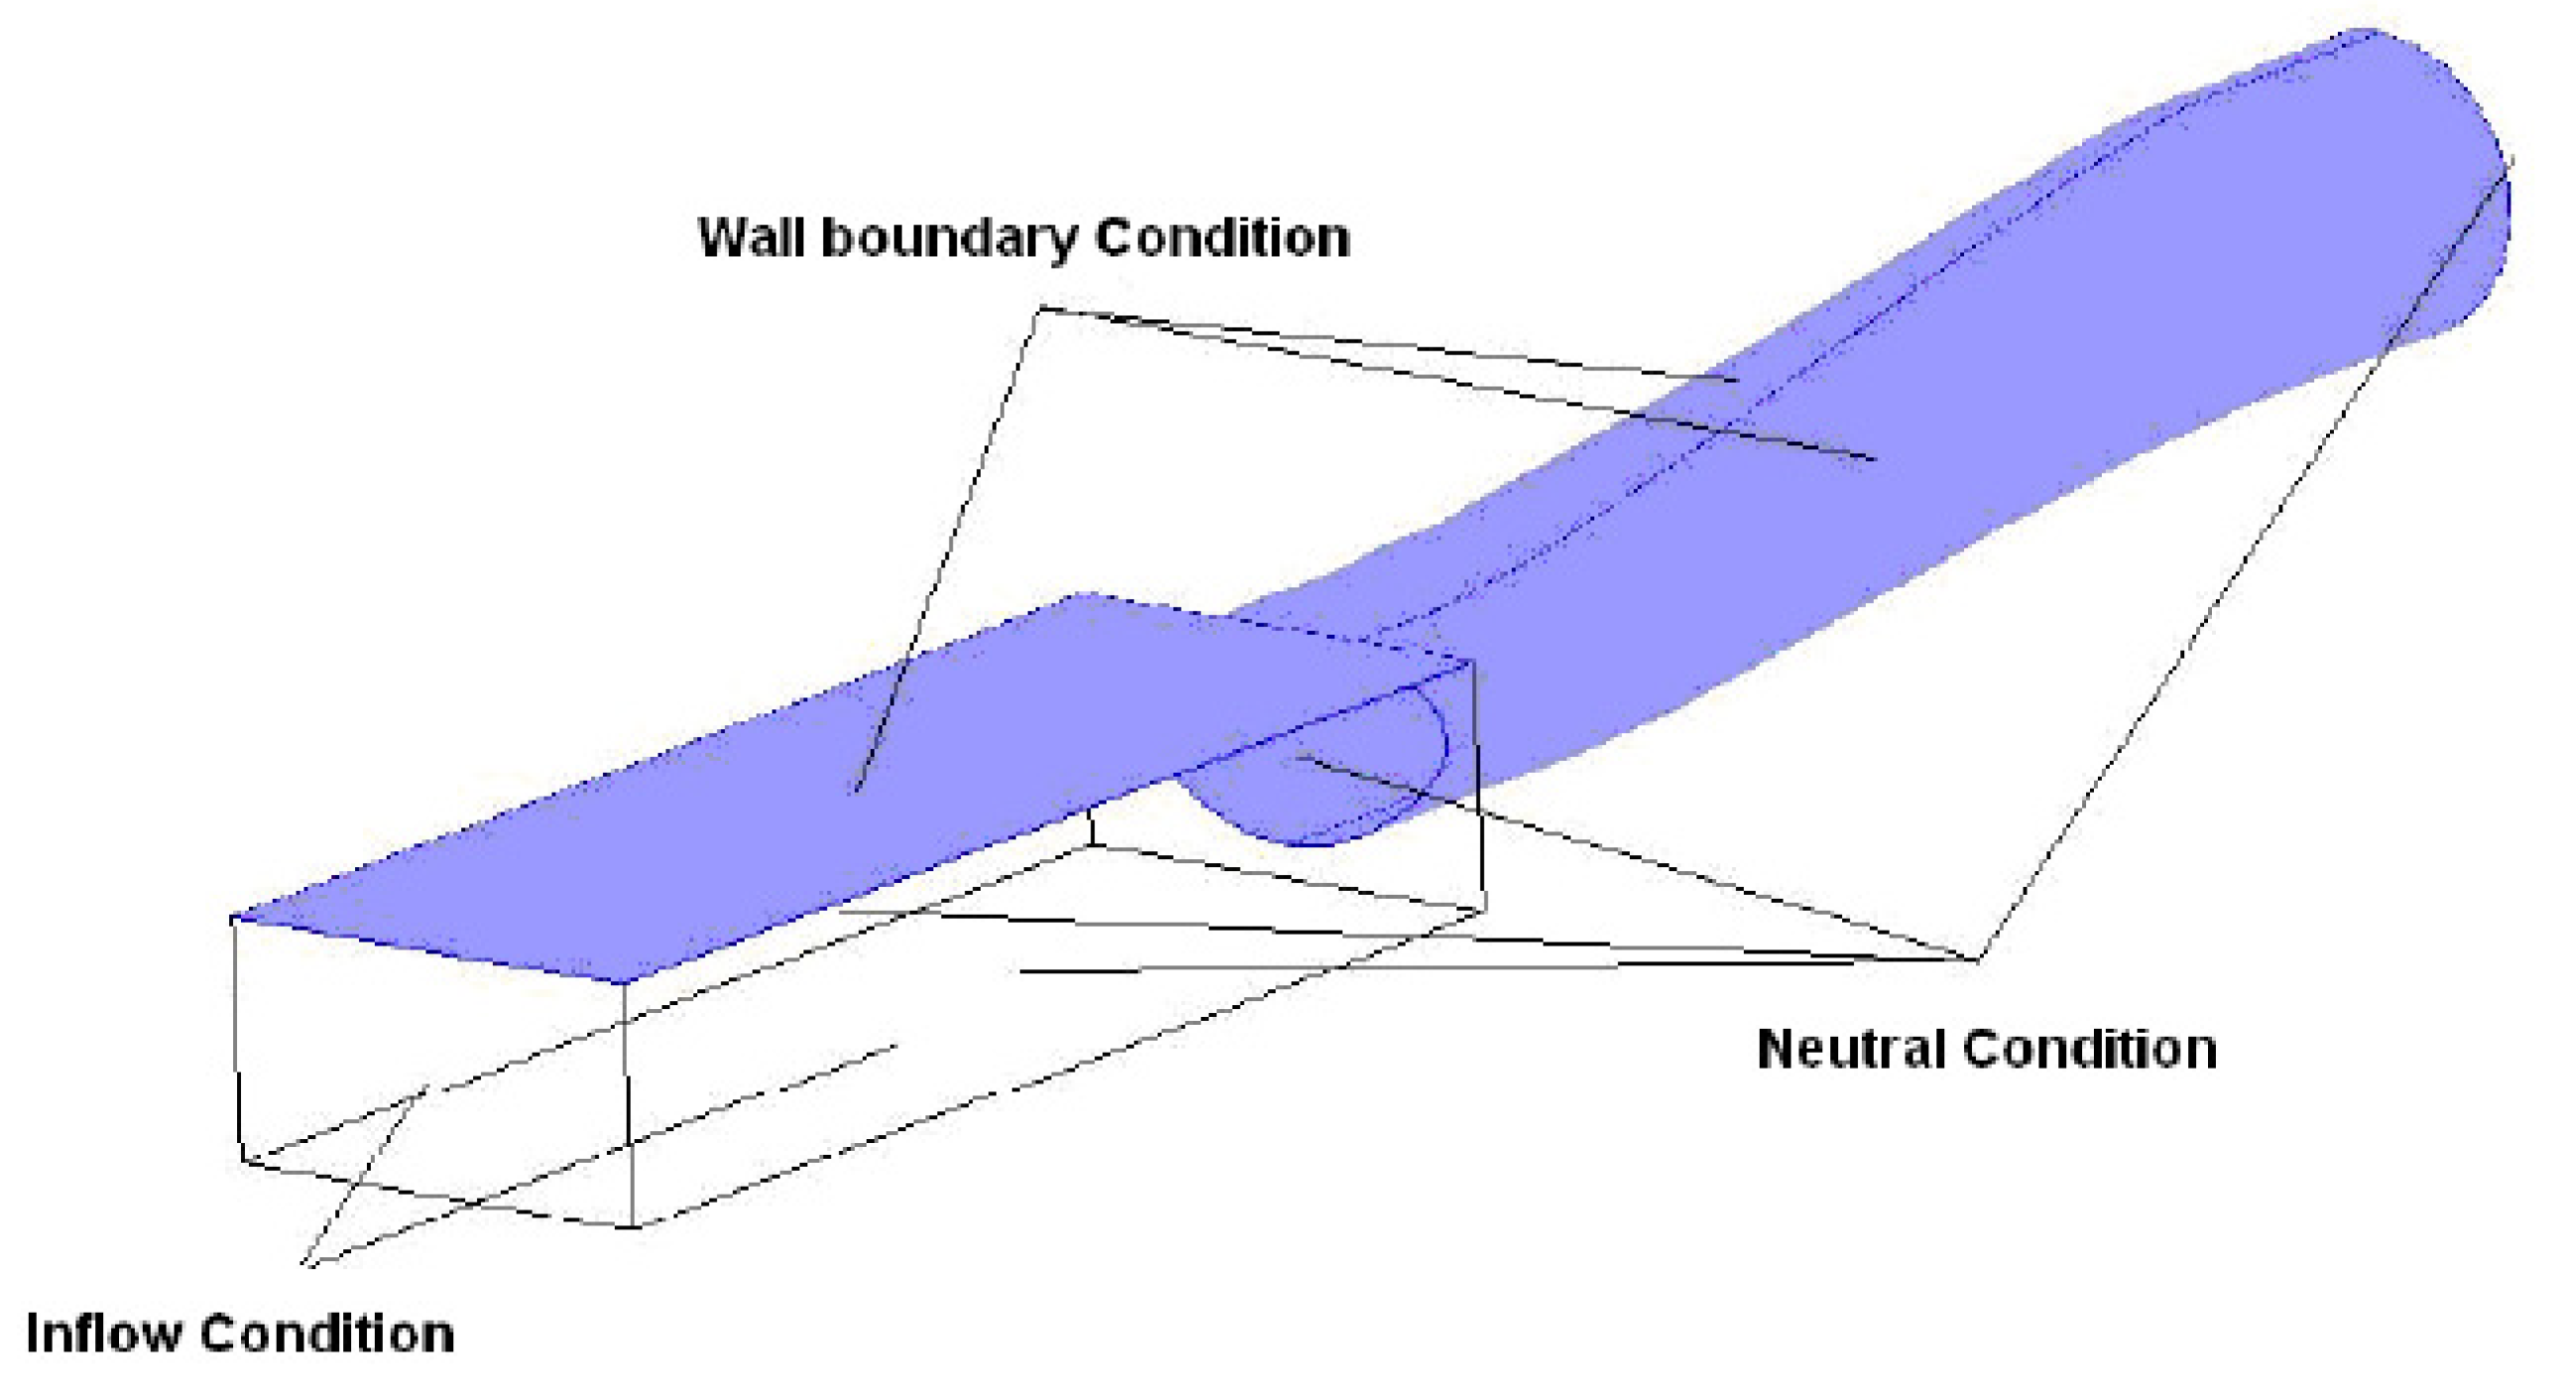
Another paper [2] investigated a modified DSI (diverterless supersonic inlet) intake system at various angles of attack and Mach numbers. The DSI, also known as a bump inlet, is an innovative design element for high-speed aircraft, offering considerable advantages in the design of stealth aircraft, and considered to be a state-of-the-art technology in some of the latest jet fighters. The modification of the geometry in the existing DSI was proposed to improve the performance of the aircraft’s propulsion. A numerical analysis of the existing DSI was carried out with different angles of attack and Mach numbers for this purpose. The numerical model was validated with the available experimental data. The performance of the modified DSI was assessed with the criteria of the pressure-recovery factor, the pressure coefficient (being the ratio of a specified area to the average pressure within a cross section), and the drag coefficient. The analysis was carried out at subsonic Mach numbers with three different angles of attack at the same flight altitude. This provided data on the behavior of the parameters, including by testing the distribution of the pressure-field changes. An example of the results is shown in Figure 3.
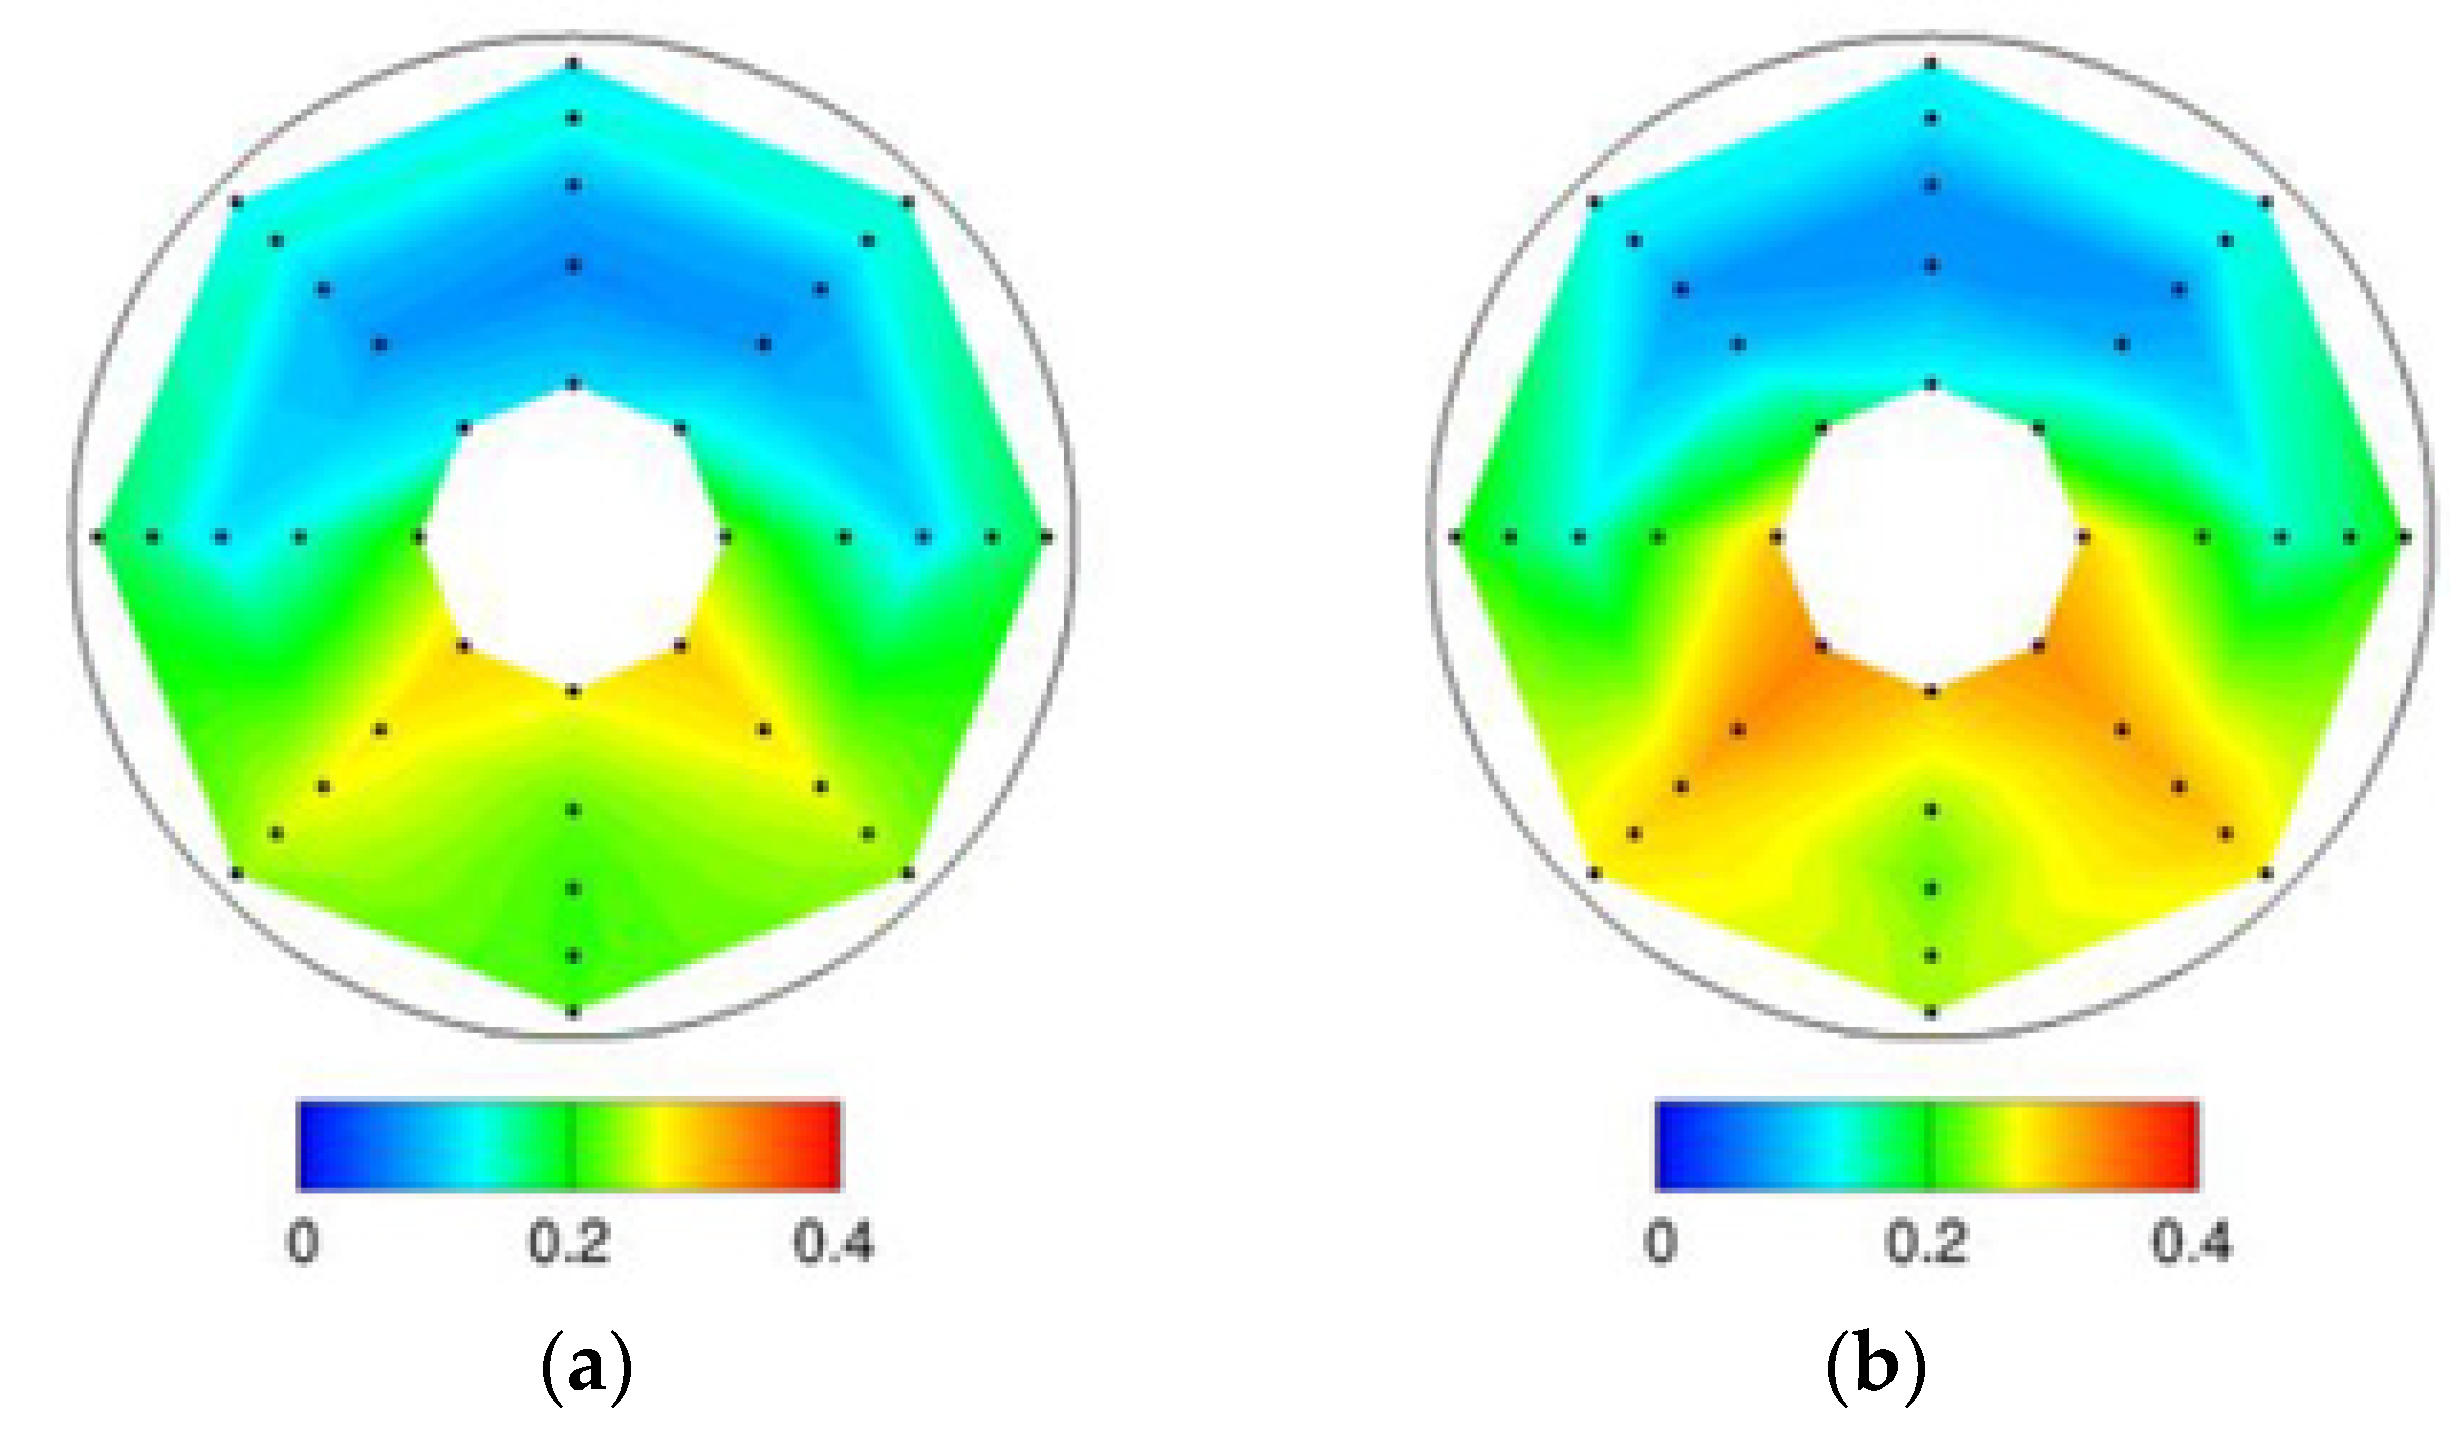
Another paper [3] investigated the dependence of the total-pressure disturbances at the outlet of a high-diffusion-offset twin-intake S-duct system to determine whether a classic solution to the problem could be applied (Figure 4). The assessment of the combined characteristics of the time-dependent radial and circumferential disturbances demonstrated that local ring-based descriptors of flow distortions were more suitable for the characterization of maximum events. An EVT (extreme value theory) was applied to predict the maximum distortion levels that could emerge during the test duration that exceeded the available set of experimental data. It was found that, in comparison with the dynamic pressure, the total-pressure fluctuations were moderately dependent on the Mach number in all the investigated duct systems. However, changing the bend-offset ratio of the S-duct from 1.34 to 2.44 significantly changed the average total-pressure instability in the AIP (aerodynamic interface plane). It was discovered that higher secondary flows, caused by an increase in the final system, not only favored total-pressure loss, but also increased the overall flow-field instability within the AIP.
Another paper [4] presented the numerical (CFD) testing of a DSI intake design using Ansys. The CFD analysis was performed on a selection of DSI configurations, with a Mach number between 0.8 and 1.6. This provided results relevant to the performance of the tested design/configuration cases in the studied range of Mach numbers. They also identified the best geometric configuration that provided the most favorable pressure-recovery factor. Suggestions were given for future activities concerning the improvement in the pressure-recovery factor in the DSI-intake-system concept. The pressure-recovery factor is defined here as the ratio of the overall pressure in the inlet cross section (Figure 5) to the free-flow total pressure. The values of the factor cover the range between 0 and 1, with 1 being no energy loss. Higher pressure-recovery-factor values are more favorable, as the factor markedly affects the thrust force of turbojet engines. Based on the total-pressure distributions, it was found that using a tear-drop-shaped bump can produce better aerodynamic parameters than those provided by an ellipsoid bump.
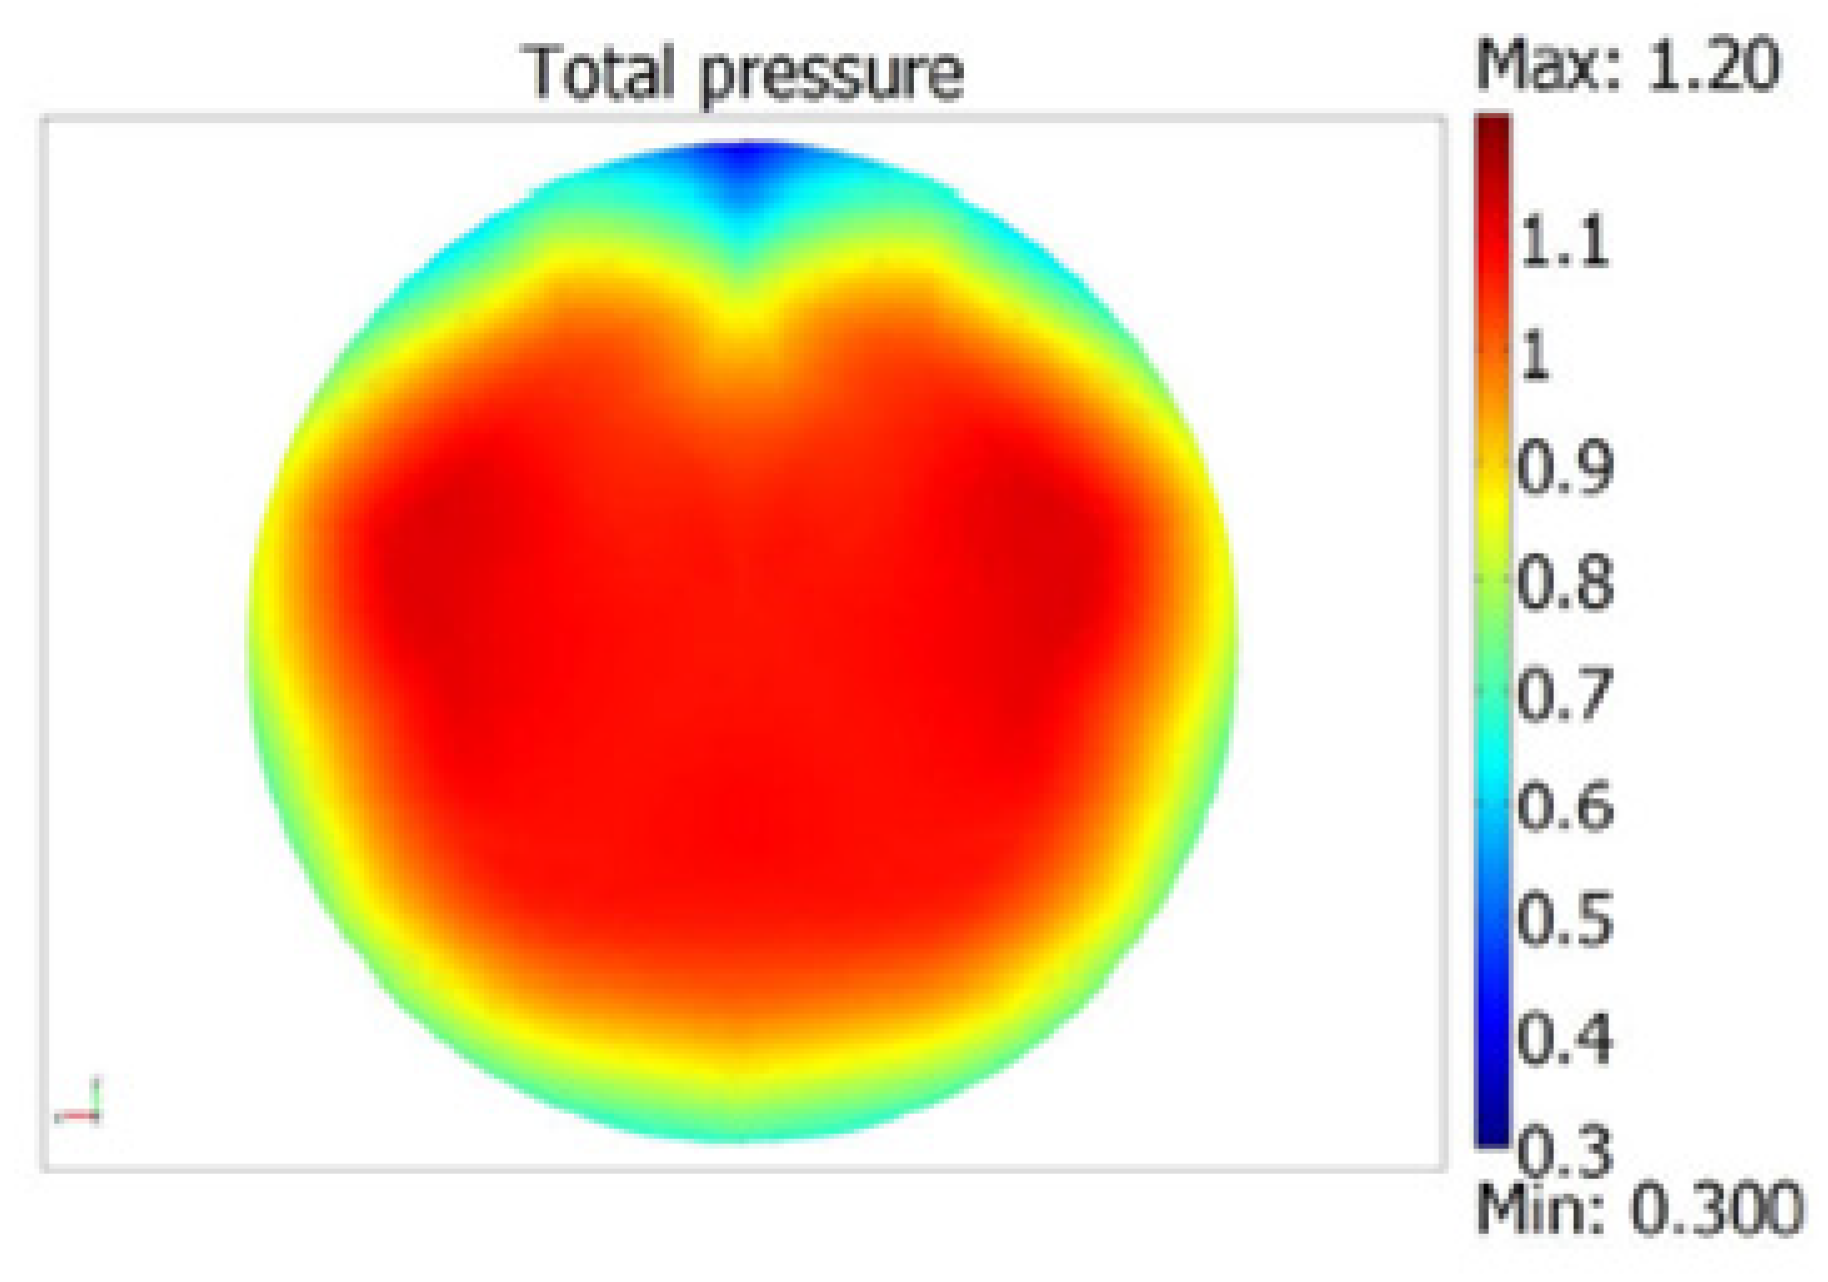
Another paper [5] contained an analysis of the changes in the intake-pressure-recovery factor and total-pressure distribution at different flight parameters of an F-16 jet fighter, which included the Mach number, angle of attack, and angle of roll. The intake parameters were investigated with reference to the AIP. The paper used a simplified computational model, which only included the intake tuck and the area under the aircraft fuselage (Figure 6).
Nonuniform-pressure-field distributions were achieved (Figure 7), which varied in intervals of 0.910–0.980 and 0.124–0.400. The flow stability through the intake was demonstrated to be affected by the aerodynamic factors of the whole flight of the aircraft.
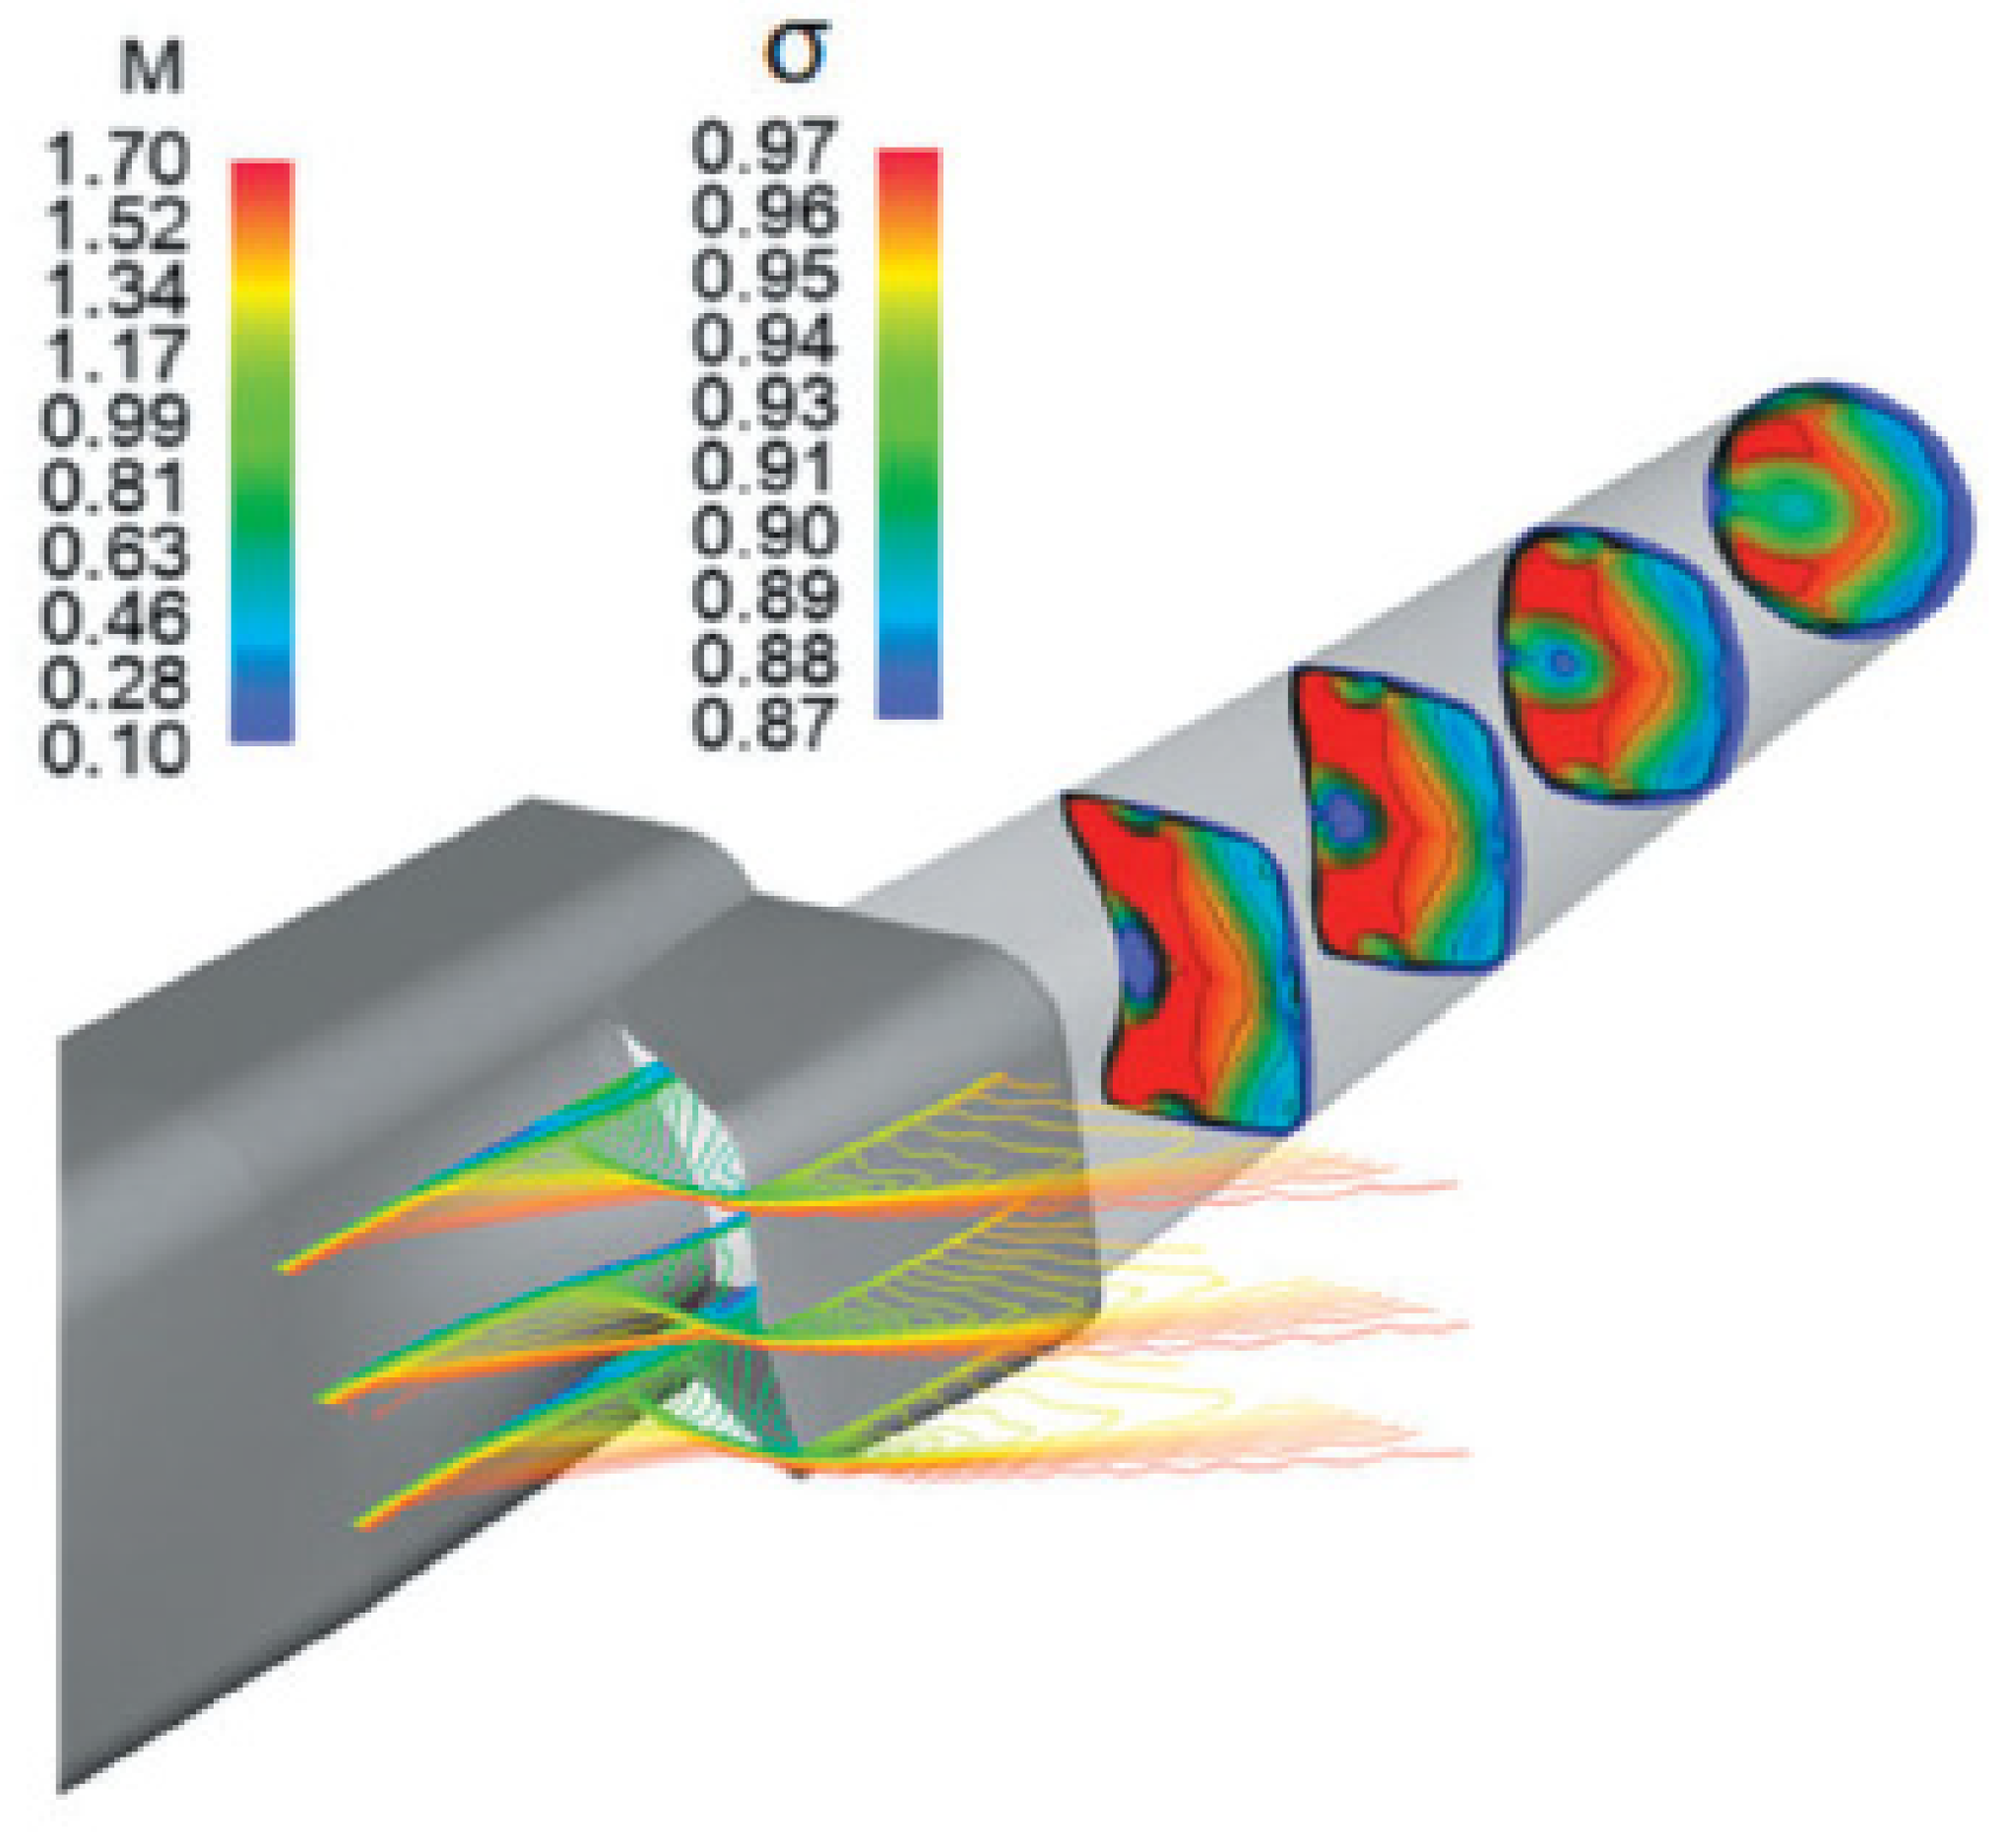
Another paper [6] involved working on improving the existing DSI intake sections based on an investigation into the distribution of the parameter fields. The examples included attempts to use a convex surface (a bump) ahead of the air intake, with early work already eliminating the risk of an epileptic form. An example of a simulated DSI performance is shown in Figure 8. The results show that there was the capacity for maintaining the structure of the shock waves during the operational mode, even at high angles of attack. The analysis of the shock-wave structures and the interaction of the shock-wave-boundary layer during supersonic maneuvers showed that the aerodynamic efficiency of a DSI with a thick boundary layer and high angles of attack was sufficient to ensure the performance of the entire supersonic flight envelope. The analysis proved that the DSI was sufficiently capable of ensuring continued operation during maneuvers at the design speed, and especially if the cowl structure was optimized for such maneuvers and flow-control technology was applied to improve the internal flow pattern.
In the literature analysis of this research area, the problem of studying the effect of a change in pressure in the inlet-fan zone (AIP (aerodynamic interface plane)) on inlet-flow disturbances was not encountered. The change in this pressure can be caused by various factors, the main one being a change in the setting angle of the inlet guide vanes. The control system causing a change in the angle of the inlet guide vanes due to its stable operation can cause instability in the operation of the inlet system. This article is part of the work carried out to study the cooperation of the inlet system with the aircraft engine fan.
2. Computational Model
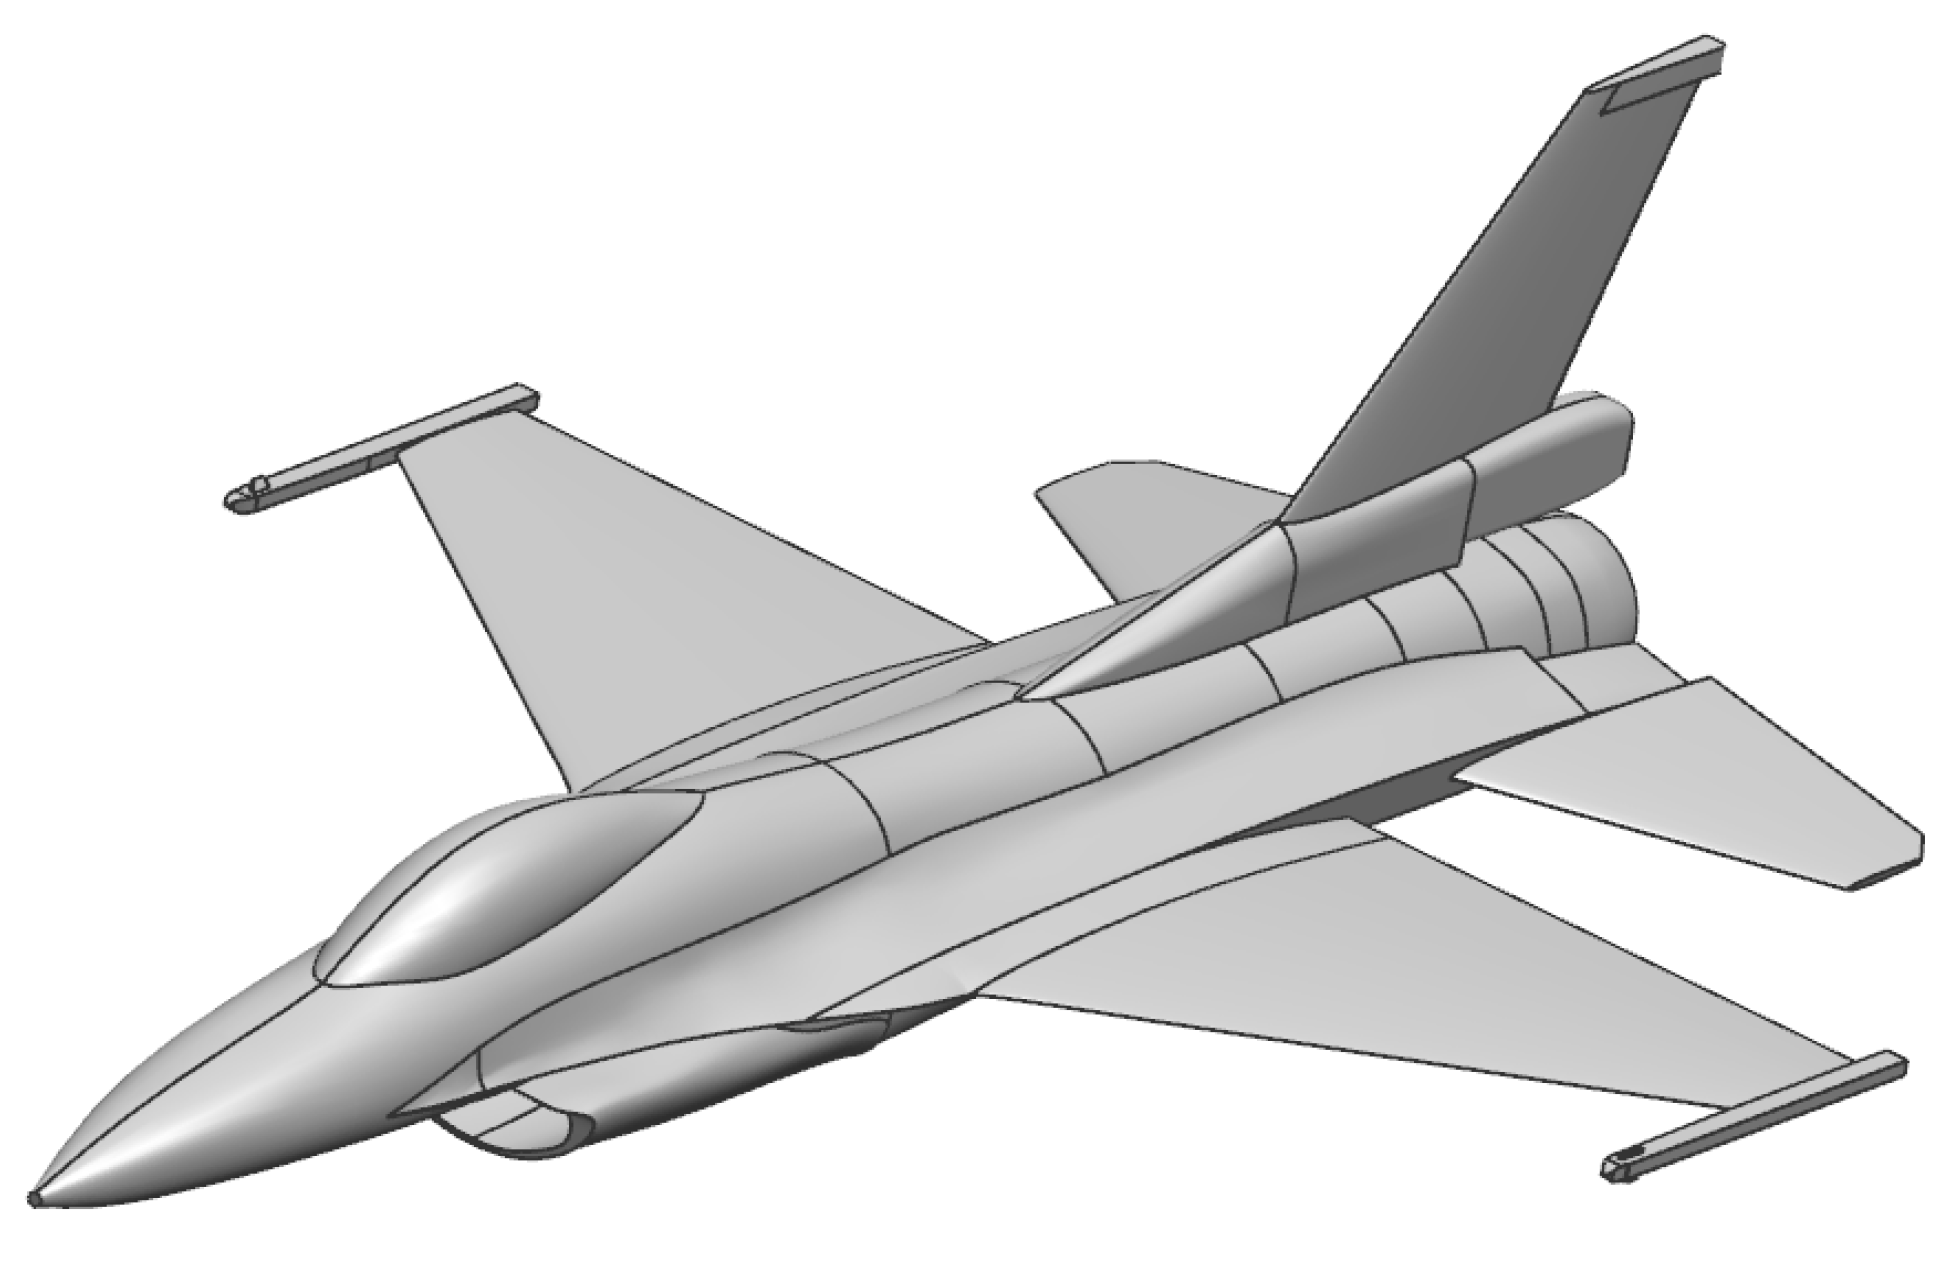
The commercial computing package CFD Ansys Fluent was used to perform the numerical simulations. The package is based on an the FVM (finite volume method). An undisputed advantage of the method is the possibility of building nonorthogonal and nonuniform computational meshes, which can be critical in the computational tasks for objects with complex shapes [7], such as for a multirole aircraft (Figure 9)
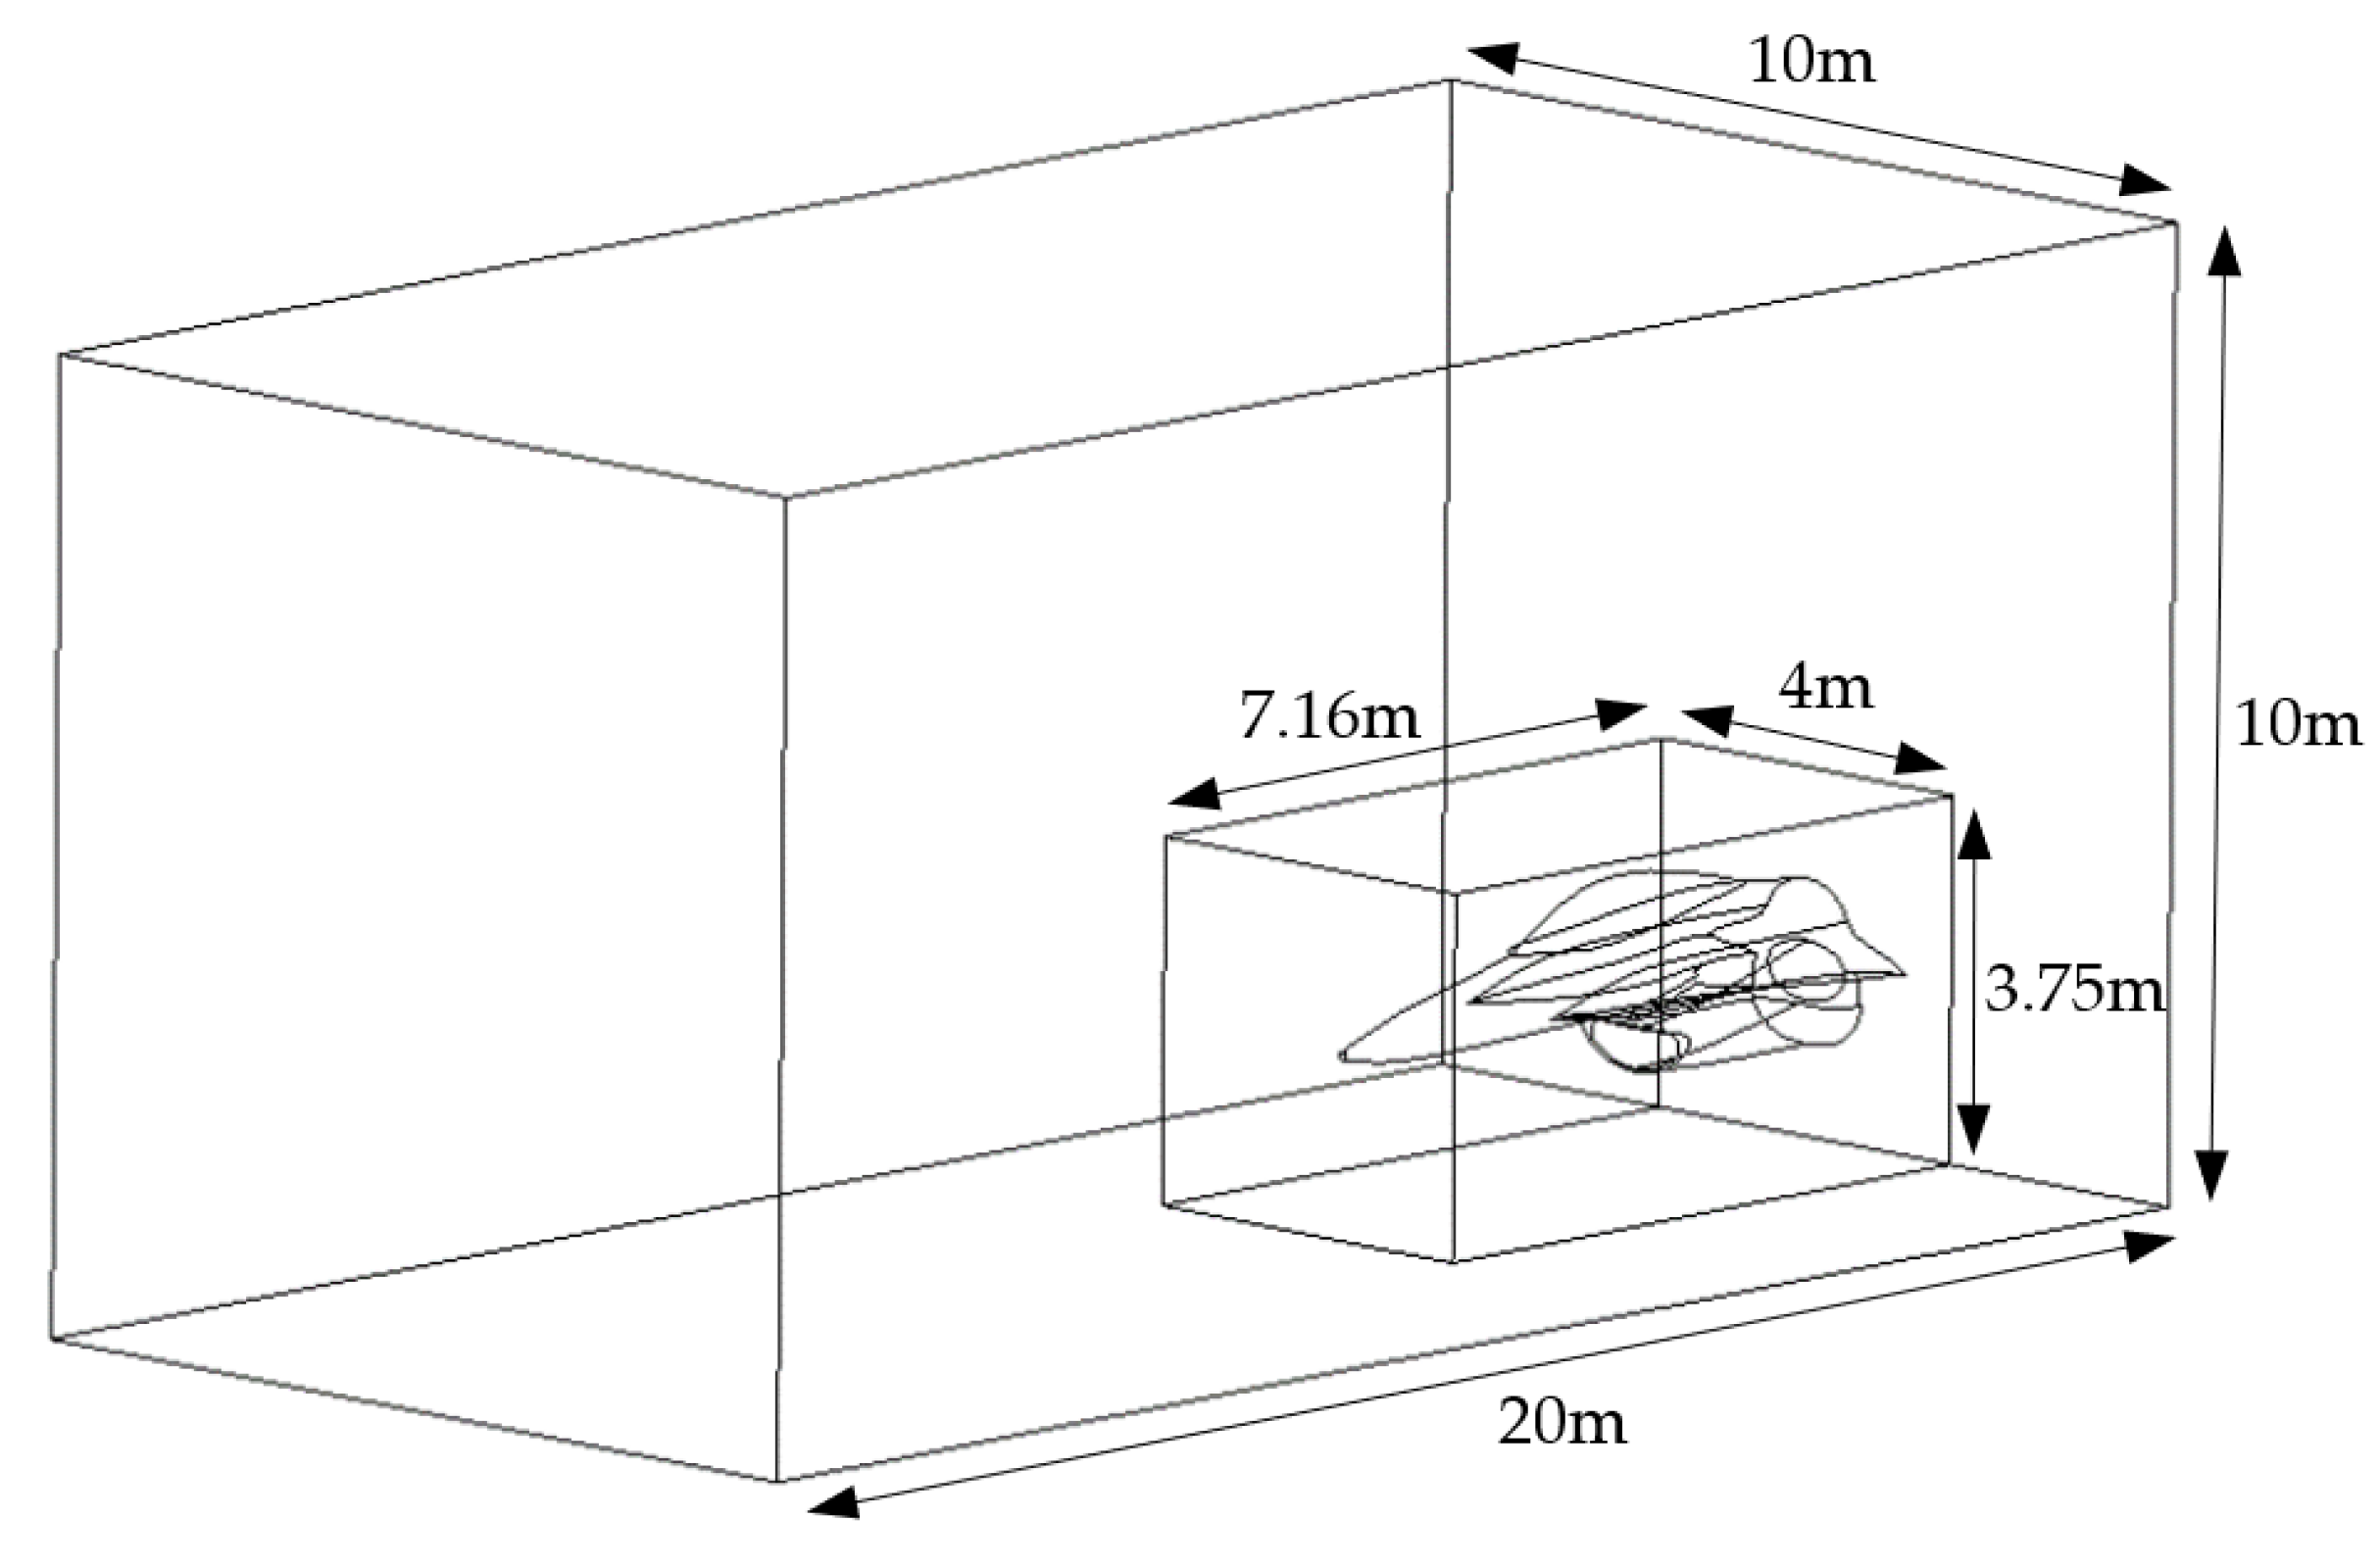
First, a computational domain was prepared, and the shape of a cuboid with the dimensions 20 m × 10 m × 10 m was chosen. It was considered necessary to thoroughly investigate the zone directly ahead of the intake section, such as the zone of an intake vortex. Therefore, based on our own experience, it was decided to separate a subdomain in the form of a cuboid with the dimensions 7.16 m × 3.75 m × 4 m. The separated additional volume was required to compact the mesh in the immediate vicinity of the engine inlet without compacting it across the entire computational domain. Procedures for extracting additional volumes for the purpose of thickening the computational meshes were required in order to increase the accuracy of the calculations. Figure 10 shows the computational domain prepared for discretization, with a separated volume necessary to perform the mesh compaction.
Before starting the discretization process, the boundary conditions recognized by the Ansys Fluent software were assigned to the appropriate surfaces of the prepared calculation area. Thus, the “pressure-far-field” condition was assigned to the outer regions of the computational domain. This condition was used to simulate the free flow for a given Mach number, and the static-pressure and temperature values. A “pressure outlet” condition was set at the compressor inlet to establish a static-pressure value corresponding to the compressor operating conditions. The remaining surfaces were assigned “wall” conditions, including the fuselage surface of the airplane model and the surface representing the ground plane (under the fuselage surface). In the case of numerical flow analysis using viscous fluids, the “wall” condition allowed us to determine the nonslip on the surface, representing the fluid–solid boundary.
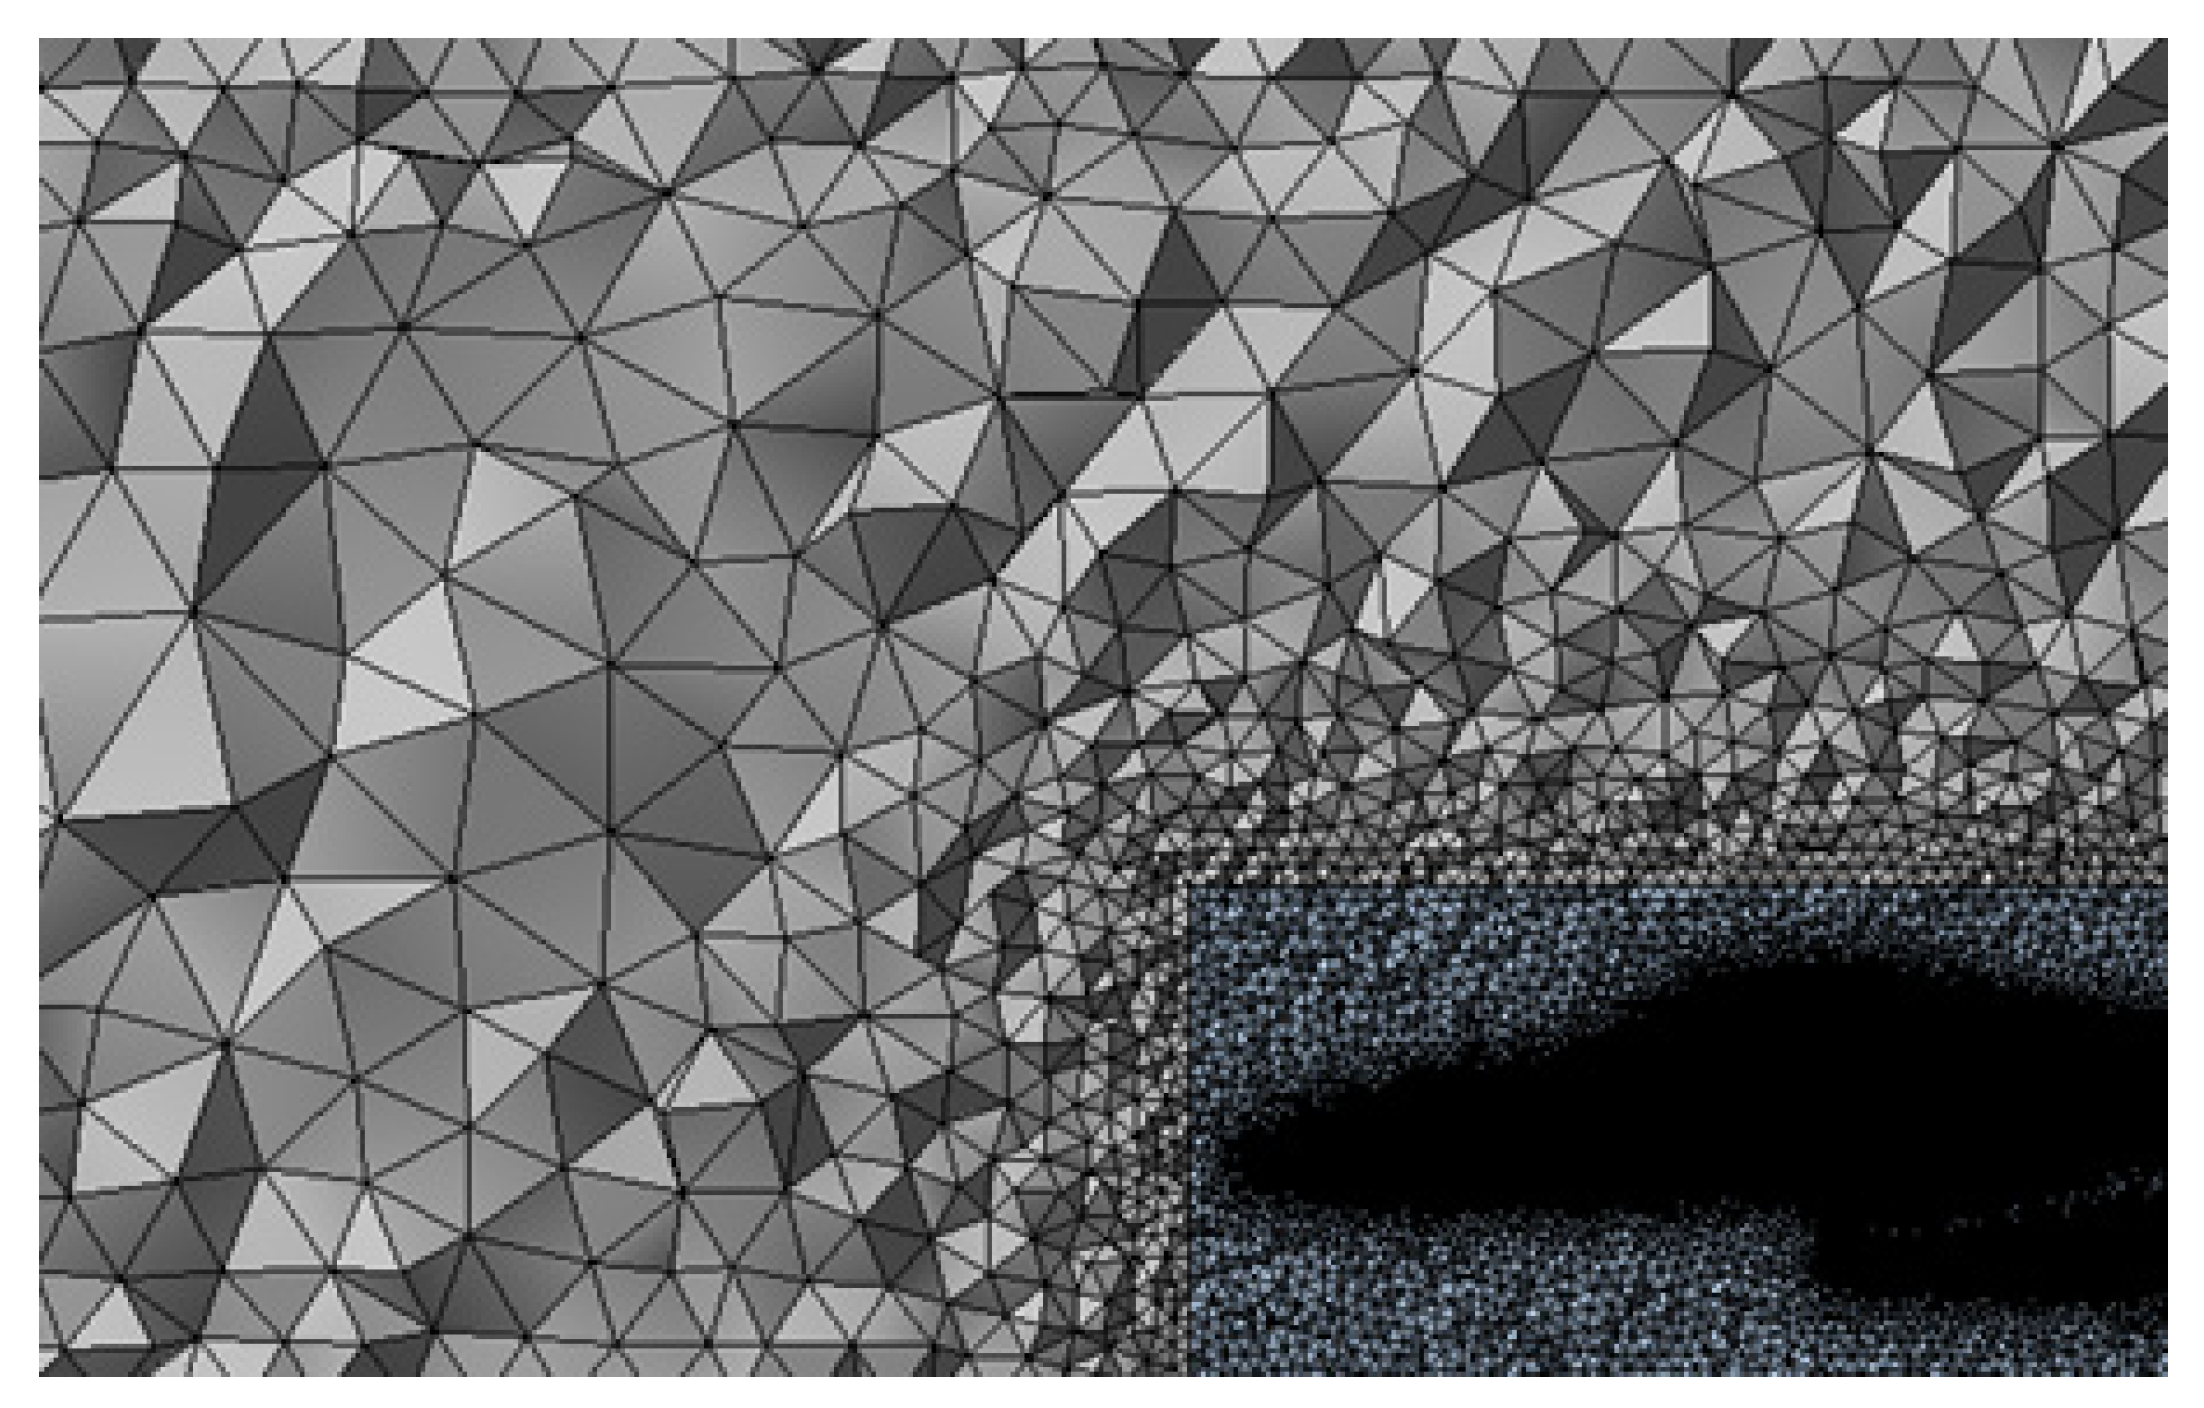
The model was adapted to carry out numerical three-dimensional flow simulations; hence, the discretization was made on the basis of discrete 3D elements with the use of structural and nonstructural meshes by building the so-called hybrid mesh. Triangular elements were modeled on the surfaces of the calculation area. In the area of the boundary layer (in the engine inlet), five layers of prismatic elements were modeled. The remaining volume of the computational domain was discretized with tetrahedral elements. Figure 11 shows the cross section of the mesh created in the aircraft plane of symmetry.
As the FVM (finite volume method) was based on the direct digitization, in a physical space of equations that express the principles of conservation, the starting point involved equations of conservation formulated as integrals [7]. The equations and the method of their transformation are shown in [8,9].
Furthermore, the equations were averaged according to the formulas shown in [10,11,12], which produced Reynolds-averaged Navier–Stokes (RANS) equations. These nonlinear equations were used to solve the problem of interest. Note that the averaging of these equations resulted in the previously closed system of equations becoming an open system, as the six complementary relationships were missing that determined the components of a turbulent stress tensor [12], and hence, it was necessary to apply turbulence models. In this work, for the purpose of carrying out the numerical simulations, the Spalart–Allmaras turbulence model with its standard settings was used [13].
3. Analysis of the Results
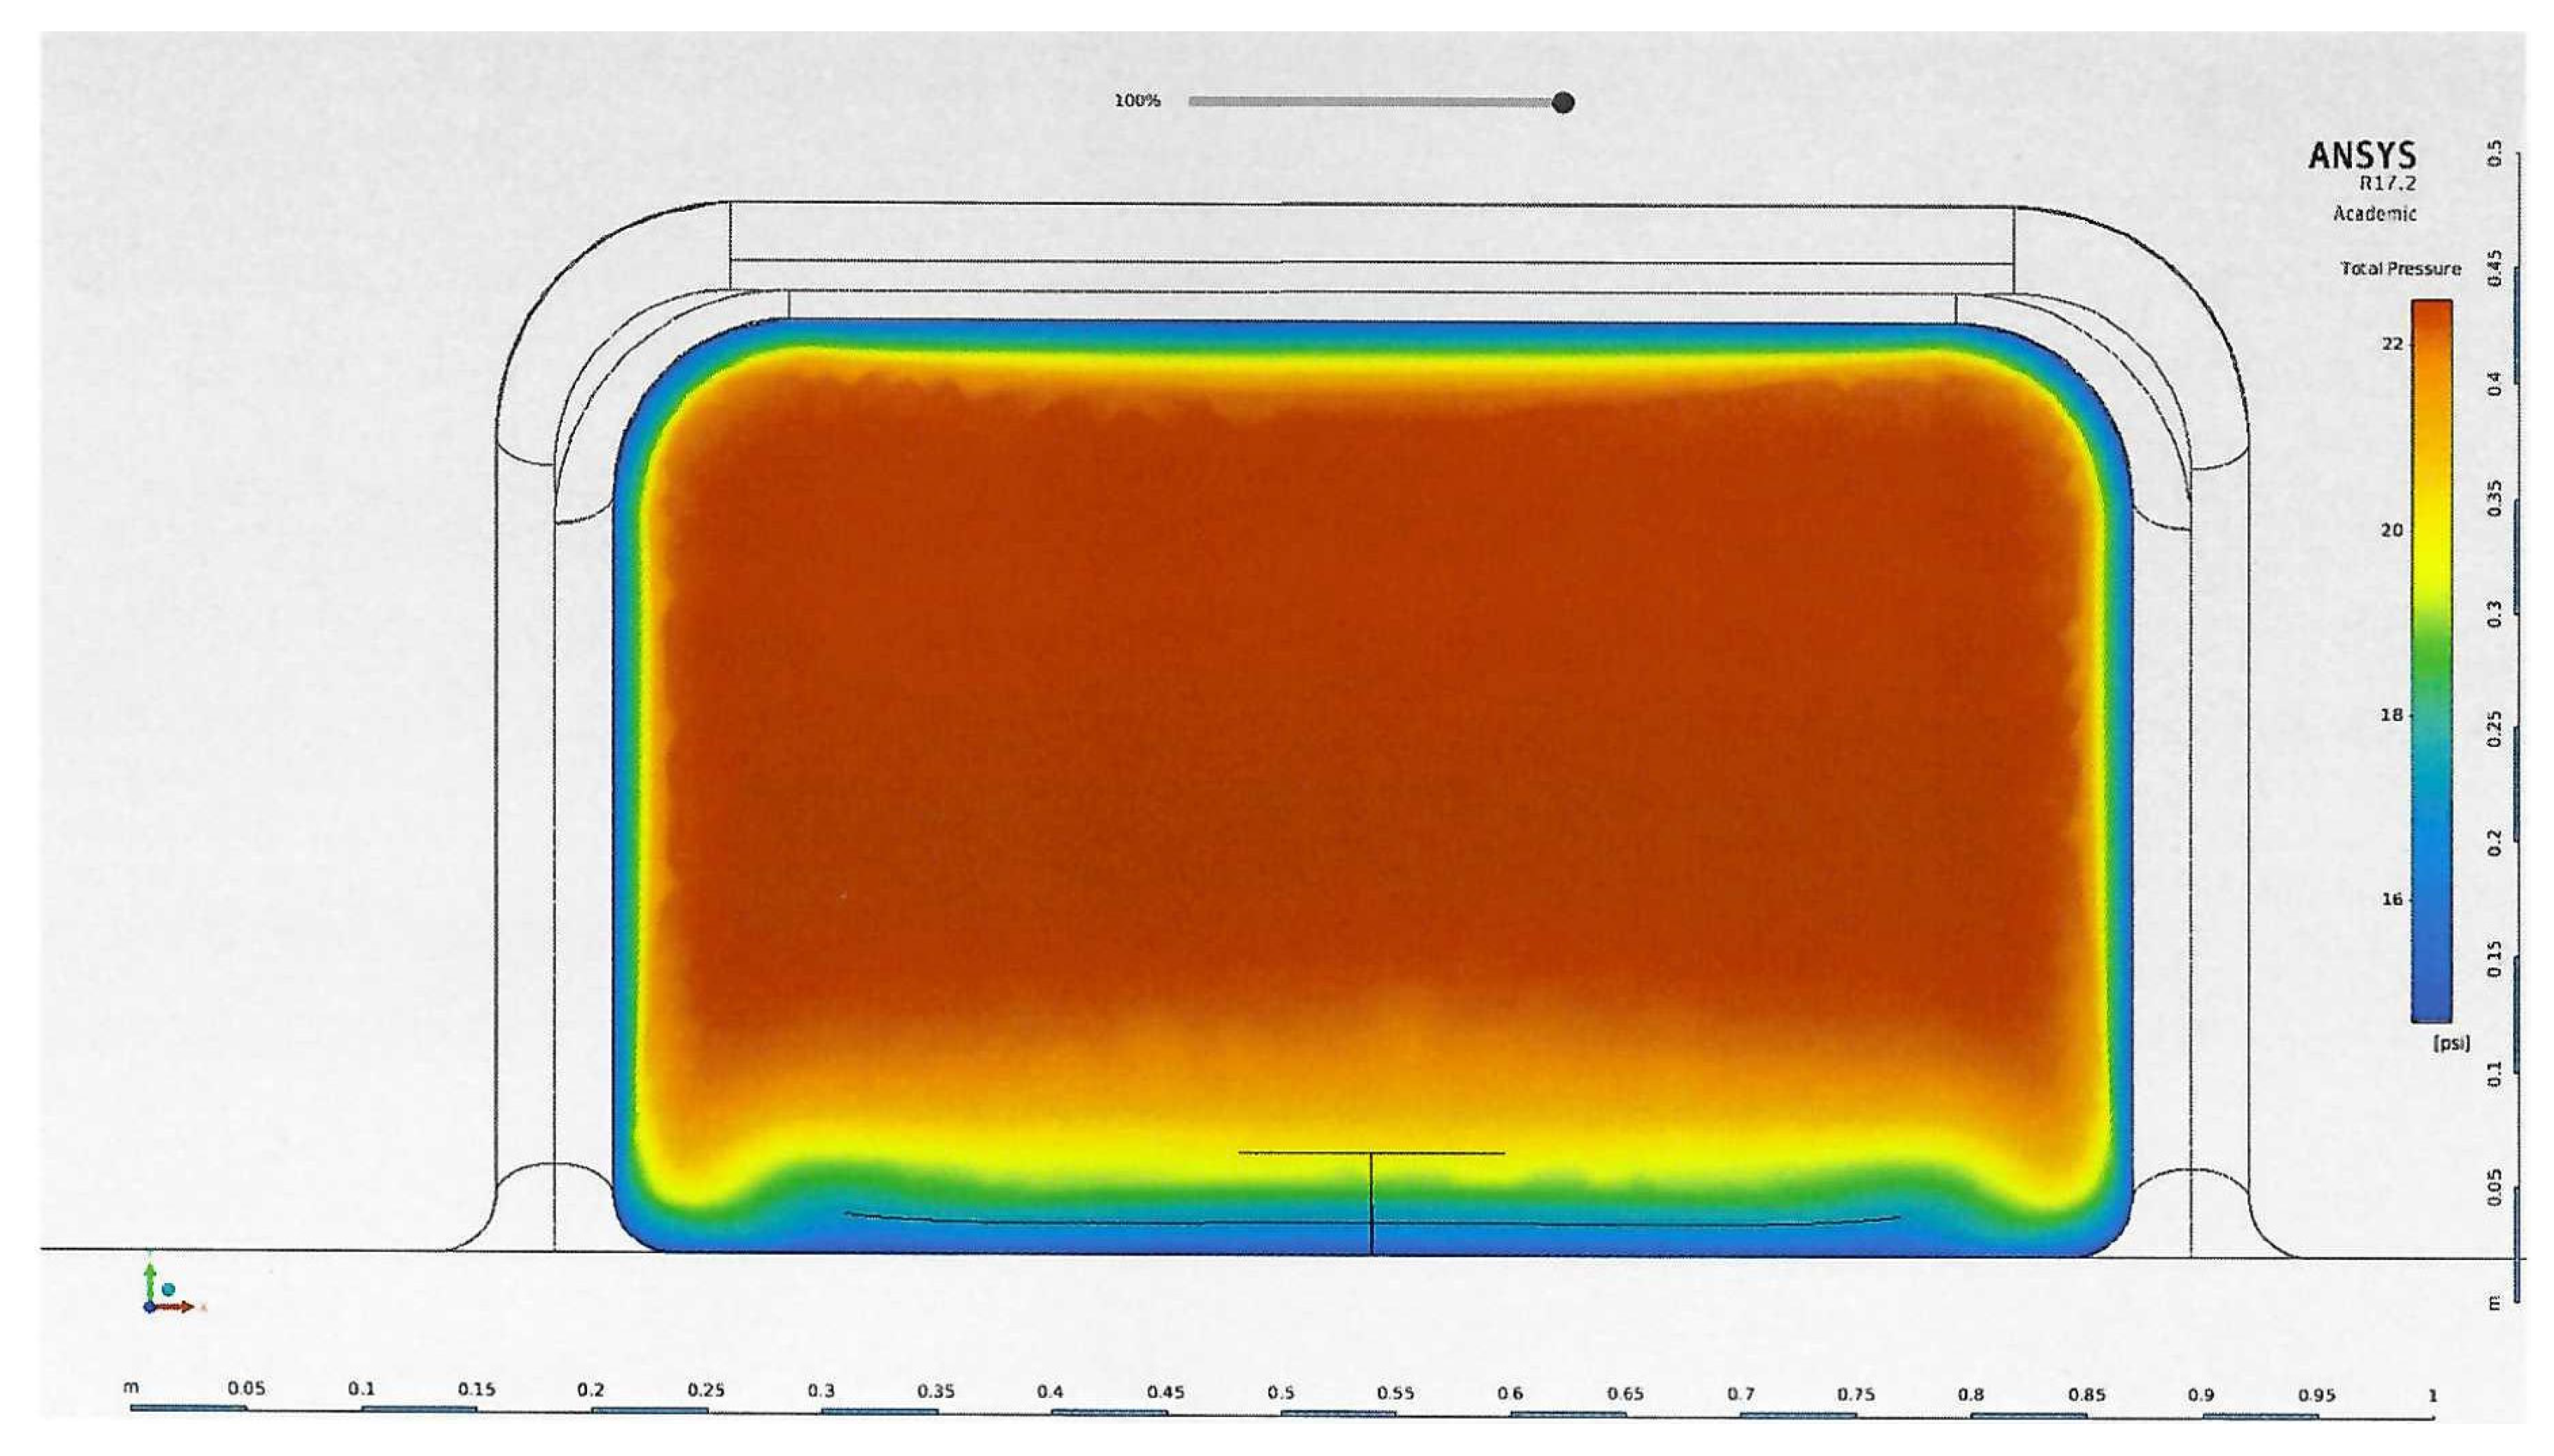
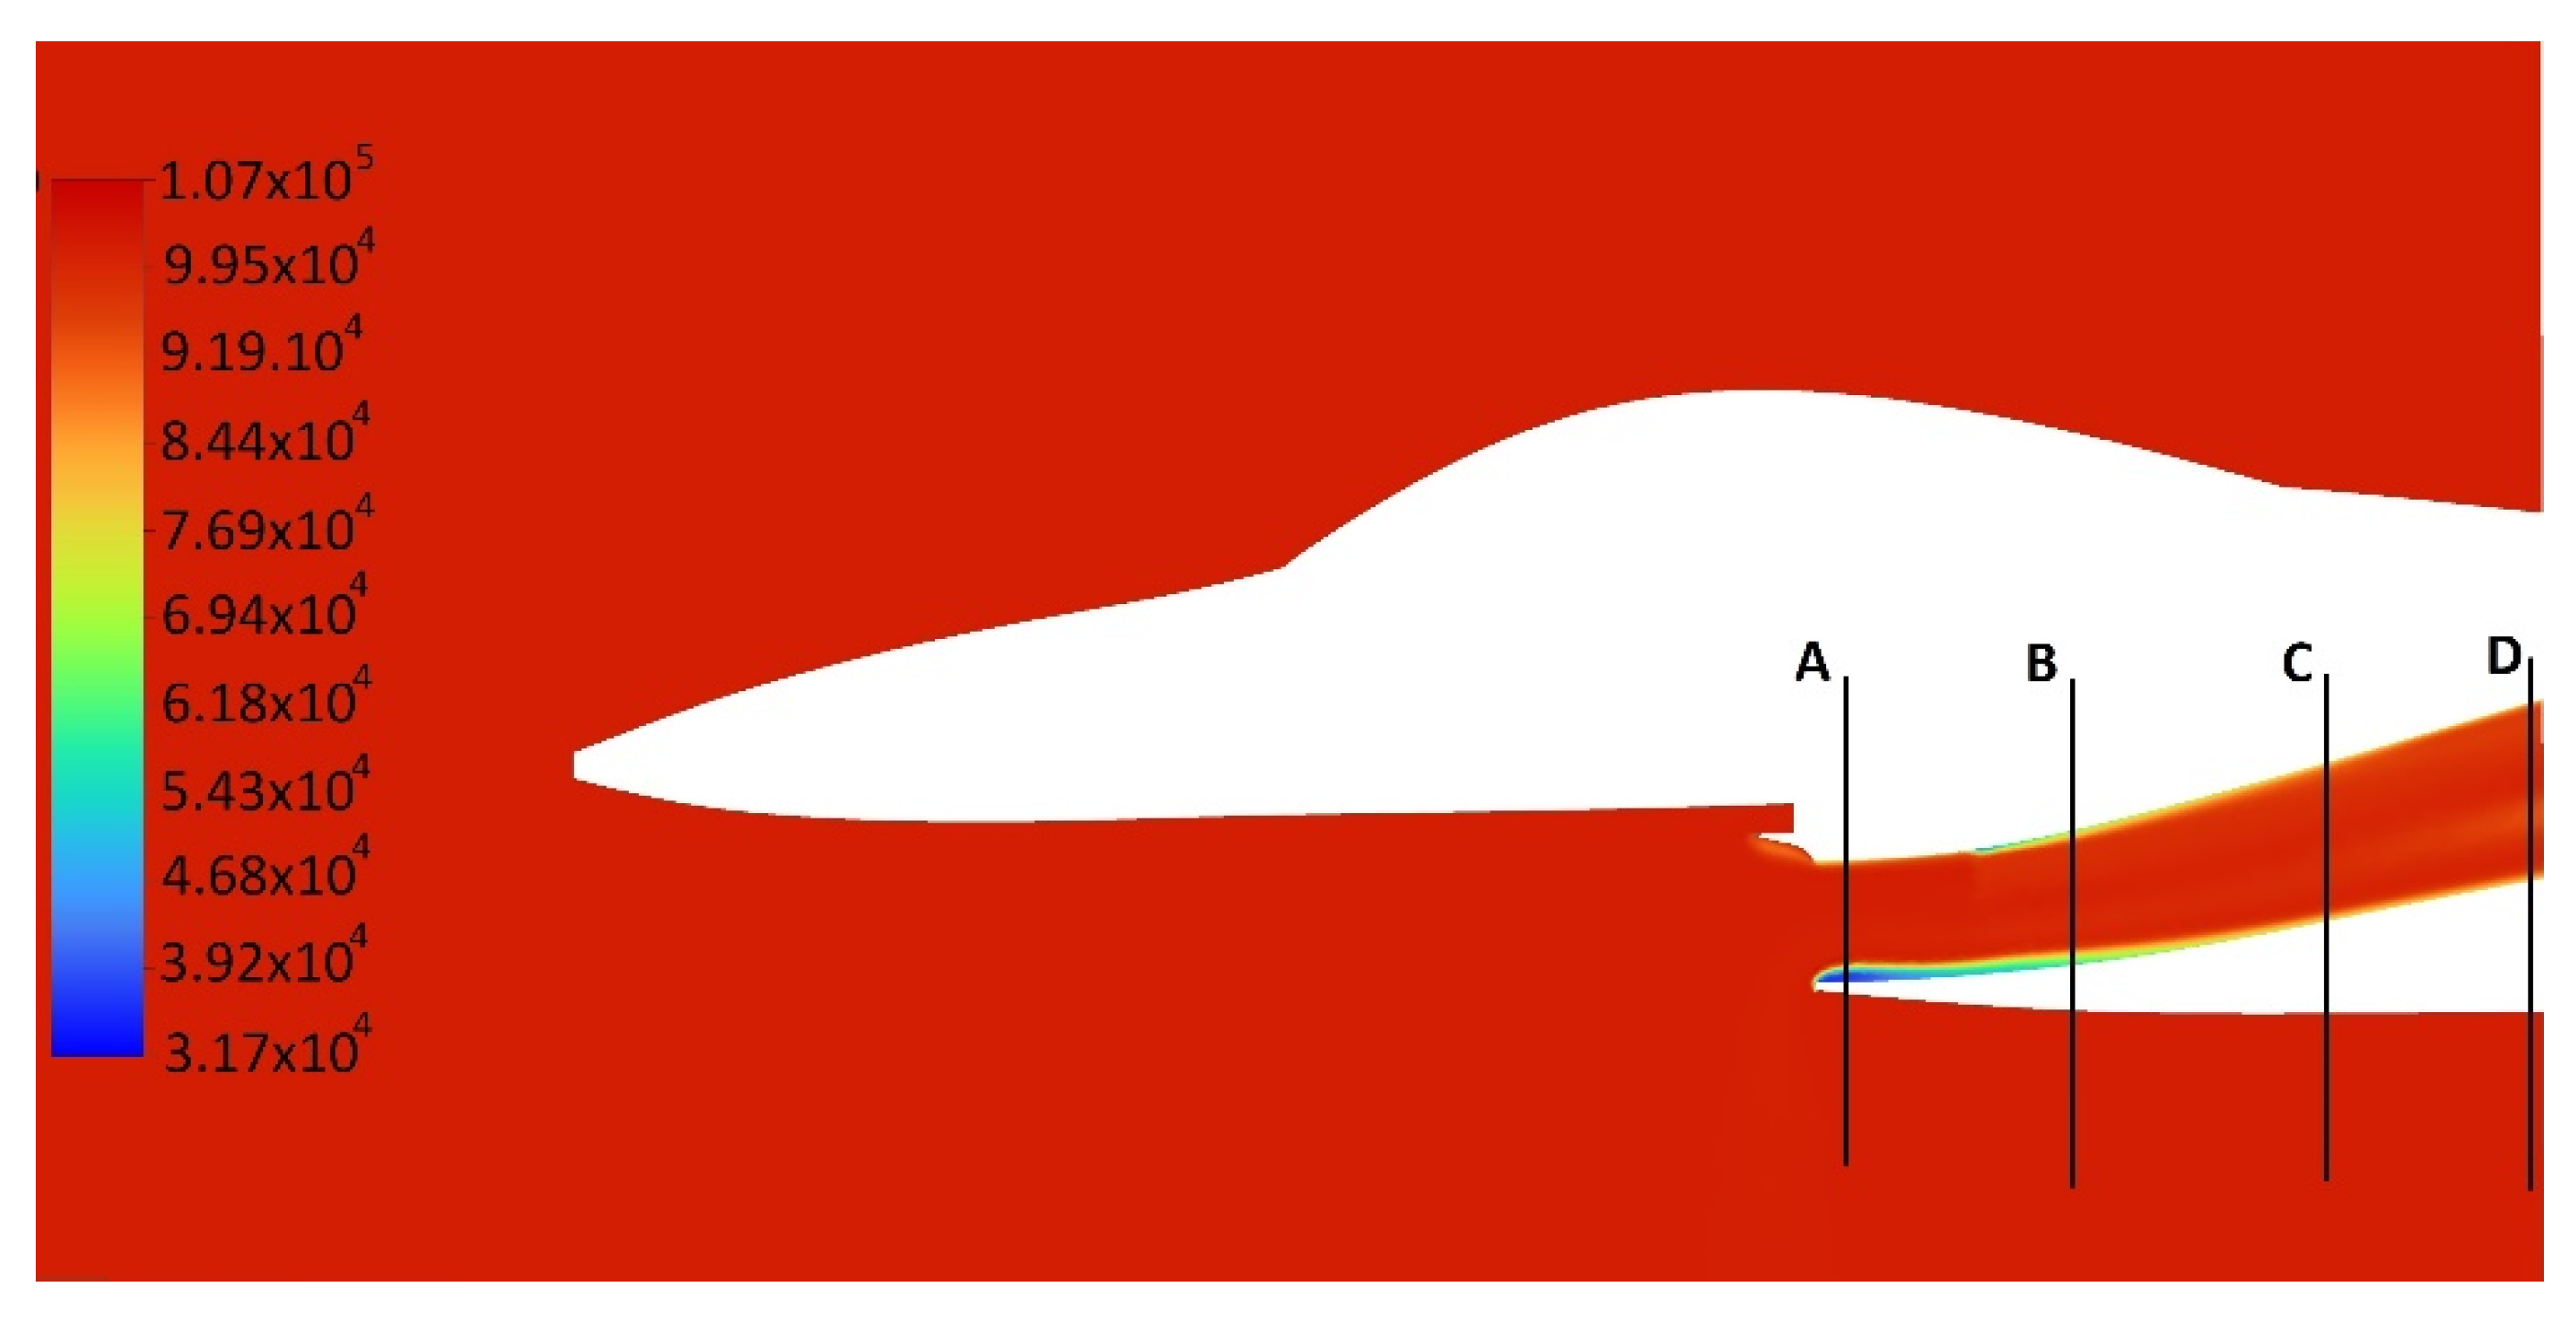
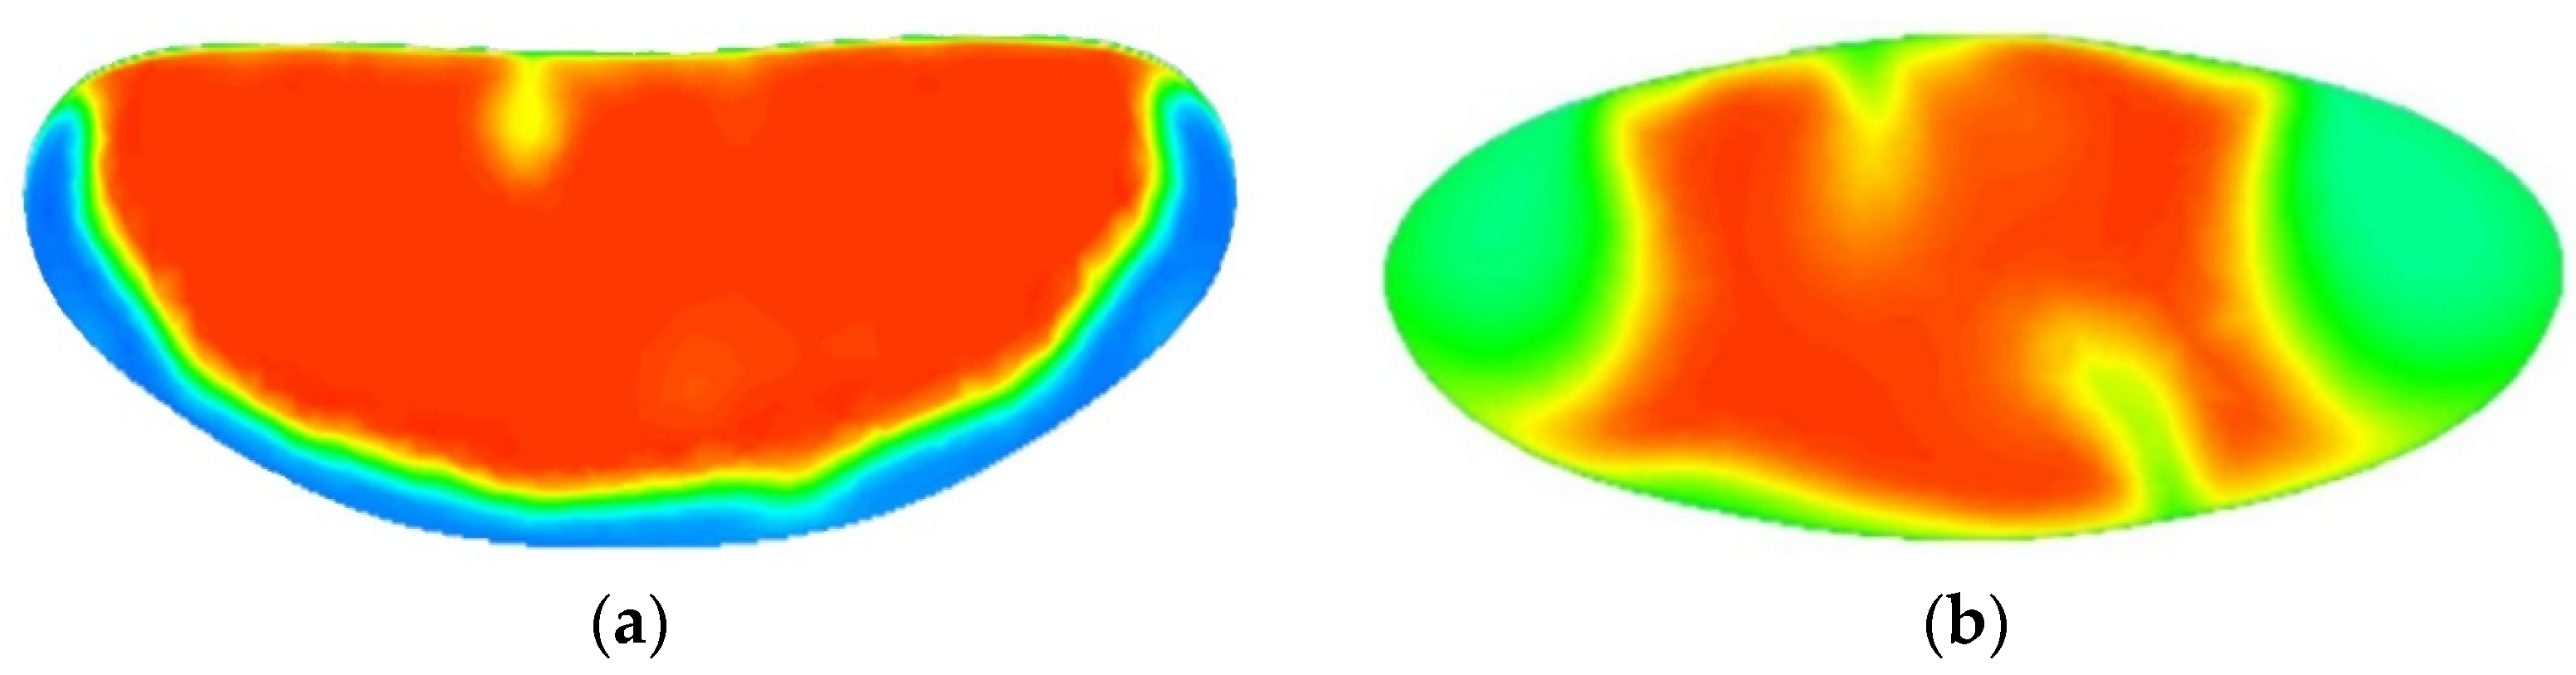
Numerical flow simulations were performed for the 3D case, while the analysis of the obtained results was based on two-dimensional cross sections. An assessment of the flow field in an intake duct, which supplies air to the compressor in the longitudinal plane of the jet engine (Figure 12), does not provide a full picture of the processes that occur throughout the entire volume of the intake duct. This analysis was two-dimensional and shows that low-pressure zones are present in the inlet section within the boundary layer. This was confirmed by the results that show the total-pressure distribution in the cross section in Figure 13a. The color scale in Figure 13 and other figures maps the pressure scale shown in Figure 12.
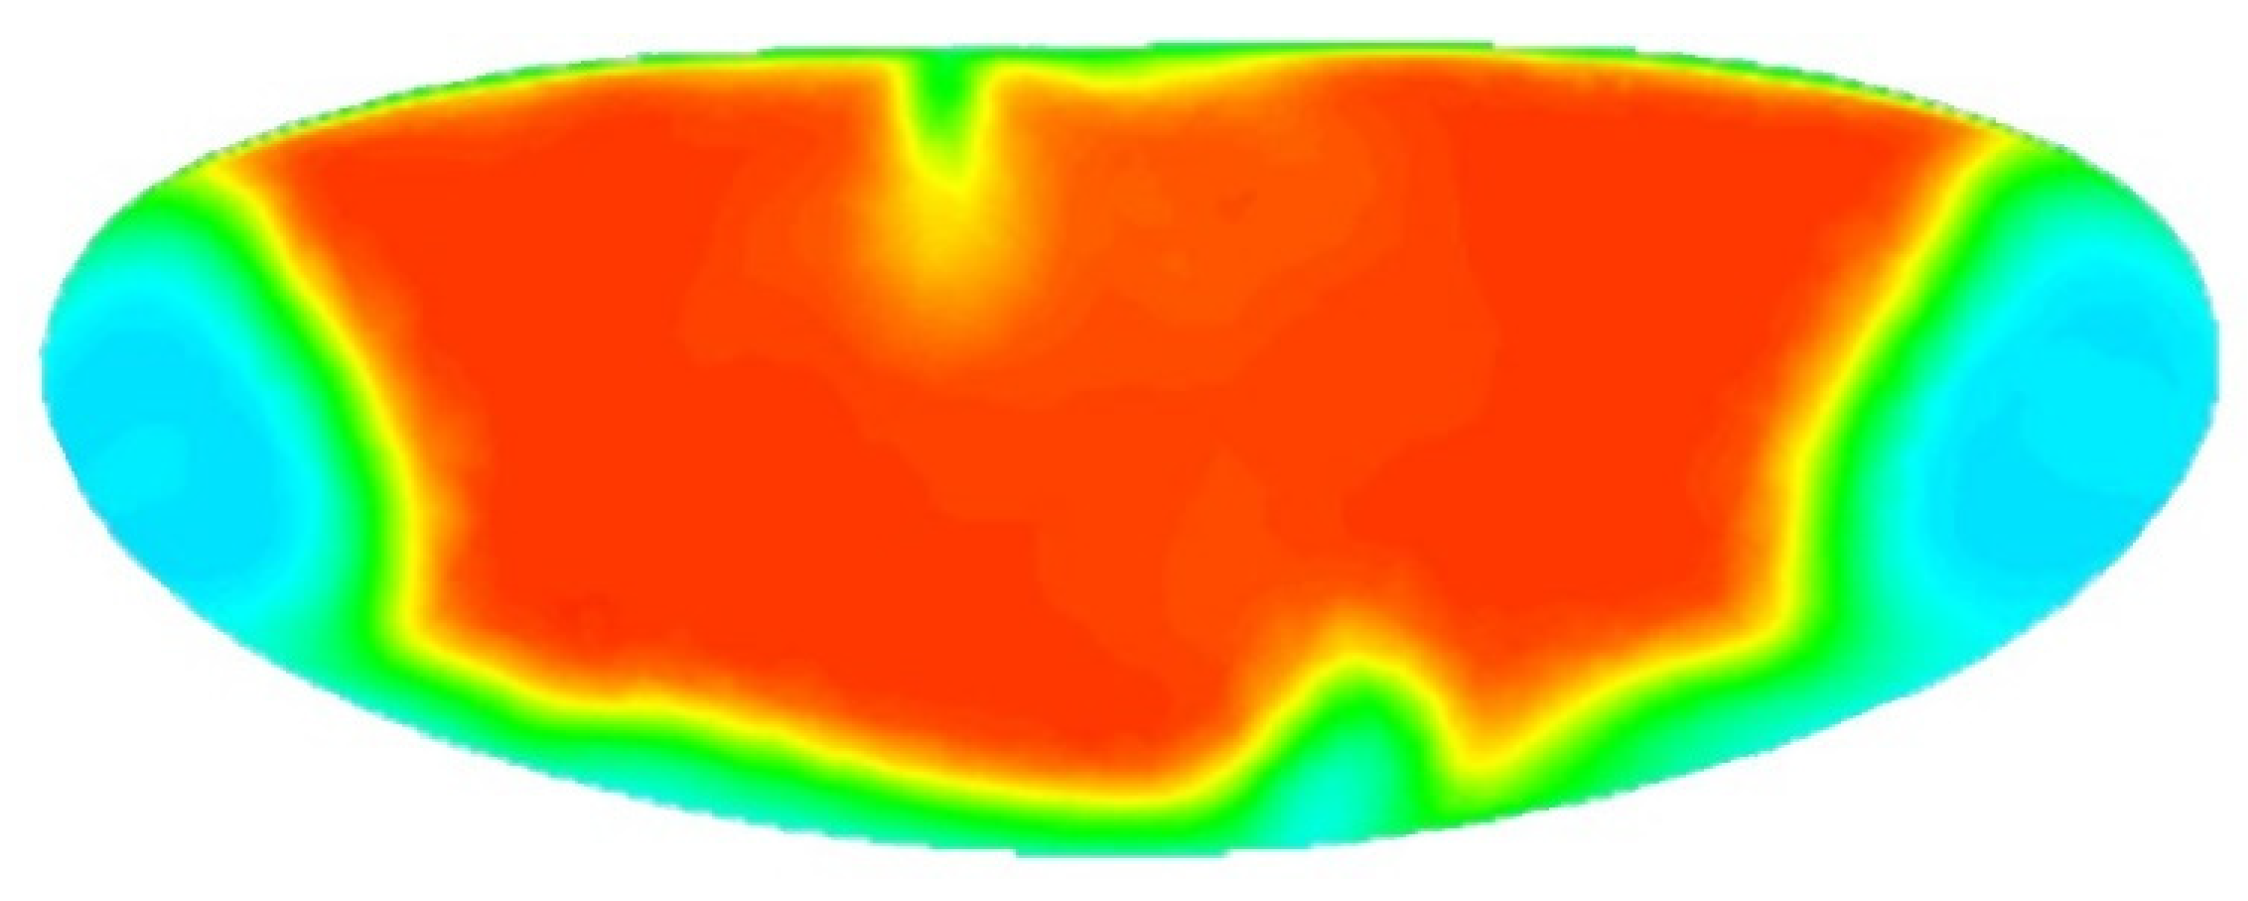
An estimation of the parameters in a cross-sectional square to the intake-duct axis, and based on the distribution of the pressure parameters in the longitudinal section (Figure 12), is only possible up to the initial part of the intake duct, which is due to a certain regularity in the distribution of the parameters in the cross section (Figure 13a). For the final section of the intake duct, the outputs from the longitudinal section (Figure 12) can be encumbered with large errors (Figure 13b) in attempts to predict the total-pressure distribution. An initial irregularity in the distribution of the parameters was present at 0.5 m (Figure 14) from the inlet cross section A (Figure 13a).
To eliminate the problems indicated above, a 3D numerical analysis was performed for a flow along the intake duct of the turbojet engine. Four cross sections (Figure 12) were qualified for further investigation to permit an assessment of the changes in the basic intake parameter, which was the total pressure along the intake duct. The cross sections selected were cross section A of the air inlet (4.5 m from the fuselage nose), cross section D, which connects the intake to the turbojet engine 6.0 m from the fuselage nose, and two intermediate cross sections (B and C, 5.0 m and 5.5 m, respectively, from the fuselage nose).
To analyze the distribution of the pressure fields (Figure 13), five main pressure intervals were defined. The pressure intervals are referred to as “series” in this paper. The tests were performed at a variable outlet pressure. For a pressure of 65 kPa at the intake-system outlet, which was the turbojet fan inlet, pressure intervals were assumed for each series, as listed in Table 1.
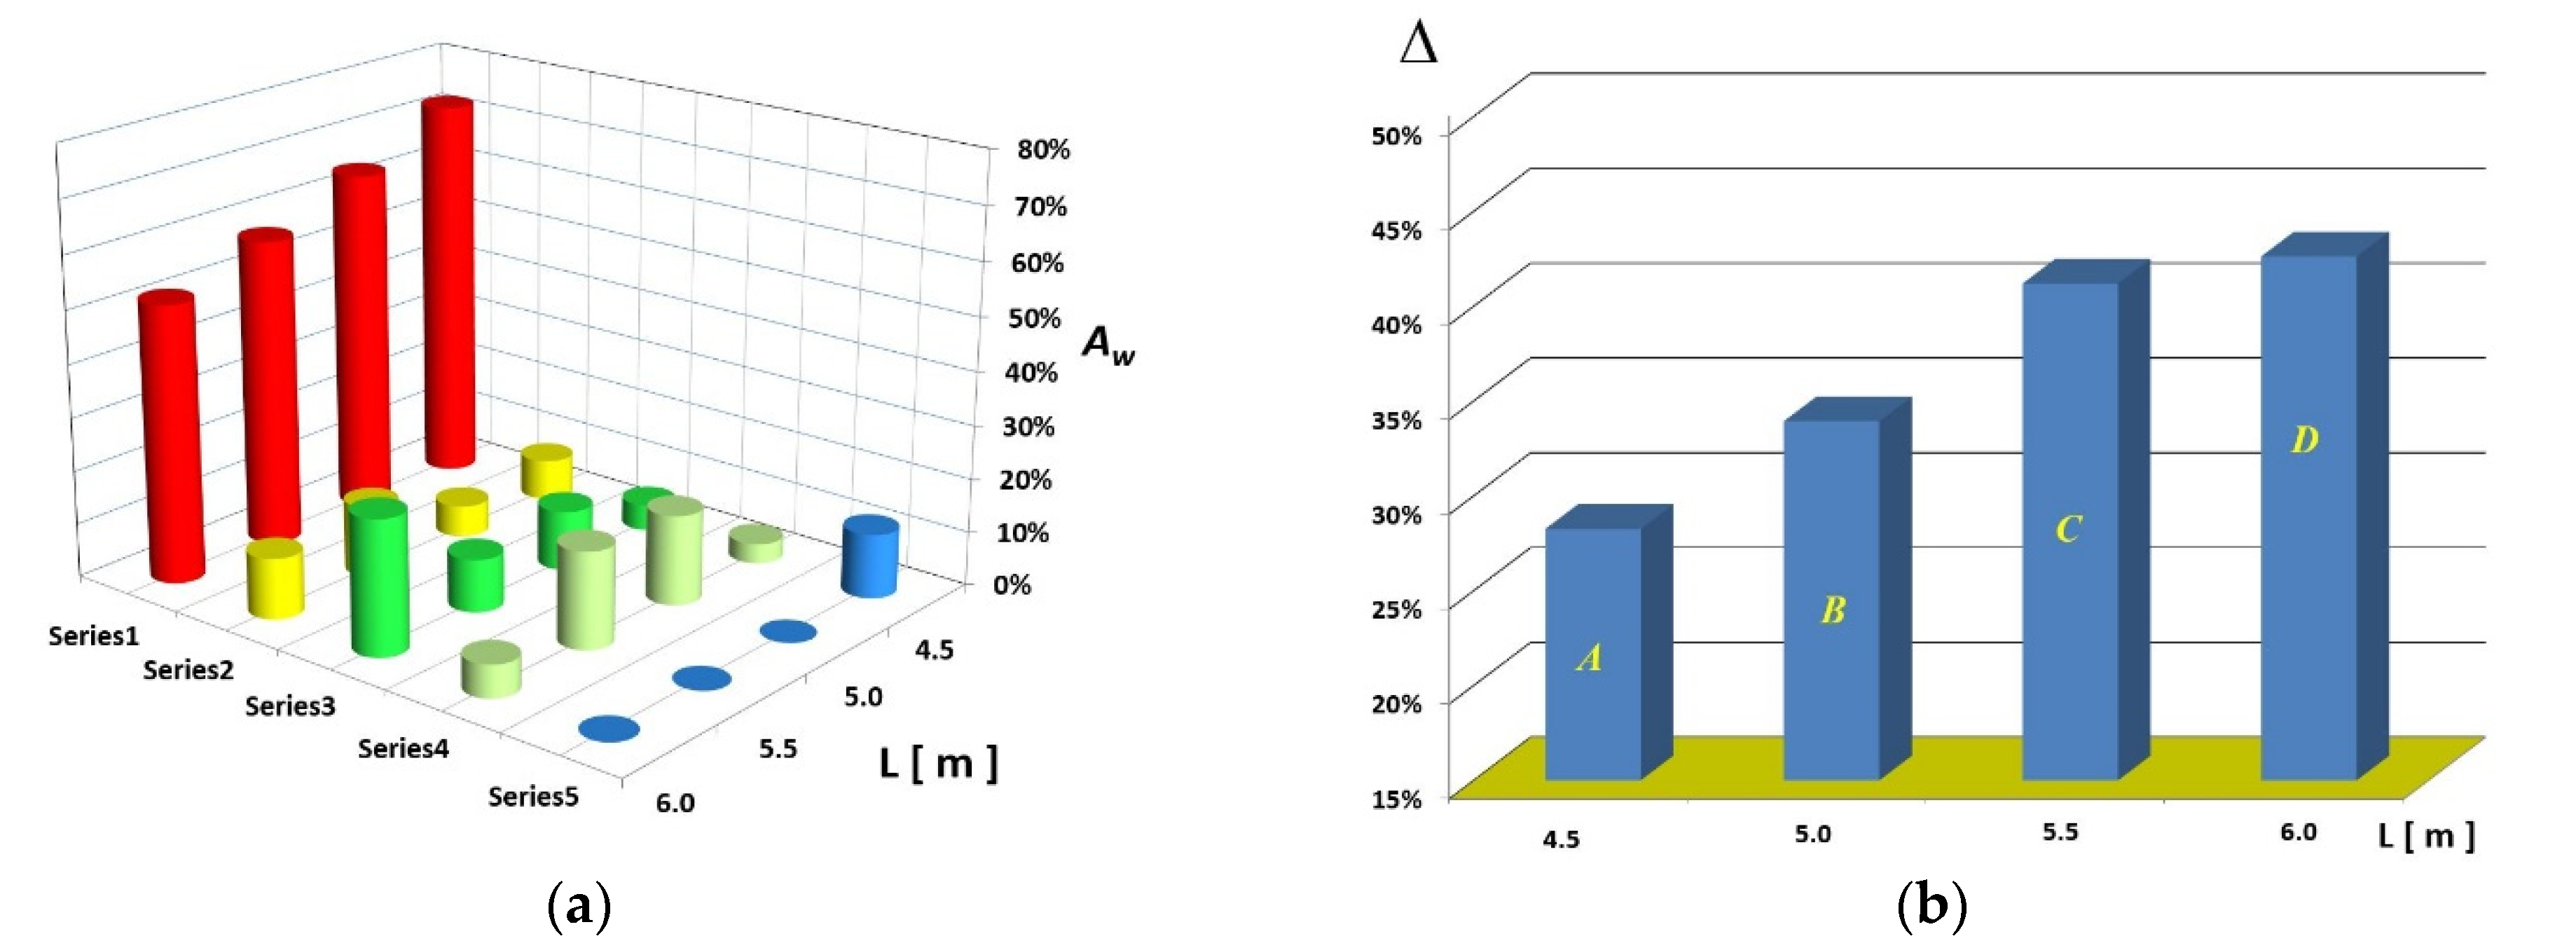
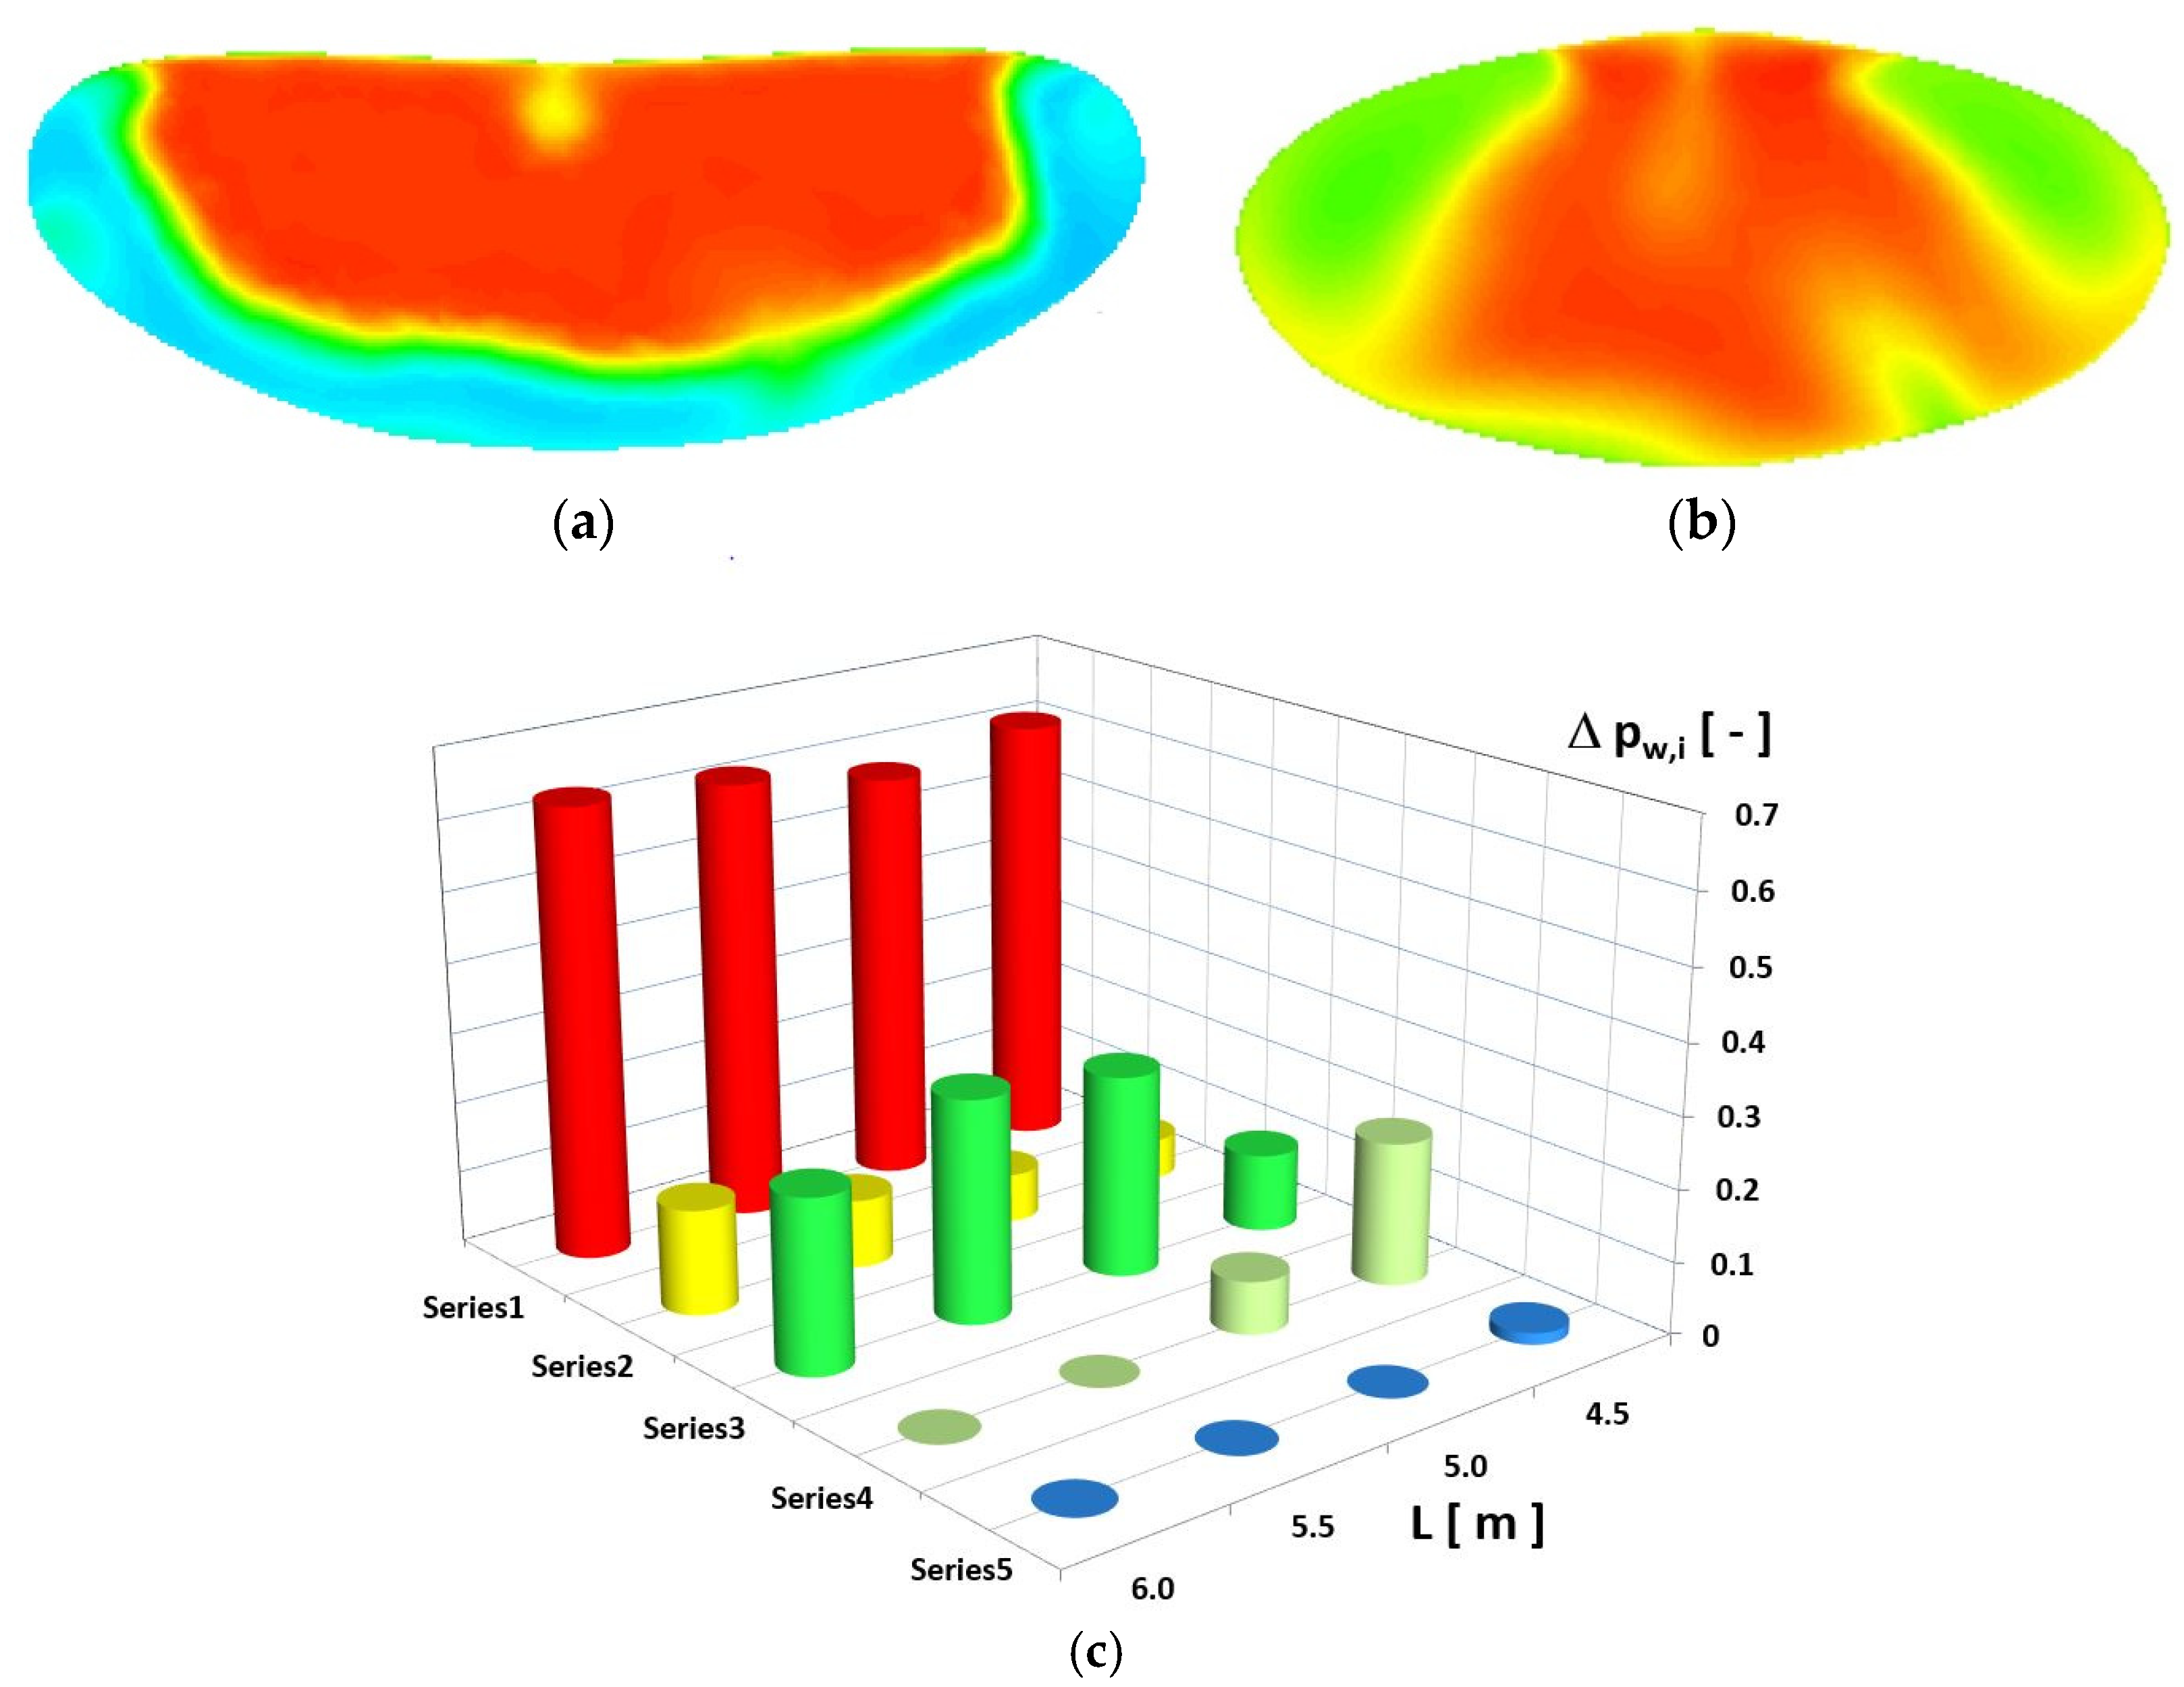
Figure 15a shows the changes in the distribution of the pressure fields along the flow duct, produced in the air flow through the intake system at 65 kPa. Here, the pressure area grew outside of the main pressure zone vs. the duct length from 28.26% to 42.63% (Figure 15b), with the main pressure zone defined as the pressure values relevant to the zone designated Series 1 (Table 1).
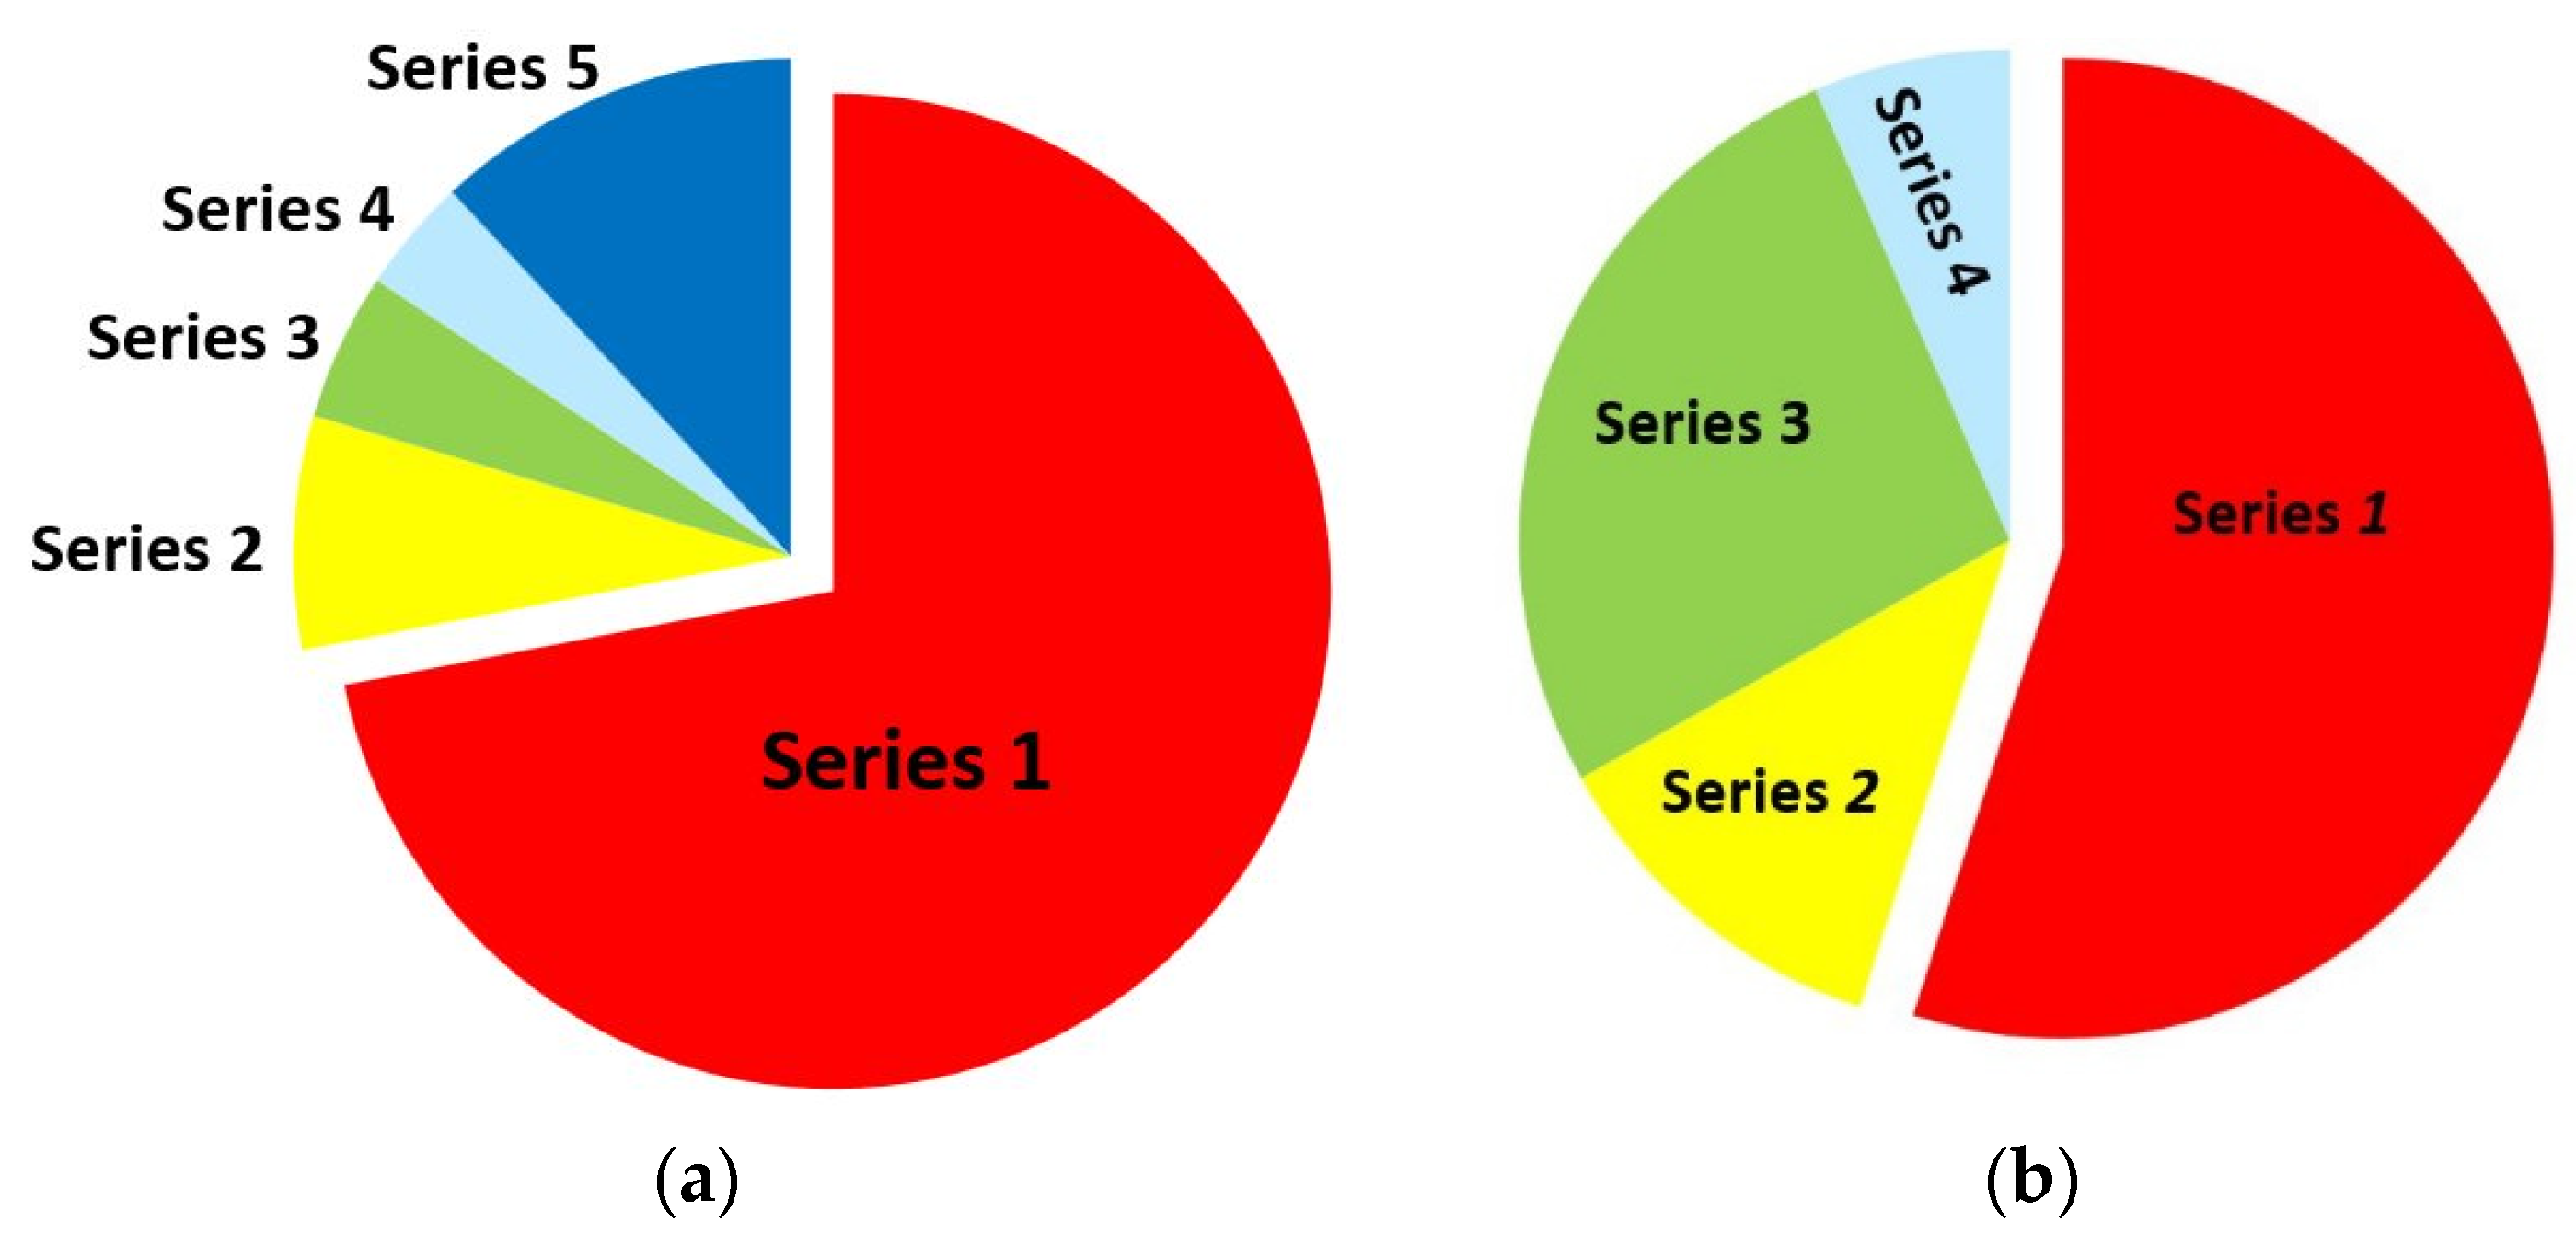
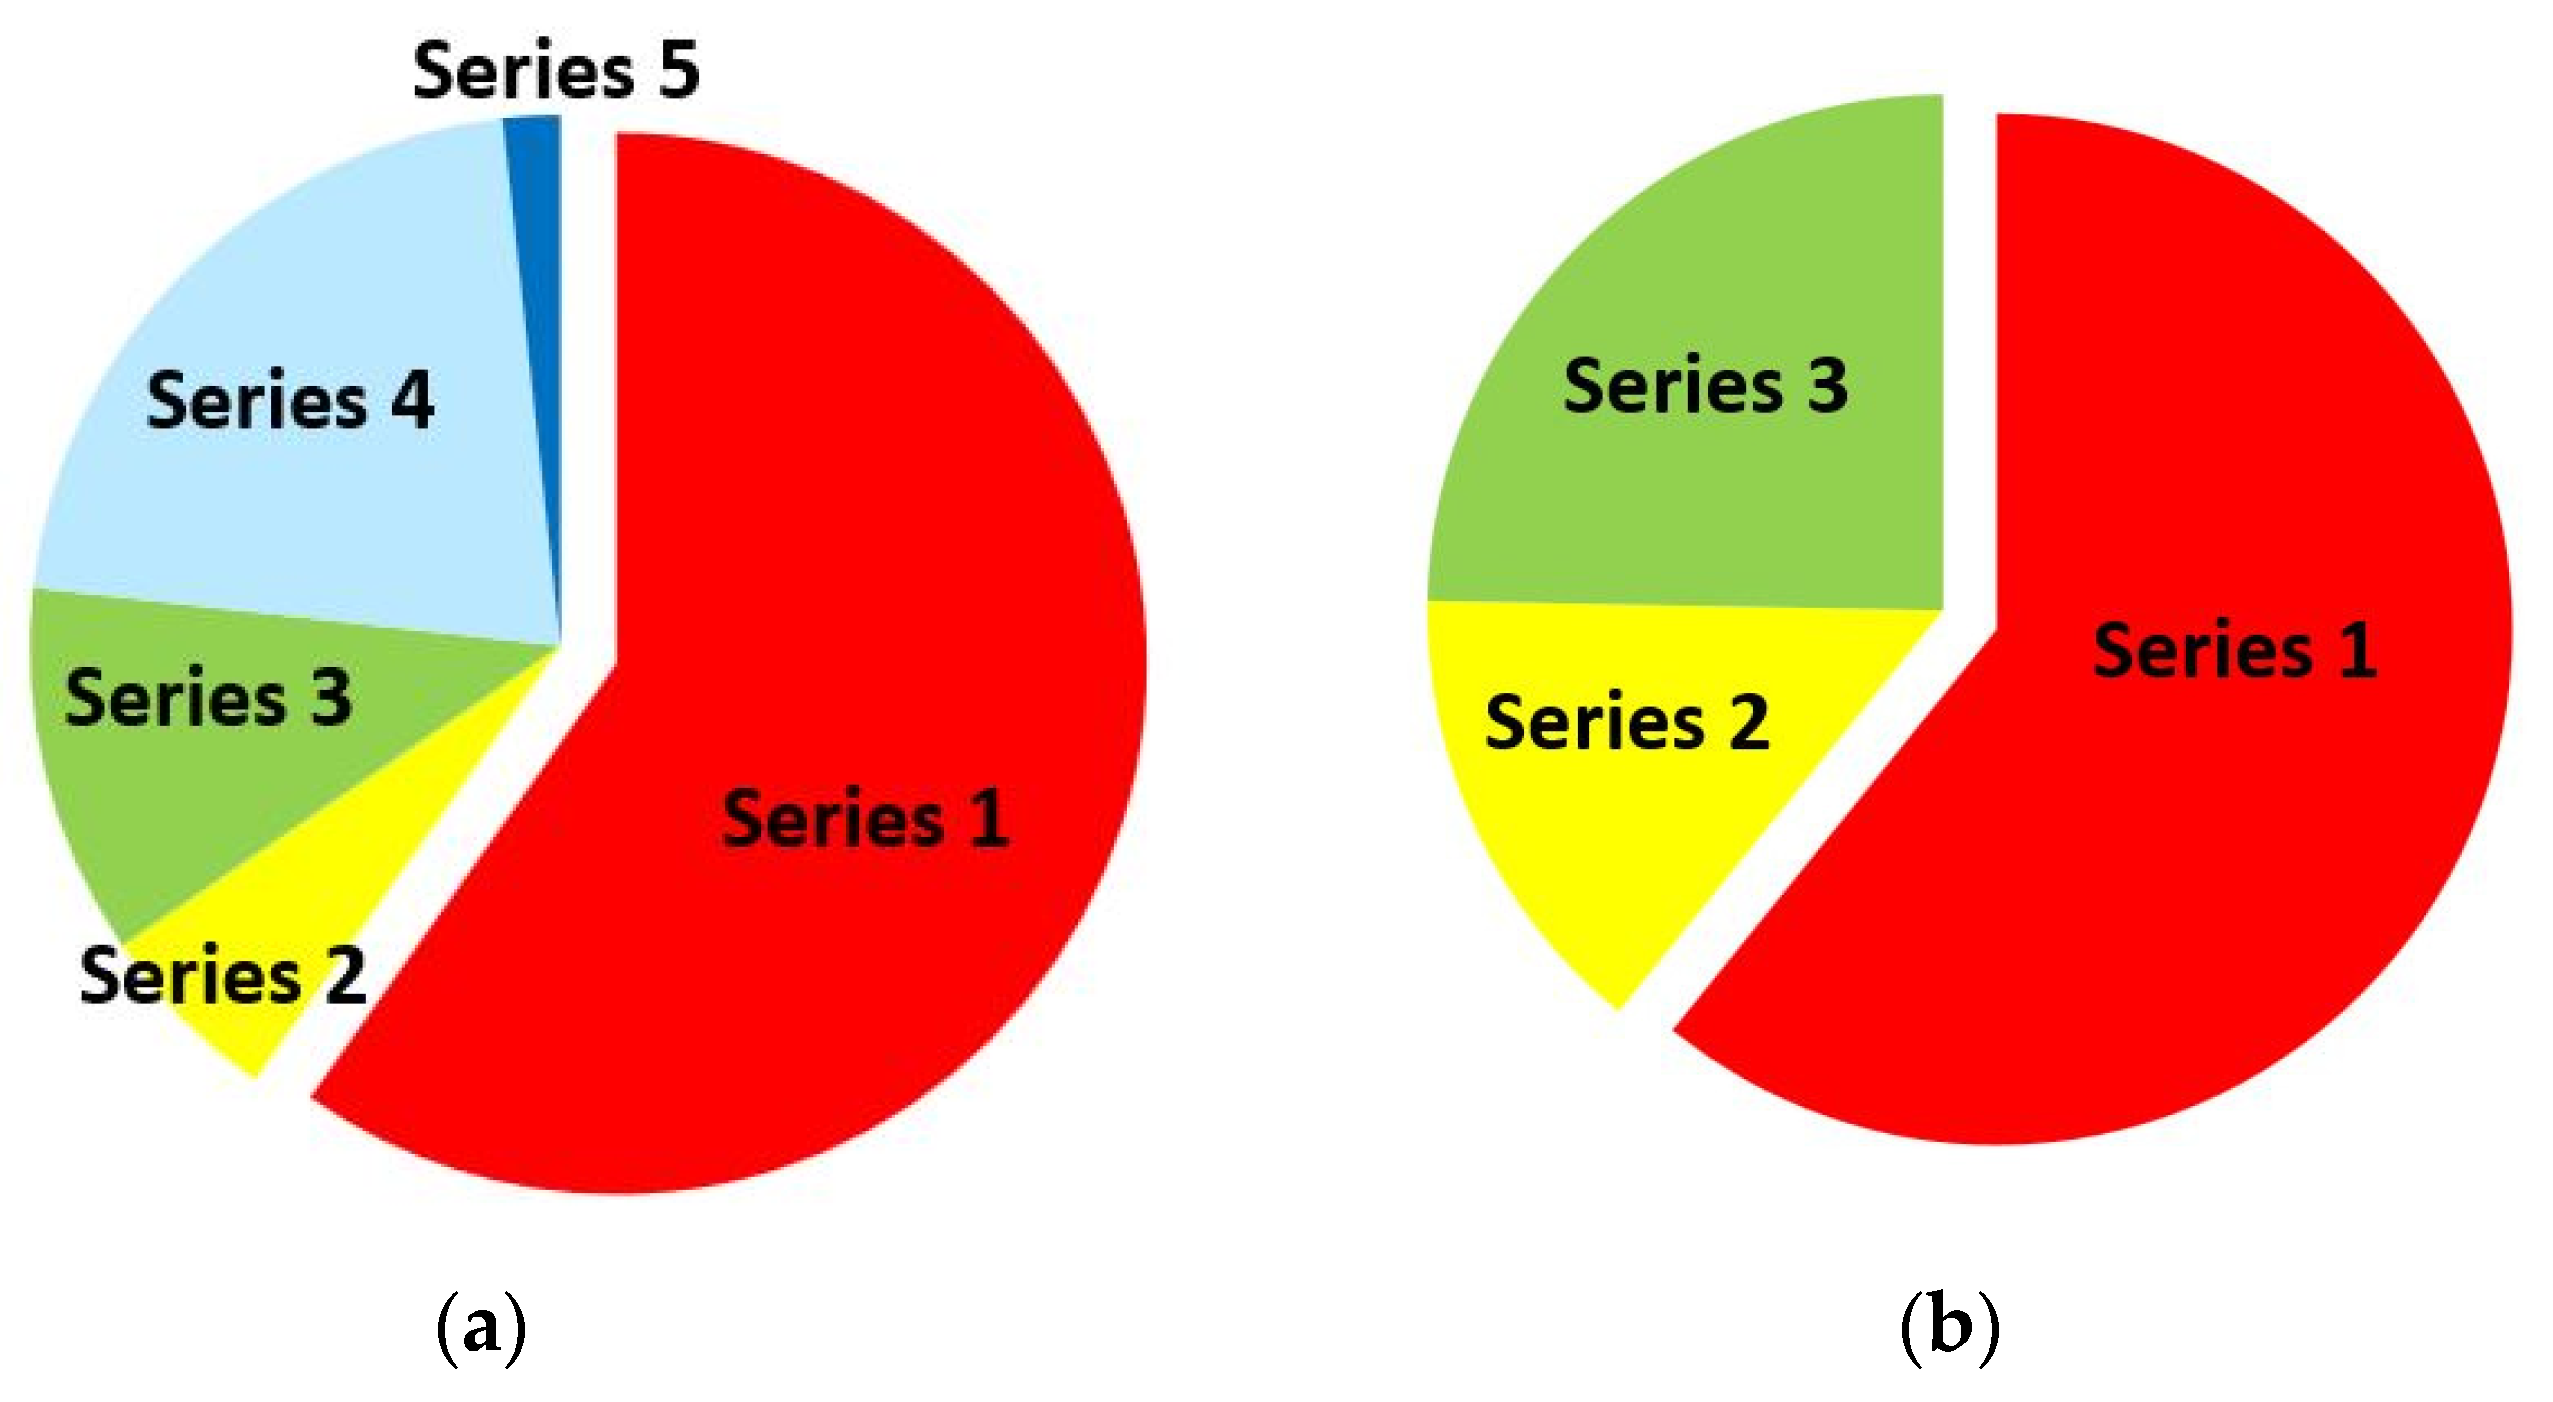
The quantitative change in the distribution in each of the pressure zones is illustrated with the pie charts in Figure 16. There was a noticeable reduction in the main pressure-zone area (Series 1) from 72.58% to 51.99% (Figure 16). The relatively considerable zone of lowest pressure, Series 5, disappeared (Figure 15a and Figure 16a) after occupying 12.03% in the first part of the intake. The Series 3 pressure zone had the highest growth, from 4.85% to 25.17% (Figure 15 and Figure 16). The surface-area shape changed from a system that could be deemed a regular one (Figure 13a) into a rather irregular one (Figure 13b).
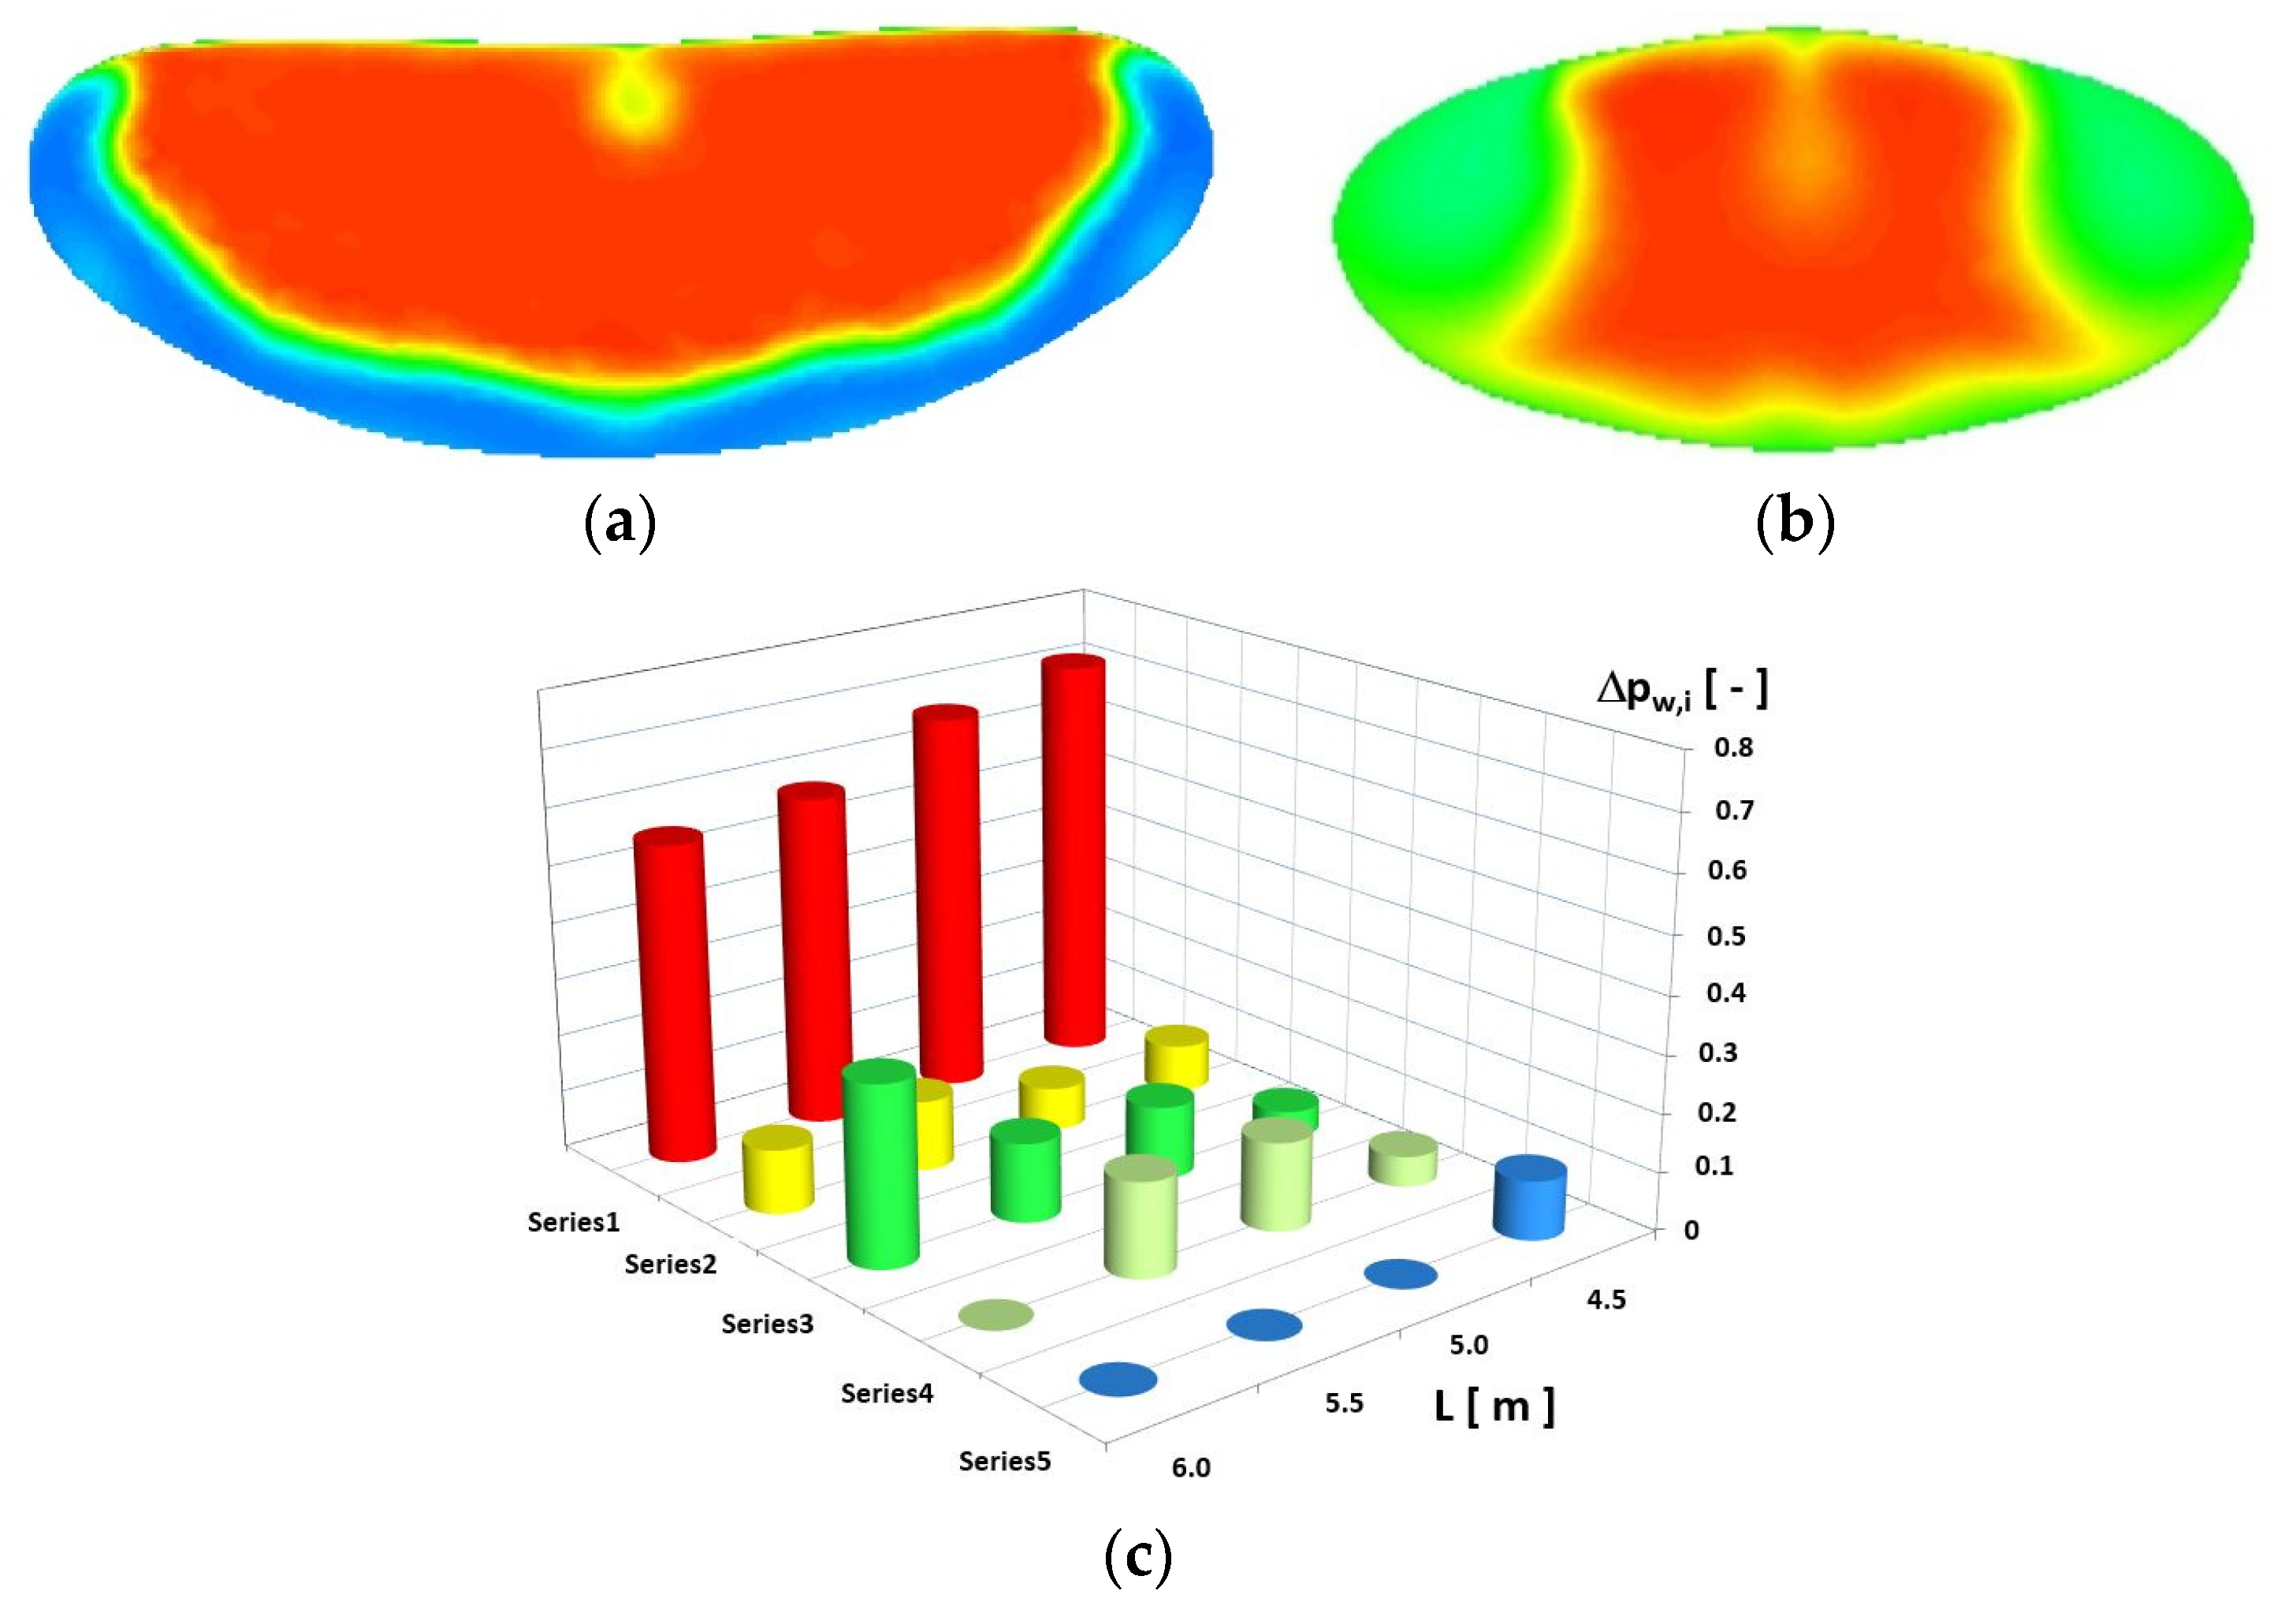
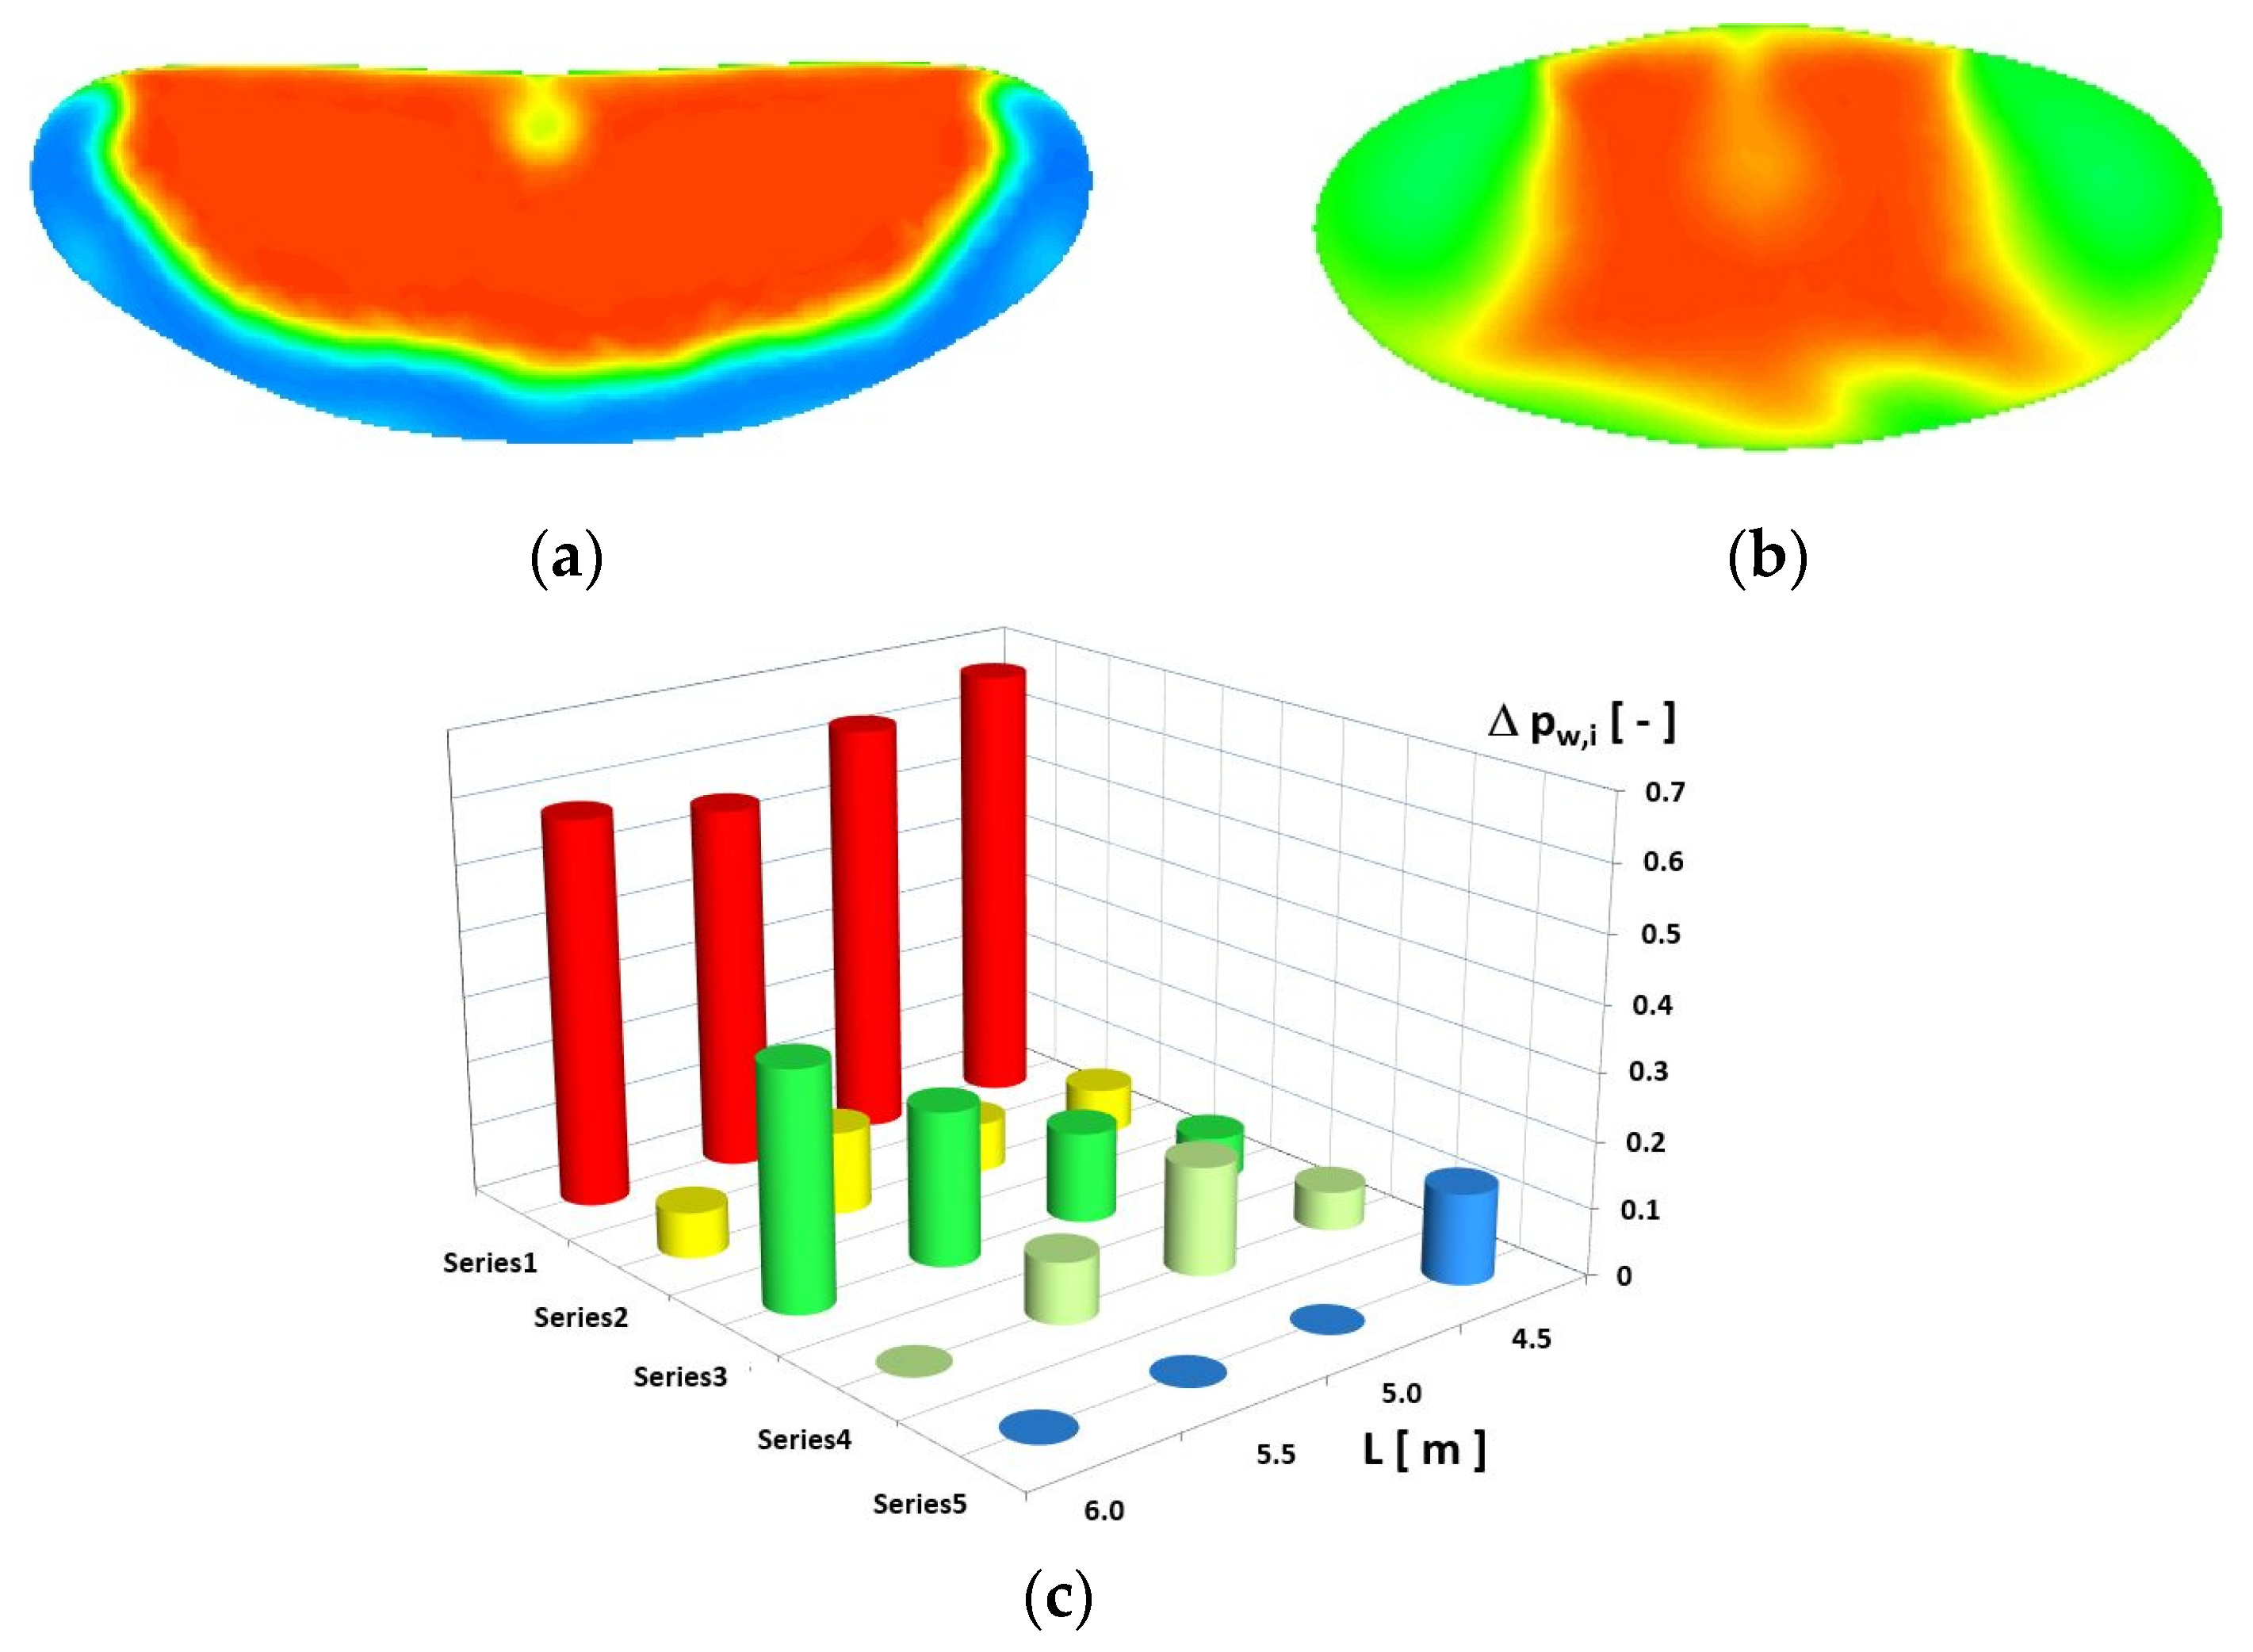
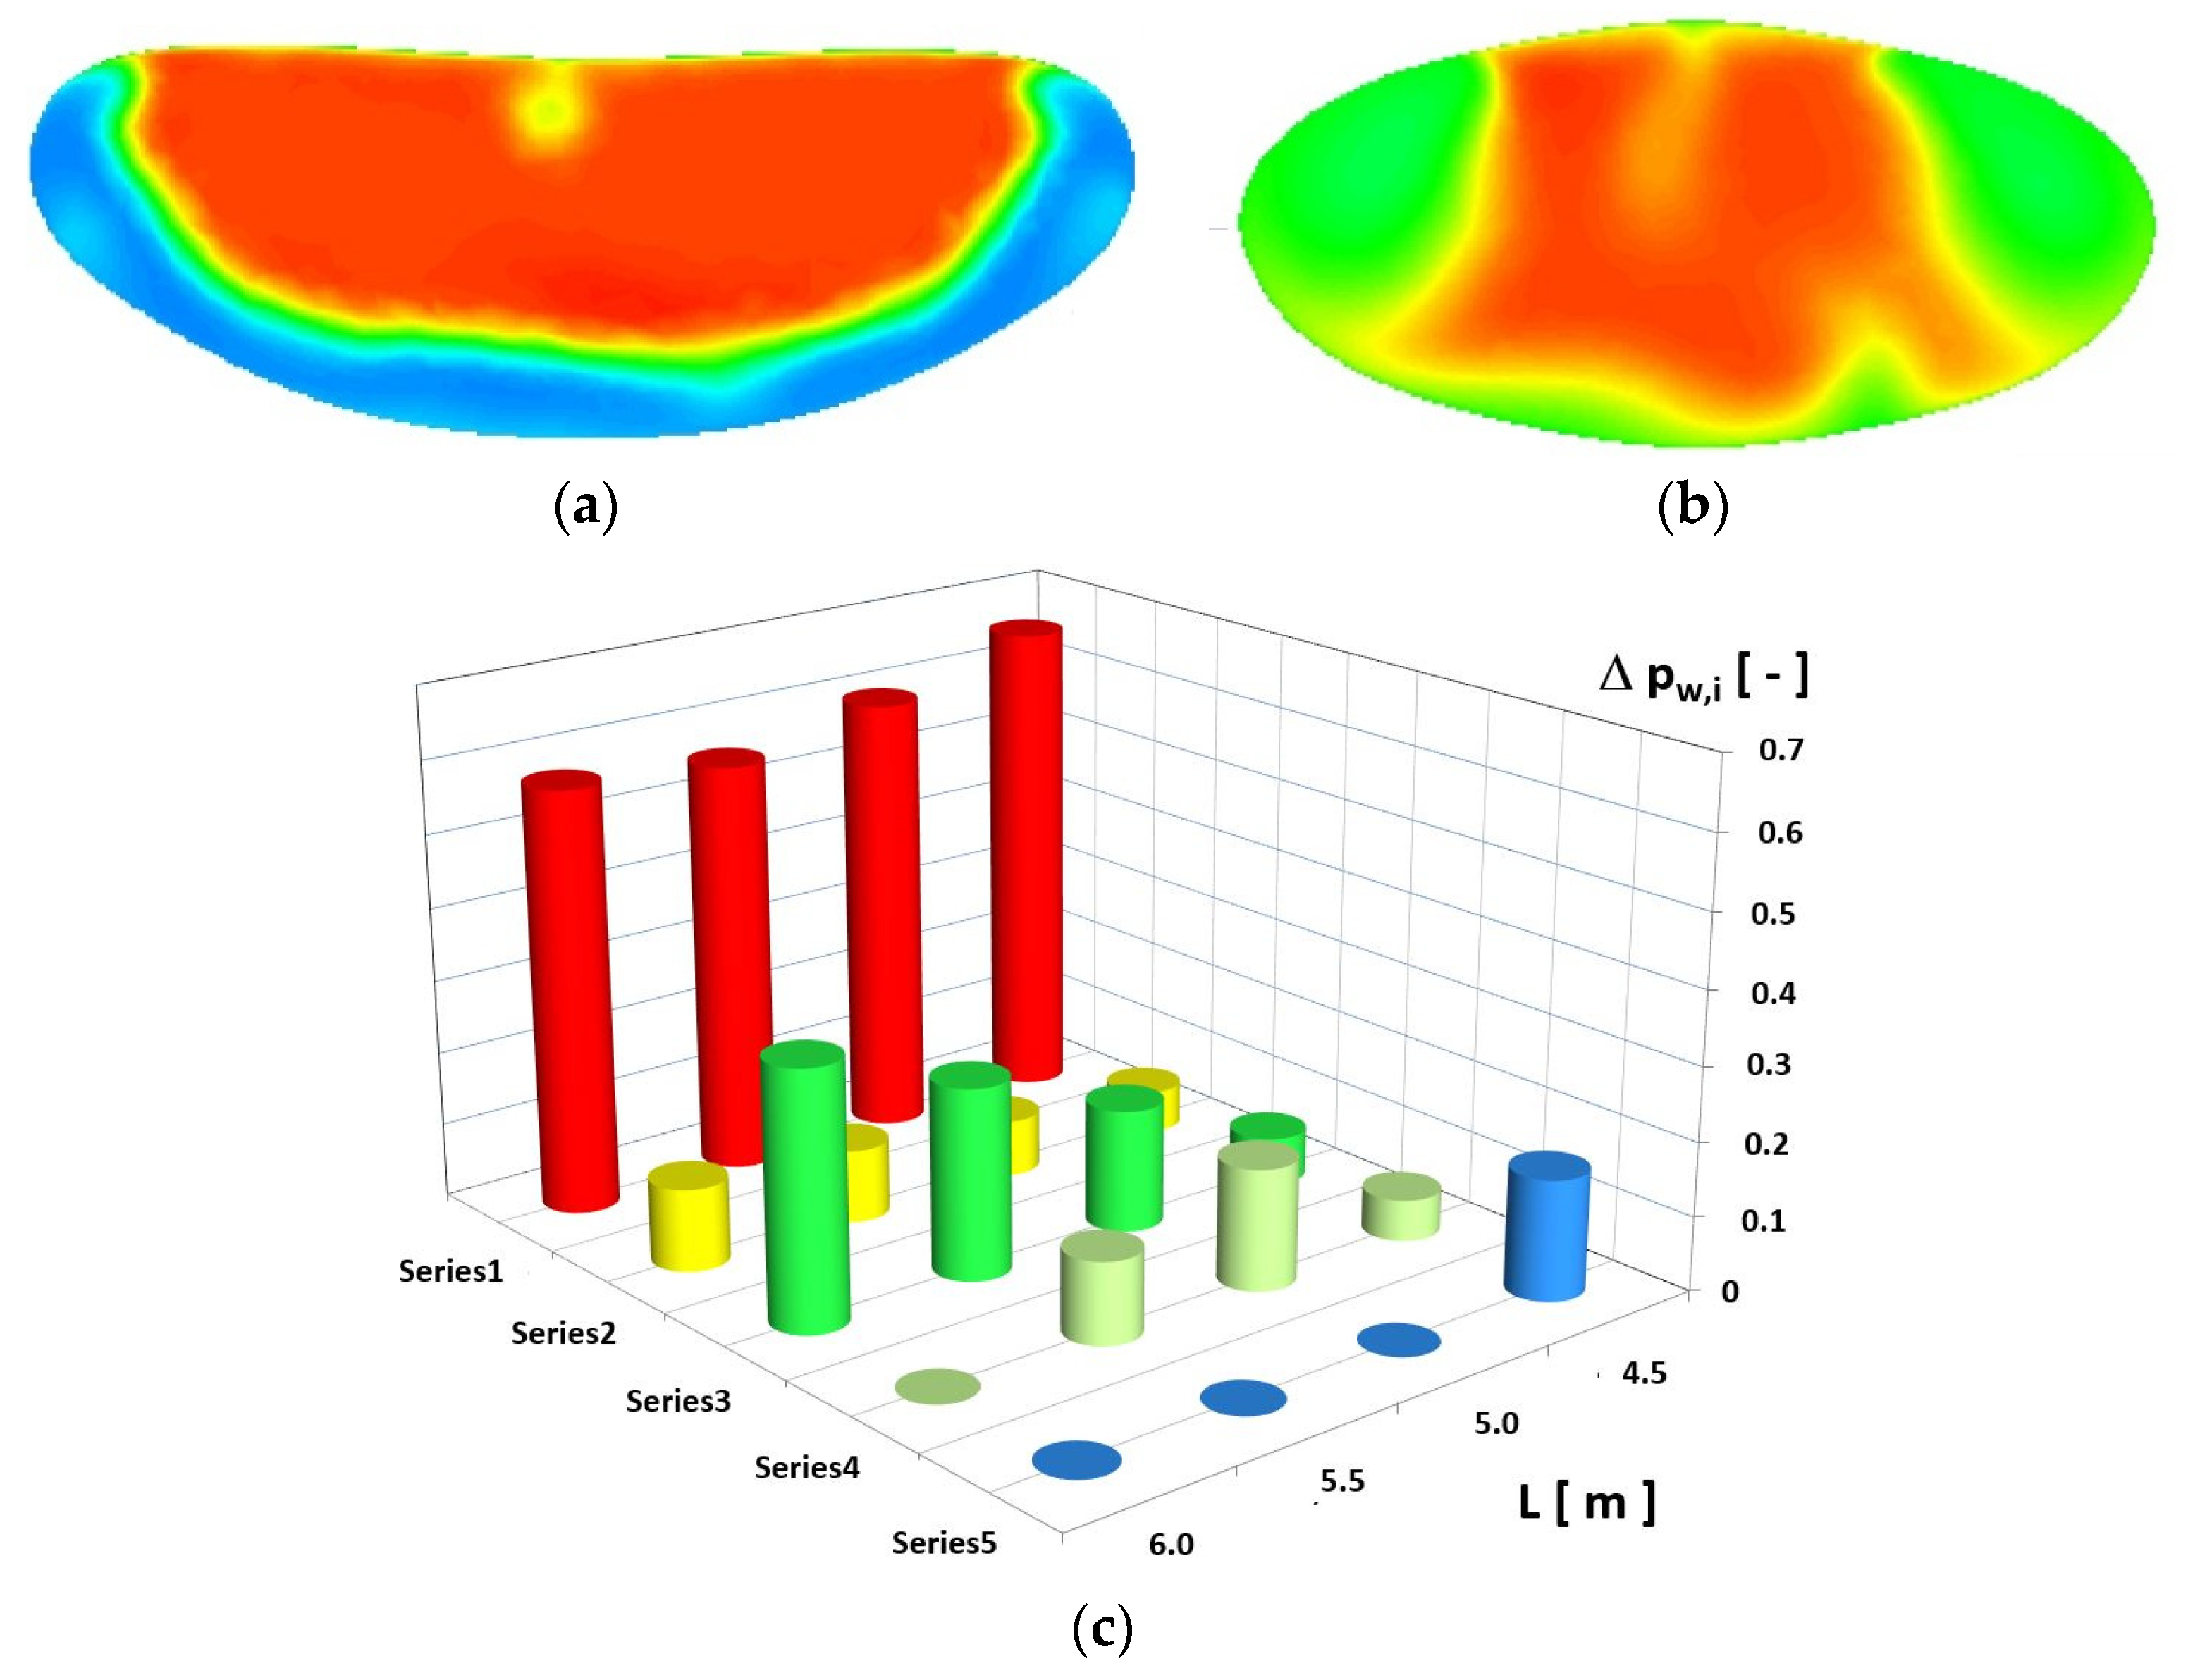
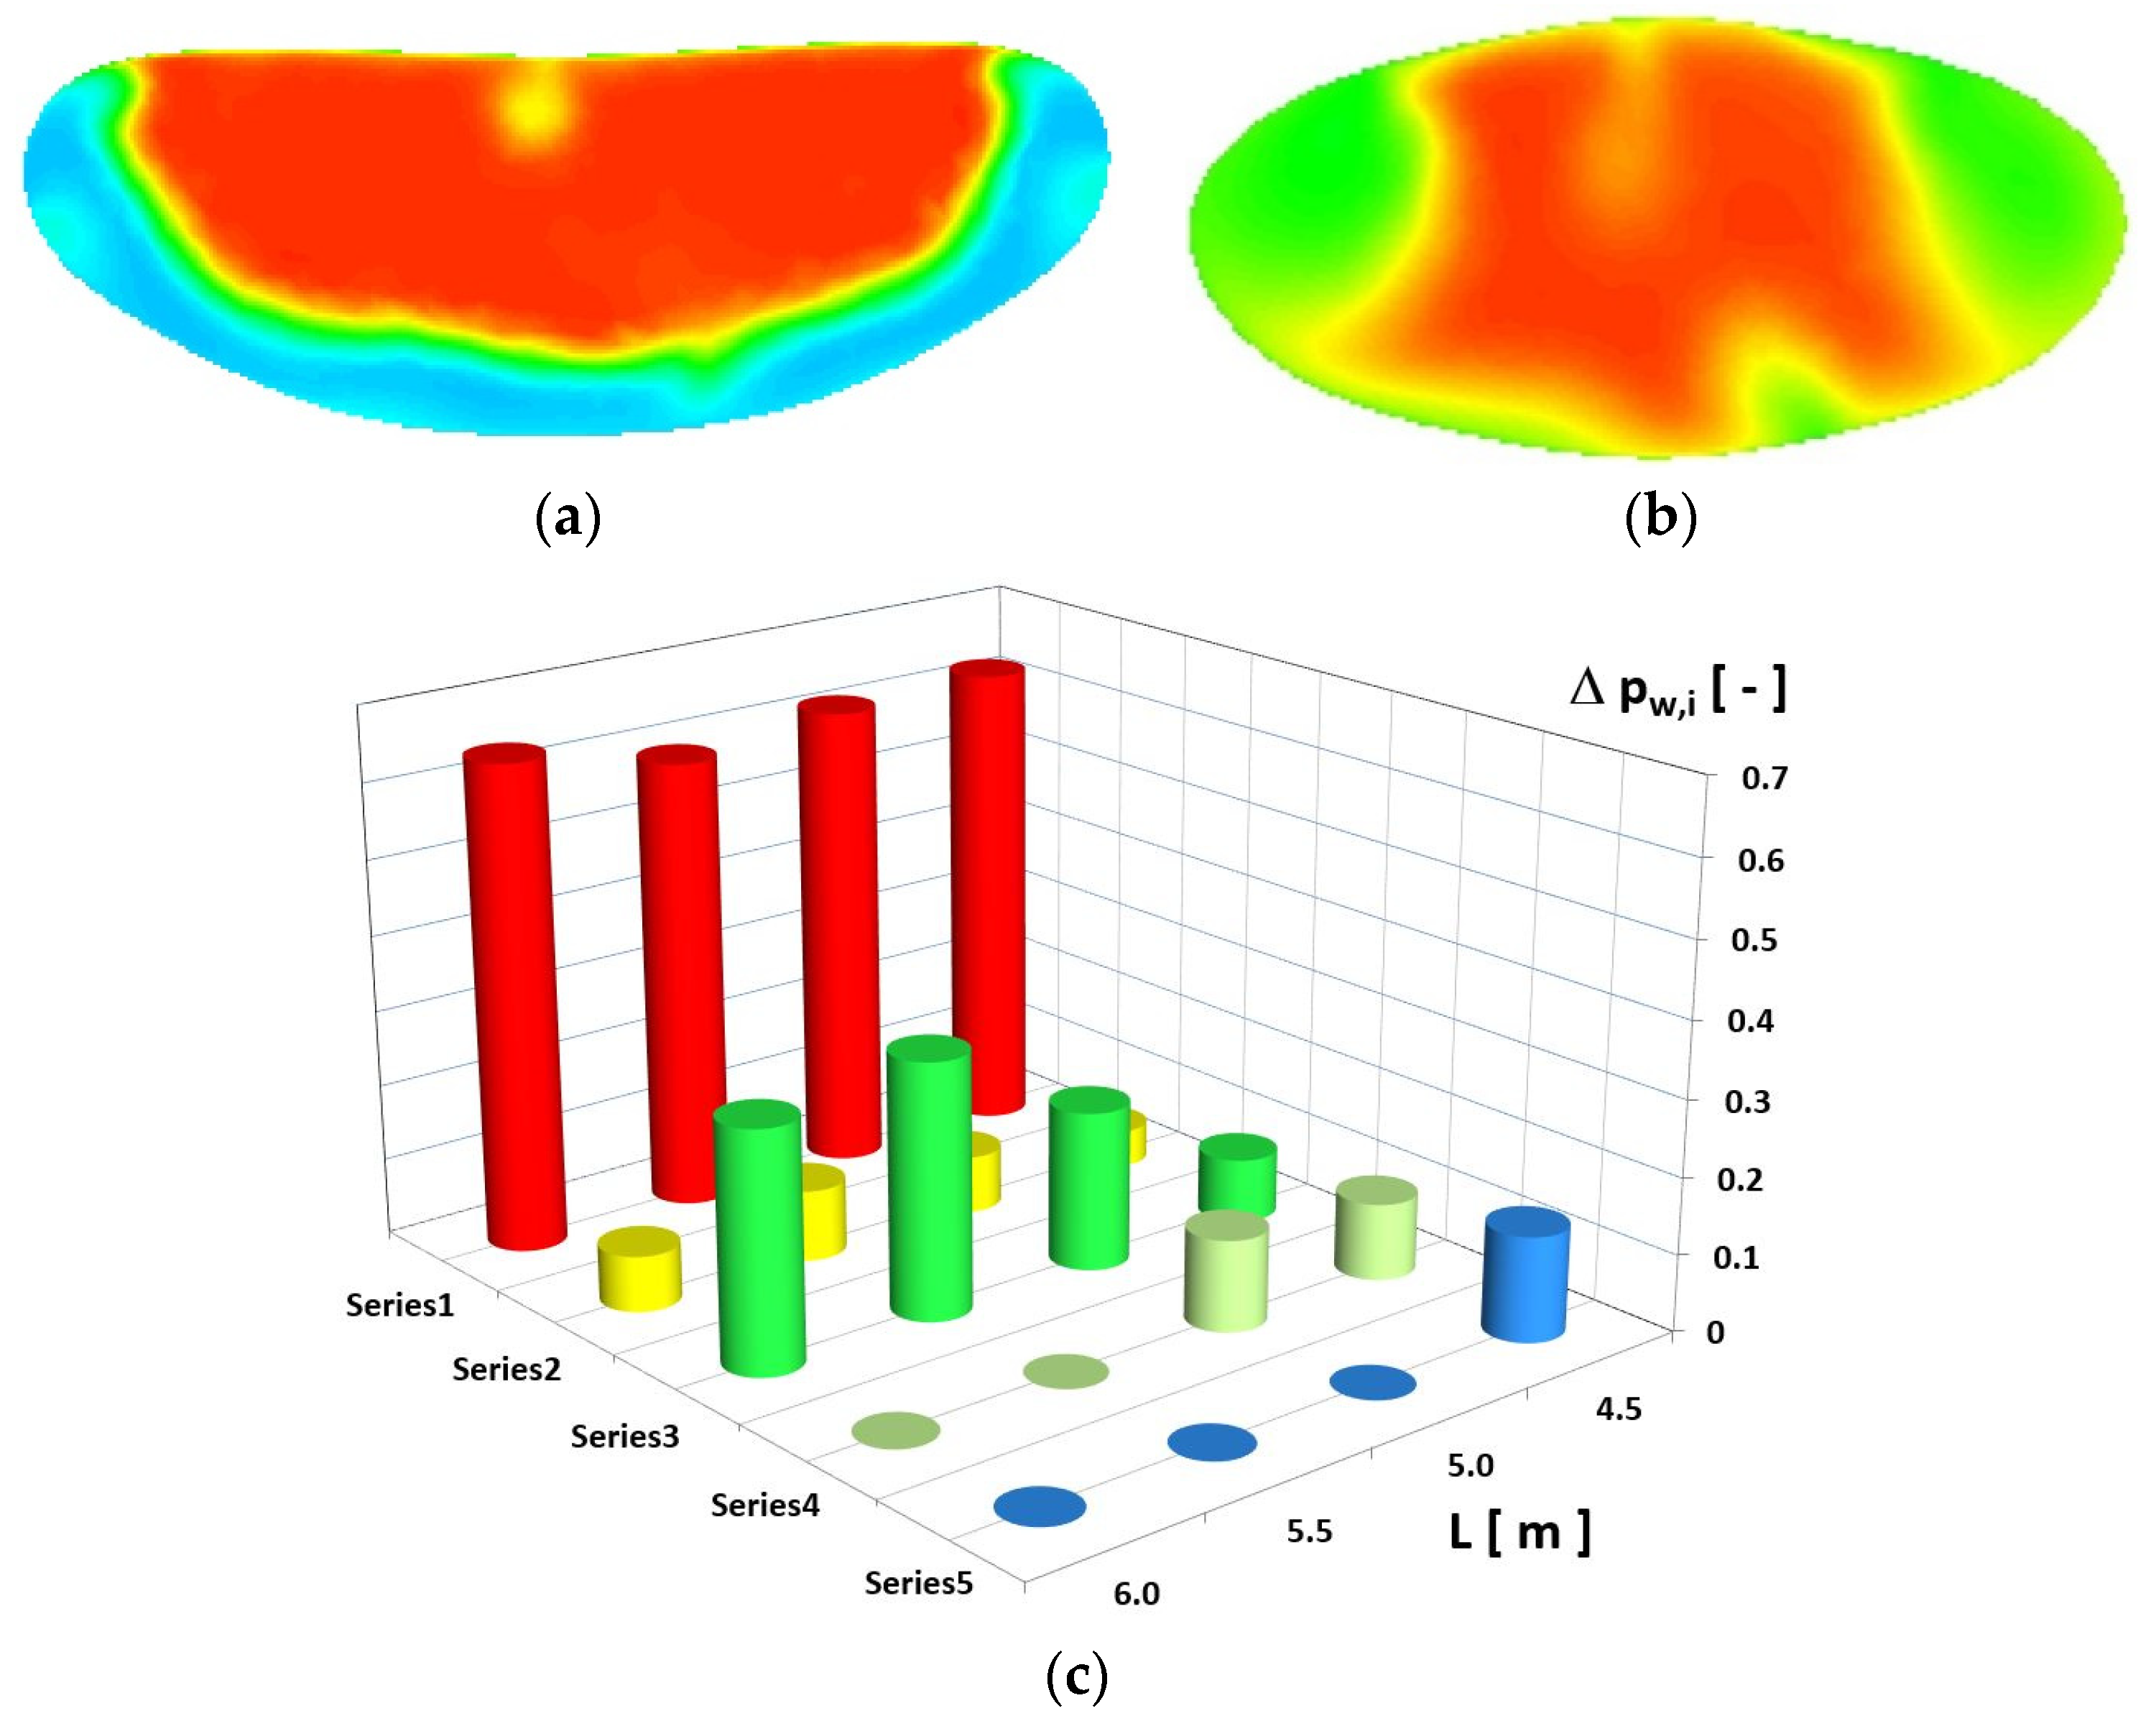
An analysis was carried out for selected operational options for the intake system, where each option was a change in the operating conditions of the turbojet fan. The changes involved throttling the pressure at the intake-system outlet, which could be achieved by changing the setting of the inlet-stator-blade pitch of the fan. This would change the pressure in the AIP cross section. The results of the numerical analyses are shown in Figure 17, Figure 18, Figure 19, Figure 20 and Figure 21, with the throttling-pressure change within a range of . The results shown include the distributions of the total pressure in the cross section of the air-intake-duct inlet (plot lines upper-indexed “a”) and the cross section of the air-intake-duct outlet (“b”), and the analysis of the distribution of the changes in the dimensionless potential-pressure ratio (1) in the flow duct at a specific throttling-pressure value (“c”):
where is the area number; is the number of separated pressure areas; is the average total pressure in the i-th area; is the dimensionless surface area of the i-th area.
The results concerning the performance of the inlet cross section at different throttling-pressure values provided a certain characteristic repeatability in the pressure-distribution zones, even with a partial change in the pressure range or area size. The flow-duct-outlet (final) cross section had an irregular pressure distribution, which changed with the throttling. The changes in the surface area in specific series of the individual cross sections are shown as plots in Figure 17, Figure 18, Figure 19, Figure 20 and Figure 21, Part (c). The disappearance of the lowest-pressure zones was evident. This applied to Series 4 and 5, at the fuselage-boundary area, and it was a function of the cross-section location inside of the fuselage (increase in parameter ) and the throttling increase. A moderate-pressure area (Series 3) became evident, and very much so in Figure 22, or by comparing the results in Figure 16 to the results in Figure 22, and this area was a result of a throttling-pressure increase at the intake-duct end.
The moderate-pressure area (Series 3) in Figure 13, Figure 17c, Figure 18c, Figure 19c, Figure 20c and Figure 21c, had its main part focused in the final sector of the starboard and port parts of the flow duct.
When analyzing the pressure distribution in the air-intake-inlet zone for an increase in the throttling pressure, as shown in Figure 16a, Figure 17a, Figure 18a, Figure 19a, Figure 20a, Figure 21a and Figure 22a, there was a distinct change in the areas occupied by each series. The areas beyond the main zone (series) increased at the inlet. The nature of the Series 1 pressure distribution also changed at the highest throttling pressure (Figure 22), and it did not change much down the duct.
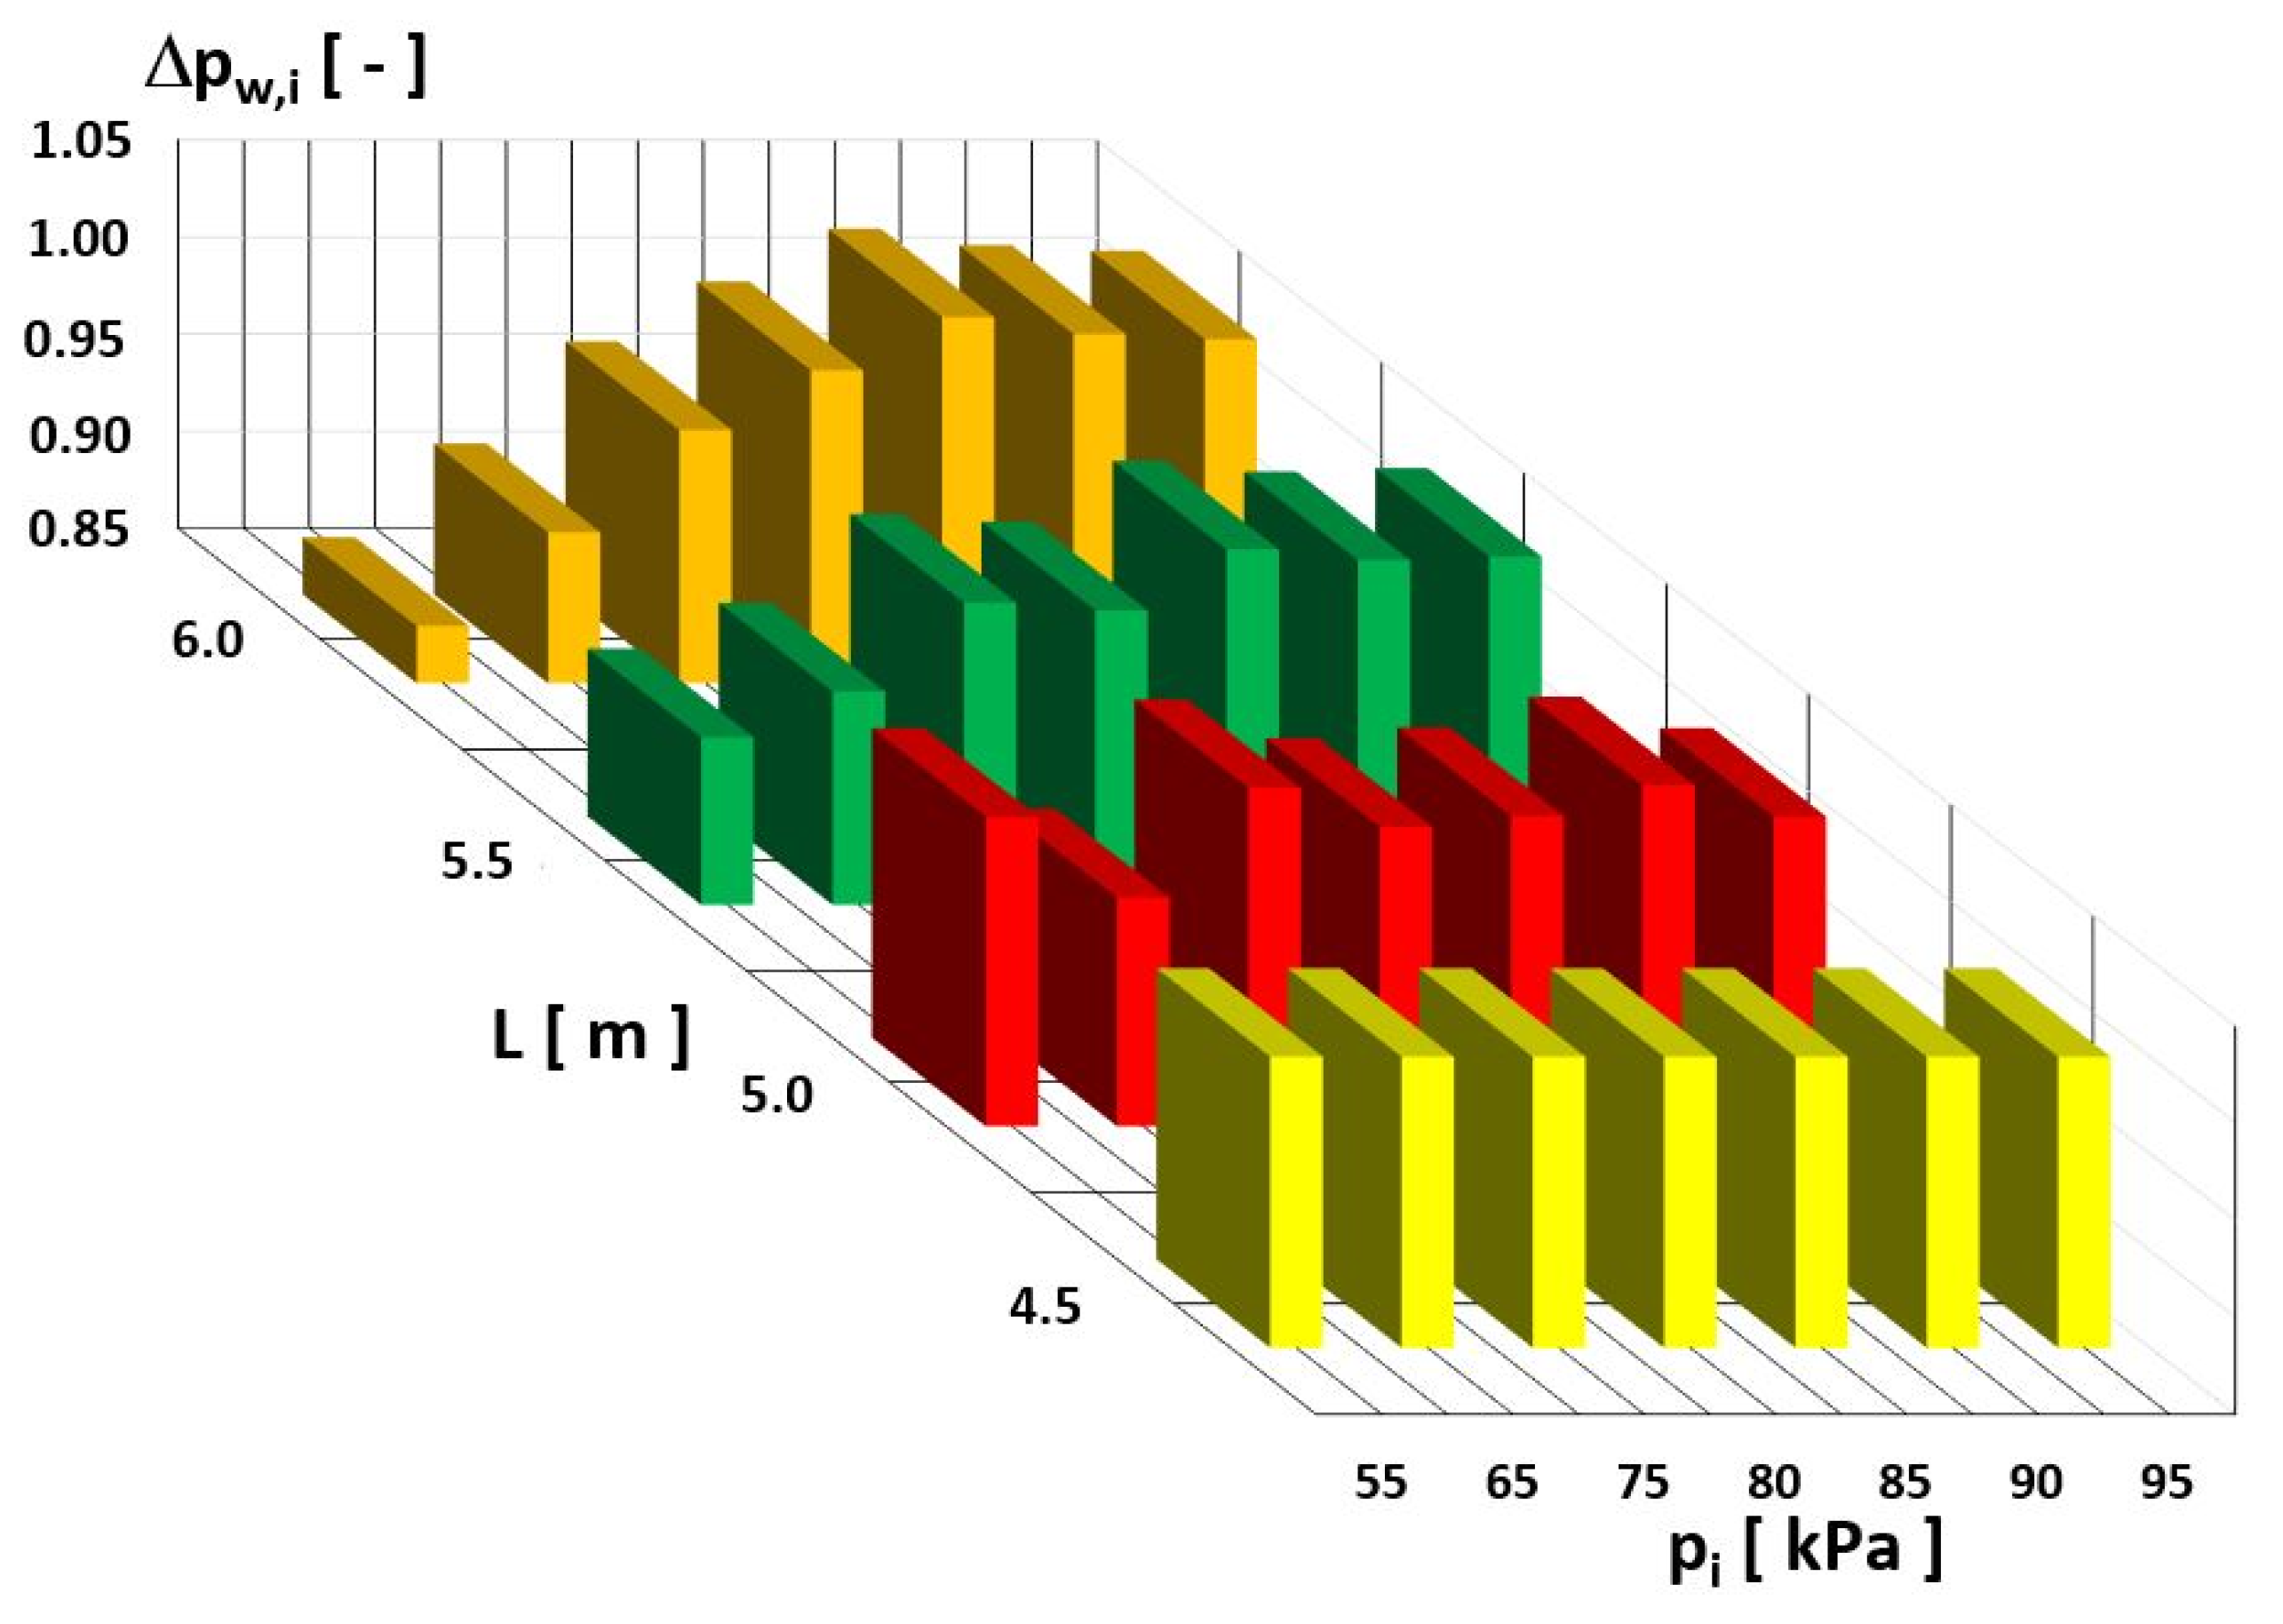
To summarize the performance of the air-intake system with variations in the throttling pressure in a way that included the location of the tested cross section, a global dimensionless potential-pressure ratio was used: . The “Dimensionless potential pressure ratio” will be designated “DPPR” in this paper.
An analysis of the DPPR in the function of the cross-section location and changes in the air-intake-duct outlet pressure (which is the throttling pressure) is shown in Figure 23. The reference cross section for each throttling case was the inlet cross section (L = 4.5 m). The most significant changes were produced without the intake system being throttled (p = 55 kPa). This was characterized by a drop in the DPPR, evidenced by an increased nonuniformity of the total-pressure field. The DPPR fell by 12.0%, although it was improved by ≈1.0% at L = 5.0 m. The pressure throttling at the air-intake-duct outlet, with an increase in the pressure () to 95 kPa, caused increased nonuniformity in the DPPR. In the first step, for , the pressure parameter increased in the end part of the intake duct by less than 1.0, with the trend dropping as a function of the L. A further increase in the pressure improved the DPPR, and the value increased above 1.0. The case with the most uniform values was , with the maximum pressure being 1.1% in the outlet (final) cross section of the air-intake duct. The highest DPPR value was produced in the system of parameters and , amounting to . The highest changes in the DPPR were within the outlet (final) cross section of the flow duct () as a function of the throttling pressure, as is clearly shown in Figure 23. It can be argued that the process of increased throttling, related to an increase in pressure, improved parameter . In an aircraft turbojet engine, throttling is controlled by a system of variable-pitch stator rings. On the one hand, one purpose of the variable-pitch stators, including the inlet stator, such as the one used in the F-100-PW-229 engine, is to stabilize the fan performance by changing the inflow angle to the rotor ring. On the other hand, the results produced suggest a conclusion concerning the stabilization of the turbojet compressor performance by increasing the pressure in the AIP, which is achieved by changing the stator-ring-blade pitch.
4. Conclusions
The research and testing results presented in this paper, which used a computational solver in Ansys Fluent that is capable of simulating flows, provide important information about the behavior of the turbojet engine air-intake system during an increase in the outlet pressure within the AIP, or flow throttling. The results illustrate the change in the nature of the distribution of the pressure fields, from relatively regular at the air-intake inlet, to zones that did not have any regularity at the end of the intake-flow channel. Those zones with the lowest pressure disappeared and were replaced with moderate-pressure zones along the intake duct. A major conclusion from the results of testing the DPPR (Figure 23) is that it is possible, within certain limits, to create an improvement in the flow uniformity by increasing the throttling pressure. The physical quantity of the DPPR is the relative value of piAi, and Figure 23 shows the change in the pressure-potential coefficient as a function of the cross-sectional area tested and the change in the final pressure. The use of this coefficient allowed for a comparison of the pressure distributions in a tunnel of a changeable shape and area. The cross section L = 4.5 is taken as a reference. In some cross sections, the value of the resultant coefficient of the entire cross section changed a little. This information is of high utilitarian value for turbojet engine control and the programming of the engine’s control system, which must protect the engine from unstable operation through control and adjustment.
For all the cases analyzed, an intake vortex was determined, the location of which changed with the point of stagnation (Figure 14 and Figure 15). These results illustrate the significance of the influence of the intake vortex on the uneven distribution of such an important parameter as the total pressure, and thus there is the need to conduct further numerical analyses, as well as experimental research, in this area. To follow the mathematical approach of describing flow phenomena and numerical modeling, Ref. [14] introduces researchers to fluid-mechanics phenomena from the perspective of mathematical equilibrium.
Author Contributions
Conceptualization, A.K., S.K., M.F. and M.M.; methodology, A.K., M.F. and M.M.; software, A.K., S.K., M.F. and M.M.; validation, A.K., S.K., M.F. and M.M.; formal analysis, A.K., M.F. and M.M.; investigation, A.K., S.K., M.F. and M.M.; resources, A.K., S.K., M.F. and M.M.; data curation, A.K., M.F. and M.M.; writing—original draft preparation, A.K., S.K., M.F. and M.M.; writing—review and editing, A.K., S.K., M.F. and M.M.; visualization, M.F. and M.M.; supervision, A.K., M.F. and M.M.; project administration, A.K.; funding acquisition, A.K., S.K., M.F. and M.M. All authors have read and agreed to the published version of the manuscript.
Funding
This research was funded by the Military University of Technology, Warsaw, Poland, under research project No. UGB 781/2022.
Institutional Review Board Statement
Not applicable.
Informed Consent Statement
Not applicable.
Data Availability Statement
Not applicable.
Conflicts of Interest
The authors declare no conflict of interest.
References
- Chiereghin, N.; Guglielmi, L.; Savill, M.; Kipouros, T.; Manca, E.; Rigobello, A.; Barison, M.; Benini, E. Shape Optimization of a Curved Duct with Free Form Deformations. In Proceedings of the American Institute of Aeronautics and Astronautics AIAA 2017-4114, Session: Optimization and Design Using CFD, Denver, CO, USA, 5–9 June 2017; Available online: https://www.researchgate.net/publication/317694229 (accessed on 2 June 2017). [CrossRef]
- Afzal, A.A.; Safdar, M.M.; Javed, A. Performance Analysis of a Proposed Design of Diverterless Supersonic Inlet at Various Flight Conditions. In Proceedings of the AIAA Scitech 2021 Forum, Virtual Event, 11–15 and 19–21 January 2021. [Google Scholar] [CrossRef]
- Tanguy, G.; Macmanus, D.; Garnier, E.; Martin, P. Characteristics of Unsteady Total Pressure Distortion for a Complex Aero-engine Intake Duct. In Aerospace Science and Technology; Elsevier: Amsterdam, The Netherlands, 2018; Volume 78, pp. 297–311. [Google Scholar] [CrossRef]
- Montes, R.A.; Chandler, F.O. A CFD investigation of a diverterless supersonic inlet of ellipsoidal entrance shape. In Proceedings of the AIAA Propulsion and Energy Forum, Indianapolis, IN, USA, 19–22 August 2019; pp. 1–33. [Google Scholar] [CrossRef]
- Ibrahim, I.H.; Ng, E.Y.K.; Wong, K. Flight Maneuverability Characteristics of the F-16 CFD and Correlation with its Intake Total Pressure Recovery and Distortion. Eng. Appl. Comput. Fluid Mech. 2011, 5, 223–234. [Google Scholar] [CrossRef]
- Saheby, E.B.; Shen, X.; Hays, A.P. Design and performance study of a parametric diverterless supersonic inlet. Proc. Inst. Mech. Eng. Part G J. Mech. Eng. 2020, 234, 470–489. [Google Scholar] [CrossRef]
- Chen, W.; Zheng, X.; Liu, S. Finite-Element-Mesh Based Method for Modeling and Optimization of Lattice Structures for Additive Manufacturing. Materials 2018, 11, 2073. [Google Scholar] [CrossRef] [PubMed]
- Kozakiewicz, A.; Frant, M.; Majcher, M. Impact of the Intake Vortex on the Stability of the Turbine Jet Engine Intake System. Int. Rev. Aerosp. Eng. 2021, 14, 4. [Google Scholar] [CrossRef]
- Frant, M.; Kozakiewicz, A.; Kachel, S. Analysis of Impact of Gust Angle and Velocity on the Position of Stagnation Point. Adv. Sci. Technol. Res. J. 2020, 14, 49–57. [Google Scholar] [CrossRef]
- Lumley, J.L.; Yaglom, A.M. A Century of Turbulence. Flow. Turbul. Combust. 2001, 66, 241–286. [Google Scholar] [CrossRef]
- Gry Liu, B.; Vanierschot, M. Numerical Study of the Hydrodynamic Characteristics Comparison between a Ducted Propeller and a Rim-Driven Thruster. Appl. Sci. 2021, 11, 4919. [Google Scholar] [CrossRef]
- Elsner, J.W. Turbulence of Flows; State Scientific Publishing House: Kraków, Poland, 1987; pp. 27–30, 52–62, 379. (In Polish) [Google Scholar]
- ANSYS FLUENT Theory Guide, Release 14.0; ANSYS, Inc.: Canonsburg, PA, USA, 2011.
- Noii, N.; Khodadadian, A.; Wick, T. Bayesian inversion for anisotropic hydraulic phase-field fracture. Comput. Methods Appl. Mech. Eng. 2021, 386, 114118. [Google Scholar] [CrossRef]
Figure 1.
Temperature-change trend downstream of the jet engine turbine during an engine surge.

Figure 2.
Standard-deviation distribution: (a) for the pressure-recovery factor; (b) for the flow-turbulence angle [1]. Adapted with permission from Ref. [1]. Copyright 2017, copyright the American Institute of Aeronautics and Astronautics AIAA.

Figure 3.
Total-pressure distribution in the intake cross section at Ma = 0.8, and the angle of attack of [2]. Adapted with permission from Ref. [2]. Copyright 2021, copyright the American Institute of Aeronautics and Astronautics AIAA.

Figure 4.
Distribution of the change in the dimensionless potential-pressure ratio in the AIP: (a) Duct A MAIP = 0.2; (b) Duct A MAIP = 0.36 [3]. Adapted with permission from Ref. [3]. Copyright 2018, copyright Elsevier: Amsterdam.

Figure 5.
AIP total-pressure distribution [4]. Adapted with permission from Ref. [4]. Copyright 2019, copyright the American Institute of Aeronautics and Astronautics AIAA.

Figure 6.
Mode of air-intake section of an F-16 jet fighter [5]. Adapted with permission from Ref. [5]. Copyright 2011, copyright Engineering Applications of Computational Fluid Mechanics.

Figure 7.
AIP cross-sectional pressure distribution in the air-intake section of an F-16 jet fighter [5]. Adapted with permission from Ref. [5]. Copyright 2011, copyright Engineering Applications of Computational Fluid Mechanics.

Figure 8.
Distribution of changes in the Mach numbers and total pressure in a DSI intake system [6]. Adapted with permission from Ref. [6]. Copyright 2020, copyright Proc. Inst. Mech. Eng. Part G J. Mech. Eng.

Figure 9.
Surface model of the F-16 aircraft.

Figure 10.
Computational domain prepared for discretization, with a separate additional volume for the compacting of the mesh.
Figure 10.
Computational domain prepared for discretization, with a separate additional volume for the compacting of the mesh.

Figure 11.
Cross section of the numerical mesh in the aircraft plane of symmetry.

Figure 12.
Overview of pressure-distribution changes, in pascals, along the intake duct of the turbojet engine, with cross sections A, B, C, and D shown.
Figure 12.
Overview of pressure-distribution changes, in pascals, along the intake duct of the turbojet engine, with cross sections A, B, C, and D shown.

Figure 13.
Pressure distribution in the intake cross section at throttling pressure: : (a) cross section A; (b) cross section D.
Figure 13.
Pressure distribution in the intake cross section at throttling pressure: : (a) cross section A; (b) cross section D.

Figure 14.
Pressure distribution in the intake cross section at throttling pressure for cross section B.
Figure 14.
Pressure distribution in the intake cross section at throttling pressure for cross section B.

Figure 15.
Analysis of the distribution of pressure-field changes in the flow duct for : (a) : relative surface area of specific total pressure (series) vs. the cross-section location (L); (b) : relative total-pressure-area increase outside of the main zone.
Figure 15.
Analysis of the distribution of pressure-field changes in the flow duct for : (a) : relative surface area of specific total pressure (series) vs. the cross-section location (L); (b) : relative total-pressure-area increase outside of the main zone.

Figure 16.
Change in the ratios of pressure-distribution-series surface areas within the intake cross section for : (a) cross section A; (b) cross section D.
Figure 16.
Change in the ratios of pressure-distribution-series surface areas within the intake cross section for : (a) cross section A; (b) cross section D.

Figure 17.
Total-pressure distribution in the inlet: (a) cross section A; (b) the outlet cross section D; (c) the distribution of the dimensionless potential-pressure ratio at Ma = 0.0075, beta 45°, p = 75 kPa.
Figure 17.
Total-pressure distribution in the inlet: (a) cross section A; (b) the outlet cross section D; (c) the distribution of the dimensionless potential-pressure ratio at Ma = 0.0075, beta 45°, p = 75 kPa.

Figure 18.
Total-pressure distribution in the inlet: (a) cross section A; (b) the outlet cross section D; (c) distribution of the dimensionless potential-pressure ratio at Ma = 0.0075, beta 45°, p = 80 kPa.
Figure 18.
Total-pressure distribution in the inlet: (a) cross section A; (b) the outlet cross section D; (c) distribution of the dimensionless potential-pressure ratio at Ma = 0.0075, beta 45°, p = 80 kPa.

Figure 19.
Total-pressure distribution in the inlet: (a) cross section A; (b) the outlet cross section D; (c) the distribution of the dimensionless potential-pressure ratio at Ma = 0.0075, beta 45°, p = 85 kPa.
Figure 19.
Total-pressure distribution in the inlet: (a) cross section A; (b) the outlet cross section D; (c) the distribution of the dimensionless potential-pressure ratio at Ma = 0.0075, beta 45°, p = 85 kPa.

Figure 20.
Total-pressure distribution in the inlet: (a) cross section A; (b) the outlet cross section D; (c) the distribution of the dimensionless potential-pressure ratio at Ma = 0.0075, beta 45°, p = 90 kPa.
Figure 20.
Total-pressure distribution in the inlet: (a) cross section A; (b) the outlet cross section D; (c) the distribution of the dimensionless potential-pressure ratio at Ma = 0.0075, beta 45°, p = 90 kPa.

Figure 21.
Total-pressure distribution in the inlet: (a) cross section A; (b) the outlet cross section D; (c) the distribution of the dimensionless potential-pressure ratio at Ma = 0.0075, beta 45°, p = 95 kPa.
Figure 21.
Total-pressure distribution in the inlet: (a) cross section A; (b) the outlet cross section D; (c) the distribution of the dimensionless potential-pressure ratio at Ma = 0.0075, beta 45°, p = 95 kPa.

Figure 22.
Change in the ratios of pressure-distribution-series surface areas within the intake cross section: (a) cross section A; (b) cross section D (Ma = 0.0075, beta 45°, p = 95 kPa).
Figure 22.
Change in the ratios of pressure-distribution-series surface areas within the intake cross section: (a) cross section A; (b) cross section D (Ma = 0.0075, beta 45°, p = 95 kPa).

Figure 23.
Distribution of changes in the potential pressure.


Table 1.
Pressure intervals for each series.
| Series No. | Pressure Interval (kPa) | Color |
|---|---|---|
| 1 | 89.9–107.0 | Red |
| 2 | 81.6–89.9 | Yellow |
| 3 | 60.8–81.6 | Green |
| 4 | 48.3–60.8 | Azure |
| 5 | 35.9–48.3 | Blue |
Publisher’s Note: MDPI stays neutral with regard to jurisdictional claims in published maps and institutional affiliations. |
© 2022 by the authors. Licensee MDPI, Basel, Switzerland. This article is an open access article distributed under the terms and conditions of the Creative Commons Attribution (CC BY) license (https://creativecommons.org/licenses/by/4.0/).
Share and Cite
MDPI and ACS Style
Kozakiewicz, A.; Kachel, S.; Frant, M.; Majcher, M. Intake System Performance Stability as a Function of Flow Throttling. Energies 2022, 15, 6291. https://0-doi-org.brum.beds.ac.uk/10.3390/en15176291
AMA Style
Kozakiewicz A, Kachel S, Frant M, Majcher M. Intake System Performance Stability as a Function of Flow Throttling. Energies. 2022; 15(17):6291. https://0-doi-org.brum.beds.ac.uk/10.3390/en15176291
Chicago/Turabian StyleKozakiewicz, Adam, Stanisław Kachel, Michał Frant, and Maciej Majcher. 2022. "Intake System Performance Stability as a Function of Flow Throttling" Energies 15, no. 17: 6291. https://0-doi-org.brum.beds.ac.uk/10.3390/en15176291
Note that from the first issue of 2016, this journal uses article numbers instead of page numbers. See further details here.