Article

Research on Spatial Distribution Characteristics of High Haze Pollution Industries Such as Thermal Power Industry in the Beijing-Tianjin-Hebei Region

1
School of Business, Ludong University, 186 Hongqizhong Road, Zhifu District, Yantai 264025, China
2
School of Management, Wuzhou University, 82 Fumin 3rd Road, Wanxiu District, Wuzhou 543002, China
3
School of Public Administration, Guangxi University, 100 Daxue East Road, Xixiangtang District, Nanning 530000, China
*
Author to whom correspondence should be addressed.
Submission received: 29 June 2022 / Revised: 29 August 2022 / Accepted: 6 September 2022 / Published: 9 September 2022

Abstract

:
The Beijing-Tianjin-Hebei region is subject to the most severe haze condition in China. Against the backdrop of the coordinated development of Beijing, Tianjin, and Hebei, it is of great significance to explore the space-time distribution characteristics of high haze pollution industries in the above region. The purpose of this article is to find high haze pollution industries scientifically, analyze the spatial distribution characteristics of high haze pollution industries in Beijing-Tianjin-Hebei correctly, and formulate effective reduction measures for the spatial distribution of high haze pollution industries in different regions of Beijing-Tianjin-Hebei. It hopes that the measures provide a basis for effective to reduce high haze pollution in the Beijing-Tianjin-Hebei region. Using the Gini coefficient and location entropy, this paper explores the space-time characteristics of high haze pollution industries in 13 cities of the Beijing-Tianjin-Hebei region. The results show that those aforesaid high haze pollution industries present an obvious clustering trend in Beijing, Tianjin, Shijiazhuang, Handan, and some areas along the economic axis of China, overall flooding into Eastern coastal and Southern inland areas. By industry, the petroleum processing and coking processing industry, chemical raw materials and chemical products industry, manufacture of non-metallic mineral products, and ferrous metal smelting and rolling processing industry witness a declining clustering trend, as opposed to the electricity, heat production, and supply industry. Meanwhile, core cities of the Beijing-Tianjin-Hebei region have developed high haze pollution industries, and the hinterland lags in economic development. It is necessary to face up to the differences in economic development among areas in the Beijing-Tianjin-Hebei region, promote the staggered development of high haze pollution industries, and build a high haze pollution industry chain with coordinated economic and environmental development, thus reducing the economic gap with each area, and realizing the coordinated development of economy, industry, and environment.

1. Introduction

With the continuous acceleration of the global industrialization process, industrial pollution brings more and more pressure on the environment. In recent decades, the ecological environment of many countries in the world has experienced unprecedented damage, and many environmental problems have emerged. At the same time, the problem of air pollution is becoming more and more serious, which has a great negative impact on human health and ecological balance [1], especially in China. Since 2012, some cities in Northern China have experienced severe haze pollution, the main component of which is fine particulate matter. The appearance of haze pollution (fine particulate matter) not only greatly reduces air visibility, but also carries a large number of bacteria and viruses [2]. The Lancet, an international authoritative medical journal, pointed out that haze ranks eighth among the factors that threaten human health, and ranks fourth in China. If effective measures cannot be taken to control haze pollution, air quality will continue to rise worsening, air pollution will become the most important cause of environmental problems leading to disease by 2050 [3].
According to the data from China Environment Bulletin in 2019, among the 337 cities at the prefecture level and above, the proportion of urban ambient air quality meeting the standard is 46.6%, while the proportion of urban ambient air quality exceeding the standard is 53.4% [4]. The Beijing-Tianjin-Hebei region is the region with the highest air pollution level in China. Among the 10 cities with the worst air quality in China assessed in 2017 and 2018, the Beijing-Tianjin-Hebei region occupies the eighth and fifth places, respectively. In 2019, the ratio of good days in Beijing Tianjin Hebei and surrounding areas was only 63.5%, which was 21.7% lower than that in the Yangtze River Delta [5]. The Beijing-Tianjin-Hebei urban agglomeration has become a typical “double-high” pollution area of ozone pollution and particulate matter pollution, and haze pollution exceeding the standard frequently occurs [6].
The Chinese government attaches great importance to haze pollution. In 2015, the new environmental protection law was implemented. In 2018, China comprehensively carried out the blue-sky defense battle, optimized the energy and transportation structure, and strengthened the supervision and law enforcement of ecological and environmental protection, to effectively dealt with heavy pollution weather. To fully implement the action plan, in 2019, the Ministry of Ecology and Environment of China formulated the “Key Points of National Air Pollution Prevention and Control Work in 2019”, solidly promoting the joint prevention and control work in key regions, such as Beijing-Tianjin-Hebei, studied and formulated relevant rules and regulations, and improved regional joint prevention and control working mechanism [7]. In 2020, due to the impact of COVID-19, industrial production and other fields were greatly affected. However, since the resumption of production, China’s social and economic development has continued to show a steady and positive development momentum. However, the social and economic losses and public health losses caused by haze pollution have made the achievements of economic development discounted [8]. The Beijing-Tianjin-Hebei region is still one of the regions with the most serious air pollution in China. There are still many problems with air quality, and the overall pollution intensity is still relatively high [9]. Unreasonable industrial structure, energy consumption patterns, and urban planning have resulted in a large number of industries with high haze pollution in the region, especially the thermal power and steel industries which mainly consume coal.
Given the above situation, the purpose of the research is to find high haze pollution industries scientifically, analyze the spatial distribution characteristics of high haze pollution industries in Beijing-Tianjin-Hebei correctly, and formulate effective reduction measures for the spatial distribution of high haze pollution industries in different regions of Beijing-Tianjin-Hebei. It hopes that the measures provide a basis for effective to reduce high haze pollution in the Beijing-Tianjin-Hebei region. In the process of achieving the research objectives, many results have been obtained, including elements of scientific novelty. First, how to scientifically identify high haze pollution industries. Second, how to correctly analyze the spatial distribution characteristics of high haze pollution industries in Beijing-Tianjin-Hebei. Third, how to give countermeasures and suggestions for effectively reducing high haze pollution in Beijing-Tianjin-Hebei according to the spatial distribution characteristics of high haze pollution industries.
Further materials are mainly divided into three parts: the first part, the identification of high haze pollution industries; The second part, the spatial distribution characteristics of Beijing-Tianjin-Hebei high haze pollution industries; The third part is the conclusions and countermeasures.

2. Literature Review

2.1. Definition and Formation Conditions of Haze

Fog and haze are two different types of weather, but these two types of weather are currently symbiotic in China. The main component of fog is water, while haze mainly consists of “poisonous fog”, in which the proportion of toxic chemicals is high and not easily diffused for a long time, causing physical and mental harm to the residents [10]. Therefore, haze can be defined as an atmospheric phenomenon in which the concentration of suspended particulate matter (PM2.5) with D ≤ 2.5 μm in the air increases, causing air pollution and greatly reducing visibility. Haze is mainly composed of tiny inhalable particles [11]. The boundary between fog and sky is not very clear. The maximum visibility is approximately 3000 m, and the particle density in the atmosphere is relatively uniform [12]. The haze diameter is very small, the minimum diameter is approximately 0.001 microns, the maximum diameter is approximately 10 microns, and most of the diameters are between 1 and 3 microns. Yu dxxum h team defined the particle size range of ultra-fine mode, intermediate mode, and coarse mode particles in the three model theory through the characteristic element tracing method, and accurately revealed the formation mechanism of PM2.5 [13]. The three modal particle size ranges of particulate matter are affected by fuel characteristics and combustion conditions. In general, the particle size of ultrafine modal particles is 0.12 μ M U.M and the coarse mode is 0.8 μ M U.M and the intermediate mode is located between them [14]. Ultrafine particles are an important component of PM2.5, and their formation pathways mainly include gasification nucleation, crushing, polymerization, and condensation [15]. Gasification condensation of inorganic mineral elements in coal is the main formation mechanism of ultrafine modal particles [16]. The crushing of coke and minerals mainly forms intermediate mode and coarse mode particles [17]. Heterogeneous action, melt polymerization, and coalescence of minerals are the main growth forms of particles [18].
The formation of haze requires two factors, one is the meteorological conditions that form haze, and the other is the fine particles that form haze [19]. The meteorological condition is “static and stable weather”, which is a climate phenomenon in which the air is almost static in the horizontal and vertical directions [20]. The fine particles mainly include two aspects: one is the combustion of coal, oil, and natural gas, which will produce carbon monoxide, carbon dioxide, sulfur dioxide, nitrogen oxides, heavy metals, organic compounds, and smoke [21]; second, the production activities of industrial enterprises, such as particulate matter, sulfur monoxide, carbon monoxide, oxygen oxides, non-methanee total hydrocarbons and odor pollutants emitted by petrochemical enterprises. Previous studies have shown that the cause of haze is mainly caused by particulate matter produced by fossil fuel combustion [22]. Volatile organic compounds (VOCs) in the atmosphere are the precursors of haze [23]. The main emission sources of VOCs are petroleum and petrochemical, printing, coating (including painting), electronic equipment and other industries [24]. In addition, coal-fired power generation is the main power generation mode in China at present, but the environmental pollution caused by coal-fired flue gas is very serious [25]. Sulfur dioxide and nitrogen oxides in the coal-fired flue gas are the main causes of environmental problems, such as haze, acid rain, and photochemical smog [26]. Especially when the current emission concentration of conventional pollutants from coal-fired power plants reaches the emission limit, the proportion of unreacted ammonia escaping from denitration devices in the total emission of flue gas pollutants continues to rise, and the harm caused by excessive ammonia escaping from denitration of coal-fired power plants under the ultra-low emission is increasingly prominent. With the increasingly serious problem of ammonia escaping from flue gas denitrification in non-electric fields, such as cement and steel, ammonia has been regarded as the “culprit” of atmospheric haze [27]. At present, China has become the largest energy consumption country in the world. For a long time, a large amount of coal has been directly burned, and a large amount of inferior fuel oil has been used, resulting in low-standard exhaust emissions. According to the data, the emissions of sulfur dioxide, nitrogen oxides, and soot from coal combustion in China account for approximately 86%, 56%, and 74% of the national total, respectively, and the PM2.5 generated accounts for 50–60% of the total. Direct coal-fired smoke emission and petrochemical consumption are one of the main reasons for haze.

2.2. The Identification of Polluting Industries and Their Spatial Distribution Characteristics

2.2.1. Identification of Industries with High Haze Pollution

High pollution industries refer to the industries that produce a large number of harmful substances in the production process [28], so the high haze pollution industries mainly refer to industries that produce large amounts of air pollutants that are easy to form haze pollution in the production process, such as SO2, smoke, and dust. Scholars have their own advantages and disadvantages in the classification and identification of high pollution industries, which are mainly divided into three identification methods: the first method is to compare the pollution control costs between different industries, and the representative is Tobey J. [29]. The second method defines the high pollution industries according to the pollution emission concentration of each industry. For example, Lucas et al. (1992) took many factories in the United States as the research samples, and determined the pollution industries according to the emission intensity of pollutants [30]. The third method is based on the scale of industrial pollutant discharge. Randy et al. (2000) ranked all industries according to the scale of pollutant emission from large to small, and classified the industries whose cumulative emission of volatile organic pollutants (VOCs) accounted for more than 60% of the VOC emissions of all industries as high pollution industries [31].

2.2.2. Spatial Distribution Type Analysis

When examining the industrial spatial structure within the scope of provinces and cities, the industry can be abstracted into a single point. Point elements usually have three types of distribution patterns: aggregate distribution, uniform distribution or random distribution. The nearest neighbor analysis method was first proposed by ecologists Clark and Evans (1954), which is considered to be suitable for irregular distribution in a specific space, reflecting the type of spatial distribution pattern of point elements [32]. Wu Yang et al. (2015) [33], Zhao Huisha and Wang Jinlian (2017) [34] and many other scholars have adopted the nearest neighbor analysis to quantitatively describe the regional spatial distribution pattern. However, due to the controversy over the definition of the nearest neighbor analysis method to determine the spatial distribution type of point features, scientists usually perform a secondary test on the industrial spatial distribution type by measuring the coefficient of variation (CV) of Voronoi polygon area. The Voronoi diagram divides the object space into many unit areas according to the principle of the nearest neighbors of elements in the object set. It is an effective method to measure the spatial distribution characteristics of point-like elements. Most scholars apply it to the study of spatial structure (Duyckaerts, 2000 [35]; Ba Duoxun et al., 2013 [36]; Han Jie and Song Baoping, 2014 [37]). In addition, Duranton and Overman proposed a new distance function-DO index, and gave a strict statistical test to determine whether the industry is in a state of agglomeration. If the actual distance density of the observed value is greater than the random density, the industry is agglomerated, otherwise the industry is dispersed [38]. This makes the DO index more widely used in economics.

2.2.3. Degree of Concentration of Spatial Distribution

The concentration degree of spatial distribution is mainly analyzed by three methods: geographic concentration index, industry concentration index and Herfindahl index. The geospatial density distribution concentration and optimal utilization degree of geographically concentrated elements are generally considered to be measured by the exponential density of the geographical concentration. Using the nearest neighbor index, geographic concentration index, Gini coefficient, imbalance index and kernel density, Chen Peng et al. (2018) study the spatial distribution characteristics of 112 national eco-tourism demonstration areas in China by the spatial analysis means in the geographical mathematical method and the spatial analysis tools provided by GIS software [39]. Industry Concentration Index (CRn) refers to the share of the corresponding value (such as output, number of employees, main business income, etc.) of the N largest enterprises in a specific industry in the whole market or the whole industry. However, it depends on the value of N and cannot give a clear result, so it usually can’t be used alone. Li Yang (2009) used three methods of location entropy, industry concentration index (CR4) and spatial Gini coefficient to calculate the degree of industrial agglomeration in western China [40]. The Herfindahl Index (H) is a key indicator used to measure market structure, expressed as the sum of the squares of the market shares of all companies in a particular industry. However, the h index completely ignores the differences in the geographical area distribution of administrative space of different industries and geographical units and fails to fully consider the geographical area distribution of other administrative departments, and there is basically no comparability among different industries.

2.2.4. Spatial Distribution Balance

The equilibrium characteristics of spatial distribution are mainly calculated by combining the imbalance index and the Lorentz curve. The Imbalance Index (S) reflects the completeness or balance of research distribution at different levels or in different regions, with a value between 0 and 1. The closer the value of S is to 0, the more balanced the distribution; the closer the value of S is to 1, the more unbalanced the distribution. Zhou Shangyi et al. (2006) accurately described the current spatial distribution and economic structure of cultural industry in Beijing metropolitan area by using Lorenz curve, concentration index curve and the equivalent line chart of annual output value of cultural enterprises in the metropolitan area according to the latest data of basic unit survey in Beijing metropolitan area [41]. Li Bohua et al. (2015) selected the nearest neighbor index, imbalance index, geographical concentration index and other survey models, and then used the spatial analysis tools ArcGIS 10.1 and Excel to quantitatively analyze the spatial distribution of traditional villages in Hunan and carried out core density calculation for Hunan village survey [42].

2.2.5. Degree of Difference in Spatial Distribution

The analysis methods of spatial distribution difference include Gini coefficient and K function. The Gini coefficient (Gini) was originally used to measure the difference between income and distribution. Later, it was introduced into geographic scientific research, and has become an important method to study the distribution relationship of spatial changes among various regions. Its main advantage is to compare the regionality and distribution change laws between different search objects and to understand their regionality and distribution change laws. Yang Xiucheng et al. (2019) collected information, data and literature on health tourism resources from Fujian provincial governments at all levels, travel agencies and media information portals, mainly using GIS spatial processing methods, and combined with spatial analysis methods, such as nearest neighbor index, Gini coefficient and nuclear density analysis, in-depth discussed the spatial distribution characteristics of health tourism resources in Fujian Province [43]. To show how the spatial distribution of points depends on the scale, Ripley uses the K-function to measure correlation results and is widely used in geography and landscape ecology. The K-function overcomes the disadvantages of the traditional single-scale spatial distribution model. The spatial distribution characteristics of geographical units on different spatial scales are different, and the results obtained are easier to understand and comprehensive.

3. Methods and Data

According to the research objectives and problems, the article takes the high haze pollution industry as the research object, puts forward the research hypothesis, and uses the index model and spatial partition map to explore how to scientifically identify the high haze pollution industry, correctly analyze the spatial distribution characteristics of the high haze pollution industry in Beijing-Tianjin-Hebei, and effectively design countermeasures and suggestions to reduce the high haze pollution in Beijing-Tianjin-Hebei.

3.1. Research Hypotheses

Hypothesis 1 (H1).
High haze pollution industry mainly refers to the industry that directly or indirectly produces pollution or harmful substances due to no measures taken in the production and processing process. It will not only threaten people’s safety and healthy life, but also damage the ecological balance and deteriorate the ecological environment. Tobey (1990) defined the chemical industry, steel industry, mining industry, primary non-ferrous metal industry and paper industry as high haze pollution industries according to the pollution control cost method [29]; Mani and Wheeler (1997) defined chemical industry, non-ferrous metal industry, non-metallic mineral products industry and steel industry as high haze pollution industries according to pollution emission intensity [44]; Zhao Xikang (2003) defined the production and supply of electricity, gas and water, cement manufacturing, non-metallic mineral manufacturing and black metal smelting and rolling industry as high haze pollution industries according to the emission intensity [45]; Randy and Henderson (2000) defined the printing industry, organic industrial chemicals industry and plastic products industry as high haze pollution industries according to the pollution emission scale [31]; Liu Qiaoling et al. (2012) defined the production and supply industry of electric power and heat, non-metallic mineral products industry and ferrous metal smelting and rolling processing industry as high haze pollution industries by constructing the pollution intensity index [46]; Qiu Fangdao (2013) constructed a pollution intensity index based on the proportion of pollutant emissions of various industries in the total pollutant emissions, and listed 10 industries, such as power, gas and water production and supply, ferrous metal smelting and rolling processing, textile, mining and chemical fiber manufacturing as high haze pollution industries [47].
Based on this, it is assumed that power, thermal production and supply industry, ferrous metal smelting and rolling processing industry, chemical raw material manufacturing industry, petroleum processing and coking industry, non-metallic mineral products industry, and non-ferrous metal smelting and rolling processing industry are industries with high haze pollution.
Hypothesis 2 (H2).
Among the pollution intensive industries in Beijing-Tianjin-Hebei, the proportion of various industries varies greatly, among which the proportion of ferrous metal smelting and rolling processing industry is the highest, especially in Hebei Province, which accounts for more than 42.52% in each year. In 2012, the steel output of Hebei Province reached 210 million tons, accounting for 22% of the total output of China, nearly double that of Jiangsu Province, which ranked second [48]. The special equipment manufacturing industry, ferrous metal smelting and rolling processing industry, non-ferrous metal smelting and rolling processing industry, petroleum processing coking and nuclear fuel industry in Hebei Province grew rapidly in the same period [49]. In 2021, the operating revenue of ferrous metal smelting and rolling processing industry in Hebei Province reached 1765.4 billion yuan, with a year-on-year increase of 32.4%, accounting for 33.87% of the industrial operating revenue of the province. The profit was 76.91 billion yuan, with a year-on-year increase of 31.5%, accounting for 33.52% of the industrial profit of the province [50].
Based on this, it is assumed that ferrous metal smelting and rolling processing industries are significantly concentrated in Hebei.
Hypothesis 3 (H3).
Among the power energy supply in Beijing-Tianjin-Hebei, the power energy supply grows rapidly and the installed capacity of thermal power accounts for the largest proportion, and the power demand in Beijing-Tianjin-Hebei shows a steady upward trend. As far as Beijing is concerned, with the deepening of the Beijing-Tianjin-Hebei integration development strategy, Beijing’s demand for electric energy will continue to expand. Under the background of gradual degradation of coal-fired units in the urban area and no new power plants will be built in principle, the power supply and demand in Beijing is in a serious imbalance. To a large extent, the power supply in Beijing is transmitted through external power, but it still faces the problem of power shortage during the peak load period. Tianjin and Hebei Province are still dominated by coal-fired power generation, with the installed capacity of coal-fired power generation accounting for 90%. It is the main base of power energy supply in Beijing-Tianjin-Hebei (Zhu Lifeng, 2020) [51].
Based on this, it is assumed that the concentration of electric power and thermal industry in Beijing-Tianjin-Hebei is increased and the spatial distribution is uneven.
Hypothesis 4 (H4).
From 2004 to 2008, Beijing mainly invested in Tangshan, accounting for almost half of the total investment in Hebei Province. The investment in Langfang, Shijiazhuang and Qinhuangdao were also relatively large. After 2009, Beijing invested the most in Langfang, and the investment in Chengde, Zhangjiakou and Baoding also increased [52]. From 2008 to 2013, the proportion of employees in 23 manufacturing industries in Beijing declined. The manufacturing industries, such as printing, textile, ferrous metal smelting, computer and communication equipment decreased significantly, and these industries effectively transferred to Tianjin and Hebei [53]. From the perspective of economic and technological development, there is a gradient gap in technology among the three provinces and cities of Beijing-Tianjin-Hebei, which in turn forms a gradient gap in the industry. The technical level and industrial structure levels of Beijing and Tianjin are higher than those of Hebei, and both are facing further upgrading of their industrial structures. It is necessary to transfer some industries that no longer have comparative advantages. From the perspective of geographical location, Beijing, Tianjin, and Hebei are geographically connected, and the transaction cost and production factor combination cost among the three places are low, which can greatly improve the utilization efficiency of production factors and reduce the transfer and adjustment cost of industrial structure, which makes Beijing-Tianjin-Hebei have the geographical conditions for industrial transfer [54].
Based on this, the hypothesis is put forward: the gradient transfer effect of Beijing-Tianjin-Hebei high haze pollution industry is significant.

3.2. Research Methods

The main methods used in this article are exponential model, spatial quantile map, Gini coefficient and location entropy.
  • Index model: the index model is generated from the index values of multiple grid calculations. The key to establishing the index model is to score and assign weights to the variable observation values. Low and Yeats (1992) defined the industries whose pollution control cost accounts for more than 1% of total sales as pollution industries [55]; Lucas (1992) classified the pollution industry by calculating the pollutant emission required for unit production [30]; Bartik (1988) classified the industrial pollutant emission industries in which the proportion of the emission of exhaust pollutants in all civil industrial sectors exceeds 6% of the total emission of exhaust pollutants in all chemical industries as the major industrial atmospheric environment pollutant emission industries [56]; Liu Qiaoling et al. (2012) combined the intensity of pollution discharge with the scale of pollution discharge and calculated the pollution intensity index to define the pollution industry [46]. Through summarizing and combing the literature, the article constructs the industrial pollution intensity index model by comprehensively considering the pollution emission intensity (the proportion of the pollutant emissions of each industry in the total industrial output value of the research area) and the emission scale (the proportion of the pollutant emissions of each industry in the total pollutant emissions of the research area). On the basis of the weight calculation by the equal weight method, the weighted summation method is used to calculate the pollution intensity index of a certain industry, Identify industries with high haze pollution;
  • Spatial bitmap: the spatial bitmap is implemented in geode software. When classifying data, the software strives to achieve the goal of achieving the minimum difference within the group and the maximum difference between groups. The classification threshold value is usually established on the node with the large jump to the data. The corresponding index observation values of each spatial unit are classified according to the numerical value, which can more intuitively analyze the industrial spatial distribution. Wang Haoyu (2017) [57] made a spatial visualization of the relative scale of producer services in Beijing-Tianjin-Hebei in 2008 and 204, and drew a five-point map: Beijing, Tianjin, and Shijiazhuang are in the first echelon, with an obvious central position, Tangshan, Baoding, and Handan are in the second place, while Hengshui, Langfang, and Chengde are relatively backward in the development of producer services. Li Lin (2020) [58] used the geographic information system software open geode to draw the spatial distribution map of the science and technology service industry in Henan Province in 2005 and 2018, respectively. On the whole, the concentration of the science and technology service industry in Henan Province shows a trend of moving around to the Central and Northern regions of Henan, which indicates that the concentration level in the Southern region of Henan is low, and the concentration level in the Central and Northern regions is relatively high. Therefore, the article can directly reflect the overall spatial distribution of the high haze pollution industry and the spatial distribution of each industry over time by grading the industrial sales output value of the high haze pollution industry in Beijing-Tianjin-Hebei and drawing a spatial six-point bitmap;
  • Gini coefficient: Gini coefficient (Gini) is an important method to study the spatial distribution of discrete regions. It is mainly used to compare the regional distribution differences of different research objects and find out the laws of their regional distribution changes. The Gini coefficient takes the ratio of the number of employed persons in the sub geographical unit to the number of employed persons in the whole region as a variable into the formula. In essence, it considers the influence of the size of the area on the concentration degree. The description of the geographical concentration degree is more accurate than that of the Herfindahl index; secondly, the geographical distribution of all industries is taken as the comparison benchmark, which makes the calculation results of different industries comparable, so it has been widely used. Wang Xinchai (2019) [59] by calculating the spatial Gini coefficient and Moran’s I index, it is found that China’s pollution-intensive industries show a certain spatial agglomeration phenomenon and have positive spatial autocorrelation. Yang Xiucheng et al. (2019) [43] collected the literature of health care tourism resources from portal websites, such as governments at all levels, tourism enterprises and media information in Fujian Province, and explored the spatial distribution characteristics of health care tourism resources in Fujian Province with the help of GIS spatial processing methods, combining the nearest neighbor index, Gini coefficient, nuclear density analysis, and scale index. Therefore, the article analyzes the balance of the spatial distribution of high haze pollution industries by calculating the Gini coefficient of the whole Beijing Tianjin Hebei high haze pollution industry and the six major haze pollution industries;
  • Location entropy: also known as the specialization rate, it is used to measure the spatial distribution of factors in a certain region, reflect the degree of specialization of a certain industrial sector and the status and role of a certain region in a high-level region. By using the location entropy method, the advantageous industries in this region that have a certain position in China can be found, and measure their specialization rate according to the size of the location entropy value. Wei Heqing et al. (2019) [60] mainly used the research methods of literature, location entropy and exploratory spatial data analysis to analyze the spatial distribution characteristics of the three major industries within China’s sports industry based on the survey data of the national sports industry unit directory in 2016. The results show that the specialization level of the sports manufacturing industry is gradually decreasing in the East, the middle, and the west, and the high, middle, and low-level regions are highly contiguous, with a certain degree of spatial agglomeration. Yang Shengli and Dong Bolei (2017) [53] divided the manufacturing industry into 29 industries. According to the number of employees in 29 industries, the location quotient of each industry was calculated to analyze its comparative advantages. It is concluded that metal smelting and other industries have comparative advantages in Hebei Province, while leather, fur, down products, wood processing and pharmaceutical manufacturing in Shijiazhuang, petroleum processing, ferrous metal smelting and rolling in Tangshan, chemical fiber, general equipment and automobile manufacturing in Baoding, handicraft manufacturing in Cangzhou, wood processing, furniture manufacturing and printing in Langfang, metal products in Hengshui The location entropy of rubber and plastic products industry area is relatively large, and it has great comparative advantages in Beijing Tianjin Hebei region. Therefore, the article uses the sales output value of Beijing Tianjin Hebei high haze pollution industry to calculate the location entropy index of each industry and can judge the degree of industrial specialization and advantageous industries of each city.

3.3. Indicator Selection and Data Source

The measurement indicators used in the identification of high haze pollution industries in the article include industrial sulfur dioxide emissions, industrial nitrogen dioxide emissions, and industrial smoke and dust emissions. Spatial distribution characteristics of high haze pollution industries take 2001–2018 as the sample interval for the study, mainly using the sales output value index of high haze pollution industries. The data are from the China Industrial Statistical Yearbook, Beijing Statistical Yearbook, Tianjin Statistical Yearbook, Hebei Economic Statistical Yearbook, and the statistical yearbooks of 11 cities in Hebei Province from 2001 to 2018 [61]. At the same time, some missing data are interpolated by using the statistical bulletin of the national economic and social development of each city in the corresponding years, and finally, all data of 13 cities in Beijing-Tianjin-Hebei are obtained.

4. Research and Analysis

4.1. Identification of Industries with High Haze Pollution

Based on the index model established, we will calculate and analyze the haze pollution index of 37 industries from 2009 to 2015, compare and analyze the haze pollution index of each industry and single out high haze pollution industries with these criteria. The calculation process is as follows:
I i = Q i + G i = α · E i B i + 1 α · E i D
where I i represents the haze pollution index of industry i , The specific calculation of the haze pollution index is as follows: first, the industrial sulfur dioxide emissions, industrial nitrogen dioxide emissions, and industrial smoke and dust emissions are summed up as the industrial waste gas emissions; second, it is calculated according to the calculation formula: pollution intensity index = emission scale + emission intensity; third, emission scale = exhaust emission of a certain industry/total industrial output value of certain industry; emission intensity = exhaust emission of a certain industry/total industrial exhaust emission of all industries; fourth, find the maximum value and minimum value in the emission scale and intensity, and carry out standardized treatment; fifth, the sum of the calculated standardized emission scale and standardized emission intensity is the pollution intensity index. Q i represents the representative emission intensity of industry i , G i represents the emission scale of industry i , E i represents pollution emissions of industry i , B i represents the total output value of industry i , D represents the total pollutant emissions. Based on calculating the weight by the equal weight method, the weighted summation method [47] is used to calculate the haze pollution index of an industry. Therefore, the value of α is 0.5.
From Table 1, it can be concluded that based on the haze pollutants from 2009 to 2015 and the haze pollution index of each industry calculated from the output value, the six industries with the highest values are electricity, heat production and supply industry, ferrous metal smelting and rolling processing industry, chemical raw materials and chemical products industry, petroleum processing and coking processing industry, manufacture of non-metallic mineral products, and non-ferrous metal smelting and rolling processing industry, which are high haze pollution industries. Therefore, Hypothesis 1 is verified.

4.2. Space-Time Distributions of High Haze Pollution Industries

Spatial Quantile-Quantile Plot classifies each spatial unit in accordance with the numeric value of the index of observations so as to embody the spatial distribution of the examined index. This analysis method can be accomplished through GeoDa which endeavors to achieve the minimum intra-group difference and the maximum inter-group difference in the process of data grading. The critical value of classification lies in the node with bigger leaps. For the purpose of showing detailed spatial distribution and changes of the whole high haze pollution industries, the paper grades the sales value of Beijing-Tianjin-Hebei high haze pollution industries and makes drawings of regional changes of high haze pollution industries in each region, respectively, in 2000, 2005, 2010, 2015, and 2017. Through comparing these five pictures, it analyzes the regional transfer situation of high haze pollution industries. The larger the sales value of high haze pollution industries in a certain region is, the more enterprises related to the above industries there are. That is to say, it is deemed to be a dense distribution area surrounded by high haze pollution industries.

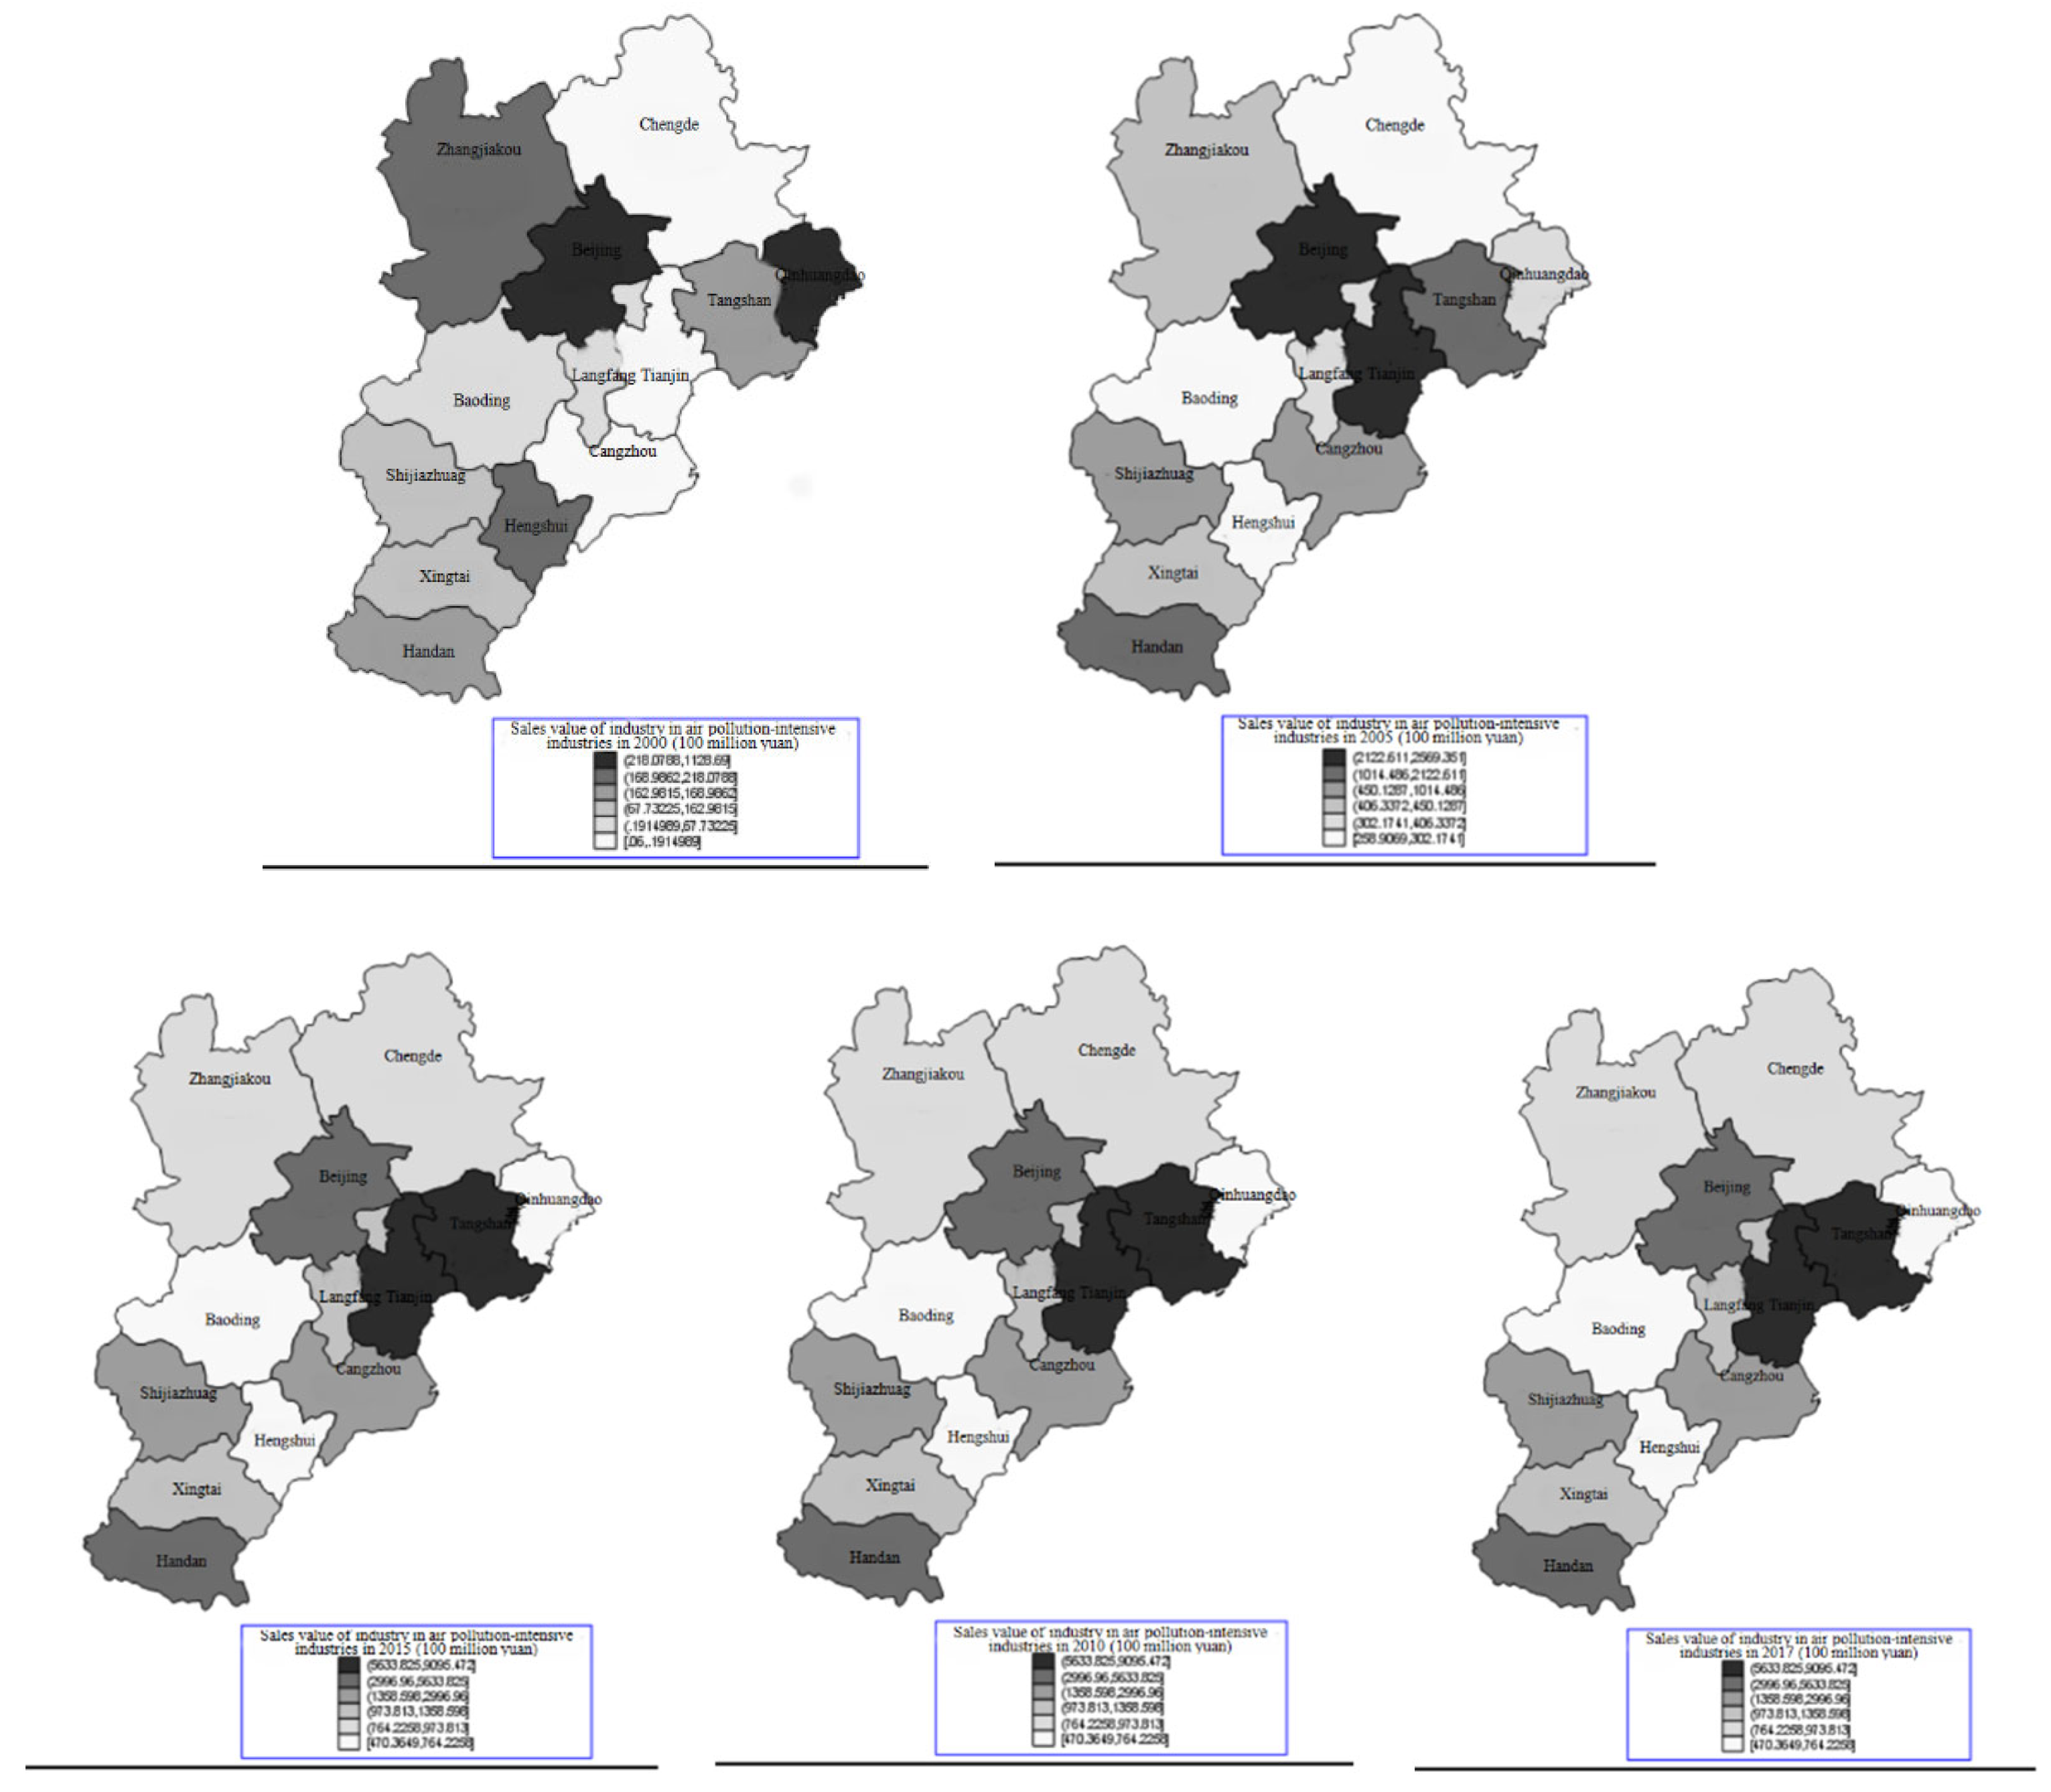
4.2.1. The Overall Space–Time Distributions of High Haze Pollution Industries

Figure 1 expresses the overall space–time distributions of high haze pollution industries. The first Quantile-Quantile Plot illustrated Beijing and Qinhuangdao in 2000. Associated with the actual situation, the main reasons are as follows: First, in 2000, power, chemical industry, and metallurgy, which were chiefly established in the Shijingshan area and the chemical industry park in the Southeast suburbs, were backbones of heavy industry in Beijing. On the basis of a large amount of money invested by the industrial system to control environmental pollution, the industrial economy achieved rapid and healthy development and its comprehensive strength was significantly enhanced by means of advanced high and new technologies that were used to transform and upgrade traditional industries. Second was the revitalization of Qinhuangdao’s textile and building materials industries, which was attributed to a series of policies and measures implemented in the same year, such as accelerating the merger, reform and reorganization of small, medium, and micro enterprises and investing in technological transformation projects from new enterprises. In this way, the total added value in the heavy industry above designated size increased by 18.3% year on year. The outputs of main industrial products, such as chemical fertilizers, machine-made paper and printing materials, aluminum materials, cement and flat glass, maintained substantial and rapid growth. In contrast to 2000, 2005 witnessed the transformation of thermal power industry and other high haze pollution industries which gradually gathered in the Central and Southern part of Hebei, while the clumping index of the eastern coastal areas was still high. The number of high haze pollution industries in Tianjin increased prominently, while that in Qinhuangdao decreased significantly. It may be influenced by the 16th CPC National Congress held in 2004 when the guiding ideology of “sustainable development strategy” was put forward. At that time, Qinhuangdao was encountering the difficulties of promoting the strategic adjustment of the industrial structure. What’s worse, the industrial enterprises’ benefit of Qinhuangdao in 2005 was reduced because of its small-scale enterprises, unobvious pillar industries, and low-level industrial science and technology. From 2010 to 2017, the distribution of thermal power industry and other high haze pollution industries remained stable, with Tianjin and Tangshan ranking the first Quantile-Quantile Plot. In contrast, Beijing fell to the second one. From 2005 to 2017, Tianjin has been firmly in the first place concerning the concentration degree of polluting industries, which may be related to solid local manufacturing. Meanwhile, 3 of the 8 pillar industries in Tianjin belonged to high haze pollution industries, thus causing a relatively high concentration level. Due to its active and effective adaptation to the complex and changeable social and economic environment after the international financial crisis in 2010, Tangshan further realized a normal and healthy economy at all levels after gradually transforming from the rapid recovery. The pace of industrial structure optimization and adjustment accelerated. The added value of the six major high-energy equipment manufacturing industries, including iron and steel, building materials, energy, chemical industry, coking and power, reached 137.832 billion yuan among the industrial added value above the scale, up 8.7% year on year. However, the reason that the concentration degree of Beijing’s high haze pollution industries has dropped to the second Quantile-Quantile Plot, was inseparable from the relocation of pollution industries before the opening of 2008 Olympic Games and relieving Beijing’s non-capital functions in recent years. In general, Beijing-Tianjin-Hebei high haze pollution industries embodied the trend of aggregation. They clustered in Beijing, Tianjin, Shi (Jiazhuang), Handan and some areas along China’s economic axis, and moved to the Eastern coastal and Southern inland areas as a whole. The development level of thermal power industry and other high haze pollution industries in cities surrounding Beijing and Tianjin, such as Baoding, Langfang, Zhangjiakou was relatively weak, as they did not keep in close touch with Beijing and Tianjin and other core areas. High haze pollution industries of Hengshui and Xingtai in the south of Hebei developed slowly and were farther from the core areas, so it is difficult to get financial and technical support. Shijiazhuang, the capital of Hebei Province, located in its Southern part, formed a polarization effect by attracting factor resources comprised of talents and capital from surrounding areas to flow to itself. The above-mentioned areas belonged to the South Hebei marginal area whose overall development lagged behind. high haze pollution industries developed rapidly in the core cities of the Beijing-Tianjin-Hebei region, while the hinterland fell behind in economic development. Hence, it was necessary to face up to the difference in the development of various regions, emphasizing the promotion of industrial dislocation and sharing, and create an integrated industrial chain with complementary advantages and synergistic coexistence, so as to reduce the gap among regions and achieve the coordinated development of the industrial chain.

4.2.2. Space–Time Distributions of Haze Pollution Industries by Industry

The space–time distributions of chemical raw materials and chemical products industry: In 2000, the overall development level of chemical raw materials and chemical products industry in the Beijing-Tianjin-Hebei region was not high. Baoding and Qinhuangdao were assigned to the first bitmap; in 2005, the sales value of this industry increased significantly, mainly in Tianjin and Shijiazhuang, and maintained until 2017.
The space–time distributions of non-ferrous metal smelting and rolling processing industry: In 2000, Baoding and Qinhuangdao were the first Quantile-Quantile Plot. In 2005, the spatial distribution of non-ferrous metal smelting and rolling processing industry changed obviously, mainly crowded in Baoding and Tianjin, and the circumstance continued to 2017.
The space–time distributions of electricity, heat production and supply industry are shown: In 2000, Zhangjiakou and Tangshan ranked first. By 2005, the spatial distribution of power and thermal industry changed significantly, the concentration degree of Zhangjiakou and Tangshan decreased, and the whole industry shifted to inland and coastal areas, mainly located in Beijing and Tianjin, which was maintained until 2017.
The space–time distributions of petroleum processing and coking processing industry: In 2000, the overall development of petroleum processing industry was slow. Baoding and Qinhuangdao had relatively high sales value in petroleum industry, so they belonged to the first Quantile-Quantile Plot. In 2005, while the sales value of this industry increased, there were signs of shifting to the Central and Southeast coastal regions, with Beijing and Tianjin taking the first place and keeping the position until 2010.
The space–time distributions of manufacture of non-metallic mineral products: The manufacture of non-metallic mineral products in the Beijing-Tianjin-Hebei region developed slowly in 2000, with Tangshan and Hengshui lying in the first Quantile-Quantile Plot. In 2005, the spatial distribution of manufacture of non-metallic mineral products changed significantly, mainly concentrated in Beijing, Shijiazhuang and South Shijiazhuang. In particular, the growth rate of sales value in Beijing was the most outstanding, and this trend continued to 2017.
The space-time distributions of ferrous metal smelting and rolling processing industry: Zhangjiakou and Handan were in the first Quantile-Quantile Plot of 2000. In 2005, the spatial distribution of ferrous metal smelting and rolling processing industry changed remarkably, and it shifted from Zhangjiakou and Handan to Tianjin and Tangshan and then constituted industrial clusters, and this distribution trend was unchanged until 2017. Therefore, Hypothesis 2 is verified.

4.3. Analysis of Spatial Equilibrium of High Haze Pollution Industries

“Spatial equilibrium” not only refers to the spatial allocation pattern of demands for various production factors in the process of industrial development, but also represents a regional production capacity layout that is compatible and coordinated with the natural resources and environmental endowment of a country and region and meets the needs of sustainable development. The Gini coefficient method is an important technical method widely used to describe the distribution differences among various spatial factors. It is used to compare the regional distribution and differences between research objects and places, so as to find out the regional distribution and change rules between them. The comprehensive calculation formula is as follows:
  G = i N S i x i 2
where G is spatial Gini coefficient, S i is the proportion of i region’s high haze pollution industries in the Beijing-Tianjin-Hebei region; x i is the proportion of i region’s relevant indicators in the Beijing-Tianjin-Hebei region; N is the number of enterprises in the Beijing-Tianjin-Hebei region. Where the value of G is between 0 and 1. If the average value of G is closer to 0, the industrial distribution will be more balanced. If the average value of G is closer to 1, the greater the imbalance will be, that is to say, the stronger the industrial agglomeration degree. Specific calculation results are shown in the following Table 2:
After calculation, the equilibrium degree of spatial distribution of high haze pollution industries in the Beijing-Tianjin-Hebei region can be obtained as follows: The spatial Gini coefficient of sales value of high haze pollution industries dropped from 0.60280 in 2000 to 0.41383 in 2003, continued to rise after 2003, but did not exceed 0.5, indicating that the spatial distribution of high haze pollution industries in the Beijing-Tianjin-Hebei region presented a low degree of aggregation trend with the promotion of its coordinated development.
Classified by industry, the spatial Gini coefficient of sales value of manufacture of non-metallic mineral products, chemical raw materials and chemical products industry petroleum processing and coking processing industry and ferrous metal smelting and rolling processing industry decreased by 0.24, 0.40, 0.22 and 0.13, respectively, and the distribution equilibrium was significantly improved. In other words, the concentration degree was reduced. The agglomeration degree of non-ferrous metal smelting and rolling processing industry decreased slightly and spread to some extent. At the same time, the electricity, heat production and supply industry showed a rise in clusters. The decline of the Gini coefficient of the petrochemical industry is inseparable from the industrial structure adjustment with the coordinated development of the Beijing-Tianjin-Hebei region. Large numbers of enterprises related to petroleum coking, chemical fertilizer, and pharmaceutical moved from Beijing to Tianjin, Shijiazhuang, Baoding, Cangzhou, Langfang, and other regions outside the Beijing-Tianjin-Hebei region. These companies shifted all things linked to their production technology research and development, industrial matching and manufacturing to Tianjin and Hebei, while their main R&D center continued to be stationed in Beijing. This transfer path was bound to change the spatial distribution of a large number of traditional heavy industries, thus advancing their balanced distribution and avoiding the formation of new large-scale agglomeration. As for the spatial change of petrochemical industry, each region needed to design a transfer plan and linkage plan to prevent the restructuring and vicious competition in the process of industrial development. The reduced Gini coefficient of manufacture of non-metallic mineral products was mainly caused by the low labor productivity of the industry. Under the trend of transformation of China’s economic development mode, high value-added industries gradually replace low value-added industries. The research results also verify that the Beijing-Tianjin-Hebei region has achieved fruitful results in the practice of restructuring and promoting transformation in recent years. Its success lies in not only realizing the extension of the industrial chain, but also realizing the industrial upgrading. The decline of Gini coefficient of ferrous metal smelting industry was also attributed to the industrial gradient transfer in the promotion of coordinated development in the Beijing-Tianjin-Hebei region, and this trend would be further strengthened. On the other hand, thanks to Beijing-Tianjin-Hebei’s efforts to accelerate the withdrawal of excess capacity and promote the conversion of industrial structure from heavy to light [62], from 2013 to 2018, Hebei Province reduced and withdrew a total of 82.23 million tons of steelmaking capacity, 75.29 million tons of ironmaking capacity, 58.17 million tons of coal, 73.7 million tons of cement and 79.83 million tons of weight boxes of flat glass, outperforming the national task of cutting over-capacity. Baoding steel production capacity has been completely withdrawn. Langfang’s three steel enterprises has been shut down, only one left. Qinhuangdao, Chengde witnessed a significant reduction in steel production capacity within the city. The concentration increase of power and thermal industry mainly resulted from the fact that the Beijing-Tianjin-Hebei region is one of the most important energy consumption centers in China. In recent years, Beijing-Tianjin-Hebei have gradually reached a consensus on the coordinated mode of division of labor and integrated development, and explored and further promoted the fields referring to the power and thermal industry. In promoting China’s backbone power facilities supporting the integrated construction of power grid, the three provinces and their cities have jointly designed and built three national and regional key uHV power transmission speed regulation lines starting from Ximeng, across Beijing, Shandong, Mengxi to South Tianjin, increasing the proportion of external high voltage speed regulation transmission; the construction of 500kv backbone power transmission network in the above three provinces was further jointly strengthened, thus optimizing the network structure of their backbone power grid network and distribution of power substation, and accelerating the formation of national integrated large-scale backbone transmission network system and network frame organization structure with the ring network construction of Beijing and Tianjin at its main core, and Beijing, Tianjin, and Hebei as the support. This plan will further improve the gathering power and thermal industries in the Beijing-Tianjin-Hebei region. Therefore, Hypotheses 3 and 4 are verified.

4.4. Analysis of Specialization Degree of High Haze Pollution Industries

Regional production specialization mainly refers to a manifestation that enterprises highly concentrated on the production space. Generally, it infers the rule of laborers and regional division of labor, uses certain specific industries or the specific advantages of product R&D and manufacture in certain specific regions, develops them in a large-scale and concentrated way, then outputs them to the outside so as to pursue the maximum economic benefits. The location entropy index, also known as the location specialization rate, is often used in regional economics to measure and evaluate whether a certain industry has established a regional specialization unit. Location entropy can be intuitively understood as the absolute ratio of the market share of an industry in a region to that of an industry in the economic system. Its calculation formula is
L Q i j = q i j q j q i q
where L Q i j is the national location entropy of i industry in j region and q i j is related indicators of i industry in j region (such as output value and employment number, etc.); q j is related indicators of all industries in j region; q i is relevant indicators of i industry nationwide; q is the relevant index of all industries in China. When the location entropy index observed is greater than 1, we can say i industry is a specialized department in j region. When the location entropy index observed is greater than 1.5, we will think the specialized industry in the observed region should have quite obvious comparative advantages. if the location entropy index observed is less than or equal to 1, we may consider that the specialized industry should be a general sector or a self-supporting sector, without such comparative advantages. According to the output value arising from collective data of high haze pollution industries in the Beijing-Tianjin-Hebei region from 2000 to 2017, the paper calculated their location entropy indexes, which are shown in the following Table 3.
In addition to the electricity, heat production and supply industry in Beijing, the specialization degree in five other kinds of high haze pollution industries tended to decline, because Beijing, the national science and technology innovation center, was phasing out manpower intensive enterprises with high energy consumption and high pollution, and shifted to the development of high technology industry, basically realizing the transformation and upgrading of the manufacturing technology and completing the layout of emerging industries led by modern manufacturing. Except for manufacture of non-metallic mineral products, power and thermal industry, the relative specialization degrees of high haze pollution industries in Tianjin were higher in the region, and demonstrated a rising trend, illustrating that the diversification degree of high haze pollution industries in Tianjin was upgrading, various departments within the region all had a relatively balanced, rapid growth. The specialization degrees in Tangshan, Cangzhou, Baoding, Langfang were high but showed a declining trend. The economic development of these regions mainly depended on the traditional advantage industries. The key to the development of these areas is to further optimize the industrial structure, improve the level of industrial technology and added value, and realize relative industrial agglomeration by connecting with the surrounding areas; In contrast, The specialization indexes of high haze pollution industries in Xingtai, Qinhuangdao, Chengde, and Handan were lower and grew slowly. Taking the small production value into consideration, it could be seen that the overall development of high haze pollution industries in these areas lagged behind, and the driving ability of dominant industries was insufficient. In the future, leading industries with regional characteristics should be chosen to support in accordance with the overall regional planning and the actual situation, thus forming joint and interactive industrial development with surrounding areas so as to realize the overall economic development of the region.
As for core areas, advantage industries in Beijing principally consist of transportation, pharmaceutical, instrument and meter manufacturing, electronic equipment manufacturing, and power and thermal industry. The above first four industries belong to high-tech industry, which verifies the conclusion of the analysis mentioned above that Beijing has realized its manufacturing industry transformation and development led by high-end manufacturing. Tianjin’s manufacturing industries with comparative advantages include light industry, traditional heavy industries, such as chemical industry and metal smelting, and high-tech manufacturing, such as communication manufacturing, showing a diversified development trend. As an important industrial town in Northern China, Tangshan enjoyed obvious advantages in ferrous metal smelting and processing industry and metal products industry, playing the leading role in the region, even in China.
The dominant industries in the area around Beijing and Tianjin were agricultural products, food processing, textile and clothing, paper making, chemical industry, gold smelting and equipment manufacturing. The dominant industries paid more attention to light industry and traditional heavy industry, and their industrial structures are highly similar to each other. The dominant industries in Baoding were transportation and electrical machinery manufacturing, while Langfang’s chemical industry and general equipment manufacturing also had the foundation to undertake high-end manufacturing from Beijing and Tianjin. Cangzhou, Zhangjiakou highlighted their heavy industries, such as oil processing coking industry and metal smelting; The manufacturing industry in Chengde and Qinhuangdao mainly concentrated on food and beverage processing and manufacturing, while their manufacturing base was the weakest.
In South Hebei regions, Shijiazhuang, a city that functioned as an important node, has many advantage industries, mainly including agricultural food production and processing, textile industry, services, products and textile apparel industry, the production and manufacturing of chemical raw materials and biochemical products, pharmaceutical manufacturing and manufacture of non-metallic mineral products. Among them, pharmaceutical manufacturing does not belong to traditional industries. Their industrial structures are similar to those in Hengshui, Xingtai, and Handan, which makes the surrounding industrial elements flow toward the center and forms polarization effect. In addition to food processing and textile industry, alcoholic beverage manufacturing in Hengshui, coking industry in Xingtai, and steel smelting and processing in Handan are also involved in highly specialized industries.

5. Conclusions and Policy Recommendations

5.1. Conclusions

The variation of sales value, structural characteristics, and spatial distribution trend of high haze pollution industries in the region are obtained by means of analyzing the panel data of 13 cities in the Beijing-Tianjin-Hebei region from 2006 to 2017. It creatively and scientifically divides high haze pollution industries, and comprehensively analyzes the spatial distribution characteristics of high haze pollution industries in the Beijing-Tianjin-Hebei region. The main conclusions are as follows:
  • Power, steel, cement, and petrochemical are industries with high haze pollution. The article clarifies the classification method of high haze pollution industries by combing the literature, mainly based on the pollution cost, pollution emission intensity, pollution emission scale, and pollution intensity index. On the basis of existing literature research, the paper selects the pollution intensity index method combining the intensity and scale of pollution emission as the method to identify the high haze pollution industries. Finally, through calculation, it is concluded that power, steel, cement, and petrochemical are high haze pollution industries and have a great impact on atmospheric environment pollution;
  • Among the high haze pollution industries in the Beijing-Tianjin-Hebei region, the differences in proportions of various industries vary greatly, among which the ferrous metal smelting and rolling processing industry accounted for the highest percentage, especially in Hebei Province where the industry occupied more than 42.53% yearly. Referring to Beijing, the output value of most industries showed negative growth or the growth rate showed a downward trend, while industries gaining relatively fast growth were electricity, power, gas, and water. This reflects that the Beijing Municipal Government, while increasing environmental regulation and relieving non-capital functions, pays more attention to the realization of the objectives related to the improvement of people’s livelihood in the adjustment of industrial structure planning;
  • The power and thermal industry is highly concentrated in Beijing-Tianjin-Hebei, but its spatial distribution is uneven. The concentration of power and heat production and supply industries has gradually increased, mainly because Beijing Tianjin Hebei region is one of the important energy consumption centers in China. In recent years, Beijing-Tianjin-Hebei has gradually reached a consensus on the coordination mode of division of labor and integrated development and has begun to explore and further promote the fields involved in the power and thermal industries. They have also spared no effort to promote the construction of the integration of China’s backbone power facilities and supporting power grids, further improving the concentration of the power and thermal industries in Beijing-Tianjin-Hebei;
  • Although the sales output value of high haze pollution industries in the Beijing-Tianjin-Hebei region has grown rapidly, it is still slightly lower than the average annual growth rate (28.59%) of all industrial sales value in the region during the same period. It shows that since the “Eleventh Five-Year Plan”, under the rigid constraints of the central government’s strong promotion of “energy saving and emission reduction”, the development scale of high haze pollution industries has been effectively controlled;
  • There are significant differences in the spatial distribution of industries with high haze pollution in the Beijing-Tianjin-Hebei region. Beijing is positioned as the four centers of politics, culture, international exchange and technological innovation. The relocation of industries with high smog pollution is an inevitable trend, and the surrounding cities in Hebei Province will undoubtedly become the main undertakers. Although the regional average concentration rate of high smog pollution industries in Tianjin has always been high, it has entered the late stage of industrialization, the manufacturing industry is gradually developing toward the high-end, and the backward production capacity of some industries will also be forced to relocate.

5.2. Suggestions

  • Focus on key industries and scientifically control haze
Haze pollution is the most important kind of ecological environment pollution at present. It not only affects people’s daily travel but also harms people’s health. In order to solve the current situation of haze pollution in Beijing, Tianjin, and Hebei, we must first grasp the key industries and find the root causes of haze pollution. Through calculation, the paper defines power, thermal production and supply industry, ferrous metal smelting and rolling processing industry, chemical raw material manufacturing industry, petroleum processing, and coking industry, non-metallic mineral products industry, and non-ferrous metal smelting and rolling processing industry as high haze pollution industries, and regards the above six industries as key industries for haze pollution control. Moreover, it is even more important to clarify the pollution mechanism of smog. It is necessary to analyze the haze pollution from the root, find the main pollution emissions of various haze pollution industries, and analyze the formation process of pollution emissions in the atmosphere. Not only that, but it is also necessary to find out which production link of each haze pollution industry has discharged pollutants, so as to carry out the targeted treatment. On the basis of clarifying the haze pollution mechanism, the governments of Beijing, Tianjin, and Hebei regions should formulate accurate and effective measures to control haze pollution, increase the capital investment in the prevention and control of atmospheric environment pollution, promote green development of the industry, solve the problem of atmospheric environment pollution from the root, inhibit the development of high haze pollution industries, promote the green development of the industry, and reduce the pollution of high haze pollution industries to the atmospheric environment.
2.
Reasonable division of labor to promote the coordinated development of industries
At present, the spatial division of labor in various areas of the Beijing-Tianjin-Hebei region has been continuously optimized. The functional division of counties and cities affiliated with Beijing-Tianjin-Hebei is becoming increasingly obvious. It also forms a concentration trend of industrial structure and effective restructuring and transformation under coordinated development. However, the industrial restructuring is affected by the inconsistent economic development level in Beijing-Tianjin-Hebei, resulting in different choices of leading industries. With the advancement of the coordinated development of the Beijing-Tianjin-Hebei region, its complementarity of the industrial structure gradient has increased. As China’s political center, Beijing should focus on high-end service industries. Tianjin has a strong industrial base and should seize the great opportunity of industrial transformation and upgrading to realize the high-end development of traditional industries. Meanwhile, the selection of leading industries in the region cannot be spoiled by excessive enthusiasm. Once the industrial policy is separated from the law of economic development, it will lose efficiency. Due to the worst economic development level in the Beijing-Tianjin-Hebei region, Hebei Province cannot blindly pursue high-end industries. The key is to find suitable industries, combined with their own resources and environmental endowment advantages and actively integrate into the collaborative development of the Beijing-Tianjin-Hebei manufacturing industry to proactively undertake the transfer of Beijing’s high haze pollution industries and smoothly further the process of industrialization.
3.
Unified planning to give full play to the advantages of industry clusters
The agglomeration of high haze pollution industries can form scale advantages, bring into play the radiation effect and the driving effect of economic agglomeration and narrow the regional development gap [63], promoting information exchange. The Beijing-Tianjin-Hebei Coordinated Development Guideline points out that the spatial layout of Beijing-Tianjin-Hebei is “one core, two cities, three axes, four districts and multiple nodes” of which the four districts are the central core function district, the eastern coastal development district, the southern function expansion district, and the northwestern ecological conservation district. This means that high haze pollution industries in the transfer development process need to be consistent with the regional functional planning. Chengde, Zhangjiakou, Baoding, and Langfang, as Beijing-Tianjin-Hebei peripheral areas, are not suitable for the development of high-pollution, high-consumption heavy industry; Tangshan, Qinhuangdao, and Cangzhou belonging to the Eastern coast of Hebei can take their own advantages of developing coastal economy; Shijiazhuang, Hengshui, Xingtai, and Handan belonging to South Hebei regions, are the main resource supply area for manufacturing development. At present, instrumentation, crafts, automotive, pharmaceutical manufacturing in Beijing; communication equipment and computers, general equipment, and non-ferrous metal smelting and rolling processing industry in Tianjin; textile and chemical fiber in Baoding; plastic and rubber products in Hengshui; leather and fur in Shijiazhuang; ferrous metal smelting and rolling processing industry in Tangshan; wood processing and furniture manufacturing in Langfang; chemical raw materials in Cangzhou; agricultural products processing in Zhangjiakou, etc. have shown a clear trend of regional agglomeration, requiring further classification to promote the formation of industrial layout in the Beijing-Tianjin-Hebei region with distinctive features and reasonable division of labor.
4.
Innovative development to promote industrial transformation and upgrading
Give full play to the important leading role of innovation and independent entrepreneurship in promoting industrial transformation and upgrading, and promote the structural transformation and upgrading of high haze pollution industries on the fundamental basis of improving the innovation capability and level of enterprises. First, increase investment in scientific and technological innovation and increase the intensity of R & D investment. There is an obvious gradient difference in innovation investment within Beijing, Tianjin, and Hebei. It is very important to increase the investment in science and technology, especially in Tianjin and Hebei, and take abundant capital and human capital as a solid foundation for technological innovation. Second, the development of innovation and upgrading of science and technology industries must be accelerated continuously. We should make full use of the comprehensive advantages of Beijing’s talents, technology, information, and capital, attract outstanding talents, capital and technology, and vigorously support, and develop the high-tech equipment industry so that the development of the capital area becomes a powerful source for the development of independent innovation in the economic circle involving three metropolises—Beijing-Tianjin-Hebei and large urban clusters. Third, enterprises should continuously strengthen the efficient and comprehensive transformation and application of national scientific and technological achievements, fully leverage the modern characteristic industrial technology base and natural resource allocation advantages in Beijing to develop new general information and electronic technologies, accelerate the industrialization of advanced scientific and technological achievements, and promote the transformation and application of advanced scientific and technological achievements. Tianjin should be committed to building a national advanced manufacturing R&D base and a strategic emerging industry system led by artificial intelligence, focusing on developing a series of key common technologies to enhance Tianjin’s industrial development. Hebei Province should focus on developing environment-friendly high-end industries and building a modern industrial system. Based on the development of the manufacturing industry, it should improve product quality and reduce energy consumption in production through scientific and technological innovation, to promote the transformation of the overall regional economic growth from “quantity-led” to “quality-driven” and to improve the total factor green productivity [64].
5.
Guiding industrial transfer in an orderly manner with complementary advantages
First of all, the self-purifying capacity level should be classified. The self-purifying ecological environment can effectively dilute or directly remove various pollutants in the outdoor atmospheric environment. Therefore, in the process of industry transfer, environmental factors should be fully considered in addition to the factors of industrial pollutant emission. Based on the collected data, the self-purifying capacity index in the atmospheric environment of different regions is calculated and classified. According to the characteristics of different self-purifying capacity levels, the basic processes of industrial planning, such as location analysis, swot analysis, analysis of regional natural resource status, and investigation of industrial development status, are applied to analyze the environmental impact mechanisms and effects of different types of air pollution industries, such as thermal power, iron, and steel, heat, cement, petrochemical, metal smelting, glass, etc., and to formulate the development planning of high haze pollution industries from the perspective of spatial distribution. Second, plans relevant to industrial transfer programs should be designed. For air pollution industries with relatively low economic status, appropriate preferential policies should be taken to enhance technological innovation and environmental protection supervision: reduce the environmental pollution degree of industries with a relatively higher economic dominant position, improve the overall environmental level of the Beijing-Tianjin-Hebei region. At the same time, we should apply the undertaking ability of high haze pollution industries and industrial gradient coefficient to select the undertaking place of related industries, and the undertaking place should confirm whether to undertake according to its own location advantage, resource environment, and demand response. In addition, in the construction of a gradient transfer control system for high haze pollution industries, based on the hierarchical differences in the self-purifying capacities of the regional atmospheric environment, in line with the national regional industrial development strategy, incremental resources for emerging industries should be arranged in a scientific manner, stock resources of high haze pollution industries should be effectively deployed and the reward and punishment mechanism for the gradient transfer of pollution industries should be enhanced from the support of land, taxation, and finance.

5.3. Research Prospects

In the paper, the research data are mainly from statistical yearbooks and environmental bulletins, and the timeliness of the data will be lacking; moreover, after the pollutants are discharged, the diffusion range is large, and there are uncertainties in the way and direction of diffusion. The distance between Beijing-Tianjin-Hebei cities is relatively short, and the pollutants between cities will affect each other, and complex influencing factors will have a certain impact on the data; in addition, this data mainly uses urban data, probably ignoring suburban and rural areas. A variety of factors affect the accuracy and validity of the research results. In future research, in order to obtain more accurate and effective data for research and analysis, the data from statistical yearbooks, environmental bulletins, weather stations, and environmental monitoring stations can be referenced at the same time to extract high-quality data. When establishing the model, more relevant factors are included to improve the practical reference significance of the results, and more research samples are selected and revised according to the actual situation to more accurately analyze the spatial distribution characteristics of different industries.

Author Contributions

Conceptualization, J.Z. and Y.L.; methodology, J.Z.; software, Y.L.; validation, J.Z. and Y.L.; formal analysis, Y.L.; investigation, Y.L.; resources, J.Z.; data curation, J.Z.; writing—original draft preparation, J.Z.; writing—review and editing, Y.L.; visualization, Y.L.; supervision, J.Z.; project administration, J.Z.; funding acquisition, J.Z. All authors have read and agreed to the published version of the manuscript.

Funding

This research was funded by “The Ministry of Education Humanities and Social Sciences Planning Fund Project”, grant number “18YJA630154” and “Special Project of Energy Conservation, Environmental Protection” and “Haze Control by Science and Technology of Key Technology R&D Program in Hebei Province”, grant number “18273715D”.

Data Availability Statement

Not applicable.

Acknowledgments

Thank Zhou Jingkun’s graduate student Ren Qian for participating in data collection and paper writing.

Conflicts of Interest

The authors declare no conflict of interest.

References

  1. Yao, X. Influence of Industrial Spatial Distribution Characteristics on Air Quality; Guangdong University of Foreign Studies: Guangzhou, China, 2018. [Google Scholar]
  2. Zhang, L.; Guo, X.; Zhao, T.; Gong, S.; Xu, X.; Li, Y.; Luo, L.; Gui, K.; Wang, H.; Zheng, Y.; et al. A Modelling Study of the Terrain Effects on Haze Pollution in the Sichuan Basin. Atmos. Environ. 2019, 196, 77–85. [Google Scholar] [CrossRef]
  3. Liu, D.; Yan, W.; Kang, Z.; Liu, A.; Zhu, Y. Boundary-Layer Features and Regional Transport Process of an Extreme Haze Pollution Event in Nanjing, China. Atmos. Pollut. Res. 2018, 9, 1088–1099. [Google Scholar] [CrossRef]
  4. Ministry of Ecology and Environment of the People’s Republic of China. Bulletin on the State of China’s Ecological Environment in 2019; Ministry of Ecology and Environment of the People’s Republic of China: Beijing, China, 2020. Available online: https://www.mee.gov.cn/hjzl/sthjzk/zghjzkgb/202006/P020200602509464172096.pdf (accessed on 28 August 2022).
  5. Guo, M.; Yang, H. 2019 energy and environment development situation and 2020 outlook. China Energy 2020, 42, 8–41+8+13. [Google Scholar]
  6. Wang, Y.; Zhang, J.; Wang, L.; Hu, B.; Tang, G.; Liu, Z.; Sun, Y.; Ji, D. Significance, Status Quo and Prospects of Research on Atmospheric Haze Pollution in Beijing-Tianjin-Hebei Region. Adv. Earth Sci. 2014, 29, 388–396. [Google Scholar]
  7. Kong, Q. Research on Industrial Agglomeration Factors of Regional Differences in Environmental Pollution in China; Lanzhou University: Lanzhou, China, 2021. [Google Scholar]
  8. Hou, J.; Dong, Y.; Chen, J. Smog pollution, environmental regulation and regional high-quality development. Environ. Econ. Res. 2020, 5, 37–55. [Google Scholar]
  9. Zhao, Y. Study on the influencing factors of air pollution in Beijing-Tianjin-Hebei. Resour. Conserv. Environ. Prot. 2020, 11, 39–40. [Google Scholar]
  10. Zhang, X.; Sun, J. Thoughts on the causes of haze in China and its governance. Chin. Sci. 2013, 58, 1178–1187. [Google Scholar]
  11. Cheng, R. Research on the causes and hazards of urban haze and countermeasures for its management. Environ. Sci. Manag. 2022, 47, 61–65. [Google Scholar]
  12. Dou, Y.; Dan, L.; Hu, B.; Shi, J. Characteristics and causes of climate change in Beijing-Tianjin-Hebei under the influence of haze weather. China Environ. Sci. 2019, 39, 60–67. [Google Scholar]
  13. Yu, D.; Xu, M.; Yao, H.; Sui, J.; Liu, X.; Yu, Y.; Cao, Q. Use of elemental size distributions in identifying particle formation modes. Proc. Combust. Inst. 2007, 31, 1921–1928. [Google Scholar] [CrossRef]
  14. Xia, Y.; Wu, J.; Yang, S.; Yu, D.; Xu, M. Research progress on the effect of pollutant removal equipment on PM2.5 emissions from coal-fired power plants. J. Coal 2021, 46, 3645–3656. [Google Scholar]
  15. Zhang, P.; Yu, D.; Luo, G.; Yao, H. Temperature effect on central-mode particle formation in combustion of coals with different mineral compositions. Energy Fuels 2015, 29, 5245–5252. [Google Scholar] [CrossRef]
  16. Neville, M.; Quann, R.J.; Haynes, B.S.; Sarofim, A.F. Vaporization and condensation of mineral matter during pulverized coal combustion. Symp. (Int.) Combust. 1981, 18, 1267–1274. [Google Scholar] [CrossRef]
  17. Quann, R.J.; Sarofim, A.F. Vaporization of refractory oxides during pulverized coal combustion. Symp. Combust. 1982, 19, 1429–1440. [Google Scholar] [CrossRef]
  18. Christensen, K.; Livbjerg, H. A plug flow model for chemical reactions and aerosol nucleation and growth in an alkali-containing flue gas. Aerosol Sci. Technol. 2000, 33, 470–489. [Google Scholar] [CrossRef]
  19. Zhang, N. A brief discussion on the hazards and prevention of haze. Energy Energy Conserv. 2020, 2, 71–72. [Google Scholar]
  20. Zhou, Y.; Jiang, Z.; Peng, Y. Feasibility analysis of artificially influenced weather to reduce haze. Energy Energy Conserv. 2020, 6, 78–80. [Google Scholar]
  21. Sun, Y. Analysis of air pollution prevention and control points in environmental protection engineering. Resour. Conserv. Environ. Prot. 2022, 4, 58–61. [Google Scholar]
  22. Zhang, L.; Ma, J. Analysis of factors influencing the monitoring of low-concentration particle in stationary source exhaust gas. Energy Environ. Prot. 2019, 33, 56–60+64. [Google Scholar]
  23. Li, S.; Sun, H.; Gao, S.; Zou, B.; Lu, S.; Zhao, D. Analysis of the relationship between volatile organic compounds and ozone and secondary organic aerosols in ambient air in petrochemical enterprises. Chem. Prog. 2018, 37, 2023–2028. [Google Scholar]
  24. Zhang, R.; Yang, Y. Experimental study of VOCs treatment in petrochemical enterprises by combustion method. Energy Environ. Prot. 2020, 34, 53–56. [Google Scholar]
  25. Sun, S.; Ma, S.; Yang, B.; Wang, J.; Cui, R. Experimental study on the removal of nitrogen oxides from coal combustion flue gas by gas-like phase ClO2. J. Coal 2020, 45, 3600–3606. [Google Scholar]
  26. Yang, Y. Nitrogen oxide emission reduction and SCR flue gas denitrification technology in thermal power plants. Energy Environ. Prot. 2017, 31, 31–35+39. [Google Scholar]
  27. Tang, J.; Yang, J.; Chen, O.; Yue, G. Excessive ammonia escape as another cause of aggravating atmospheric haze. China Energy 2020, 42, 39–41. [Google Scholar]
  28. Qin, B.; Ge, L. Relative environmental regulation, transfer of highly polluting industries and pollution agglomeration. China Popul. Resour. Environ. 2018, 28, 52–62. [Google Scholar]
  29. Tobey, J. The Effects of Domestic Environmental Policies on Patterns of World Trade: An Empirical Test. Kyklos 1990, 43, 191–209. [Google Scholar] [CrossRef]
  30. Lucas, R.; Wheeler, D.; Hemamala, H. Economic Development, Environmental Regulation, and the International Migration of Toxic Industrial Pollution 1960–1988; World Bank Working Paper; The World Bank: Washington, DC, USA, 1992; Volume 1062. [Google Scholar]
  31. Randy, B.; Henderson, V. Effects of Air Quality Regulations on Polluting Industries. J. Political Econ. 2000, 18, 379–421. [Google Scholar]
  32. Clark, P.; Evans, F. Distance to nearest neighbour as ameasure of spatial relationships in populations. Ecology 1954, 35, 445–453. [Google Scholar] [CrossRef]
  33. Wu, Y.; Ni, X.; Ma, R.; Zhang, W. Spatial distribution and linkage characteristics of Shanghai’s industrial tourism resources. Resour. Sci. 2015, 37, 2362–2370. [Google Scholar]
  34. Zhao, H.; Wang, J. Spatial distribution characteristics and influencing factors of national all-for-one tourism demonstration areas. Resour. Environ. Arid Areas 2017, 31, 177–182. [Google Scholar]
  35. Duyckaerts, C.; Godefroy, G. Voronoi tessellation to study the numerical density and the spatial distribution of neurones. J. Chem. Neuroanat. 2000, 20, 83–92. [Google Scholar] [CrossRef]
  36. Ba, D.; Wang, R.; Xia, B. Research on the Spatial Distribution of Ethnic Tourism Resources in Gansu Province. Reg. Res. Dev. 2013, 32, 77–82. [Google Scholar]
  37. Han, J.; Song, B. Analysis of Spatial Distribution Characteristics of Water Conservancy Scenic Areas in Shaanxi Province and Construction of Spatial System of Water Conservancy Tourism. Econ. Geogr. 2014, 34, 166–172. [Google Scholar]
  38. Berke, O. Exploratory disease mapping: Kriging the spatial risk function from regional count data. Int. J. Health Geogr. 2004, 3, 18. [Google Scholar] [CrossRef] [PubMed]
  39. Chen, P.; Yang, X.; Du, M. Research on the Spatial Distribution Characteristics of China’s National Eco-tourism Demonstration Areas. Ecol. Econ. 2018, 34, 132–136. [Google Scholar]
  40. Li, Y. An empirical study on the measurement of industrial agglomeration level in the western region. Nankai Econ. Res. 2009, 4, 144–151. [Google Scholar]
  41. Zhou, S.; Jiang, M.; Wu, L. Analysis of Spatial Distribution Characteristics of Cultural Industry in Beijing Urban Area. J. Beijing Norm. Univ. 2006, 6, 127–133. [Google Scholar]
  42. Li, B.; Yin, S.; Liu, P.; Dou, Y. Analysis of Spatial Distribution Characteristics and Influencing Factors of Traditional Villages in Hunan Province. Econ. Geogr. 2015, 35, 189–194. [Google Scholar]
  43. Yang, X.; Song, L.; Zhong, Y.; Wang, D. Research on Spatial Distribution Characteristics and Influencing Factors of Wellness Tourism Resources in Fujian Province. J. Fujian Norm. Univ. (Nat. Sci. Ed.) 2019, 35, 106–116. [Google Scholar]
  44. Mani, M.; Wheeler, D. In Search of Pollution Havens? Dirty Industry Migration in the World Economy 1960–1995. J. Environ. Dev. A Rev. Int. Policy 1998, 7, 215–247. [Google Scholar]
  45. Zhao, X. Environmental Protection and Industrial International Competitiveness: Theoretical and Empirical Analysis; China Social Sciences Press: Beijing, China, 2003. [Google Scholar]
  46. Liu, Q.; Wang, Q.; Li, P. China’s pollution-intensive industries and their regional distribution trends. Ecol. Econ. 2012, 28, 107–112. [Google Scholar]
  47. Qiu, F.; Jiang, T.; Zhang, C.; Shan, Y. Spatial transfer and influencing factors of pollution-intensive industries in Jiangsu Province. Geogr. Sci. 2013, 33, 789–796. [Google Scholar]
  48. National Bureau of Statistics of the People’s Republic of China. China Statistical Yearbook 2013; China Statistics Press: Beijing, China, 2014. Available online: http://www.stats.gov.cn/tjsj/ndsj/2013/indexch.htm (accessed on 28 August 2022).
  49. People’s Government of Hebei Province. Hebei Economic Yearbook 2007–2013; China Statistics Press: Beijing, China, 2013.
  50. Hebei Provincial Bureau of Statistics in China. From January to December 2021, the Main Economic Benefit Indicators of Industries above Designated Size in the Province; Hebei Provincial Bureau of Statistics in China: Shijiazhuang, China, 2022. Available online: http://tjj.hebei.gov.cn/hetj/tjsj/zxshuju/ (accessed on 28 August 2022).
  51. Zhu, L. Comparative Research on the Competitiveness of Beijing-Tianjin-Hebei Power Generation Industry Based on PPM-Coupling Theory; North China Electric Power University: Beijing, China, 2020. [Google Scholar]
  52. Xie, Z.; Zhang, J.; Zhang, X. Status Quo, Changes and Spatial Capital Flow of Beijing-Tianjin-Hebei Industrial Structure: Evidence from Industrial and Commercial Registration Data. Popul. Dev. 2015, 21, 24–33. [Google Scholar]
  53. Yang, S.; Dong, B. Spatial distribution and agglomeration trend of manufacturing industries in Beijing-Tianjin-Hebei. J. Shijiazhuang Railw. Univ. 2017, 11, 7–13. [Google Scholar]
  54. Chen, X. Functional orientation of industrial development in Beijing-Tianjin-Hebei and spatial distribution of industrial clusters. J. Hebei Univ. Econ. Bus. 2005, 6, 49–56. [Google Scholar]
  55. Low, P.; Yeat, A. Do Dirty Industries Migrate? International Trade and the Environment; Word Bank Discussion Papers; The World Bank: Washington, DC, USA, 1992; Volume 159. [Google Scholar]
  56. Bartik, T. The Effects of Environmental Regulation on Business Location in the United States. Growth Chang. 1988, 19, 22–44. [Google Scholar] [CrossRef]
  57. Wang, H. Research on Beijing-Tianjin-Hebei Industrial Association and Spatial Distribution; Beijing University of Posts and Telecommunications: Beijing, China, 2017. [Google Scholar]
  58. Li, L. Research on the Industrial Correlation and Spatial Distribution of Science and Technology Service Industry in Henan Province; Henan University of Economics and Law: Zhengzhou, China, 2020. [Google Scholar]
  59. Wang, X. Research on the Spatial Distribution and Influencing Factors of Pollution-Intensive Industries in China; Jilin University: Changchun, China, 2019. [Google Scholar]
  60. Wei, H.; Mao, X.; Li, Y. Research on the Spatial Distribution and Location Layout Countermeasures of China’s Sports Industry. J. Beijing Sport Univ. 2019, 42, 29–39. [Google Scholar]
  61. China’s Economic and Social Big Data Research Platform. China Industrial Statistical Yearbook; China Statistics Press: Beijing, China, 2022; Available online: https://data.cnki.net/yearbook/Single/N2022010304 (accessed on 28 August 2022).
  62. Yue, H.; Zheng, Y.; Ma, G. Effectiveness, problems and policy suggestions for the coordinated development of Beijing-Tianjin-Hebei industries: Based on the perspective of industrial electricity consumption. China Energy 2020, 42, 32–36+16. [Google Scholar]
  63. Zhu, D.; Li, H. Environmental effects of industrial agglomeration in China and its mechanism of action. China Popul. Resour. Environ. 2021, 31, 62–70. [Google Scholar]
  64. Wang, H.; Xie, Y.; Zhang, C.; Sun, J. The agglomeration and evolution characteristics and synergistic factors of air pollution in Beijing-Tianjin-Hebei and surrounding areas from a dynamic spatial perspective. China Popul. Resour. Environ. 2021, 31, 52–65. [Google Scholar]
Figure 1. Spatial Quantile-Quantile Plot of sales value in Beijing-Tianjin-Hebei high haze pollution industries.
Energies 15 06610 g001
Table 1. Haze pollution index of each industry in 2009–2015.
Industry Name2009201120132015
Coal mining and washing industry2.321.131.291.12
Oil and gas mining industry1.921.361.201.77
Ferrous metal mining and processing industry4.944.724.894.27
Non-ferrous metal mining and processing industry1.460.460.621.74
Non-metallic mining and processing industry4.371.842.172.12
Other mining industry11.795.4515.769.26
Agricultural and sideline product processing industry2.662.532.141.93
Food manufacturing industry5.012.332.281.61
Beverage manufacturing industry3.492.532.102.04
Tobacco products industry1.250.900.780.70
Textile industry2.802.381.551.32
Textile garments, shoes, hats manufacturing industry0.180.540.020.06
Leather, fur, and feathers (down) and its products industry0.640.500.260.25
Wood processing and wood, bamboo, rattan, palm, and grass products industry4.855.953.676.02
Furniture manufacturing0.510.751.270.44
Paper and paper products industry10.6020.227.626.96
Printing industry and reproduction of recording media1.661.250.530.49
Education and sports goods manufacturing industry1.240.360.120.12
Petroleum processing, coking, and nuclear fuel processing industry13.9311.6411.0711.05
Chemical raw materials and chemical products industry15.2412.8712.5413.20
Pharmaceutical manufacturing industry1.883.471.442.51
Chemical fiber manufacturing industry10.833.934.303.64
Rubber and plastic products industry1.833.392.512.47
Manufacture of non-metallic mineral products64.3766.8458.9652.47
Ferrous metal smelting and rolling processing industry64.2770.4568.7166.94
Non-ferrous metal smelting and rolling processing industry17.6617.4017.3918.73
Metal products industry1.926.283.303.33
General equipment manufacturing1.340.680.520.73
Special equipment manufacturing industry4.211.910.660.34
Transportation equipment manufacturing industry4.932.652.462.45
Electrical machinery and equipment manufacturing industry0.610.530.921.07
Communication computer and other electronic equipment manufacturing industry1.912.362.392.78
Other manufacturing industry8.506.114.7428.47
Waste resources and waste materials recycling industry0.471.181.301.52
Electricity, heat production and supply industry100.0095.61102.3288.66
Gas production and supply industry19.601.972.100.80
Water production and supply industry0.00−0.07−0.151.12
Table 2. Gini coefficient table of high haze pollution industries in the Beijing-Tianjin-Hebei region from 2000 to 2017.
YearSales value of High Haze Pollution Industries GiniYearSales Value of High Haze Pollution Industries Gini
20000.6028020090.46503
20010.4850020100.46946
20020.4169320110.47316
20030.4138320120.47625
20040.4233420130.47887
20050.4357220140.48112
20060.4450320150.48309
20070.4532820160.48486
20080.4597620170.48642
Table 3. Location entropy of electricity, heat production, and supply industry.
RegionIn 2000In 2005In 2010In 2015In 2017Mean Value
Beijing0.000082.140762.951933.235593.304762.326625
Tianjin0.401750.597750.478540.445870.438750.472532
Shijiazhuag3.251150.869580.682890.627840.615551.209402
Tangshan2.481270.552480.441870.408380.400130.856824
Langfang6.764370.916370.729520.677810.666501.950911
Zhangjiakou2.151011.685651.569171.540901.535621.696471
Baoding2.583651.911651.698171.633731.619511.889341
Chengde0.020740.740020.741910.740460.740220.596668
Cangzhou0.000390.484820.504120.509750.511190.402055
Hengshui0.920490.974471.030111.082261.099161.021299
Qinhuangdao2.178271.162120.955500.878940.860031.206972
Xingtai0.971020.992980.879710.845350.837750.905362
Handan2.351240.642290.504870.462890.453400.882939
Publisher’s Note: MDPI stays neutral with regard to jurisdictional claims in published maps and institutional affiliations.

