Article

Dynamic Modeling of CO2 Absorption Process Using Hollow-Fiber Membrane Contactor in MEA Solution

by
Alexandru-Constantin Bozonc
1,
Ana-Maria Cormos
1,*,
Simion Dragan
1,
Cristian Dinca
2 and
Calin-Cristian Cormos
1
1
Faculty of Chemistry and Chemical Engineering, Babeș-Bolyai University, Arany Janos 11, RO-400028 Cluj-Napoca, Romania
2
Faculty of Energy Engineering, University Politehnica Bucharest, Splaiul Independentei 313, Sector 6, RO-060042 Bucharest, Romania
*
Author to whom correspondence should be addressed.
Submission received: 8 July 2022 / Revised: 21 September 2022 / Accepted: 27 September 2022 / Published: 2 October 2022

Abstract

:
In this work, a comprehensive mathematical model was developed in order to evaluate the CO2 capture process in a microporous polypropylene hollow-fiber membrane countercurrent contactor, using monoethanolamine (MEA) as the chemical solvent. In terms of CO2 chemical absorption, the developed model showed excellent agreement with the experimental data published in the literature for a wide range of operating conditions (R2 > 0.96), 1–2.7 L/min gas flow rates and 10–30 L/h liquid flow rates. Based on developed model, the effects of the gas flow rate, aqueous liquid absorbents’ flow rate and also inlet CO2 concentration on the removal efficiency of CO2 were determined. The % removal of CO2 increased while increasing the MEA solution flow rate; 81% of CO2 was removed at the high flow rate. The CO2 removal efficiency decreased while increasing the gas flow rate, and the residence time in the hollow-fiber membrane contactors increased when the gas flow rate was lower, reaching 97% at a gas flow rate of 1 L‧min−1. However, the effect was more pronounced while operating at high gas flow rates. Additionally, the influence of momentous operational parameters such as the number of fibers and module length on the CO2 separation efficiency was evaluated. On this basis, the developed model was also used to evaluate CO2 capture process in hollow-fiber membrane contactors in a flexible operation scenario (with variation in operating conditions) in order to predict the process parameters (liquid and gaseous flows, composition of the streams, mass transfer area, mass transfer coefficient, etc.).

1. Introduction

The greenhouse effect is the overheating of the Earth’s surface and atmosphere, a phenomenon known as global warming [1]. The principal anthropogenic gas with a greenhouse effect is CO2, representing about 76% of total greenhouse gas emissions [2]. In order to achieve the target that was set at the Paris Climate Agreement [3], to limit the global temperature rise to 1.5 °C, the European goal is to eliminate the greenhouse gas emissions by 2050 [4]. One of the best solutions to reduce the CO2 emissions from the main sources is carbon capture [5].
The post-combustion process is the most feasible method of CO2 capture to implement in existing power plants, consisting in capturing the CO2 from flue gases obtained by burning fossil fuels [6]. The absorption processes for post-combustion CO2 capture are the most commonly applied technologies at the commercial scale, due to their lower costs and high efficiency (over 90% capture efficiency) compared with the other available technologies [7,8]. The absorption may be just physical, where the efficiency is based on the solubility of CO2 in the solvent at the work temperature and pressure, or it can include a chemical reaction to increase the CO2 capture efficiency [7]. Overall, the chemical absorption is used for CO2 capture from flue gas with low partial pressure in CO2, due to the high absorption capacity, even if the CO2 concentration in gas is low [9]. Is important that the chemical reaction that takes place in the absorber is reversible, so that the cost of the absorbent solution can be minimized by thermal regeneration; taking this into consideration, alkanolamine solutions are the most frequently used solvents [10].
Among all alkanolamines, monoethanolamine (MEA) is the most popular solvent in industrial process of CO2 capture, due to its fast reaction with CO2, high absorption capacity, ability to minimize the absorption column dimensions, low price and high water solubility. However, using MEA solutions also brings some disadvantages, such as high corrosion, high viscosity at high concentrations, irreversible reactions with O2, the solvent lost through vaporization, etc. [7,10,11].
In order to overcome some of the disadvantages of using MEA solutions, a number of other technologies for post-combustion CO2 capture have been studied. These consist in the use of other liquid solvents, among which are: aqueous ammonia solution [12], aqueous piperazine [13], potassium taurate solvent [14] and semi-aqueous monoethanolamine [15]. However, CO2 absorption using MEA aqueous solutions remains the most technically and economically mature carbon capture technology with the highest probability of being implemented in large-scale applications in the following years.
The flow diagram for the CO2 capture process using an MEA aqueous solution is presented in Figure 1.
The flue gas from the thermal power plant is pretreated, in order to remove the SO2 and NOx formed by burning fossil fuels, and at the same time is cooled. The SO2 and NOx are acid gases that react with MEA and form very stable compounds, thus reducing the capture efficiency of the solvent [16]. After pretreatment, the flue gas rich in CO2, enters the absorption column at its base, where it flows in a countercurrent arrangement with the aqueous MEA solution entered at the top of the column. The gaseous CO2 is absorbed in the liquid solution, where it reacts with the MEA, forming a stable compound, which can be transported in the solution to the stripper column. After the absorption, the gas treated for CO2 is evacuated safety into the atmosphere. The rich solvent, where the CO2 is chemically bonded to the MEA, is pumped into the cross-heat exchanger, where it is preheated based on the heat released by the regenerated absorbent solution. After being preheated, the rich solvent enters the stripper column at the top, where, based on the heat of the steam in the reboiler, the reverse process occurs: the CO2 is released as gas, and the MEA solution is regenerated. At the top of the stripper column, the gas flow enters a condenser where the water and MEA condense, and the mixture is separated in a flash vessel, with the liquid being sent back to the absorber, and at the top a high-purity gaseous CO2 is formed. The regenerated MEA solution is pumped to the cross-heat exchanger, being cooled by the rich solvent. In order to maintain the best possible absorption efficiency, the lean solvent is cooled to the optimal temperature in another heat exchanger. After cooling, the regenerated solvent is mixed with the fresh MEA solution in the buffer tank, and then enters the absorption column.
The goal of the process is to purify the flue gases, allowing them to be safely released into the atmosphere, with the highest possible CO2 capture efficiency at a minimum cost. In order to increase the efficiency of the CO2absorption process, several types of absorbers have been studied in order to increase as much as possible the mass transfer area between the gas and liquid [7,8,17]. At the industrial level, the most commonly used technology for the absorption process is the packed-bed column, which creates the largest mass transfer area possible by choosing the best possible packing material [7,8]. However, the conventional packed-bed columns have many drawbacks, such as liquid channeling, flooding at high flow rates, unloading at low flow rates, foaming, entrainment, larger pressure drops and weak heat transfer [18,19,20]. In order to overcome these disadvantages, the use of the hollow-fiber membrane contactors (HFMCs) to intensify the process of CO2 absorption has been intensively investigated. This technology offers a number of advantages [17,19,21,22,23]:
  • The mass transfer area is considerable higher than in the packed-bed column, due to the large number of fibers inside of the HFMC;
  • The gas mixture and the liquid solution are not in direct contact, as the membranes physically separate them; this avoids some of the problems caused by the contact between phases in conventional columns, such as foaming, flooding, channeling and entrainment;
  • The surface area between the gas and liquid is known and is constant at large flow rate variations;
  • Because there is no dispersion of gas into the liquid phase, emulsions do not form;
  • After the absorption process, there is no need to have a special section for washing the losses of the absorbent solution carried over by the gas;
  • There is no density difference required between the gas and liquid, compared to traditional columns, where the liquid usually flows gravitationally under its own weight and gas flows from the bottom up, due to the lower density;
  • The solvent holdup is low, an advantageous feature in the case of using high-cost absorbent solutions;
  • The membrane module is much more compact, due to a large mass transfer area in a small volume;
  • The membrane systems are modular, allowing the length of the module to be extended by simply adding a new module to the existing one, offering the possibility of operating in a wide range of gas flow variation.
Additionally, membrane technology has important techno-economic benefits in comparison to chemical and physical absorption (for example, decarbonization of integrated gasification combined cycle power plants) and, “e.g., greater overall net energy efficiency (up to about one net percentage point), lower specific capital investment costs (down to 9%), lower operational & maintenance costs (down to 10%), lower electricity production costs (down to 7%), lower CO2 capture costs (down to 50%)” [24].
However, the use of membranes for CO2 capture also has some disadvantages, including [21]:
  • The membrane introduces a new resistance to mass transfer. This resistance is not found in conventional columns; however, it can be minimized by choosing favorable operating conditions;
  • The lifetime of the membranes is short, so the cost of replacing them periodically must be considered;
  • Over time, due to the watering of the membranes, the absorption efficiency decreases.
In the absorption of CO2 using an HFMC, the membrane itself functions just as a separator between the gas mixture and the liquid solvent, and does not play any role in actually separating the CO2 from the flue gases. The actual separation of CO2 from the gas mixture occurs because of the properties of the solvent. The mass transfer across the membranes pores is carried out by diffusion due to the gradient concentration of CO2 between the two phases [8]. A schematic representation of the hollow-fiber membrane contactor for CO2 absorption, with the countercurrent arrangement for the gas mixture and liquid solution flow, is presented in Figure 2.
There are two different ways that the fluids can flow into the HFMC: the gas mixture inside the tube and the liquid solution in the shell compartment (Figure 3a), or the liquid in the tube and the gas in the shell (Figure 3b).
In order to provide timely information about the studied system, with a very short response time, and to predict the system’s dynamic behavior under flexible operating conditions, a detailed mathematical model is needed.
Most of the existing mathematical models presented in the literature for CO2 capture using an HFMC are developed in a stationary mode of operation and use continuity equations to describe the mass transfer of CO2 from the gas through the membrane into the liquid [26,27,28,29,30]. This paper brings forward a mathematical dynamic model of the carbon capture process in an MEA solution using a hollow-fiber membrane contactor (HFMC). As a novelty, part of the developed model represents the mass transfer coefficients, which are specifically calculated for the investigated system. Even though a simplified model of the CO2 capture process using an HFMC was used in this work (the variation in the parameters is considered only along the length of the membranes, and the CO2 mass transfer through the membrane is described by the partial mass transfer coefficients), the simulations results are in concordance with the experimental data presented in the literature [26]. Additionally, the dynamic modeling and simulation of the investigated system represents a key novel element in comparison to the current state of the art.

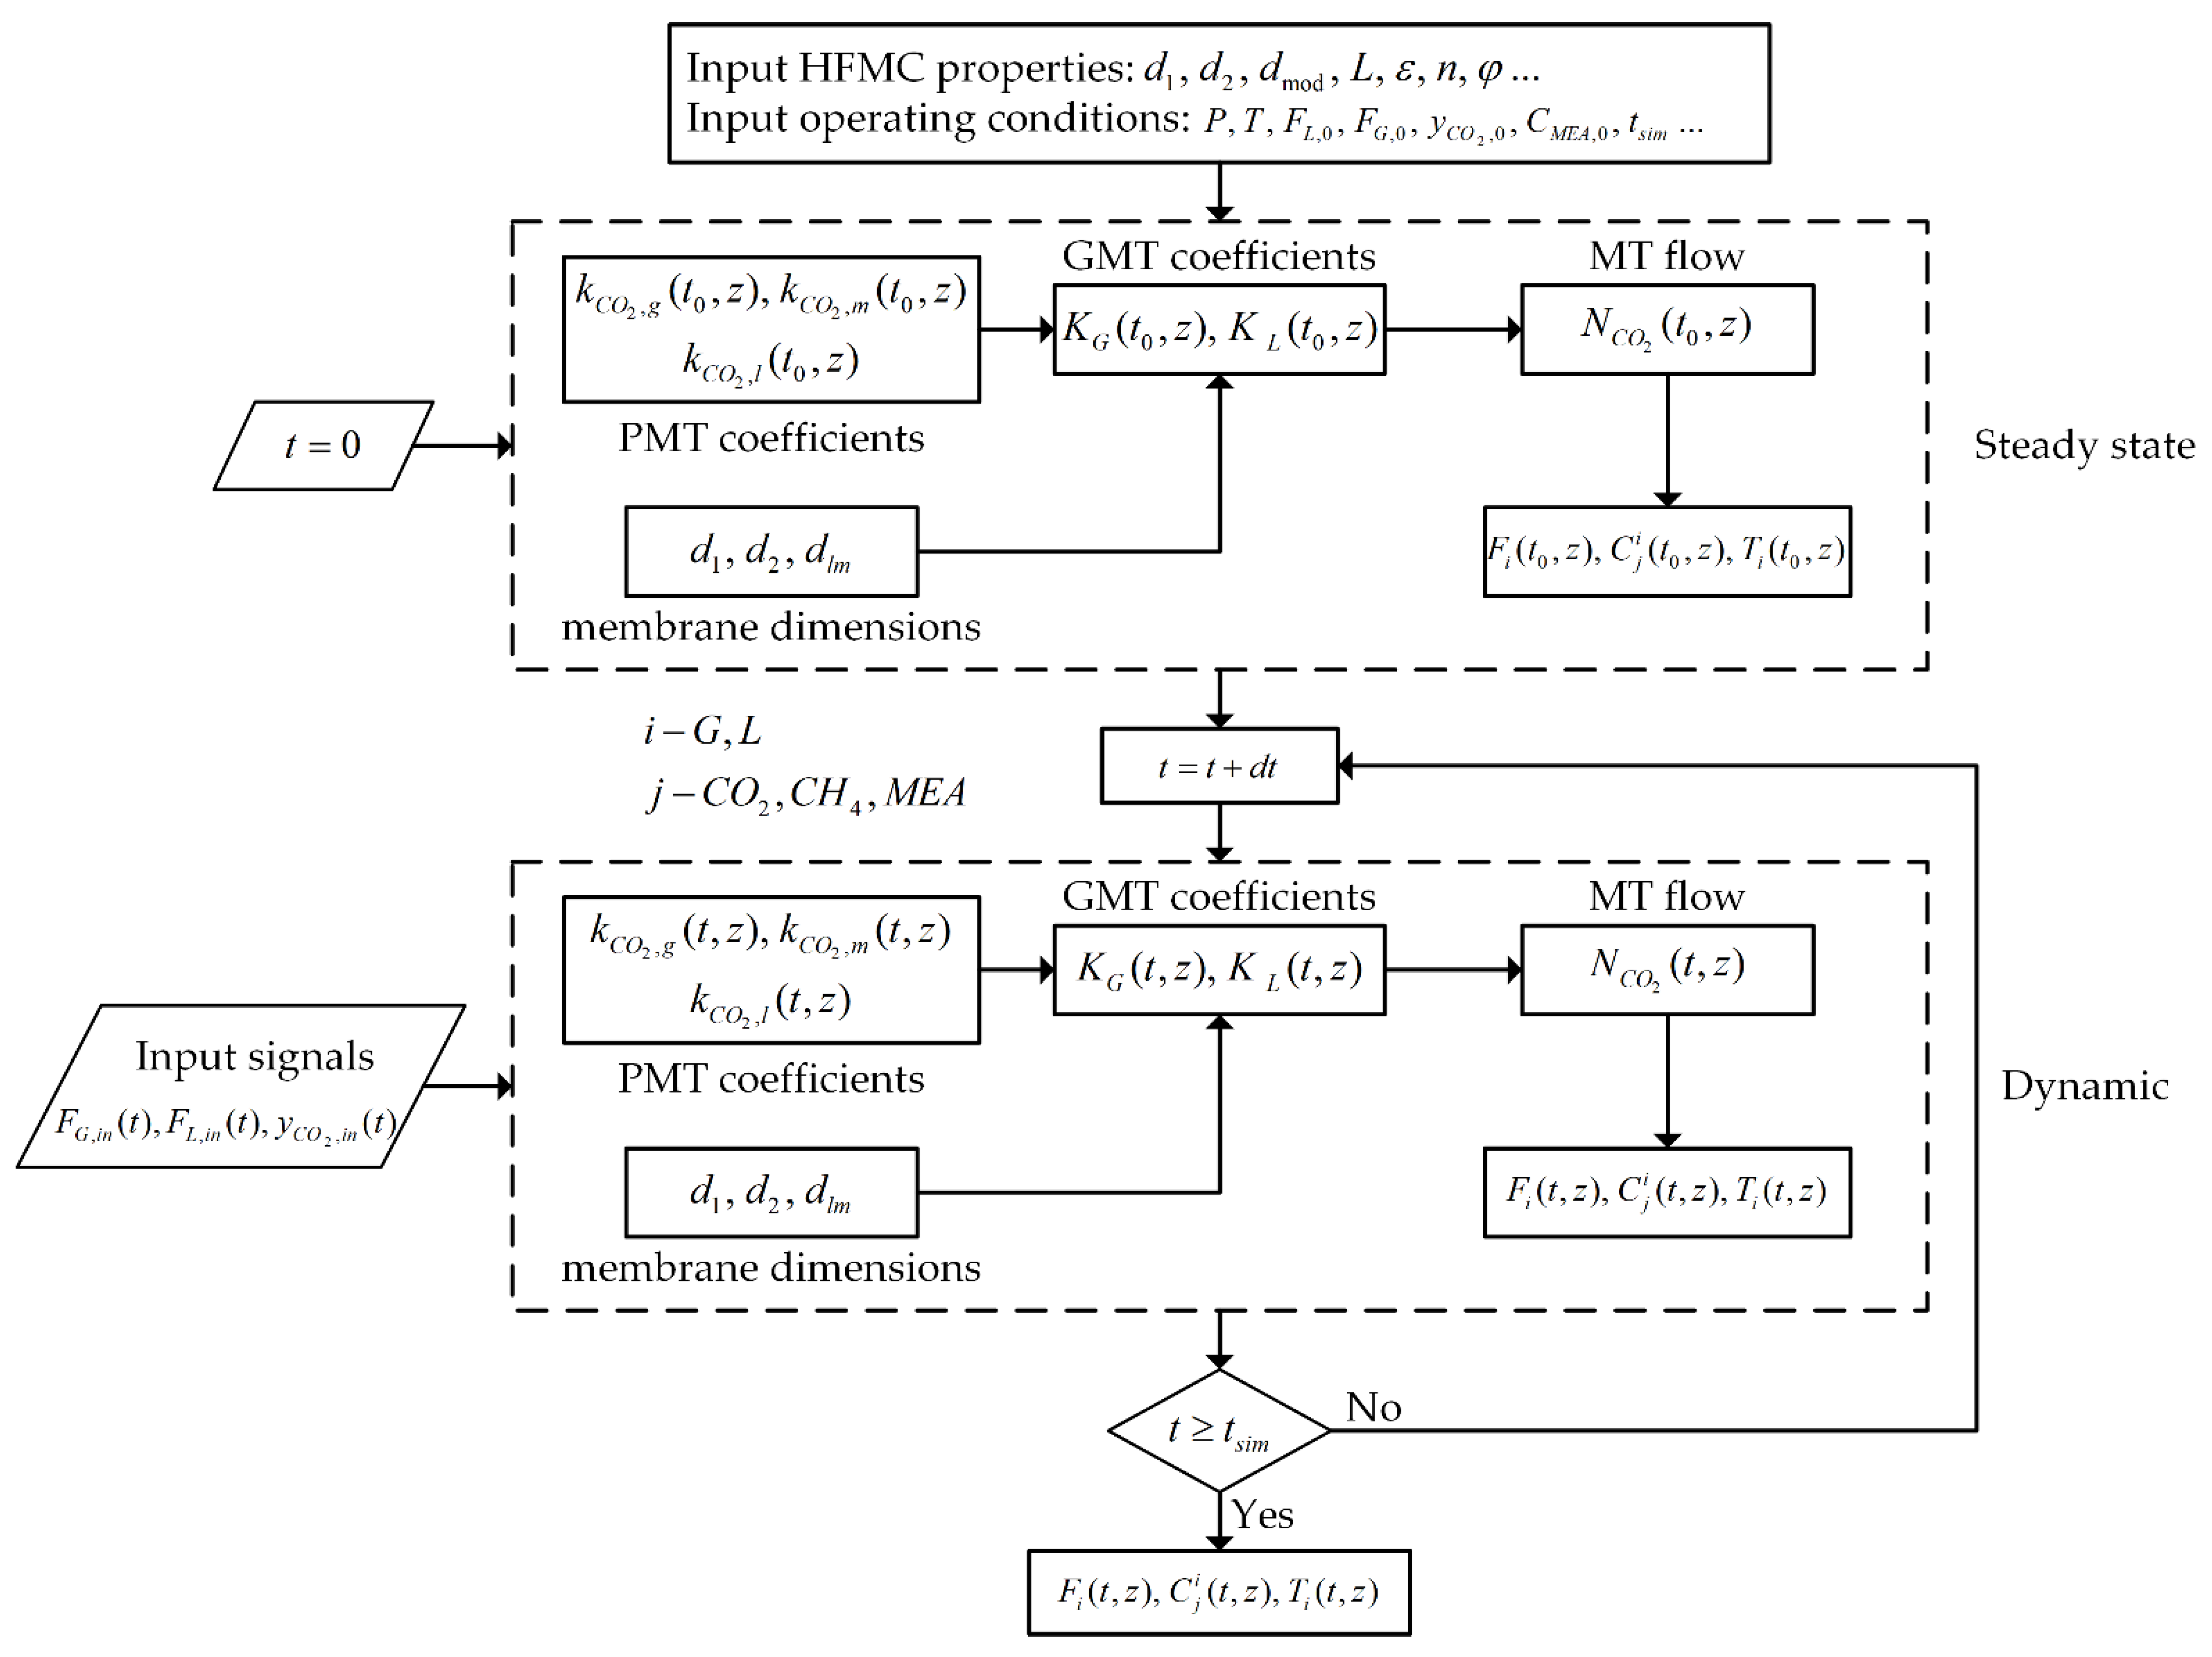
2. Dynamic Modeling of CO2 Absorption in MEA Solutions

In the process of CO2 absorption into an aqueous MEA solution using a hollow-fiber membrane contactor, the following processes take place:
  • Transport of CO2 inside the gas phase to the membrane, by convection and diffusion, in the tube side of the HFMC;
  • Diffusion of CO2 inside the membrane pores due to the concentration gradient formed;
  • The CO2 absorption process occurs in the aqueous MEA solution;
  • Transported CO2 inside the liquid phase, by convection and diffusion and the chemical reaction with MEA.
In order to develop the dynamic mathematic model, the following assumptions are made [26,31]:
  • To describe the fluid mechanics inside the HFMC, the plug flow model is applied, with the model parameters being constants on the radial section of the membranes;
  • Both phases are considered to behave like ideal mixtures;
  • The laminar flow of the gas mixture inside the membranes and the liquid phase in the shell compartment is considered;
  • To calculate the CO2 concentration at the gas–liquid interface, Henry’s law is applied;
  • The chemical reaction between CO2 and MEA takes place only in the liquid phase;
  • The membranes inside the HFMC are considered to operate in non-wetting mode;
  • The heat transfer carried out by radiation and conduction is negligible;
  • The pressure drop across the HFMC is negligible;
  • To calculate the equivalent circular diameter of the liquid absorbent around the fibers, Happel’s approximation is used. In the shell compartment, the effective diameter of the shell can be calculated with the following equation [26]:
d 3 = d 2 1 1 φ

2.1. Chemical Rection

The chemical reaction between CO2 and MEA takes place in the liquid phase, in the shell compartment of the hollow-fiber membrane contactor, according to the following reaction equations [32,33]:
C O 2 + 2 M E A M E A + + M E A C O O
C O 2 + H 2 O H + + H C O 3
The kinetics can be expressed as a second-order reaction, as the first order of each reactant. The reaction rate can be calculated at different temperatures using the following expression [28]:
N R = k C M E A C C O 2 L = 10 ( 10.99 2152 T L ) 1000 C M E A C C O 2 L
The chemical reaction works as an accelerator of the absorption process; this acceleration is represented in the model through the enhancement factor, E, which is calculated with the Kishinevsckii correlations [34]:
E = 1 + H a α 1 [ 1 exp ( 0.65 H a α 1 ) ]
α 1 = H a E 1 + exp [ 0.68 H a 0.45 H a E 1 ]
E = ( 1 + 1 b D B D A C B C A i ) ( D A D B ) 1 / 2
where the Hatta module (Ha) is calculated with [35]:
H a = k C M E A L D C O 2 , l k l

2.2. Balance Equations

The dynamic mathematical model of the CO2 absorption process using a hollow-fiber membrane contactor consists in the main balance equations presented in Table 1. In addition to the dynamic balance equations and the mass transfer equations, the developed model contains another set of algebraic equations, equations that calculate the physical-chemical properties of the gas and liquid, such as density, cinematic and dynamic viscosities, specific heat capacities, solubility of CO2 in the MEA solution, the diffusion coefficients of CO2 in the gas and liquid phase, etc.

2.3. Mass Transfer Model

The CO2 mass transfer flow across the gas–liquid interface is described by the two-film model, and is proportional to the enhancement factor, E , the overall mass transfer coefficients of CO2 inside the gas, K G , and liquid phase, K L , and the CO2 concentration gradient between the two phases [36,37,38].
N C O 2 = E K G ( C C O 2 G C C O 2 G , e ) = E K L ( C C O 2 L , e C C O 2 L )
where C C O 2 G , e and C C O 2 L , e are the equilibrium CO2 concentration in the liquid and gas phase, calculated using Henry’s law:
C C O 2 G , e = H C O 2 C C O 2 L
C C O 2 L , e = C C O 2 G H C O 2
In order to determine the CO2 mass transfer flow across the gas–liquid interface, we need to estimate the overall mass transfer coefficients inside the liquid and gas phase. The coefficients are calculated based on the mass transfer partial coefficients, the HFMC dimensions and Henry’s coefficient of CO2 in the MEA solution [29]:
1 K L d 2 = 1 k C O 2 , l d 2 + 1 k C O 2 , m H C O 2 d l m + 1 k C O 2 , g H C O 2 d 1
1 K G d 2 = H C O 2 k C O 2 , l d 2 + 1 k C O 2 , m d l m + 1 k C O 2 , g d 1
where d 1 , d 2 and d l m are the inside, outside and logarithmic diameter of the membrane. To calculate Henry’s coefficient of CO2 in the MEA solution, the following analogy is used [39]:
H C O 2 , M E A = H N 2 O , M E A H C O 2 , H 2 O H N 2 O , H 2 O
H N 2 O , M E A = 1.207 × 10 5 exp ( 1136.5 T )
H C O 2 , H 2 O = 2.82 × 10 6 exp ( 2044 T )
H N 2 O , H 2 O = 8.55 × 10 6 exp ( 2284 T )
In order to develop the model, the partial mass transfer coefficients of CO2 inside the gas phase, through the membrane pores and inside the liquid phase ( k C O 2 , g , k C O 2 , m and k C O 2 , l ), need to be calculated. The following expressions of the coefficients, specific to the studied system, are presented in the literature.

2.3.1. The Partial Mass Transfer Coefficient of CO2 Inside the Gas Phase— k C O 2 , g

The gas, rich in CO2, flows through the tube side of the membranes, where the mass transfer is carried out by the convection mechanism, due to the movement of the gas mixture along the length of the membranes, and by the diffusion mechanism, due to the CO2 concentration gradient obtained by the absorption process in the liquid phase.
The Yang and Cussler correlation is used to predict the value of the partial mass transfer coefficient of CO2 inside the gas phase [40]:
S h = k C O 2 , g d 1 D C O 2 , g = 1.25 ( Re d h L ) 0.93 S c 0.33
The hydraulic diameter (dh) depends on the inner diameter of the HFMC module (dmod) and number of membranes (n), and is calculated with the following expression [39]:
d h = d mod 2 n d 2 2 d mod + n d 2

2.3.2. The Partial Mass Transfer Coefficient of CO2 through the Membrane— k C O 2 , m

The membranes inside the HFMC introduce further resistance at the CO2 mass transfer stage, a resistance that does not occur in the traditional systems for CO2 absorption, such as packed-bed absorption columns. The mass transfer across the membrane is carried out by diffusion.
According with the experimental data used to validate the model, the operating condition of the membranes inside the HFMC is considered non-wetted [26].
The partial mass transfer coefficient of CO2 through the non-wetted membrane can be calculated, using the membrane parameters (porosity, thickness and tortuosity), by the following equation [41]:
k C O 2 , m = D C O 2 , g , m ε δ τ
The membrane tortuosity is calculated, based on the membrane porosity, with the following equation [26]:
τ = ( 2 ε ) 2 ε
The CO2 diffusion coefficient inside the membrane pores can be calculated based on the Knudsen ( D C O 2 , K n ) and the molecular ( D C O 2 , M ) diffusion coefficients, with the following equations [26,42,43]:
1 D C O 2 , g , m = 1 D C O 2 , M + 1 D C O 2 , K n
D C O 2 , M = 1200 R T Ω μ M C O 2 P Ω D μ C O 2
D C O 2 , K n = d p 3 8 R T π M C O 2

2.3.3. The Partial Mass Transfer Coefficient of CO2 Inside the Liquid Phase— k C O 2 , l

The MEA solution flows through the shell side of the HFMC, where the mass transfer is carried out by the convection mechanism, due to the movement of the liquid mixture along the length of the membranes, and by the diffusion mechanism, due to the CO2 concentration gradient obtained by the absorption process and the chemical reaction with MEA.
Graetz-Lévêque propose the following equation to predict the partial mass transfer coefficient of CO2 inside the liquid phase [21]:
S h = k C O 2 , l d e D C O 2 , l = 1.62 ( d e 2 υ L D C O 2 , l L ) 1 / 3
The mass transfer coefficients were calculated and compared with those presented in the literature, and similar values were obtained ( k C O 2 , g = 5.2 × 10 3 m·s−1, k C O 2 , m = 5.3 × 10 3 m·s−1 and k C O 2 , l = 2.2 × 10 4 m·s−1) [26,39,40].

3. Results and Discussions

The hollow-fiber membrane contactor dimensions and properties used in the development process of the model and to validate it are presented in Table 2.
The operating conditions of the hollow-fiber membrane contactor for the CO2 absorption process in an aqueous MEA solution used in the simulations are presented in Table 3.
Using the HFMC properties and the operating conditions presented in Table 2 and Table 3, as well as the physical properties of the gas and liquid phase, the developed dynamic mathematical model presented in Section 2 was implemented in MATLAB/Simulink. The partial differential equations, which describe the mass and energy variations in the time and space of the parameters, presented in Table 1, were transformed into total differential equations using a numerical method for discretization.
The available experimental data from the literature, which were used to validate the mathematical model [26], consider a CO2/CH4 gas mixture to be purified by CO2 absorption using an HFMC; however, the same developed mathematical model could also be used to evaluate the CO2 removal efficiency of the HFMC from flue gases.
A block flow diagram representing the used algorithm is presented in Figure 4.

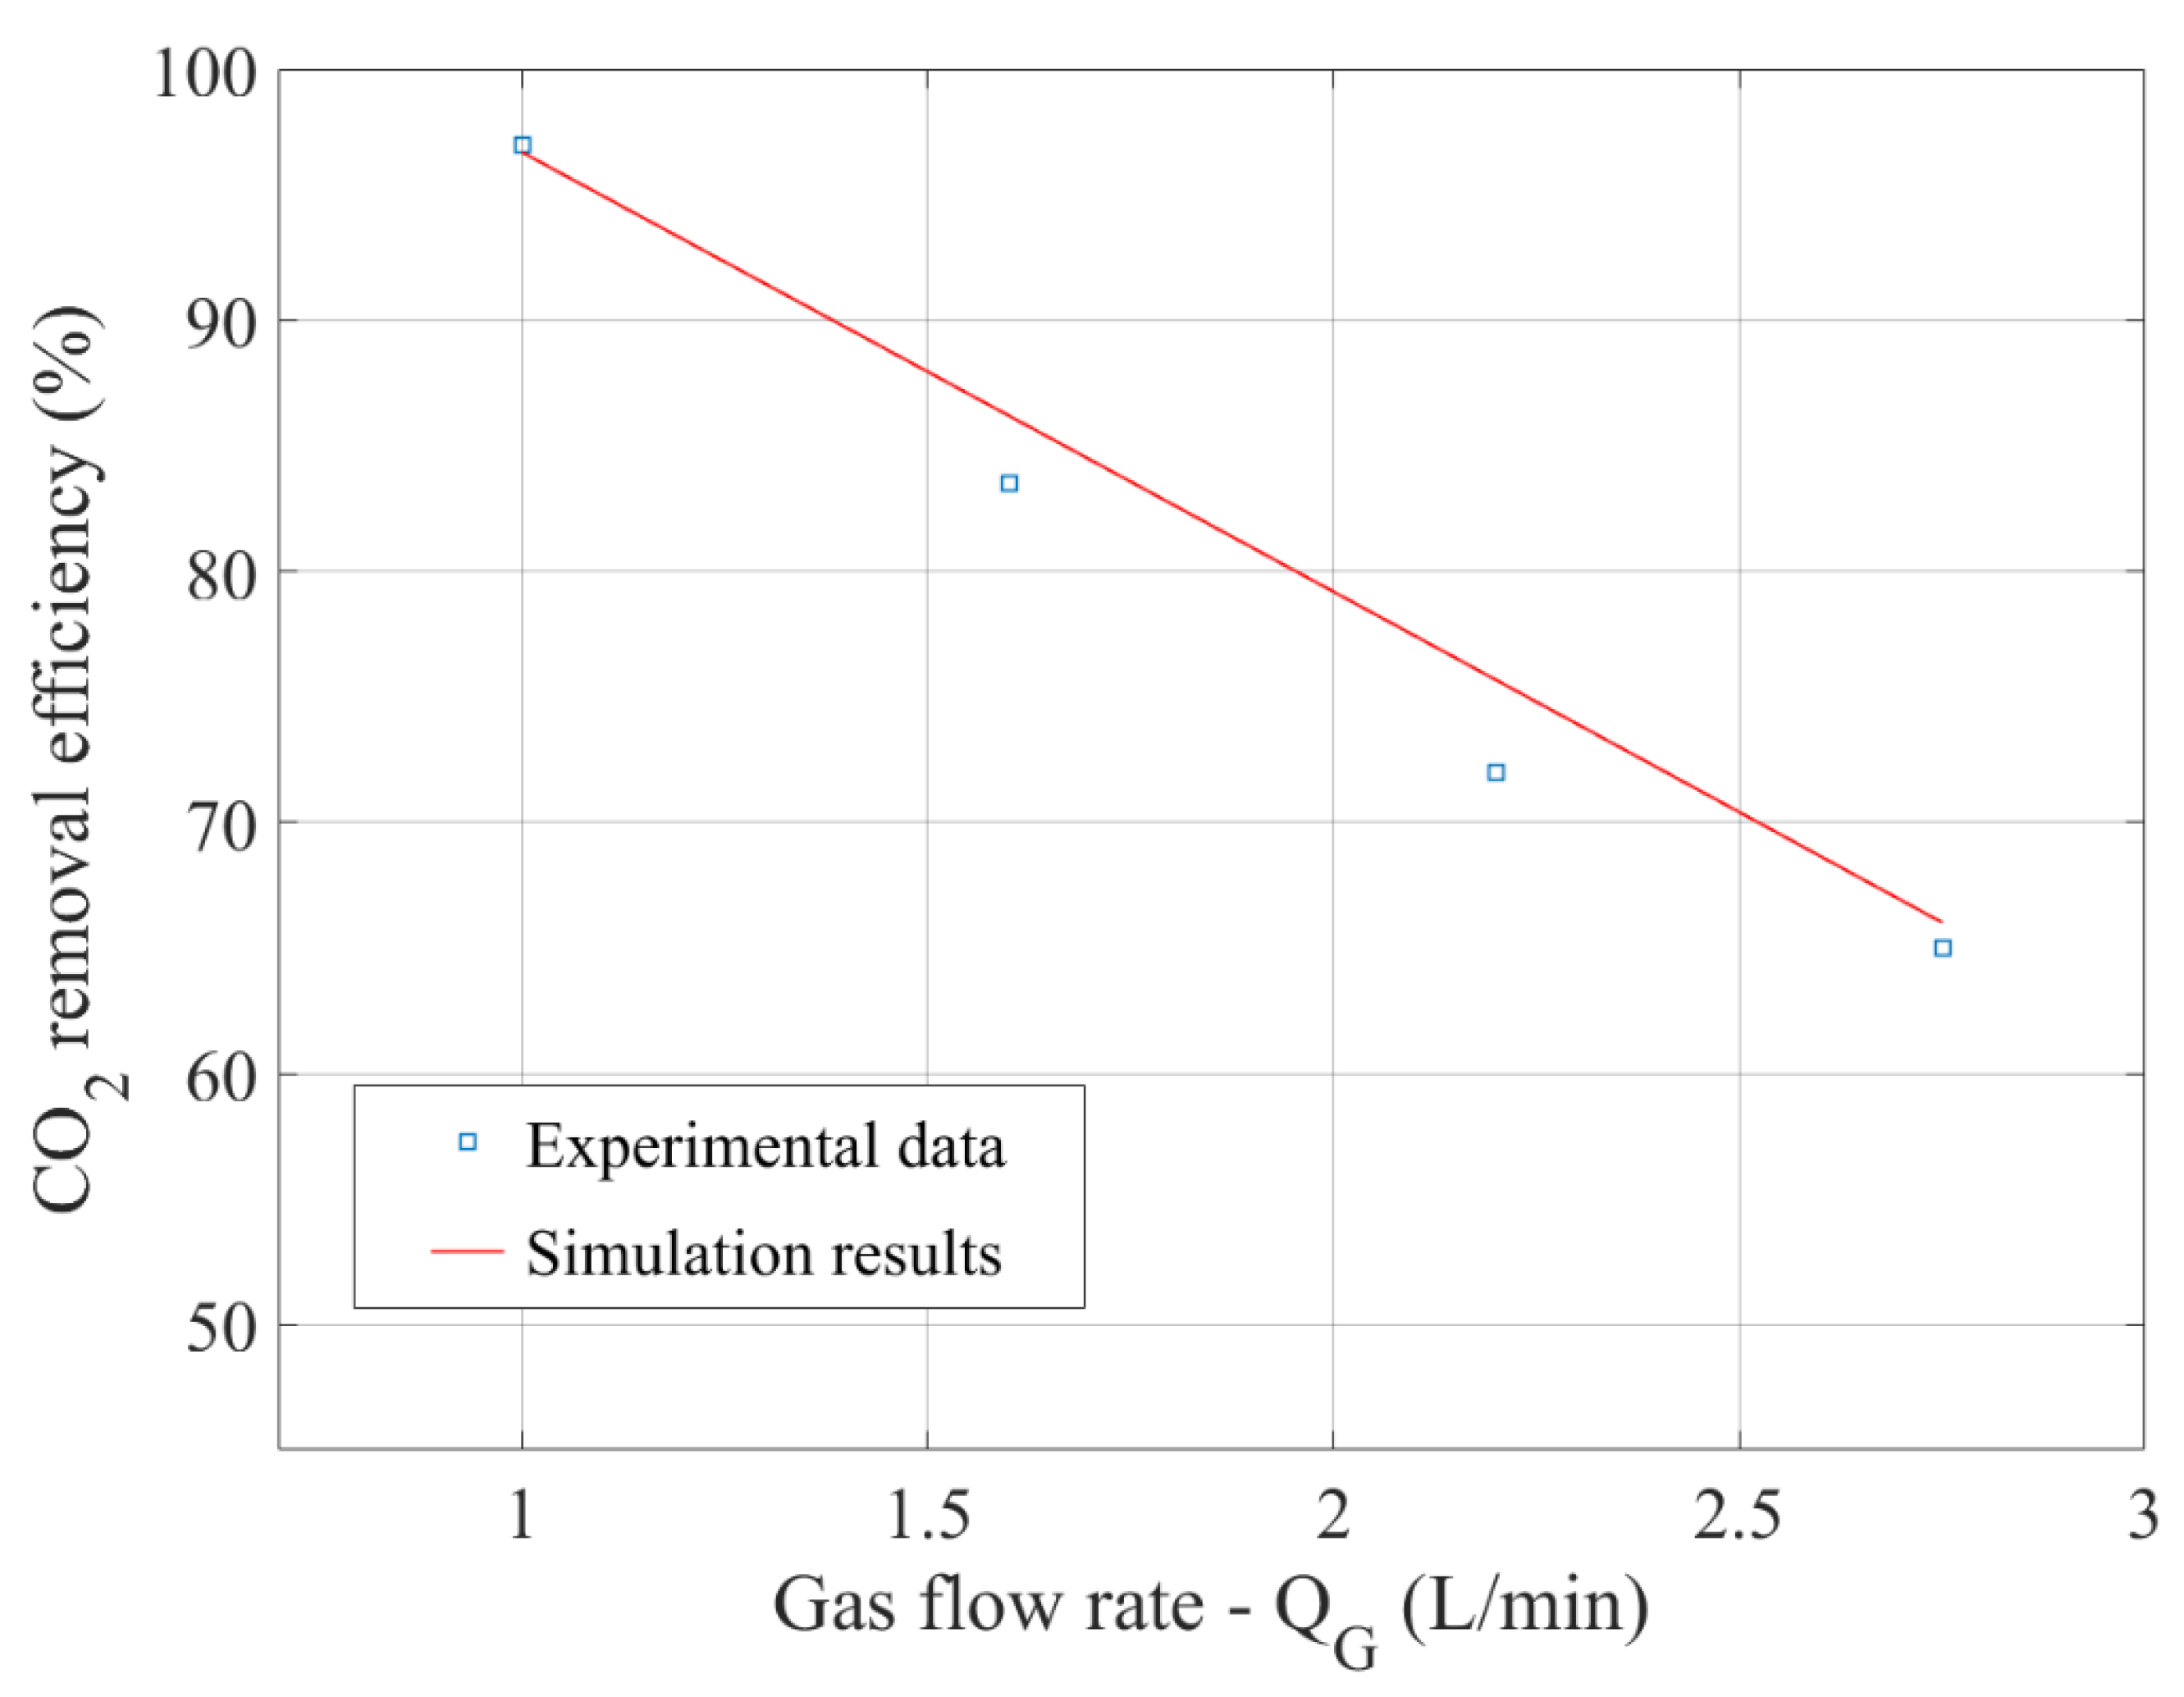
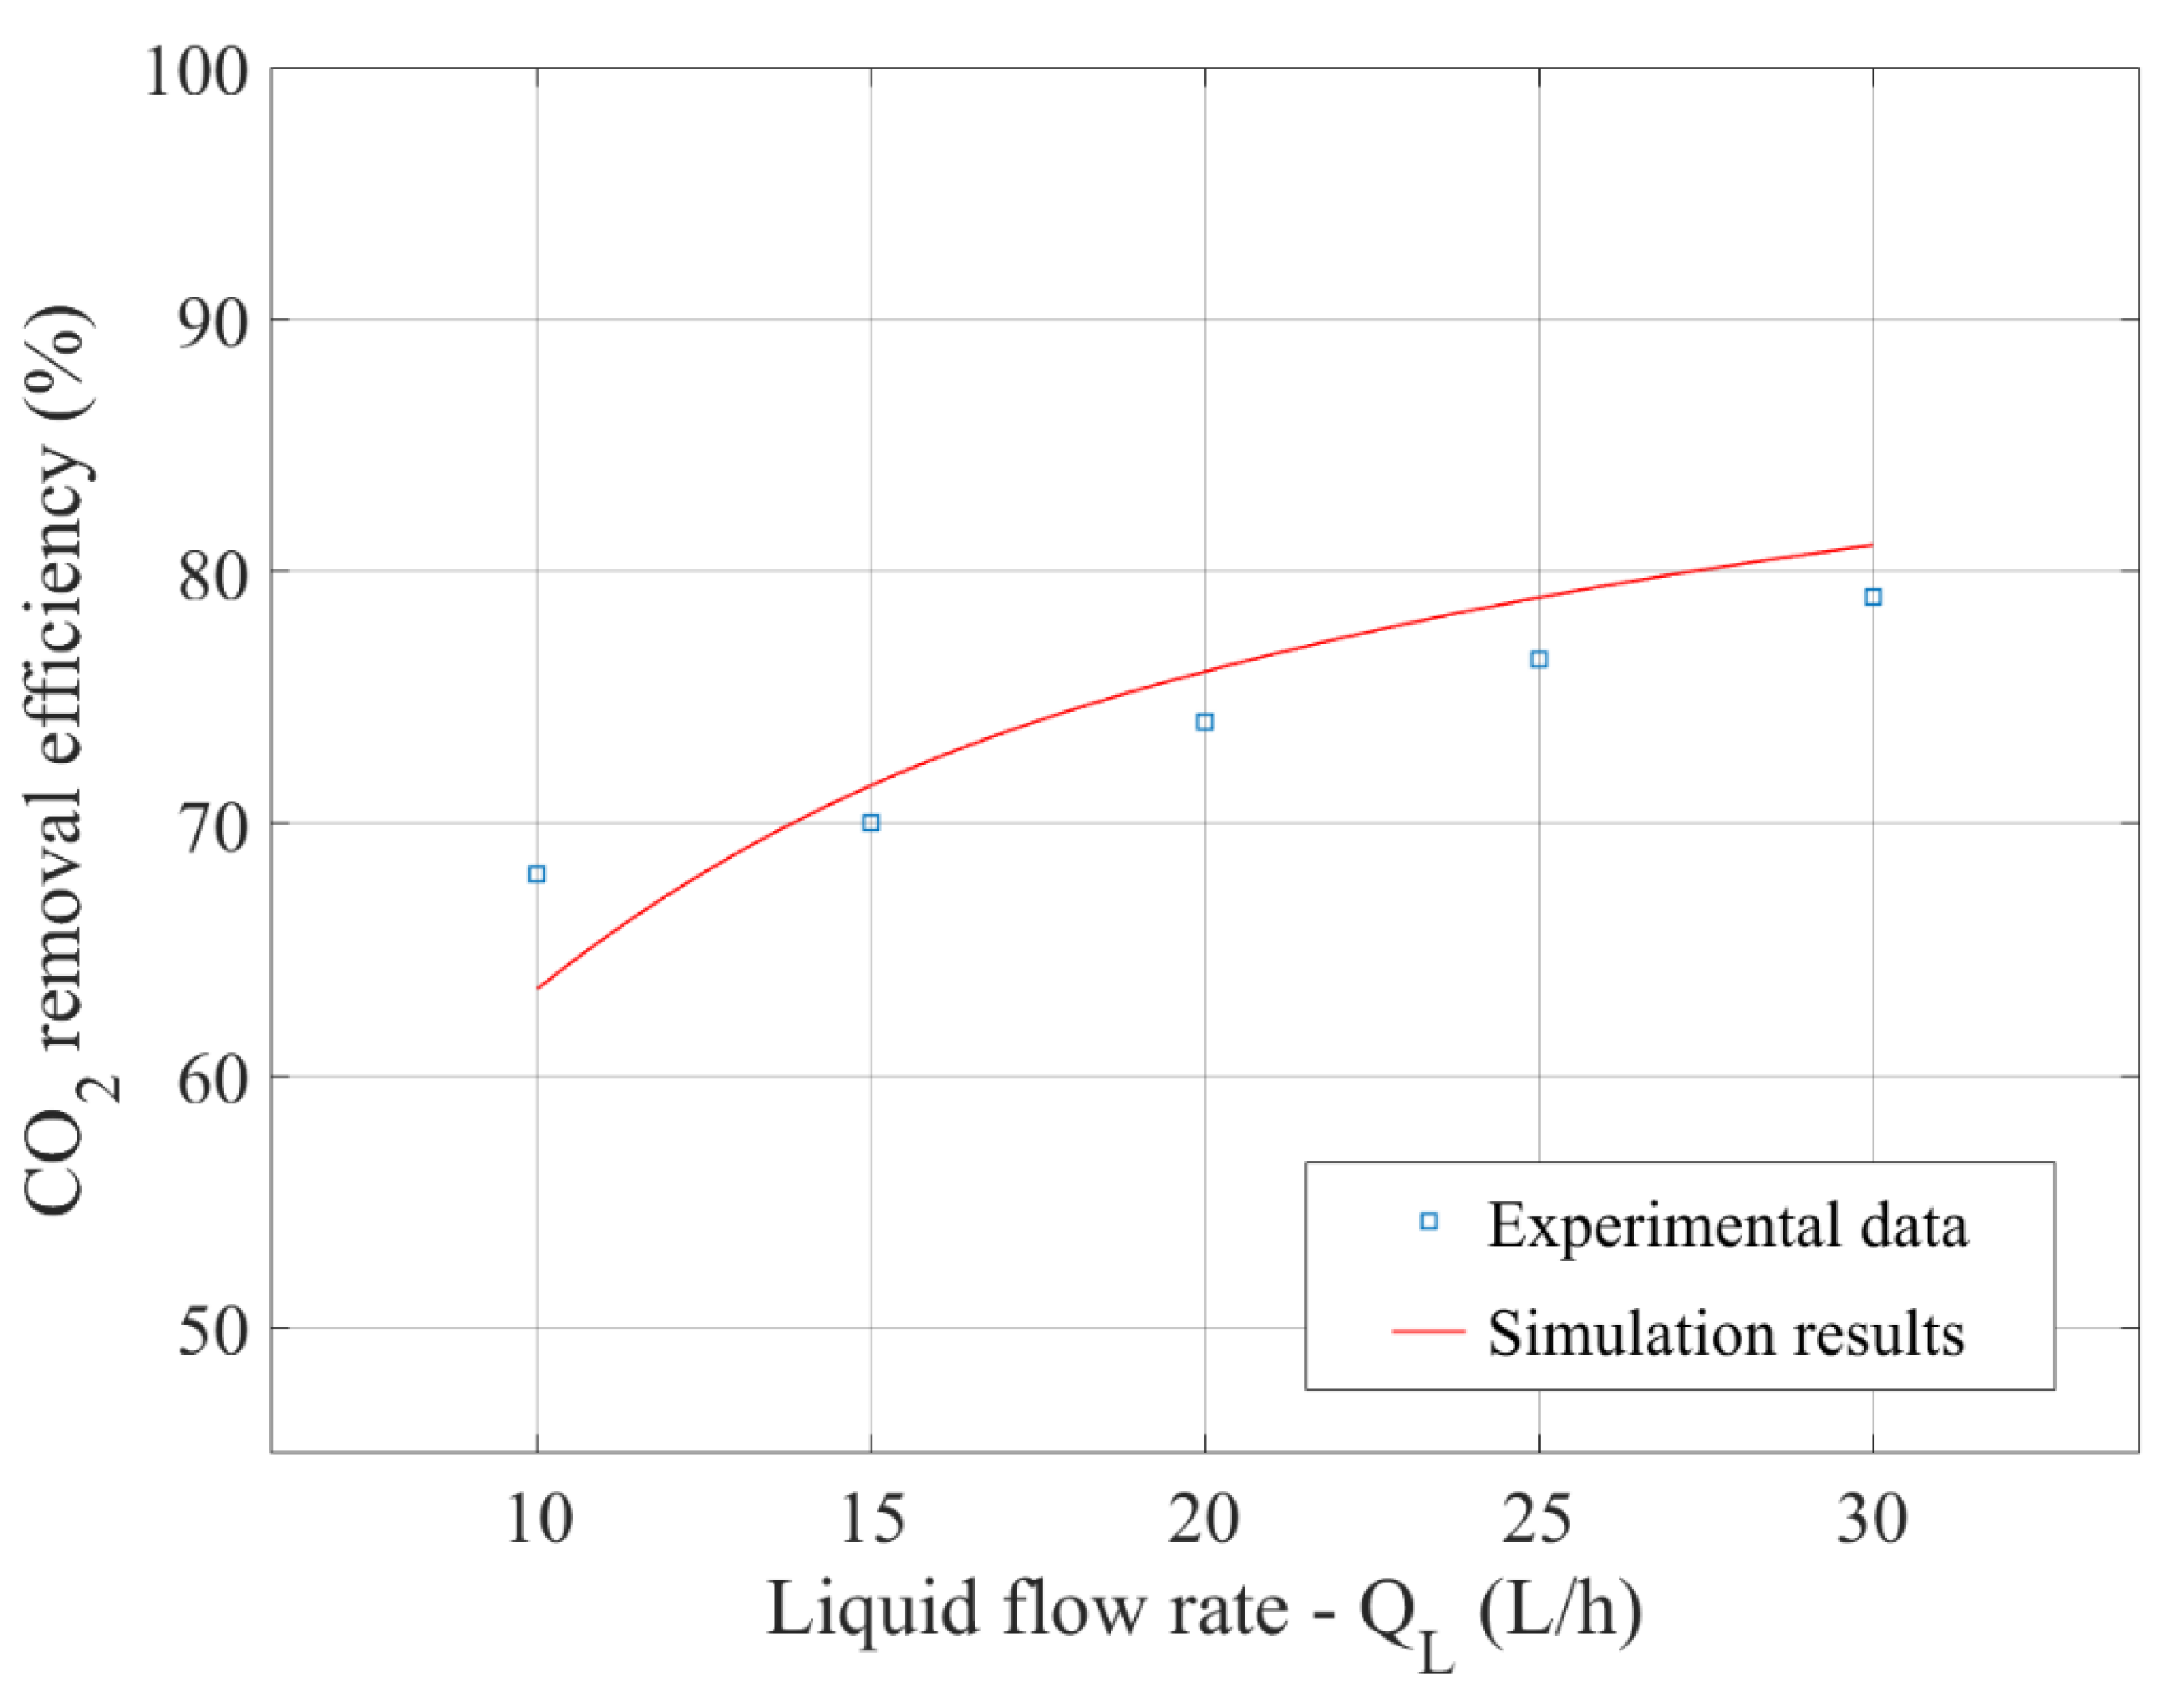
3.1. Model Validation

In order to confirm that the model gives correct information about the CO2 absorption process using an HFMC in an MEA solution, the simulation results were compared with experimental data published in the literature [26] (Figure 5 and Figure 6). The validation of the model was realized via evaluating the CO2 removal efficiency of the HFMC at different gas and liquid flow rates, being calculated with the following equation:
C O 2 r e m o v a l e f f i c i e n c y ( % ) = C C O 2 , i n C C O 2 , o u t C C O 2 , i n 100
The CO2 removal efficiency at different gas flow rates, evaluated at a constant liquid flow rate (25 L ‧ h−1), is represented in Figure 5. When the gas flow rate was lower, the residence time in the HFMC increased, and the CO2 removal efficiency was substantially higher, reaching 97% at a gas flow rate of 1 L ‧ min−1. When the gas flow rate was increased to 2.75 L ‧ min−1, the CO2 removal efficiency considerably decreased to 66%.
The simulation results and experimental data in terms of CO2 removal efficiency for a wide range of liquid flow rates, keeping the gas flow rate constant at 2 L ‧ min−1, are represented in Figure 6. When the liquid flow rate was increased from 10 L ‧ h−1 to 30 L ‧ h−1, the removal efficiency increased, as we expected, from 64% to 81%.
As shown in Figure 5 and Figure 6, the developed model gives a good approximation of the CO2 absorption process using an HFMC; compared to the experimental data, the correlation coefficient obtained is R2 > 0.96. It can be concluded that the developed model of the CO2 absorption process, in an MEA solution, using a hollow-fiber membrane contactor, provides a good approximation of the system, and can be further used to predict the behavior of the system in a wide range of operating conditions.

3.2. Steady-State Profiles

Based on the simulation results, the variation in the parameters over the module length was predicted for different operating condition scenarios. As we expected, in the gas–liquid absorption process, both parameters, gas flow rate (blue line in Figure 7) and CO2 concentration, (red line in Figure 7), decreased over the module length in the gas phase, due to the CO2 absorption into the liquid solvent. At the same time, the CO2 removal efficiency increased over the length of the module due to the absorption of CO2, and the concentration of MEA in the liquid phase decreased, due to the chemical reaction with the absorbed CO2 (Figure 8). The liquid solvent flows in the shell compartment of the HFMC, in a countercurrent with the gas mixture. The CO2 concentration inside the gas phase decreased from the initial 10% vol. to nearly 1% vol.

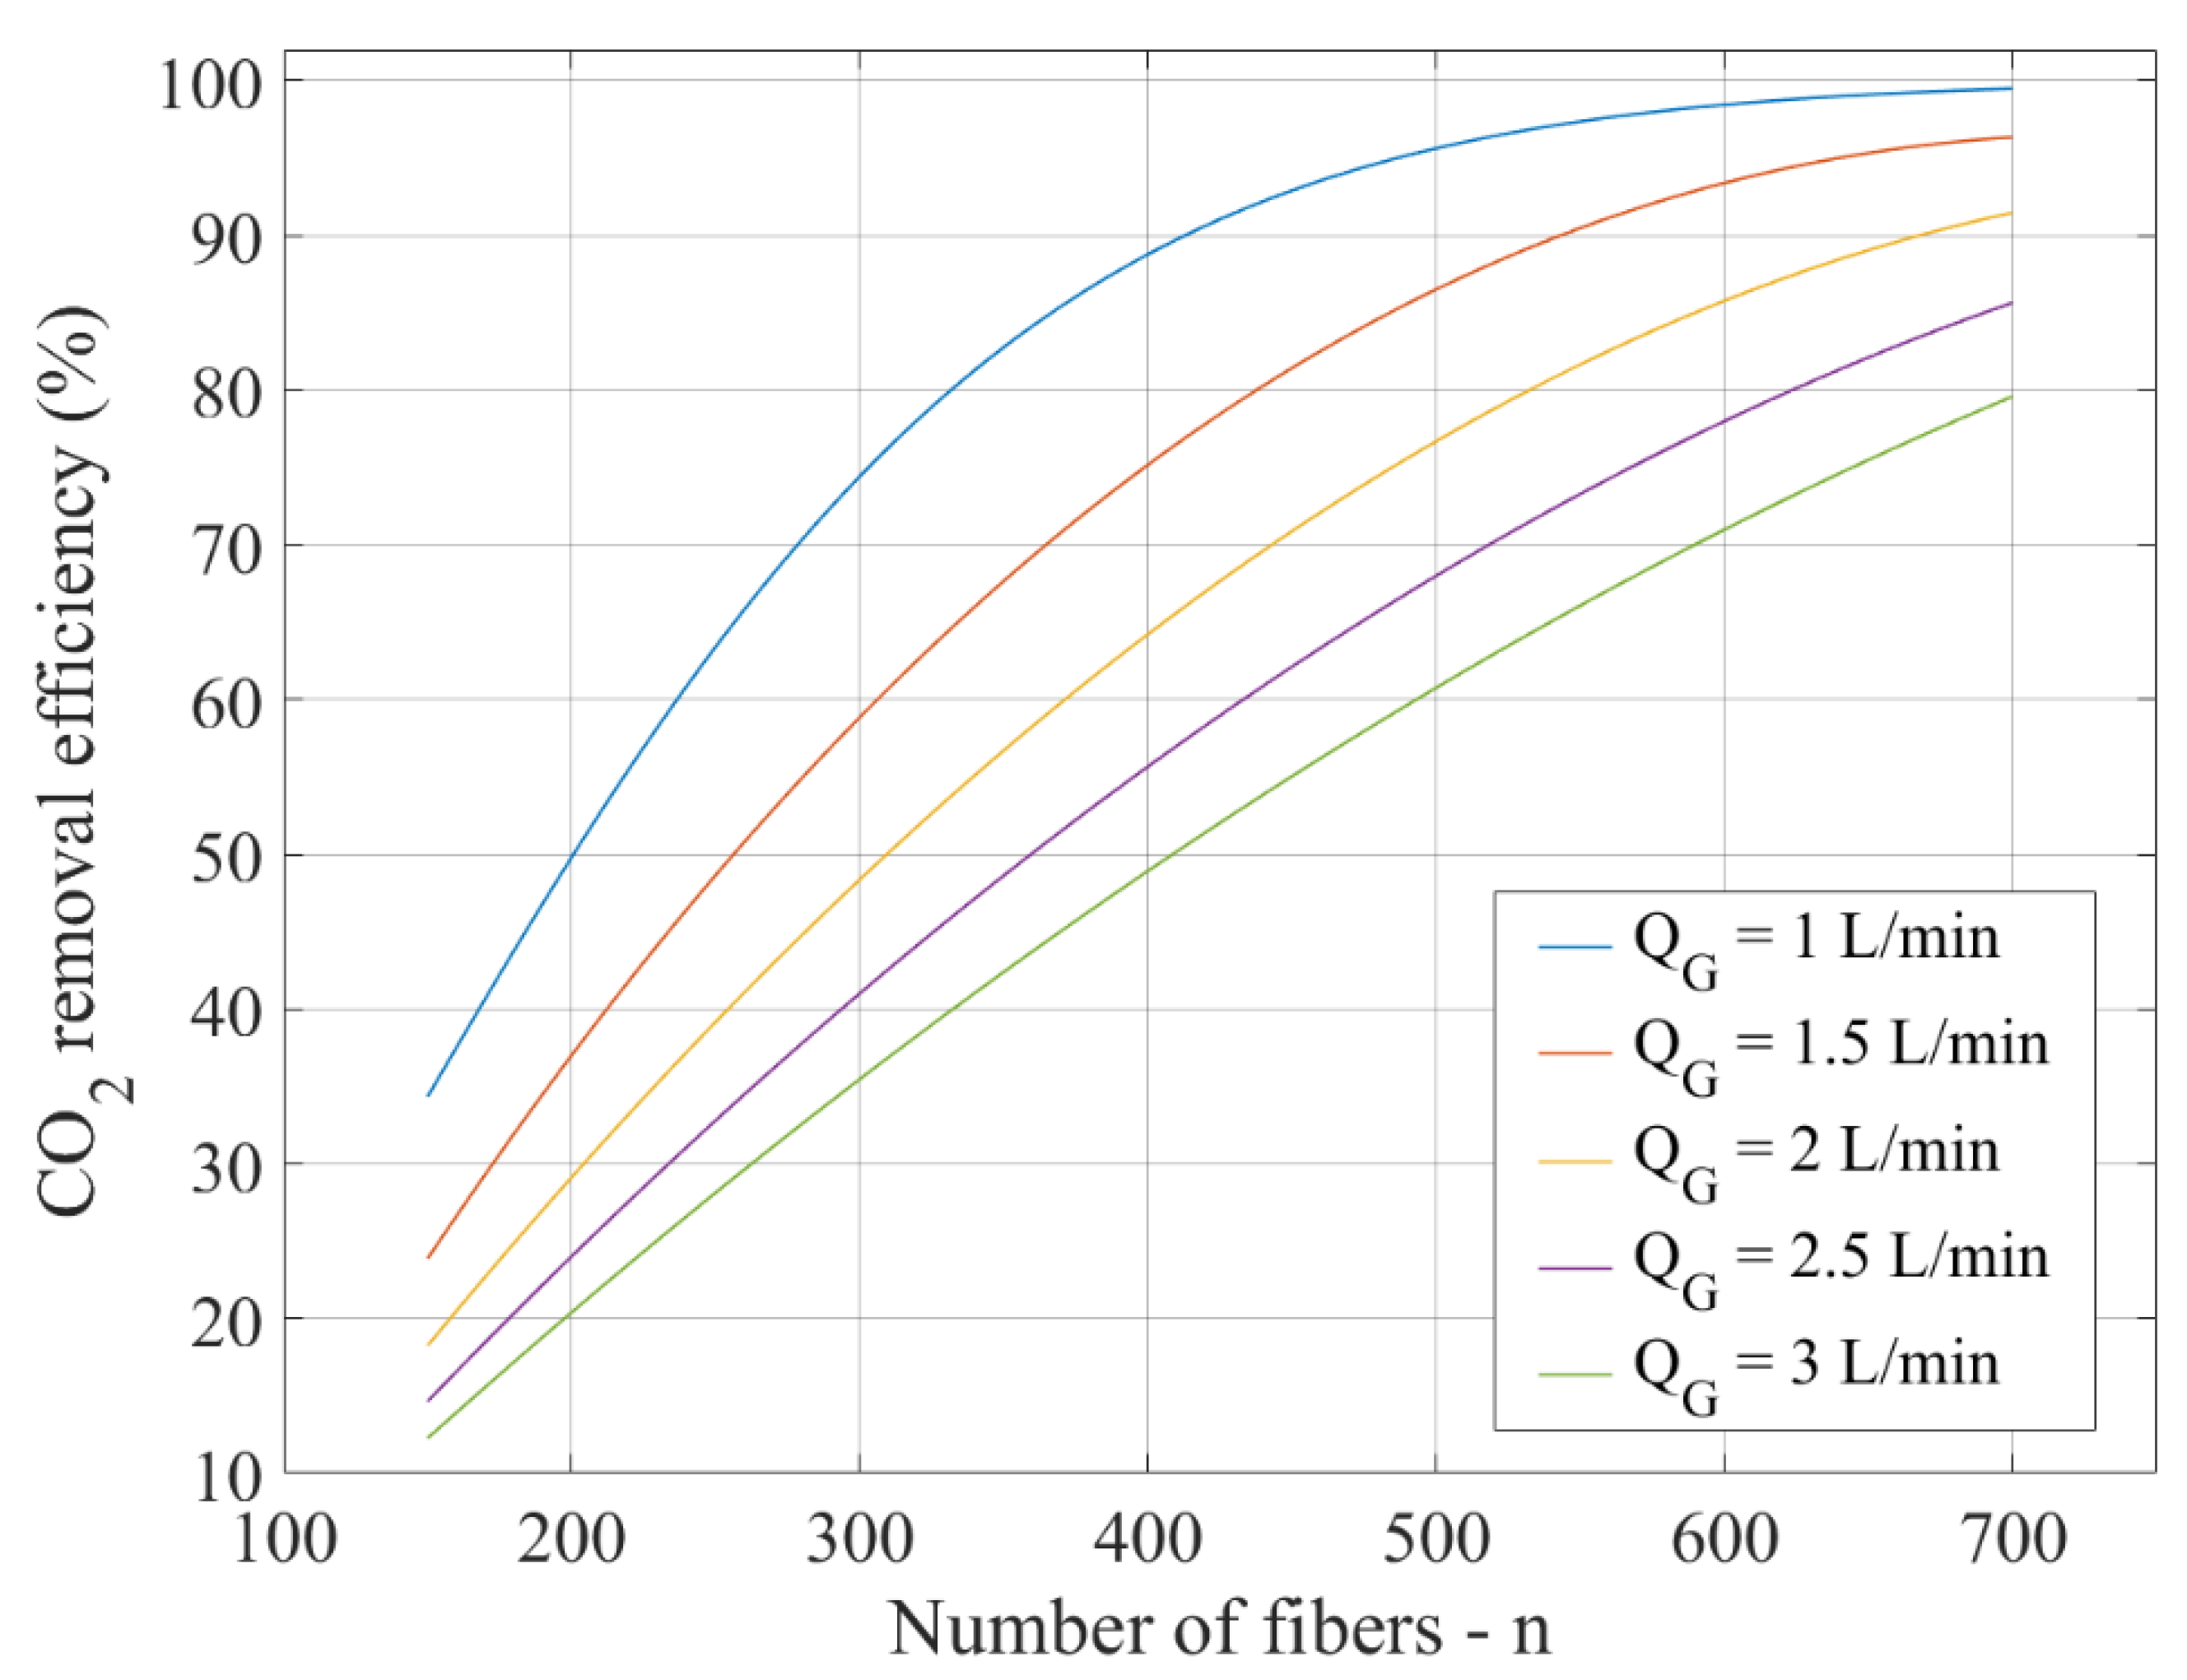
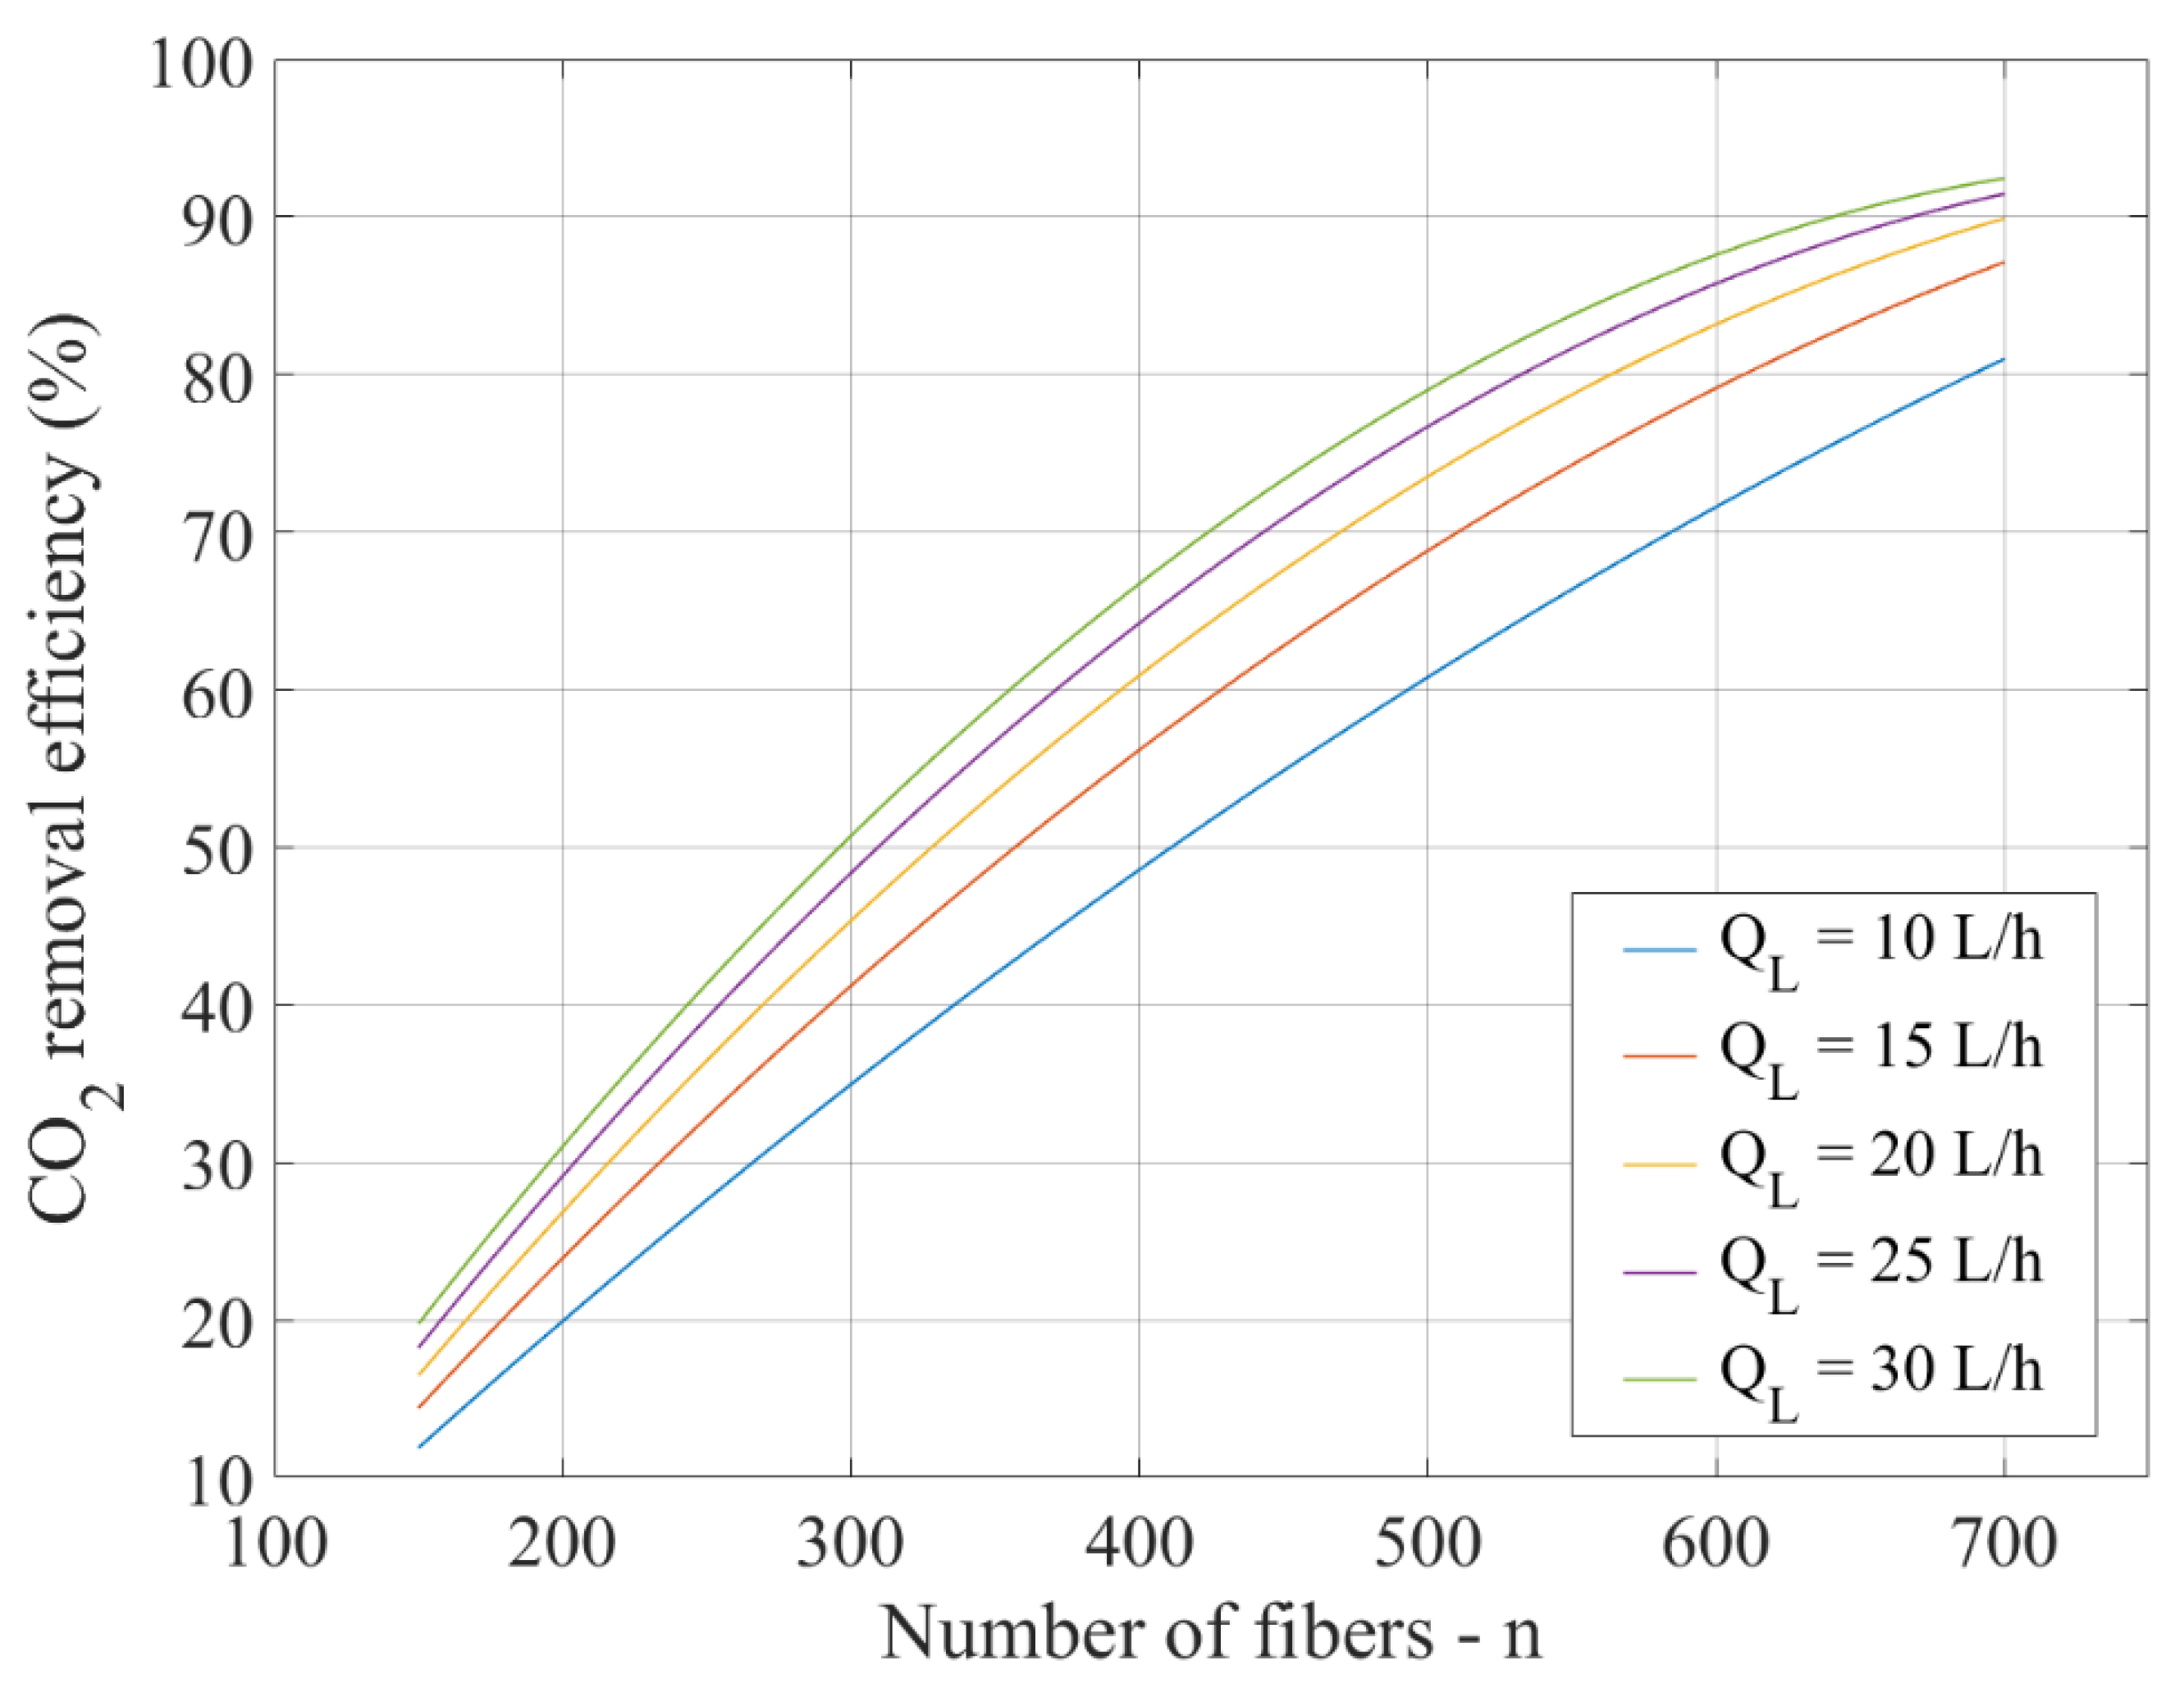
3.2.1. Influence of the Number of Membranes on the CO2 Removal Efficiency

When increasing the number of fibers inside the HFMC, the mass transfer area between the gas and liquid significantly increased, having a positive effect on the absorption efficiency. The effect of the number of fibers inside the HFMC on the CO2 removal efficiency for different gas flow rates, at a constant liquid flow rate (25 L ‧ h−1), is represented in Figure 9. Additionally, different liquid flow rates, holding the gas flow rate constant at 2 L ‧ min−1, are represented in Figure 10. At a gas flow rate of 1 L ‧ min−1, the CO2 removal efficiency increased from 35% at 150 fibers inside the HFMC to nearly 99% at 700 fibers. The increase in the absorption efficiency was consistent at different gas flow rates when the number of fibers inside the HFMC was increased, as shown in Figure 9. The positive effect of more fibers inside the module can also be noticed in the case of changing the liquid flow rate (increasing the CO2 removal efficiency from 20% at 150 fibers to 90% at 700 fibers, in the case of a 2 L*min−1gas flow rate), with the results being presented in Figure 10. It needs to be considered, for an industrial scale up, that when increasing the liquid flow rate, the energy consumption with amine regeneration will increase, and furthermore, the replacement cost for a large number of fibers is high (the lifetime of the membranes is short). Thus, a compromise must be considered between the liquid flow rate and number of fibers used to achieve the desired CO2 removal efficiency.

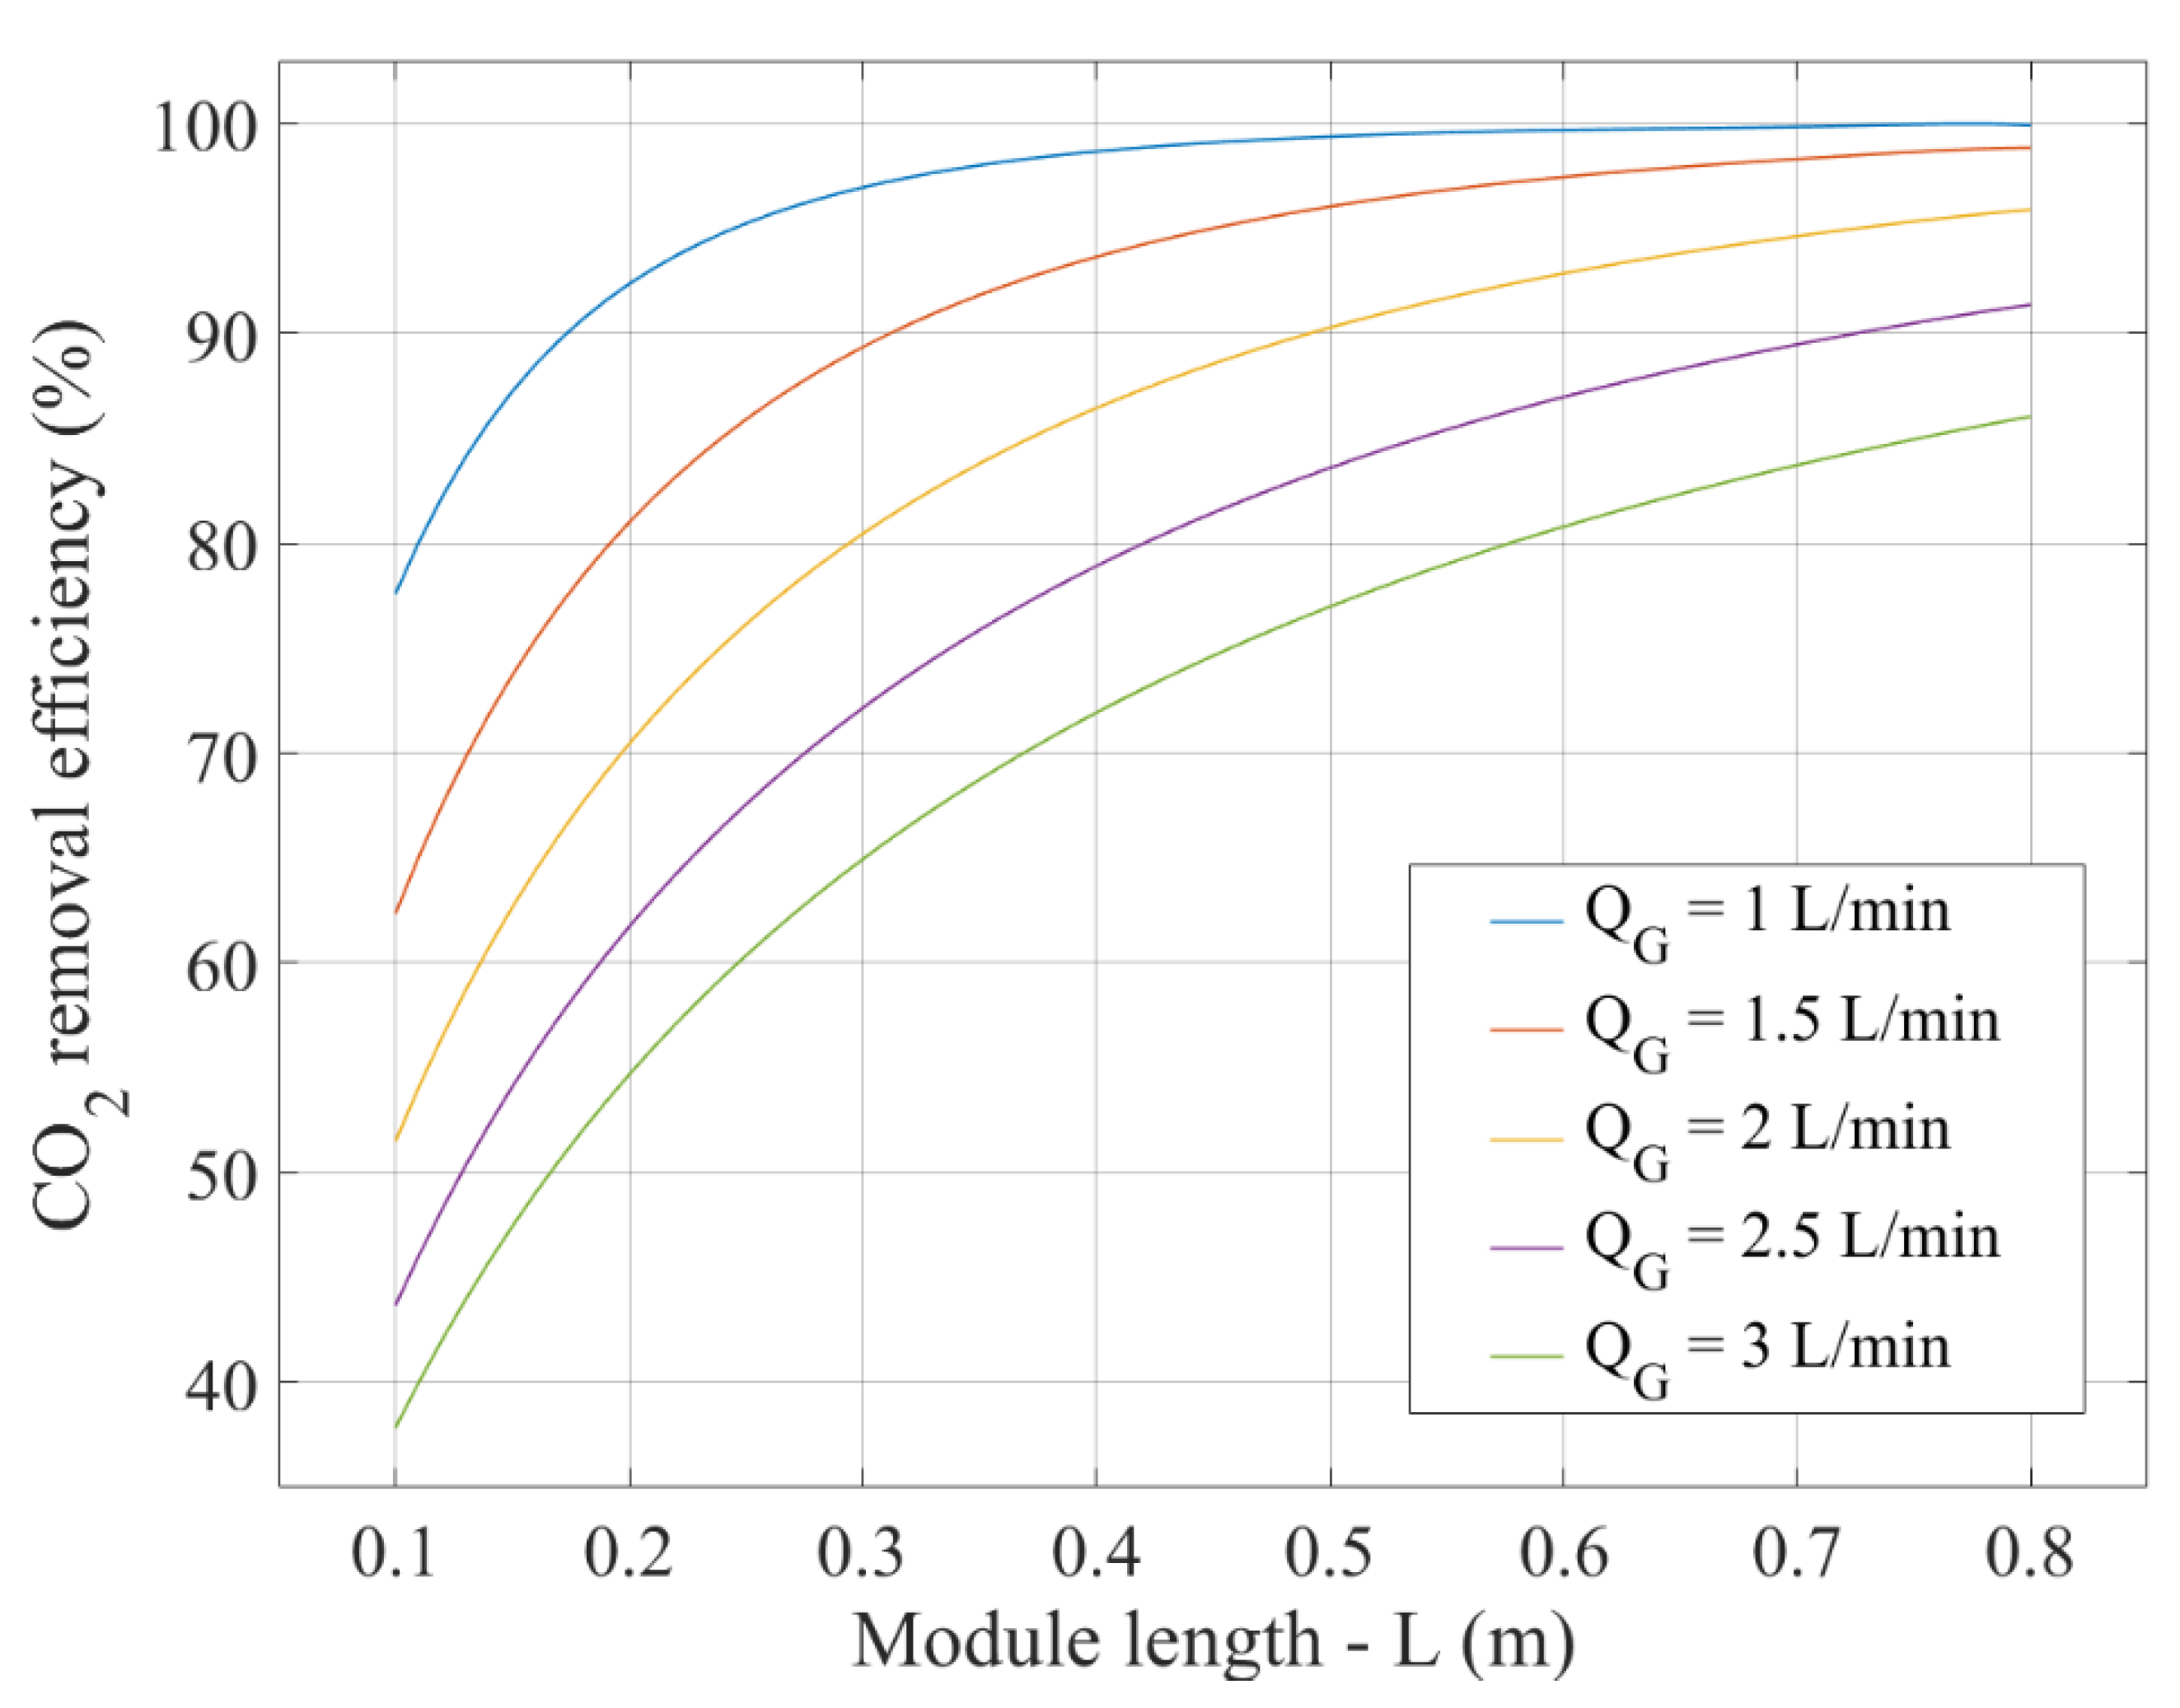
3.2.2. Influence of the Module Length on the CO2 Removal Efficiency

In determining the optimal operating conditions, the length of the module could be easily modified, in comparison with the number of fibers inside the HFMC, due to the membrane modularity, offering the possibility of extending the module by simply adding a new one, continuing the existing one [21].
The effect of the module length on the CO2 removal efficiency, for different gas flow rates (from 1 to 3 L ‧ min−1) and liquid flow rates (from 10 to 30 L ‧ h−1), is presented in Figure 11 and Figure 12.
As we expected, by increasing the length of the HFMC, the CO2 removal efficiency was increased, due to the increase in the residence time in the module, resulting in a higher surface area between the gas and liquid.
Initially, a small increase in the length of the module showed a significant increase in the CO2 removal efficiency, at a liquid flow rate of 1.5 L ‧ min−1. The CO2 removal efficiency was increased from 62% at 0.1 m to nearly 90% at 0.3 m of the module length. When the length of the module continued to increase, the CO2 removal efficiency reached the value of nearly 98% at a module length of 0.8 m. As seen in Figure 11, the CO2 removal efficiency was increased by 28% (from 62% to 90%) with the addition of 0.2 m in fiber length (from 0.1 to 0.3 m), and after the addition of another 0.5 m (from 0.3 to 0.8 m), the CO2 removal efficiency increased by only 8% (from 90% to 98%). This can be explained by the fact that the CO2 concentration gradient is higher on the inlet side of the system, and when the gas advances into the HFMC, the CO2 partial pressure in the gas phase decreases, due to the absorption in the liquid phase; as a result, the overall process velocity also decreases, requiring a longer contact time between the phases to obtain an increase in the efficiency of removing the CO2 from the gas.
The same effect was observed when the liquid flow rate was changed (Figure 12). At a liquid flow rate of 25 L ‧ h−1, the CO2 removal efficiency increased from 50%, at a module length of 0.1 m, to nearly 95% at a module length of 0.8 m.
It can be concluded that the length of the HFMC is an important factor in the efficiency of the absorption process; when increasing the length, leading to an increase in the contact time between the two phases, the impact of the CO2 removal efficiency is positive. However, it should be considered that a CO2 removal efficiency value greater than 90% requires longer fiber lengths, which leads to a higher operation/capital cost.

3.3. Dynamic Behavior

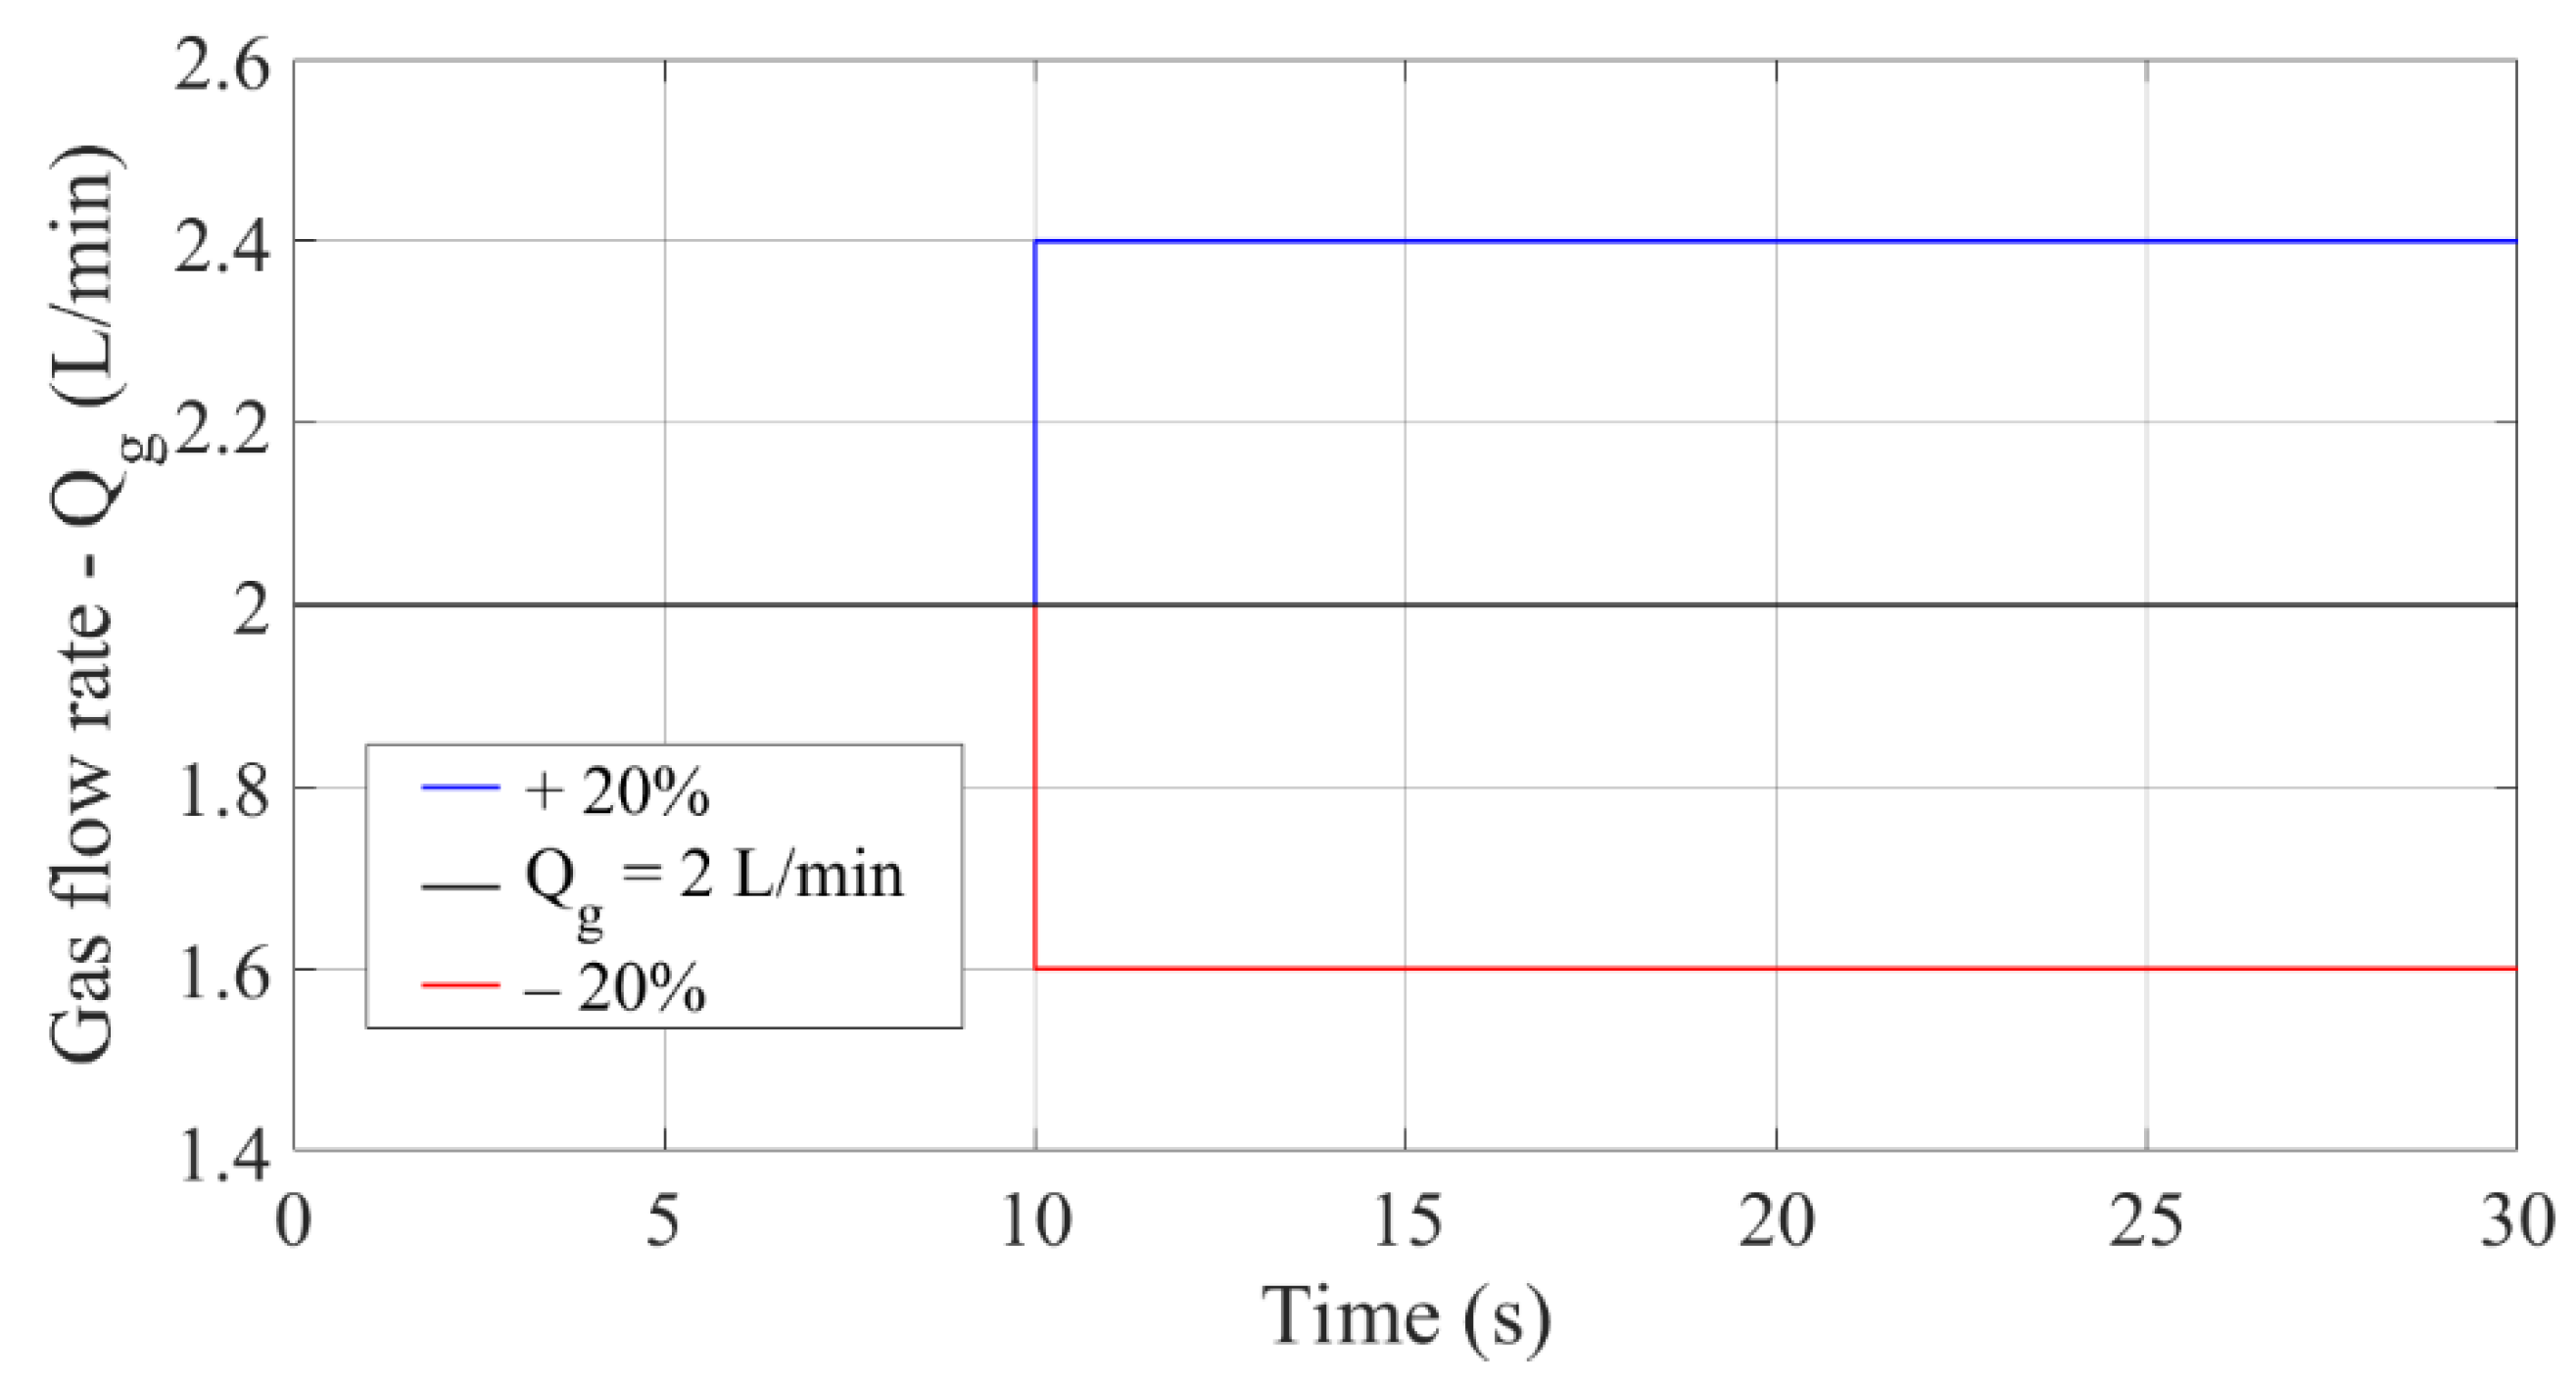
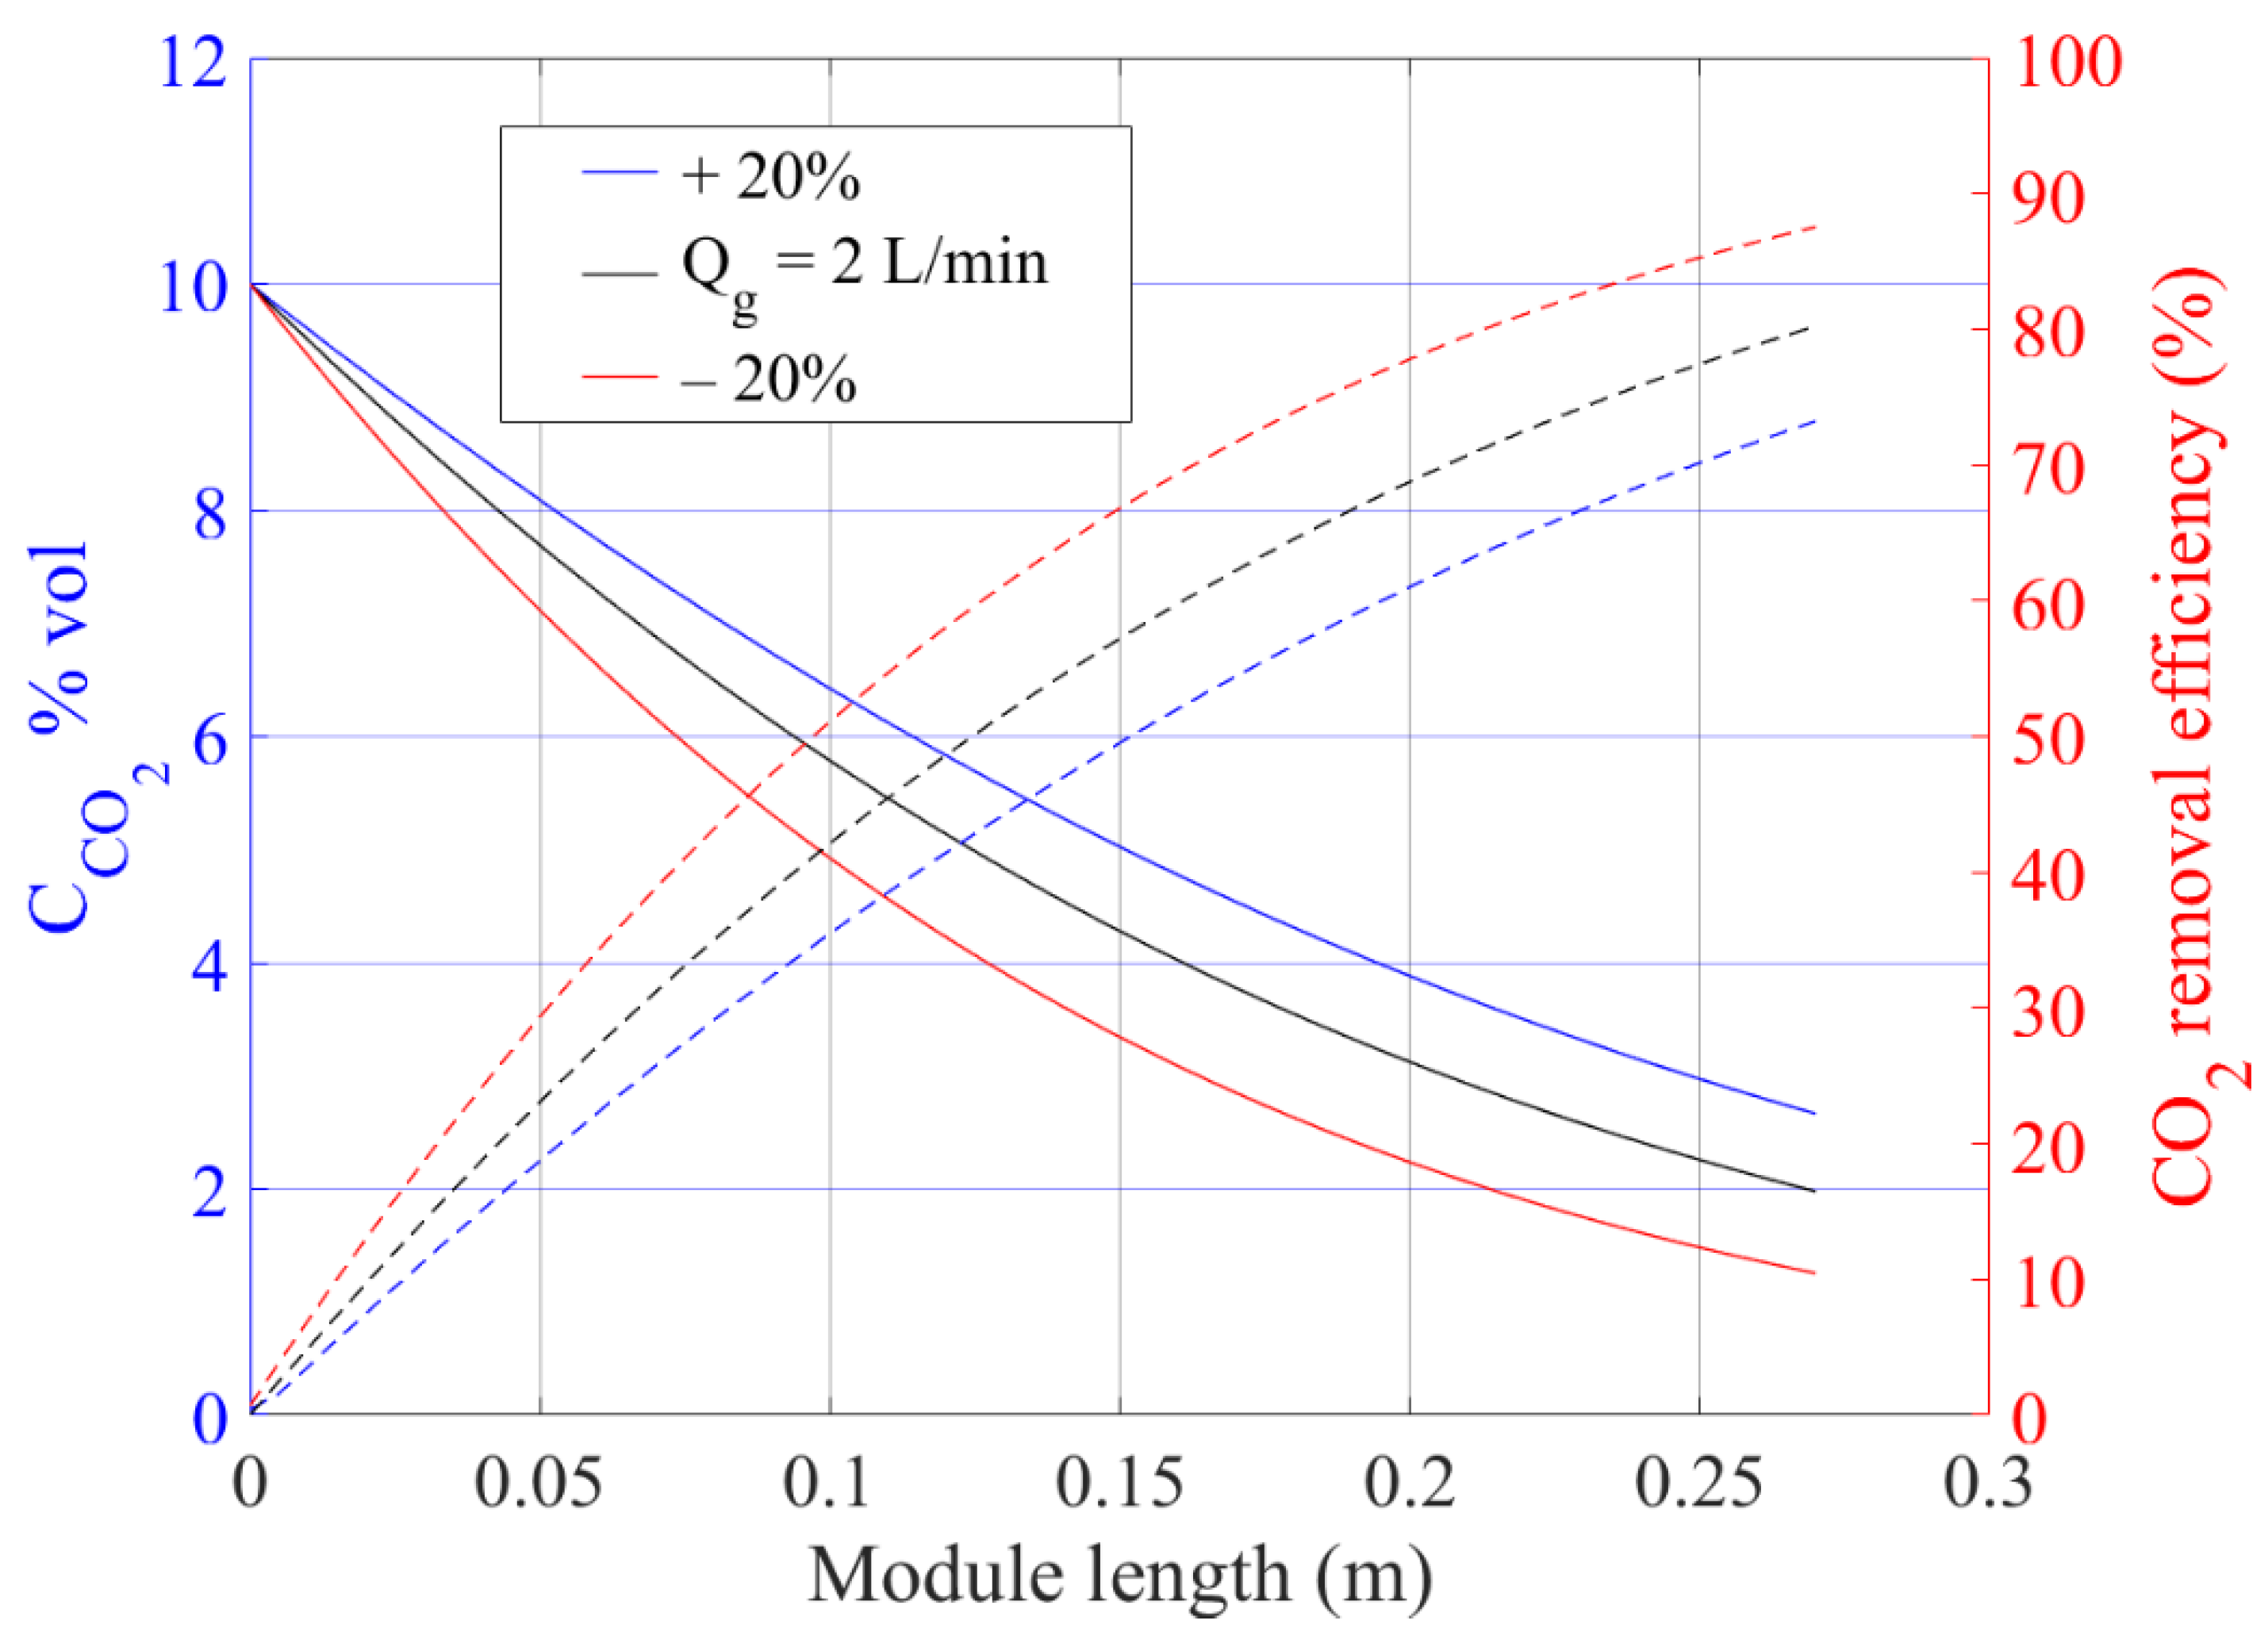
3.3.1. The System Response at Step Signal on the Gas Flow Rate

Due to the dynamic production process of electricity by power plants, the flow rate of the flue gases and the concentration in CO2 change over time [16]. It is important to predict the HFMC system’s response to these variations; thus, the application of step and ramp signals was considered.
In the first evaluated scenario, increasing and decreasing the inlet flue gas flow rates by 20% (from 2 L ‧ min−1), as a step function, was considered (Figure 13). The system response to the step function is represented in Figure 14 and Figure 15.
As shown in Figure 14, when the gas flow was increased, the concentration of CO2 in the gas phase increased along the module length, and the absorption efficiency decreased by approximately 8%. The effect can be explained by the decrease in the residence time in the absorber. The system reacts oppositely when the gas flow rate decreased by 20%, with the absorption efficiency increasing by approximately 9%.
Because of the increase in the gas flow rate, the quantity of CO2 absorbed increased, which led to a decrease in the MEA concentration (Figure 15), and the opposite effect occurred when the gas flow rate decreased.

3.3.2. The System Response at Ramp/Oscillatory Signal on the Gas Flow Rate

In order to be able to analyze the performance of the absorption system in a flexible scenario, an oscillatory change in the flue gas flow, over time, was considered (in Figure 16). This scenario was created to reproduce the variations in the flue gas flow, due to the increase and decrease in energy demand for the 24 h period (during the day, the energy demand is higher than at night) [44]. A simulation time of 75 h was considered to be able to represent three full cycles of 24 h. The variation in the gas flow rate was increased by 25% during the day, compared to the nominal value of QG = 1.5 L ‧ min−1, and a decrease with the same value occurred during the night. The increase and the decrease in the gas flow rate was achieved in the form of a ramp signal for a period of 3 h. The response of the system shows that when the gas flow rate increases by 25%, the CO2 removal efficiency decreases by approximately 7%, and the CO2 concentration in gas released into the atmosphere increases from 0.42 mol ‧ m−3 to 0.7 mol ‧ m−3.

4. Conclusions

A complex mathematical model for CO2 capture in MEA solutions, using a hollow-fiber membrane contactor, has been developed. The mass transfer coefficients were calculated and compared with those presented in the literature, and similar values were obtained. For a wide range of gas and liquid flow rates, the simulation results were compared with experimental data published in the literature. In terms of CO2 removal efficiency, a good correlation was observed (R2 > 0.96).
Based on the developed model, the effect of the number and length of the fibers on CO2 removal efficiency was evaluated. By increasing the number of fibers inside the HFMC, the mass transfer area between the gas and liquid was significantly increased, having a positive effect on the CO2 absorption efficiency. The CO2 removal efficiency increased from 20% at 150 fibers to 98% at 700 fibers due to the change in the gas flow rate (1 to 3 L ‧ min−1) and liquid flow rate (10 to 30 L ‧ h−1). The length of the HFMC is an important factor in the efficiency of the absorption process. The increased fiber module length led to an increase in the contact time between the two phases with a positive impact on the CO2 removal efficiency. However, it should be considered that a CO2 removal efficiency greater than 90% requires longer fiber lengths, which leads to higher operational/capital costs, due to the fact that the lifetime of the membranes is not too long.
Usually, the power plant is operated at full capacity during the day and at part-load or even shut down during the night. Therefore, the developed dynamic model was used to simulate the transient behavior of the CO2 absorption system due to an oscillatory change in the flue gas flow. In a flexible operation scenario of an absorption system, it was observed that the CO2 removal efficiency changed by approximately 7% during 24 h period.
The developed model could be used to evaluate the CO2 capture process in hollow-fiber membrane contactors for wide range of operating conditions in order to predict with accuracy the process parameters (liquid and gaseous flows, composition of the streams, mass transfer coefficient, etc.).

Author Contributions

Conceptualization, A.-C.B., A.-M.C., S.D. and C.D.; Investigation, A.-C.B., A.-M.C. and S.D.; Resources, C.-C.C.; Supervision, A.-M.C. and C.-C.C.; Validation, A.-C.B.; Visualization, S.D. and C.-C.C.; Writing—original draft, A.-C.B. and A.-M.C.; Writing—review & editing, A.-C.B., A.-M.C., C.D. and C.-C.C. All authors have read and agreed to the published version of the manuscript.

Funding

The research leading to these results received funding from the NO Grants 2014–2021, under project contract no. 13/2020 and from a grant from the Romanian Ministry of Education and Research, CCCDI—UEFISCDI, project number PN-III-P4-ID-PCE-2020-0632, within PNCDI III.

Informed Consent Statement

Not applicable.

Conflicts of Interest

The authors declare no conflict of interest.

Nomenclature

a e effective mass transfer area [m2/m3]
A G , A L tube (G) and shell (L) transversal section area [m2]
b MEA stoichiometric coefficient (b = 2),
C C O 2 G , C C O 2 L CO2 molar concentration in gas and liquid phase [kmol/m3]
C C O 2 G , e , C C O 2 L , e equilibrium CO2 molar concentration in gas and liquid phase [kmol/m3]
C M E A , C B MEA molar concentration in liquid phase [kmol/m3]
C A i CO2 molar concentration at the gas–liquid interface [kmol/m3]
C p G , C p L specific heat of gas and liquid phase [kJ/kg K]
d 1 inner fiber diameter of membrane [m]
d 2 outer fiber diameter of membrane [m]
d 3 effective diameter of shell [m]
d h hydraulic diameters of HFMC [m]
d l m logarithmic mean diameter of membrane [m]
d mod module inner diameter [m]
d p average pore diameter [m]
d e average inner diameter of shell [m]
D C O 2 , g , D C O 2 , l diffusion coefficient of CO2 in gas and liquid phase [m2/s]
D C O 2 , g , m diffusion coefficient of CO2 in membrane pores [m2/s]
D C O 2 , K n , D C O 2 , M Knudsen and molecular CO2 diffusion coefficient [m2/s]
D A , D B diffusion coefficient of CO2 and MEA in liquid phase [m2/s]
E enhancement factor [–]
F G , F L gas and liquid flow rate [m3/s]
h heat transfer coefficient [W/m2 K]
H a Hatta module [–]
H C O 2 , H C O 2 , M E A Henry’s coefficient of CO2 in the MEA solution [–]
k reaction rate constant [m3/kmol s]
k C O 2 , g partial mass transfer coefficient of CO2 inside the gas phase [m/s]
k C O 2 , m partial mass transfer coefficient of CO2 through the membrane [m/s]
k C O 2 , l , k l partial mass transfer coefficient of CO2 inside the liquid phase [m/s]
K G , K L overall mass transfer coefficient of CO2 inside the gas and liquid phase [m/s]
L module length [m]
M C O 2 CO2 molecular weight [kg/kmol]
N C O 2 CO2 molar flow across the gas–liquid interface [kmol/m2 s]
N R reaction rate of CO2 and MEA [kmol/m3 s]
n number of fibers [–]
P pressure [atm]
Re Reynolds number [–]
Q G , Q L gas and liquid flow rate [L/min], [L/h]
S c Schmidt number [–]
S h Sherwood number [–]
T L , T G liquid and gas temperature [K]
v G , v L gas and liquid velocity [m/s]
y C O 2 , 0 , y C H 4 , 0 inlet CO2 and CH4 molar fraction in gas phase [–]
MTmass transfer
PMT, GMTpartial and global mass transfer
Greek symbols
Δ H r reaction heat [kJ/kmol]
δ membrane thickness [m]
ε membrane porosity [–]
μ C O 2 dynamic viscosity of CO2 [Pa s]
υ L kinematic viscosity of liquid phase [m2/s]
ρ G , ρ L gas and liquid density [kg/m3]
τ membrane tortuosity [–]
Ω μ , Ω D viscosity and diffusion collision integrals [–]

References

  1. Cloy, J.M.; Smith, K.A. Greenhouse gas emissions. Ref. Modul. Earth Syst. Environ. Sci. 2015, 1–11. [Google Scholar] [CrossRef] [Green Version]
  2. Global Emissions-Center for Climate and Energy Solutions. Available online: https://www.c2es.org/content/international-emissions/ (accessed on 1 July 2022).
  3. The Paris Agreement, a Strategy for the Longer Term|World Resources Institute. Available online: https://www.wri.org/climate/expert-perspective/paris-agreement-strategy-longer-term (accessed on 1 July 2022).
  4. Climate Change14 March 2019. Available online: https://www.europarl.europa.eu/doceo/document/TA-8-2019-0217_EN.html (accessed on 1 July 2022).
  5. Szima, S.; Arnaiz Del Pozo, C.; Cloete, S.; Fogarasi, S.; Jiménez Álvaro, J.; Cormos, A.M.; Cormos, C.C.; Amini, S. Techno-Economic Assessment of IGCC Power Plants Using Gas Switching Technology to Minimize the Energy Penalty of CO2 Capture. Clean Technol. 2021, 3, 594–617. [Google Scholar] [CrossRef]
  6. Van Harmelen, T.; Koornneef, J.; Horssen, A.; Ramirez-Ramirez, C.A.; van Gijlswijk, R. The Impacts of CO2 Capture Technologies on Transboundary Air Pollution in The Netherlands; Copernicus Institute, Utrecht University: Utrecht, The Netherlands, 2008. [Google Scholar]
  7. Tan, L.S.; Shariff, A.M.; Lau, K.K.; Bustam, M.A. Factors Affecting CO2 Absorption Efficiency in Packed Column: A Review. J. Ind. Eng. Chem. 2012, 18, 1874–1883. [Google Scholar] [CrossRef]
  8. Tay, W.H.; Lau, K.K.; Lai, L.S.; Shariff, A.M.; Wang, T. Current Development and Challenges in the Intensified Absorption Technology for Natural Gas Purification at Offshore Condition. J. Nat. Gas. Sci. Eng. 2019, 71, 102977. [Google Scholar] [CrossRef]
  9. Schwendig, F. Carbon Capture and Storage. In Managing CO2 Emissions in the Chemical Industry; Wiley-VCH Verlag GmbH & Co. KGaA: Weinheim/Berlin, Germany, 2010. [Google Scholar] [CrossRef] [Green Version]
  10. Lepaumier, H.; Picq, D.; Carrette, P.L. Degradation Study of New Solvents for CO2 Capture in Post-Combustion. Energy Procedia 2009, 1, 893–900. [Google Scholar] [CrossRef] [Green Version]
  11. Aroonwilas, A.; Tontiwachwuthikul, P. High-Efficiency Structured Packing for CO2 Separation Using 2-Amino-2-Methyl-1-Propanol (AMP). Sep. Purif. Technol. 1997, 12, 67–79. [Google Scholar] [CrossRef]
  12. Yu, H. Recent developments in aqueous ammonia-based post-combustion CO2 capture technologies. Chin. J. Chem. Eng. 2018, 26, 2255–2265. [Google Scholar] [CrossRef]
  13. Rochelle, G.T.; Akinpelumi, K.; Gao, T.; Liu, C.T.; Suresh Babu, A.; Wu, Y. Pilot plant results with the piperazine advanced stripper at NGCC conditions. Int. J. Greenh. Gas Control. 2022, 113, 103551. [Google Scholar] [CrossRef]
  14. Moioli, S.; Ho, M.; Wiley, D.; Pellegrini, L. Assessment of carbon dioxide capture by precipitating potassium taurate solvent. Int. J. Greenh. Gas Control. 2019, 87, 159–169. [Google Scholar] [CrossRef]
  15. Yuan, Y.; Rochelle, G.T. CO2 absorption rate in semi-aqueous monoethanolamine. Chem. Eng. Sci. 2018, 182, 56–66. [Google Scholar] [CrossRef]
  16. Rao, A.B.; Rubin, E.S. A Technical, Economic, and Environmental Assessment of Amine-Based CO2 Capture Technology for Power Plant Greenhouse Gas Control. Environ. Sci. Technol. 2002, 36, 4467–4475. [Google Scholar] [CrossRef] [Green Version]
  17. Mansourizadeh, A.; Ismail, A.F. Hollow Fiber Gas–Liquid Membrane Contactors for Acid Gas Capture: A Review. J. Hazard. Mater. 2009, 171, 38–53. [Google Scholar] [CrossRef] [PubMed]
  18. DeMontigny, D.; Tontiwachwuthikul, P.; Chakma, A. Using Polypropylene and Polytetrafluoroethylene Membranes in a Membrane Contactor for CO2 Absorption. J. Membr. Sci. 2006, 277, 99–107. [Google Scholar] [CrossRef]
  19. Bottino, A.; Capannelli, G.; Comite, A.; di Felice, R.; Firpo, R. CO2 Removal from a Gas Stream by Membrane Contactor. Sep. Purif. Technol. 2008, 59, 85–90. [Google Scholar] [CrossRef]
  20. Jeong, D.H.; Realff, M.J. Modular Monolith Adsorbent Systems for CO2 Capture and Its Parameterized Optimization. Chem. Eng. Res. Des. 2021, 176, 1–13. [Google Scholar] [CrossRef]
  21. Gabelman, A.; Hwang, S.T. Hollow Fiber Membrane Contactors. J. Membr. Sci. 1999, 159, 61–106. [Google Scholar] [CrossRef]
  22. Feron, P.H.M.; Jansen, A.E. CO2 Separation with Polyolefin Membrane Contactors and Dedicated Absorption Liquids: Performances and Prospects. Sep. Purif. Technol. 2002, 27, 231–242. [Google Scholar] [CrossRef]
  23. Cesari, L.; Castel, C.; Favre, E. Membrane Contactors for Intensified Gas-Liquid Absorption Processes with Physical Solvents: A Critical Parametric Study. J. Membr. Sci. 2021, 635, 119377. [Google Scholar] [CrossRef]
  24. Cormos, A.M.; Dragan, S.; Cormos, C.C. Integration of membrane technology for decarbonization of gasification power plants: A techno-economic and environmental investigation. Appl. Therm. Eng. 2022, 205, 118078. [Google Scholar] [CrossRef]
  25. Kim, S.; Scholes, C.A.; Heath, D.E.; Kentish, S.E. Gas-Liquid Membrane Contactors for Carbon Dioxide Separation: A Review. Chem. Eng. J. 2021, 411, 128468. [Google Scholar] [CrossRef]
  26. Nakhjiri, A.T.; Heydarinasab, A.; Bakhtiari, O.; Mohammadi, T. Experimental Investigation and Mathematical Modeling of CO2 Sequestration from CO2/CH4 Gaseous Mixture Using MEA and TEA Aqueous Absorbents through Polypropylene Hollow Fiber Membrane Contactor. J. Membr. Sci. 2018, 565, 1–13. [Google Scholar] [CrossRef]
  27. Abdolahi-Mansoorkhani, H.; Seddighi, S. CO2 capture by modified hollow fiber membrane contactor: Numerical study on membrane structure and membrane wettability. Fuel Process. Technol. 2022, 209, 106530. [Google Scholar] [CrossRef]
  28. Faiz, R.; Al-Marzouqi, M. Mathematical modeling for the simultaneous absorption of CO2 and H2S using MEA in hollow fiber membrane contactors. J. Membr. Sci. 2009, 342, 269–278. [Google Scholar] [CrossRef]
  29. Ghobadi, J.; Ramirez, D.; Jerman, R.; Crane, M.; Khoramfar, S. CO2 separation performance of different diameter polytetrafluoroethylene hollow fiber membranes using gas-liquid membrane contacting system. J. Membr. Sci. 2018, 549, 75–83. [Google Scholar] [CrossRef]
  30. Dindore, V.Y.; Brilman, D.W.F.; Versteeg, G.F. Modelling of cross-flow membrane contactors: Mass transfer with chemical reactions. J. Membr. Sci. 2005, 255, 275–289. [Google Scholar] [CrossRef] [Green Version]
  31. Cormos, A.M.; Gaspar, J. Assessment of Mass Transfer and Hydraulic Aspects of CO2 Absorption in Packed Columns. Int. J. Greenh. Gas Control 2012, 6, 201–209. [Google Scholar] [CrossRef]
  32. Ramachandran, N.; Aboudheir, A.; Idem, R.; Tontiwachwuthikul, P. Kinetics of the Absorption of CO2 into Mixed Aqueous Loaded Solutions of Monoethanolamine and Methyldiethanolamine. Ind. Eng. Chem. Res. 2006, 45, 2608–2616. [Google Scholar] [CrossRef]
  33. Ma, C.; Pietrucci, F.; Andreoni, W. Capture and Release of CO2 in Monoethanolamine Aqueous Solutions: New Insights from First-Principles Reaction Dynamics. J. Chem. Theory Comput. 2015, 11, 3189–3198. [Google Scholar] [CrossRef]
  34. Bozga, G.; Munteanu, O.; Woinarschy, A. Applications to Chemical Reactors Design; Technical: Bucharest, Romania, 1984; pp. 312–367. (In Romanian) [Google Scholar]
  35. Krupiczka, R.; Rotkegel, A.; Ziobrowski, Z. Comparative Study of CO2 Absorption in Packed Column Using Imidazolium Based Ionic Liquids and MEA Solution. Sep. Purif. Technol. 2015, 149, 228–236. [Google Scholar] [CrossRef]
  36. Nil, S.; Takeuchi, H.; Takahashi, K. Removal of CO2 by Gas Absorption across a Polymeric Membrane. J. Chem. Eng. Jpn. 1992, 25, 67–72. [Google Scholar] [CrossRef] [Green Version]
  37. Kumar, P.S.; Hogendoorn, J.A.; Feron, P.H.M.; Versteeg, G.F. Approximate Solution to Predict the Enhancement Factor for the Reactive Absorption of a Gas in a Liquid Flowing through a Microporous Membrane Hollow Fiber. J. Membr. Sci. 2003, 213, 231–245. [Google Scholar] [CrossRef]
  38. Bozonc, A.C.; Cormos, A.M. Modeling and simulation of CO2 capture using MEA in hollow fiber membrane contactors. In Proceedings of the 9th European Young Engineers Conference, Virtual, 19–21 April 2021; Warsaw University of Technology: Warsaw, Poland, 2021; pp. 111–115, ISBN 978-83-936575-9-9. [Google Scholar]
  39. Khaisri, S.; deMontigny, D.; Tontiwachwuthikul, P.; Jiraratananon, R. CO2 Stripping from Monoethanolamine Using a Membrane Contactor. J. Membr. Sci. 2011, 376, 110–118. [Google Scholar] [CrossRef]
  40. Yang, M.-C.; Cussler, E.L. Designing Hollow-Fiber Contactors. AIChE J. 1986, 32, 1910–1916. [Google Scholar] [CrossRef]
  41. Qi, Z.; Cussler, E.L. Microporous Hollow Fibers for Gas Absorption: II. Mass Transfer across the Membrane. J. Membr. Sci. 1985, 23, 333–345. [Google Scholar] [CrossRef]
  42. Mavroudi, M.; Kaldis, S.P.; Sakellaropoulos, G.P. A Study of Mass Transfer Resistance in Membrane Gas–Liquid Contacting Processes. J. Membr. Sci. 2006, 272, 103–115. [Google Scholar] [CrossRef]
  43. Kreulen, H.; Smolders, C.A.; Versteeg, G.F.; van Swaaij, W.P.M. Determination of Mass Transfer Rates in Wetted and Non-Wetted Microporous Membranes. Chem. Eng. Sci. 1993, 48, 2093–2102. [Google Scholar] [CrossRef] [Green Version]
  44. Cormos, A.M.; Simon, A. Assessment of CO2 Capture by Calcium Looping (CaL) Process in a Flexible Power Plant Operation Scenario. Appl. Therm. Eng. 2015, 80, 319–327. [Google Scholar] [CrossRef]
Figure 1. A schematic flowsheet configuration of CO2 capture using aqueous MEA solution in an absorption–desorption gas–liquid process.
Energies 15 07241 g001
Figure 2. Schematic representation of the hollow-fiber membrane contactor for CO2 absorption process [25].
Energies 15 07241 g002
Figure 3. Phase flow model inside the HFMC. (a). Gas mixture—tube and liquid solution—shell, (b). Liquid solution—tube and gas mixture—shell.
Energies 15 07241 g003
Figure 4. Block flow diagram of the used algorithm.
Energies 15 07241 g004
Figure 5. CO2 removal efficiency at different gas flow rates, Q L = 25 L h 1 .
Energies 15 07241 g005
Figure 6. CO2 removal efficiency at different liquid flow rates, Q G = 2 L min 1
Energies 15 07241 g006
Figure 7. Gas flow rate and CO2 gas concentration profiles over the module length, Q L = 25 L h 1 .
Energies 15 07241 g007
Figure 8. CO2 removal efficiency and MEA concentration in liquid phase over the module length, Q L = 25 L h 1 .
Energies 15 07241 g008
Figure 9. Effect of the number of fibers on the CO2 removal efficiency at different gas flow rates, Q L = 25 L h 1 .
Energies 15 07241 g009
Figure 10. Effect of the number of fibers on the CO2 removal efficiency at different liquid flow rates, Q G = 2 L min 1 .
Energies 15 07241 g010
Figure 11. Effect of the module length on the CO2 removal efficiency at different gas flow rates, Q L = 25 L h 1 .
Energies 15 07241 g011
Figure 12. Effect of the module length on the CO2 removal efficiency at different liquid flow rates, Q G = 2 L min 1 .
Energies 15 07241 g012
Figure 13. Step signal for intel flue gas scenario (increase/decrease).
Energies 15 07241 g013
Figure 14. CO2 concentration in gas (on the left, represented by solid lines) and CO2 removal efficiency (on the right, represented by the dashed lines) over the module length (increase/decrease scenarios of gas flow rate).
Energies 15 07241 g014
Figure 15. MEA concentration in liquid phase over the module length. Initial and new steady-state profiles (increase/decrease scenarios of gas flow rate).
Energies 15 07241 g015
Figure 16. Gas flow variation scenario and the system’s response to the variation in time.
Energies 15 07241 g016
Table 1. Dynamic mathematical model balance equations.
Total mass balance
Liquid phase F L t = v L F L z + v L A L a e N C O 2 M C O 2 ρ L (9)
Gas phase F G t = v G F G z v G A G a e N C O 2 M C O 2 ρ G (10)
Components’ mass balance
Liquid phase C M E A t = v L C M E A z 2 N R (11)
C C O 2 L t = v L C C O 2 L z + a e N C O 2 N R (12)
Gas phase C C O 2 G t = v G C C O 2 G z a e N C O 2 (13)
Heat balance
Liquid phase T L t = v L T L z + h a e ( T G T L ) ρ L c p L Δ H r N R ρ L c p L (14)
Gas phase T G t = v G T G z h a e ( T G T L ) ρ G c p G (15)
L, G represent the liquid and gas phase; z, t represent the space and time dependence of variables.
Table 2. Polypropylene HFMC module properties [26].
Parameter (Unit)SymbolValue
Inner fiber diameter (m) d 1 3.5 × 10 4
Outer fiber diameter (m) d 2 4 × 10 4
Module inner diameter (m) d mod 1.512 × 10 3
Module length (m) L 0.27
Average pore diameter (μm) d p 0.1
Membrane porosity (–) ε 0.17
Voidage (–) φ 0.93
Tortuosity (–) τ 19.7
Number of fibers (–) n 510
Membrane thickness (m) δ 2.5 × 10 5
Table 3. Operating conditions of HFMC [26].
Parameter (Unit)SymbolValue
Pressure (bar) P 1
Temperature (K) T 298.15
Liquid flow rate (L ‧ h−1) Q L 10 30
Gas flow rate (L ‧ min−1) Q G 1 2.75
Gas composition (—)
CO2 y C O 2 , 0 0.1
CH4 y C H 4 , 0 0.9
MEA concentration (wt%) C MEA 5
Publisher’s Note: MDPI stays neutral with regard to jurisdictional claims in published maps and institutional affiliations.

