
Black Start Capability from Large Industrial Consumers


1
School of Engineering, Cardiff University, Cardiff CF24 3AA, UK
2
National Grid Electricity Transmission Plc, London WC2N 5EH, UK
*
Author to whom correspondence should be addressed.
Energies 2022, 15(19), 7262; https://0-doi-org.brum.beds.ac.uk/10.3390/en15197262
Submission received: 21 August 2022
/
Revised: 27 September 2022
/
Accepted: 28 September 2022
/
Published: 3 October 2022
(This article belongs to the Special Issue Intelligent Control for Future Systems)
Abstract
:The way of control and operation of an electrical power system has been changing rapidly with the integration of renewable energy sources (RES). One of the emerging issues that require addressing is the capability of RES to participate in the restoration process upon a total or partial system failure. However, with the continuous shutdown of large-centralised generators, which traditionally provided the black start support together with the variability of RES, the restoration process becomes much more complex. Primarily, the RES should have enough capacity to energise the load at the time of the restoration. Nonetheless, due to significant advantages, there is an increasing trend to use RES to meet the local energy demand by large industrial customers. The flexibility of shifting loads together with the surplus of RE generation could support the system operator during the system energisation process after a blackout. This paper mainly focuses on identifying the capabilities and factors that should be accounted for to participate in the system restoration process by large industrial consumers. The case study conducted on a large-scale steel factory in the UK reveals the possibility of supporting the restoration process under the bottom-up approach.
1. Introduction
The depletion of fossil-fuel resources together with adverse climate effects has given rise to the move to cleaner and greener energy resources over the past few decades. This has been further incentivised by different policy goals introduced by nations around the world to reduce their carbon footprint. For instance, the UK’s ambitious target to become net-zero by 2050 and the decarbonisation pathways to a net-zero in European Union (EU) reducing the EU’s emissions by 55% by 2030 are notable [1,2].
Together with the growth of industrial and residential energy demand, existing distribution networks experience different sets of challenges [3]. For instance, the congestion of distribution networks and unbalanced conditions of the three-phase AC network. These issues may result in system instability and force distribution network operators to expand and reinforce their grid infrastructures. Thus, integrating distributed energy resources (DERs) can help to improve system efficiency, reliability, and resiliency [4]. Among the most widely installed inverter-based DERs, solar PV and onshore wind power plants (Type-4) are traditionally designed to operate under grid-following mode [5]. In this mode, the inverter is controlled as a current source and the frequency is set by phase-locking to the existing grid [6]. However, an essential feature of grid-connected inverters to support system restoration is the capability to act as an anchor generator (i.e., to operate as a voltage source) [7].
The capability to provide black start service from these inverter-based DERs has been extensively investigated in the literature. In [8], a decentralised control system for the black start of wind energy conversion systems was proposed in which the total wind power is regulated to match the demand during the black start process. An optimisation method to enhance the efficiency of system restoration using solar PV was proposed in [9]. In [10], it was demonstrated that the use of a battery energy storage system (BESS) coupled with a solar PV system can be used to support the system restoration process. The use of BESS will help minimise the intermittent nature of solar PV and improves the resilience of solar PV to participate as a black start provider. Further, the ongoing work by several leading industries on grid-forming controls to allow wind and solar inverters to form voltage and frequency levels like traditional generators is notable [11,12,13]. However, continuous research and development are essential to uplift the technology readiness level of the black start capability of these DERs.
Upon a blackout, the electricity network should re-energise in a timely and orderly manner. For instance, as defined by the GB National Grid Electricity System Operator (ESO), the black start is “the procedure uses to restore power in the event of a total or partial shutdown of the national electricity transmission system” [14]. The expected requirements to meet by the black start provider are (a) the ability to start up the main generating plant of the station from shutdown without the use of external power supplies, (b) the capability to accept instantaneous loading of demand blocks and control frequency and voltage levels within acceptable limits, (c) facilities to ensure that all generating units can be safely shutdown without the need for external supplies, and (d) the reactive capability to charge the immediate transmission and/or distribution systems.
All the above four requirements can only be provided by synchronous generators and there is currently a top-down (transmission-led) approach of starting large generators and energising a section of the transmission network. To date, this has been provided by coal- or gas-fired generation, with support from hydro and pumped-storage and biomass plants [15]. However, with a decreased number of traditional providers, it is necessary to identify technical capabilities from other non-conventional generating sources to participate in the system restoration process. Further, the revision of the conventional restoration process, which is based on the top-down approach (first energise the transmission lines and then energise the medium voltage distribution system) is necessary.
Even though the probability of occurrence of a total system failure is very low, it can happen at any time of the day throughout the year. The rapid integration of DERs presents an opportunity to develop a novel and innovative approach to the system restoration process. As energy systems continue to decarbonise and decentralise, innovative projects such as the Distributed ReStart, which looks at how DERs can be used to restore power in the GB electricity transmission system, are important [16].
The Distributed ReStart project is made up of five workstreams; (a) organisational systems and telecommunications, (b) power engineering and trials, (c) procurement and compliance, (d) project direction, and (e) knowledge dissemination workstreams. The first three workstreams cover the technical issues to enable black start services from DERs. The outcome of this project helps to identify the competencies of these generation technologies in terms of shutdown resilience, black start performance, and restoration capabilities [17]. However, the flexibility of large industrial prosumers to provide black start support has not been considered in this project.
Given the shortcomings found in the work published in open literature, this paper aims at fulfilling two main research gaps; (a) investigate the flexibility of large industrial consumers with reference to a steel production plant with a 90 MW peak load. (b) identify the qualitative and quantitative factors that need to be accounted for by large industrial consumers to participate in future black start services.
2. Opportunities for Emerging Generation Technologies
At present, a majority of the large industrial facilities are equipped with standby diesel generators to supply electricity to critical plant processes upon the loss of grid infeed. However, the capability of adjusting plant processes (flexibility of loads) provides the opportunity to participate in the demand response program with additional resources installed at the site. The main objective of this section is to identify the capabilities of large industrial plants to support the system restoration process upon total or partial system failure. As discussed in [18], when incorporating DERs for system restoration, there are two main obstacles that require addressing.
- The firmness of Availability—The intermittent nature of renewable energy sources makes it difficult to guarantee the energy/power it can provide at any time of the day irrespective of the season.
- Size and Location of Assets—The current Black Start Service option of Great Britain requires that the asset can energise in block sizes of 50 MW, for Distribution Network Operators (DNOs) to be able to reconnect blocks of load. Only the generating sources connected to the transmission voltage levels can provide this service at present. Since there is a considerable amount of DERs connected to the medium voltage distribution network, existing requirements are also a barrier to serving as a Black Start provider.
However, the benefits of DERs are that they provide an alternative to traditional large generators and could reduce the costs associated with large generator readiness. Increased participation from DERs is also necessary for the bottom-up or hybrid (a mix of both top-down and bottom-up) approach as traditional larger thermal plants are almost no longer in service.
2.1. Opportunities for Emerging Generation Technologies (Synchronous and Non-Synchronous) to Participate in Black Start Services
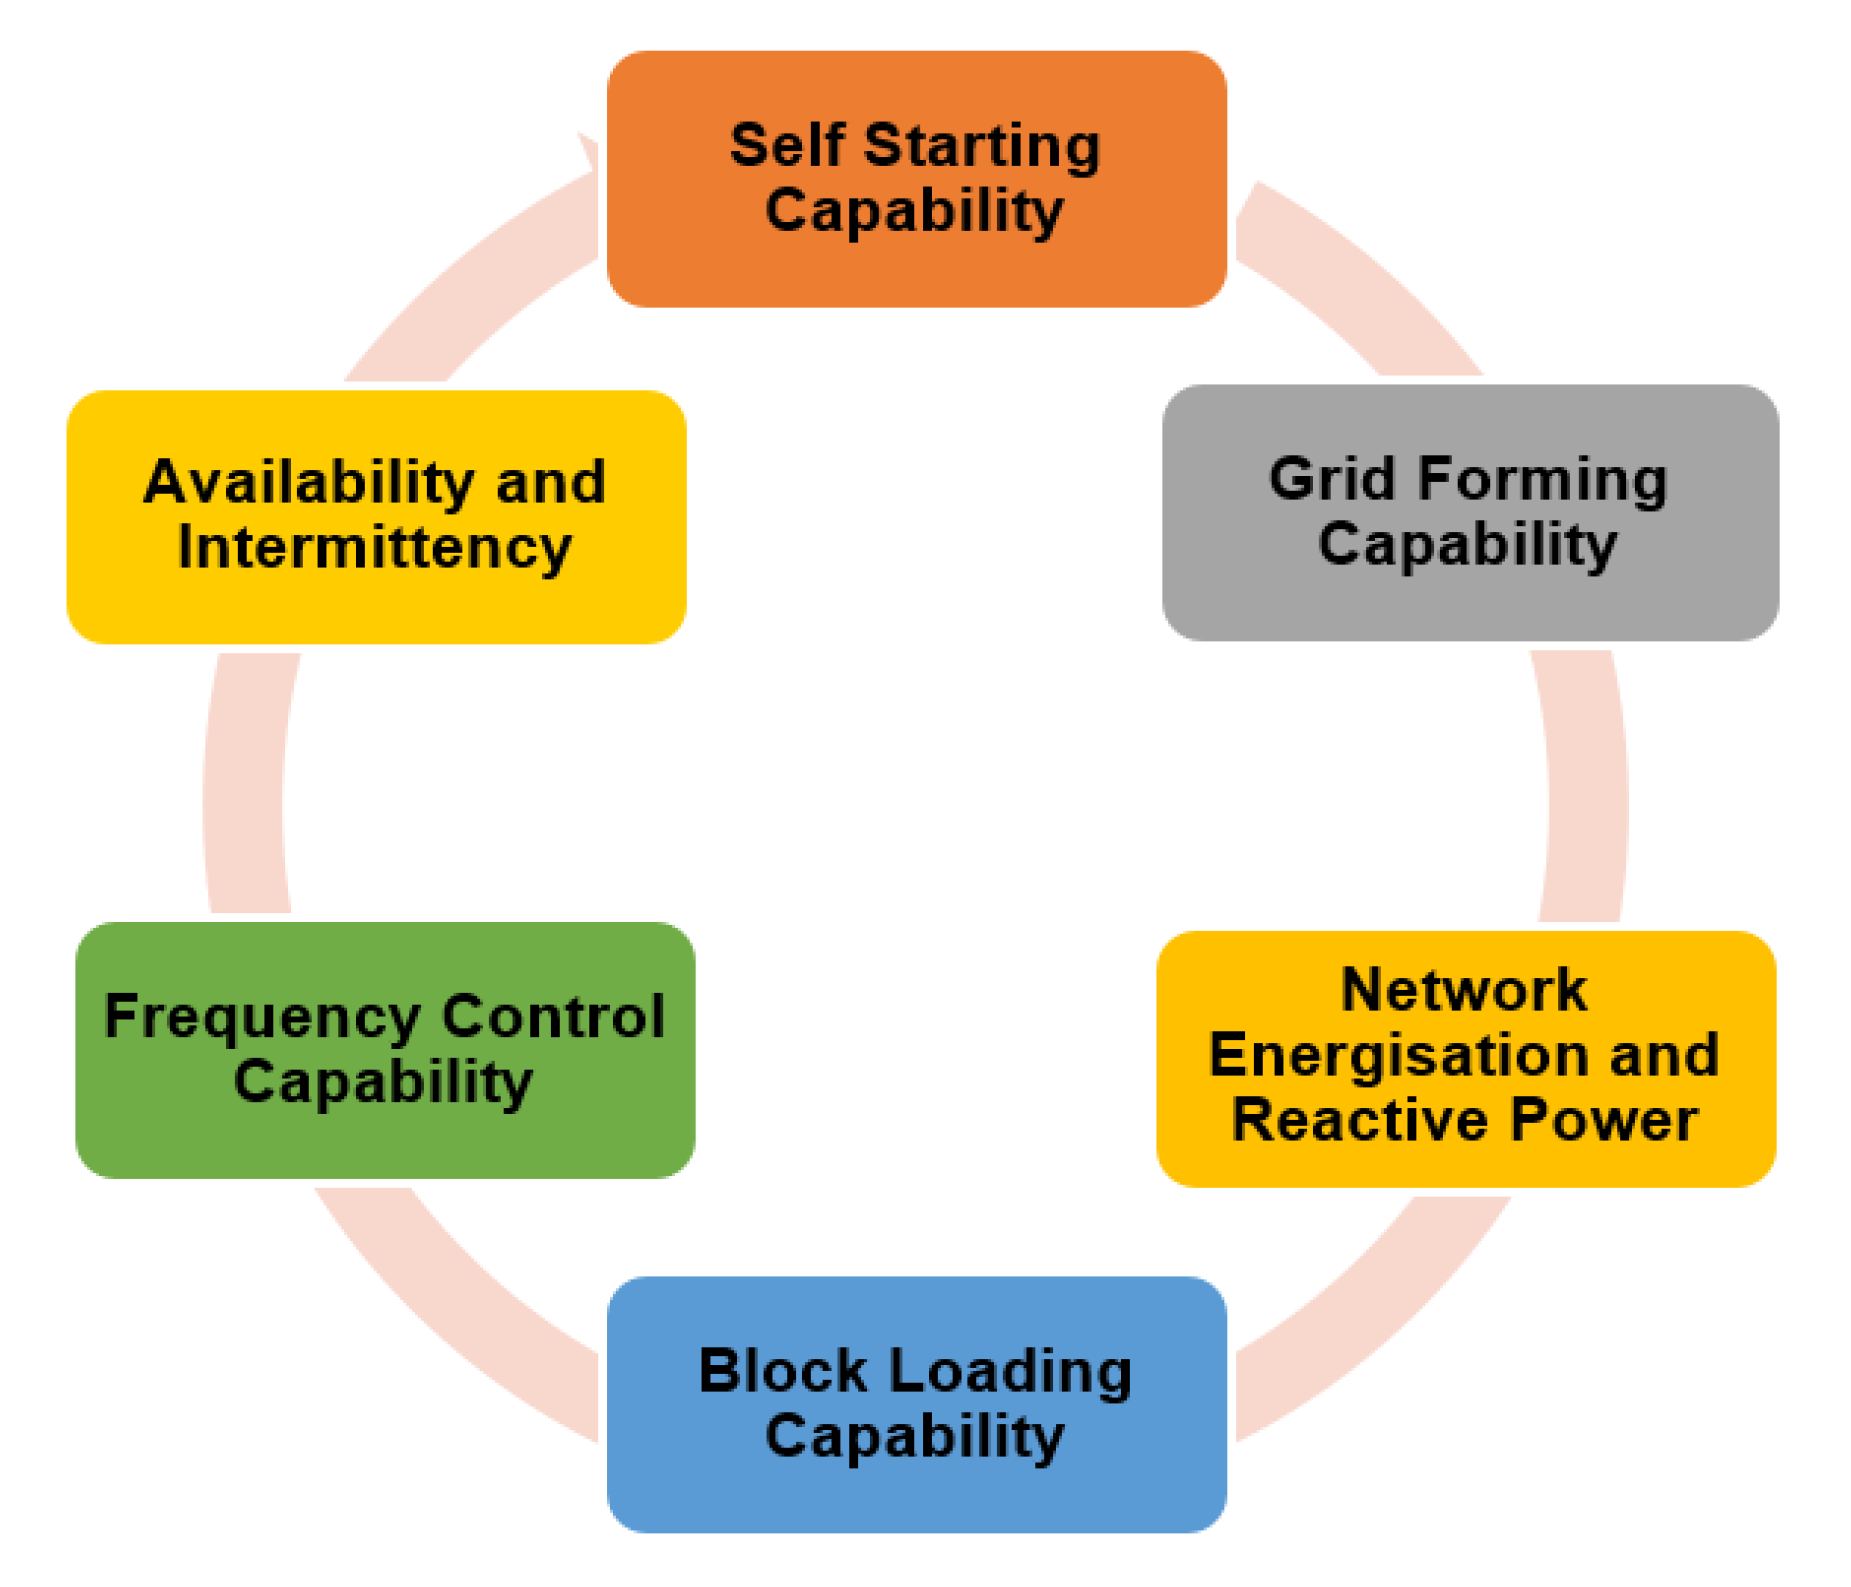
In this section, we aim to identify the capabilities of emerging generator technologies that can participate in the system restoration process. Here, emerging generation technologies are defined as generation resources that have been not used for Black Start in the past such as coal-fired generation, large-scale diesel, and gas-fired generation facilities. The technologies of interest are small-scale wind (<30 MW), Commercial PV (≤10 MW), small-scale waste- and natural-gas plants, and battery storage systems. In general, the above-mentioned DERs are used to supply energy to in-house production processes economically. However, following a system outage, if these DERs can support the system restoration process it will be advantageous for both the plant owner as well as the ESO. Under the assumption that the industrial plant is capable of supporting the system restoration, the technical capabilities of DER technologies are reviewed as shown in Figure 1.
- Small scale wind plants:
Most of the commercially available small-scale onshore wind turbines (WT) are of Type-3 variable speed with partial scale power electronics converters (also known as a doubly-fed induction generator, i.e., DFIG) or Type-4 direct-in-line variable speed wind turbine with a full-scale power converter.
The main drawback of the DFIG is its requirement of external power for energisation making it incapable of acting as an anchor generator to create a power island. A novel grid forming control for DFIG to participate in the Black Start procedure is proposed in [19]. It mainly considers the ability to control voltage and frequency in the islanded system after a blackout. As the DFIG loses its support of voltage and frequency from the main grid, the traditional vector control that acts as a current source no longer satisfies grid needs, thus a control strategy that provides voltage and frequency support is needed. In [20], an improved virtual synchronous control strategy of a DFIG is proposed to achieve Black Start and stand-alone operation at a low voltage level with wind energy.
In general, WTs are equipped with an internal power supply, which also includes small energy storage, like an uninterruptible power supply (UPS), which can help the WT to supply critical components. However, large industrial plants are normally equipped with backup generators (diesel), and it only requires a fraction of the WT’s rated power to start up. Otherwise, an electrical energy storage system has the potential to provide the power to start a WT. Further, a firmware change of the grid-forming inverter is also a feasible option to unlock this capability in the future [21]. Below are some of the technical constraints, which need to be considered further to participate in a system restoration process by WTs.
- (i)
- Reactive Power: Reactive power support capability will depend on the wind turbine technology (Type-4 full-scale inverter typically has the best capability) as well as the availability of additional reactive power compensation equipment installed at a site. Small-scale wind farms have the capability to provide reactive power service on a small scale.
- (ii)
- Frequency Control: The grid-decoupled nature of both DFIG and fully converter-fed synchronous generators (electrically excited or permanent magnet) deployed in modern wind farms implies a very low contribution to network inertia in the conventional sense. Associated voltage and frequency control will be dependent on the technology of the wind farm-to-grid connection and the availability of compatible control algorithms. In terms of frequency control, this will also depend on the available wind resource since low wind conditions will limit the capacity of the wind farm to ramp up the active power supply [21].
- (iii)
- Availability and Intermittency: Wind resource is intermittent and may not be available or sufficient for a Black Start demand at such times as it is needed. For a given wind speed, however, it has the capability to control the output of a wind turbine. Wind power intermittency can be mitigated by different technological solutions. Energy storage is the most prevalent wind power intermittency mitigation approach. High-accuracy wind speed and wind power forecasting methods can also be utilised to reduce the impact of intermittency.
Further, in the grid-forming mode, the control of the WT converter while operating as a voltage source during the process of creating a power island could be challenging. This is due to situations where step changes in active and reactive power (up/down) are due to the connection/disconnection of auxiliary loads. Further, if the blackout occurs during grid export mode, the self-sustaining capability of WTs is an important fact to consider.
- Solar PV:
Owing to higher efficiency, reliability, and faster dynamic response of the voltage source inverter (VSI) technology (compared to current source inverter technology) has proven to be more suitable in commercial-scale solar PV applications, such as steel- and glass-manufacturing industries. Applications of modern DERs introduce new requirements of high-quality electric power, flexibility, and reliability. It is worth noting that some additional electrical connection arrangements are required when PV systems supply energy to the in-house production process and intend to serve as a Black Start supporting generation unit.
In general, conventional PV systems are interfaced by grid-connected inverters, which fail to support the grid and participate in ancillary services provided by typical synchronous generators such as frequency regulation. Most solar PV connections are made through a grid-following inverter, which is not able to produce its voltage signal to energise a network, instead of latching on to a pre-existing voltage signal. However, using the virtual synchronous generator (VSG) technology, it is possible to support the grid during the system restoration [22]. Compared with the conventional PV system, the grid-supporting PV system, behaving as an inertial voltage source like synchronous generators, has the capability of participating in frequency regulation and providing inertia.
Availability to provide Black Start service from solar PV is limited to daylight only. Depending on weather conditions, including climatic concerns for GB, solar power coupled with energy storage or diesel generation can be designed to provide night-time emergency power. The bottom-up restoration requires some form of energy storage or backup generation to mitigate weather intermittency as well. The ability to cater to reactive power requirements from solar PV is dependent on the converter subsystem. Inverters have reactive power management capability and are able to supply or absorb reactive power, usually up to a 0.8 power factor. However, the specified 100 MVar margin is not achievable by a single site or any DER sites. With proper coordination and control with nearby Black Start generating units, this is achievable.
Most grid-connected loads such as water pumps, washing machines, dishwashers, heat pumps, etc. fall under the category of inductive loads. During the energisation, these loads are encountered which can result in large transient inrush currents (typically six to eight times the rated current), which the typical solar PV inverter is unlikely to be able to provide [23]. This phenomenon should be investigated in detail if solar PV systems intend to participate as primary Black Start providers.
- Small Scale Waste and Natural Gas Plants:
A majority of large industrial plants usually have onsite generators to improve energy efficiency and reduce energy costs. Part of these onsite generators mainly consumes the waste gas/heat produced by the production processes. For example, in a steelmaking plant, the waste gases from production processes are primarily used to feed into processes such as coke ovens. The rest of the waste gases could feed into boilers to produce steam or other products such as renewable liquid fuels [24]. Waste- and natural-gas units both use a steam turbine, from burning waste and evaporating liquid air, respectively, and they are required to operate with a minimum threshold value without rapid start-up and shut-down.
As these plants are synchronous generators, they inherently have the capability to be grid-forming as they are rotating machines [21]. These generators are capable of controlling frequency and voltage levels. Hence, they can form a Power Island and therefore, be able to rely on their on-site backup generation to energise the starting procedures as well as communicate with the system operator.
- Energy Storage Systems:
The introduction of REs is one of the primary drivers behind the interest in energy storage systems (ESS). It is considered one of the most suitable options to provide energy system flexibility, and it can generally be deployed quickly and modularly when and where flexibility is needed. At the utility level, energy storage is also important for energy management, frequency regulation, peak shaving, load levelling, seasonal storage, and standby generation during a fault. In [25], it has shown that large industrial sites (grid-connected, weak grid, or off-grid) can gain benefits economically, environmentally, and operationally if ESS are utilised.
The electrical energy storage system can be mainly categorised into five sections [26]: mechanical, electrochemical, electrical, chemical, and thermal as shown in Figure 2. Compared with conventional energy storage methods, battery technologies are desirable energy storage devices for large-scale electrical energy storage. Unlike conventional energy storage approaches (e.g., pumped hydroelectric power, compressed air energy storage, thermal energy storage), BESS are promising candidates for large scale applications such as industrial plants.
In [27], it has successfully demonstrated the use of a BESS to provide a Black Start, firing up a combined cycle gas turbine from an idle state. This is one of the most recent examples to showcase the capability of BESS to create power islands. Further, ESS can provide different services, which have different user-specific values. TSO and DNO could use storage for the deferral of network expansion, to manage grid congestion, or for the provision of ancillary services to maintain system stability (voltage support in weak grids, fast frequency response (FFR), black-Start capability) [26].
Large industrial sites could use ESS together with wind, solar PV, or other intermittent DERs to provide the firm capacity to the grid when they participate in demand response programs. Additionally, a wider range of ancillary services such as frequency containment reserve (FCR), Frequency restoration reserve (FRR), FFR, and reactive power can also be provided using BESS. Deploying a suitable storage technology is beneficial to meet in-house energy demand as well as to support system energisation as a primary restoration provider. Further, different vendors [25,28] now come up with different commercial-scale BESS solutions ranging from DERs capacity firming, load shifting, and Black Start, to frequency regulation.
2.2. The Advantages of Co-Locating Different DER Resources (Hybrid Systems)
Co-location refers to connecting a wind, solar PV farm, etc., and energy storage at the same grid node (also known as the point of common coupling). In this case, the asset owner requires to comply with a set of connection requirements (grid code) covering the capabilities and functionalities of the combined facility. In this study, we focus on the services that can be provided by large industrial sites with on-site wind and solar PV farms; particularly related to Black Start support capability. It is important to note that these services can be combined to increase the value of the storage assets under co-location. Further, it can be identified that Black Start is one of the ancillary services out of many which can be provided when co-locating DERs.
Table 1 presents an overview of electricity storage services, classified into ancillary services, energy time shift, and grid adequacy. Each of the services can help with the better functioning of the network across various markets and mechanisms. Co-located BESS and DERs can also be used to reduce imbalances, which are caused by wind and PV forecasting errors. Reducing imbalances might prove economic benefits with a high level of accuracy (e.g., response to demand request), or prevent paying high penalties associated with non-compliances [26]. Further, combined BESS, wind, and solar PV can be used to control reactive power and thus manage system voltage during network restoration. However, their capacity for providing reactive power at times of high load and low resources (wind, sun) is limited since the occurrence of system failures are highly unpredictable. However, this can create an incentive to deploy distributed storage, which is perfectly suited to provide voltage control.
3. Black Start Support Capability from Large Industrial Consumers
In Section 2, we have broadly discussed the opportunities and capabilities of emerging DER resources to participate in the Black Start service, which can be installed at large industrial facilities. In general, any commercial/domestic customer always attempts to avoid high electricity bills. This is equally valid for large industrial plants, which look for low-cost alternative energy sources to supply their demand with minimum grid import.
As highlighted in [29], the ability of emerging DER technologies to act as grid forming (anchor) generator is essential. In this regard, voltage and frequency control capabilities, as well as reactive power capability of these resources should be evaluated. As discussed in Section 2, BESS is capable of establishing an independent voltage source. However, in an industrial plant, BESS is used for different purposes and the state-of-charge (SoC) of the BESS plays a critical role when system energisation initiates. Therefore, relying on a single anchor generator could have adverse effects on system restoration time even though the technology readiness level of such sources is higher. Further, other synchronous DER generators such as waste- and natural-gas plants can be combined with BESS to minimise this risk. Since all of these DER resources are co-located, the industrial sites are capable of participating as a primary Black Start provider with comparatively lower risk than individual resources. In contrast, solar PV and Wind (Type-4) generators can participate as secondary restoration providers without using new grid-forming inverters.
Although most grid-connected DER facilities are unmanned, large industrial plants operate 24 × 7 with active human interference. Therefore, within a short period of time, the plant maintenance crew could attend to the in-house DER facilities’ technical issues.
This is another advantage of involving industrial plants in the bottom-up system restoration process. Communication and control resilience is another key feature to consider in the bottom-up system restoration process. Following the loss of communications and control, the site will be checked and the condition that led to tripping found. A reliable backup communication system is necessary to minimise the system restoration time. However, poor observability does not allow for the participation of industrial loads or DGs in restoration plans. Figure 3 below illustrates the high-level overview of the steel-making plant, which accommodates black-start support.
3.1. Proposed Black Start Business Model for Industrial Sites
This study mainly focuses on the qualitative assessment of the capability of large industrial sites to participate in the Black Start service. However, to exploit the available resources from industrial sites, which can support the system restoration process a proper business model is required. It should mainly address the following key factors:
- Competency level—The technology readiness level of industrial plants to participate in Black Start Service.
- Additional investment required to set up the platform.
- Additional revenues by providing the Black Start Service.
- Impact on the anticipated production goals (i.e., financial gain/loss when participating in the restoration process rather utilising its generation resources for the production process).
- Required amendments in the grid code to involve industrial sites as Black Start providers.
- The procurement policy (i.e., contracted, non-contracted Black Start provider).
- Communication and control resilience.
- Restoration capability—The anticipated time to remain grid-connected during the restoration.
- Minimum DER capacity threshold to participate in the new Black Start service.
In this regard, a competitive pricing strategy will enable these emerging facilities to participate as primary/secondary Black Start providers. Further, cost-benefit studies can help identify policy barriers that may prevent industrial plants from providing this service. This will also indicate the most efficient roadmap to unlock the capability of industrial sites to provide Black Start service.
3.2. Required Technical Amendments of Industrial Plants
The capability to provide Black Start service from a large industrial site mainly depends on the flexibility level at the time of total grid failure occurs or, that is, the plant moves to island mode. If the local generation is less than the islanded load, it is unlikely to provide this service unless some non-critical production processes are halted and some additional power is available.
Irrespective of the direction of the flexibility, it is essential to feed the critical loads of the plant to prevent high costs associated with the cold-start of the whole production process. Therefore, identification of critical loads and ensuring the continuity of supply is the first step in investigating the technical amendments at the site. In a typical industrial plant, this can be achieved by separating busbars connected to these critical loads, and local generation is connected via automatic transfer switches. Generally, small standby diesel generators are used to start local gas turbines or to provide power references such as voltage and frequency to allow renewable power generators to reconnect. Due to its fast speed of response, BESS can be used as an alternative to a black start diesel generator. It improves reliability and can also provide the necessary short-circuit power to ensure a given protection sequence.
During an event, if the local generation exceeds the islanded load (upward flexibility) extra measures have to be taken to prevent over-speeding of local gas turbines, which could ultimately trip the machines. This could happen due to insufficiently fast or unstable control response. However, it is essential to make sure that these generating units are readily available to participate in the restoration process upon the commands received from the system operator. In this regard, a proper coordination and control restoration method is required to establish between load, synchronous, and non-synchronous generating units. This is another technical requirement that needs to be addressed.
Another key aspect is the communication and control resilience of the plant. This is critical for a Black Start provider to be able to monitor the plant and execute the remote failsafe operation, as well as send information and receive instructions from the system operator during an outage. The type of technology and capacity of the connection is important in the restoration planning process and for the coordination of actions during the restoration itself. However, if the industrial load already participates in the DSR program no additional communication infrastructure is required to be set up. The required technical amendments at the site are:
- Critical load identification and ensure the continuity of supply.
- Reconfiguration of busbar arrangement to serve critical and non-critical loads.
- Point of connection of local generation to serve critical loads while participating in Black Start service.
- Communication and Control modifications within the plant to provide BS service.
3.3. SWOT Analysis
In this section, a comprehensive SWOT (Strengths, Weaknesses, Opportunities, Threats) analysis is conducted to understand the internal and external factors that industrial plants encounter to formulate development strategies, plans, and countermeasures when participating in the Black Start service. Figure 4. highlights the key points of the SWOT analysis of industrial plant Black Start participation.
- (a)
- Strengths
- Co-location of DERs—The possibility of co-locating DERs is one of the major strengths of industrial sites to participate in the Black Start service. This will improve the security of the supply of variable renewable energy sources during the system restoration.
- Act as an Anchor Generator—Synchronous DERs such as waste-gas and natural gas generation units can readily participate as anchor generators to create power islands.
- Policy Support—The government support for integrating low-carbon power generating sources will motivate industries to participate in different ancillary services offered by the grid operator.
- Remain in hot-standby mode—Cost minimisation is one of the main objectives of a large Industrial plant. The use of own generation facilities will reduce high-cost grid imports. Since these types of plants operate 24 × 7, the plant availability is high. This helps to minimise total restoration time upon a blackout.
- Communication infrastructure—If the industrial plants already participate in the DSR program, no additional communication facilities are required to install at the site.
- (b)
- Weaknesses
- Intermittent nature of DERs—The availability of wind and solar PV energy is highly correlated with the stochasticity nature of wind and solar irradiance.
- Small block loading capability—Even during a blackout, the plant will use its resources to keep running the critical process to avoid high costs associated with restarting the plant. Therefore, only a fraction of the DER installed capacity is capable of providing this service.
- Low restoration support time—Unlike large synchronous generators energy availability to support system restoration is very limited. (ex. the SoC of the BESS, availability of waste gas, etc.)
- New grid forming inverters—New grid forming inverters are required if wind and solar PV is intended to use as anchor generators.
- Low reactive power support—The capability to absorb/export reactive power from inverter-based DERs is currently limited to a 0.8 power factor.
- (c)
- Weaknesses
- The decline of DER capital costs—Over the years the required £/MW value to install DERs is declining.
- Financial incentives—Most financial institutions are willing to provide low-interest credits for DER projects.
- Use of same assets to provide multiple services—Capability of receiving additional income utilising the same resources.
- (d)
- Threats
- Impact on production processes—Delay in meeting the production goals if the restoration takes several hours which requires additional grid imports.
- Existing technical limitations—Power quality issues, reverse power flow, and lack of sustained fault current are some of the existing technical limitations of DERs over traditional synchronous generators. Also, it is required to identify the short-circuit power levels necessary to operate the protection relays.
4. Flexibility from Large Industrial Consumers
In this section, the methodology used to identify the electricity flexibility of large industrial consumers is presented. The mathematical background of the optimisation method used for this analysis by referring to an integrated steelmaking site, to unlock their electricity flexibility and to assist in the decision-making process is discussed. The sources of flexibility and quantification of the amount per source for participation in the ancillary services are identified. The optimisation methodology is able to integrate various algorithms to calculate the optimal production schedule by analysing market options in relation to their own operating constraints and asset availability. As shown in Figure 5, the optimal schedule is divided into two scenarios:
- (i)
- Normal operation without ancillary services; the objective is to minimise the total system operational costs.
- (ii)
- Operation with ancillary services provision; the objective is to maximise the total revenue, which is the total gain minus total costs.
4.1. Plant Characteristics of a Typical Steel Plant
Based on day-ahead electricity price (as a guidance, the price is not locked down), through cost-effective calculation when the grid price is higher than on-site generation, the steel-make site can decide to use them to generate electricity and vice versa, whilst following a general principle that is to keep some generating units (ex. natural gas) at the minimum normally but also reduce the grid import.
In a typical steel plant, Hot Strip Mill is the most energy-intensive process and demand reduction operation comes at a cost of delaying the steel production leading to a loss of revenues This is mainly the bottleneck process of a steel plant. Sinter plant, pre-treatment link, and superheater are other non-critical loads that show flexibility in shifting to another pre-planned time slot. However, these processes are less flexible and lesser in capacity compared to hot strip mills, but the process shall be shifted at no extra cost. More information on steel making process can be found in [30].
4.2. Optimising Variables for the Modelling Study
The elements of interest for the modelling study include typical industrial processes (steel production), energy generation systems including different DERs, as well as electricity trading mechanisms with the gird. The characteristics of these elements are:
- Industrial process model
- (a)
- State task network (STN).
- (b)
- Non-schedulable tasks (NSTs), such as for blast furnace modelling.
- (c)
- Schedulable tasks (STs), such as for water heating/cooling modelling [31].
- Energy generation system (ESG)—this includes non-schedulable generation, such as solar, wind, waste heat, and large thermal power plants. It also includes schedulable plants, such as diesel and natural gas power plants. The state is given by;where stands for total energy generated from EGS at time t, stands for energy generated from non-schedulable sources (NEGS) and stands for energy generated from schedulable sources (SEGS).
- A trading mechanism for selling and purchasing electricity can be modelled following [32]. This can be adapted to include ancillary services modelling. Presumably more complicated than selling/purchasing according to day-ahead hourly electricity price.
To obtain the optimal generation schedule with demand flexibility of the plant the following decision variables are required to be accounted for:
- (a)
- Determine the scheduling of state tasks (STs), and energy generation system (EGS) in order to shift the demand from peak periods (with high electricity price) to off-peak periods (with low electricity price).
- (b)
- Operating points of STs.
- (c)
- Quantity of each element.
- (d)
- Costs of each element.
The model specification used for the analysis of the optimal operation of an industrial consumer is summarised in Table 2.
4.3. Methodology and Mathematical Formulation
As mentioned above, the main objective is to minimise the cost of dispatching local generation at the site. This is achieved by utilising on-site RE sources with a high priority with their availability. Additionally, two types of synchronous generators by the cost of fuel are considered. Waste-gas generators can be generally considered cheaper compared to a natural-gas generator. The demand profile is randomly generated using Monte Carlo methods but taking account of the typical characteristics of steel-making processes. The output of this multi-objective optimisation process is the optimal usage allocation of four types of generations as well as the optimal amount of grid import. The mathematical formulation is described in the following section.
- Consider hourly demand profile in one day with 24 data points
- Input set: J = [(1) PV, ; (2) wind, ; (3) waste-gas generator, ; (4) natural-gas generator, (5) grid import, ].
- The waste- and natural-gas generators are normally operated within a certain range of their full capacity. The operating ranges (upper bound—and low bound—) of and are at and [] respectively.
- The change in is assumed not to exceed 50% of their values in the previous time step .
- The cost of using is set up as [] with and the lowest and the highest.
- The production capacity limit of the four types of generation is set as .
Therefore, the optimisation problem can be written as follows:
Subjected to the following equality and inequality constraints.
After defining the problem, the standard linprog format in MATLAB has been used as follows.
Subject to:
Finally, the following function has been used to obtain required results.
5. Case Study on a Steel Making Plant
In this section, the percentage availabilities of on-site PV and wind to participate in industrial demand response have been quantified under different PV and wind generation profiles. Initially, an optimised load profile of a 90 MW steel-making plant has been generated following the methodology presented in [33]. The total demand comprises the following processes:
- Hot strip mill (consumption between 10 MW and 60 MW from 12:00 to 4:00 morning the next day).
- Sinter plant with an average consumption of 14 MW.
- Pre-treatment link (PT Link) with an average consumption of 12 MW.
- Super-heater with an average consumption of 4 MW.
This steel plant load demand has been optimised considering time-based electricity prices by optimally arranging energy-consuming activities to avoid peak hours. The capability of adjusting loads comes from the flexibility of sources at the steelmaking plant and the duration that each task can be adjusted without hindering the production targets. For scheduling with flexible loads, adjustability between 75% to 125% of the nominal value is assumed in this study. The scheduling models are based on resource-task network formulations that incorporate the electric arc furnaces’ flexibilities to reduce the electricity cost. Figure 6 illustrates the optimised demand profile of the plant [34].
The in-house PV and wind generation profiles related to the geographical area where the steel-making plant is located are considered by referring to the work in [35]. The average installed capacities of PV (22.5 MW) and wind generation (22.8 MW) are obtained using the Monte Carlo methodology for 365 days as shown in Figure 7. Further, it is assumed that the steel plant has a total generating capability of 94 MW including PV and wind generation. Subsequently, the operating limit of both waste-gas and natural-gas generators is assumed at [0.2, 0.8] of their full capacities. This results in the operating range of both generators are [9.4, 37.6] MW.
The following steps are followed to identify the flexibility levels.
- Step-1: Generate the optimised load profile with 20 min interval from an analysis conducted according to the methodology described in [33].
- Step-2: Average the optimised load profile for a 1-h interval.
- Step-3: Run the adapted optimisation algorithm by varying different on-site PV and wind generation profiles.
To obtain the optimised load profile of the steelmaking site (in Step-1), only grid electricity import is considered. This enables prioritising on-site PV and wind generations when identifying the level of flexibilities from these low-cost generation units in Step 3. Further, the following assumptions are made. First, the grid electricity price is set to a higher value. This allows prioritising the PV and wind generation over the grid import. Two generation priority levels have been assigned, the first priority level for low carbon renewable energy sources (PV and Wind generation) and the second priority level for inhouse waste gas and natural gas generation. Also, ramp rates of in-house waste gas and natural gas plants are not considered in this simulation scenario.
The ability of the steel plant to adjust its load curve in response to the electricity price curve is an indication of the level the flexibility it has. The better it can adjust its load curve enables the steelmaking plant to provide different ancillary services to the grid operator. The flexibility of PV and wind generation can be calculated as:
where, Ppv-opt (t) and Pwind-opt (t) are the optimum PV and wind generation used to serve the demand at time t.
5.1. Case Studies
In the following section, four case studies have been conducted by varying the PV and wind generation capacities. Case studies 1 and 2 have been conducted by varying PV generation while maintaining a fixed wind profile. It is worth noting that, the annualised 1-h average values have been used for all four cases.
- (a)
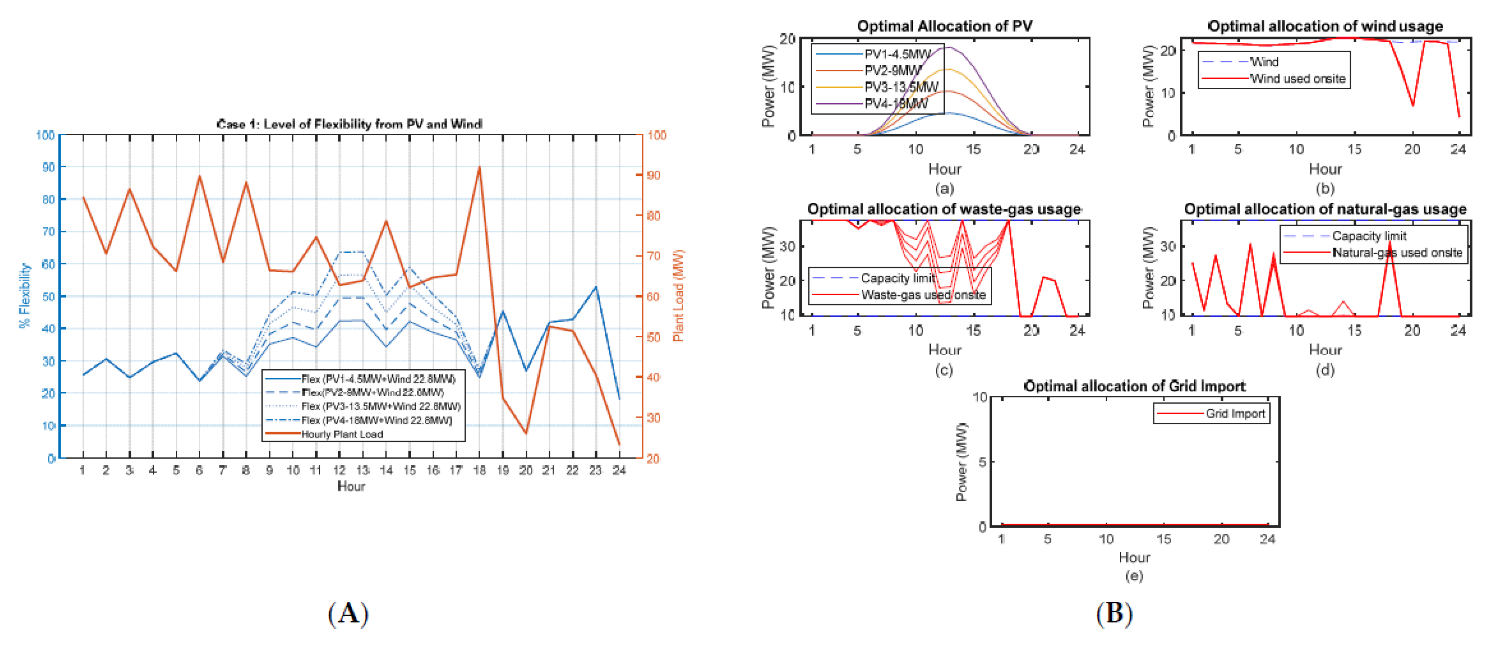
- Case Study 1: Variation of flexibility with different PV generation (4.5–18 MW) while maintaining the wind generation profile constant (at the peak value of 22.8 MW).
Figure 8A shows the optimised hourly load profile of the aforementioned steel-making plant and the different levels of percentage flexibility that the plant could provide with four different PV generation peak capacities (4.5 MW, 9 MW, 13.5 MW, 18 MW). Notably, during the daytime between 12:00–13:00 hrs, it shows the highest flexibility level at about 65%. As shown in Figure 8B(a), between this interval, the PV generation is the highest, and wind generation is also at its peak level of 22.8 MW. On the contrary, the optimum allocation of waste gas was above its minimum generation and the natural gas supply was set to its minim generation of 9.4 MW as shown in Figure 8B(c,d). Due to higher on-site generation than its demand, the grid import is zero as shown in Figure 8B(e).
- (b)
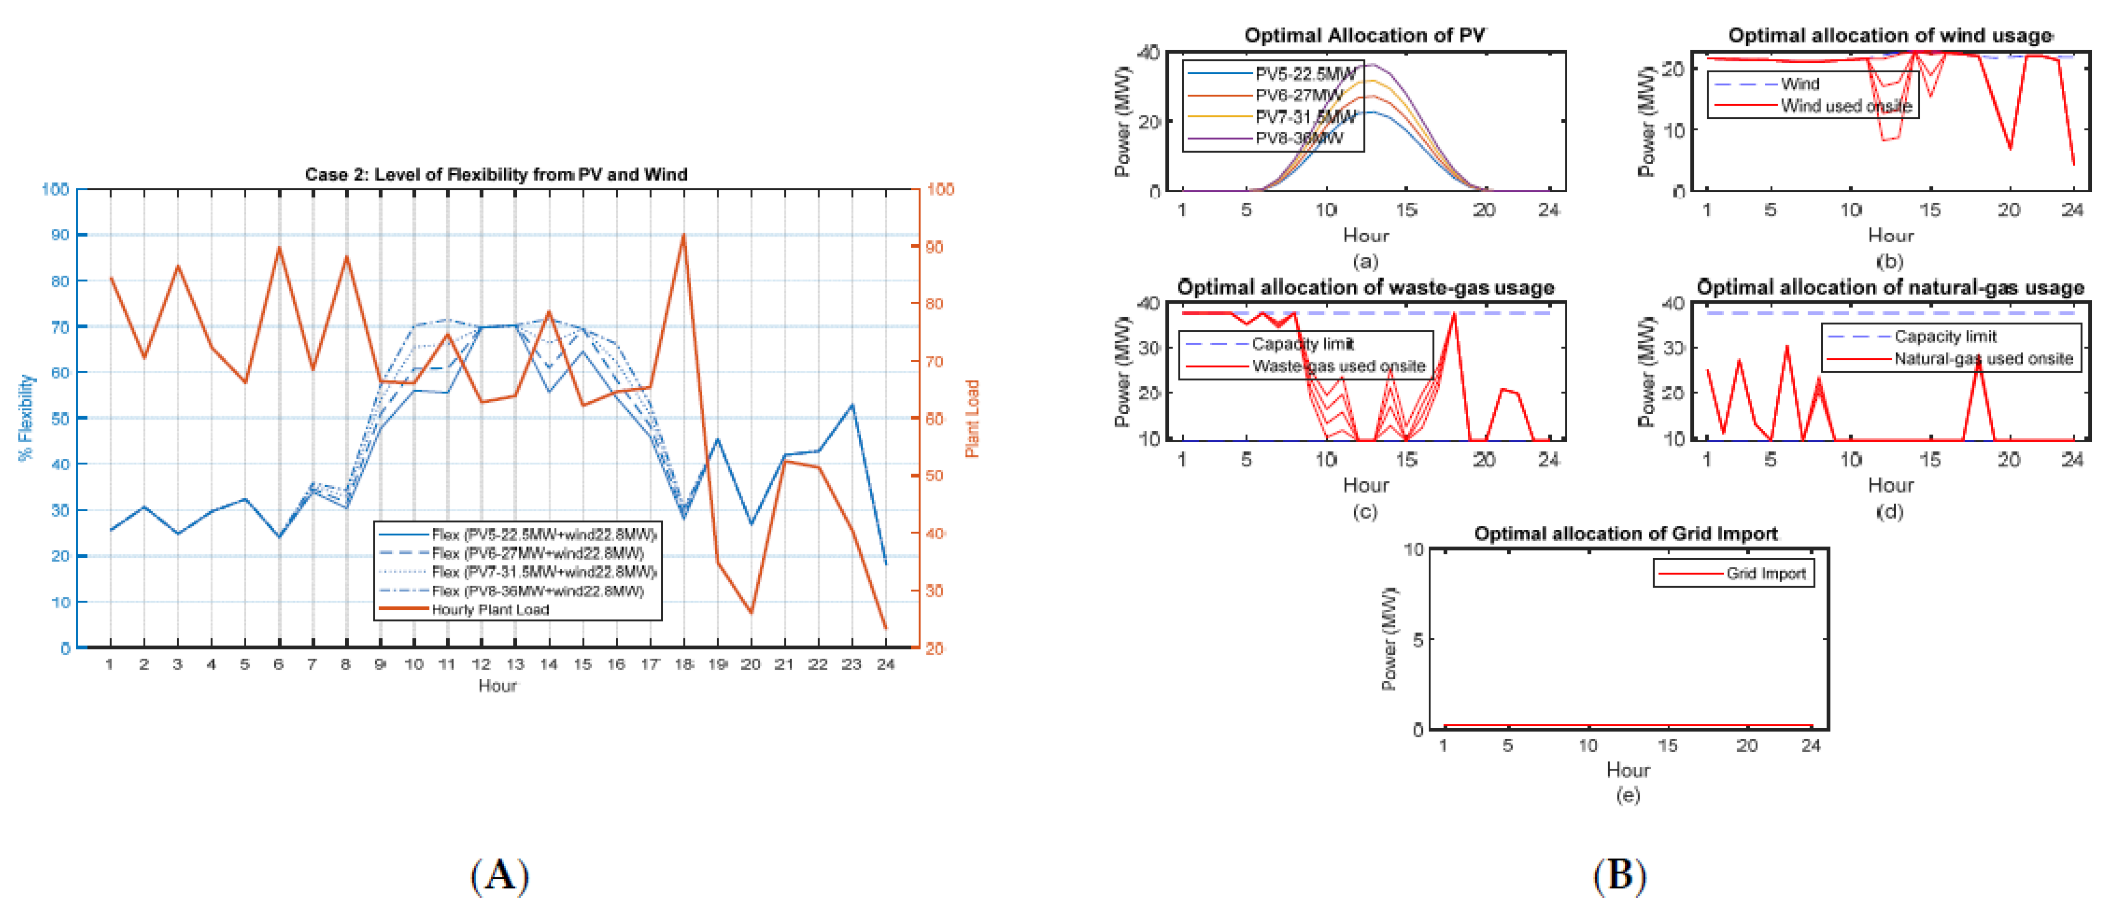
- Case Study 2: Variation of flexibility with different PV generation (22.5–36 MW) while maintaining the wind generation profile constant (at the peak value of 22.8 MW).
The Case Study 2 represents how flexibility level varies with higher PV generation (22.5 MW, 27 MW, 31.5 MW, 36 MW) compared to Case Study 1. Figure 9A shows the optimised hourly load profile of the aforementioned steel-making plant and the different levels of percentage flexibility that the plant could provide for cases considered. Similar to Case Study 1, during the daytime between 12:00–13:00 hrs it shows the highest flexibility level about 70%. As shown in Figure 9B(a), between this interval, the PV generation is the highest. However, wind generation is lower than its peak level of 22.8 MW. Therefore, a 5% increase in flexibility could be observed compared to Case Study 1. On the contrary, the optimum allocation of waste and natural gas supply was set to their minim generation of 9.4 MW as shown in Figure 9B(c,d). Due to higher on-site generation than its demand, the grid import is zero as shown in Figure 9B(e).
- Discussion on the simulation results:
National Grid ESO splits the year in a number of seasons and specifies the period in each day (working and non-working days) where Short Term Operating Reserve (STOR) providers can be called upon to deliver this service. This period is known as the STOR Availability Window (SAW). As per [36], the general time periods of STOR Availability Window are:
- (i)
- Window 1: (05:00–6:00)–(12:00–13:00) [GMT]
- (ii)
- Window 2: (15:00–16:00)–(17:00–20:00) [GMT]
Therefore, for the industrial customer who wishes to participate in STOR service as Balancing Mechanism (BM) or non-BM service provider under the Committed Service category, the industrial load should be able to reduce grid import or supply in-house surplus energy to the grid. In our case studies presented in Figure 8 and Figure 9, the availability levels depend on the assumed PV and wind generation levels. With the increase in PV generation levels, the level of flexibility increases. Table 3 quantifies the flexibility level (in MW) for each two of the scenarios presented. It is worth noting that, between 18:00–24:00 hrs the level of flexibility is much lower compared to the other two periods due to the low demand at the steelmaking plant. However, the availability of on-site wind plants is considerably higher, which may be capable of exporting energy to the grid. Only demand reduction is considered in this analysis.
Consider the level of flexibility between 12:00–13:00 hrs (R1) of Figure 10 correspond to Case 2. This relates to the minimum load level during daytime which has maximum PV generation. A constant level of flexibility is observed irrespective of the variation of PV generation for the R1 period. This is due to the fact that between 12:00–13:00 hr local waste and natural gas usage is at its minimum generation level of 9.4 MW. Whereas, PV generation will use its maximum available generation and the balance will be provided by the wind generation. It should be noted that the grid import remains at 0 MW. This demonstrates the correlation between the level of flexibility and the industrial process. Further, this shows the flexibility of industrial loads to participate in the STOR service as a BM provider.
- (c)
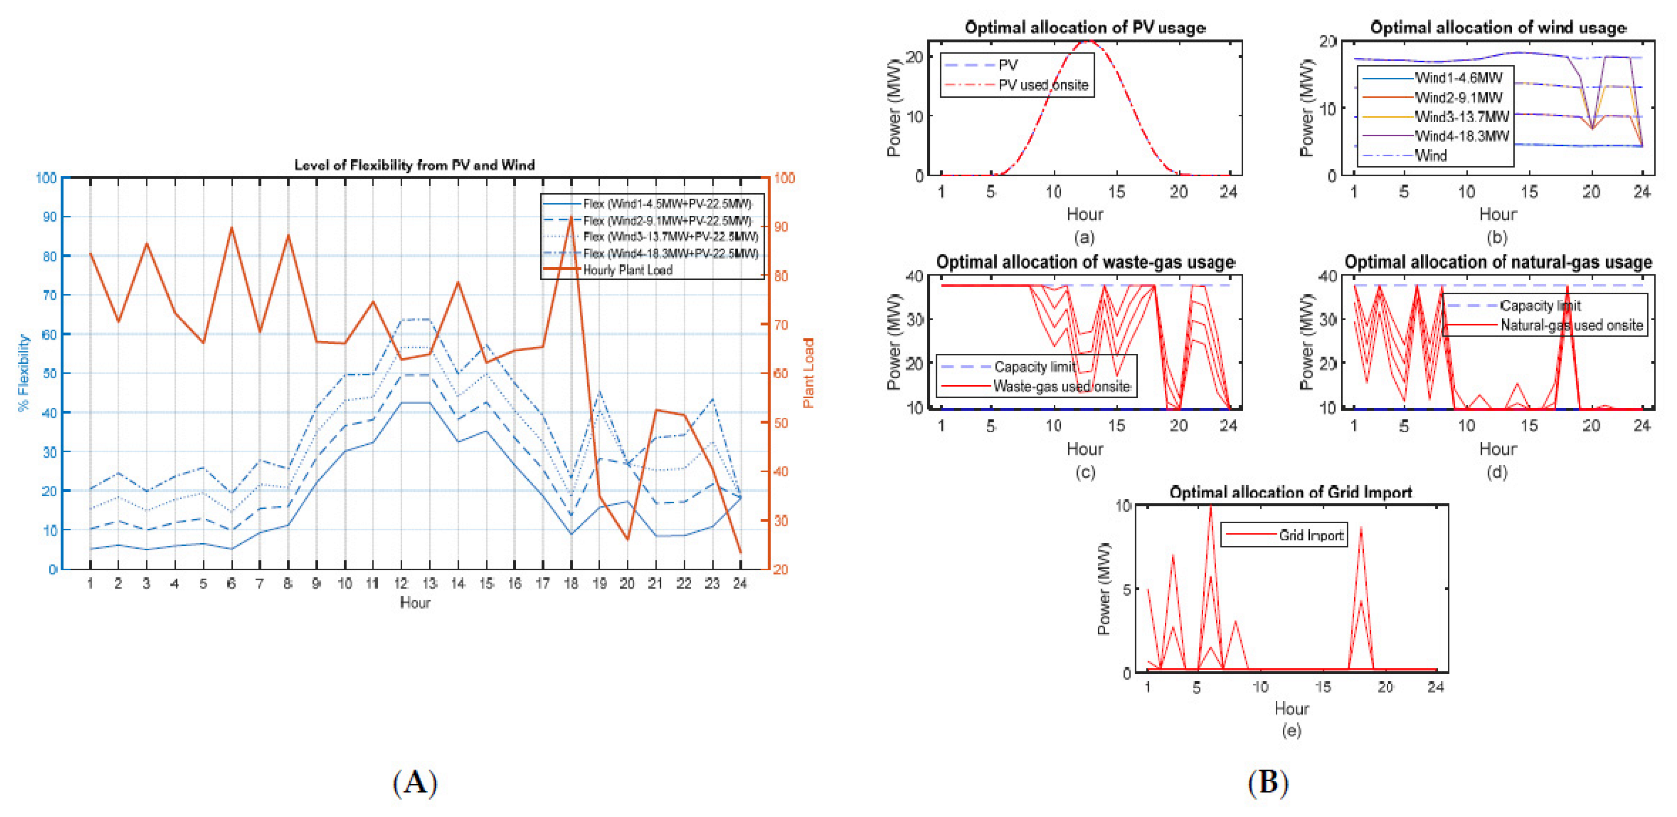
- Case Study 3: Variation of flexibility with different wind generation (4.6–18.3 MW) while maintaining the PV generation profile constant (at the peak value of 22.5 MW)
Figure 11A below shows the optimised hourly load profile of the steel-making plant and different levels of percentage flexibility that the plant could provide with four different on-site wind generation with peak capacities of 4.6 MW, 9.1 MW, 13.7 MW, 18.3 MW while on-site solar PV peak generation set to 22.5 MW. Notably, during the daytime between 12:00–13:00 hrs, it shows the highest flexibility level at about 65%. As shown in Figure 11B(b), between this interval, the wind generation is the highest. However, it utilises the PV generation at its full capacity throughout the period. On the contrary, the optimum allocation of waste gas was above its minimum generation and the natural gas supply was set to its minim generation of 9.4 MW as shown in Figure 11B(c,d). Compared to the previous two cases, during several intervals, it requires to import of energy from the grid to cater to its demand as shown in Figure 11B(e). However, for higher wind (18.3 MW) and PV generation (22.5 MW), the grid import is zero.
- (d)
- Case Study 4: Variation of flexibility with different Wind generation (22.8–36.5 MW) while maintaining the PV generation profile constant (at the peak value of 22.5 MW)
Case Study 4 represents how flexibility level varies with higher wind generation (22.8 MW, 27.4 MW, 31.9 MW, 36.5 MW) compared to Case Study 3. Figure 12A shows the optimised hourly load profile of the aforementioned steel-making plant and different levels of percentage flexibility that the plant could provide for cases considered. Similar to Case Study 3, during the daytime between 12:00–13:00 hrs it shows the highest flexibility level about 70%. Notably, although high wind generation is available during this period (where on-site RE generation is higher and day-time peak demand is lower), the wind generation has been curtailed to accommodate other constraints imposed by the optimisation algorithm as shown in Figure 12B(b). As of Case Study 3, between this interval, the PV generation is the highest. Further, a 5% increase in the flexibility level could be observed compared to Case Study 3. On the contrary, the optimum allocation of waste and natural gas supply was set to their minim generation of 9.4 MW as shown in Figure 12B(c,d). Due to higher on-site generation than its demand, the grid import is zero as shown in Figure 12B(e).
- Discussion on the simulation results:
The results shown for Case 3 and Case 4 are based on varying the wind generation profile while maintaining a fixed PV profile. As seen in Figure 11 and Figure 12 improved flexibility levels can be observed beyond the BM STOR availability windows due to the utilisation of more wind energy. However, the general pattern of the flexibility curve is almost similar for all four cases since the level of flexibility exclusively depends on the capability of adjusting the in-house loads.
Table 4 quantifies the flexibility level (in MW) for each two of the scenarios above. With the increase in wind generation, the level of flexibility is increased for the periods 0:00–8:00 hrs and 8:00–18:00 hrs. However, between 18:00 to 24:00 hrs the flexibility level of 6.9 MW remains unchanged irrespective of the scenario due to low demand from the steelmaking plant. This highlights the fact that the level of flexibility from on-site PV and wind is highly correlated with the steelmaking process.
From the above four case studies, the following general observations can be made. The levels of flexibility from PV and wind are highly correlated with the capability of shifting loads in the steelmaking plant. Proper coordination and management of non-critical loads will enable steelmaking plants to participate in the demand response programmes in a more beneficial manner.
5.2. Sensitivity Analysis of Flexibility Level with the Seasonal Variation of PV and Wind Generations
The two graphs from Figure 13 show the seasonal variation of PV and wind of the nominal annual average capacity of 22.5 MW of PV and 22.8 MW of wind. It can be noted that during the summer the PV generation is higher whereas during the winter wind generation is higher. In order to exploit the level of flexibility with the seasonal variations of on-site PV and wind generation, a sensitivity analysis was carried out following the methodology discussed above.
A total number of 8 case studies have been conducted as summarised in Table 5.
- Discussion on the simulation results:
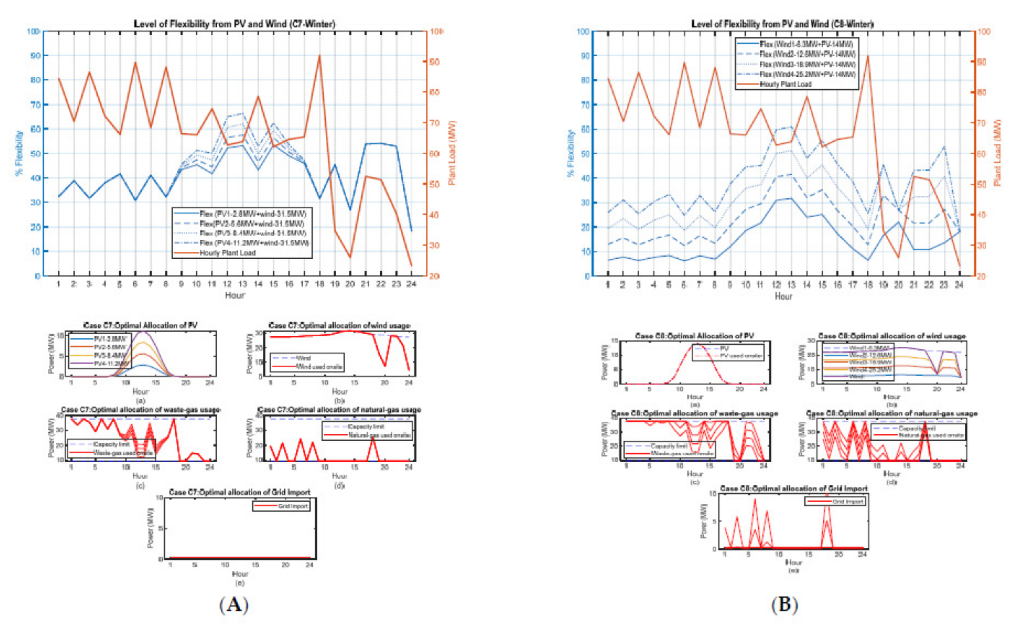
The sensitivity analysis (case studies C1–C8) shows that depending on the seasonal variation of on-site PV and wind the level of flexibility varies significantly. It should be noted that all the minimum flexibility levels correspond to the minimum demand reduction of 6.9 MW. This is the lowest demand for the steelmaking plant (between 19:00–20:00 hrs), which corresponds to STOR Availability Window-2. Generally, after 18:00 hrs the PV generation is minimal thus the flexibility should be provided by available on-site wind generation.
Some of the scenarios that correspond to case studies C2, C4, C6, C8 (fixed PV with varying wind) show that grid import is required at some specific time intervals. It can be identified that these scenarios relate to very low wind generations thus a minimum threshold should be identified. In order to provide a demand reduction of 6.9 MW (which is the lowest demand reduction possible in this case study) a minimum of 18 MW of wind and 14 MW of PV are required to be installed at the site. However, complying with National Grid requirements and to provide a minimum of 3 MW of flexibility (with a minimum of 2 h and a recovery period of not more than 1200 min) it is recommended to install a minimum of 8 MW of wind and 6 MW of PV at the steelmaking site.
6. Conclusions
At present, one of the main obstacles to participating in the Black Start service is the existing size of the block load. Most of the embedded generating plant nameplate capacities are below 50 MW and when intermittency is considered, the capable block load size reduces further. However, for instance, the case study conducted concluded that a minimum of 6 MW-PV and 8 MW-Wind are required to participate in the DSR program as a BM provider. The industrial plant considered for this analysis is already equipped with 37.6 MW of waste and natural gas generating units. Therefore, a total of 51.6 MW of nameplate generating capacity is available at that site. If the size of the critical loads to be served is less than this capacity, industrial plants are able to support the system restoration process without hindering the plant operation completely. In addition to these key points, the configuration of the network is also important.
Further, another option to participate in this Black Start service is via an aggregator. The role of the Black Start aggregator would be different from the aggregator that provides STOR services. Network energisation via an aggregator requires a more sophisticated control and communication platform. The responsibility of controlling Black Start generating units inside the aggregator will be much more complicated. However, during the tendering process, the intended Black Start provider should demonstrate its compliance at the Point of Delivery (PoD). From the system operator’s (SO) perspective, the issues emerge behind the PoD during the energisation and have to be resolved by the Black Start provider.
Further, a combined system restoration approach will increase the system restoration speed. The process should be a combination of speed and availability because there is a transition period moving from a centralised to a de-centralised system restoration approach until all DNOs should have the capability to provide this service. DNOs have the ability to segregate the network but it depends on the switching capability. Thus, reducing the size of the block load is essential. A discussion had with the SO confirms that the block load size between 35–50 MW is suitable. Instead of a fixed block load size, specifying a range will enable more generating assets to participate in this service. However, considering the restoration time a minimum block load size of 20 MW is recommended. Some other technical aspects such as the ability to switch remotely, DNO-TO (transmission owner) protection coordination, earthing requirements, Sub-Synchronous Resonance, and Interaction (SSR and SSI) when deploying a large number of inverter-based generating resources for network energisation are also required to be considered.
To summarise, this paper addresses two main research gaps stated in the introduction section; (a) investigate the flexibility of large industrial consumers with reference to a steel production plant with a 90 MW peak load. (b) identify the qualitative and quantitative factors that need to be accounted for by large industrial consumers to participate in future black start services.
Author Contributions
Conceptualization, G.A. and L.C.; Data curation, G.A.; Formal analysis, G.A.; Funding acquisition, L.C. and X.D.; Investigation, G.A., L.C. and X.D.; Methodology, G.A.; Project administration, L.C. and X.D.; Resources, L.C.; Software, G.A.; Supervision, L.C.; Validation, G.A.; Visualization, G.A.; Writing–original draft, G.A.; Writing–review & editing, L.C. and X.D. All authors have read and agreed to the published version of the manuscript.
Funding
We are grateful for support from the UK National Grid Electricity Transmission under grant number 10649-NIA_NGT00031 and Decarbonising Transport through Electrification (DTE) Network+ funded by EPSRC grant reference number EP/S032053/1.
Acknowledgments
This work was supported by the National Grid Electricity Transmission, project “Feasibility study to unlocking flexibility from within industrial and commercial users” and Decarbonising Transport through Electrification (DTE) Network+ funded by EPSRC.
Conflicts of Interest
The authors declare no conflict of interest.
References
- UK Becomes First Major Economy to Pass Net-Zero Emissions Law. Available online: https://www.gov.uk/government/news/uk-becomes-first-major-economy-to-pass-net-zero-emissions-law (accessed on 23 July 2021).
- D’Aprile, P.; Engel, H.; Gendt, G.V.; Helmcke, S.; Hieronimus, S.; Nauclér, T.; Pinner, D.; Walter, D.; Witteveen, M. Net-Zero Europe: Decarbonization Pathways and Socioeconomic Implications; McKinsey & Company: Stockholm, Sweden, 2020. [Google Scholar]
- Yuan, C.; Illindala, M.S.; Khalsa, A.S. Co-Optimization Scheme for Distributed Energy Resource Planning in Community Microgrids. IEEE Trans. Sustain. Energy 2017, 8, 1351–1360. [Google Scholar] [CrossRef] [Green Version]
- Abeynayake, G.; Yu, J.; Moon, A.; Liang, J. Analysis and Control of MVDC Demonstration Project in the UK: ANGLE-DC. Power Supply 2020, 37, 44–50. [Google Scholar]
- Rodriguez, P.; Lai, N. Chapter 17—Grid-following and grid-forming and wind turbines. In Control of Power Electronic Converters and Systems; Academic Press: Cambridge, MA, USA, 2021; pp. 499–521. [Google Scholar]
- Li, Y.; Gu, Y.; Zhu, Y.; Junyent-Ferré, A.; Xiang, X.; Green, T.C. Impedance Circuit Model of Grid-Forming Inverter: Visualizing Control Algorithms as Circuit Elements. IEEE Trans. Power Electron. 2021, 36, 3377–3395. [Google Scholar] [CrossRef]
- Chandler, P.; Miller, N.; Gutschow, D. Black Start from Distributed Energy Resources: Case Study Selection Process. 2019. Available online: https://www.nationalgrideso.com/document/142746/download (accessed on 25 July 2021).
- Peña Asensio, A.; Gómez, S.A.; Rodriguez-Amenedo, J.L.; Cardiel-Álvarez, M.Á. Decentralized Frequency Control for Black Start of Full-Converter Wind Turbines. IEEE Trans. Energy Convers. 2021, 36, 480–487. [Google Scholar] [CrossRef]
- Jing, W.; Lai, C.H.; Wong, W.S.H.; Wong, M.L.D. A comprehensive study of battery-supercapacitor hybrid energy storage system for standalone PV power system in rural electrification. Appl. Energy 2018, 224, 340–356. [Google Scholar] [CrossRef]
- Xu, Z.; Yang, P.; Zeng, Z.; Peng, J.; Zhao, Z. Black start strategy for PV-ESS multi-microgrids with three-phase/single-phase architecture. Energies 2016, 9, 372. [Google Scholar] [CrossRef] [Green Version]
- Schomann, O. Experience with large grid-forming inverters on various island and Microgrid projects. In Proceedings of the SMA Hybrid Power Systems Workshop, Crete, Greece, 22–23 May 2019. [Google Scholar]
- Bellini, E. General Electric works on grid-forming inverter controls. PV Magazine, 6 April 2020. Available online: https://www.pv-magazine.com/2020/04/06/general-electric-works-on-grid-forming-inverter-controls/ (accessed on 24 July 2021).
- Gkountaras, A. Trends in Grid Integration of Offshore & Onshore Wind. Siemens Gamesa Renewable Energy. In Proceedings of the Virtual Wind Workshop, Darmstadt, Germany, 11–12 November 2020. [Google Scholar]
- THE GRID CODE- Issue 5 Revision 38. National Grid Electricity System Operator, Tech. Rep.. 4 September 2019. Available online: https://www.nationalgrideso.com/document/33821/download (accessed on 23 July 2021).
- Black Start from Distributed Energy Resources. Bid document to Ofgem-National Grid ESO, Tech. Rep.; 2017. Available online: https://www.ofgem.gov.uk/publications/electricity-nic-2018-national-grid-electricity-system-operator-eso-black-start-distributed-energy-resources (accessed on 23 July 2021).
- Energy restoration for tomorrow: Distributed ReStart. Tech. Rep., Project progress report. June 2021. Available online: https://www.nationalgrideso.com/document/211371/download (accessed on 26 July 2021).
- Black Start from Non-Traditional Generation Technologies. Tech. Rep., Network Innovation Allowance. June 2019. Available online: https://www.nationalgrideso.com/document/148196/download (accessed on 26 July 2021).
- Wider Strategy for Flexibility from Intermittent Generation. National Grid ESO. 2020. Available online: https://www.nationalgrideso.com/document/167886/download (accessed on 25 July 2021).
- Rodríguez-Amenedo, J.L.; Gómez, S.A.; Martínez, J.C.; Alonso-Martinez, J. Black-Start Capability of DFIG Wind Turbines Through a Grid-Forming Control Based on the Rotor Flux Orientation. IEEE Access 2021, 9, 142910–142924. [Google Scholar] [CrossRef]
- Zhu, L.; Pan, Z.; Xu, G. Black Start with DFIG-Based Wind Turbines Using Improved Virtual Synchronous Control. In Proceedings of the 2018 21st International Conference on Electrical Machines and Systems (ICEMS), Jeju, Korea, 7–10 October 2018; pp. 1013–1018. [Google Scholar]
- Black Start from Non-Traditional Generation Technologies (Technology Capability and Readiness for Distributed Restoration). National Grid ESO. 2019. Available online: https://www.nationalgrideso.com/document/148201/download (accessed on 24 July 2021).
- Xu, H.; Su, J.; Liu, N.; Shi, Y. A Grid-Supporting Photovoltaic System Implemented by a VSG with Energy Storage. Energies 2018, 11, 3152. [Google Scholar] [CrossRef] [Green Version]
- Jain, H.; Seo, G.-S.; Lockhart, E.; Gevorgian, V.; Kroposki, B. Blackstart of Power Grids with Inverter-Based Resources: Preprint. In Proceedings of the 2020 IEEE Power & Energy Society General Meeting (PESGM), Montreal, QC, Canada, 2–6 August 2020; Volume 8. [Google Scholar]
- Hos, T.; Herskowitz, M. Utilization of CO-rich waste gases from the steel industry for production of renewable liquid fuels. Energy Convers. Manag. 2021, 240, 114233. [Google Scholar] [CrossRef]
- Cherevatskiy, S. Microgrid Solutions Enabling Resilient and Cost Effective Access to Power; ABB: Zürich, Switzerland, 2016. [Google Scholar]
- Wind Energy and on-site Energy Storage: Exploring Market Opportunities. Wind Europe. 2017. Available online: https://windeurope.org/wp-content/uploads/files/policy/position-papers/WindEurope-Wind-energy-and-on-site-energy-storage.pdf (accessed on 3 August 2021).
- Energy Storage News. California Battery’s Black Start Capability Hailed as ‘Major Accomplishment in the Energy Industry. Available online: https://www.energy-storage.news/news/california-batterys-black-start-capability (accessed on 3 August 2021).
- Duboviks, V. Battery Energy Storage Systems (BESS): Ancillary Services and Beyond; GE Energy Connections: Bracknell, UK, 2018. [Google Scholar]
- Chandler, P.; Miller, N.; Gutschow, D. Black Start from Distributed Energy Resources. National Grid ESO, SP Energy Networks, TNEI, March. 2019. Available online: https://www.nationalgrideso.com/document/142746/download (accessed on 5 August 2021).
- Li, W. Production Scheduling in Integrated Steel Manufacturing. Ph.D. Dissertation, University of Wisconsin-Milwaukee, Milwaukee, WI, USA, 2014. [Google Scholar]
- Shoreh, M.H.; Siano, P.; Shafie-khah, M.; Loia, V.; Catalão, J.P.S. A survey of industrial applications of Demand Response. Electr. Power Syst. Res. 2016, 141, 31–49. [Google Scholar] [CrossRef]
- Ding, Y.M.; Hong, S.H.; Li, X.H. A Demand Response Energy Management Scheme for Industrial Facilities in Smart Grid. IEEE Trans. Ind. Inform. 2014, 10, 2257–2269. [Google Scholar] [CrossRef]
- Zhang, X.; Hug, G.; Harjunkoski, I. Cost-Effective Scheduling of Steel Plants with Flexible EAFs. IEEE Trans. Smart Grid 2017, 8, 239–249. [Google Scholar] [CrossRef]
- Sun, W.; Wang, Q.; Zhou, Y.; Wu, J. Material and energy flows of the iron and steel industry: Status quo, challenges and perspectives. Appl. Energy 2020, 268, 114946. [Google Scholar] [CrossRef]
- Pfenninger, S.; Staffell, I. Long-term patterns of European PV output using 30 years of validated hourly reanalysis and satellite data. Energy 2016, 114, 1251–1265. [Google Scholar] [CrossRef]
- STOR Availability Window-STOR Availability Window Covering 2019-12-31. Available online: https://test.bmreports.com/bmrs/?q=transmission/storavailabilitywindow/historic (accessed on 3 August 2021).
Figure 1.
Required Technical Competencies from DERs.

Figure 2.
Classification of energy storage technologies by the form of stored energy.

Figure 3.
High-level overview of the steel-making plant which accommodates black-start support.

Figure 4.
The SWOT analysis of industrial plant black start participation.

Figure 5.
Flowchart of the high-level operational model.

Figure 6.
Optimised hourly demand profile of the steel plant.

Figure 7.
Historical (a) PV and (b) wind generation for 365 days with highlighted average values.

Figure 8.
(A) Level of flexibility correspond to Case 1, (B) Case 1—Optimal allocation of generation.
Figure 8.
(A) Level of flexibility correspond to Case 1, (B) Case 1—Optimal allocation of generation.

Figure 9.
(A) Level of flexibility correspond to Case 2, (B) Case 2—Optimal allocation of generation.
Figure 9.
(A) Level of flexibility correspond to Case 2, (B) Case 2—Optimal allocation of generation.

Figure 10.
Flexibility level between 12:00–13:00 hrs correspond to Case 2.

Figure 11.
(A) Level of flexibility correspond to Case 3, (B) Case 3—Optimal allocation of generation.
Figure 11.
(A) Level of flexibility correspond to Case 3, (B) Case 3—Optimal allocation of generation.

Figure 12.
(A) Level of flexibility correspond to Case 4, (B) Case 4—Optimal allocation of generation.
Figure 12.
(A) Level of flexibility correspond to Case 4, (B) Case 4—Optimal allocation of generation.

Figure 13.
Nominal Seasonal Variation of PV and Wind.

Figure 14.
Flexibility corresponds to cases (A) C1 and (B) C2 of Spring.

Figure 15.
Flexibility corresponds to cases (A) C3 and (B) C4 of Summer.

Figure 16.
Flexibility corresponds to cases (A) C5 and (B) C6 of Autumn.

Figure 17.
Flexibility corresponds to cases (A) C7 and (B) C8 of Winter.


Table 1.
Services of electricity storage and its potential value for co-location.
| Category of Service | Services of Electricity Storage | Size | Potential Value of Co-Location | Type of Market |
|---|---|---|---|---|
| Ancillary Services | Frequency reserves | Small | High | Fast frequency response, synthetic inertia |
| Voltage control | Small | High | Reactive power | |
| Black-Start | Large/Small | High/Medium | Ancillary services | |
| Energy Time Shift | Self-consumption | Small | Low | Day-ahead market, Intra-day market |
| Grid Adequacy | Curtailment/Reduction of congestion | Small | High | Balancing/redispatch mechanism |
| Ramping control/smoothing | Small | High | New Market opportunity | |
| Capacity firming/Imbalance reduction | Small | High | Balancing, Frequency reserves |
Table 2.
Model specifications.
| Potential Sources of Flexibility | Input Information | Objective(s) | Output Information |
|---|---|---|---|
| On-site Renewable Generation |
|
|
|
| On-site Generators (diesel, natural gas, or waste gas) |
| ||
| Industrial Processes |
| ||
| Price |
|
Table 3.
Level of flexibility with the time (Case Study 1 and 2).
| Scenario | Flexibility Level (MW) | |||
|---|---|---|---|---|
| 0:00–8:00 hrs | 8:00–18:00 hrs | 18:00–24:00 hrs | ||
| Case Study 1 | PV 1 | 21.4 | 22.2 | 6.9 |
| PV 2 | 21.4 | 23.3 | 6.9 | |
| PV 3 | 21.4 | 24.5 | 6.9 | |
| PV 4 | 21.4 | 25.6 | 6.9 | |
| Case Study 2 | PV 5 | 21.4 | 26.7 | 6.9 |
| PV 6 | 21.4 | 27.9 | 6.9 | |
| PV 7 | 21.4 | 29.0 | 6.9 | |
| PV 8 | 21.4 | 30.1 | 6.9 | |
Table 4.
Level of flexibility with the time (Case Study 3 and 4).
| Scenario | Flexibility Level (MW) | |||
|---|---|---|---|---|
| 0:00–8:00 hrs | 8:00–18:00 hrs | 18:00–24:00 hrs | ||
| Case Study 1 | Wind 1 | 4.2 | 9.8 | 4.4 |
| Wind 2 | 8.5 | 14.1 | 6.5 | |
| Wind 3 | 12.9 | 18.3 | 6.7 | |
| Wind 4 | 17.1 | 22.5 | 6.9 | |
| Case Study 2 | Wind 5 | 21.3 | 26.7 | 6.9 |
| Wind 6 | 25.7 | 30.9 | 6.9 | |
| Wind 7 | 30.1 | 35.2 | 6.9 | |
| Wind 8 | 34.2 | 39.4 | 6.9 | |
Table 5.
Seasonal variation case studies.
| Season | Case Study Acronym | Corresponding Figure | Description |
|---|---|---|---|
| Spring | C1 | Figure 14A | Fixed Wind Generation at 21.8 MW and vary PV generation 3.1 MW, 6.3 MW, 9.5 MW, 12.6 MW |
| C2 | Figure 14B | Fixed PV Generation at 15.8 MW and vary Wind generation 4.3 MW, 8.7 MW, 13.1 MW, 17.5 MW | |
| Summer | C3 | Figure 15A | Fixed Wind Generation at 19 MW and vary PV generation 6.2 MW, 12.4 MW, 18.6 MW, 24.8 MW |
| C4 | Figure 15B | Fixed PV Generation at 31 MW and vary Wind generation 3.8 MW, 7.6 MW, 11.4 MW, 15.2 MW | |
| Autumn | C5 | Figure 16A | Fixed Wind Generation at 19.3 MW and vary PV generation 5.8 MW, 11.7 MW, 17.6 MW, 23.5 MW |
| C6 | Figure 16B | Fixed PV Generation at 29.4 MW and vary Wind generation 3.8 MW, 7.7 MW, 11.5 MW, 15.4 MW | |
| Winter | C7 | Figure 17A | Fixed Wind Generation at 31.5 MW and vary PV generation 2.8 MW, 5.6 MW, 8.4 MW, 11.2 MW |
| C8 | Figure 17B | Fixed PV Generation at 14 MW and vary Wind generation 6.3 MW, 12.6 MW, 18.9 MW, 25.2 MW |
Publisher’s Note: MDPI stays neutral with regard to jurisdictional claims in published maps and institutional affiliations. |
© 2022 by the authors. Licensee MDPI, Basel, Switzerland. This article is an open access article distributed under the terms and conditions of the Creative Commons Attribution (CC BY) license (https://creativecommons.org/licenses/by/4.0/).
Share and Cite
MDPI and ACS Style
Abeynayake, G.; Cipcigan, L.; Ding, X. Black Start Capability from Large Industrial Consumers. Energies 2022, 15, 7262. https://0-doi-org.brum.beds.ac.uk/10.3390/en15197262
AMA Style
Abeynayake G, Cipcigan L, Ding X. Black Start Capability from Large Industrial Consumers. Energies. 2022; 15(19):7262. https://0-doi-org.brum.beds.ac.uk/10.3390/en15197262
Chicago/Turabian StyleAbeynayake, Gayan, Liana Cipcigan, and Xiaolin Ding. 2022. "Black Start Capability from Large Industrial Consumers" Energies 15, no. 19: 7262. https://0-doi-org.brum.beds.ac.uk/10.3390/en15197262
Note that from the first issue of 2016, this journal uses article numbers instead of page numbers. See further details here.