
Energy Security in Danger? A Comparative Analysis of Oil and Copper Supply

Warsaw School of Economics, 02-554 Warszawa, Poland
Energies 2022, 15(2), 560; https://0-doi-org.brum.beds.ac.uk/10.3390/en15020560
Submission received: 8 November 2021
/
Revised: 20 December 2021
/
Accepted: 10 January 2022
/
Published: 13 January 2022
(This article belongs to the Special Issue The Issues of the Energy Supply and Demand in the Socio-Economic Development and Reorganization of Military Security Structures)
Abstract
:This study aims to examine energy security in terms of crude oil and copper supply. While oil remains the leading energy commodity globally, copper is crucial for many new technologies, foremost for RES. Therefore, both oil and copper are extremely important for current and future energy security. This article contains a bivariate methodological approach to a comparative analysis of oil and copper supply: determining supply security with an Index of security of supply, and examines price stability with generalized autoregressive conditional heteroscedasticity (GARCH) models. This research provides evidence that there are many differences but also significant similarities between these two completely different commodities in terms of both supply security and price stability. Facing the future for RES, significant demand may cause a threat to energy security on a previously unknown scale. Therefore this instability, both supply- and price-related, appears to be the main threat to future energy security.
1. Introduction
Throughout the years, energy security has remained one of the most important topics for analysis and discussion [1]. Great attention has been paid to this notion in many different fields, such as politics [2], national energy policies [3], international relations [4], and national security [5]. Initially, due to two oil shocks in the 1970s and 1980s, energy security was mostly perceived as energy supply [6,7]. Thus, free access to fossil fuels, namely crude oil, coal, and natural gas, played a significant role. Nowadays, environmental issues are also becoming increasingly important [8,9], and hence, renewable energy sources (RES) are developing intensively.
In the light of contemporary theoretical research on the energy security concept, several hundred or more papers deal with this issue, and they have delivered dozens of different definitions of what is meant by energy security (see for example [10,11]). Despite the huge popularity of the energy security area, difficulties have been encountered in developing a clear and precise concept of this notion [12,13,14,15]. However, the most common definitions still refer to "the uninterrupted availability of energy sources at an affordable price" [16,17]. Hence, the continuity of energy supplies at an acceptable price still might be perceived as being at the core of a vast majority of the existing definitions of this concept. On the other hand, there are also other elements of this concept that depend in turn on the context of the considerations [18,19,20,21,22,23]. For example, currently, due to serious concerns about environmental issues like global warming [24], climate change [25,26], CO2 and greenhouse gas emissions, heavy-metal emissions, water contamination [27], air pollution [28], acidic rain [29], and indoor suffocation [30], these environmental needs are often accented as well.
Due to the lack of an unambiguous concept of energy security, there are many different methods for assessing this issue in practice. These indicators might be grouped depending on the purpose of the analysis. On the one hand, there are measures regarding the degree of concentration in imports. These are based on the commonly proclaimed thesis that diversification of supply and suppliers is the right solution for ensuring energy security [31,32]. The scale of diversification of imports can be evaluated by using an import concentration index (e.g., the Herfindahl-Hirschman index (HHI): [20,33,34,35,36] or a dispersion index (e.g., the Shannon–Weiner dispersion index: [37,38]. On the other hand, there are indicators based on the analysis of the costs of interruptions in energy supply [39,40,41,42,43]. However, these are often referred to as supply cost estimates rather than energy security measures. These methods allow for a quantitative analysis of supply shocks and their impact on the economy. Additionally, few other indicators are based on measuring energy security through the prism of its complexity. Research on this issue is based on advanced measures of energy security. These measures comprise many elements relating to such issues as domestic fuel resources, reliability of transmission infrastructure, or the dependence of the importing country on foreign supplies of energy resources [22,44,45,46,47,48,49,50]. They are published by international organizations such as the International Energy Agency (Model of Short-Term Energy Security), the World Energy Council (Energy Trillema Index), and the American Chamber of Commerce in cooperation with the Global Energy Institute (Energy Security Index).
Although much has been said about energy security, an extensive review of the literature reveals that there are still some areas very little explored, especially in terms of empirical assessment. For example, although studies and reports point to the problem of significant future demand for many different raw materials, to the best of the author’s knowledge, there are no analogous comparative studies for such materials as crude oil and copper in terms of energy security. In general, comparative analysis is narrowly used in the energy security area, which is especially obvious when it comes to the case of completely different groups of commodities: energy and non-energy. However, it should be noted that energy production is currently more and more substitutable, i.e., electricity can be produced by burning coal, oil, or gas, and also comes from wind and solar farms. Hence, the comparative method in the energy security field is strongly justified.
While fossil fuels are still dominant today and one-third of energy still comes from oil [51], the shift towards RES is greatly expected in the future. As energy transitions accelerate globally, clean energy implies a significant increase in demand for minerals essential for solar panels, batteries, wind turbines, and electric networks, led by copper. Until the mid-2010s, the energy sector’s share in total demand for minerals was small. However, clean energy technologies and RES are becoming the fastest-growing demand segment as energy transitions gather pace. In a scenario that meets the Paris Agreement goals, the demand for clean energy technologies will rise significantly over the next two decades to over 40% in the case of copper and rare earth elements, 60–70% for nickel and cobalt, and almost 90% for lithium [52]. The ambitious plans regarding solar panels, wind turbines, and electric cars might be threatened by the scarcity of necessary resources for RES, including but not limited to copper. In contrast, fossil fuels and crude oil continue to be essential. Therefore, there is a need to assess the price volatility and supply security of both crude oil and copper in a comparative manner [40].
This article aims to examine the state of energy security for both copper and oil in terms of their price stability and security of supply. The reason for this case study analysis is that oil is still the world’s dominant energy commodity [39], while copper is the most widely used mineral in clean energy technologies due to its thermal and electrical conductivity [53]. Hence, both oil and copper are fundamental for the energy sector now and in the future.
On the other hand, there are significant differences between these two groups of raw materials and their use in the energy sector. For example, a shortage or spike in the price of copper only directly affects the price of new electric vehicles (EV) or solar plants, while an increase in oil prices causes the fuel price dynamic, and there is a follow-on impact concerning energy security. Moreover, oil combustion means a new supply is essential for energy production (a non-renewable resource). By contrast, copper, as a component of infrastructure, has the potential to be recovered and recycled [54].
This paper is organized as follows. Section 2 firstly contains the bivariate methodology of quantitative measurement of energy security: supply security (Section 2.2) and price stability (Section 2.3). Section 3 presents the research results based on both the security of supply index (Section 3.1) and GARCH models for price volatility (Section 3.2). Section 4 contains a discussion. Section 5 provides conclusions and prospects for further research.
2. Methodology
2.1. Energy Security Dimensions in the Case of Oil and Copper Supply
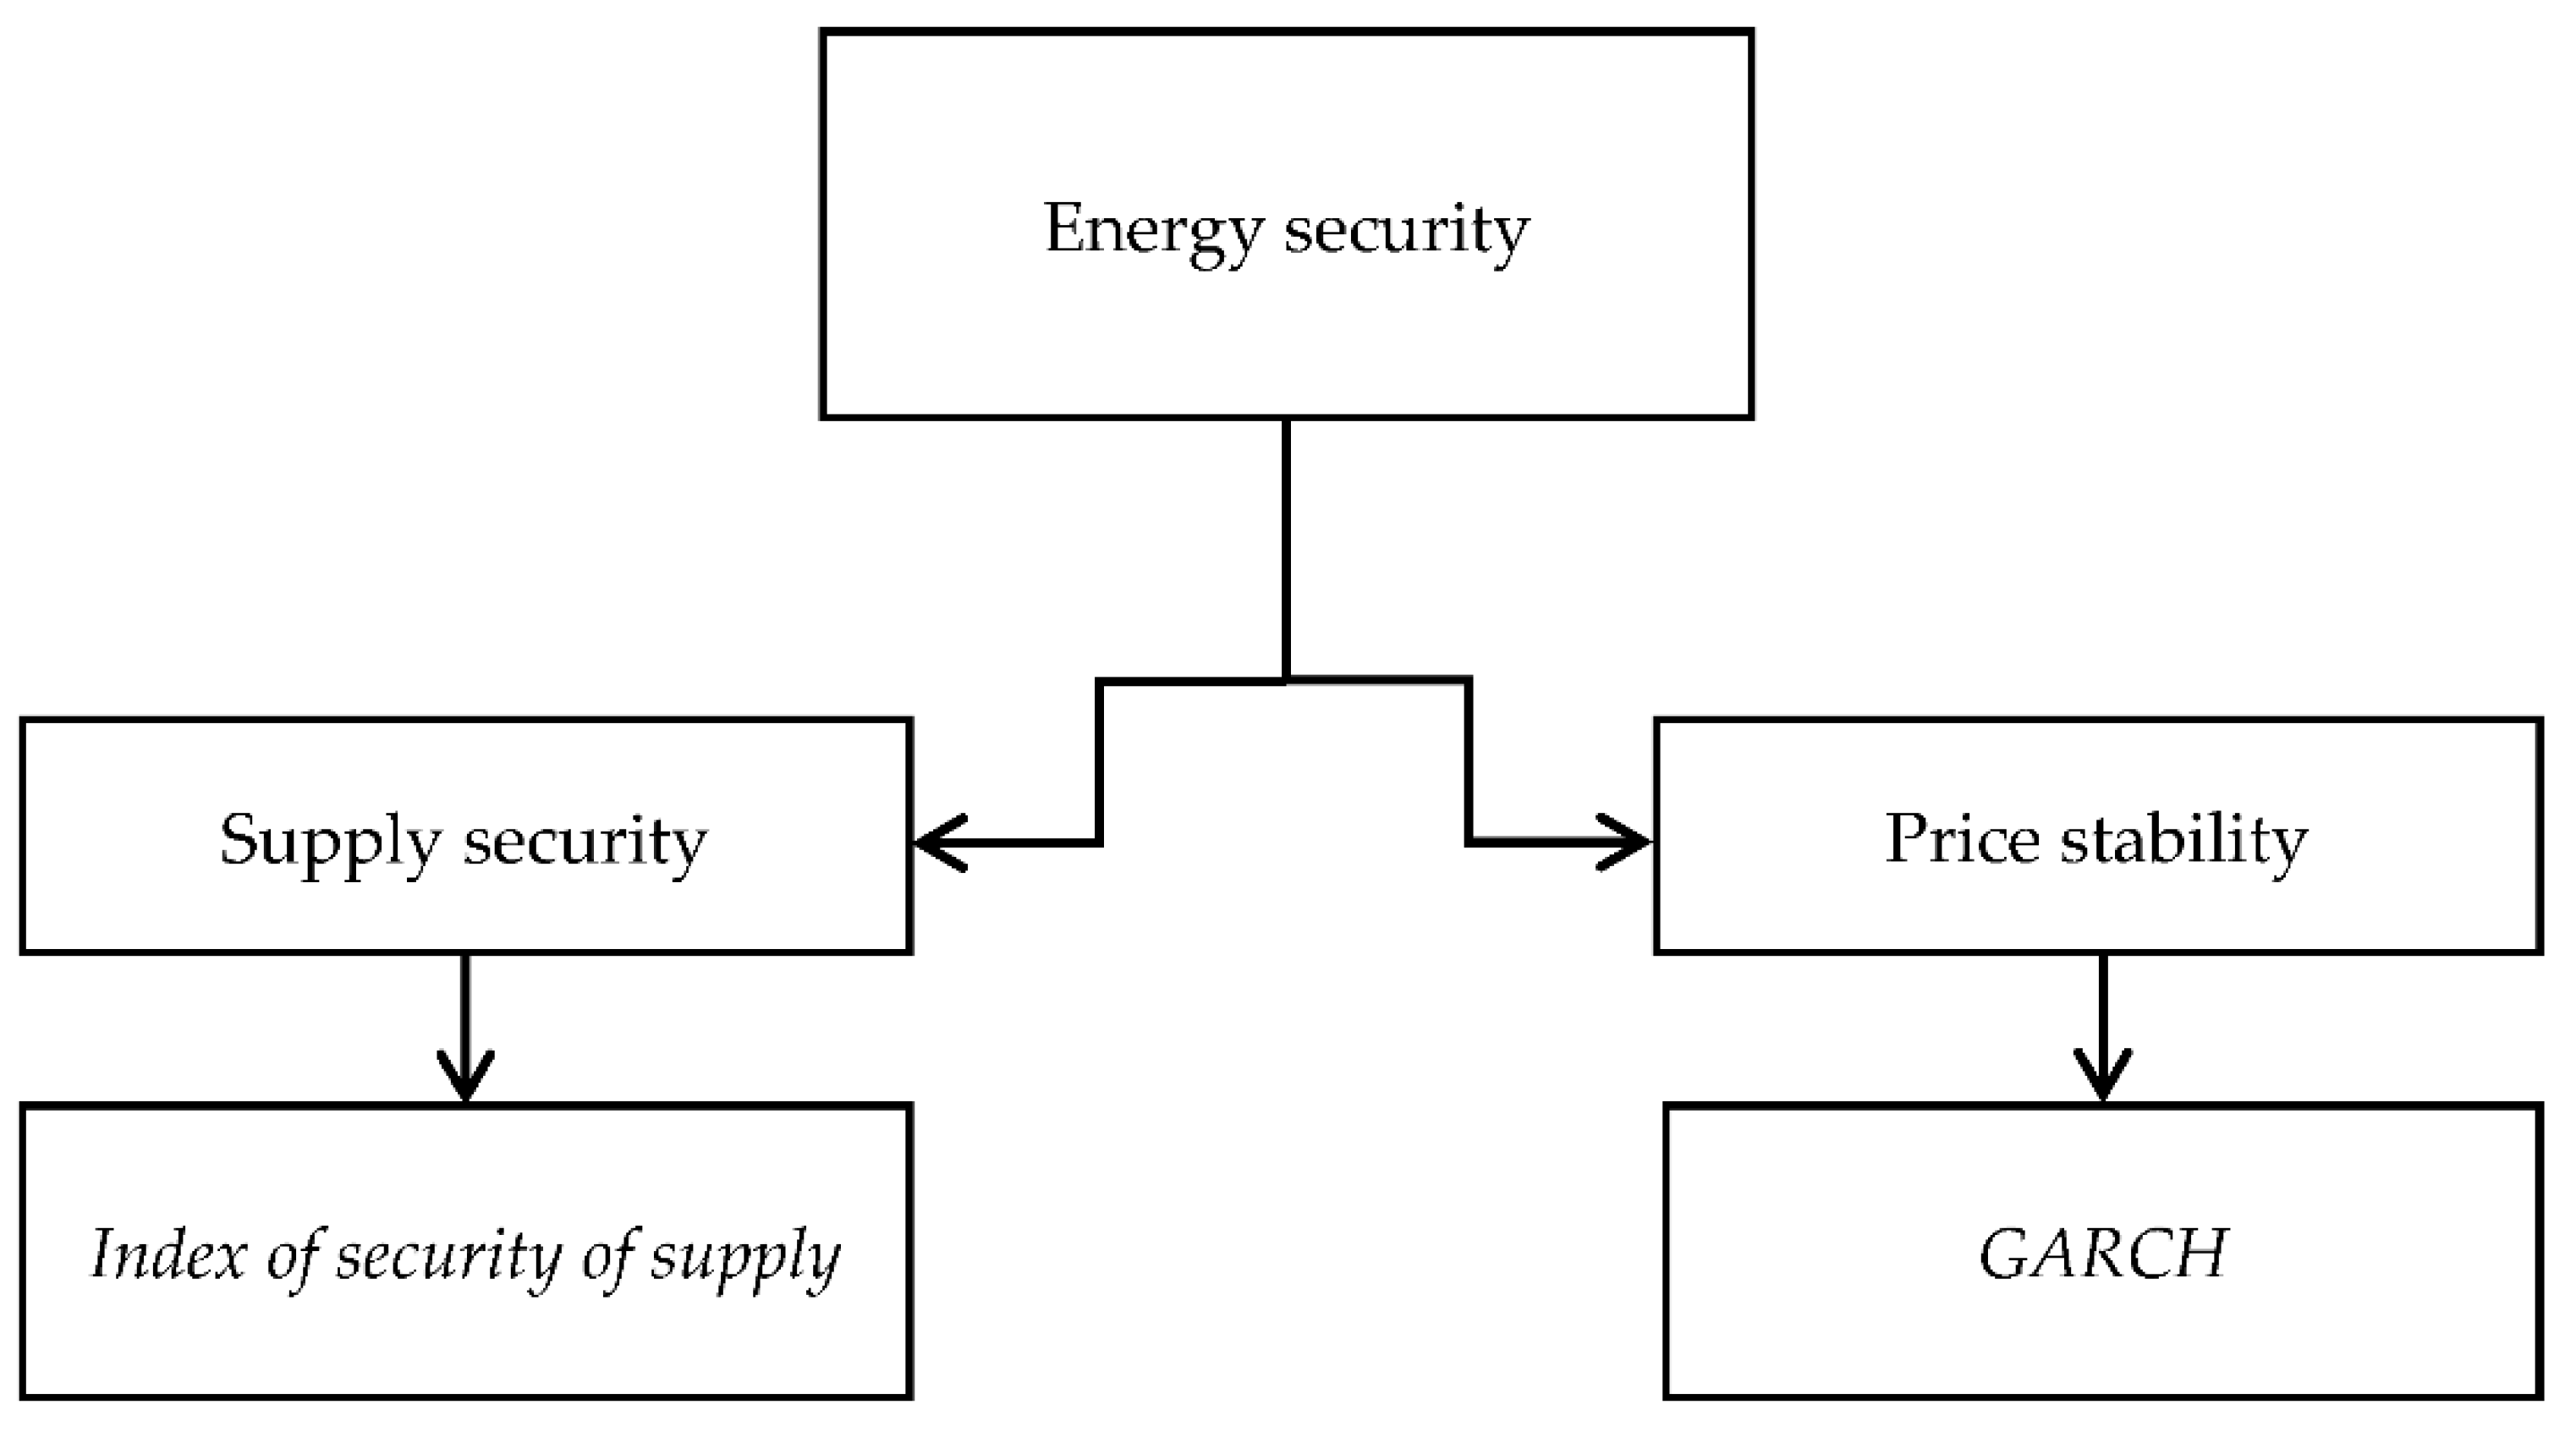
Due to both core elements of this energy security concept, a bivariate methodological approach is taken in further analysis: a comparison of the global supply of crude oil and copper (Section 2.2) and their price stability (Section 2.3)—see Figure 1.
2.2. The Security of Global Oil and Copper Supply
Energy security in terms of supply security might be achieved using different approaches. However, most of this analysis concerns fossil fuels only. In this field, the quantitative measures are based on the commonly proclaimed thesis that supply diversification is the right solution for ensuring energy security [31,32]. Therefore, the scale of diversification of import might be evaluated by using an import concentration index (e.g., the Herfindahl-Hirschman index (HHI); [33,34,35,36]) or a dispersion index (e.g., the Shannon–Weiner dispersion index; [37,38]). Moreover, for a more thorough analysis, many other parameters might also be included, for example, political stability of the supplier or share in the total world production by the exporter (see, e.g., [34]). As this article relates to the holistic approach to the global risk of both oil and copper supply, the indicator takes the form described below:
where:
—the Herfindahl-Hirschman index of world oil or copper producer;
—political stability of the supplier (World Bank’s Political Stability Index (Political stability index (−2.5 weak; 2.5 strong), 2019—Country rankings: The average for 194 countries was −0.06 points)).
Herfindahl-Hirschman Index (HHI) measures the concentration level in a given industry and the level of competition in a given market [55]. In this article, the formula relates to copper and oil production, and is as follows:
where:
represents the market share of each producer/supplier, and n represents the total number of producers/suppliers (see Table 1).
2.3. The Price Stability of the Copper and Oil
Generally, regarding price conditions of the oil and copper supply, it is difficult to precisely define the affordability level for all importer countries. This always depends on the counterparty of the transaction. Moreover, that parameter is not stable over time. However, it is commonly assumed that an affordable price should be characterized by certain stability [9] and predictability. Therefore, price volatility is considered crucial for risk management in terms of energy security. In this context, many methods for assessing volatility and making forecasts in literature are applied, e.g., econometric models and soft computing models (see for example [56,57,58]) or artificial intelligence and machine learning [59,60,61]. However, like generalized autoregressive conditional heteroscedasticity (GARCH) models, and the variations of these, such econometric models are still in use in the case of time-series analysis. In this model, the variances from previous periods make it possible to assess the current variability of the process dependent on its entire past in a sparingly parameterized manner. These econometric models have been applied in plenty of studies regarding energy commodities, particularly crude oil (e.g., [62,63,64,65,66,67,68,69,70,71]) or natural gas (e.g., [64,66,72]). Also, metals (including copper) are well examined regarding volatility persistence using autoregressive time-series and GARCH models as well (e.g., [73,74,75,76,77,78,79,80,81]). Surprisingly, the results for non-energy and energy commodities are very rarely compared. Therefore, in this article, the GARCH model is also used as a standard tool for measuring volatility.
Firstly, the ARIMA (p,d,q) (auto-regressive integrated moving average) model was applied to forecast both the oil and copper time-series in-sample. However, as the specification of the ARIMA model indicated the canceling values of the coefficients for both oil and copper (see Appendix A), the GARCH models are employed on logarithmic returns. The GARCH (p,q) model (introduced by Bollerslev [82]) is applied to describe the time-varying variance. This model assumes that is the innovation process which can be presented as:
where is the conditional variance, is the set of all information available at time t−1, N is the conditional normal distribution.
where > 0, ≥ 0, ≥ 0 for i = 1, 2, …, q; j = 1, 2, …, p.
Prior research shows that in practice, the most frequently used model in financial time-series modeling is the GARCH (1,1) model. However, in individual cases and for a longer time series, the GARCH (1,2) and GARCH (2,1) models sometimes describe volatility better than the GARCH (1,1) model (see for example [83,84]). The choice of the sparingly parameterized form of the GARCH model is made based on the Akaike criterion (AIC), Schwarz criterion (SIC), and Hannan-Quinn (HQC); here, AIC is the main information criterion, while SIC and HQC are treated as auxiliary criteria. From among the various forms of the model, the one for which the value of the information criterion is lowest is selected.
3. Results
3.1. Geographical Concentration of Oil and Copper Production
The degree of concentration of production is still fundamental for analyzing energy security. Thus, there is an assumption that high dispersion together with political stability of the suppliers favors the security of both crude oil and copper supply.
Given its unmatched thermal and electrical conductivity, copper has wide application in various industries such as machine manufacturing, automobile manufacturing, agriculture, electronic components, household appliances, and finally, RES [85,86,87,88]. As it is commonly believed, copper’s attributes make it almost irreplaceable. Hence, world production of copper has a large impact on the future of clean energy technologies [89,90]. While oil has remained the leading energy commodity globally over the years [51], the demand for copper for clean energy technologies remains one of the highest both by weight and monetary value [53]. Copper is the third most consumed industrial metal (after iron and aluminum) [91,92].
In the case of copper, Chile and Peru are the world’s main suppliers, with production accounting for 28% (HHI 783.69) and 12% (141.07), respectively [93]—see Figure 2, Table 2. China, Congo, D.R., the United States, and Australia are the other major producing countries, though their individual share in total world production is less than 10%. Copper supply has been expanding rapidly over the past decades due to demand generated by strong economic growth in emerging and developing economies. More than 250 mines currently operate in nearly 40 countries, producing around 21 million tons of copper. This level of production is 30% greater than ten years ago. Nevertheless, the current production in major copper mines has already peaked or is expected to peak in the early 2020s due to declining ore quality and exhaustion of reserves [53]. Total copper production is moderately concentrated on a global scale (HHI 1175.27), and its further development in the case of entities dominant in this market may threaten the existing competition. Moreover, the largest production is still realized in politically unstable countries. This determines the threats to the stability of the copper supply. The threats arise in areas such as government effectiveness of the exporters’ countries, regulatory quality in these countries, the rule of law, control of corruption, or probability of occurrence of violence or terrorist attacks (see, for example, the World Bank’s Political Stability Index [94]).
In the case of crude oil, production concentration is not as high: HHI 763.70, which suggests competition in the market. While the United States is the main crude oil producer in the world, with production accounting for 16.70% (HHI 278.90), the Russian Federation and Saudi Arabia are also significant suppliers, with shares of approximately 12.80% (HHI 163.96) and 12.43% (HHI 154.48), respectively [51]—see Figure 3; Table 3. However, the shape of the crude oil market is also significantly influenced by OPEC (The Organization of the Petroleum Exporting Countries), with nearly 80% of the world’s proven oil reserves [95]. Furthermore, supply security is determined by certain political and economic turmoil, such as in Venezuela (still retaining the world’s biggest crude reserves) or other factors such as sanctions on Iranian oil.
Comparing copper and oil production, in the case of the 15 largest copper producers, the index of security of supply is at 691.541, while 15 of the world’s major oil producers have 183.551 of this index. This is because there are low values (negative Political Stability Index) in many major producers. Therefore, oil production seems to be 3.77 times less stable than copper. This means that top oil producing countries are politically unstable states, and hence there is a greater risk of intermittent supply than in the case of copper. On the other hand, in the case of copper, the Total-15 concentration is even higher than oil, at around 89.40% vs. 81.34%, which ultimately demonstrates a higher market concentration.
3.2. Oil and Copper Price Volatility
Apart from the stability of supply and suppliers, the definition of energy security also includes the affordable price component. As the World Energy Council has stated, volatility of energy prices has a critical uncertainty for the future economy [96]. Hence, price stability is highly desirable.
Table 4 shows the descriptive statistics of both variables: copper and oil prices (also with their daily logarithmic returns). Financial data have been sourced from the Shanghai Metals Market (SMM) for copper (Copper 99.95 Spot Price Daily), and from the NY Mercantile Exchange for oil (Brent Forties and Oseberg Dated FOB Northsea Crude daily), both via Reuters. The time-series span is from the beginning of June 2012 to the end of August 2021 (The time limitation of the study is due to the availability of data: SMM quoted copper from June 2012). These variables are on different price levels: the mean price for copper is around USD 7 577.4 per ton, while the mean for oil is USD 69.329 per barrel. However, the findings suggest that crude oil is twice as volatile as copper. This is evidenced by the corresponding standard deviations in relation to their mean values: 36.34% vs. 17.29%. Both time-series returns for oil and copper are negatively skewed. Both have excess kurtosis, and their distributions are leptokurtic. In the case of both, the null of normality is strongly rejected according to the Jarque-Bera test (Table 4).
The time-series of both oil and copper prices are not stationary, and this has been confirmed by the Augmented Dickey-Fuller (ADF) test [97] and Phillips-Perron test [98] (Table 5). Therefore, logarithmic returns were used (realization of both time-series are shown in Figure 4)
Moreover, the presented graphs of logarithmic rates of return on crude oil and cooper indicate variance grouping effects, namely volatility clustering (periods of increased volatility and relatively stable periods occurring consecutively). Therefore, the traditional ARCH/GARCH test confirms there are ARCH effects; the test statistic for oil is LM: 151.021, while for copper, it is LM: 56.2352 (Table 6).
The GARCH (1,1) for oil and GARCH (2,1) for copper are applied based on the AIC (Appendix B: Table A3 and Table A4). In both cases, the value of coefficients is less than but close to unity. In this context, the greater the sum of the evaluation of the parameters α1 + α2 + … + αq + β1 + β2 + … + …+ βp = 1 in the GARCH model, the longer the impact of shock phenomena on the variance of the analyzed process [83]. Therefore, this indicates that volatility shocks are quite persistent and cluster. In the case of copper, the sum of the β coefficient in the GARCH model is 2.6 times greater than α, while in the case of oil, this ratio is approximately 7.6, which suggests higher unexpected volatility. Forecasts for the conditional variance (in-sample) generated by the models for both oil and copper are presented in Figure 5.
4. Discussion
This study examined energy security in the case of both crude oil and copper supply. It found that the price of crude oil is twice as volatile as the price of copper in the research period. This is evidenced by the corresponding standard deviations in relation to their mean values. Moreover, the relation of the β coefficients to α is higher in the case of oil than copper, which means the state will experience higher unexpected oil price volatility than copper. On the other hand, copper has a higher concentration level in the Total-15 producer group. This ultimately suggests a higher concentration of the market. In turn, by analyzing the security of the supply index, there is strong evidence that both copper and oil are at serious risk of supply discontinuity. However, oil production seems to be 3.77 times less stable than copper. The source of these threats may be insufficient government effectiveness of the producing countries, low regulatory quality in these countries, or even unsatisfactory control of corruption (these factors are included in the Political Stability Index).
Finally, the study results show that the expected dynamics of demand for oil and copper, amid relatively limited supplies and conditions of low competitiveness among suppliers, may mean that their price will not be determined solely by the market mechanism. These fears are compounded by the relatively high political instability of the main exporters of these materials, as well as the socio-economic problems in these countries [99].
Looking deeply into the problem in light of the existing studies, there are many factors determining price changes of oil and copper. The most frequent determinants in the case of oil price equations cover economic factors such as demand and supply levels (amount of consumption and production [100,101,102,103]); business cycle (global GDP growth) or global financial market liquidity [103]; political factors such as OPEC production amounts [100,101,102,103,104,105]; or the political risk of exporters (e.g., measured by the International Country Political Risk Guide [103]); infrastructure factors like production capacity [106] or crude oil stocks [100,102,105]; and other factors such as the ratio of futures contracts trading in relation to physical deliveries, and the number of terrorist attacks or number of soldiers stationed in the Middle East.
In the case of copper, per analogiam, the current level of demand and supply strongly determine the price as well. These are crucial because the copper market is relatively transparent, which means that a change in supply or demand is reflected in the price, while an excess of production over consumption results in higher stock levels. On the other hand, a production deficit relative to consumption results in lower stock levels. Also, recessions result in reduced demand. Additionally, supply can be delayed by long lead times for the construction of new facilities [107] (growth rate in industrial production) (see, e.g., [108]). Moreover, there are also financial factors [108,109,110,111]. Thus, the impact of various hedge funds that focus, or at least partially focus on commodities, also affects copper prices (the financialization of commodity markets) [109,112]. This obviously has a real-world link. Such funds can increase instability in copper prices, especially in the short term. In the past, prices tended to change more gradually, but there are more spikes, both high and low, in the current marketplace.
Furthermore, for both these commodities, unexpected events also have a major effect on the price. For example, oil and copper prices spiked during the first half of 2020. This might be explained by, among other things, the ongoing COVID-19 pandemic, and it can be assumed that this is not merely a one-off event. The prolonged effect of the pandemic, and any additional repercussions the pandemic might cause, could determine potential future market turmoil.
5. Conclusions and Prospects for Further Research
Extending the obtained conclusions from the analysis of the entire group of clean energy metals (e.g., silver, vanadium, titanium, molybdenum, zinc, nickel, lithium, lead, indium, cobalt, chromium, or aluminum), it is assumed that possible disruptions combined with already unstable prices, accounting for significant future demand for RES, may present a threat to energy security on a previously unknown scale. This instability, both price-related and political (affecting the continuity of supplies), appears to be the main threat to future energy security. Therefore, the implementation of new solutions as the basis for reducing dependence on metals such as copper (e.g., the use of substitutes) due to the strong concentration of production is of key importance. Moreover, the long-term supply of clean energy metals will also depend on developing efficient recycling systems. Therefore, recycling will be a key element influencing the state of energy security of the future.
Undoubtedly, an extremely important area of future research in light of energy security will be even greater analysis of the determinants of non-energy commodity prices, especially those essential for RES. This type of research might provide new insights into the rapidly changing world energy picture. As has been proved, comparative analysis has great value; hence further development is postulated.
Additionally, further analyses and forecasts are extremely necessary in order to better manage risk and ensure energy security in the future. Hence, the price volatility of non-energy commodities should be an indispensable part of energy security research.
From the methodological point of view, it is still problematic to find the most appropriate models and tools to measure both the stability of supplies and prices more accurately. Possible further research into energy security could be performed by applying other GARCH model modifications such as EGARCH, IGARCH (In this research, the sum of coefficients nearly unity for GARCH (1,1) in the case of crude oil suggest that the Integrated GARCH model could be used as a peculiar case of the IGARCH process, GARCH-M, GARCH GJR, or APARCH for better prediction of clean energy metal price volatility (not only copper).
Funding
This research received no external funding.
Institutional Review Board Statement
Not applicable.
Informed Consent Statement
Not applicable.
Data Availability Statement
Publicly available datasets were analyzed in this study.
Conflicts of Interest
The authors declare no conflict of interest.
Appendix A

Table A1.
Statistic of time-series.
| Coefficient | Coefficient | Std. Error | z | p-Value | |
|---|---|---|---|---|---|
| copper_price ARIMA (2,1,2) | phi_1 | 1.07808 | 0.132760 | 8.120 | <0.0001 *** |
| phi_2 | −0.752266 | 0.0423458 | −17.76 | <0.0001 *** | |
| theta_1 | −1.08824 | 0.122010 | −8.919 | <0.0001 *** | |
| theta_2 | 0.786759 | 0.0381243 | 20.64 | <0.0001 *** | |
| oil_price ARIMA (1,1,1) | phi_1 | −0.769229 | 0.0395812 | −19.43 | <0.0001 *** |
| theta_1 | 0.792901 | 0.0376070 | 21.08 | <0.0001 *** |
Notes: *** 1% level significant.
Table A2.
Statistic of time-series.
| Statistics | ME | RMSE | MAE | MPE | MAPE |
|---|---|---|---|---|---|
| copper_price ARIMA (2,1,2) | 0.95534 | 84.094 | 54.885 | 0.0038776 | 0.72846 |
| oil_price ARIMA (1,1,1) | −0.010504 | 1.2807 | 0.93484 | −0.058535 | 1.6369 |
Appendix B
Table A3.
Parameters and statistics of GARCH models in the case of copper.
| Model | Parameter | Coefficient | Std. Error | z | p-Value | Schwarz Criterion | Akaike Criterion | Hannan-Quinn |
|---|---|---|---|---|---|---|---|---|
| GARCH(1,1) | alpha(0) | 0.00001 | 0.00000 | 4.943 | <0.0001 *** | −13,894.18 | −13,916.94 | −13,908.62 |
| alpha(1) | 0.17681 | 0.02778 | 6.364 | <0.0001 *** | ||||
| beta(1) | 0.72767 | 0.03937 | 18.480 | <0.0001 *** | ||||
| GARCH(1,2) | alpha(0) | 0.00001 | 0.00000 | 3.468 | 0.0005 *** | −13,885.74 | −13,914.19 | −13,903.79 |
| alpha(1) | 0.15560 | 0.03545 | 4.390 | <0.0001 *** | ||||
| alpha(2) | 0.00000 | 0.04841 | 0.000 | 1 | ||||
| beta(1) | 0.74521 | 0.05644 | 13.200 | <0.0001 *** | ||||
| GARCH(1,3) | alpha(0) | 0.00001 | 0.00000 | 3.331 | 0.0009 *** | −13,878.05 | −13,912.19 | −13,899.71 |
| alpha(1) | 0.15845 | 0.03584 | 4.421 | <0.0001 *** | ||||
| alpha(2) | 0.00000 | 0.05095 | 0.000 | 1 | ||||
| alpha(3) | 0.01288 | 0.04277 | 0.301 | 0.7634 | ||||
| beta(1) | 0.73274 | 0.06865 | 10.670 | <0.0001 *** | ||||
| GARCH(2,1) *** | alpha(0) | 0.00001 | 0.00000 | 4.987 | <0.0001 *** | −13,899.77 | −13,928.22 | −13,917.82 |
| alpha(1) | 0.25220 | 0.03501 | 7.204 | <0.0001 *** | ||||
| beta(1) | 0.21564 | 0.05896 | 3.657 | 0.0003 *** | ||||
| beta(2) | 0.44103 | 0.06397 | 6.894 | <0.0001 *** | ||||
| GARCH(3,1) | alpha(0) | 0.00001 | 0.00000 | 4.921 | <0.0001 *** | −13,892.36 | −13,926.50 | −13,914.02 |
| alpha(1) | 0.26043 | 0.03847 | 6.770 | <0.0001 *** | ||||
| beta(1) | 0.17843 | 0.08661 | 2.060 | 0.0394 ** | ||||
| beta(2) | 0.43279 | 0.06612 | 6.546 | <0.0001 *** | ||||
| beta(3) | 0.03796 | 0.06939 | 0.547 | 0.5843 | ||||
| GARCH(2,2) | alpha(0) | 0.00001 | 0.00000 | 3.729 | 0.0002 *** | −13,891.72 | −13,925.86 | −13,913.38 |
| alpha(1) | 0.23565 | 0.03603 | 6.541 | <0.0001 *** | ||||
| alpha(2) | 0.00000 | 0.04507 | 0.000 | 1 | ||||
| beta(1) | 0.24630 | 0.13290 | 1.853 | 0.0638 * | ||||
| beta(2) | 0.42435 | 0.09627 | 4.408 | <0.0001 *** | ||||
| GARCH(2,3) | alpha(0) | 0.00001 | 0.00000 | 2.571 | 0.0102 ** | −13,882.79 | −13,922.62 | −13,908.06 |
| alpha(1) | 0.21461 | 0.03975 | 5.399 | <0.0001 *** | ||||
| alpha(2) | 0.00000 | 0.03964 | 0.000 | 1 | ||||
| alpha(3) | 0.00002 | 0.06246 | 0.000 | 0.9998 | ||||
| beta(1) | 0.23965 | 0.11909 | 2.012 | 0.0442 ** | ||||
| beta(2) | 0.46793 | 0.12417 | 3.769 | 0.0002 *** |
Notes: Selected model based on AIC criteria. * 10% level of significant; ** 5% level significant; *** 1% level significant.
Table A4.
Parameters and statistics the GARCH models in case of crude oil.
| Model | Parameter | Coefficient | Std. Error | z | p-Value | Schwarz Criterion | Akaike Criterion | Hannan-Quinn |
|---|---|---|---|---|---|---|---|---|
| GARCH(1,1) *** | alpha(0) | 0.000006 | 0.0000018 | 3.241 | 0.0012 *** | −10,714.08 | −10,736.84 | −10,728.52 |
| alpha(1) | 0.116227 | 0.0126919 | 9.158 | <0.0001 *** | ||||
| beta(1) | 0.883214 | 0.0115181 | 76.68 | <0.0001 *** | ||||
| GARCH(1,2) | alpha(0) | 0.000013 | 0.0000049 | 2.609 | 0.0091 *** | −10,689.03 | −10,717.48 | −10,707.08 |
| alpha(1) | 0.172150 | 0.0315393 | 5.458 | <0.0001 *** | ||||
| alpha(2) | 0.000000 | 0.0379168 | 0.000 | 1 | ||||
| beta(1) | 0.825979 | 0.0313808 | 26.32 | <0.0001 *** | ||||
| GARCH(2,1) | alpha(0) | 0.000007 | 0.0000023 | 3.01 | 0.0026 *** | −10,708.03 | −10,736.48 | −10,726.08 |
| alpha(1) | 0.138277 | 0.0220650 | 6.267 | <0.0001 *** | ||||
| beta(1) | 0.651605 | 0.1803880 | 3.612 | 0.0003 *** | ||||
| beta(2) | 0.209163 | 0.1635130 | 1.279 | 0.2008 |
Notes: Selected model based on AIC criteria. *** 1% level significant.
References
- Vivoda, V. Evaluating energy security in the AsiaPacific region: A novel methodological approach. Energy Policy 2010, 38, 5258–5263. [Google Scholar] [CrossRef] [Green Version]
- Jonsson, D.K.; Johansson, B.; Månsson, A.; Nilsson, L.J.; Nilsson, M.; Sonnsjö, H. Energy security matters in the EU Energy Roadmap. Energy Strat. Rev. 2015, 6, 48–56. [Google Scholar] [CrossRef]
- Franki, V.; Viškovic, A. Energy security, policy and technology in South East Europe: Presenting and applying an energy security index to Croatia. Energy 2015, 90, 494–507. [Google Scholar] [CrossRef]
- Kirchner, E.; Berk, C. European energy security cooperation: Between amity and enmity. J. Com. Mark. Stud. 2010, 48, 859–880. [Google Scholar] [CrossRef]
- Dyer, H.; Trombetta, M.J. International Handbook of Energy Security; Edward Elgar Publishing: Cheltenham, UK; Northampton, MA, USA, 2013. [Google Scholar]
- Willrich, M. International energy issues and options. Ann. Rev. Ener. 1976, 1, 743–772. [Google Scholar] [CrossRef]
- Miller, L.B.; Lieber, R.J.; Maddox, J.; Mancke, R.; Vernon, R.; Willrich, M. Energy, security and foreign policy: A review essay. Int. Secur. 1977, 1, 111–123. [Google Scholar] [CrossRef]
- Müller-Kraenner, S. Energy Security, Re-Measuring the World; Routledge: London, UK, 2007. [Google Scholar]
- Yao, L.; Chang, Y. Energy security in China: A quantitative analysis and policy implications. Energy Policy 2014, 67, 595–604. [Google Scholar] [CrossRef]
- Ang, B.W.; Choong, W.L.; Ng, T.S. Energy security: Definitions, dimensions and indexes. Renew. Sustain. Energy Rev. 2015, 42, 1077–1093. [Google Scholar] [CrossRef]
- Azzuni, A.; Breye, C. Definitions and dimensions of energy security: A literature review. Adv. Rev. 2018, 7, 1–34. [Google Scholar] [CrossRef]
- Knox-Hayes, J.; Brown, M.A.; Sovacool, B.K.; Wang, Y. Understanding attitudes toward energy security: Results of a cross-national survey. Glob. Environ. Chang. 2013, 23, 609–622. [Google Scholar] [CrossRef]
- Šumskis, V.; Giedraitis, V. Economic implications of energy security in the short run. Ekonomika 2015, 94, 119–138. [Google Scholar] [CrossRef]
- Kruyt, B.; van Vuuren, D.; de Vries, H.; Groenenberg, H. Indicators for energy security. Energy Policy 2014, 37, 2166–2181. [Google Scholar] [CrossRef]
- Loeschel, A.; Moslener, U.; Ruebellke, D.T.G. Indicators of Energy Security in Industrialised Countries. Energy Policy 2010, 38, 1665–1671. [Google Scholar] [CrossRef]
- Labandeira, X.; Manzano, B. Some Economic Aspects of Energy Security. IMF Work Pap. 2012, 9, 1–18. [Google Scholar] [CrossRef] [Green Version]
- International Energy Agency (IEA). 2019. Available online: https://www.iea.org/areas-of-work/ensuring-energy-security (accessed on 3 September 2021).
- Chester, L. Conceptualising energy security and making explicit its polysemicnature. Energy Policy 2010, 38, 887–895. [Google Scholar] [CrossRef]
- Cherp, J.J. The concept of energy security: Beyond the four As. Energy Policy 2014, 75, 415–421. [Google Scholar] [CrossRef] [Green Version]
- Gupta, E. Oil vulnerability index of oil-importing countries. Energy Policy 2008, 36, 1195–1211. [Google Scholar] [CrossRef]
- Sovacool, B.K. Differing cultures of energy security: An international comparison of public perceptions. Renew. Sustain. Energy Rev. 2016, 55, 811–822. [Google Scholar] [CrossRef]
- Radovanović, M.; Filipović, S.; Pavlović, D. Energy security measurement–a sustainable approach. Renew. Sustain. Energy Rev. 2017, 68, 1020–1032. [Google Scholar] [CrossRef]
- Dezellus, E.; Ferreira, L.; Pereira, N.; Vasiliūnaitė, R. Entrepreneurship conditions: Energy resources’ prices and energy consumption peculiarities in developed countries. Entrep. Sustain. Issues 2015, 2, 163–170. [Google Scholar] [CrossRef]
- Meadows, D.H.; Randers, J.; Meadows, D.L.; Behrens, W.W. The Limits to Growth; Club of Rome: New York, NY, USA, 1972. [Google Scholar]
- Von Hippel, D.; Suzuki, T.; Williams, J.; Hayes, P. Evaluating the energy security impacts of energy policies. In The Routledge Handbook of Energy Security; Sovacool, B.K., Ed.; Routledge: Oxford, UK; New York, NY, USA, 2011. [Google Scholar]
- Munich Re, Munich Reinsurance Company. Topics Geo: Natural Catastrophes 2013: Analyses, Assessments, Positions; Munich Reinsurance Company: Munich, Germany, 2014. [Google Scholar]
- Sovacool, B.K.; Bulan, L.C. Meeting targets, missing people: The energy security implications of the Sarawak Corridor of Renewable Energy (SCORE). Contemp Southeast Asia. J. Int. Strat. Aff. 2011, 33, 56–82. [Google Scholar]
- Brown, M.A.; Dworkin, M. The environmental dimension of energy security. In The Routledge Handbook of Energy Security; Sovacool, B.K., Ed.; Routledge: Oxford, UK; New York, NY, USA, 2011. [Google Scholar]
- Islam, A.; Chan, E.-S.; Taufiq-Yap, Y.H.; Mondal, M.A.H.; Moniruzzaman, M.; Mridha, M. Energy security in Bangladesh perspective—An assessment and implication. Renew. Sustain. Energy Rev. 2014, 32, 154–171. [Google Scholar] [CrossRef]
- Correljé, A.; van der Linde, C. Energy supply security and geopolitics: A European perspective. Energy Policy 2006, 34, 532–543. [Google Scholar] [CrossRef]
- Grubb, M.; Butler, L.; Twomey, P. Diversity and security in UK electricity generation: The influence of low-carbon objectives. Energy Policy 2010, 34, 4050–4062. [Google Scholar] [CrossRef] [Green Version]
- Lefevre, N. Measuring the energy security implications of fossil fuel resource concentration. Energy Policy 2010, 38, 1635–1644. [Google Scholar] [CrossRef]
- Le Coq, C.; Paltseva, E. Measuring the security of external energy supply in the European Union. Energy Policy 2009, 37, 4474–4481. [Google Scholar] [CrossRef]
- Neff, T.L. Improving Energy Security in Pacific Asia, Diversification and Risk Reduction for Fossil and Nuclear Fuels; PARES Project; Center for International Studies, Massachusetts Institute of technology: Cambridge, MA, USA, 1997. [Google Scholar]
- Percebois, J. Dependance et Vulnerabilite: Deux Fac-ons Connexes Mais Differentes Da´border les Risque´ s Renergetiques; Centre de Recherche en Economie et Droit de lE´nergie (CREDEN), Universite de Montpellier: Montpellier, France, 2006. [Google Scholar]
- Neumann, A. How to Measure Security of Supply? Dresden University of Technology: Dresden, Germany, 2007. [Google Scholar]
- Jansen, J.C.; van Arkel, W.G.; Boots, M.G. Designing indicators of long-term energy supply security; ECN: Petten, The Netherlands, 2004. [Google Scholar]
- Barsky, R.B.; Kilian, K. Oil and the Macroeconomy since the 1970s. J. Econ. Persp. 2004, 18, 115–134. [Google Scholar] [CrossRef] [Green Version]
- Beccue, P.; Hunington, H.G. Oil disruption. Risk Assessment. Ener. Mod. Forum 2005, 8, 1–56. [Google Scholar]
- Constantini, V.; Gracceva, F. Social costs of energy disruptions. FEEM Work Pap. 2004, 6, 11604. [Google Scholar]
- Davis, M.; Piontkivsky, R.; Pindyuuk, O. Ukraine—The Impact of Higher Natural Gas and Oil Prices; The World Bank: Washington, DC, USA, 2005; p. 38602. [Google Scholar]
- Leiby, P.N.; Jones, D.W.; Curlee, T.R.; Lee, R. An Oil Imports: An Assessment of Benefits and Costs, Oak Ridge National Laboratory. 1997. Available online: https://www.esd.ornl.gov/eess/energy_analysis/files/ORNL6851.pdf (accessed on 12 October 2021).
- Cabalu, H. Indicators of security of natural gas supply in Asia. Ener. Pol. 2010, 38, 218–225. [Google Scholar] [CrossRef] [Green Version]
- Garcia-Gusano, D.; Iribarren, D.; Garrain, D. Prospective analysis of energy security: A practical life-cycle approach focused on renewable power generation and oriented towards policy-makers. Appl. Energy 2017, 190, 891–901. [Google Scholar] [CrossRef]
- Kisel, E.; Hamburg, A.; Härm, M.; Leppimanad, A.; Ots, M. Concept of energy security matrix. Ener. Pol. 2016, 95, 1–9. [Google Scholar] [CrossRef]
- Mansson, A.; Johansson, B.; Nilsson, L.J. Assessing energy security: An overview of commonly used methodologies. Energy 2014, 73, 1–14. [Google Scholar] [CrossRef] [Green Version]
- Erahman, Q.F.; Purwanto, W.W.; Sudibandriyo, M.; Hidayatno, A. An assessment of Indonesia’s energy security index and comparison with seventy countries. Energy 2016, 111, 364–376. [Google Scholar] [CrossRef]
- Li, Y.; Shi, X.; Yao, L. Evaluating energy security of resource-poor economies: A modified principle component analysis approach. Ener. Econ. 2016, 58, 211–221. [Google Scholar] [CrossRef]
- Wang, Q.; Zhou, K. A framework for evaluating global national energy security. Appl. Energy 2017, 188, 19–31. [Google Scholar] [CrossRef]
- Zeng, S.; Streimikiene, D.; Baležentis, T. Review of and comparative assessment of energy security in Baltic States. Renew. Sust. Ener. Rev. 2017, 76, 185–192. [Google Scholar] [CrossRef]
- BP. Statistical Review of World Energy 2021, 70th ed. Available online: https://www.bp.com/content/dam/bp/business-sites/en/global/corporate/pdfs/energy-economics/statistical-review/bp-stats-review-2021-full-report.pdf (accessed on 10 September 2021).
- Mining Energy. IEA Predicts a Dramatic Rise in Mineral Demand for Clean Energy Transition. Available online: https://me.smenet.org/webContent.cfm?webarticleid=3556 (accessed on 1 September 2021).
- IEA. The Role of Critical World Energy Outlook Special Report Minerals in Clean Energy Transitions. Available online: https://iea.blob.core.windows.net/assets/278ae0c8-28b8-402b-b9ab-6e45463c273f/TheRoleofCriticalMineralsinCleanEnergyTransitions.pdf (accessed on 15 September 2021).
- Sara Hastings-Simon and Morgan Bazilian—23 July 2020. Available online: https://www.globalpolicyjournal.com/blog/23/07/2020/critical-minerals-dont-burn-why-energy-security-playbook-needs-re-write (accessed on 13 September 2021).
- Brown, T. Measurement of mineral supply diversity and its importance in assessing risk and criticality. Resour. Policy 2018, 58, 202–218. [Google Scholar] [CrossRef]
- Gana, L.; Wang, H.; Yang, Z. Machine learning solutions to challenges in finance: An application to the pricing of financial products. Tech. For. Soc. Chang. 2020, 153, 119928. [Google Scholar] [CrossRef]
- García, D.; Kristjanpoller, W. An adaptive forecasting approach for copper price volatility through hybrid and non-hybrid models. Appl. Soft Comp. 2019, 74, 466–478. [Google Scholar] [CrossRef]
- Kriechbaumer, T.; Angus, A.; Parsons, D.; Rivas Casado, M. An improved wavelet–ARIMA approach for forecasting metal prices. Res. Policy 2014, 39, 32–41. [Google Scholar] [CrossRef] [Green Version]
- Sehgal, N.; Pandey, K.K. Artificial intelligence methods for oil price forecasting: A review and evaluation. Energy Syst. 2015, 6, 479–506. [Google Scholar] [CrossRef]
- Chen, Y.; He, K.; Tso, G.K.F. Forecasting Crude Oil Prices: A Deep Learning based Model. Procedia Comput. Sci. 2017, 122, 300–307. [Google Scholar] [CrossRef]
- Abdullah, S.N.; Zeng, X. Machine learning approach for crude oil price prediction with Artificial Neural Networks-Quantitative (ANN-Q) model. In Proceedings of the International Joint Conference on Neural Networks, Barcelona, Spain, 18–23 July 2010. [Google Scholar]
- Nomikos, N.K.; Pouliasis, P.K. Forecasting petroleum futures markets volatility: The role of regimes and market conditions. Energy Econ. 2011, 33, 321–337. [Google Scholar] [CrossRef]
- Wang, Y.; Wu, C. Forecasting energy market volatility using GARCH models: Can multivariate models beat univariate models? Energy Econ. 2012, 34, 2167–2181. [Google Scholar] [CrossRef]
- Chkili, W.; Hammoudeh, S.; Nguyen, D.K. Volatility forecasting and risk management for commodity markets in the presence of asymmetry and long memory. Energy Econ. 2014, 41, 1–18. [Google Scholar] [CrossRef]
- Klein, T.; Walther, T. Oil price volatility forecast with mixture memory GARCH. Energy Econ. 2016, 58, 46–58. [Google Scholar] [CrossRef] [Green Version]
- Kumar, D. Forecasting energy futures volatility based on the unbiased extreme value volatility estimator. IIMB Manag. Rev. 2017, 29, 294–310. [Google Scholar] [CrossRef]
- Herrera, A.M.; Hu, L.; Pastor, D. Forecasting crude oil price volatility. Int. J. Forecast. 2018, 34, 622–635. [Google Scholar] [CrossRef]
- Zhang, Y.-J.; Zhang, J.-L. Volatility forecasting of crude oil market: A new hybrid method. J. Forecast. 2018, 37, 781–789. [Google Scholar] [CrossRef]
- Bildirici, M.; Bayazit, N.G.; Ucan, Y. Analyzing crude oil prices under the impact of COVID-19 by using LSTARGARCHLSTM. Energies 2020, 13, 2980. [Google Scholar] [CrossRef]
- Lin, Y.; Xiao, Y.; Li, F. Forecasting crude oil price volatility via a HM-EGARCH model. Energy Econ. 2020, 87, 104693. [Google Scholar] [CrossRef]
- Bacon, R.; Kojima, M. Coping with Oil Price Volatility. In Energy Sector Management Assistance Program; The International Bank for Reconstruction and Development/The World Bank Group: Washington, DC, USA, 2008. [Google Scholar]
- Lv, X.; Shan, X. Modeling natural gas market volatility using GARCH with different distributions. Phys. A 2013, 392, 5685–5699. [Google Scholar] [CrossRef]
- Díaz, J.D.; Hansen, E.; Cabrera, G. Economic drivers of commodity volatility: The case of copper. Resour. Policy 2021, 73, 102224. [Google Scholar] [CrossRef]
- Li, G.; Li, Y. Forecasting copper futures volatility under model uncertainty. Resour. Policy 2021, 46, 167–176. [Google Scholar] [CrossRef]
- Gong, X.; Lin, B. Structural breaks and volatility forecasting in the copper futures market. J. Futures Mark. 2018, 38, 290–339. [Google Scholar] [CrossRef]
- Hammoudeh, S.; Yuan, Y. Metal volatility in presence of oil and interest rate shocks. Energy Econ. 2008, 30, 606–620. [Google Scholar] [CrossRef]
- Khalifa, A.A.; Miao, H.; Ramchander, S. Return distributions and volatility forecasting in metal futures markets: Evidence from gold, silver, and copper. J. Futures Mark. 2011, 31, 55–80. [Google Scholar] [CrossRef]
- Lyócsa, Š.; Molnár, P.; Todorova, N. Volatility forecasting of non-ferrous metal futures: Covariances, covariates or combinations? J. Inter. Fin. Mark., Inst. Money 2017, 51, 228–247. [Google Scholar] [CrossRef]
- Todorova, N. The course of realized volatility in the LME non-ferrous metal market. Econ. Model. 2015, 51, 1–12. [Google Scholar] [CrossRef]
- Todorova, N.; Worthington, A.; Souček, M. Realized volatility spillovers in the non-ferrous metal futures market. Resour. Policy 2014, 39, 21–31. [Google Scholar] [CrossRef] [Green Version]
- Smith, K.L.; Bracker, K. Forecasting changes in copper futures volatility with GARCH models using an iterated algorithm. Rev. Quant. Finance Account. 2003, 20, 245–265. [Google Scholar] [CrossRef]
- Bollerslev, T. Generalised Autoregressive Conditional Heteroskedasticity. J. Econom. 1986, 31, 307–327. [Google Scholar] [CrossRef] [Green Version]
- Fiszeder, P. Modele klasy GARCH w Empirycznych Badaniach Finansowych; Uniwersytet Mikołaja Kopernika w Toruniu: Toruń, Poland, 2009. [Google Scholar]
- Fiszeder, P. Jednorównaniowe modele GARCH—Analiza procesów zachodzących na GPW w Warszawie. In Dynamiczne Modele Ekonometryczne, Materiały na VII Ogólnopolskie Seminarium Naukowe; UMK: Toruń, Poland, 2001. [Google Scholar]
- Berillis, P.; Mente, E.; Kormas, K.A. The use of copper alloy in aquaculture fish net pens: Mechanical, economic and environmental advantages. J. Fish. Sci. Com 2017, 11, 1–3. [Google Scholar] [CrossRef]
- Elshkaki, A.; Graedel, T.E.; Ciacci, L.; Reck, B.K. Copper demand, supply, and associated energy use to 2050. Global Envir. Change 2016, 39, 305–315. [Google Scholar] [CrossRef] [Green Version]
- Ma, Y.; Yu, Y.; Lin, B.; Zhang, L.; Cao, Y.; Guo, M. A novel signal amplification strategy based on the use of copper nanoclusters for ratiometric fluorimetric determination of o-phenylenediamine. Microchim. Acta 2019, 186, 206. [Google Scholar] [CrossRef] [PubMed]
- Malandrakis, A.A.; Kavroulakis, N.; Chrysikopoulos, C.V. Use of copper, silver and zinc nanoparticles against foliar and soil-borne plant pathogens. Sci. Total Environ. 2019, 670, 292–299. [Google Scholar] [CrossRef] [PubMed]
- Donga, D.; van Oersa, L.; Tukker, A.; van der Voeta, E. Assessing the future environmental impacts of copper production in China: Implications of the energy transition. J. Cleaner Prod. 2020, 274, 122825. [Google Scholar] [CrossRef]
- European Commission. Critical Raw Materials for Strategic Technologies and Sectors in the EU—A Foresight Study. Available online: https://ec.europa.eu/docsroom/documents/42881 (accessed on 11 September 2021).
- Lusty, P.A.J.; Hannis, S.D. Copper Mineral Profile; British Geological Survey, Keyworth: Nottingham, UK, 2009. [Google Scholar]
- Ayres, R.U.; Ayres, L.W.; Rade, I. The Lifecycle of Copper, Its Co-products and Byproducts; Mining, Minerals and Sustainable Development, International Institute for Environmental Development: London, UK, 2002. [Google Scholar]
- World Mining Data. Share of World Mineral Production 2019 by Countries. Available online: https://www.world-mining-data.info/?World_Mining_Data___Data_Section (accessed on 14 September 2021).
- Kaufmann, D.; Kraay, A.; Mastruzzi, M. The Worldwide Governance Indicators: Methodology and Analytical Issues; World Bank Policy Research Working Paper No. 5430; World Bank: Washington, DC, USA, 2010. [Google Scholar]
- Organization of the Petroleum Exporting Countries. OPEC Share of World Crude Oil Reeserves. 2018. Available online: https://www.opec.org/opec_web/en/data_graphs/330.htm (accessed on 18 September 2021).
- World Energy Council. World Energy Issues Monitor, Energy Price Volatility: The New Normal; World Energy Council: London, UK, 2015. [Google Scholar]
- Dickey, D.A.; Fuller, W.A. Distribution of the estimators for autoregressive time series with a unit root. J. Amer. Stat. Ass. 1979, 75, 427–431. [Google Scholar]
- Phillips, P.C.B.; Perron, P. Testing for a unit root in time series regressions. Biometrica 1988, 75, 335–346. [Google Scholar] [CrossRef]
- Church, C.; Crawford, A. Minerals and the Metals for the Energy Transition: Exploring the Conflict Implications for Mineral-Rich, Fragile States. In The Geopolitics of the Global Energy Transition; Hafner, M., Tagliapietra, S., Eds.; Springer: Cham, Switzerland, 2020; pp. 279–304. [Google Scholar]
- Kaufmann, R. A model of the world oil market for Project LINK. Econ. Model. 1995, 12, 165–178. [Google Scholar] [CrossRef]
- Kaufmann, R.; Karadeloglou, P.; Dees, S.; Sanchez, M. Does OPEC matter? An Econometric Analysis of Oil Prices. Energy J. 2004, 25, 67–90. [Google Scholar] [CrossRef]
- Chevillon, G.; Rifflart, C. Physical market determinants of the price of crude oil ant the market premium. Energy Econ. 2009, 31, 537–549. [Google Scholar] [CrossRef]
- Thomas, A.; Mühleisen, M.; Pant, M. Peaks, Spikes, and Barrels: Modeling Sharp Movements in Oil Prices. IMF Work. Pap. Strategy Policy Rev. Dep. 2010, 186, 1–19. [Google Scholar] [CrossRef]
- Kaufmann, R.; Dees, S.; Gausteuil, A.; Mann, M. Oil prices: The role of refinery utilization, futures markets and non-linearities. Energy Econ. 2008, 30, 2609–2622. [Google Scholar] [CrossRef]
- Zamani, M. An Econometric Model of Short Term Oil Spot Price. Available online: https://citeseerx.ist.psu.edu/viewdoc/download?doi=10.1.1.110.3044&rep=rep1&type=pdf (accessed on 10 September 2021).
- Kabwe, E.; Yiming, W. Analysis Of Copper‘s Market And Price-Focus on The Last Decade‘s Change and Its Future Trend. Inter. J. Scient. Technol. Res. 2015, 4, 54–61. [Google Scholar]
- USGS. Factors that influence the price of Al, Cd, Co, Cu, Fe, Ni, Pb, Rare Earth Elements, and Zn. Available online: https://pubs.usgs.gov/of/2008/1356/pdf/ofr2008-1356.pdf (accessed on 10 September 2021).
- Buncic, D.; Moretto, C. Forecasting copper prices with dynamic averaging and selection models. N. Am. J. Econ. Fin. 2015, 33, 1–38. [Google Scholar] [CrossRef] [Green Version]
- Tang, K.; Xiong, W. Index Investment and the Financialization of Commodities. Fin. Anal. J. 2012, 68, 54–74. [Google Scholar] [CrossRef]
- Adams, Z.; Glück, T. Financialization in commodity markets: A passing trend or the new normal? J. Bank. Financ. 2015, 60, 93–111. [Google Scholar] [CrossRef] [Green Version]
- Mayer, H.; Rathgeber, A.; Wanner, M. Financialization of metal markets: Does futures trading influence spot prices and volatility? Res. Pol. 2017, 53, 300–316. [Google Scholar] [CrossRef] [Green Version]
- Cheng, I.H.; Xiong, W. Financialization of Commodity Markets. Ann. Rev. Fin. Econ. 2014, 6, 419–441. [Google Scholar] [CrossRef] [Green Version]
Figure 1.
Energy security components: methodological approach.

Figure 2.
Herfindahl-Hirschman index (HHI) and copper production in 2020.

Figure 3.
Herfindahl-Hirschman index (HHI) and crude oil production in 2020.

Figure 4.
Time-series of crude oil and copper prices.

Figure 5.
Forecasts for the conditional variance (in-sample) of crude oil and copper.

Table 1.
Herfindahl-Hirschman index and levels of market concentration.
| Market * | USA | EU |
|---|---|---|
| Not concentrated—a lot of competition in the market | <1000 | <1000 |
| Moderately concentrated—further development in the case of entities that are dominant in this market may threaten the existing competition | 1000–1800 | 1000–2000 |
| Highly concentrated—further development in the case of parent entities has a harmful effect on competition | >1800 | >2000 |
Notes: * the higher values of the Herfindahl-Hirschman index. There is a higher level of concentration of a given market (the risk to competitiveness of supplies increases).
Table 2.
Herfindahl-Hirschman index, index of security of supply and copper production in 2020.
| Rank | Country | Production (Tones) | Share in % | HHI | Political Stability Index | Index of Security of Supply |
|---|---|---|---|---|---|---|
| 1 | Chile | 5,787,400 | 27.99 | 783.69 | 0.945 | 740.932 |
| 2 | Peru | 2,455,440 | 11.88 | 141.07 | −0.049 | −6.912 |
| 3 | China | 1,683,450 | 8.14 | 66.31 | −0.363 | −24.063 |
| 4 | Congo, D.R. | 1,461,124 | 7.07 | 49.95 | −1.606 | −80.220 |
| 5 | United States | 1,260,000 | 6.09 | 37.15 | 1.129 | 41.944 |
| 6 | Australia | 934,055 | 4.52 | 20.41 | 1.565 | 31.950 |
| 7 | Russia | 812,400 | 3.93 | 15.44 | −0.580 | −8.953 |
| 8 | Zambia | 789,942 | 3.82 | 14.6 | −0.453 | −6.619 |
| 9 | Mexico | 713,704 | 3.45 | 11.92 | −0.371 | −4.428 |
| 10 | Kazakhstan | 604,470 | 2.92 | 8.55 | −0.298 | −2.546 |
| 11 | Canada | 560,800 | 2.71 | 7.36 | 1.578 | 11.613 |
| 12 | Poland | 398,900 | 1.93 | 3.72 | 0.648 | 2.412 |
| 13 | Brazil | 363,268 | 1.76 | 3.09 | −0.180 | −0.557 |
| 14 | Indonesia | 351,080 | 1.70 | 2.88 | −0.166 | −0.479 |
| 15 | Iran | 308,270 | 1.49 | 2.22 | −1.140 | −2.532 |
| - | Total-15 | 18,484,303 | 89.40 | 1168.36 | 0.659 | 691.541 |
| - | World | 20,673,358 | 100.00 | 1175.27 | - | - |
Table 3.
Herfindahl-Hirschman index, index of security of supply and crude oil production in 2020.
| Rank | Country | Production (Tones) | Share in % | HHI | Political Stability Index | Index of Security of Supply |
|---|---|---|---|---|---|---|
| 1 | United States | 747,843,230 | 16.70 | 278.90 | 1.129 | 314.892 |
| 2 | Russian Federation | 573,388,845 | 12.80 | 163.96 | −0.580 | −95.074 |
| 3 | Saudi Arabia | 556,564,010 | 12.43 | 154.48 | −0.227 | −35.104 |
| 4 | Canada | 263,462,162 | 5.88 | 34.62 | 1.578 | 54.618 |
| 5 | Iraq | 234,220,106 | 5.23 | 27.36 | −1.514 | −41.427 |
| 6 | China | 191,014,000 | 4.27 | 18.20 | −0.363 | −6.603 |
| 7 | United Arab Emirates | 180,544,180 | 4.03 | 16.26 | 0.647 | 10.524 |
| 8 | Iran | 157,764,822 | 3.52 | 12.41 | −1.140 | −14.155 |
| 9 | Brazil | 150,774,423 | 3.37 | 11.34 | −0.180 | −2.043 |
| 10 | Kuwait | 143,379,896 | 3.20 | 10.25 | −0.045 | −0.458 |
| 11 | Nigeria | 101,139,828 | 2.26 | 5.10 | −1.048 | −5.348 |
| 12 | Mexico | 94,918,412 | 2.12 | 4.49 | −0.371 | −1.669 |
| 13 | Kazakhstan | 91,043,885 | 2.03 | 4.13 | −0.298 | −1.231 |
| 14 | Norway | 78,545,297 | 1.75 | 3.08 | 1.766 | 5.434 |
| 15 | Qatar | 77,684,138 | 1.73 | 3.01 | 0.397 | 1.195 |
| - | Total-15 | 3,642,287,234 | 81.34 | 747.58 | −0.250 | 183.551 |
| - | World | 4,477,987,878 | 100.00 | 763.70 | - | - |
Table 4.
Statistic of time-series.
| Variable | Mean | Median | Minimum | Maximum | Std. Dev. | Ex. Kurtosis. | Jarque-Bera Test | Skewness |
|---|---|---|---|---|---|---|---|---|
| copper | 7577.4 | 7425.8 | 5167.8 | 11,986 | 1310.3 | 0.27231 | 123.093 | 0.55806 |
| copper—returns | 0.000082 | 0.000038 | −0.10565 | 0.07544 | 0.01066 | 10.108 | 9387.42 | −0.47259 |
| oil | 69.329 | 63.520 | 9.1200 | 118.90 | 25.195 | −0.88626 | 167.526 | 0.47855 |
| oil—returns | −0.000178 | 0.000522 | −0.48037 | 0.31743 | 0.02878 | 53.382 | 260518 | −1.6297 |
Table 5.
Unit root tests.
| Variable | Augmented Dickey-Fuller Test | Phillips-Perron Test |
|---|---|---|
| copper | −0.602 | -0.699 |
| copper—returns | −31.317 | −45.976 |
| oil | −1.516 | −1.556 |
| oil—returns | −32.268 | −47.672 |
Table 6.
ARCH/GARCH tests.
| Variable | F-Statistic | Decision |
|---|---|---|
| copper | 56.2352 *** | ARCH effects exist |
| oil | 151.021 *** | ARCH effects exist |
Notes: The null hypothesis is H0: There is no ARCH effect. *** Indicates that the likelihood ratio test is statistically significant at 1%.
Publisher’s Note: MDPI stays neutral with regard to jurisdictional claims in published maps and institutional affiliations. |
© 2022 by the author. Licensee MDPI, Basel, Switzerland. This article is an open access article distributed under the terms and conditions of the Creative Commons Attribution (CC BY) license (https://creativecommons.org/licenses/by/4.0/).
Share and Cite
MDPI and ACS Style
Mróz, M. Energy Security in Danger? A Comparative Analysis of Oil and Copper Supply. Energies 2022, 15, 560. https://0-doi-org.brum.beds.ac.uk/10.3390/en15020560
AMA Style
Mróz M. Energy Security in Danger? A Comparative Analysis of Oil and Copper Supply. Energies. 2022; 15(2):560. https://0-doi-org.brum.beds.ac.uk/10.3390/en15020560
Chicago/Turabian StyleMróz, Maciej. 2022. "Energy Security in Danger? A Comparative Analysis of Oil and Copper Supply" Energies 15, no. 2: 560. https://0-doi-org.brum.beds.ac.uk/10.3390/en15020560
Note that from the first issue of 2016, this journal uses article numbers instead of page numbers. See further details here.