
Development of Photovoltaic Energy in EU Countries as an Alternative to Fossil Fuels


Department of Organization and Management, Silesian University of Technology, 41-800 Zabrze, Poland
*
Author to whom correspondence should be addressed.
Energies 2022, 15(2), 662; https://0-doi-org.brum.beds.ac.uk/10.3390/en15020662
Submission received: 21 November 2021
/
Revised: 7 January 2022
/
Accepted: 12 January 2022
/
Published: 17 January 2022
(This article belongs to the Special Issue Economics and Management in Extractive and Energy Industry)
Abstract
:The aim of the article is to present the development of photovoltaic energy in the EU countries as one of the alternatives to fossil fuels. The article was prepared on the basis of secondary information and statistical data on the photovoltaic energy market in EU countries, and three hypotheses were formulated: H1—There is a statistically significant correlation between a country’s long-term orientation and its use of photovoltaic energy in European Union countries; H2—There is a statistically significant correlation between GDP per capita and photovoltaic energy use in European Union countries; and H3—There is a relationship between climate and photovoltaic energy use in European Union countries. Correlation coefficients and the Guilford classification were used to analyse the data. Data analysis has shown that photovoltaic energy is the second fastest-growing energy source in the EU, after wind energy. In 2020, 134 TWh of solar energy was produced in the EU countries. Based on the analysis, it can be concluded that there is a statistically significant correlation between the production of photovoltaic energy per person and the level of GDP per capita in the EU countries (Hypothesis 2). Germany and the Netherlands produce the most solar energy. The studies did not confirm Hypothesis 3; however, it can be seen that countries such as Germany, Belgium and the Netherlands have the highest PV energy efficiency compared to average temperature values. A data analysis showed statistically significant correlations between the country’s long-term orientation in the use of photovoltaic energy (Hypothesis 1). In the case of Germany and Belgium, the long-term orientation indicator is very high above 80, while Portugal, Poland and Finland have the lowest indicator, from 30 to 40.
1. Introduction
Renewable energy is a leading and promising pathway used to fight against global warming. The reduction in GHG emissions and the replacement of fossil fuels with renewable energy sources are the most important challenges in the development of the economies of all the countries in the world [1,2]. The literature on the subject uses the term “green economy” [2,3,4,5,6,7]. This concept is related to the global phenomenon of the transition from the current energy system in which fossil fuels are used as an energy source to an energy system based primarily on renewable energy sources such as wind energy, hydropower, photovoltaic energy and biofuels [2,3,4,5]. The European Union is among the world leaders in the field of energy transformation related to the reduction in GHG emissions with regard to increasing the share of renewable energy sources. For the EU member states, energy transformation is one of the most important strategic goals of counteracting climate change, as well as increasing energy security and the attractiveness of European Union countries [2,3,4,5,6,7,8]. In the EU, energy transition is perceived as a long-term process which, in consequence, will also strengthen economic competitiveness by creating jobs and improving the quality of life. In the literature on the subject, three components of energy transformation have been distinguished: economic, industrial and social [4,5,6,7,8,9,10,11]. The economic component is related to the export of low-carbon technologies as well as new investments and jobs. The industrial component is connected with the modernization of economy and the reduction in pollution by changing the technology to a less-energy-consuming one. The social component includes activities related to climate protection and improvement of public health. All EU activities related to energy transformation have been included in the EU climate policy, and all member states have been obliged to take actions aimed at using renewable energy sources as a prospective technology in the fight against the effects of global warming and the ensuing consequences [2,3,4,5,6,12,13,14,15,16]. The article presents an analysis of the development of photovoltaic energy in the EU countries as one of the alternatives to fossil fuels. The first part of the study presents a literature review on renewable energy sources in the energy policy of the European Union. Then, a statistical analysis of data on the development of the solar photovoltaic market in the European Union countries has been conducted. Discussions and the results of the analysis are presented at the end of the article.
According to statistical data the photovoltaic power capacity in EU countries is growing year by year (Table 1 and Table 2). However, the careful analysis of annual installations led to the conclusion that between 2011 and 2017 the EU countries’ share was not only declining compared to the growing worldwide market; we could also observe a decrease in the annual installation figures. After a rise in the occurrence of installation in 2011 when the total photovoltaic capacities in EU counties reached 70% of the worldwide installation we observed a decreasing trend, and now the EU market consists of only 50% of the worldwide market [17,18,19,20].
The growth of the share of energy leading from photovoltaic cells in the energy mix in many EU countries gives them many benefits [28]. The widespread usage of photovoltaic energy gives the countries many opportunities connected with the benefits of using the solar energy [29,30]. In the usage of solar energy, contrarily to using wind energy, no noise is generated in the energy production process. Additionally, photovoltaic energy installation is fast to and can be easily adapted to the local conditions and needs [31,32]. The best way of using solar energy is its consumption by the user of the installation. However, for small-scale also spatially distributed energy producers can use micro photovoltaics [33]. The problem is in the case of large-scale photovoltaic power plants because their technical infrastructure needs to occupy a large amount of land. The problem is that land for potential big power plant investments is rather scare and also expensive. In many situations this means that agriculture land should be taken out of production [34,35].
The transition from fossil fuel towards renewable energy sources including photovoltaic energy in EU countries is possible due to a high level of environmental investment. “Greening” the national budget is an important part of the current pro ecological transition. Additionally, according to European Commission documents assessing the overall greenness of a budget can help the country to promote consistency of its environmental objectives [36]. In the years 2014–2020 the expenditures of the EU on climate change finance were (in EUR): 2014—16,174 million, 2015—28,398 million, 2016—33,018 million, 2017—31,555 million, 2018—32,437 million, 2019—33,809 million and 2020—34,452 million. The expenditure on climate was about 20% of all the EU budget in the mentioned years [37].
Additionally, the analysis of the data on environmental investment in photovoltaic energy allows us to observe some relations between the availability of solar radiation and the usage of photovoltaic energy. Due to the fact that photovoltaic cells are installed in the open and also are exposed to extreme weather conditions, they are highly affected by solar radiation. Many researchers have tried to find if the effect of solar radiation on photovoltaic cells is positive or negative [38,39]. This effect varies depending on wavelengths resulting from clouds. Accumulation of dust on the cell also reduces its level of productivity. This dust can reduce the permeability of radiation to the cell. Additionally, pollutants emitted from vehicles can cause significant air pollution, and they are deposited on solar cell surfaces [40,41]. Additionally, solar radiation has a direct effect on the temperature of the cells because this temperature can increase as the solar radiation increases. This rise of solar radiation has an impact on that the resulting voltages, which are not significantly affected by the rise of the current, and this effect is greater than the rise in the cell temperature [42]. In the paper we also tried to analyse the nature of relations between national average temperature and photovoltaic power in EU countries.
2. Renewable Energy Sources and the Energy Policy of the European Union
The energy policy of the European Union is characterized by an integrated approach to energy security, environmental and climate protection and by a fulfilment of social needs. Provisions for renewable energy sources have been included in EU directives since 1990 2018. The main goal of the EU sustainable energy policy is to reduce the use of fossil fuels in favour of energy from renewable sources [16,43]. As already mentioned, in the 1990s, the EU began to consider increasing energy security, limiting the import of fossil fuels and reducing greenhouse gas emissions [44]. The first information on renewable energy sources and their role in the economies of EU countries was given in Regulation (EEC) No. 1302/78 of 1978 on providing financial support for research projects concerning the use of alternative energy sources. In 1980, the European Commission, for the first time, included renewable energy sources in the EU energy policy in a document on energy policy objectives. In 1995, the so-called White Paper formulating the need for financial regulations regarding the development of renewable energy sources came into existence. In the Green Paper published in 1996, the European Commission assumed that by 2010 the share of renewable energy sources would increase to 12%. In 1997, the document “Energy for the Future: renewable energy sources” was adopted by the EU [45]. Another legal act was developed by the European Parliament in 2001 in the form of Directive 2001/77/EC and concerned the support for the production of electricity produced from renewable sources on the internal market up to 2010 [46]. In 2003, Directive 2003/30/EC was developed to support the use of biofuels or other renewable fuels in transport. The European Commission has imposed on the member states the obligation to reach a 5.75% share of renewable energy sources in transport by 2020 [47]. In 2007, the Renewable Energy Road was published: “Renewable energies in the 21st century: building a more diverse future”. This document contains a long-term strategy for renewable energy in the EU, with the following priorities: energy security and reduction in greenhouse gas emissions [48,49]. In 2008, the European Commission presented a package on the EU’s energy and climate policy, a part of which was the adoption of the 2009 Directive of the European Parliament and of the Council. This directive related to the promotion of the use of energy from renewable sources, amending and repealing the 2003 directive. The main goal was to establish a common framework for the promotion of energy from renewable sources by setting mandatory targets for EU countries [50]. In the 2010 communication “Energy 2020 A strategy for a competitive, sustainable and safe energy sector”, the European Commission noted that without the modernization of power grids and the use of ecological solutions, it would be difficult to achieve the goals of the strategy. The European Commission also considered that the time limit to achieve the stated goals should be extended to 2050 [51]. In 2011, an action plan leading to the transition to a competitive low-carbon economy by 2050 was developed. In this plan, the European Commission set the ambitious target of reducing greenhouse gas emissions by 80–95% in relation to 1990 levels. The share of renewable energy sources should be 55% in 2050 compared to 2011 [52]. In the communication “Renewable energy: an important player on the European energy market” published in 2012, the European Commission presented information on the inclusion of renewable energy sources in the EU energy market and maintaining the pace of growth of the share of renewable energy sources in energy production up to 2030 [53]. In 2013, the European Commission published the policy framework for climate and energy for the period from 2020 to 2030, which includes specific information on climate protection in the EU up to 2030. The European Commission proposed a reduction in greenhouse gas emissions up to 2030 by 40% compared to 1990. Moreover, the document also includes the following provisions: the share of energy from renewable sources in the energy consumed in the EU is to be at least 27%. To this end, EU countries should establish common goals and implement them ambitiously [43,54,55,56,57,58,59,60].
In the European Union countries, the technical potential of renewable energy amounts to approximately 40,000 PJ/year, which is 60% of the current primary energy consumption. The economic potential of renewable energy is estimated as 5780 TW/year. It is worth noting, however, that renewable energy potential in the EU countries is uneven due to the climatic, hydrological and geological conditions in individual EU countries. In the EU, the share of renewable energy sources is growing steadily. In 2000, it reached 10.3%, and in 2013 this increased to 24.3%. The largest increase in energy production from renewable energy sources took place in 2000–2013—from 163 million to 190 million tons [43].
In the EU countries, the largest share of electricity in 2020 was generated from wind; the leaders are Germany (96 TWh), France (40 TEh) and Sweden (28 TWh). Poland was in fourth place (14 TWh). Solar energy (photovoltaic) is the second fastest-growing renewable energy source in the EU. In 2020, 134 TWh of solar energy was produced in the EU countries, mostly in Germany (49 TWh), Italy (26 TWh), Spain (15 TWh) and France (13 TWh). In Poland, 2 TWh came from solar energy. In the case of biofuels in the EU countries, the most energy from this source in 2019 was generated by Germany (45 TWh), followed by Great Britain (32 TWh) and Italy (18 TWh). In Poland, biofuels accounted for 7.5 TWh of energy [61,62].
Summing up, it can be said that all renewable energy sources are promising and should play a leading role in the fight against global warming. Striving for sustainable energy development should be the basis of energy transition all over the world. The development of renewable energy must be included in the strategic goals of each country. All countries in the world should also limit the use of fossil fuels in favour of renewable energy sources, and energy transformation should be treated as a civilization challenge.
The use of photovoltaic energy is a way to achieve a better renewable energy share. Up till the 21st century fossil fuels were used to satisfy the energy needs in spheres of human life which were energy intense. However, next, growth in the case of environmental pollution was a matter of seeking alternatives to non-renewable resources such as fossil fuel [63].
Photovoltaic energy is one of the types of renewable energy. The nowadays observed shift towards the use of renewable energy resources such as photovoltaic energy is mainly due to environmental reasons. The existing emphasis on decarbonization and quick energy transformation from the usage of fossil fuels towards renewable energy resources is because authorities want to mitigate risk, which is posed by anthropogenic influence on the earth’s climatic system.
The level of accessibility of renewable energy sources is determined by many factors. Among them one of most important is connected with accessibility and the abundance of particular sources in a given region along with local topography [64]. Photovoltaic electricity is produced using photovoltaic cells. These cells are the smallest elements of solar panels. The more cells are in the panel, the greater its capacity. Nowadays, photovoltaic cells are used to illuminate houses and streets. In this way we can obtain electricity in the situation where access to a grid is not possible [65]. The main advantages of solar energy are connected with: the broad availability of the energy source; zero cost of consumption of power after the end of the period return of investment, the environmental friendliness of this energy source; and zero impact on the earth’s energy balance. The main problems connected with this energy source are: problems with storing solar energy, the relatively high cost of the installation, the high dependence of power on seasonality and the energy panels, which need a very large area to be installed [66,67].
To deal with some of the drawbacks of photovoltaic energy we can integrate a photovoltaic fuel cell system with the usage of hydrogen. The purpose of this type of integration is to achieve integrated qualities that can be seen when we use hydrogen power or photovoltaic power individually [68]. The main objective of using a mix of hydrogen and photovoltaic energy is the possible increase in energy efficiencies, improvement of the reliability of the energy system, reduction in overall costs and reduction in the level of emission of greenhouse gases [69]. There are many potential solutions involving mixing photovoltaic and hydrogen energy, including a parabolic dish–eRankine- organic cycle–fuel cell system [70], cell–microturbine system [71,72] integrated PV–wind turbine–battery–diesel system [73], hybrid solid oxide fuel cell (SOFC)–thermovoltaic system 7 [74] and PV–fuel cell–diesel system [75].
3. Materials and Methods
The analysis was prepared based on data on the photovoltaic energy market in European Union countries, which is annually published in Photovoltaic Barometr. Photvoltaic Barometr is an annual report on the renewable energy market [21,22,23,24,25,76]. Reports have measured the renewable energy market and progress made by renewable energy sector since 1998. The data in reports consist of all sectors of renewable energy in all European Union states. In this paper we concentrated only on data connected with photovoltaic energy.
The publication also set out to explore the relationships between the data collected and other country-specific indicators. In particular, data on GDP per capita calculated at purchasing power parity for 2019 and data on cultural characteristics of individual countries were used. Data on GDP per capita were taken from the International Monetary Fund and World Economic Outlook databases [26].
In order to analyse the impact of cultural indicators, indicators of a country’s culture were used—in particular the indicator of a country’s long-term orientation. The indicators developed by Hofstede Insight—an international organisation providing data on measuring the culture factor for many countries in the world [76]—were used for the analysis. In particular, the long-term orientation indicator was used. Long-term orientation refers to persistence, adaptability and thinking about long-term effects of a particular economic decision. For the calculation of per capita indicators, data on population in European Union countries were used [77]. To analyse the relationship between photovoltaic capacity and average country temperature, data on average annual temperatures of individual countries in the European Union were used [78].
For the analysis of the relationship between electricity production and production per capita and other parameters the analysis was done for countries where the level of energy production from solar photoviltaic was greater than 200 MW in 2019. The analysis was carried out for the following countries: Germany, Italy, United Kingdom, France, Spain, Belgium, Greece, the Netherlands, the Czech Republic, Romania, Austria, Bulgaria, Portugal, Denmark, Hungary, Slovakia, Sweden, Poland, Slovenia and Finland.
The aim of the research conducted was to answer the following research questions:
- How has the level of photovoltaic energy use changed in the European Union countries between 2014 and 2019?
- Which European Union countries are most advanced in the use of photovoltaic energy?
- Does cultural long-term orientation affect the use of photovoltaic energy in European Union countries?
- Does the level of GDP per capita affect the use of photovoltaic energy in EU countries?
- Does climate influence the use of photovoltaic energy in EU countries?
We formulated three hypotheses in the study:
Hypothesis 1 (H1).
There is a statistically significant correlation between a country’s long-term orientation and its use of photovoltaic energy in European Union countries.
Hypothesis 2 (H2).
There is a statistically significant correlation between GDP per capita and photovoltaic energy use in European Union countries.
Hypothesis 3 (H3).
There is a relationship between climate and photovoltaic energy use in European Union countries.
4. Data and Analysis
Table 1 collects data on the development of the amount of energy produced by photovoltaic sources between 2014 and 2019. The phenomena are illustrated in Figure 1 and Figure 2. We present the statistical data for the years 2008–2013 in Table 2. When comparing the data in Table 1 and Table 2 we can observe that the tendency to add new photovoltaic capacity is not growing. In most of the leading countries the increase in amount of photovoltaic capacity growth between 2003 and 2008 was greater than in the years 2014–2019.
An analysis of the data collected in Table 1 shows that in 2019, the top countries were Germany—19,016 MW; Italy—20,864 MW, United Kingdom—13,616 MW, France—10,575 MW and Spain—9232 MW. The photovoltaic capacity value for all European Union countries in 2019 was 133,663 MW.
The European lead did not change throughout the study period from 2014; however, there were slight shifts between countries. Table 3 shows the top five places over the period 2014–2019, with the only change occurring between 2014 and 2015 when the order changed between the United Kingdom and France.
The dynamics of photovoltaic capacity addictions varied across the countries analysed. Table 4 presents data on photovoltaic capacity addictions in the studied countries in 2015–2019. The phenomenon is illustrated in Figure 3.
The analysis of changes in individual years shows different strategies used by individual countries to increase photovoltaic capacity. Some countries increased their photovoltaic capacity relatively similarly over the entire period under study—an example of such a country is France, where photovoltaic capacity increased by approximately 1000 MW each year (with the exception of 2017, where the increase amounted to 1446 MW). In other countries such as Germany there is a clear upward trend—during the period under review there was an increase in installed photovoltaic capacity in consecutive years from a level of 1563 MW in 2015 to a level of 3834 MW in 2019. In other countries a sharp increase occurred in 2019—such examples include: Spain, with an increase of 3993 MW in 2019 and Belgium with an increase of 3544 MW.
Due to the significant differences between the individual years, contrary to the total photovoltaic capacity in this case, there are significant shifts in the first places in terms of installed photovoltaic capacity for the following years. The top five positions in this respect are summarised in Table 5.
The differences between Table 3 and Table 5 is that in Table 3 we analysed the data on the sum of photovoltaic capacity in the EU countries, but in Table 5 we analysed the amount of photovoltaic capacity installed only in a particular year.
Figure 3 shows the change in photovoltaic capacity in the surveyed countries over the period 2014–2019. The largest number of photovoltaic cells was installed in Germany during this period, at 10715 MW. The United Kingdom is next with 8386 MW followed by the Netherlands with 5824 MW. The next three countries that increased their photovoltaic capacity by 4000–5000 MW during the period under study are, respectively: France—4975 MW, Spain—4445 MW and Belgium—4425 MW.
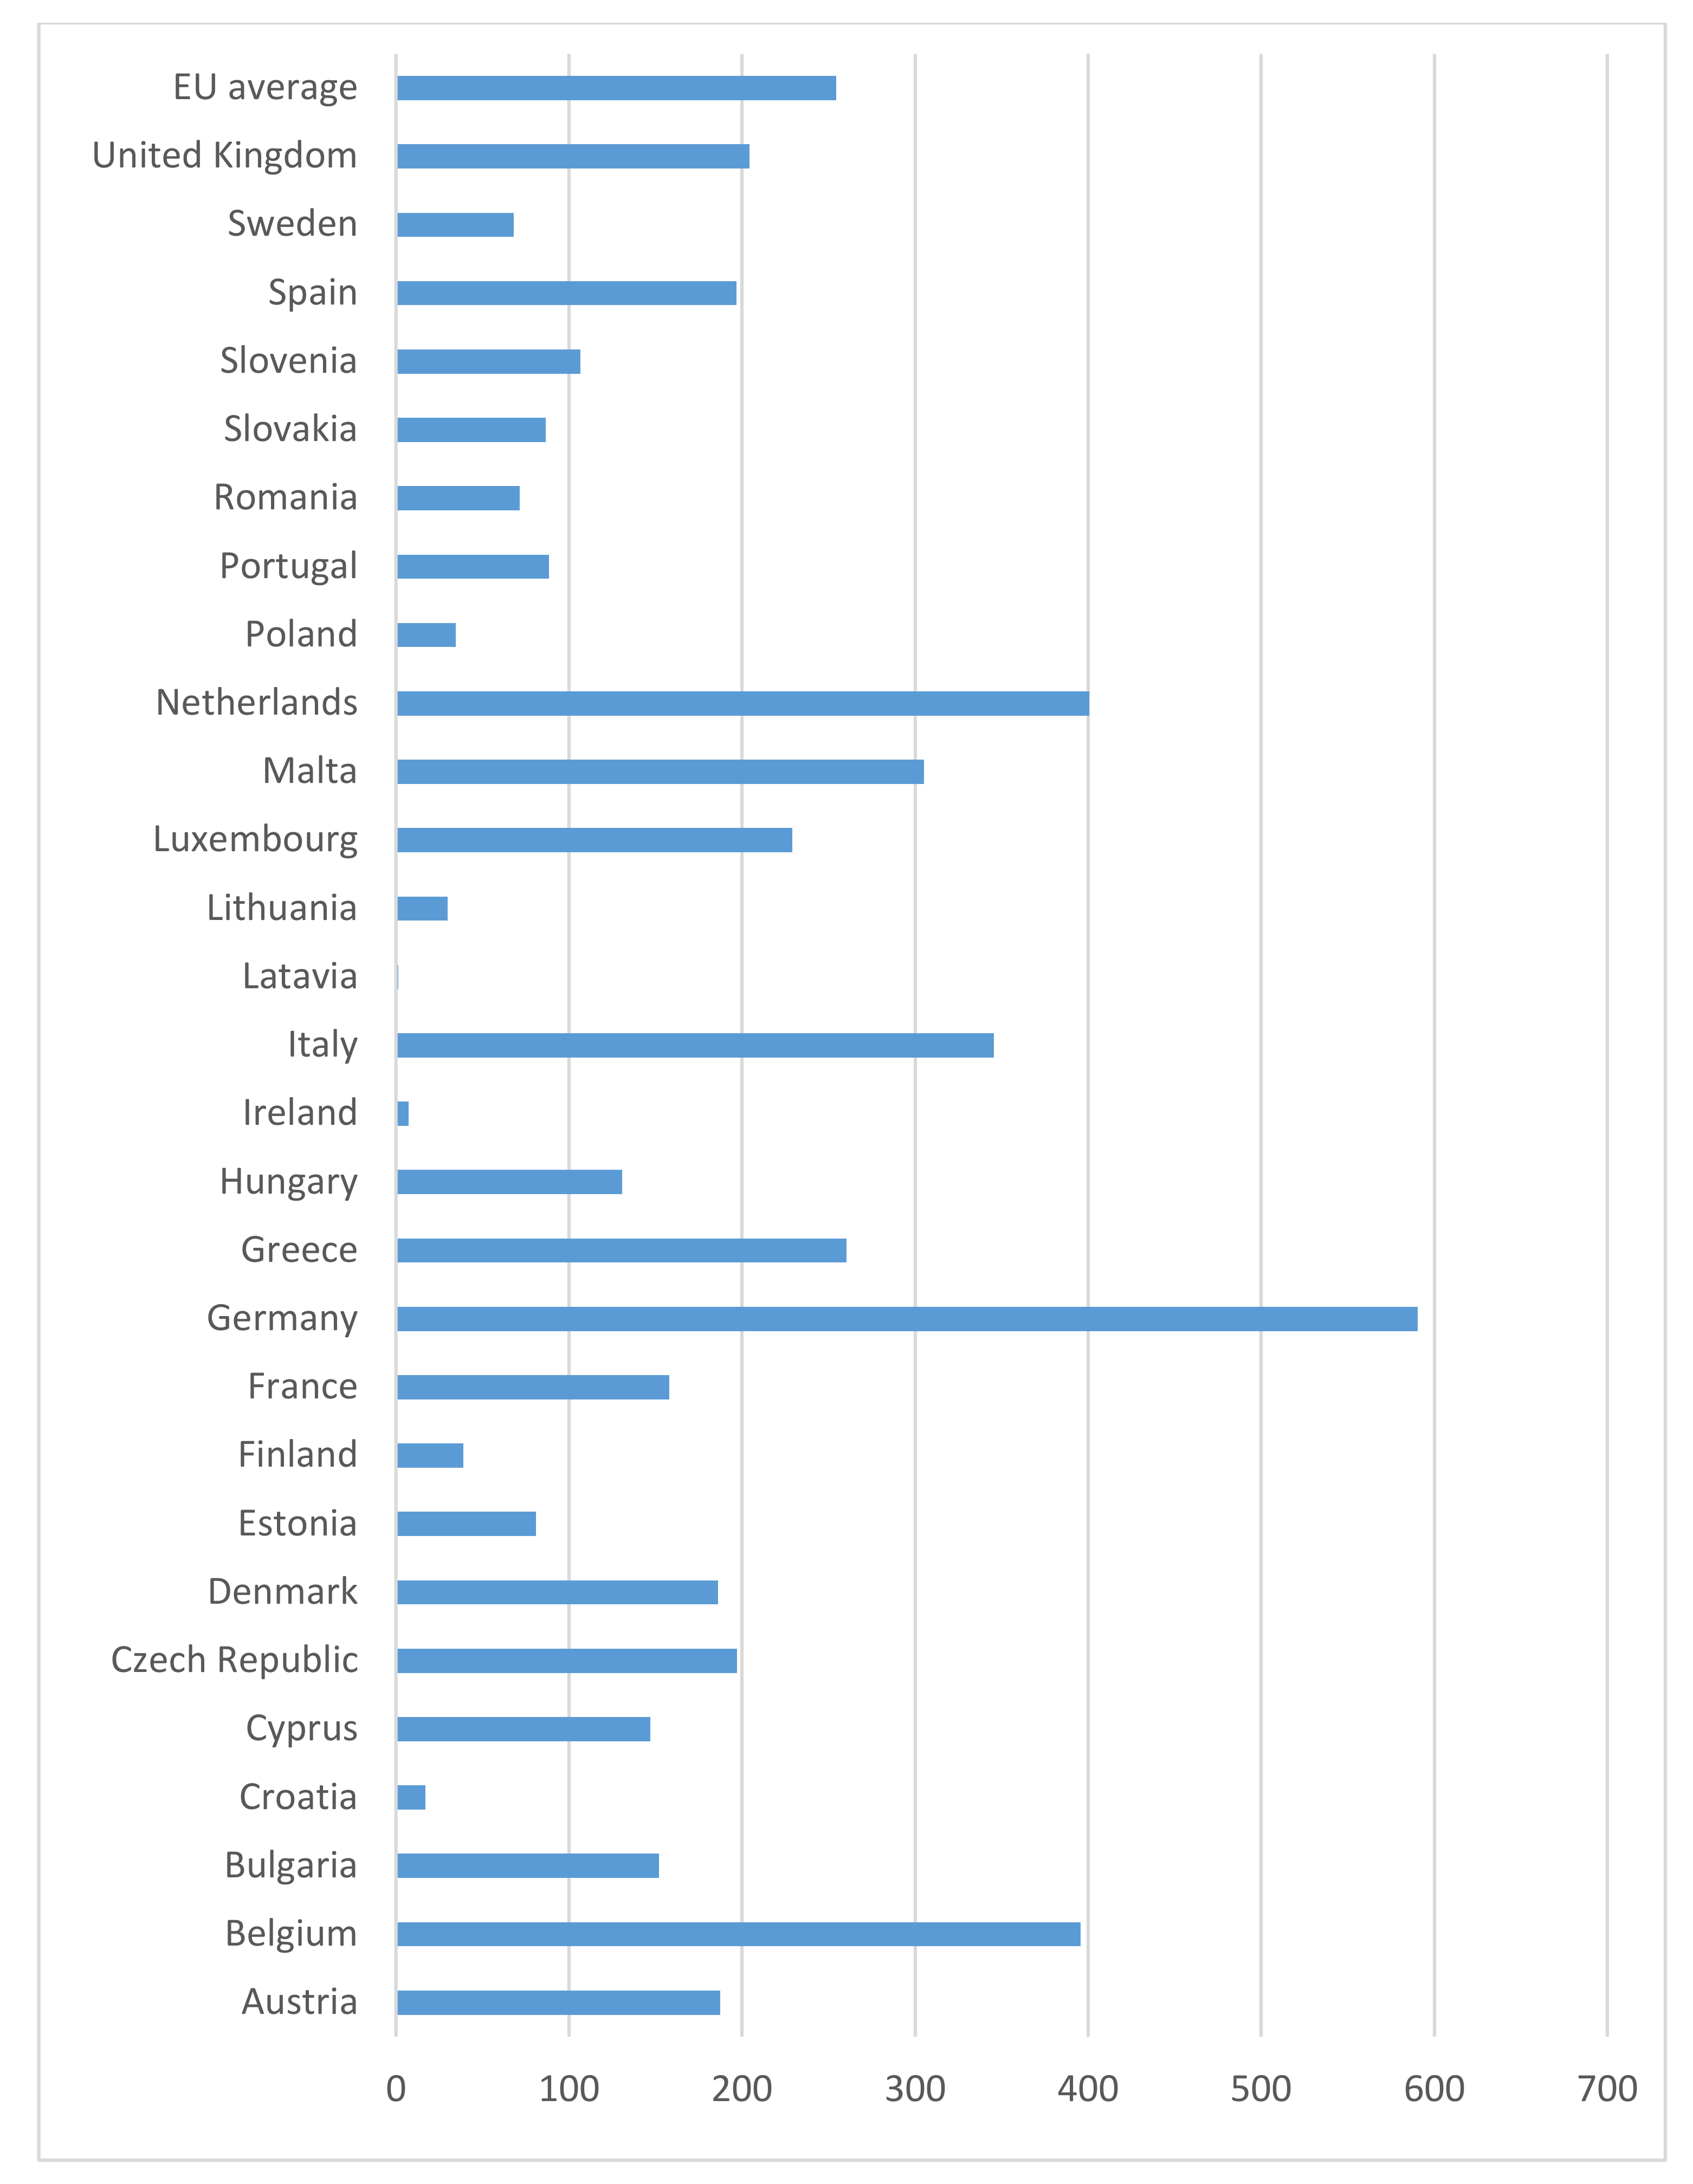
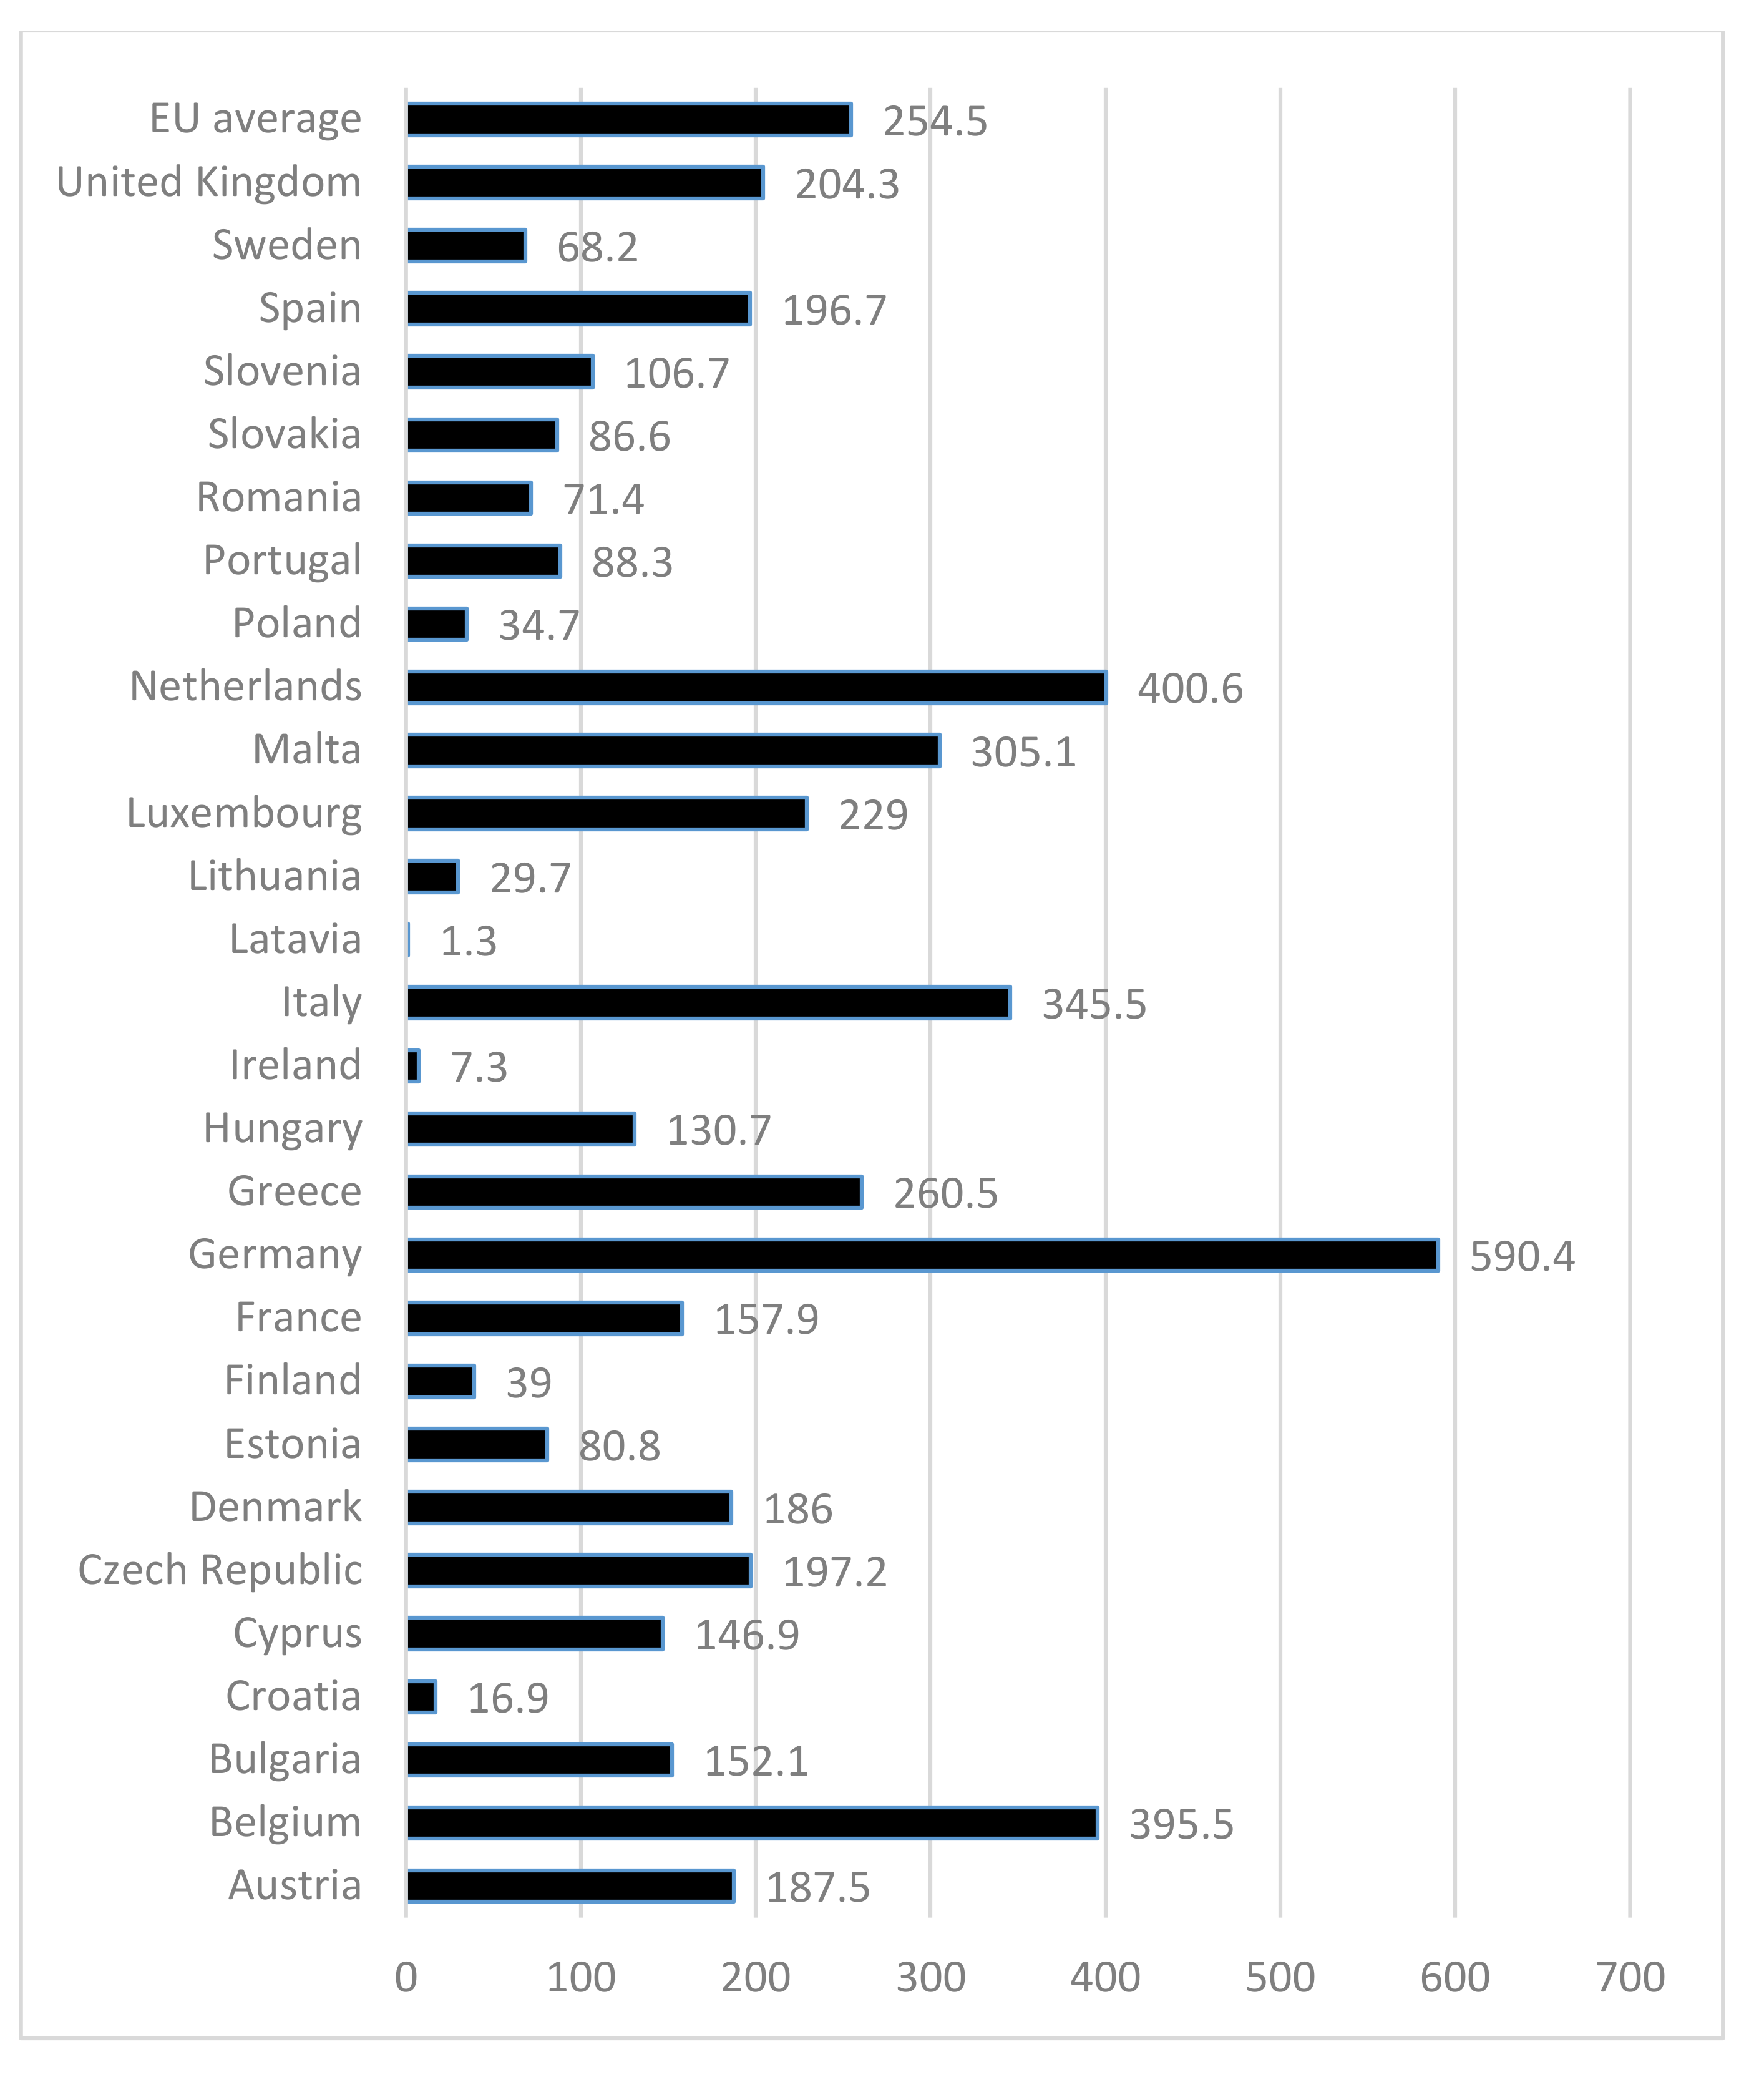
The analyses presented so far have taken into account the population level of a given country, which has meant that countries with higher populations tended to take top positions. In the next stage of the study, we decided to check the level of photovoltaic capacity per capita in the studied countries. The result was given in W/inhabitants. The collected data are summarised in Table 5. Figure 4 shows the result for the years 2014–2019.
In the case of photovoltaic capacity per capita in 2019, Germany had the highest level with 590.4 (W/inhabitant), followed by the Netherlands with 400.6 (W/inhabitant) and Belgium with 395.5(W/inhabitant). In fourth place was Italy 345.5 (W/inhabitant) and Malta with 305.1 (W/inhabitant). For the whole European Union the average was 254.5 (W/inhabitant) per capita. Figure 5 presents a summary of photovoltaic capacity per inhabitant for 2019.
Table 6 lists the top five countries in terms of photovoltaic capacity for the period 2014–2019. Compared to the results of photovoltaic capacity calculated in absolute numbers (Table 1 and Table 2) in both cases Germany is in first place; it is by far the most advanced country in the European Union in the case of implementation of solar energy as an energy source. Italy is also very high in both classifications. The analysis of photovoltaic capacity per capita shows a high level of photovoltaic implementation in the Benelux countries—Belgium, the Netherlands and Luxembourg—which, due to their small size, are not at the top in terms of absolute numbers but have a very high level of photovoltaic saturation. Malta, Greece and the Czech Republic also have high levels of photovoltaic use per capita. In contrast, France and Spain have a high photovoltaic capacity due to their large size but are below the EU average on a per capita basis.
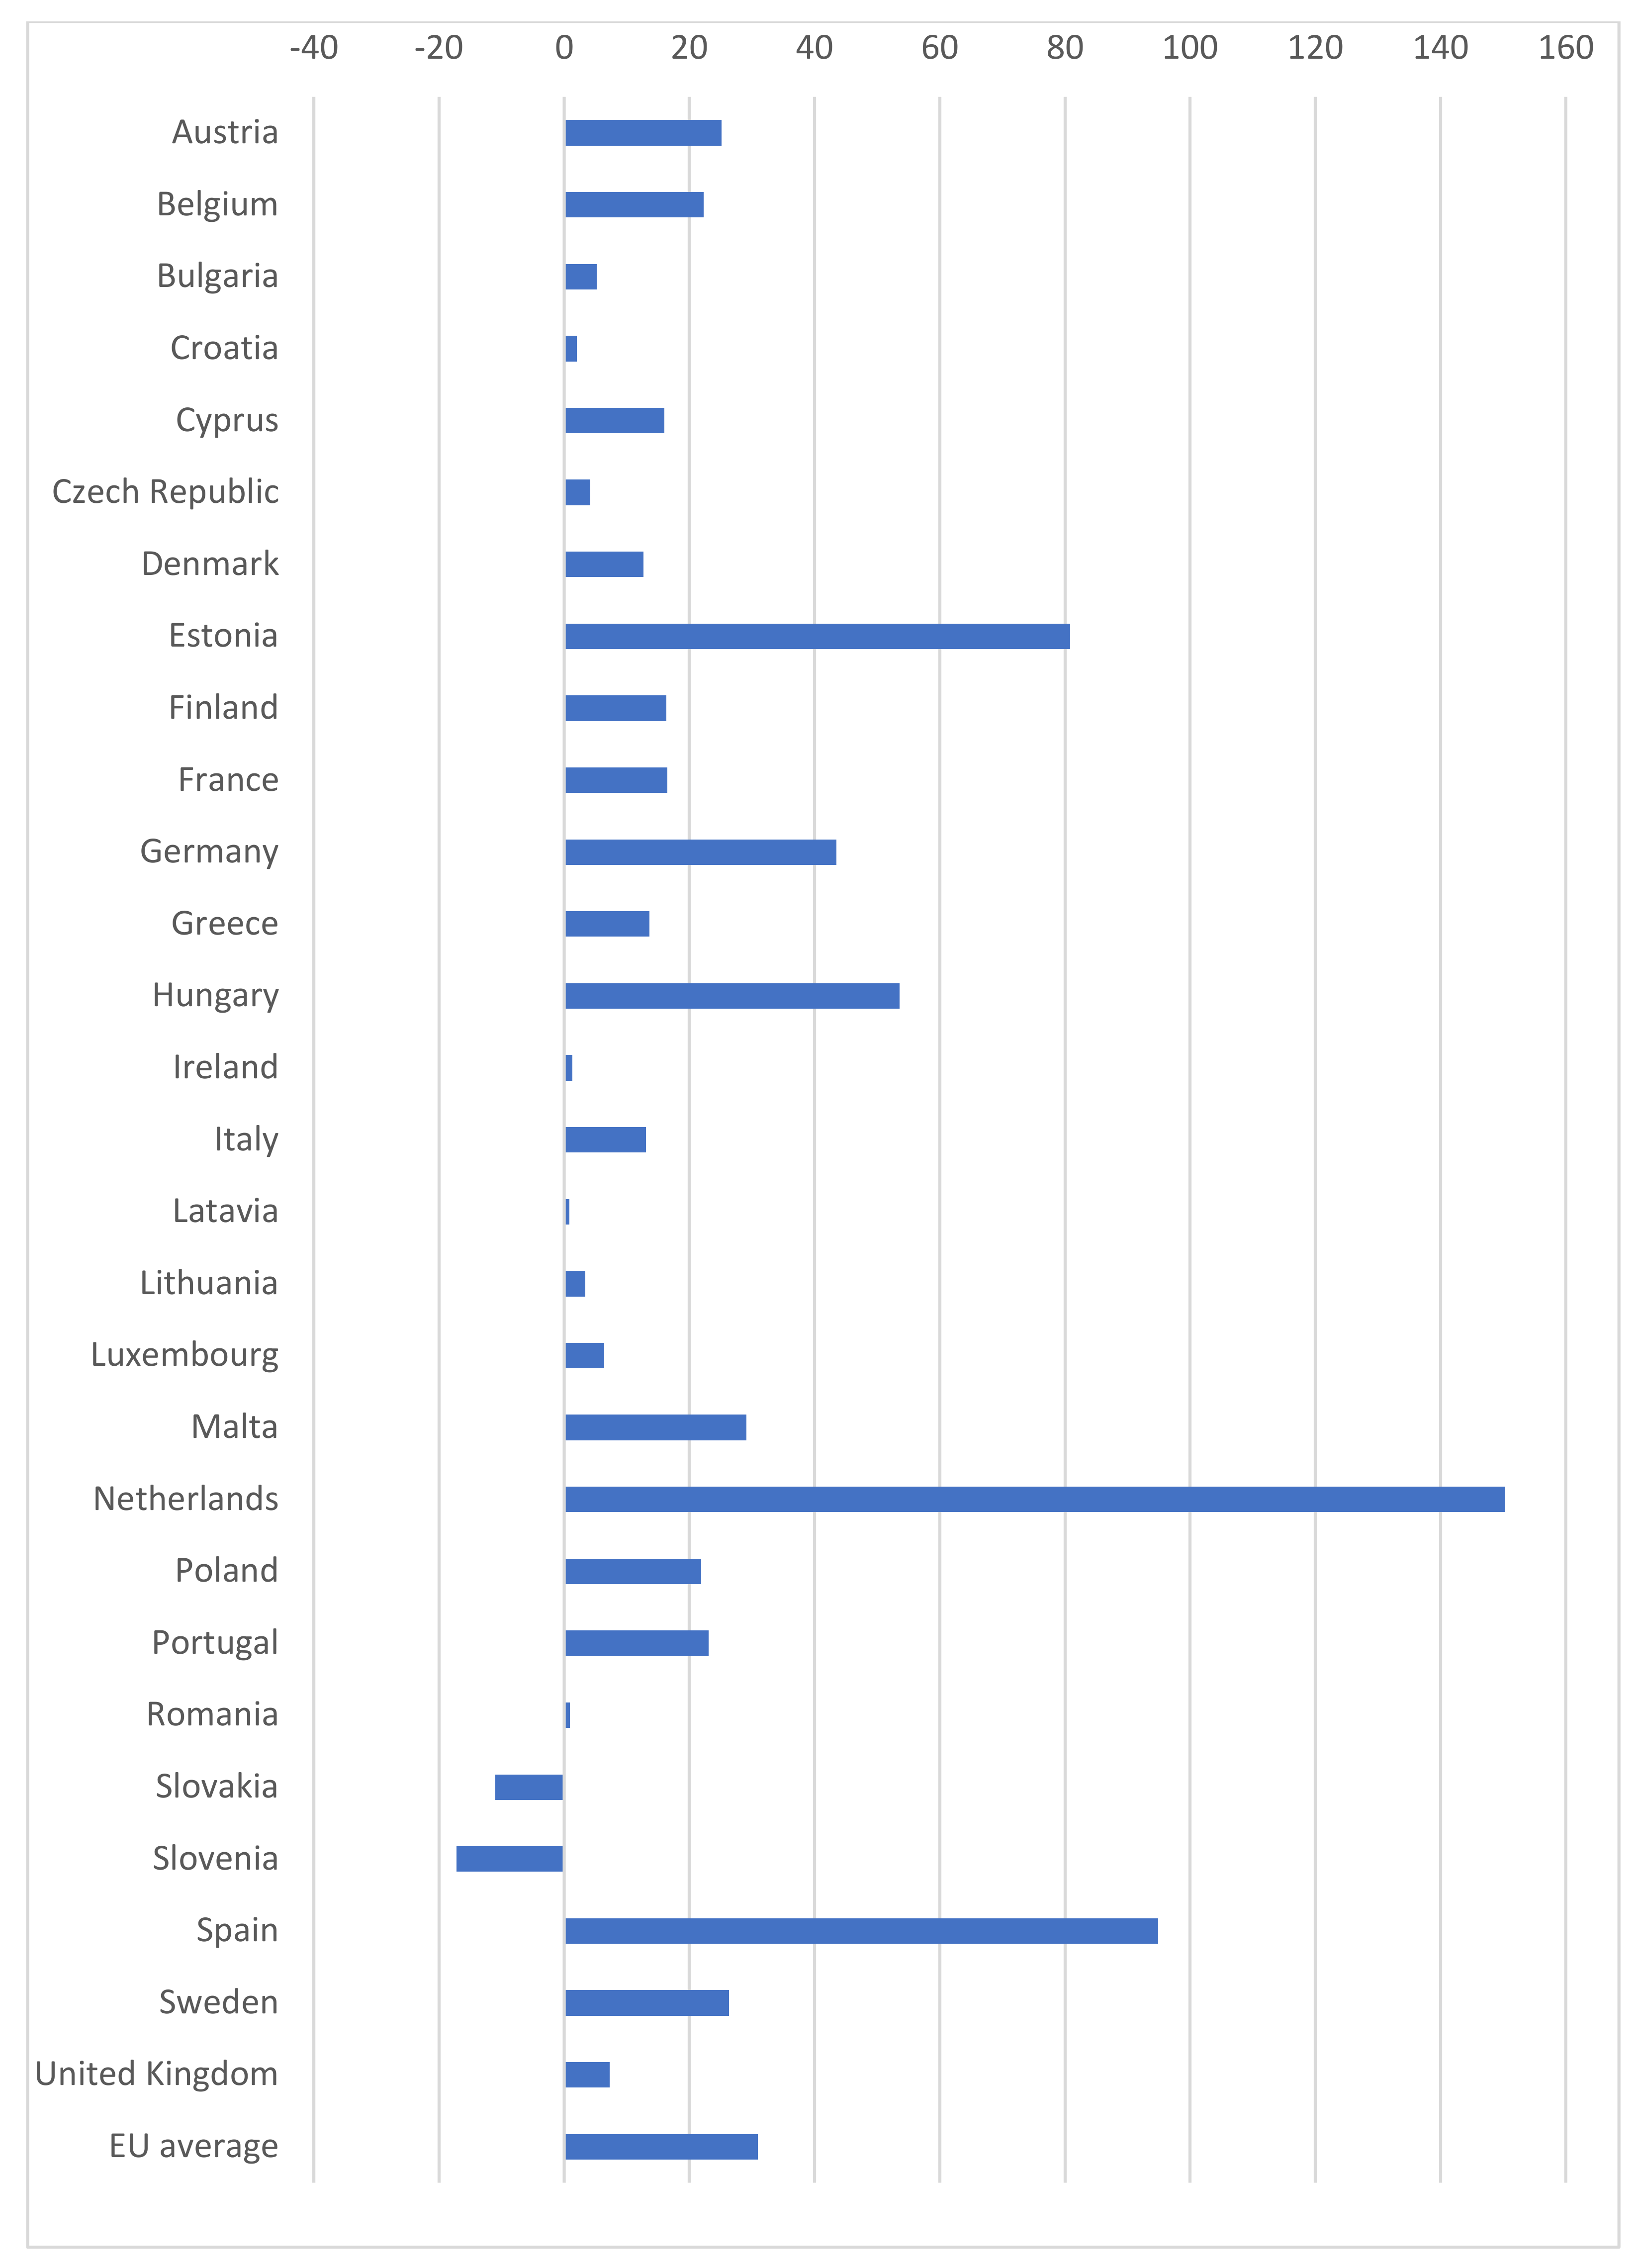
In Table 7 we present the data on the yearly capacity additions in European Union countries in the years 2015–2019. In Table 8 we give a juxtaposition of the five best countries in the case of increases in photovoltaic capacity in particular years. In 2019, the largest increase in photovoltaic capacity per person occurred for the Netherlands with 150.3 (W/inhabitant). In second place was Spain with 94.9 (W/inhabitant). In third place was Estonia with 80.8 (W/inhabitant(, fourth was Hungry with 53.6 (W/inhabitant) and fifth was Germany with 43.5 (W/inhabitants). The average for European Union countries was 30.9 (W/inhabitants). In recent years, a particularly fast increase in photovoltaic capacity per habitants can be observed in the Netherlands, Belgium and Hungry Table 9. It is worth noting that in 2019 the investment in photovoltaic capacity significantly accelerated compared to the previous year. Between 2015 and 2018, the annual average increase in photovoltaic capacity in EU countries varied between 10 and 15 (W/inhabitant). In 2019, it increased by 100% and amounted to 30.9(W/inhabitant).
The use of photovoltaic energy requires investment before it is economically viable. Figure 6 shows the relationship between photovoltaic energy production per person in EU countries in W/inhabitant (for countries where this level exceeds 200 TWh) and the level of GDP per capita calculated as purchasing power parity. The analysis of the graph shows that there is a statistically significant correlation between the data (at the level of statistical significance α = 0.05) with a value of 0.45. According to the Guilford classification [79], the magnitude of the correlation can be considered as average. The data support H2 regarding the existence of a statistically significant correlation between GDP per capita and photovoltaic energy use in the European Union countries.
The relationship between the studied variables can be expressed by the following equation:
Photovoltaic capacity per inhabitant = −68.1334 + 0.0064 GDP per capita
The analysis shows that the involvement of countries in the development of photovoltaic energy is correlated with their wealth. The higher the per capita income of a country, the more modern are the energy solutions used in that country, such as the use of energy from renewable sources. Two groups of countries are worth noting in the figure:
- Countries that have a significantly lower level of photovoltaic energy use compared to their wealth—these include Sweden, Finland and Poland. These countries, especially Finland and Sweden, are located in a cold climate where the use of photovoltaic panels can be difficult. For this reason, they do not install as many photovoltaic panels despite their relatively high wealth.
- Countries where the level of photovoltaic use is higher than their wealth would suggest. This includes in particular three countries—Greece, Italy, Belgium and Germany. In the case of Greece and Italy in particular, the widespread use of photovoltaic panels is most likely due to their warm climate, which favours the use of solar energy to a large extent.
The next stage of the study analysed the relationship between the average temperature in a country and the photovoltaic capacity per inhabitant. In this case, no statistically significant correlation was found between the variables (at the statistical significance level α = 0.05). The data collected do not support H3 as follows: there is a relationship between climate and photovoltaic energy use in European Union countries. Although there is no statistically significant correlation between the variables, the analysis of the scatter plot (Figure 7) identified a group of countries with very high values of photovoltaic capacity per capita at average temperatures, such as Germany, Belgium and the Netherlands. This lack of a direct correlation between national average temperature and the photovoltaic power in particular countries can be due to the mixed effect of high temperature on solar cells, especially in the situation of high radiation. Sometimes high radiation can have positive effect but sometimes also a negative effect on cell power [38,39,42].
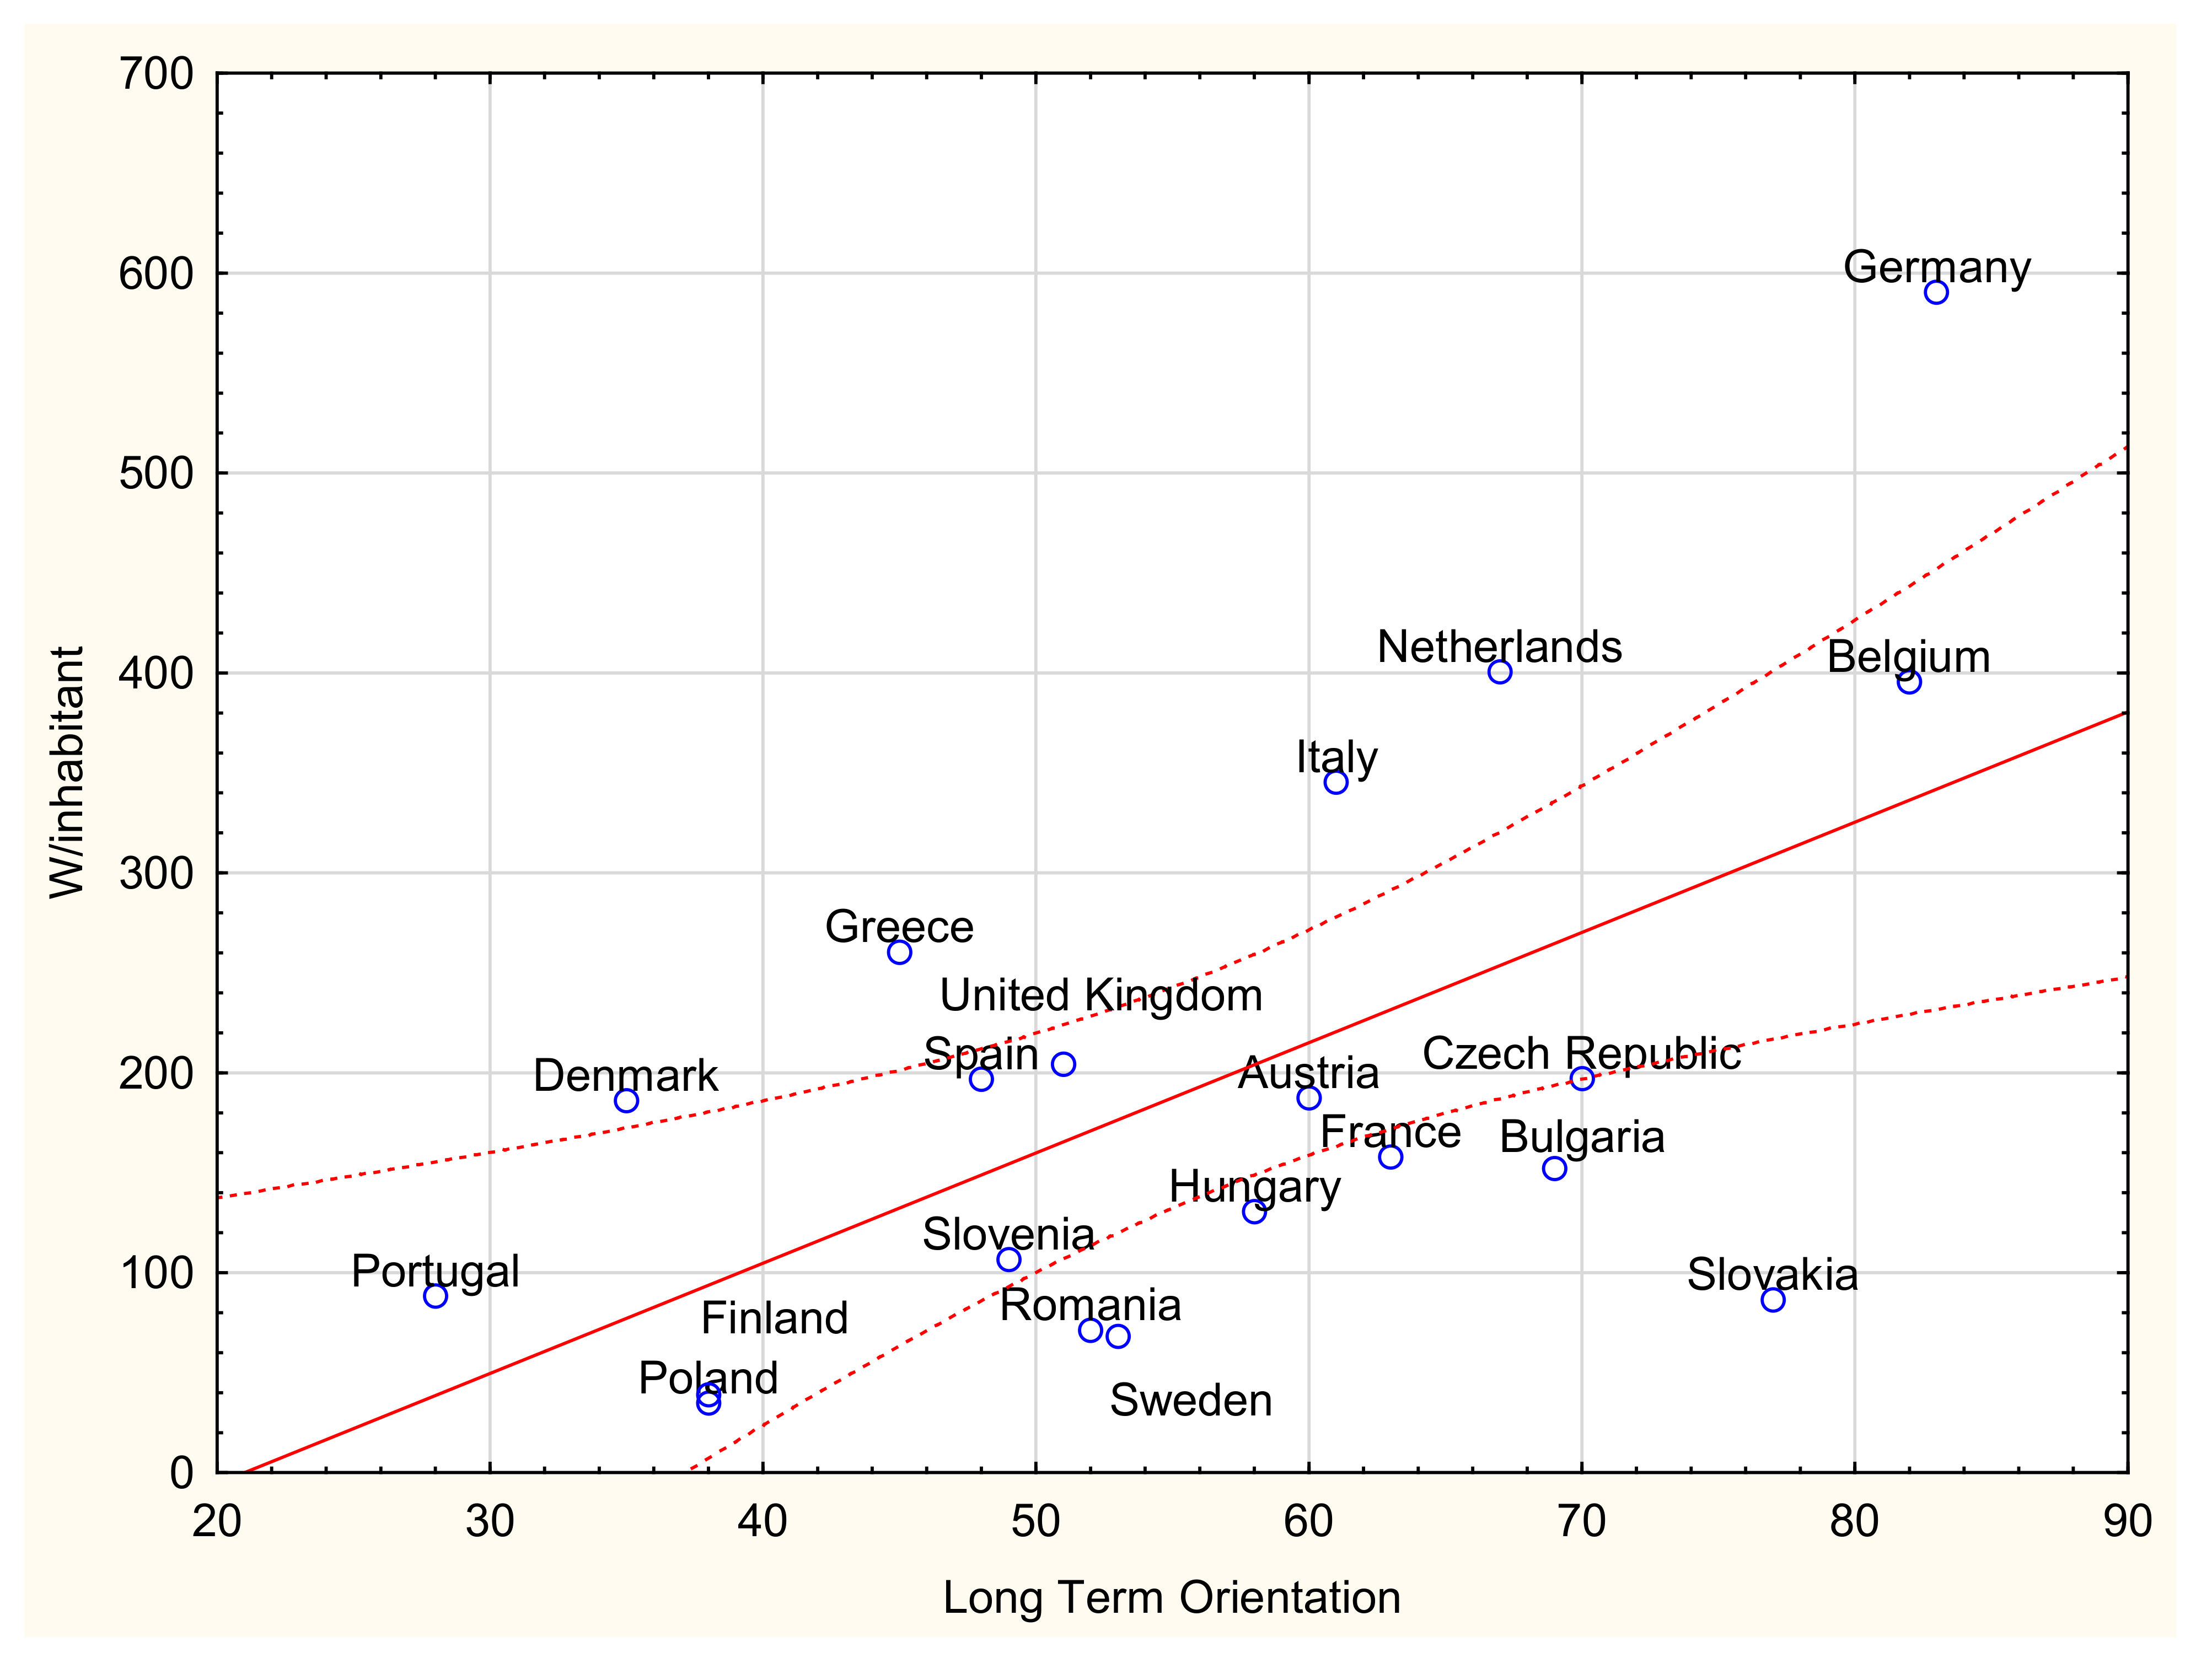
The data analysis also showed the existence of a statistically significant relationship (at the level of statistical significance α = 0.05) at the level of 0.6 between the photovoltaic capacity per inhabitant and the value of the long-term orientation of a given country (it is one of the indicators characterising the culture of a country according to the concept of G. Hofstede). This correlation can be considered, according to the Guilford classification [79], as high. The data support the hypothesis H1 regarding the existence of a statistically significant correlation between the long-term orientation of a country and the use of photovoltaic energy in the European Union countries. In particular, this can be seen in the case of Belgium and Germany—two countries characterised by the highest long-term orientation index among the countries analysed and at the same time very high values of photovoltaic capacity per capita. Conversely, for countries such as Portugal, Poland and Finland, the low long-term orientation (i.e., short-term orientation) results in these countries not investing in modern clean energy technologies, such as photovoltaic technologies.
The relationship between the studied variables can be expressed by the following equation:
Photovoltaic capacity per capita = -115.8041 + 5.5154 × Long Term Orientation Indicator
Figure 8 shows a graph of the relationship between production of the analysed variables.
In the case of countries such as Slovakia, Sweden, Romania, Hungary, France and Bulgaria, their level of photovoltaic capacity saturation is lower than would be indicated by the long-term orientation indicator for their country.
The opposite is true for Germany, the Netherlands, Italy, Greece and Denmark—in these countries the level of solar energy use and their photovoltaic capacity per capita performance is higher than indicated by their long-term orientation indicator.
5. Discussion
All EU Member States, aiming to counteract climate change, have taken strategic actions, the effect of which is energy system transformation. The goal of the undergoing transformation is to improve energy security and the attractiveness of the economy. In the literature on the subject, energy transformation is understood as striving for economic sustainable development, in which energy efficiency, low-emission energy sources and electromobility are aimed at environmental protection [2,80,81,82,83,84,85]. According to researchers, when considering the development and use of renewable energy sources in individual countries, one must look at energy transformation as a complex process consisting of economic, social and industrial factors. Energy transformation in an economic context is related to the technological modernization of energy production processes. This favours the development of new branches, the so-called “Green economy”, improves competitiveness and may have an impact on the growth of GDP in individual EU countries [2,82,84,85,86].
The development of renewable energy sources in the EU countries depends on their prosperity. The European leader in the use of renewable energy sources is Germany. The development of renewable energy sources is also conducive to the growth of employment. The so-called eco-jobs are created, which allows combining economic goals with environmental policy. The European Union has also developed a new industrial policy, in which modernising and innovating the technologies of renewable energy production through creating intelligent energy transmission networks—the so-called Smart Grid, popularization of electric vehicles as well as investments related to the concept of electromobility are vitally important [2,82,84]. The EU countries focus on energy efficiency, which is related to one of the goals of the EU sustainable energy policy. The social aspect is also of great importance in the process of energy transformation. The use of renewable energy sources reduces air pollution, which lowers public health expenditure and, consequently, reduces the negative impact of the energy sector on human health. The energy transformation brings positive social effects, such as better air quality, new jobs, and increased purchasing power. However, attention should also be paid to the disadvantageous aspect of reducing the number of jobs in other sectors of the economy related to the extraction of combustible minerals. Therefore, the EU countries must take these problems into account when creating strategies for the development of renewable energy sources [2,83,84,85].
Since the introduction of the first European directive on renewable energy sources in April 2009, the installed solar capacity in the European Union and Great Britain has increased more than 10 times, from 11.3 GW in 2008 to more than 134 GW in 2019 [80,83,84].
Approximately 60% of it includes residential and commercial rooftop installations. At the end of 2019, the total power from photovoltaic energy in the European Union and the United Kingdom was 635 GW, which accounted for 21% of all the power in the world. The contribution of photovoltaic energy in reducing greenhouse gases is expected to reach 55% by 2030. The long-term EU strategy (LTS) by 2050 assumes that there must be a rapid increase in renewable energy sources in the service sector as well as in transport, so that in 2050 energy from renewable sources in the EU countries will be close to 100% [80,81,82,86]. The European Union has the best defined and established goals in the world regarding the policy of renewable energy sources. However, it must be emphasized that in individual EU countries the use of photovoltaic energy is very diverse and dependent on many factors [80]. The development of renewable energy sources is different across the EU countries due to the different structure of the energy balance as well as political and cultural environment in which these countries are embedded. The climatic conditions and the economic level of the member states are also important. Regardless of the starting point, Member States will all pursue three goals: social expectations with regard to environmental protection, industrial development and economic growth [87,88,89,90,91,92]. The presented results of the analysis on the development of photovoltaic energy in the EU countries in relation to GDP per capita calculated according to the purchasing power parity and the cultural characteristics of the EU Member States enhance the knowledge of the factors influencing the energy transformation process in individual EU countries [93].
The increase of photovoltaic power usage in annualized EU countries can be in the future connected with the widespread of usage of mix hydrogen energy and photovoltaic energy. This system seems like environmentally sustainable and because of that can be used for grid-connected and also for non-grid application [68]. This mix can lead to creation of clean fuel transportation using hydrogen powered by solar energy. For example, hydrogen can be generated by solar photovoltaic and in the next stage stored and used [94]
6. Conclusions
Renewable energy sources are basic tools of energy transformation and constitute the main goal of eco-innovation in the EU countries.
In the EU countries, the distribution of renewable energy potential is varied and related to economic, industrial and social factors. Photovoltaic energy is the second fastest growing renewable energy source in the EU. In 2020, 134 TWh of solar energy was produced in the EU countries [92,93]. The article investigates the relationship between data on the development of the photovoltaic market in the EU countries and data on GDP per capita calculated according to the purchasing power parity, as well as data on the cultural characteristics of individual countries, such as the long-term orientation of a particular country, the population index in EU countries and data related to the relationship between solar capacity and the average temperature of the country. In the study, three research questions and three research hypotheses were formulated.
The presented statistical research methodology enables us to present the following conclusions and answers to the research questions as well as the formulated research hypotheses:
- The use of photovoltaic energy before it becomes economically profitable requires individual EU countries to incur expenditures. Based on the statistical analysis, it can be concluded that there is a statistically significant correlation (at the level of statistical significance α = 0.05, reaching the value of 0.45) between the production of photovoltaic energy per person in the EU countries and the level of GDP per capita calculated as the purchasing power parity. According to the Guilford classification, the size of the correlation can be considered average. The presented data support Hypothesis 2.
- The involvement of EU countries in the development of photovoltaic energy is correlated with their prosperity. The higher income per capita a given country has, the more frequently it applies modern solutions related to photovoltaic energy.
- On the basis of the research, no correlation was found between the average temperature in a given EU country and the photovoltaic capacity per inhabitant. The presented analysis does not support the Hypothesis 3, which reads as follows: there is a relationship between the climate and the use of photovoltaic energy in the European Union countries. However, some countries—Germany, Belgium and the Netherlands, can boast a very high solar energy capacity against average temperature values.
- The conducted data analysis revealed statistically significant relationships at the level of 0.6 between the photovoltaic capacity per inhabitant and the value of long-term orientation of a given EU country. According to the Guilford classification, this correlation should be considered high. The presented data supports Hypothesis 1.
Author Contributions
The main activities of the team of authors can be described as follows: Conceptualization, B.S.-Z. and R.W.; methodology, B.S.-Z. and R.W.; software, R.W.; validation, B.S.-Z. and R.W., formal analysis, B.S.-Z. and R.W., investigation, B.S.-Z. and R.W.; resources, B.S.-Z. and R.W.; data curation B.S.-Z. and R.W.; writing—original draft preparation, B.S.-Z. and R.W., writing—review and editing, B.S.-Z. and R.W.; visualization, R.W. supervision, B.S.-Z. and R.W.; funding acquisition, B.S.-Z. and R.W. All authors have read and agreed to the published version of the manuscript.
Funding
This research was funded by Silesian University of Technology, Faculty of Organization and Management, Department of Economics and Computer Science, grant number 13/010/BK_22/0065.
Institutional Review Board Statement
Not applicable.
Informed Consent Statement
Not applicable.
Data Availability Statement
Data are contained within the article.
Acknowledgments
Silesian University of Technology supported this work as a part of statutory research grant number 13/010/BK_22/0065.
Conflicts of Interest
The authors declare no conflict of interest.
References
- Balthaser, A.; Schreurs, M.A.; Varone, F. Energy transformation in Europe and the United States: Policy Entrepreneurs and Veto Players in Federalist Systems. J. Environ. Dev. 2020, 29, 3–25. [Google Scholar] [CrossRef]
- Młynarski, T. Unia Europejska w procesie transformacji energetycznej. Krak. Studia Międzynarodowe 2019, 16, 31–44. [Google Scholar]
- Młynarski, T. Bezpieczeństwo Energetyczne i Ochrona Klimatu w Drugiej Dekadzie XXI Wieku; Energia-Środowisko-Klimat: Kraków, Poland, 2017.
- Młynarski, T.; Ruszel, M.; Szurlej, A. Pojęcie Transformacji Energetycznej, [w] Energy Policy Transition, The Perspective of Different States; Ignacy Lukasiewicz Energy Policy Institute: Rzeszów, Poland, 2017; pp. 1–12. [Google Scholar]
- Młynarski, T. Bezpieczeństwo Energetyczne; Wydawnictwo PWN: Warszawa, Poland, 2018. [Google Scholar]
- Bόrawski, P.; Yashchenko, T.; Sviderskyi, A.; Dunn, J.W. Development of renewable energy market in the EU with particular regard to solar energy. In Proceedings of the VII International Scientific Conference Determinants of Regional Development, Pila, Poland, 12–13 April 2018; pp. 43–55. [Google Scholar]
- Pellerin-Carlin, T.; Vinios, J.-A.; Rubi, E.; Fernandes, S. Making the Energy Transition European Success. Tackling the Democratic, Innovation Financing and Social Challenges of the Energy Union. “Studies & Reports”114. June 2017. Available online: https://institutdelors.eu/wp-content/uploads/2020/08/makingtheenergytransitionaeuropeansuccess-study-pellerincarlinfernandesrubio-june2017-bd-1.pdf (accessed on 15 November 2021).
- Eyl-Mazzega, M.-A.; Mathieu, C. The European Union and The Energy Transition. In The Geopolitics of the Global Energy Transition; Hafner, M., Tagliapiera, S., Eds.; Springer International Publishing: Berlin, Germany, 2020; pp. 27–46. [Google Scholar]
- Morris, C.; Jungjohann, A. Energy Democracy; Palgrave Macmillan: Cham, Switzerland, 2016; p. 437. [Google Scholar]
- Ruszel, M. The energy security paradigm (Paradygmat bezpieczeństwa energetycznego). In Qutline of the Theory of State Security; Gryz, J., Ed.; Akademia Obrony Narodowej: Warszawa, Poland, 2016; p. 347. [Google Scholar]
- Knodt, M.; Ringel, M.; Muller, R. Harder soft governance in the European Energy Union. J. Environ. Policy Plan. 2020, 22, 787–800. [Google Scholar] [CrossRef]
- Masterplan for a Competitive Transformation of EU Energy-Intensive Industries Enabling a Climate-Neutral, Circular Economy by 2050, Rapport by High-Level Group on Energy-Intensive Instructions; Publications Office of the European Union: Luxembourg, 2019. Available online: https://op.europa.eu/en/publication-detail/-/publication/be308ba7-14da-11ea-8c1f-01aa75ed71a1 (accessed on 6 November 2020).
- Tagliapitera, S.; Zachmann, G.; Edenhofer, O.; Glachant, J.-M. The European union energy transition: Key priorities for the next five years. Arch. Eur. Integr. Policy Brief. 2019, 132, 950–954. [Google Scholar] [CrossRef] [Green Version]
- European Energy Transition 2030: The Big Picture, Ten Priorities for the Next European Commission to Meet the EU 2030 Targets and Accelerate towards 2050; Ecologic Institute: Berlin, Germany, 2019; p. 91.
- Pollak, J.; Schubert, S.; Slominski, P. Die Energiepolitik der EU; WUV Facultas: Wien, Austria, 2010. [Google Scholar]
- Argantegui, R.L.; Jäger-Waldau, A. Photovoltaic energy and wind status in the European Union after the Paris Ageement. Renew. Sustain. Rev. 2018, 81, 2460–2471. [Google Scholar] [CrossRef]
- Jäger-Waldau, A. PV Status Report, JRC Science for Policy Report, European Commission; Publications Office of the European Union: Luxembourg, 2019.
- Martínez-Ruiz, Y.; Manotas-Duque, D.F.; Ramírez-Malule, H. Evaluation of investment projects in photovoltaic solar energy using the dnpv methodology. Int. J. Energy Econ. Policy 2020, 11, 180–185. [Google Scholar] [CrossRef]
- Akram, R.; Chen, F.; Khalid, F.; Huang, G.; Irfan, M. Heterogeneous effects of energy efficiency and renewable energy on economic growth of BRICS countries: A fixed effect panel Quantile Regression Analysis. Energy 2020, 215, 119019. [Google Scholar] [CrossRef]
- Hussain, A.; Oad, A.; Ahmad, M.; Irfan, M. Do financial development and economic openness matter for economic progress in an emerging country? Seeking a sustainable development path. J. Risk Financ. Manag. 2021, 14, 237. [Google Scholar] [CrossRef]
- Photovoltaic Barometer 2020. Available online: https://www.eurobserv-er.org/pdf/barometre-photovoltaique-2020/ (accessed on 1 October 2021).
- Photovoltaic Barometer 2019. Available online: https://www.eurobserv-er.org/pdf/photovoltaic-barometer-2019-en/ (accessed on 1 October 2021).
- Photovoltaic Barometer 2018. Available online: https://www.eurobserv-er.org/pdf/photovoltaic-barometer-2018-en/ (accessed on 1 October 2021).
- Photovoltaic Barometer 2017. Available online: https://www.eurobserv-er.org/pdf/photovoltaic-barometer-2017-en/ (accessed on 1 October 2021).
- Photovoltaic Barometer 2016. Available online: https://www.eurobserv-er.org/pdf/photovoltaic-barometer-2016-en/ (accessed on 1 October 2021).
- Photovoltaic Barometer 2015. Available online: https://www.eurobserv-er.org/pdf/photovoltaic-barometer-2015-en/ (accessed on 1 October 2021).
- Word Economic Outlook Databases. Available online: https://www.imf.org/en/Publications/SPROLLs/world-economic-outlook-databases#sort=%40imfdate%20descending (accessed on 1 October 2021).
- Majewski, J.; Szymanek, M. Technical, economic and legal conditions of the development of photovoltaic generation in Poland. Acta Energ. 2012, 2, 21–26. [Google Scholar]
- Bigorajski, J.; Chwieduk, D. Analysis of a micro photovoltaic/thermal—PV/T system operation in moderate climate. Renew. Energy 2019, 137, 127–136. [Google Scholar] [CrossRef]
- Bartecka, M.; Terlikowski, P.; Kłos, M.; Michalski, Ł. Sizing of prosumer hybrid renewable energy systems in Poland. Bull. Polish Acad. Sci. Tech. Sci. 2020, 68, 721–731. [Google Scholar]
- Kruzel, R.; Helbrych, P. Analysis of the profitability of a photovoltaic installation in the context of sustainable development of construction. E3S Web Conf. 2021, 49, 00061. [Google Scholar] [CrossRef] [Green Version]
- Abdmouleh, Z.; Gastli, A.; Ben-Brahim, L.; Haouari, M.; Al-Emadi, N.A. Review of optimization techniques applied for the integration of distributed generation from renewable energy sources. Renew. Energy 2017, 113, 266–280. [Google Scholar] [CrossRef]
- Mitscher, M.; Rüther, R. Economic performance and policies for grid-connected residential solar photovoltaic systems in Brazil. Energy Policy 2012, 49, 688–694. [Google Scholar] [CrossRef]
- Dinesh, H.; Pearce, J.M. The potential of agrivoltaic systems. Renew. Sustain. Energy Rev. 2016, 54, 299–308. [Google Scholar] [CrossRef] [Green Version]
- Patel, M.T.; Khan, M.R.; Sun, X.; Alam, M.A. A worldwide cost-based design and optimization of tilted bifacial solar farms. Appl. Energy 2019, 247, 467–479. [Google Scholar] [CrossRef] [Green Version]
- Bova, E. Green Budgeting Practices in the EU: A First Review, European Commission; Publications Office of the European Union: Luxembourg, 2021.
- Supporting Climate Action through the EU Budget. Available online: https://ec.europa.eu/clima/eu-action/funding-climate-action/supporting-climate-action-through-eu-budget_en (accessed on 27 November 2021).
- Kazem, H.A.; Chaichan, M.T.; Al-Waeli, A.H.A.; Mani, K. Effect of shadows on the performance of solar photovoltaic. In Mediterranean Green Buildings & Renewable Energy; Sayigh, A., Ed.; Springer: Cham, Switzerland, 2017; pp. 379–385. [Google Scholar]
- Kazem, H.A.; Chaichan, M.T. The impact of using solar colored filters to cover the PV panel on its outcomes. Bull. J. 2016, 2, 464–469. [Google Scholar] [CrossRef]
- Chaichan, M.T.; Kazem, H.A. Effect of sand, ash and soil on photovoltaic performance: An experimental study. Int. J. Sci. Eng. Sci. 2017, 1, 27–32. [Google Scholar]
- Kazem, H.A.; Chaichan, M.T. Experimental effect of dust physical properties on photovoltaic module in northern Oman. Sol. Energy 2016, 139, 68–80. [Google Scholar] [CrossRef]
- Buni, M.J.B.; Al-Walie, A.A.K.; Al-Asadi, K.A.N. Effect of Solar Radiation on Photovoltaic Cell. Int. Res. J. Adv. Eng. Sci. 2018, 3, 47–51. [Google Scholar]
- Molo, B. Polityka Unii Europejskiej a rozwój odnawialnych źródeł energii w Niemczech. Rocznik Integracji Europejskiej 2016, 10, 121–142. [Google Scholar] [CrossRef] [Green Version]
- Miciuła, I. Polityka Energetyczna Unii Europejskiej do 2030 Roku w Ramach Zrównoważonego Rozowju; Wydział Nauk Ekonomicznych i Zarządzania Uniwersytetu Szczecińskiego: Szczecin, Poland, 2015; pp. 57–67. [Google Scholar]
- Communication Form the Commission–Energy for the Future: Renewable Sources of Energy–White Paper for a Community Strategy and Action Plan. COM (1997) 97. p. 599. Available online: https://europa.eu/documents/comm/white_papers/pdf/com97_599_en.pdf (accessed on 15 December 2021).
- Dyrektywa 2001/77/WE Parlamenty Europejskiego i Rady z Dnia 27 Września 2001 r. w Sprawie Wspierania Produkcji na Rynku Wewnętrznym Energii Elektrycznej Wytwarzanej ze Źródeł Odnawialnych. Dz. U. I. 283 z 27.10. 2001. Available online: https://eur-lex.europa.eu/LexUriServ/LexUriServ.do?uri=CONSLEG:2001L0077:20100401:PL:PDF (accessed on 25 December 2021).
- Dyrektywa Parlamentu Europejskiego i Rady 2003/30/WE z Dnia 8 Maja 2003 r. w Sprawie Wspierania Użycia w Transporcie Biopaliw Lub Innych Paliw Odnawialnych. Dz. U. UE. L. 123/42 z 17.05. 2003. Available online: https://eur-lex.europa.eu/legal-content/PL/TXT/PDF/?uri=CELEX:32003L0030&from=DE (accessed on 15 December 2021).
- Zielona Księga Europejska Strategia na Rzecz Zrównoważonej, Konkurencyjnej i Bezpiecznej Energii; COM (2006) 105; European Comission: Brussels, Belgium, 2006.
- Komisja Europejska. Komunikat Komisji z Dnia 10.Styczna 2007r, Mapa Drogowa na Rzecz Energii Odnawialnej–Energie Odnawialne w XXI Wieku: Budowa Bardziej Zrównoważonej Przyszłości; COM (2006), 844; European Comission: Brussels, Belgium, 2007. [Google Scholar]
- Dyrektywa Parlamentu Europejskiego i Rady 2009/28/WE z Dnia 23 kwietnia 2009 r., w Sprawie Promowania Stosowania Energii ze Źródeł Odnawialnych Zmieniająca i w Następstwie Uchylająca Dyrektywy 2001/77/WE Oraz 2003/30/WE. Dz. U. EU. L. 140/16-62 z 5.06.2009. Available online: https://eur-lex.europa.eu/legal-content/PL/TXT/PDF/?uri=CELEX:02009L0028-20151005&from=GA (accessed on 15 December 2021).
- European Comission. Komunikat Komisji Parlamentu Europejskiego, Rady Europejskiego Komitetu Ekonomiczno-Społecznego i Komitetu Regionów, Energia 2020. Strategia na Rzecz Konkurencyjnego, Zrównoważonego i Bezpieczeństwa Sektora Energetycznego; COM (2010), 639; European Comission: Brussels, Belgium, 2010. [Google Scholar]
- European Comission. Komunikat Komisji Parlamentu Europejskiego, Rady Europejskiego Komitetu Ekonomiczno-Społecznego i Komitetu Regionów, Plan Działania w Zakresie Energii do Roku 2050; COM (2011), 885; European Comission: Brussels, Belgium, 2011. [Google Scholar]
- European Comission. Komunikat Komisji Parlamentu Europejskiego, Rady Europejskiego Komitetu Ekonomiczno-Społecznego i Komitetu Regionów, Energia Odnawialna: Ważny Uczestnik Europejskiego Rynku Energii; COM (2021) 271; European Comission: Brussels, Belgium, 2012. [Google Scholar]
- Zielona Księga. Ramy Polityki w Zakresie Klimatu i Energii do Roku 2030; COM (2013), 169; European Comission: Brussels, Belgium, 2013. [Google Scholar]
- European Comission. Komunikat Komisji Parlamentu Europejskiego, Rady Europejskiego Komitetu Ekonomiczno-Społecznego i Komitetu Regionów, Ramy Polityczne na Okres 2020–2030 Dotyczące Klimatu i Energii; COM (2014) 15 2; European Comission: Brussels, Belgium, 2014. [Google Scholar]
- European Comission. Komunikat Komisji, Wytyczne w Sprawie Pomocy Państwa na Ochronę Środowiska i Cele Związane z Energią w Latach 2014–2020 (2014/C/200/01); European Comission: Brussels, Belgium, 2014. [Google Scholar]
- Chataeu, B.; di Valdalbero, D.R. World and European Energy and Environment Transition Outlook; European Commission: Brussels, Belgium, 2011; p. 160. [Google Scholar]
- Bugała, A.; Bednarek, K.; Kasprzyk, L.; Tomczewski, A. Statistical analysis of the electric energy production form photovoltaic conversion using mobile and fixed constructions, EEMS 2017. E3S Web Conf. 2017, 19, 01002. [Google Scholar] [CrossRef] [Green Version]
- European Commission. European Energy and Transport Trends to 2030; European Commission: Brussels, Belgium, 2010. [Google Scholar]
- European Commission. An Energy Policy for Europe; COM (2007), 1; Commission of The European Communities: Brussels, Belgium, 2007. [Google Scholar]
- Rozwój Potencjału Energetyki Odnawialnej w Polsce; Polski Instytut Ekonomiczny: Warszawa, Poland, 2020; pp. 9–25.
- Juszczak, A.; Maj, M. Rozwój i Potencjał Energetyki Odnawialnej w Polsce; Polski Instytut Ekonomiczny: Warszawa, Poland, 2020. [Google Scholar]
- Marks-Bielska, R.; Bielski, S.; Pik, K.; Kurowska, K. The Importance of Renewable Energy Sources in Poland’s Energy Mix. Energies 2020, 13, 4624. [Google Scholar] [CrossRef]
- Ma’sloch, G. Uwarunkowania i Kierunki Rozwoju Energetyki Odnawialnej w Polsce (Conditions and Directions of Development of Renewable Energy in Poland); Szkoła Główna Handlowa: Warszawa, Poland, 2018. [Google Scholar]
- Mularczyk, A.; Hysa, B. Rozwój i perspektywy energii solarnej w Polsce i województwie śląskim (Development and perspectives of solar energy in Poland and the Śląskie Voivodeship). Zeszyt Naukowy Politechniki Śląskiej Organizacja i Zarza˛dzanie 2015, 86, 363–377. [Google Scholar]
- Kasztelewicz, Z.; Tajduś, A.; Słomka, T. Węgiel brunatny to paliwo przyszłości czy przeszłości? (Lignite is the fuel of the future or the past?). Napędy i Sterowanie 2017, 19, 88–104. [Google Scholar]
- Brodziński, Z.; Brodzińska, K.; Szadziun, M. Photovoltaic Farms—Economic Efficiency of Investments in North-East Poland. Energies 2021, 14, 2087. [Google Scholar] [CrossRef]
- Ogbonnaya, C.; Abeykoon, C.; Nasser, A.; Turan, A.; Sunday, C. Prospects of Integrated Photovoltaic-Fuel Cell Systems in a Hydrogen Economy: A Comprehensive Review. Energies 2021, 14, 6827. [Google Scholar] [CrossRef]
- Rajashekara, K. Hybrid fuel-cell strategies for clean power generation. IEEE Trans. Ind. Appl. 2005, 41, 682–689. [Google Scholar] [CrossRef]
- Ozturk, M.; Dincer, I. Thermodynamic analysis of a solar-based multi-generation system with hydrogen production. Appl. Therm. Eng. 2013, 51, 1235–1244. [Google Scholar] [CrossRef]
- Ferrari, M.L.; Damo, U.M.; Turan, A.; Sanchez, D. Hybrid Systems Based on Solid Oxide Fuel Cells: Modelling and Design; Wiley: Hoboken, NJ, USA, 2017. [Google Scholar]
- Damo, U.M.; Ferrari, M.L.; Turan, A.; Massardo, A.F. Solid oxide fuel cell hybrid system: A detailed review of an environmentally clean and efficient source of energy. Energy 2019, 168, 235–246. [Google Scholar] [CrossRef] [Green Version]
- Bukar, A.L.; Tan, C.W.; Lau, K.Y. Optimal sizing of an autonomous photovoltaic/wind/battery/diesel generator microgrid using grasshopper optimization algorithm. Sol. Energy 2019, 188, 685–696. [Google Scholar] [CrossRef]
- Bukar, A.L.; Tan, C.W. A review on stand-alone photovoltaic-wind energy system with fuel cell: System optimization and energy management strategy. J. Clean. Prod. 2019, 221, 73–88. [Google Scholar] [CrossRef]
- Cano, A.; Jurado, F.; Sánchez, H.; Fernández, L.M.; Castañeda, M. Optimal sizing of stand-alone hybrid systems based on PV/WT/FC by using several methodologies. J. Energy Inst. 2014, 87, 330–340. [Google Scholar] [CrossRef]
- Hofstede Insight. Available online: https://www.hofstede-insights.com/ (accessed on 1 October 2021).
- European Countries by Population. Available online: https://www.worldometers.info/population/countries-in-europe-by-population/ (accessed on 1 October 2021).
- Average Yearly Temperature by Country. Available online: https://www.ncdc.noaa.gov/sotc/global/201913 (accessed on 1 October 2021).
- Guilford, J.P. Fundamental Statistics in Psychology and Education; McGraw-Hill: New York, NY, USA, 1965. [Google Scholar]
- Kougias, I.; Taylor, N.; Kakoulaki, G.; Jäger-Waldau, A. The role of pfotovoltaics for the European Grenn Deal and the recover plan. Renew. Sustain. Energy Rev. 2021, 144, 1–8. [Google Scholar] [CrossRef]
- Jäger-Waldau, A.; Kougias, I.; Taylor, N.; Thiel, C. How photovoltaic energy can contribute to GHG emission. reductions of 55% in the EU by 2030. Renew. Sustain. Energy Rev. 2020, 126, 109836. [Google Scholar] [CrossRef]
- Zhang, Y.; Ren, J.; Pu, Y.; Wang, P. Solar energy potential assessment: A framework to integrate geographic, technological, and economic indices for a potential analysis. Renew. Energy 2020, 149, 577–586. [Google Scholar] [CrossRef]
- Fragkos, P.; Paroussos, L. Employment creation in EU related to renewables expansion. Appl. Energy 2018, 230, 935–945. [Google Scholar] [CrossRef]
- Keiner, D.; Ram, M.; Barbosa, L.D.S.N.S.; Bogdanov, D.; Breyer, C. Cost optimal self-consumption of PV. prosumers with stationary batteries, heat pumps, thermal energy storage and electric vehicles across the. world up to 2050. Sol. Energy 2019, 185, 406–423. [Google Scholar] [CrossRef]
- Madsen, D.N.; Hansen, J.P. Outlook of solar energy in Europe based on economic growth characteristics. Renew. Sustain. Energy Rev. 2019, 114, 109306. [Google Scholar] [CrossRef]
- United Nations. The Sustainable Development Goals Report 2019; United Nations: New York, NY, USA, 2019; pp. 121–131. [Google Scholar]
- SolarPower Europe and LUT University. 100% Renewable Europe: How to Make Europe’s Energy System Climate-Neutral Before 2050; SolarPower Europe: Brussels, Belgium, 2020. [Google Scholar]
- Huang, P.; Lovati, M.; Shen, J.; Chai, J.; Zhang, X. Investigation of the Peer-to-Peer energy trading performances in a local community under the future climate change scenario in Sweden. Energy Rep. 2022, 8, 989–1001. [Google Scholar] [CrossRef]
- Alsaleh, M.; Abdul-Rahim, A.S. The pathway toward pollution mitigation in EU28 region: Does hydropower growth make a difference? Renew. Energy 2022, 185, 291–301. [Google Scholar] [CrossRef]
- Markandya, A.; Arto, I.; González-Eguino, M.; Román, M.V. Towards a green energy economy? Tracking the employment effects of low-carbon technologies in the European Union. Appl. Energy 2016, 179, 1342–1350. [Google Scholar] [CrossRef] [Green Version]
- Capros, P.; Kannavou, M.; Evangelopoulou, S.; Petropoulos, A.; Siskos, P.; Tasios, N.; Zazias, G.; DeVita, A. Outlook of the EU energy system up to 2050: The case of scenarios prepared for European Commission’s “clean energy for all Europeans” package using the PRIMES model. Energy Strategy Rev. 2018, 22, 255–263. [Google Scholar] [CrossRef]
- Hassan, Q. Evaluate the adequacy of self-consumption for sizing photovoltaic system. Energy Rep. 2022, 8, 239–254. [Google Scholar] [CrossRef]
- Jacobson, M.Z.; Delucchi, M.A.; Cameron, M.A.; Coughlin, S.J.; Hay, C.A.; Manogaran, I.P.; Shu, Y.; von Krauland, A.-K. Impacts of green new deal energy plans on grid stability, costs, jobs, health, and climate in 143 countries. One Earth 2019, 1, 449–463. [Google Scholar] [CrossRef]
- Wilson, J.F.; Srinivasan, S.S.; Moore, B.M.; Henderson, L.; Ely, S.; Sharma, P.C. Hydrogen Production Using Solar Energy. J. Undergrad. Res. Phys. 2013, 1, 1–7. [Google Scholar]
Figure 1.
Photovoltaic capacity additions in the European Union countries in 2019 (MW). Source: Own analyses based on data: [21,22,23,24,25,26,27].

Figure 2.
The photovoltaic capacity addictions in EU countries in the years 2014–2019 (MW). Source: Own analyses based on data: [21,22,23,24,25,26,27].

Figure 3.
Photovoltaic capacity installed in European Union countries in year 2019. Source: Own analyses based on data: [21,22,23,24,25,26,27,54,55,56,57,58,59,60,61,62,76].

Figure 4.
Photovoltaic installed capacity in years 2014–2019—European Union countries. Source: Authors’ own analysis based on data in [21,22,23,24,25,26,27,79].

Figure 5.
Photovoltaic capacity in European Union countries per inhabitant in 2019 (W/inhabitant). Source: Authors own analysis based on data in [21,22,23,24,25,26,27].

Figure 6.
Relationship between GDP/per capita and W/inhabitant of photovoltaic capacity for the countries analysed. Source: Authors’ own analysis.
Figure 6.
Relationship between GDP/per capita and W/inhabitant of photovoltaic capacity for the countries analysed. Source: Authors’ own analysis.

Figure 7.
Relationship between national average temperature and W/inhabitant of photovoltaic power. Source: Authors’ own analysis.
Figure 7.
Relationship between national average temperature and W/inhabitant of photovoltaic power. Source: Authors’ own analysis.

Figure 8.
Relationship between long-term orientation of the country and W/inhabitant of photovoltaic capacity. Source: Authors’ own analysis.
Figure 8.
Relationship between long-term orientation of the country and W/inhabitant of photovoltaic capacity. Source: Authors’ own analysis.


Table 1.
Photovoltaic capacity in European Union countries in years 2014–2019 (MW).
| 2014 | 2015 | 2016 | 2017 | 2018 | 2019 | |
|---|---|---|---|---|---|---|
| Austria | 770 | 937 | 1077 | 1269 | 1437 | 1660 |
| Belgium | 3105 | 3252 | 3425 | 3610 | 3986 | 7530 |
| Bulgaria | 1020 | 1029 | 1032 | 1035 | 1032 | 1065 |
| Croatia | 34 | 45 | 50 | 60 | 67 | 69 |
| Cyprus | 51 | 51 | 55 | 110 | 118 | 128 |
| Czech Republic | 2047 | 2047 | 2075 | 2069 | 2075 | 2100 |
| Denmark | 601 | 786 | 858 | 906 | 995 | 1080 |
| Estonia | 0.2 | 7 | 10 | 10 | 31 | 107 |
| Finland | 10 | 15 | 20 | 74 | 140 | 215 |
| France | 5600 | 6605 | 7164 | 8610 | 9617 | 10,575 |
| Germany | 38,301 | 39,864 | 41,340 | 42,339 | 45,181 | 49,016 |
| Greece | 2602 | 2603 | 2603 | 2605 | 2645 | 2793 |
| Hungary | 38 | 175 | 288 | 355 | 726 | 1277 |
| Ireland | 1.1 | 2.1 | 5 | 16 | 24 | 36 |
| Italy | 18,450 | 18,905 | 19,274 | 19,682 | 20,107 | 20,864 |
| Latavia | 1.5 | 1.5 | 1.5 | 1.5 | 2 | 3 |
| Lithuania | 68 | 73 | 73 | 74 | 82 | 83 |
| Luxembourg | 110 | 116 | 122 | 132 | 130 | 140 |
| Malta | 54 | 74 | 82 | 112 | 131 | 150 |
| Netherlands | 1100 | 1515 | 2040 | 2903 | 4522 | 6924 |
| Poland | 24 | 111 | 195 | 287 | 562 | 1317 |
| Portugal | 419 | 465 | 470 | 585 | 667 | 907 |
| Romania | 1292 | 1302 | 1371 | 1374 | 1385 | 1385 |
| Slovakia | 540 | 540 | 545 | 545 | 472 | 472 |
| Slovenia | 210 | 239 | 259 | 246 | 221 | 221 |
| Spain | 4787 | 4773 | 4801 | 4725 | 5239 | 9232 |
| Sweden | 79 | 126 | 153 | 244 | 428 | 698 |
| United Kingdom | 5230 | 9187 | 11,562 | 12,783 | 13,118 | 13,616 |
| Total | 86,544.8 | 94,845.6 | 100,950.5 | 106,761.5 | 115,140 | 133,663 |
Table 2.
Photovoltaic capacity in European Union countries in years 2008–2003 (MW).
| 2008 | 2009 | 2010 | 2011 | 2012 | 2013 | |
|---|---|---|---|---|---|---|
| Austria | 0.5 | 0.6 | 2 | 2.9 | 49 | 1022 |
| Belgium | 57 | 68 | 97 | 118 | 321 | 739 |
| Bulgaria | 1 | 1 | 2 | 1.8 | 3.4 | 4.2 |
| Croatia | <0.1 | <0.1 | 0.1 | 0.1 | 6.1 | 68 |
| Cyprus | 6 | 8 | 10 | 11 | 11 | 11 |
| Czech Republic | 55 | 463 | 1953 | 1959 | 2022 | 2064 |
| Denmark | 3 | 5 | 7 | 16 | 391 | 572 |
| Estonia | 5.6 | 12 | 16 | 16 | 20 | 20 |
| Finland | 2 | 3 | 6 | 10 | 17 | 35 |
| France | 104 | 335 | 1054 | 2831 | 4027 | 4625 |
| Germany | 6019 | 9959 | 17,370 | 24,875 | 32,698 | 36,402 |
| Greece | 71 | 574 | 787 | 1812 | 2649 | 3040 |
| Hungary | 1 | 6 | 17 | 132 | 933 | 1019 |
| Ireland | 0.4 | 0.6 | 0.6 | 0.7 | 0.7 | 1 |
| Italy | 458 | 1157 | 3478 | 12,764 | 16,361 | 18,065 |
| Latavia | <0.1 | <0.1 | <0.1 | 1.5 | 1.5 | 1.5 |
| Lithuania | <0.1 | <0.1 | <0.1 | 0.2 | 0.2 | 0.2 |
| Luxembourg | 25 | 26 | 27 | 30 | 76 | 95 |
| Malta | 0.2 | 2 | 2 | 11 | 18 | 28 |
| Netherlands | 19 | 55 | 205 | 631 | 1543 | 2585 |
| Poland | <0.1 | 0.2 | 144 | 488 | 517 | 588 |
| Portugal | 0.5 | 0.7 | 2 | 4.1 | 3.7 | 35 |
| Romania | 32 | 53 | 103 | 173 | 421 | 631 |
| Slovakia | 68 | 102 | 131 | 143 | 228 | 303 |
| Slovenia | 2 | 9 | 36 | 90 | 217 | 248 |
| Spain | 3421 | 3438 | 3808 | 4214 | 4516 | 4766 |
| Sweden | 8 | 9 | 10 | 18 | 23 | 43 |
| United Kingdom | 23 | 30 | 75 | 1014 | 1657 | 2782 |
| Total | 10.38 | 15.86 | 29.33 | 51.36 | 68.64 | 79.79 |
Table 3.
European Union countries with maximum photovoltaic capacity in years 2014–2019.
| 2014 | 2015 | 2016 | 2017 | 2018 | 2019 | |
|---|---|---|---|---|---|---|
| First place | Germany | Germany | Germany | Germany | Germany | Germany |
| Second place | Italy | Italy | Italy | Italy | Italy | Italy |
| Third place | France | United Kingdom | United Kingdom | United Kingdom | United Kingdom | United Kingdom |
| Fourth place | United Kingdom | France | France | France | France | France |
| Fifth place | Spain | Spain | Spain | Spain | Spain | Spain |
Source: Authors’ own analysis.
Table 4.
Photovoltaic capacity installed in European Union countries in years 2015–2019 (MW).
| 2015 | 2016 | 2017 | 2018 | 2019 | |
|---|---|---|---|---|---|
| Austria | 167 | 140 | 192 | 168 | 223 |
| Belgium | 147 | 173 | 185 | 376 | 3544 |
| Bulgaria | 9 | 3 | 3 | −3 | 33 |
| Croatia | 11 | 5 | 10 | 7 | 2 |
| Cyprus | 0 | 4 | 55 | 8 | 10 |
| Czech Republic | 0 | 28 | −6 | 6 | 25 |
| Denmark | 185 | 72 | 48 | 89 | 85 |
| Estonia | 6.8 | 3 | 0 | 21 | 76 |
| Finland | 5 | 5 | 54 | 66 | 75 |
| France | 1005 | 559 | 1446 | 1007 | 958 |
| Germany | 1563 | 1476 | 999 | 2842 | 3835 |
| Greece | 1 | 0 | 2 | 40 | 148 |
| Hungary | 137 | 113 | 67 | 371 | 551 |
| Ireland | 1 | 2.9 | 11 | 8 | 12 |
| Italy | 455 | 369 | 408 | 425 | 757 |
| Latavia | 0 | 0 | 0 | 0.5 | 1 |
| Lithuania | 5 | 0 | 1 | 8 | 1 |
| Luxembourg | 6 | 6 | 10 | −2 | 10 |
| Malta | 20 | 8 | 30 | 19 | 19 |
| Netherlands | 415 | 525 | 863 | 1619 | 2402 |
| Poland | 87 | 84 | 92 | 275 | 755 |
| Portugal | 46 | 5 | 115 | 82 | 240 |
| Romania | 10 | 69 | 3 | 11 | 0 |
| Slovakia | 0 | 5 | 0 | −73 | 0 |
| Slovenia | 29 | 20 | −13 | −25 | 0 |
| Spain | −14 | 28 | −76 | 514 | 3993 |
| Sweden | 47 | 27 | 91 | 184 | 270 |
| United Kingdom | 3957 | 2375 | 1221 | 335 | 498 |
| Total | 8300.8 | 6104.9 | 5811 | 8378.5 | 18,523 |
Table 5.
European Union countries with maximum photovoltaic installed capacity in years 2015–2019.
| 2015 | 2016 | 2017 | 2018 | 2019 | |
|---|---|---|---|---|---|
| First palace | United Kingdom | United Kingdom | France | Germany | Germany |
| Second place | Germany | Germany | United Kingdom | Netherlands | Spain |
| Third place | France | France | Germany | France | Belgium |
| Fourth place | Italy | Netherlands | Netherlands | Spain | Netherlands |
| Fifth place | Netherlands | Italy | Italy | Italy | France |
Source: Authors’ own analysis.
Table 6.
Photovoltaic capacity in European Union countries per inhabitant in years 2014–2019 (W/inhabitant).
Table 6.
Photovoltaic capacity in European Union countries per inhabitant in years 2014–2019 (W/inhabitant).
| 2014 | 2015 | 2016 | 2017 | 2018 | 2019 | |
|---|---|---|---|---|---|---|
| Austria | 90.6 | 108.9 | 123.9 | 142.3 | 162.4 | 187.5 |
| Belgium | 272.2 | 286.7 | 203.8 | 338.4 | 373.2 | 395.5 |
| Bulgaria | 140.8 | 141.7 | 144.3 | 144.8 | 146.9 | 152.1 |
| Croatia | 8.1 | 10.6 | 12 | 12.4 | 14.9 | 16.9 |
| Cyprus | 75.5 | 82 | 64.7 | 123.1 | 130.9 | 146.9 |
| Czech Republic | 196.1 | 197.7 | 194 | 192.9 | 193 | 197.2 |
| Denmark | 106.9 | 138.3 | 150.4 | 158.3 | 173.3 | 186 |
| Estonia | 0.1 | 3.1 | 7.7 | 0 | 0 | 80.8 |
| Finland | 1.9 | 2.7 | 3.6 | 11.1 | 22.7 | 39 |
| France | 87.6 | 99.1 | 107.3 | 120.5 | 141.4 | 157.9 |
| Germany | 474.1 | 489.8 | 503.1 | 512 | 546.9 | 590.4 |
| Greece | 236.8 | 241.7 | 241.4 | 242.2 | 246.9 | 260.5 |
| Hungary | 3.9 | 14 | 29.3 | 37.6 | 77.1 | 130.7 |
| Ireland | 0.2 | 0.5 | 1.1 | 1.9 | 6 | 7.3 |
| Italy | 303.5 | 311.3 | 317.7 | 325 | 332.4 | 345.5 |
| Latavia | 0.8 | 0.8 | 0.8 | 0.7 | 0.5 | 1.3 |
| Lithuania | 23.1 | 25 | 27.7 | 28.8 | 26.3 | 29.7 |
| Luxembourg | 200 | 222 | 212.8 | 215 | 222.6 | 229 |
| Malta | 127.5 | 170.5 | 188.8 | 247.9 | 276 | 305.1 |
| Netherlands | 65.4 | 83.1 | 120.1 | 160.9 | 250.3 | 400.6 |
| Poland | 0.6 | 2.3 | 5.2 | 7.1 | 12.8 | 34.7 |
| Portugal | 40.2 | 44.3 | 45.4 | 55.2 | 65.2 | 88.3 |
| Romania | 64.8 | 66.7 | 69.4 | 70 | 70.5 | 71.4 |
| Slovakia | 109 | 109 | 100.5 | 98.1 | 97.6 | 86.6 |
| Slovenia | 124.2 | 124.8 | 125.5 | 124.9 | 123.9 | 106.7 |
| Spain | 102.9 | 106 | 103.4 | 109.8 | 101.8 | 196.7 |
| Sweden | 8.2 | 13.3 | 15.6 | 23.1 | 41.9 | 68.2 |
| United Kingdom | 81.3 | 137.7 | 176.8 | 193.9 | 197 | 204.3 |
| EU Average | 171.5 | 186.1 | 197.8 | 208.3 | 223.6 | 254.5 |
Table 7.
European Union countries with maximum photovoltaic capacity per inhabitant in years 2014–2019.
Table 7.
European Union countries with maximum photovoltaic capacity per inhabitant in years 2014–2019.
| 2014 | 2015 | 2016 | 2017 | 2018 | 2019 | |
|---|---|---|---|---|---|---|
| First place | Germany | Germany | Germany | Germany | Germany | Germany |
| Second place | Italy | Italy | Italy | Italy | Belgium | Netherlands |
| Third place | Belgium | Belgium | Greece | Belgium | Italy | Belgium |
| Fourth place | Greece | Greece | Luxembourg | Greece | Netherlands | Italy |
| Fifth place | Czech Republic | Czech Republic | Belgium | Malta | Greece | Malta |
Source: Authors’ own analysis.
Table 8.
Photovoltaic capacity installed in European Union Countries in years 2015–2019 per inhabitant (W/inhabitant).
Table 8.
Photovoltaic capacity installed in European Union Countries in years 2015–2019 per inhabitant (W/inhabitant).
| 2019 | 2018 | 2017 | 2016 | 2015 | |
|---|---|---|---|---|---|
| Austria | 25.1 | 20.1 | 18.4 | 15 | 18.3 |
| Belgium | 22.3 | 34.8 | 134.6 | −82.9 | 14.5 |
| Bulgaria | 5.2 | 2.1 | 0.5 | 2.6 | 0.9 |
| Croatia | 2 | 2.5 | 0.4 | 1.4 | 2.5 |
| Cyprus | 16 | 7.8 | 58.4 | −17.3 | 6.5 |
| Czech Republic | 4.2 | 0.1 | −1.1 | −3.7 | 1.6 |
| Denmark | 12.7 | 15 | 7.9 | 12.1 | 31.4 |
| Estonia | 80.8 | 0 | −7.7 | 4.6 | 3 |
| Finland | 16.3 | 11.6 | 7.5 | 0.9 | 0.8 |
| France | 16.5 | 20.9 | 13.2 | 8.2 | 11.5 |
| Germany | 43.5 | 34.9 | 8.9 | 13.3 | 15.7 |
| Greece | 13.6 | 4.7 | 0.8 | −0.3 | 4.9 |
| Hungary | 53.6 | 39.5 | 8.3 | 15.3 | 10.1 |
| Ireland | 1.3 | 4.1 | 0.8 | 0.6 | 0.3 |
| Italy | 13.1 | 7.4 | 7.3 | 6.4 | 7.8 |
| Latavia | 0.8 | −0.2 | −0.1 | 0 | 0 |
| Lithuania | 3.4 | −2.5 | 1.1 | 2.7 | 1.9 |
| Luxembourg | 6.4 | 7.6 | 2.2 | −9.2 | 22 |
| Malta | 29.1 | 28.1 | 59.1 | 18.3 | 43 |
| Netherlands | 150.3 | 89.4 | 40.8 | 37 | 17.7 |
| Poland | 21.9 | 5.7 | 1.9 | 2.9 | 1.7 |
| Portugal | 23.1 | 10 | 9.8 | 1.1 | 4.1 |
| Romania | 0.9 | 0.5 | 0.6 | 2.7 | 1.9 |
| Slovakia | −11 | −0.5 | −2.4 | −8.5 | 0 |
| Slovenia | −17.2 | −1 | −0.6 | 0.7 | 0.6 |
| Spain | 94.9 | −8 | 6.4 | −2.6 | 3.1 |
| Sweden | 26.3 | 18.8 | 7.5 | 2.3 | 5.1 |
| United Kingdom | 7.3 | 3.1 | 17.1 | 39.1 | 56.4 |
| EU average | 30.9 | 15.3 | 10.5 | 11.7 | 14.6 |
Table 9.
European Union countries with maximum photovoltaic installed capacity per capita in years 2015–2019.
Table 9.
European Union countries with maximum photovoltaic installed capacity per capita in years 2015–2019.
| 2015 | 2016 | 2017 | 2018 | 2019 | |
|---|---|---|---|---|---|
| First place | United Kingdom | Belgium | Netherlands | Netherlands | |
| Second place | United Kingdom | Malta | Malta | Hungry | Spain |
| Third place | Denmark | Hungary | Cyprus | Germany | Estonia |
| Fourth place | Austria | Germany | Netherlands | Belgium | Hungry |
| Fifth place | Netherlands | Denmark | United Kingdom | Malta | Germany |
Source: Authors’ own analysis.
Publisher’s Note: MDPI stays neutral with regard to jurisdictional claims in published maps and institutional affiliations. |
© 2022 by the authors. Licensee MDPI, Basel, Switzerland. This article is an open access article distributed under the terms and conditions of the Creative Commons Attribution (CC BY) license (https://creativecommons.org/licenses/by/4.0/).
Share and Cite
MDPI and ACS Style
Wolniak, R.; Skotnicka-Zasadzień, B. Development of Photovoltaic Energy in EU Countries as an Alternative to Fossil Fuels. Energies 2022, 15, 662. https://0-doi-org.brum.beds.ac.uk/10.3390/en15020662
AMA Style
Wolniak R, Skotnicka-Zasadzień B. Development of Photovoltaic Energy in EU Countries as an Alternative to Fossil Fuels. Energies. 2022; 15(2):662. https://0-doi-org.brum.beds.ac.uk/10.3390/en15020662
Chicago/Turabian StyleWolniak, Radosław, and Bożena Skotnicka-Zasadzień. 2022. "Development of Photovoltaic Energy in EU Countries as an Alternative to Fossil Fuels" Energies 15, no. 2: 662. https://0-doi-org.brum.beds.ac.uk/10.3390/en15020662
Note that from the first issue of 2016, this journal uses article numbers instead of page numbers. See further details here.