Article

Assessment of the Impact of Flow Changes and Water Management Rules in the Dam Reservoir on Energy Generation at the Jeziorsko Hydropower Plant

1
National Water Holding Polish Waters, Regional Water Management Board in Poznań, Chlebowa 4/8, 61-003 Poznań, Poland
2
Institute of Meteorology and Water Management—National Research Institute, Podleśna 61, 01-673 Warszawa, Poland
3
Department of Hydrology and Water Management, Adam Mickiewicz University, Krygowskiego 10, 61-680 Poznań, Poland
4
Department of Land Improvement, Environmental Development and Spatial Management, Poznań University of Life Sciences, Piątkowska 94E, 60-649 Poznań, Poland
*
Author to whom correspondence should be addressed.
Submission received: 19 September 2022 / Revised: 13 October 2022 / Accepted: 17 October 2022 / Published: 18 October 2022

Abstract

:
This paper presents the impact of flow changes in the Warta River and water management rules regarding the Jeziorsko dam reservoir on the energy production by the hydropower plant in the period 1995–2021. The Jeziorsko dam reservoir was built in 1986. It is the second largest dam reservoir in Poland in terms of surface area. In 1994, a hydropower plant with an installed capacity of 4.89 MW started operation. The study results show the average annual energy production from 1995 to 2021 at a level of 18,718 MWh. On the other hand, energy production largely changed from year to year, from 12,432 MWh (in 2019) to 26,916 MWh (in 2001). The droughts that have occurred in the Warta River basin over the past two decades have had a major impact on energy production. As a consequence of the drought, it was not possible to maintain the required water level in the reservoir. Moreover, a change in the rules for the reservoir’s management that led to lower water levels in the reservoir by 1.5 m between April and June was important from the point of view of energy production. Improving the efficiency of energy production requires changing the rules of water management in the reservoir. More flexible reservoir operation schemes should be considered, including operational management based on meteorological and hydrological forecasts. Moreover, other criteria should also be considered, such as maintaining environmental flows, ensuring protection from flooding, and operating a nature reserve around the reservoir.

Graphical Abstract

1. Introduction

The observed technological transformation has resulted in an increase in demand for energy [1]. Therefore, in addition to its current sources, new solutions are becoming popular, aimed at satisfying the dynamically developing situation and climatic goals. The fourth industrial revolution will accelerate the use of clean energy that will eventually replace conventional energy sources [2]. Alternative energy sources can be used as a substitute for fossil fuels, contributing to a decrease in the share of the latter in the general energy mix [3]. Globally, broad-based efforts are underway to reduce carbon emissions. Among the countries of the European Union, Poland is currently the largest emitter of greenhouse gases per resident [4], and coal is still used in more than 67% of energy production [5]. It is therefore justified to use solutions based on renewable energy sources here. Hydropower is one of the possible solutions.
Hydropower requires a relatively high initial investment but is characterized by a long period of operation with very low maintenance costs [6]. Hydropower projects are prone to various uncertainties and risks, including the following: economic, environmental, social, geological, regulatory, political, technological, financial, climatic, natural, and safety-related ones [7]. Nonetheless, hydropower still remains the dominant, affordable, and reliable source of energy on a global scale [8]. It accounts for more than 72% of the entire renewable electric energy globally [9]. According to Tefera and Kasiviswanathan [10], at the global scale, the theoretical potential of hydropower varies from 25.48 PWhyr−1 at 95% flow dependency to 184.17 PWhyr−1 at 30% flow dependency. Optimum future solutions assume the maximization of benefits from the use of hydropower with a simultaneous minimization of the impact on the environment through the revitalization of the existing infrastructure [11].
One of the most serious problems currently faced by humanity is the adaptation to conditions related to global warming [12], which affected virtually all areas of human activity. In the case of hydropower production, climate change may lead to a shift in the demand for electricity toward high-emission technologies [13]. As predicted by Hamududu and Killingtveit [14], in reference to the currently functioning hydropower system on a global scale, the production of hydropower will change to a very low degree by 2050. According to Wasti et al. [15], the effect of climate change on the hydropower sector is difficult to predict and is not globally uniform but rather dependent on local conditions. Approximately 65% of the current global power installed in hydropower plants will be exposed to the risk related to recurring high river flows. Up to 75% of the existing hydroelectric power in Europe, North America, and MENA is generated in areas where draughts are forecasted to be at least 10% longer [16]. In Europe, the development of hydropower production depends on the economic, political, and environmental conditions. This raises the need for an integrated approach that considers the requirements of sustainable development as well as research and innovations in the scope of hydropower generation [17]. The situation in Poland was analyzed by Kałuża et al. [18], pointing to the key barriers faced by the hydropower sector, among others, as follows: institutional (including the inappropriate structure of legal documents of the Polish system of support for renewable energy sources, inappropriate implementation of the obligation to consider green energy in the sold energy balance, as well as the lack of obligation to consider issues related to the management of the local renewable energy sources); social (including protests of residents blocking an investment due to concerns for the ecological effects, water quality, etc.); economic (return on investment), and climatic (decrease in river outflow). In this context, it is important to thoroughly investigate the functioning of the existing hydropower plants to determine the directions and rate of changes to date, particularly important in the times of dynamically changing climatic conditions.
The issues concerning hydropower production are analyzed in a complex manner for the entire sector or for a particular power plant [19]. The latter approach is implemented in this paper and refers to the Jeziorsko hydropower plant on the Warta River, the third largest river in Poland.
The study objective is the analysis of the effect of changes in river flows in Warta and changes in the schedule of water management on the Jeziorsko dam reservoir towards the production of electricity by the hydropower plant in the period 1995–2021.

2. Materials and Methods

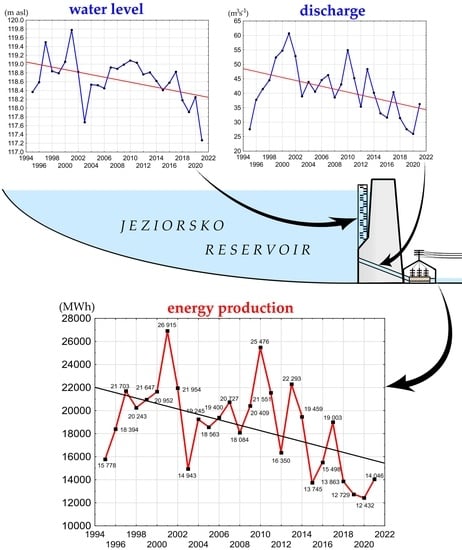
2.1. Study Site Description

The Jeziorsko reservoir is a lowland dam reservoir in the central part of Poland (Figure 1). It resulted from the construction of a dam embankment on the Warta River in its middle section. Warta is the third largest river in Poland (following the Vistula and Oder rivers of which it is the main tributary). Its length is 808 km, and total catchment area 54.5 thousand km2 (corresponding to approximately 17.4% of the territory of Poland).
The operation of the Jeziorsko dam reservoir commenced in 1986, and its complete range of damming was reached in 1992. The total catchment of the reservoir is 9012.6 km2, including a direct catchment area of 76.36 km2. Its length is approximately 19.4 km, and width reaches up to 3.5 km. At full banks, it reaches 37.73 km2 of surface area and 222.6 × 10⁶ m3 of volume. The maximum depth of the reservoir is approximately 12.0 m. The parameters of the reservoir, however, are subject to substantial changes depending on the level of its filling.
Since 29 August 2014 the operation of the reservoir is conducted according to the following schedule:
  • From 1 January to 31 January–maintenance of the damming level in the reservoir at a level of 116.00–116.30 m a.s.l.;
  • From 1 February to 15 April–filling the reservoir during the winter-spring river flooding, up to regular damming level of –120.00 m a.s.l.;
  • From 16 April to 15 September–maintenance of a constant damming level reached during filling the reservoir, but not higher than 120.00 m a.s.l.;
  • From 16 September to 31 December–gradual emptying of the reservoir, aimed at reaching a level of 116.0–116.30 m a.s.l. for the purpose of preparation for the spring flooding.
In previous years, a manual was binding that specified the ordinate of the regular damming level as 121.5 m a.s.l. (until 1998) and 120.50 m a.s.l. (until 2014), and the ordinate of the minimum damming level as 116.30 m a.s.l. (Table 1). They were reduced to the currently binding values after the summer flood from 2010 and the winter one from 2011 for the purpose of increasing the flood reserve of the reservoir.
The basic functions of the Jeziorsko reservoir include the following: flood protection of the middle Warta valley, water alimentation in the Warta River channel in low flow periods, and ensuring water for the purposes of energy production and cooling the nearby powerplant-industrial complex. The reservoir also fulfils the role of water reservoir for agricultural irrigations and offers the possibility of production of electricity at the hydropower plant on the right bank of Warta in the direct vicinity of the weir and dam embankment. It started operation in 1995. The functioning of the power plant is based on two Kaplan turbines with a rotor diameter of 2400 mm, with a maximum discharge for each of them of 35.0 m3s−1. The flow is possible to obtain at a regular damming level of 120.00 m a.s.l. The minimum energy production level for proper functioning of the power plant is 116.00 m a.s.l., and in the period of occurrence of ice phenomena 116.30 m a.s.l. Water for turbines is supplied by means of two steel pipelines with a diameter of 2800 mm. The maximum power of a single turbine is 2767 kW, and the rated power output possible to obtain in optimal conditions of water flow and damming of the reservoir is 1625 kW. The minimum power of a single turbine is 653 kW. The rated power output of the hydropower plant is 5.04 MWyear−1.

2.2. Materials

The study material are data on monthly electricity production in the period 1995–2021 by a hydropower plant on the Jeziorsko dam reservoir. The analysis of electricity production was conducted in the context of water level fluctuations in the reservoir. Water levels in the Jeziorsko reservoir were recorded with a frequency of once per day at 7.00 am. Moreover, the study employed data on mean daily water flows through the turbines of the power plant. The hydrological data concerning the Jeziorsko dam reservoir were provided by the State Water Holding Polish Waters (PGW WP). Due to the lack of data in 2003, a reconstruction of this characteristic was performed through conducting a multiple regression equation with the following independent variables: mean monthly energy production, water level in the reservoir, discharge from the reservoir through the weir, and mean monthly flows in hydrological station Uniejów below the dam of the Jeziorsko reservoir. Changes in energy production were determined depending on the hydrological factors and hydrotechnical parameters of the reservoir. The found correlation is statistically significant at a level of 0.01; the coefficient of determination is 0.89, and the average estimation error is 3.2 m3s−1. The operation of the reservoir is specified in the manual of water management that replicates the provisions resulting from the administrative decision. For the Jeziorsko dam reservoir in the area of its functioning, five manuals of water management from 1986, 1992, 1999, 2008, and 2014 have been binding. The manuals specify among others water levels in the reservoir that should be maintained within regular operating conditions during specified times (Table 1).
The determination of changes in water flows in the Warta River within the reservoir in the period 1995–2021 employed daily data on flows from two hydrological stations Sieradz and Uniejów. Hydrological station Sieradz is located on km 521.0 of the Warta River, above the Jeziorsko reservoir (Figure 1). Hydrological station Uniejów is located on km 470.3 of the Warta River, approximately 14 km below the dam. The dam of the Jeziorsko reservoir is located on km 484.3 of the Warta River. The analysis of changes in water flows was conducted in the context of monthly fluctuations of air temperatures and precipitation from climatological station Puczniew. Climatological station Puczniew is located approximately 25 km east of the Jeziorsko dam reservoir. The hydrological and meteorological data were provided by the Institute of Meteorology and Water Management–National Research Institute (IMGW-PIB). In the scope of its statutory activity, IMGW-PIB conducts measurements of water stages and flows in rivers, and meteorological measurements throughout Poland. The parameters of the Jeziorsko reservoir and hydropower plant were determined based on the design documentation and manual of water management from 2014 provided by PGW WP.

2.3. Methods

The first stage involved the analysis of changes in energy production by the hydropower plant on the Jeziorsko dam reservoir. The values of basic statistics were calculated for monthly and annual time intervals for the purpose of determination of the variability of this parameter in the years 1995–2021. It was followed by the analysis of directions and values of changes in energy production from a monthly and annual perspective. The analysis of directions of changes in energy production was conducted by means of a non-parametric Mann-Kendall test (MK) [20]. Most changes in energy production were analyzed by means of a non-parametric Sen test [21]. Due to the changes in the schedule of operation of the Jeziorsko dam reservoir in 1999, 2008, and 2014, it was verified whether the changes affected the energy production by the hydropower plant. For this purpose, the wild binary segmentation (WBS) method was applied, developed by Fryzlewicz [22]. In the WBS method, the detection of change points is carried out for randomly selected time intervals. In the WBS method, change point detection is performed for randomly selected subsegments. In the first step, the sample is randomly divided into subsegments, for which the cumulative sum statistic (CUSUM) is calculated. In the second step the largest CUSUM statistic for all subsegments is compared to a threshold value. When the largest CUSUM statistic exceeds the threshold value, a change point is detected. Finally, the data series based on detected change point is split into two subseries. The same procedure is applied to any subseries. In this way, the WBS method allows the detection of multiple change points, which is crucial in this study. The analysis of directions and magnitude of changes in energy production employed the modified MK package developed by Patakamuri et al. [23]. Change point detection was conducted using the WBS package developed by Baranowski and Fryzlewicz [24]. Statistical analyses were conducted at the assumed level of significance of 0.05 and 0.01. The analogical procedure was applied in the scope of statistical analysis of water flows in hydrological stations Sieradz and Uniejów, and analysis of water levels in the dam reservoir and water flows through the Jeziorsko power plant. The analysis was conducted for mean monthly and annual characteristics. The determination of changes in water deficits in the Warta River in the period 1995–2021 covered the calculation of durations of maintenance of flows below the flow with exceedance of 70% (Q70%). The flow value of Q70% for hydrological station Sieradz estimated based on daily water flows from the years 1995 to 2021 based on values obtained by IMGW-PIB is 29.2 m3s−1. The value is approximate to the maximum capacity of a single turbine in the Jeziorsko hydropower plant. The value of Q70% for hydrological station Uniejów in the period 1995–2021 is 32.4 m3s−1. The analysis of directions and magnitude of changes in air temperatures and precipitation aimed at placing the paper in the context of climate changes observed in that period. The determination of the directions and magnitude of changes in precipitation and air temperatures employed trend analysis. The study also searched for a dependency between the values of mean monthly water levels in the reservoir, water flows through the turbines of the power plant, and the amount of produced energy. In normal conditions of operation of the reservoir, water from the reservoir is drained through two pipelines of the power plant. The capacity of each of the pipelines reaches up to 35 m3s−1.

3. Results

Annual values of electricity production by the power plant on the Jeziorsko dam reservoir in the period 1995–2021 were at a level from 12,432 MWh in 2020 to 26,915 MWh in 2001. The mean annual electricity production was 18,718 MWh. In total, since the launch of the power plant, 505.4 GWh of electricity has been produced. The variability coefficient of annual energy production by the power plant is calculated as the ratio of the standard deviation and the average value is 19.9%. Monthly values of electricity production were at a level from 442 MWh to 2941 MWh. The highest values of energy production were obtained in April and May, and the lowest in January, February, November, and December (Figure 2).
In May, the average energy production was 2023 MWh, with a minimum and maximum value of 782 and 2941 MWh, respectively. In December, energy production averaged 1167 MWh. In the years 1995–2021, values of energy production in December varied from 481 to 2125 MWh. The variety coefficients of energy production by the power plant in particular months were in a range from 25.9% in May to 35.1% in July. The analysis of monthly and annual data on energy production by means of wild binary segmentation (wbs) showed the occurrence of change points in as many as 9 months. The highest number of change points was found in January (3 changes in 1998, 2011, and 2012), August (4 changes in 1999, 2002, 2010, and 2012), and December (5 changes in 1997, 2010, 2011, 2017, and 2018). In other months, single change points occurred in March (1998 and 2012), April (2014), June and July (2003), and October (2001 and 2002). In February, May, and September, no change points were identified. WBS showed one change point for annual values in 2014, associated with a change in the operation of the reservoir, i.e., the reduction of water level in the reservoir by 0.5 m in the period from 16 April to 15 September (Table 1).
The analysis of changes in annual values of electricity production in the years 1995–2021 by means of a Mann-Kendall test showed a decreasing trend. The value of Sen’s statistic, showing the slope of the trend line, is −304 MWh per year. The described trend showing a decrease in energy production is statistically significant at a level of 0.01 (Figure 3, Table 2). The analysis of changes in monthly values of electricity production pointed to a decreasing trend in the period from April to August. The changes varied from −24.5 MWh per year to −55.1 MWh per year. The aforementioned trends were statistically significant at a level of 0.05 in May and June, and significant at a level of 0.01 in April, July, and August. A decreasing trend in energy production by the Jeziorsko power plant was also observed in other months in a range from −3.5 to 27.9 MWh per year, although the changes are not statistically significant.
The amount of produced energy is directly related to the water level in the reservoir (height of decrease) and the amount of water flowing through the turbines. The course of mean monthly water levels in the dam reservoir in the period 1995–2021 is presented in Figure 4. The highest water levels in the reservoir were maintained in the period from April to July and the lowest in January and December. The way of operation of the reservoir and the variability of water flow in the Warta River affect the distribution of water levels on a daily, monthly, and annual scale. The course of mean monthly water levels corresponds with those specified in the manual of water management in the reservoir that should be maintained in regular operating conditions. The lowest variability of mean monthly water levels in the Jeziorsko reservoir occurred in the period from May to July (the variance coefficients averaged 11.4%). The highest fluctuations occurred in December (the variance coefficient was 46.6%). It was observed that mean monthly water levels in the reservoir in April, May, and June showed a left-side distribution. It results from the way of operation of the reservoir, which in that period a water level of 120 m a.s.l. should be maintained (until 2014, the water level was maintained at 120.5 m a.s.l.). Due to the lack of sufficient water supply, however, or the conducted renovation works within the dam embankment, it could not always be ensured. The opposite situation occurs in January, February, and December, where the distribution is right-sided. In these months, the water level should be maintained at a height from 116.0 to 116.3 m a.s.l., although periodically occurring floods during that time cause its exceedance.
The application of wild binary segmentation permitted the identification of change points in the set of mean monthly water levels. Only in December, the WBS method showed no occurrence of change points. In the remaining months, from 1 (October) to 4 (January, April, June, and September), change points occurred. Part of these points suggest changes in the way of operation of the reservoir in 1998/1999, 2008, and 2014, and the remaining ones point to a change in the course of climatic and hydrological conditions in the analyzed period. In April, May, and June 2014, the changes resulted from the change in the operation of the reservoir, i.e., the reduction of the water damming level from the ordinate of 120.5 to 120.0 m a.s.l. In 1998/1999, change points were recorded for January, August, and September, and in 2008/2009 in April. Moreover, change points usually occurred in 2002 (February, April, June, July, October, and November), 2003 (February, March, September), and 2011 (January and March).
The analysis of changes in average water levels in the reservoir showed a decreasing trend in all months (Table 3). In the period from April to July, a decreasing trend at a level of 0.01 occurred, and the values of the Sen’s coefficient varied from −0.037 to −0.045 m per year. In March, in the period from 1995 to 2021, an even greater decrease in the water level in the Jeziorsko reservoir occurred by approximately −0.06 m per year (a change significant at a level of 0.05). Moreover, in the remaining months, a decreasing trend occurred, although the changes were not statistically significant. Considering mean annual water levels in the Jeziorsko reservoir, a decrease also occurred in that scope, at a rate of −0.034 m per year. The trend is statistically significant at a level of 0.01 (Figure 5).
Mean monthly water flows through the turbines of the hydropower plant on the Jeziorsko dam reservoir varied from 16 m3s−1 to 71.2 m3s−1. The greatest water supply to the power plant occurred in April, averaging 45.2 m3s−1, and the lowest in June, averaging 34.4 m3s−1 (Figure 6). The range of changes in water flows through the power plant in particular months was at a level from 39.9 to 54.0 m3s−1 in January and June, respectively. The variance coefficients of water flows through the power plant vary from 22.6% in October to 41.3% in June. The analysis of water flows through the power plant by means of wild binary segmentation showed the occurrence of change points in 8 months. The highest number of change points occurred in June (5 change points in 2001, 2003, 2010, 2013, and 2014) and July (4 change points in 1997, 2003, 2009, and 2015). In the remaining months, 2 (4 times) or 1 change point occurred (2 times). In February and September, one change point occurred in 1998 and 2002, respectively. Two change points were recorded in March (1998 and 2012), April (1998 and 2014), August (2002 and 2012), and October (1996 and 2003). No changes occurred in January, May, November, or December. On the annual scale, wbs revealed two occurrences of change points—in 1999 and 2015.
The analysis of changes in mean monthly flows through the Jeziorsko hydropower plant showed a decreasing trend. The greatest changes in flows through the power plant occurred in April, July, and August when the value of the Sen’s slope varied from −1.201 to −1.090 m m3s−1. The changes are statistically significant at a level of 0.01 (Table 4). Moreover, significant changes in this parameter were observed in June, September, and October, and their value was −0.502, −0.927, and 0.587 m3s−1, respectively. They were changes significant at a level of 0.05. In the remaining months, a decreasing trend occurred. In January, changes in flows through the power plant were the smallest. The presented changes in monthly flows through the Jeziorsko power plant are reflected in the annual values. The analysis showed a decreasing trend of the value of the mean annual flow through the power plant, reaching −0.761 m3s−1, statistically significant at a level of significance of 0.01 (Figure 7).
A complex analysis of the causes of the decrease in energy production by the hydropower plant requires the analysis of water flows in hydrological stations below and above the dam reservoir. Mean annual flows in the Warta River above the Jeziorsko reservoir in hydrological station Sieradz varied from 26.4 m3s−1 in 2020 to 70.6 m3s−1 in 2001, averaging 42.9 m3s−1. The highest mean monthly flows in the hydrological station in Sieradz were recorded in March (average 61.7 m3s−1), and the lowest in August and September (average 31.3 and 31.1 m3s−1) (Figure 8a). In the analyzed period, the highest variability of mean monthly flows occurred in July (variance coefficient of 84.2%), and the lowest was in March (32.9%). Below the Jeziorsko reservoir, flows of the Warta River were at a somewhat higher level. Mean annual flows in hydrological station Uniejów in the period 1995–2021 varied from 28.5 to 74.9 m3s−1, averaging 46.1 m3s−1. Considering mean monthly flows, their distribution was observed to differ from that above the reservoir. The lowest values of mean monthly flows occurred in June (average of 40.1 m3s−1), and the highest was in January (average of 50.8 m3s1) (Figure 8b). In the analyzed period, the highest variability of mean monthly flows in station Uniejów occurred in July (variance coefficient 73.4%), and the lowest in October and November (30.1% and 30.4%, respectively). The comparison of various coefficients of flows above and below the dam reservoir revealed a greater variability of flows in hydrological station Sieradz in July, September, October, and November (differences higher than 5%). In January, February, March, and June, the variability of flows was at a higher level in the hydrological station Uniejów below the reservoir.
The analysis of mean annual flows in the period 1995–2021 in both hydrological stations showed a decreasing trend significant at a level of significance of 0.01. The Sen’s slope values reached −1.11 and −1.29 m3s−1 per year (Figure 9).
Considering mean monthly flows, most of them showed a decreasing trend in both hydrological stations. At hydrological station Sieradz, significant decreasing trends were identified in almost all months, with the exception of January, February, and May. The range of the changes is from −0.59 to −1.74 m3s−1 per year (Table 5). Moreover, in the hydrological station Uniejów, significant decreasing trends were observed in seven months, with the exception of January, February, May, October, and December. The range of changes in flows expressed by Sen’s slope varies from −0.68 to −1.71 m3s−1 per year.
Considering the number of days with flows below the threshold values of Q70%, an increasing trend was observed for the hydrological stations in Sieradz and Uniejów in the period 1995–2021 (Figure 10). At the hydrological station Sieradz, the number of days with flows below 29.2 increases from year to year at an average rate of 7.1 days per year. At the hydrological station Uniejów, the number of days with flows below the value of 32.4 increased even more, reaching approximately 8.5 days per year.
Changes in flows of the Warta River in hydrological stations Sieradz and Uniejów primarily result from the course of the climatic conditions. The analysis of air temperatures in station Puczniew in the years 1995–2021 showed an increasing tendency in all months except for May. In March, June, August, September, and December, the changes were statistically significant (Table S1). The range of air temperature changes was from 0.60 to 1.24 °C per decade. In January, February, April, June, October, and November, the changes varied from 0.42 to 0.58 °C per decade, although they were not statistically significant at a level of significance of 0.05. On the annual scale, an increasing trend occurred at a level of 0.58 °C per decade, statistically significant at a level of 0.05. Regarding precipitation, its monthly changes were not statistically significant (Table S1). The directions of its changes in particular months were also opposite. In January, June, August, September, October, and December, an increasing trend occurred in a range from 1 to 12 mm per decade, and in March, July, and November, a decreasing trend in a range from –2 to –12 mm per decade. No changes occurred in February or April. On the annual scale, a slight increasing trend of precipitation occurs at a level of 6 mm per decade. Similar study results showing a lack of statistically significant changes in the distribution of multiannual precipitation are also presented by analyses performed for the last 30-year period for synoptic stations in central Poland [25].
Finally, a correlation was searched for between monthly values of electricity production and water levels in the reservoir, water flows through the power plant, and products of water level in the reservoir and flow through the power plant (Figure 11 Time series of analyzed values from 1995 to 2021 are shown in Figure S1. The correlation analysis showed that energy production in subsequent months is correlated the strongest with the product of water level in the reservoir and flow through the power plant. The correlation is expected and obvious. The analysis of the individual effect of water level in the reservoir on electricity production suggests that this parameter is of greater importance than flow in January, October, November, and December. From March to September, flows have a greater effect on energy production by power plants. In those months, water in the reservoir is at a constant level (120.5 or 120 m a.s.l.), and the variable determines the production flow through the turbines of the power plant. In February, the effect of the water level in the reservoir and the flow through the power plant are at an approximate level. It is a month of launching of the process of filling the reservoir from a level of 116.3 to 120.0 m a.s.l. (earlier, until 2014, to a level of 120.5 m a.s.l.).
The directions of changes in electricity production in the context of changes in hydrological parameters are presented in Figure 12. All months evidently show a decreasing trend in hydrological parameters and electricity production by the hydropower plant on the Jeziorsko dam reservoir. An increasing trend in air temperatures is also evident, translating into an increase in the volume of evaporation and prolongation of the growing season, which, in the case of precipitation maintained at a comparable level, results in a decrease in the amount of surface water resources [26,27,28,29].

4. Discussion

The awareness of care for the environment, both for our comfort of life and for future generations, is becoming increasingly widespread. Such an approach is accompanied by the popularization of a number of new solutions or expanding the currently existing ones, also regarding the energy sector. In that area, the main focus is put on limiting greenhouse gas production, aimed at obtaining zero emissions. In the case of Poland, according to simulations by Li et al. [30], obligations regarding a decrease in the share of carbon in energy production by 2030 will be met. The implementation of these postulates requires a considerable transformation of energy production, currently based on carbon. Consideration of renewable energy sources is becoming increasingly important, and although the direction of such activities is fully justified, the implementation of the set assumptions poses a number of difficulties. One of the important issues concerns the instability of the production of “clean” energy, which is determined by natural conditions. It is confirmed by results obtained in the paper, revealing a trend for the diminishment of water resources. Due to their direct and indirect dependency on climatic variables, renewable energy sources will be exposed to the impact of changes in that scope [31]. Global warming will directly affect the quality and quantity of water resources, constituting important factors for the hydropower production potential [32]. One of the factors sensitive to climate change in hydropower plants is the value of the input flow to the reservoir [33]. The obtained results confirm the aforementioned concerns regarding hydropower production, where its successive decrease results from the unfavorable meteorological-hydrological situation observed in the analyzed multiannual period. In the conditions of statistically non-significant changes in the course of precipitation totals, an increase in air temperatures is of key importance. It contributes to greater losses due to evaporation and, consequently, a decrease in river alimentation. Moreover, water that reaches Warta from the catchment area is subject to more intensive evaporation from the surface of the reservoir due to higher temperatures [34].
According to Kim et al. [35], the forecasted changes in inflow to reservoirs and the potential for hydropower production are divergent in time, whereas extreme situations will intensify, resulting in high sensitivity of the catchment to climate and uncertainty in the scope of supply of the system and energy production potential. In the case of the Bamboi catchment, a decrease in the production of hydropower is forecasted by 9.1% (2020–2049) and 8.4% (2070–2099). It results from an increase in discharge in the rainy season (that cannot be transformed into hydropower) in combination with a decrease in the discharge in dry months [36]. According to Rončák et al. [37], the hydropower potential of small, flow-through, and retention hydropower plants is strongly related to the distribution of outflow over the year and therefore may contribute to not only a complete change in outflow but also changes in its distribution in the future. Forecasts of changes in water flow presented by van Vliet et al. [38] in reference to the area analyzed in the paper showed a relatively stable distribution (changes from −5 to 5%), but also a situation of its evident decrease (changes from −20 to −40%), and both forecasts depend on the assumed scenario of climate change. The results obtained for the Tremorgio hydropower plant (Switzerland) suggest that climate change will modify the seasonality of inflows and volumes used for the production of hydropower. Importantly, adaptation strategies in the management of reservoirs may minimize losses/maximize profits [39]. Low flow is an increasingly serious problem, although reservoirs can be used to mitigate the negative effect on water supply in dry periods [40]. In the case of the Warta catchment, even carefully designed hydrotechnical structures offer no guarantee for the stabilization of water circulation, as confirmed by the example of Lake Powidzkie [41]. These findings help increase awareness of the complicated situation in the context of conducting proper management of the Jeziorsko reservoir and, consequently, the existing power plant. One of the primary objectives of the construction of the reservoir analyzed in the paper was shaping water resources through control of water flow in the scope of low and high flows [42], and in the later period (eight years after the launch of the dam), the activity was extended by energy production. The successively worsening hydrological situation in the Warta catchment is a threat to the multifunctionality of the reservoir, and the operation of the hydropower plant (due to other priorities assumed from the beginning of its existence) is primarily threatened with a decrease in efficiency. It is therefore a broader problem of a decrease in the share of energy production from renewable sources in the context of climate change. For example, research conducted for three reservoirs in Canada showed that the reliability of hydropower will decrease by more than 50% from the perspective of future climate change [43]. It should generally be emphasized that the relations of renewable energy sources with climate change leads to a feedback effect; i.e., climate changes destabilizes the production of clean energy, which increases the use of fossil fuels, and their combustion contributes to global warming.
Shu et al. [44] discuss two strategies for mitigation of the effect of climate change on hydropower production. One of them involves an increase in the share of hydropower as renewable energy (a decrease in the emission of greenhouse gases), and the other is based on the optimization of the operation and management of hydropower plants. In this context, it is necessary to conduct more detailed research in the Warta River catchment, where, in accordance with the obtained results, the effects of climate change on the course of hydrological processes are increasingly evident. Complex and accurate assessment of all components shaping water flow in the river (both natural and artificial) will permit appropriate management of hydropower production, also contributing to the implementation of the international obligations declared by Poland. In times of climate change, investment in the development of knowledge is recommended to make enterprises, institutions, and even states resistant to the upcoming transformations [45]. According to earlier research [46] in the territory of Poland (Nysa Łużycka) regarding risk analysis related to the effect of climate changes on water resources and hydropower production, similar directions of activities for the analyzed area can be pointed out. For the purpose of mitigating the effect of climate change on water resources, Adynkiewicz-Piragas and Miszuk [46] recommend, among others, the following: analysis of legal regulations and their adaptations, water retention and sustainable use of water resources, changes in river valleys (creating buffer zones, reclamation of valleys and channels), amendments to strategic documents of self-governments (taking into consideration the aspect of climate change and its effect on residents and the economy), and an increase in awareness in the scope of present and future water resources (provision of information to residents and local authorities). It should be emphasized that in the case of the Warta River catchment, a program to increase retention through the construction of new hydrotechnical facilities and the modernization of older ones—often failing to meet the original objectives of their operation—is being successfully implemented.

5. Conclusions

Energy production by the hydropower plant on the Jeziorsko dam reservoir was characterized by high variability on the multiannual and annual scales. Extreme annual values of energy production in the years 1995–2021 differed by more than twice. Monthly variability on the annual scale was even greater, and changes in the volume of energy production on the multiannual scale differed even four-fold. The research showed a decreasing trend in energy production. Significant decreases in energy production were determined for annual and monthly time intervals from April to September. Changes in energy production were primarily determined by a decrease in flows of the Warta River. As many as 9 months showed a significant decreasing trend. A decrease in the flow of the Warta River translated into a limited possibility of maintenance of the assumed water levels in the Jeziorsko dam reservoir, resulting from the water management schedule. A decrease in water levels in the reservoir in subsequent months and a decrease in water flows through the turbines of the power plant affected electricity production. A factor limiting energy production in January, October, November, and December was the water level in the reservoir. In the period from March to September, it was water flow. The analysis showed that climatic factors largely determined energy production, particularly through a decrease in the flows of the Warta River. Particularly evident decreases in energy production have occurred over the last 10 years. Another factor determining energy production was changes in the rules of water management in the reservoir, and particularly a change in the water damming levels in the reservoir and periods of their maintenance. According to the obtained results, flow-through power plants at dam reservoirs are subject to pressure resulting from climate change. The water management in the reservoir is carried out according to certain rules. Adverse climate changes translate into the more frequent occurrence of low flows in Warta and the inability to achieve the normal damming level. As a result, a further downward trend in energy production will also continue. A way to counteract this process could be to change the manual of water management, which would give the possibility of more flexible and effective water management, especially during the summer. Appropriate rules enable the interception of larger amounts of water in the reservoir during periods of its surplus and use in times of shortages. This would allow for the elimination of unproductive discharges through the weir. The administration of the Jeziorsko reservoir plans to change the manual water management based on the conducted research. Future research should focus on the optimization of the rules of water management, with consideration of both the conditions of flood safety, droughts occurring with greater frequency, and the needs of the nature reserve established on the reservoir in the context of the observed changes in climatic conditions. It is important to consider more flexible operating rules for the reservoir, including operational management based on meteorological and hydrological forecasts. Addressing these issues is important from the point of view of energy sector transformations in Poland resulting from the implementation of the European Green New Deal and Fit for 55 package.

Supplementary Materials

The following supporting information can be downloaded at: https://0-www-mdpi-com.brum.beds.ac.uk/article/10.3390/en15207695/s1, Figure S1: Monthly changes in energy production (a), water levels in the Jeziorsko dam reservoir (b), water flows through the hydropower plant, and at the Sieradz and Uniejów hydrological stations (c), air temperature (d) and precipitation (d) from 1995 to 2021; Table S1: Changes in air temperature and precipitation in station Puczniew in the period 1995–2021.

Author Contributions

Conceptualisation, M.S.; methodology, M.S.; software, M.S.; validation, M.S., M.P. and B.N.; formal analysis, M.S.; investigation, M.S.; resources, B.N.; data curation, B.N., A.A. and G.F.; writing—original draft preparation, M.S., M.P. and B.N.; writing—review and editing, M.S., M.P., B.N. and A.A.; visualisation, M.S., B.N. and A.A.; supervision, M.S.; project administration, M.S.; funding acquisition, M.S. All authors have read and agreed to the published version of the manuscript.

Funding

This research received no external funding.

Data Availability Statement

Not applicable.

Conflicts of Interest

The authors declare no conflict of interest.

References

  1. Apata, O.; Adebayo, A.V.; Ainah, P.K. Renewable energy systems and the fourth industrial revolution. In Proceedings of the 2021 IEEE PES/IAS PowerAfrica, Nairobi, Kenya, 23–27 August 2021; pp. 1–5. [Google Scholar] [CrossRef]
  2. He, P.; Ni, X. Renewable Energy Sources in the Era of the Fourth Industrial Revolution: A Perspective of Civilization Development. J. Phys. Conf. Ser. 2022, 2301, 012030. [Google Scholar] [CrossRef]
  3. Nasiri, E.; Rocha-Meneses, L.; Inayat, A.; Kikas, T. Impact of Policy Instruments in the Implementation of Renewable Sources of Energy in Selected European Countries. Sustainability 2022, 14, 6314. [Google Scholar] [CrossRef]
  4. Bórawski, P.; Wyszomierski, R.; Bełdycka-Bórawska, A.; Mickiewicz, B.; Kalinowska, B.; Dunn, J.W.; Rokicki, T. Development of Renewable Energy Sources in the European Union in the Context of Sustainable Development Policy. Energies 2022, 15, 1545. [Google Scholar] [CrossRef]
  5. Mazurek-Czarnecka, A.; Rosiek, K.; Salamaga, M.; Wąsowicz, K.; Żaba-Nieroda, R. Study on Support Mechanisms for Renewable Energy Sources in Poland. Energies 2022, 15, 4196. [Google Scholar] [CrossRef]
  6. Killingtveit, Å. Hydroelectric power. In Future Energy: Improved, Sustainable and Clean Options for Our Planet; Elsevier: Amsterdam, The Netherlands, 2020; pp. 315–330. [Google Scholar]
  7. Shaktawat, A.; Vadhera, S. Risk management of hydropower projects for sustainable development: A review. Environ. Dev. Sustain. 2021, 23, 45–76. [Google Scholar] [CrossRef]
  8. Larosa, F.; Rickman, J.; Ameli, N. Finding the right partners? Examining inequalities in the global investment landscape of hydropower. Glob. Environ. Chang. 2022, 74, 102518. [Google Scholar]
  9. Gernaat, D.E.H.J.; Bogaart, P.W.; Vuuren, D.P.V.; Biemans, H.; Niessink, R. High-resolution assessment of global technical and economic hydropower potential. Nat. Energy 2017, 2, 821–828. [Google Scholar] [CrossRef] [Green Version]
  10. Tefera, W.M.; Kasiviswanathan, K.S. A global-scale hydropower potential assessment and feasibility evaluations. Water Resour. Econ. 2022, 38, 100198. [Google Scholar] [CrossRef]
  11. Garrett, K.; McManamay, R.A.; Wang, J. Global hydropower expansion without building new dams. Environ. Res. Lett. 2021, 16, 114029. [Google Scholar] [CrossRef]
  12. Ptak, M.; Sojka, M.; Kozłowski, M. The increasing of maximum lake water temperature in lowland lakes of central Europe: Case study of the Polish Lakeland. Ann. De Limnol. 2019, 55, 6. [Google Scholar] [CrossRef]
  13. Turner, S.W.D.; Hejazi, M.; Kim, S.H.; Clarke, L.; Edmonds, J. Climate impacts on hydropower and consequences for global electricity supply investment needs. Energy 2017, 141, 2081–2090. [Google Scholar] [CrossRef]
  14. Hamududu, B.; Killingtveit, A. Assessing climate change impacts on global hydropower. Energies 2012, 5, 305–322. [Google Scholar] [CrossRef] [Green Version]
  15. Wasti, A.; Ray, P.; Wi, S.; Folch, C.; Ubierna, M.; Karki, P. Climate change and the hydropower sector: A global review. Wiley Interdiscip. Rev. Clim. Chang. 2022, 13, e757. [Google Scholar] [CrossRef]
  16. Paltán, H.A.; Pant, R.; Plummer Braeckman, J.; Dadson, S.J. Increased water risks to global hydropower in 1.5 °C and 2.0 °C Warmer Worlds. J. Hydrol. 2021, 599, 126503. [Google Scholar]
  17. Wagner, B.; Hauer, C.; Habersack, H. Current hydropower developments in Europe. Curr. Opin. Environ. Sustain. 2019, 37, 41–49. [Google Scholar] [CrossRef]
  18. Kałuża, T.; Hämmerling, M.; Zawadzki, P.; Czekała, W.; Kasperek, R.; Sojka, M.; Mokwa, M.; Ptak, M.; Szkudlarek, A.; Czechlowski, M.; et al. The hydropower sector in Poland: Actual state and the outlook for the future. Renew. Sustain. Energy Rev. 2022, 163, 112500. [Google Scholar] [CrossRef]
  19. Gaudard, L.; Romerio, F. The future of hydropower in Europe: Interconnecting climate, markets and policies. Environ. Sci. Policy 2014, 37, 172–181. [Google Scholar] [CrossRef]
  20. Kendall, M.G.; Stuart, A. The Advanced Theory of Statistics; Hafner Publising Company: New York, NY, USA, 1966. [Google Scholar]
  21. Gilbert, R.O. Statistical Methods for Environmental Pollution Monitoring; John Wiley and Sons: New York, NY, USA, 1987. [Google Scholar]
  22. Fryzlewicz, P. Wild binary segmentation for multiple change-point detection. Ann. Stat. 2014, 42, 2243–2281. [Google Scholar] [CrossRef]
  23. Patakamuri, S.K.; O’Brien, N.; Muthiah, K. Modified Versions of Mann Kendall and Spearman’s Rho Trend Tests; Version 1.6. 2020. Available online: https://cran.r-project.org/web/packages/modifiedmk/modifiedmk.pdf (accessed on 1 September 2022).
  24. Baranowski, R.; Fryzlewicz, P. Multiscale autoregression on adaptively detected timescales. In Proceedings of the 12th International Conference of the ERCIM WG on Computational and Methodological Statistics, London, UK, 14–16 December 2019. [Google Scholar]
  25. Bulletin of the National Hydrological and Meteorological Service; Pawelec, W.; Pietrzykowska, A.; Wereski, S. (Eds.) The Institute of Meteorology and Water Management—National Research Institute: Warszawa, Poland, 2022. [Google Scholar]
  26. Kędziora, A. Water balance of Konin strip mine land scape in changing climatic conditions. Rocz. Glebozn. 2008, 59, 104–118, (In Polish with English summary). [Google Scholar]
  27. Kędziora, A. Climatic conditions and water balance of the Kujawy Lakeland. Rocz. Glebozn. 2011, 62, 189–203, (In Polish with English summary). [Google Scholar]
  28. Choiński, A.; Ławniczak, A.; Ptak, M. Changes in water resources of Polish lakes as influenced by natural and anthropogenic factors. Pol. J. Environ. Stud. 2016, 25, 1883–1890. [Google Scholar] [CrossRef]
  29. Nowak, B.; Przybyłek, J. Recharge and drainage of lakes in Powidzki Landscape Park in the conditions of increased anthropogenic and environmental pressure (Central-Western Poland). Geol. Q. 2020, 64, 205–219. [Google Scholar] [CrossRef]
  30. Li, Y.; Zhang, H.; Kang, Y. Will Poland fulfill its coal commitment by 2030? An answer based on a novel time series prediction method. Energy Rep. 2020, 6, 1760–1767. [Google Scholar]
  31. Skoulikaris, C. Run-of-river small hydropower plants as hydro-resilience assets against climate change. Sustainability 2021, 13, 14001. [Google Scholar] [CrossRef]
  32. Nonki, R.M.; Lenouo, A.; Tchawoua, C.; Lennard, C.J.; Amoussou, E. Impact of climate change on hydropower potential of the Lagdo dam, Benue River Basin, Northern Cameroon. Proc. Int. Assoc. Hydrol. Sci. 2021, 384, 337–342. [Google Scholar] [CrossRef]
  33. Huangpeng, Q.; Huang, W.; Gholinia, F. Forecast of the hydropower generation under influence of climate change based on RCPs and Developed Crow Search Optimization Algorithm. Energy Rep. 2021, 7, 385–397. [Google Scholar] [CrossRef]
  34. Ptak, M.; Sojka, M.; Kałuża, T.; Choiński, A.; Nowak, B. Long-term water temperature trends of the Warta River in the years 1960–2009. Ecohydrol. Hydrobiol. 2019, 19, 441–451. [Google Scholar] [CrossRef]
  35. Kim, S.J.; Asadzadeh, M.; Stadnyk, T.A. Climate change impact on water supply and hydropower generation potential in Northern Manitoba. J. Hydrol. Reg. Stud. 2022, 41, 101077. [Google Scholar] [CrossRef]
  36. Mutsindikwa, T.C.; Yira, Y.; Bossa, A.Y.; Hounkpè, J.; Salack, S.; Saley, I.A.; Rabani, A. Modeling climate change impact on the hydropower potential of the Bamboi catchment. Model. Earth Syst. Environ. 2021, 7, 2709–2717. [Google Scholar]
  37. Rončák, P.; Šurda, P.; Vitková, J. The impact of climate change on the hydropower potential: A case study from topľa River Basin. Acta Hydrol. Slovaca 2021, 22, 22–29. [Google Scholar]
  38. Van Vliet, M.T.H.; van Beek, L.P.H.; Eisner, S.; Flörke, M.; Wada, Y.; Bierkens, M.F.P. Multi-model assessment of global hydropower and cooling water discharge potential under climate change. Glob. Environ. Chang. 2016, 40, 156–170. [Google Scholar] [CrossRef]
  39. Ranzani, A.; Bonato, M.; Patro, E.R.; Gaudard, L.; De Michele, C. Hydropower Future: Between Climate Change, Renewable Deployment, Carbon and Fuel Prices. Water 2018, 10, 1197. [Google Scholar] [CrossRef] [Green Version]
  40. Olabiwonnu, F.O.; Bakken, T.H.; Anthony, B. Achieving sustainable low flow using hydropower reservoir for ecological water management in Glomma River Norway. Sustain. Water Resour. Manag. 2022, 8, 53. [Google Scholar] [CrossRef]
  41. Nowak, B.; Ptak, M. Natural and anthropogenic conditions of water level fluctuations in lakes—Powidzkie Lake case study (Central-Western Poland). J. Water Land Dev. 2019, 40, 13–25. [Google Scholar] [CrossRef]
  42. Water Management Instruction. Jeziorsko Reservoir; Regional Water Management Board: Poznań, Poland, 2014. (In Polish) [Google Scholar]
  43. Mandal, S.; Arunkumar, R.; Breach, P.A.; Simonovic, S.P. Reservoir Operations under Changing Climate Conditions: Hydropower-Production Perspective. J. Water Resour. Plan. Manag. 2019, 145, 04019016. [Google Scholar] [CrossRef]
  44. Shu, J.; Qu, J.J.; Motha, R.; Xu, J.C.; Dong, D.F. Impacts of climate change on hydropower development and sustainability: A review. IOP Conf. Ser. Earth Environ. Sci. 2018, 163, 012126. [Google Scholar] [CrossRef]
  45. Nakayama, P.K.T.; Mustafá, A.L. Hydropower plants and the climate change: Impacts and actions. CIGRE 2016, 46, 135990. [Google Scholar]
  46. Adynkiewicz-Piragas, M.; Miszuk, B. Risk Analysis Related to Impact of Climate Change on Water Resources and Hydropower Production in the Lusatian Neisse River Basin. Sustainability 2020, 12, 5060. [Google Scholar] [CrossRef]
Figure 1. Location of the study object.
Energies 15 07695 g001
Figure 2. Monthly changes in energy production by the Jeziorsko hydropower plant.
Energies 15 07695 g002
Figure 3. Direction of annual changes in electricity production by the Jeziorsko hydropower plant in the period 1995–2021.
Energies 15 07695 g003
Figure 4. Distribution of mean monthly water levels in the Jeziorsko reservoir.
Energies 15 07695 g004
Figure 5. Changes in mean annual water levels in the Jeziorsko reservoir in the period 1995–2021.
Energies 15 07695 g005
Figure 6. Mean monthly water flows through the hydropower plant on the Jeziorsko reservoir in the period 1995–2021.
Energies 15 07695 g006
Figure 7. Changes in mean annual water flows through the Jeziorsko hydropower plant in the period 1995–2021.
Energies 15 07695 g007
Figure 8. Changes in mean monthly water flows in hydrological stations Sieradz (a) and Uniejów (b) in the period 1995–2021.
Energies 15 07695 g008
Figure 9. Changes in mean annual water flows in hydrological stations Sieradz and Uniejów in the period 1995–2021.
Energies 15 07695 g009
Figure 10. Changes in the durations of flows below the value of Q70% in the Warta River in hydrological stations Sieradz and Uniejów in the years 1995–2021.
Energies 15 07695 g010
Figure 11. Analysis of the correlation coefficient between energy production by the Jeziorsko hydropower plant and selected hydrological parameters.
Energies 15 07695 g011
Figure 12. Directions of changes in energy production in the Jeziorsko hydropower plant and climatic and hydrological parameters.
Energies 15 07695 g012
Table 1. Dates and damming levels of the Jeziorsko reservoir.
Date/Damming m a.s.l.
22 October 199223 December 199829 October 200829 August 2014
Filling1 February–15 April
From 116.3 to 121.5
1 February–15 April
From 116.3 to 120.5
1 February–15 April
From 116.3 to 120.5
1 February–15 April
From 116.3 to 120.0
Maintenance of the obtained damming level16 April–30 June
121.5
16 April–30 June
120.5
16 April–30 June
120.5
16 April–15 September
120.0
Adjustment of the water level1 July–30 November
121.5–116.3
1 July–30 November
120.5–116.3
1 July–31 December
116.3–120.5
16 September–31 December
116.3–120.0 m
Maintenance of the obtained damming level1 December–31 January
116.0–116.3
1 December–31 January
116.0–116.3
1 January–31 January
116.0–116.3
1 January–31 January
116.0–116.3
Table 2. Changes in monthly and annual values of energy production by the Jeziorsko hydropower plant in the period 1995–2021.
PeriodSZ-ValueSen’s Slope
(MWh)
p-Value
January−29−0.62−3.50.537
February−29−0.62−8.40.537
March−75−1.63−27.90.103
April−143−3.13−43.40.002 **
May−93−2.03−24.50.043 *
June−117−2.56−28.70.011 *
July−181−3.97−55.10.000 **
August−141−3.09−47.00.002 **
September−55−1.19−20.70.234
October−43−0.93−9.00.355
November−31−0.66−10.40.508
December−41−0.88−8.60.378
Year−151−3.31−303.80.001 **
*—significant at a level of 0.05, **—significant at a level of 0.01.
Table 3. Changes in mean monthly and annual water levels in the Jeziorsko reservoir in the period 1995–2021.
PeriodSZ-ValueSen’s Slope
(m)
p-Value
January−87−1.90−0.0190.058
February−55−1.19−0.0330.234
March−105−2.29−0.0670.022 *
April−177−3.88−0.0450.000 **
May−168−3.68−0.0370.000 **
June−165−3.61−0.0370.000 **
July−122−2.67−0.0430.008 **
August−41−0.88−0.0220.378
September190.400.0120.692
October−10.00−0.0021.000
November−35−0.75−0.0210.454
December−47−1.01−0.0150.311
Year−129−2.82−0.0340.005 **
*—significant at a level of 0.05, **—significant at a level of 0.01.
Table 4. Changes in mean monthly and annual flows through the Jeziorsko hydropower plant in the period 1995–2021.
PeriodSZ-ValueSen’s Slope
(m3s−1)
p-Value
January−11−0.22−0.0720.826
February−41−0.88−0.3770.378
March−87−1.90−0.6810.058
April−121−2.64−1.1220.008 **
May−85−1.85−0.6320.064
June−95−2.07−0.5020.038 *
July−193−4.23−1.0900.000 **
August−169−3.70−1.2010.000 **
September−115−2.51−0.9270.012 *
October−99−2.16−0.5870.031 *
November−77−1.68−0.5530.094
December−81−1.76−0.5750.078
Year−173−3.79−0.7610.000 **
*—significant at a level of 0.05, **—significant at a level of 0.01.
Table 5. Changes in mean monthly and annual water flows in hydrological stations Sieradz and Uniejów in the period 1995–2021.
SieradzUniejów
PeriodSZ-ValueSen’s Slope
(m3s−1)
p-ValueSZ-ValueSen’s Slope
(m3s−1)
p-Value
January−55−1.19−0.4950.234−25−0.53−0.3380.597
February−65−1.41−0.9020.158−75−1.63−0.9450.103
March−163−3.57−1.7420.000 **−107−2.34−1.4900.019 *
April−173−3.79−1.1020.000 **−149−3.26−1.7100.001 **
May−89−1.94−0.7340.052−83−1.81−0.8400.071
June−145−3.17−0.5860.002 **−129−2.82−0.6750.005 **
July−147−3.22−1.0590.001 **−201−4.41−1.4590.000 **
August−133−2.91−0.7170.004 **−191−4.19−1.3910.000 **
September−115−2.51−0.6550.012 *−119−2.60−0.8390.009 **
October−121−2.64−0.6920.008 **−83−1.81−0.6320.071
November−129−2.82−0.9470.005 **−93−2.03−0.7480.043 *
December−105−2.29−0.6310.022 *−81−1.76−0.7190.078
Year−179−3.92−1.1060.000 **−175−3.84−1.2890.000 **
*—significant at a level of 0.05, **—significant at a level of 0.01.
Publisher’s Note: MDPI stays neutral with regard to jurisdictional claims in published maps and institutional affiliations.

