Article

Effect of Temperature on Energy Consumption and Polarization in Reverse Osmosis Desalination Using a Spray-Cooled Photovoltaic System

by
María Magdalena Armendáriz-Ontiveros
,
Germán Eduardo Dévora-Isiordia
*,
Jorge Rodríguez-López
,
Reyna Guadalupe Sánchez-Duarte
,
Jesús Álvarez-Sánchez
,
Yedidia Villegas-Peralta
and
María del Rosario Martínez-Macias
Departamento de Ciencias del Agua y Medio Ambiente, Instituto Tecnológico de Sonora, 5 de Febrero 818 Sur, Ciudad Obregón 85000, Sonora, Mexico
*
Author to whom correspondence should be addressed.
Submission received: 30 September 2022 / Revised: 10 October 2022 / Accepted: 11 October 2022 / Published: 20 October 2022

Abstract

:
Reverse osmosis (RO) desalination is considered a viable alternative to reduce water scarcity; however, its energy consumption is high. Photovoltaic (PV) energy in desalination processes has gained popularity in recent years. The temperature is identified as a variable that directly affects the behavior of different parameters of the RO process and energy production in PV panels. The objective of this study was to evaluate the effect of temperature on energy consumption and polarization factor in desalination processes at 20, 23, 26 and 30 °C. Tests were conducted on a RO desalination plant driven by a fixed 24-module PV system that received spray cooling in the winter, spring and summer seasons. The specific energy consumption was lower with increasing process feed temperature, being 4.4, 4.3, 3.9 and 3.5 kWh m−3 for temperatures of 20, 23, 26 and 30 °C, respectively. The water temperature affected the polarization factor, being lower as the temperature increased. The values obtained were within the limits established as optimal to prevent the formation of scaling on the membrane surface. The spray cooling system was able to decrease the temperature of the solar cells by about 6.2, 13.3 and 11.5 °C for the winter, spring and summer seasons, respectively. The increase in energy production efficiency was 7.96–14.25%, demonstrating that solar cell temperature control is a viable alternative to improve power generation in solar panel systems.

1. Introduction

Access to clean freshwater is a fundamental necessity for the development of any civilization [1]. Around 97% of the earth’s water contains high levels of salinity and is found in oceans, seas, and lakes, while the remaining 3% is considered fresh water, and much of it is frozen in icecaps and glaciers [2,3]. Water stress increases due to the constant population growth and overexploitation of water [4], prompting public authorities to seek new mechanisms to obtain water resources [5]. Hence, two of the three greatest human challenges are ensuring access to drinking water and the generation of energy, which has led experts to propose the water–energy–food security nexus [6]. Desalination is considered an effective technology to mitigate water scarcity in arid and coastal regions [7]. This technology separates dissolved salt content from saline water to produce water for human consumption, industrial, and agricultural purposes [8,9]. Reverse osmosis (RO) is currently the most widely used technology in seawater and brackish desalination worldwide, with higher efficiency and lower costs than other technologies [10,11]. Nowadays, most of the RO desalination plants around the world are powered by energy generated from fossil fuels [12,13]. The main disadvantage of RO desalinization is high energy consumption [14] since it requires high hydraulic pressure to oppose and exceed the osmotic pressure of the saline water [7,15], increasing RO product water costs, representing 50% of the produced water cost [16], making this technology economically unfeasible for low-income countries. In addition, the RO membranes are easy to foul [17] by different compounds such as inorganic, organic, scaling and biological [18]. The scaling occurs when the solubility of mineral salts in the feed water is exceeded, causing salt precipitation, permeate flux reduction, water flux recovery reduction and increasing maintenance costs [19,20]. Another disadvantage of RO desalination is the polarization factor in spiral wound membrane modules (SWMM), in which solute accumulates on the membrane surface, reducing the observed salt rejection; this phenomenon is highly dependent on the feed water temperature, membrane rejection and the feed spacer geometry of SWMM [21,22]. Even with these drawbacks, RO desalination is an essential tool that the United Nations is recommending to ensure water availability [23] in countries facing water scarcity. For instance, in Mexico, which suffers from a severe drought in its northwest region due to it being characterized as an arid and semiarid zone, the government is planning to invest in the construction of three desalination plants in the coming five years [24]. However, those investments are not enough to supply fresh water to all the vulnerable populations in Mexico.
In an attempt to reduce the problem of high RO costs, much research has focused on RO desalination powered by renewable energies such as wind, ocean waves, solar and geothermal power to make this process affordable for low-income regions [25]. The most commonly used renewable energy has been solar PV [9] since it is easy to install and cheaper compared to other technologies. In addition, regions with a shortage of water are generally regions with high solar irradiation, making them suitable for solar PV implementation. For example, Alghoul et al. [26] designed, constructed, and tested a small-scale brackish (2000 mg L−1) water (BWRO) desalination unit powered by a 2 kWp PV system. They found that the PV system supplied the load without disturbances, while the RO unit showed stable levels of permeate flow and salinity. Elmaadawy et al. [27] modeled the off-grid power systems for a 1500 m3 d−1 RO desalination plant, and they proposed a photovoltaic/wind/diesel/battery/convertor system and found a 62% energy cost reduction. Eltamaly et al. [28] designed a hybrid energy system (wind turbines, PV and batteries) to operate a 1000 m3 d−1 RO desalination plant. They found similar water production costs to a RO desalination plant powered by fossil fuels.
However, solar PV has a low efficiency, which decreases with a high temperature of PV surface [29] by 0.4–0.5% per 1 °C compared to that obtained at 25 °C [30]. This is because 85 to 90% of solar radiation is absorbed by PV cells as heat that increases the PV module temperature, resulting in structural damage [31]. To enhance efficiency and increase the amount of PV energy production, various studies have been conducted on the cooling technologies of PV modules. For example, Schiro et al. [32] tested a modified PV system with sprayed water over the frontal surface of the PV panel using nozzles and a water flow of 0.09 L s−1 m−2. They found a cooling arrangement that reduces the temperature by 70%. Bahaidarah et al. [33] incorporated an active water cooling system in the PV panel at its rear surface and dropped the temperature by 20%, increasing the PV panel efficiency by 9%. Zhao et al. [34] compared water cooling and spray cooling systems experimentally, and they found the net power generation efficiency increased by 22.5%.
Using PV cooling for powering RO plants is a promising technique with significant potential as a suitable and easy-to-implement strategy that reduces high RO water product costs and reduces greenhouse gas emissions to combat climate change. PV cooling may be one of the most promising energy sources for desalination operations, given their simple installation process and relatively low cost compared to other renewable energies used in powered RO plants. For those reasons, much research has been conducted on coupling PV cooling with RO desalinization plants. For example, Monjezi et al. [35] designed and simulated a 5 m−3 d−1 RO desalination unit integrated with PV-Thermal cooling using feed seawater as the cooling medium. They simulated the system for the seawater properties and climatic conditions in Alexandria, Egypt. They found a reduction of 0.12 kWh m−3 in the specific electricity consumption rate of RO desalination and increased the electricity generation capacity of the PVT. Recently, Suzuki et al. [36] designed and operated a PV cooling system using the feed water of an RO desalination plant in Sonora, Mexico, as the cooling fluid. They found an increase in energy production efficiency by 10% and permeate flow by 27.5%. However, the use of unclean cooling fluids (e.g., seawater or brackish water) in cooling PV would decline the glass optical properties, resulting in low efficiency [34]. Nonetheless, previous studies using cooling PV to power desalination plants in Mexico only explored brackish water as a cooling fluid [36], a fluid that may cause fouling in the cooling system and hinder energy production efficiency [37].
Given that such a RO desalinization plant power with cooling PV would be an attractive alternative for mitigating the water scarcity in northwest Mexico, the objective of this paper is to experimentally evaluate a RO desalination plant powered with a fixed array PV panels with a spray cooling system, analyzing the temperature effect on energy consumption and the RO membrane polarization factor. This work represents the second study of a RO desalination system operated with PV cooling and the first using a spray cooling system in Mexico, which contemplates the effect of temperature on the polarization factor. Thus, the results obtained can provide important and realistic insights useful for decision-making in the new desalination plants planned in northwest Mexico.

2. Materials and Methods

2.1. Description of the RO System

A 5.76 m3 d−1 RO desalination plant was used, located at Instituto Tecnologico de Sonora (28°36′0″ N, 111°31′1″ W) in Obregon City, Sonora, Mexico. The RO system had 4 membranes (Hydranautics SWC5 LD-4040, Oceanside, CA, USA) connected in parallel and series, with a salt rejection of 99.7% and an effective membrane area of 29.6 m2, based on the following standard test conditions: 32,000 ppm, 5.5 MPa, 10% conversion, 25 °C and pH 6.5–7. A 2 HP high-pressure pump (SIEMENS 1RF3 058-4YB41, Munich, Germany) was used to increase the pressure of the feed water. This RO equipment does not have an energy recovery device (ERD). The RO desalination plant pre-treatment includes the following operations: (1) sand filtration, (2) activated carbon filtration, (3) Softening, and (4) cartridge filtration (5 μm). Water post-treatment was performed with ultraviolet (UV) rays (WEDECO UV Technologies Inc., Charlotte, NC, USA, Model NLR1845WS) (Figure 1).

2.2. Energy Supply to RO Desalination Plant

The energy requirement of the desalination plant is supplied by a 120 kWh d−1 PV power station named “Parque Solar ITSON”, constituted by 84 PV modules, divided into three arrays: fixed (24), single axis (36), and dual axes (24) with energy generation of 30, 40 and 50 kWh d−1, respectively. A fixed array of 24 PV modules was used for this study, and the modules were divided into two sections of 12 PV modules, with an array of 6 modules connected in series by 2 modules connected in parallel (Figure 1). The energy productivity record was compiled daily and consulted on the platform “EnlightenManager”. The PV modules (REC Solar REC240PE-BLK, Singapore) used for the experimental tests were connected to an ENPHASE micro-inverter (M215-60-2LL-S). Table 1 and Table 2 show the technical specifications for PV modules and the micro-inverter, respectively.

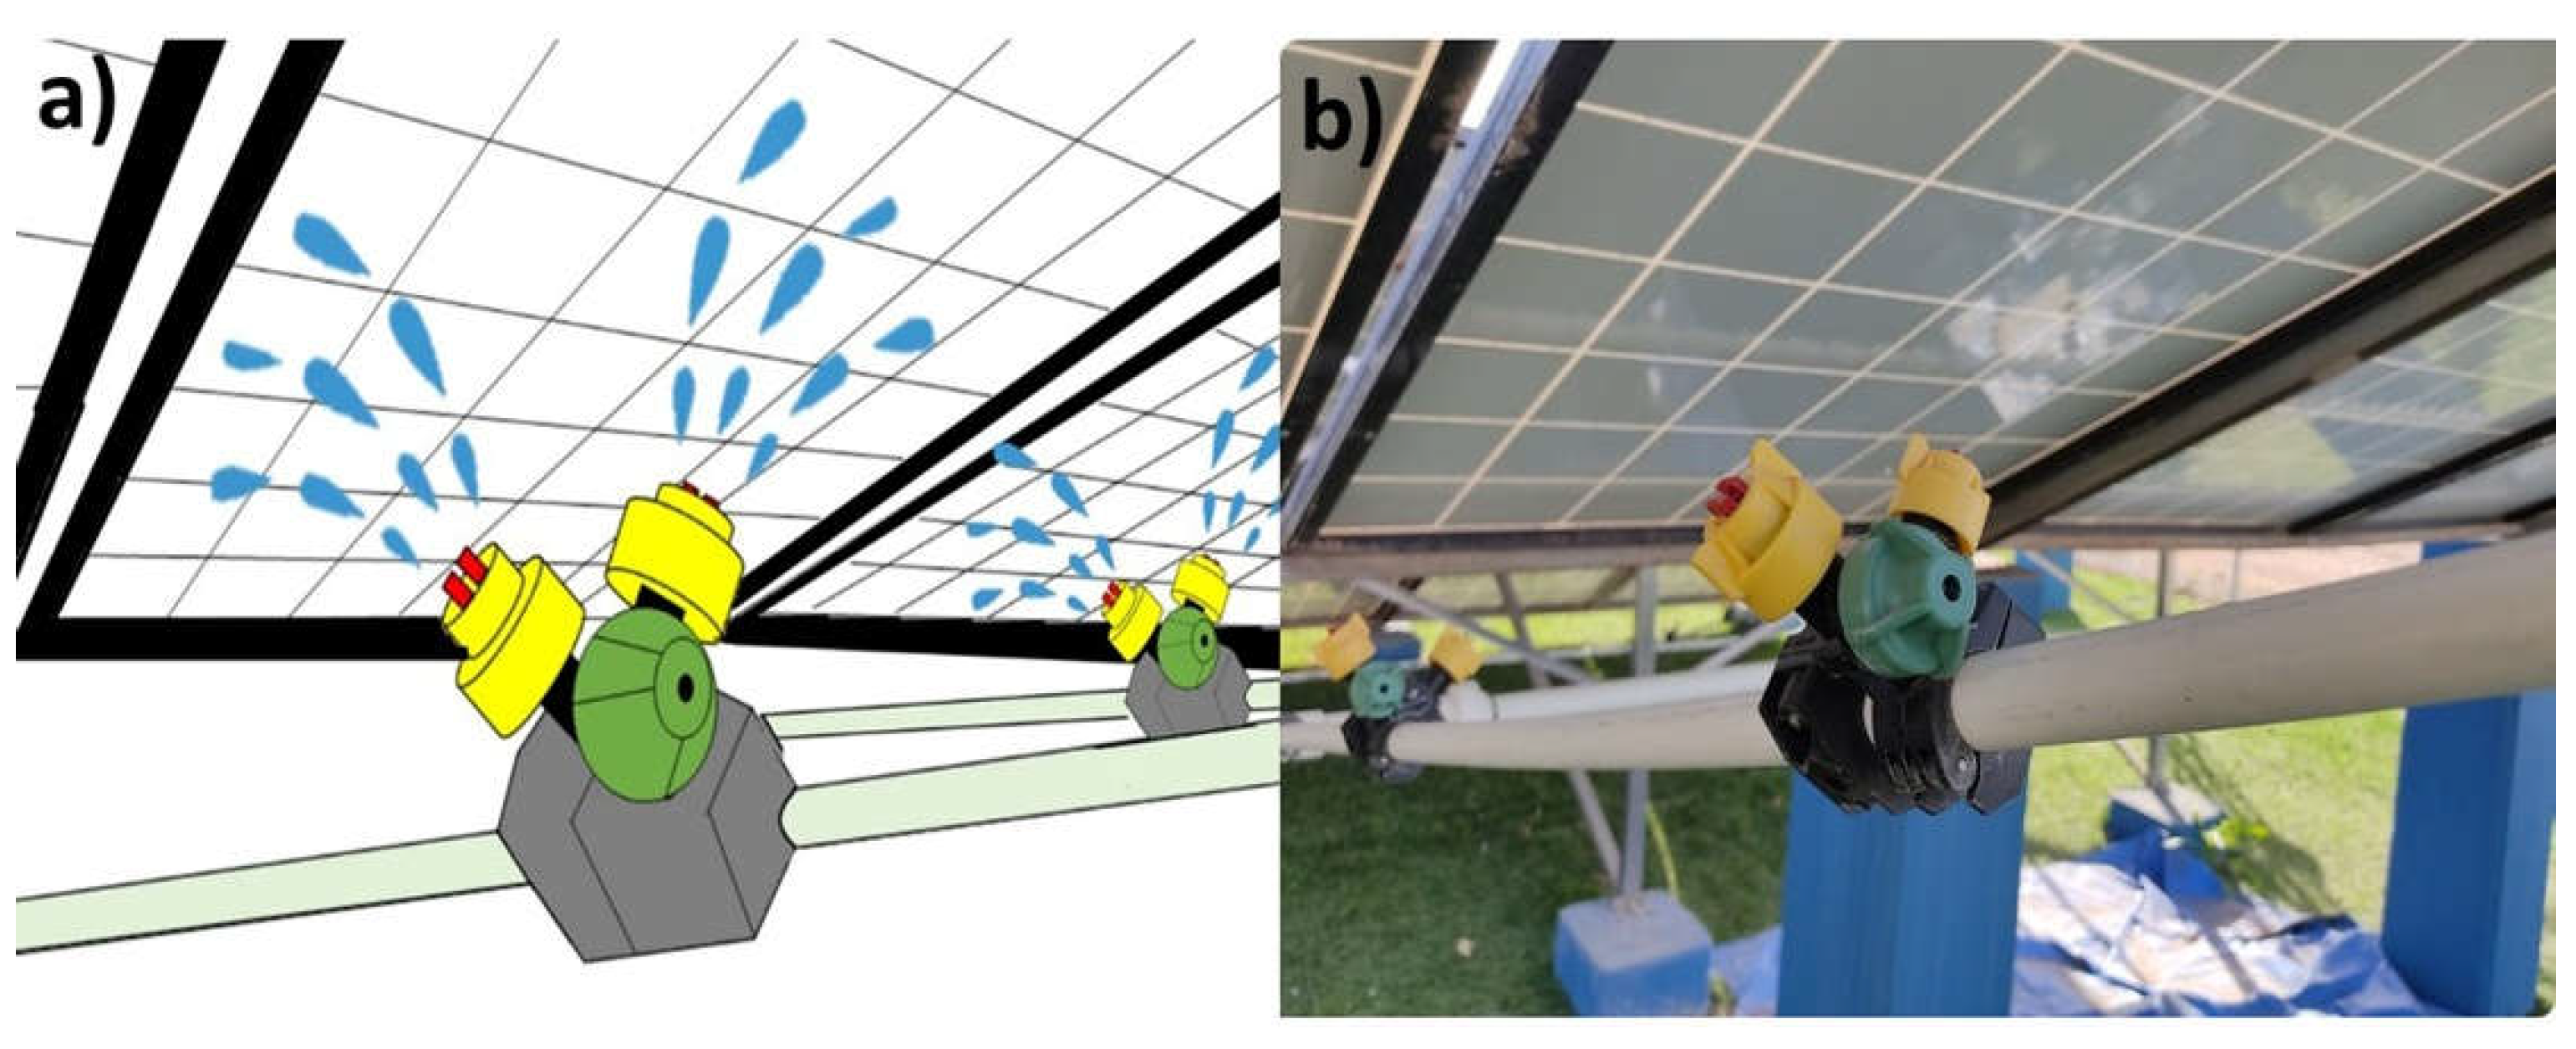
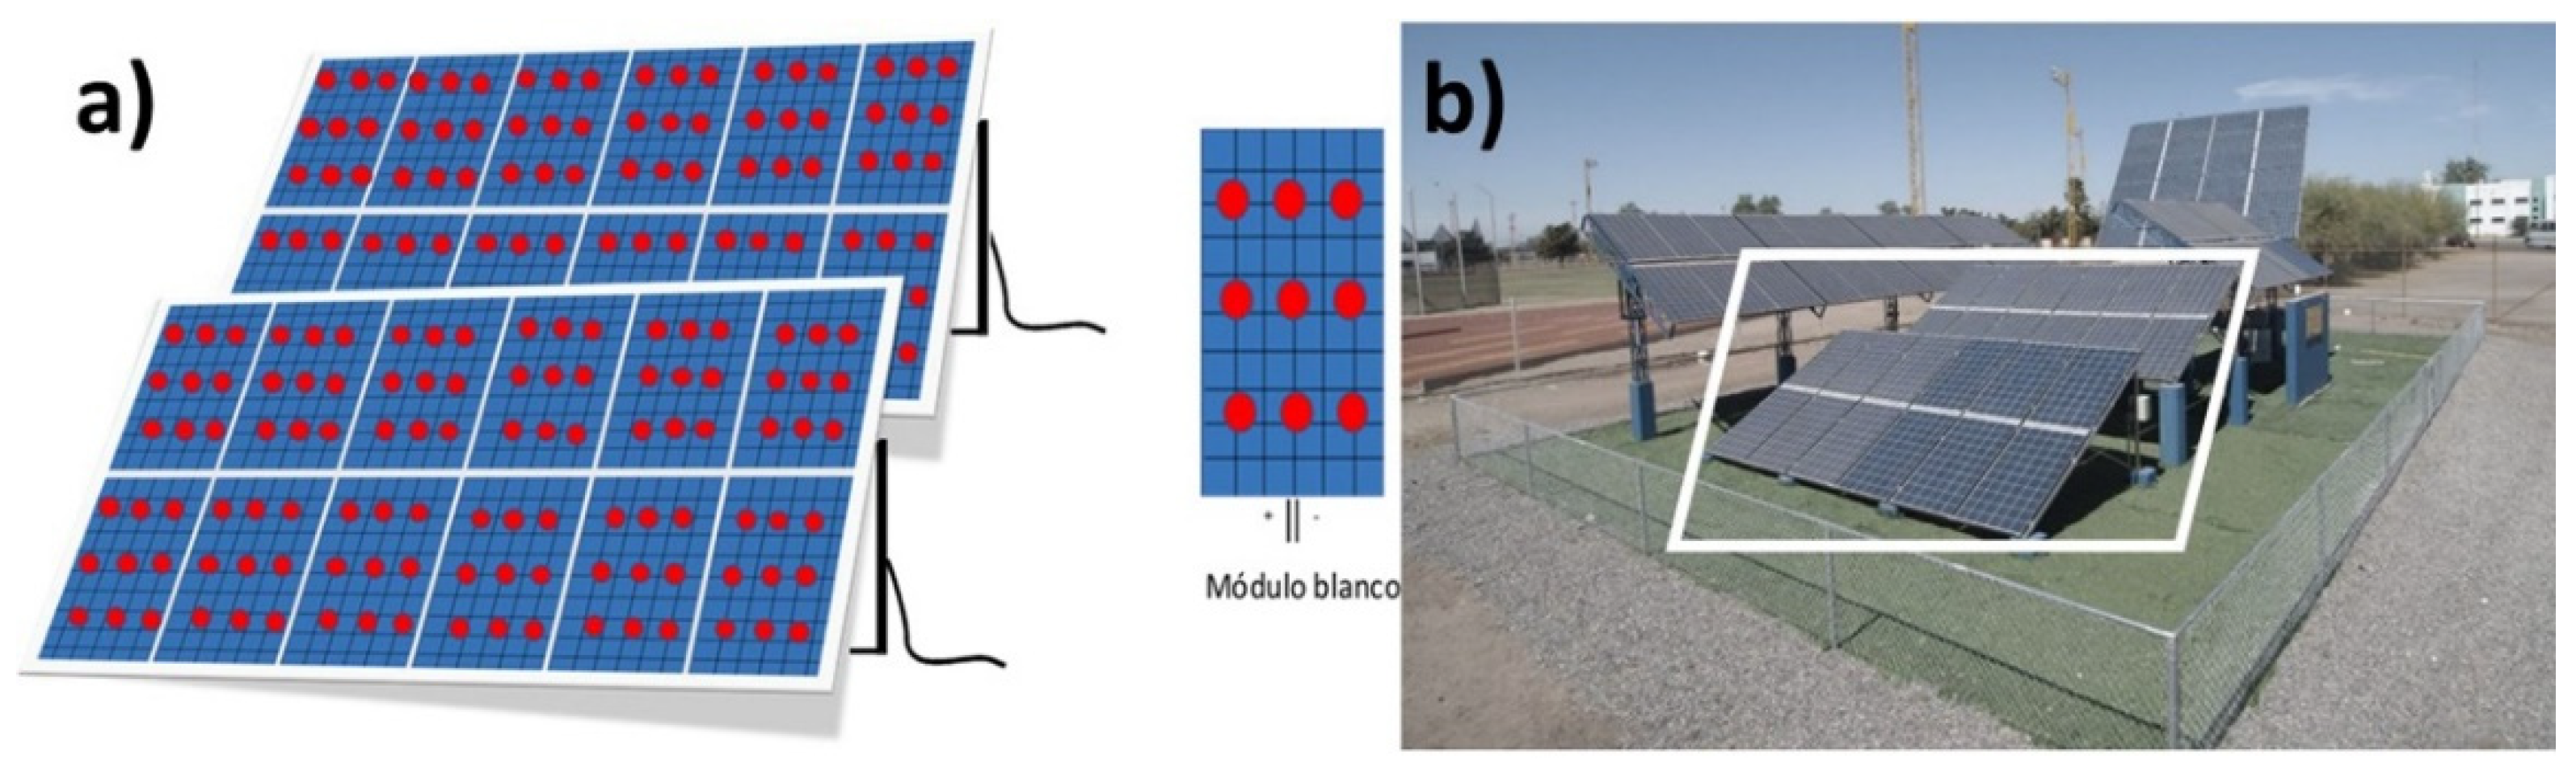
2.3. PV Module Spray Cooling Design

The spray cooling system consisted of 96 nozzles installed in the 24 fixed array PV modules (Figure 2), using water as a cooling fluid and spraying it uniformly on the back surface of the PV panels. Four nozzles were installed in each PV module, two in the vertical and two in the horizontal position. The total volume of sprayed water was 60 L, with repetitions every 30 min from 10 a.m. to 4 p.m. using a ½ HP submersible pump (Aquex 20AQD05121) and a hydropneumatic tank (Aquex TPQH-26). The cooling water was supplied from a hydropneumatic tank (Aquex TPQH-26). The total pumping distance was 80 m, and the pipe used was made of rigid plastic with a diameter of 2.5 cm. The cooling system was closed, with no loss of water volume. Spray cooling tests were conducted in the winter (13–18 January 2021), spring (6–14 May 2021), and summer (9–14 September 2021) seasons.

2.4. Energy Productivity of the Spray-Cooling PV Modules

The energy productivity of the spray-cooling PV modules and the control was evaluated by calculating energy efficiency and heat removed from the PV module’s surface and global heat transfer coefficient. The temperatures of the 24 PV modules were measured using an infrared thermometer (Fluke-62-Max) every 30 min for 6 h d−1 in nine different surface areas of the PV module front. One extra PV module was used as a control. Furthermore, water cooling temperature was measured before and after passing it to the cooling system (Figure 3).
The PV energy efficiency production (η) was calculated with respect to the received solar energy using Equation (1).
η = P p A p G s
where Pp is the electric power generated by the PV panel obtained directly from the EnlightenManager platform, Ap is the PV panel area and Gs is the solar irradiation. The heat removed from the panel by the water (q) in W was determined according to Suzuki et al. [36] using Equation (2).
q = Q ρ c C w p ( T f T i )
where Q is the water cooling flow (m3 s−1), ρc is the water cooling density (kg m−3), Cwp is the calorific capacity of the water cooling (KJ Kg−1 K−1) and Tf and Ti are the water cooling temperate (K) at PV panel outlet and inlet, respectively. The global heat transfer coefficient is (U, W K−1 m−2), and Ap is the PV panel area (m2). The U is related to the multiplication of the logarithmic mean temperature difference between the module and the cooling water (ΔTLm) and Ap and q, as follows:
U = q A p Δ T L m
TLm was calculated using Equation (3):
Δ T L m = T f T i ln ( T p T i T p T f )
where Tp is the PV module’s mean temperature.

2.5. Specific Energy Consumption and Concentration Polarization Modulus of the RO System

The RO system was operated using synthetic brackish water (5000 mg L−1) comprised of synthetic sea salt (Instant Ocean) and distilled water. The experimental tests were carried out keeping a constant permeate flux (7 LMH) and feed water temperature at 20, 23, 26, and 30 °C using an electrical immersion resistor at 70% recovery for 1 h. A transducer (IFM, PX9111) was used to record pressure data. The physical-chemical parameters such as T, electrical conductivity, total dissolved solids, salt fraction, dissolved oxygen, and pH were measured in feed water and permeate water using a multi-parameter (YSI 556). The energy requirement of the RO system was determined in terms of specific energy consumption (SEC). The consumed electricity by the RO system was measured by putting wattmeters (FLUREON TS-386ª) in the output switch cable of the high- and low-pressure pumps. The SEC (kWh m−3) was calculated by Equation (4):
S E C = E Q p t
where E is the energy consumption (kWh), Qp is the permeate volumetric flow (m3 s−1), and t is the time elapsed during the test (s).
The mass transfer through the RO membrane was determined by the concentration polarization modulus (Γ) from boundary layer theory [38]:
Γ = C m C p C f C p = exp ( J v k m t )
where Cm (mg L−1), Cf (mg L−1) and Cp (mg L−1) are the salt concentration on the membrane surface, the feed solution and permeate solution, respectively. Jv is the permeate flux (m s−1), and kmt is the mass transfer coefficient (m s−1). Jv was related to the effective membrane area (Am) and Qp, calculated according to Kucera et al. [39], via the following:
J v = Q p A m
The values for kmt can be obtained using Equation (8) according to Treybal [40]
k m t = S h D d h
where Sh is the Sherwood number, D is the solute diffusivity (m2 s−1), and dh is the hydraulic diameter of the flow channel (m). The correlation of the Sh depends on the system geometry for the spiral wound membrane module, and Sh is:
S h = 0.023 R e 0.88 S c 1 3
The dimensionless numbers, Reynolds (Re) and Schmidt (Sc), are determined by Equations (9) and (10), respectively.
R e = ρ v d h μ
S c = μ D ρ
where ρ is the water density (kg m−3), and v is the water velocity (m s−1). D is calculated as follows:
D = 117.3 × 10 18 T φ M B μ V A 0.6
where T is water temperature (K), MB is the solute molecular weight (kg kmol−1), VA is the solvent molar volume (m3 kmol−1) at normal boiling point and φ is a solvent association factor (2.26 for water). The salt rejection (SR) was calculated by:
S R = C f C p C f × 100
where SR is the salt rejection (%), and Cf (g L−1) and Cp (g L−1) are the concentrations of the feed solution and permeate solution, respectively.

2.6. Estimated Investment and Desalinated Water Costs

Using data from the DesalData database 2021 [41], the investment cost of a BWRO plant will be estimated by correlating the cost of installed reverse osmosis plants against the installed capacity m3 d−1 of desalination plants that use brackish water as feedwater. This is in order to know the initial investment cost of any installed plant and to be able to predict any plant to be installed in the future.
With Equation (14), the total cost (TC) in USD m−3 of desalinated water was calculated for different temperatures at 20, 23, 26 and 30 °C at a brackish water feed concentration of 5000 mg L−1. However, emphasis will be placed on the correlation of the specific energy consumption (SEC), which represents 60% of the total cost [42]. In addition, conservation and maintenance costs (c&m) representing 27% of the total cost, labor (mp) representing 6.5% of the total cost, management (m) and chemical use (ch) representing 3.6 and 2.9%, respectively, will be added to this equation.
T C = T I C S E C + T I C c & m + T I C m p + T I C m + T I C c h

2.7. Statistical Analysis

An analysis of variance of simple classification (ANOVA) α = 0.05 based on a linear fixed effects model was carried out for each of the following variables: working pressure, SEC, permeate salinity, salt rejection, solute diffusivity, and polarization factor. The source of variation was taken to be the temperature. Once differences were detected, the means were compared by the Tukey test for p ≤ 0.001.

3. Results and Discussion

3.1. Desalination Performance and Energy Consumption of the RO System

Figure 4 shows the working pressure and SEC of the RO system at different temperatures to obtain 7 LMH. It is possible to observe a reduction in working pressure and SEC at a higher temperature. This result is probably because the temperature has an essential influence on the surface energy of the membrane, determining the chemical potential of the water and, at the same time, the driving force through the membrane [43]. Furthermore, the water solubility and wettability of the membrane increase at higher temperatures [44], causing the water to pass through the membrane easier, reducing the membrane resistance, and thus reducing the working pressure and the SEC. Those results are beneficial for the desalinization process costs since when it consumes less energy, it may reduce water product costs, making RO desalination feasible for low-income regions.
Figure 5 shows the results of permeate salinity and salt rejection. It is possible to observe salt rejection values of less than 99%, and this result may be due to the use of an RO membrane for seawater at low working pressures and low feed water salt concentration (5000 mg L−1). A reduction in salt rejection and an increase in permeate salinity are also observed at higher temperatures. These results are mainly due to the viscosity of the water decreasing at higher feed water temperatures, making the water flow more easily, and dragging more salts through the membrane, thus reducing its selectivity [45]. Furthermore, the RO membranes are made from polymers susceptible to high temperatures, which can suffer from irreversible swelling and strength the covalent bonds of the membrane compounds, facilitating the mass transfer through the membrane [46]. However, the permeate salinity values at 20, 23, and 26 °C are still in the range of permissible limits for human consumption according to the Mexican Official Norm (NOM-127-SSA1-1994) [47,48] and the World Health Organization (WHO) [49] (less than 500 mg L−1). The water permeated at 30 °C in this study would be used for agricultural, industrial and livestock activities.
As regards the diffusivity and the polarization factor, Figure 6 shows the values obtained after the RO experiments. It is possible to observe that there was a statistically significantly higher polarization factor at 20 °C (at least 7% higher) with respect to 30 °C. These results are probably due to the higher salt rejection obtained at 20 °C (Figure 5) since the solute accumulation near the membrane surface is higher in comparison to the other studied temperatures [22]. However, the polarization factor values obtained are in the range of the typical concentration polarization values (≤2) [38], and this result may delay scaling on the membrane surface [19]. These results are desirable for desalination operations since they indicate that the membrane boundary layer has a lower salt concentration. Values of polarization factor ≥2 can decrease the observed salt rejection and increase the salt passage through the membrane, thereby reducing the water product quality. The higher polarization factor can be attributed to the osmotic pressure of water since it is influenced by the solute concentration difference between the feed and permeate channel [50], and it increases at lower temperatures [51]. Furthermore, the temperature directly influences the µ and ρ of the feed water, affecting the dimensionless numbers (Sh, D, Sc and NRe). Kmt depends on these numbers; thus, it increases at higher temperature values, decreasing the polarization factor value (see Equation (6)). The water diffusivity shows an increase at higher temperatures, which may be attributed to the diffusivity being directly related to the temperature and the dynamic viscosity of the feedwater [40]. An increase in the water diffusivity value is desirable as it increases the mass transfer coefficient through the membrane, leading to an increase in water product amount and reduction inthe SEC and operation pressure (Figure 5), which can decrease the desalination operational costs.

3.2. PV Cooling System in Winter, Spring and Summer

Figure 7 shows the irradiance, cooling water and PV temperature in winter, spring and summer. These results show non-uniform solar irradiance conditions in the spring and the summer seasons due to the fact that in these seasons, the natural phenomena called the North American Monsoon occurs in northwest México, which consists of rainfall and cloudy skies [52] and could interfere with the pyrometer reading. Furthermore, it is possible to observe a small increase in mean values of the PV temperatures in summer from 11:30 a.m. to 3:00 p.m. compared to the spring. With respect to cooling water temperatures, a highly significant increase is observed in the summer compared to spring and winter. These results can affect the power generation produced by the PV module since higher temperatures create hotspots that can degrade the photovoltaic cells, reducing the efficiency of the PV module [53].
Figure 8 shows the temperature drop in the PV panel and cooling water before and after the cooling system. It can be observed that in winter, the temperature drop of the PV panel is lower than the cooling water from 10:30 a.m. to 13:30 p.m. This shows that the use of the cooling system is unnecessary before 13:30 p.m., as it does not provide savings to the system. It can also be observed that in summer there is a drastic decay in temperature drop from 12:00 to 15:00 p.m., probably because irradiation is lower during that period (see Figure 7). The largest temperature drop of the PV panel occurred in spring, indicating higher efficiency of the cooling system in this season of the year, which may help to increase the efficiency of the PV panel’s electrical energy production.
Figure 9a shows the global heat transfer coefficient (U) after the cooling. The highest U values are achieved in the summer (>23.1 higher than the spring) followed by the winter and the spring, which suggests that the cooling water significantly removed the heat in the PV panel since the highest temperatures were presented in the summer. Figure 9b shows the effect of the season of the year on PV module energy efficiency. The data shows a highly significant increase in PV energy efficiency with the use of the PV cooling system compared to without the use of cooling. This increase is 14.25% in the winter, 7.96% in the spring and 13.98% in the summer. The largest value is found for the spring followed by winter and summer, with significant statistical differences between them (>14.6 and >27.2 lower, respectively). The highest values of efficiency occurred in the spring, probably due to higher irradiation and higher temperature drop (Figure 7 and Figure 8) but with lower mean temperatures than in the summer. The U results (see Figure 9a) suggest that this could be related to a reduction in PV temperature. Figure 9a,b suggests that higher heat removal causes lower efficiency of PV energy production, which is probably due to the PV panel temperature being higher, causing a higher amount of heat on the PV panel surface, reducing the efficiency.

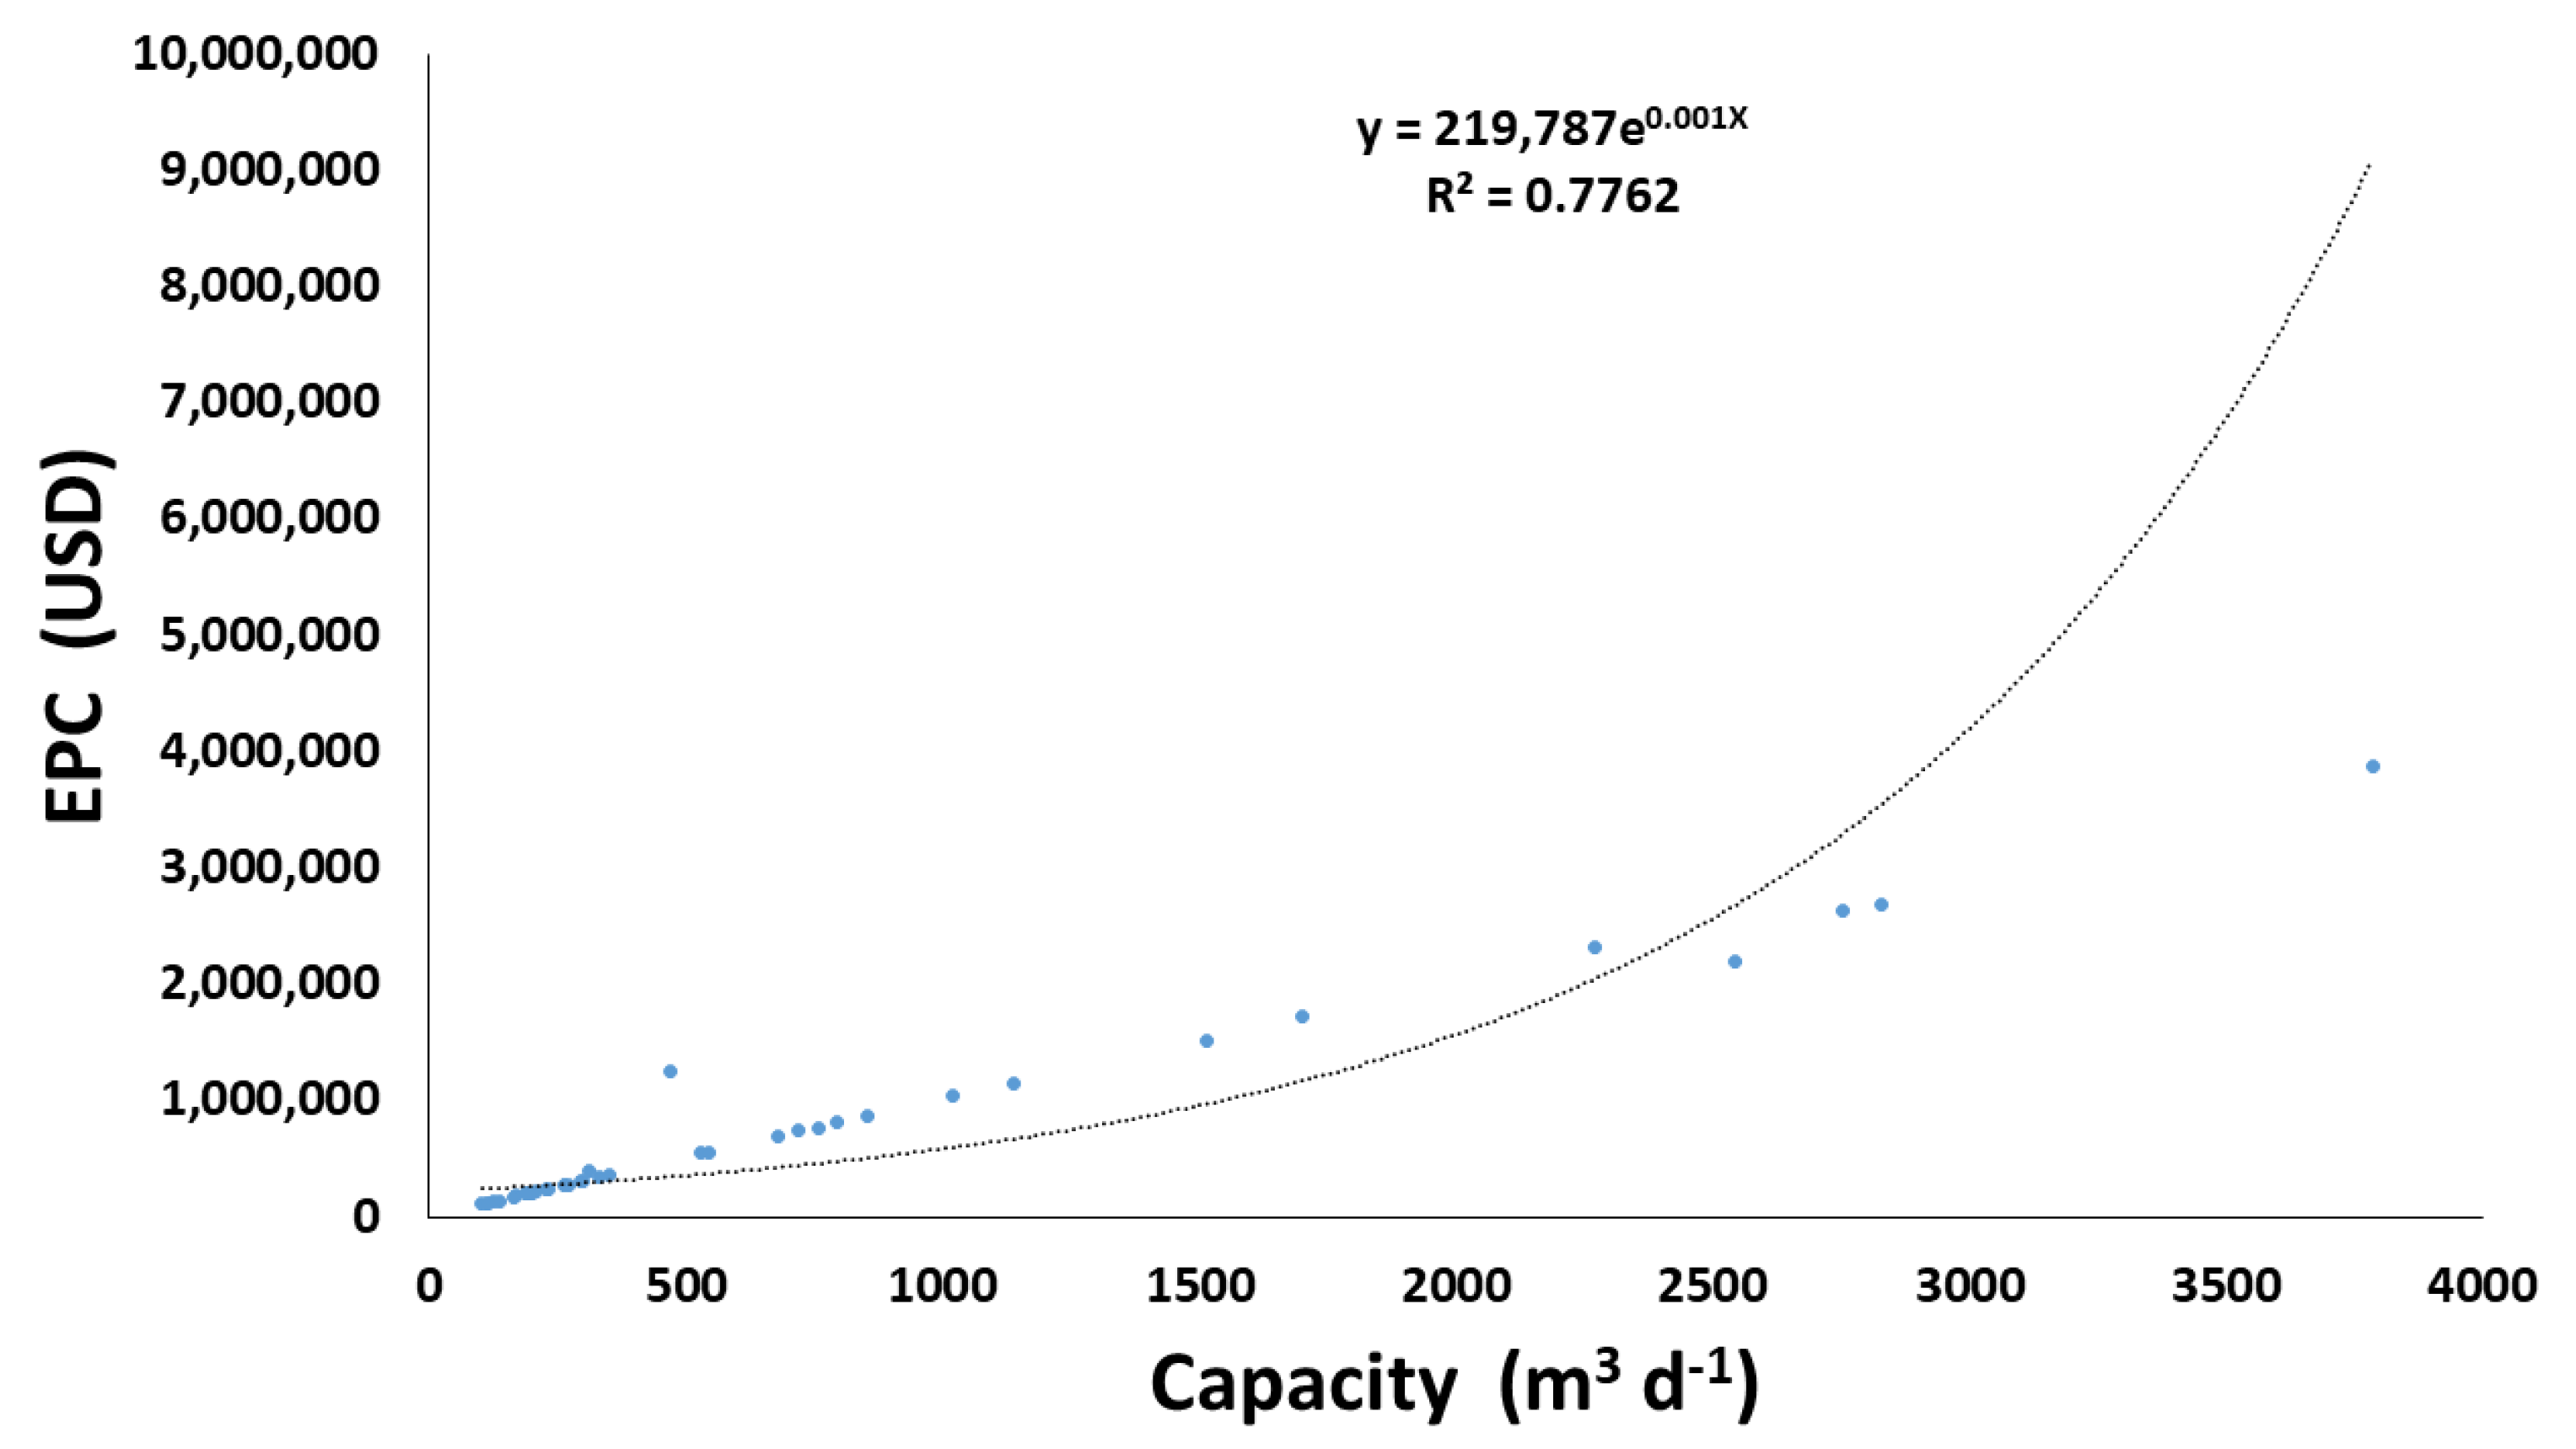
3.3. Investment and Desalinated Water Cost

Figure 10 shows the exponential correlation of the cost of 38 installed reverse osmosis plants versus the installed capacity m3 d−1 of desalination plants using brackish water as feedwater in Mexico. The resulting equation provides an estimate of the initial investment cost or plant capacity installed or to be installed in the future.
Table 3 shows the total cost (TC) in USD m−3 of desalinated water for different temperatures in the brackish feedwater at 20, 23, 26 and 30 °C at 5000 mg L−1 with their different costs and percentages. Specific energy consumption (SEC), conservation and maintenance (c&m), labor (mp), management (m), and chemicals (ch).

4. Conclusions

The results presented in this study confirm that temperature is a parameter that directly influences SEC, operational pressure, salt rejection, diffusivity, and polarization factor, thus determining desalination process costs. It is recommended to monitor this parameter in the pre-treatment stage of desalination plants in order to control the water product cost, as well as enhance the feasibility of RO desalination in low-income countries. For example, it is advisable to try to maintain T > 26 °C. If the T value decreases more than that level, it would be advisable to increase temperature monitoring.
The spray cooling system was able to decrease the temperature of the solar cells by about 6.2, 13.3 and 11.5 °C for the winter, spring and summer seasons, respectively. The PV module presented up to 14.25% higher efficiency under spray-cooling conditions in the winter. However, the PV efficiency was significantly higher in the spring than in the winter (up to 14% higher), demonstrating that solar cell temperature control is a viable alternative to improve power generation in PV panel systems. To improve these findings, it is advisable to carry out studies with 45 °C > T > 30 °C, compared with other cooling PV panel methods and perform coupled spray-cooling PV panel and RO desalinization tests to assess the water production costs.
Currently, the installation of small-scale RO desalination plants that operate through the use of PV systems is considered economically viable. Arid areas suffering from water scarcity within the state of Sonora, as well as elsewhere in the world, can take advantage of solar resources to increase water availability.

Author Contributions

Conceptualization, G.E.D.-I., M.M.A.-O., J.R.-L., J.Á.-S., R.G.S.-D., Y.V.-P. and M.d.R.M.-M.; data curation, G.E.D.-I., M.M.A.-O. and J.Á.-S.; formal analysis, R.G.S.-D., Y.V.-P. and M.d.R.M.-M.; funding acquisition, G.E.D.-I.; investigation, G.E.D.-I., M.M.A.-O. and J.R.-L.; methodology, R.G.S.-D. and M.d.R.M.-M.; project administration, G.E.D.-I.; resources, G.E.D.-I.; software, J.R.-L.; supervision, G.E.D.-I.; validation, G.E.D.-I. and M.M.A.-O., visualization, J.R.-L., J.Á.-S. and R.G.S.-D.; writing—original draft, G.E.D.-I. and M.M.A.-O.; writing—review and editing, G.E.D.-I., J.Á.-S., R.G.S.-D. and M.d.R.M.-M. All authors have read and agreed to the published version of the manuscript.

Funding

This research was funded by the Instituto Tecnologico de Sonora through a PROFAPI fund (Projects: 2022-0495, 2022-0496, 2022-0012, 2022-0081, 2022-0090 and 2022-0088).

Institutional Review Board Statement

Not applicable.

Informed Consent Statement

Not applicable.

Data Availability Statement

Not applicable.

Acknowledgments

G.E.D.-I. and M.M.A.-O. helped with translating and editing the paper.

Conflicts of Interest

All authors declare no conflict of interest.

Nomenclature

Variables
SymbolDescriptionUnits
AmEffective membrane aream2
APPV panel area m2
chChemicals costUSD m−3
CfSalt concentration on the feed solutionmg L−1
CmSalt concentration on the membrane surfacemg L−1
CpSalt concentration on the permeate solutionmg L−1
CwpHeat capacity of cooling waterJ kg−1 K−1
c&mConservation and maintenance costUSD m−3
DSolute diffusivitym2 s−1
dhHydraulic diameterm
EEnergy consumption of desalination plantkW
GsTotal solar irradiationW m−2
JvVolumetric permeate fluxm s−1
kmtMass transfer coefficient on the membrane surfacem s−1
mManagement costUSD m−3
mpLabor costUSD m−3
MBSolute molecular weightkg kmol−1
PpElectric power generated by the PV panelW
QWater cooling flowm3 s−1
QpPermeate volumetric flowm3 s−1
qHeat removed from the panel by the waterW
ReReynolds number-
ScSchmidt number-
SECSpecific energy consumption -
ShSherwood number-
SRSalt rejection%
TTemperature°C, K
TCTotal costUSD m−3
TICSECTotal investment cost of specific energy consumptionUSD m−3
TICc&mTotal investment cost of conservation and maintenanceUSD m−3
TICmpTotal investment cost of laborUSD m−3
TICmTotal investment cost of managementUSD m−3
TICchTotal investment cost of chemicalsUSD m−3
TiTemperature of cooling water at PV module inletK
TfTemperature of cooling water at PV module outletK
TPPV module mean temperature.K
tTime elapsed during the tests
ΔTlmLogarithmic mean temperature difference between PV module and cooling waterK
UGlobal heat transfer coefficient for cooling water heat exchangeW m−2 K
VASolvent molar volume at normal boiling pointm3 kmol−1
vWater velocity in membrane modulem s−1
Greek Symbols
SymbolDescriptionUnits
ΓConcentration polarization modulus-
ηElectrical efficiency of PVT module%
φsolvent association factor-
μFluid viscosityPa s
ρDensity of waterkg m−3

References

  1. Roggenburg, M.; Warsinger, D.M.; Bocanegra Evans, H.; Castillo, L. Combatting water scarcity and economic distress along the US-Mexico border using renewable powered desalination. Appl. Energy 2021, 291, 116765. [Google Scholar] [CrossRef]
  2. Aladwani, S.H.; Al-Obaidi, M.A.; Mujtaba, I.M. Performance of reverse osmosis based desalination process using spiral wound membrane: Sensitivity study of operating parameters under variable seawater conditions. Clean. Eng. Technol. 2021, 5, 100284. [Google Scholar] [CrossRef]
  3. Skuse, C.; Gallego-Schmid, A.; Azapagic, A.; Gorgojo, P. Can emerging membrane-based desalination technologies replace reverse osmosis? Desalination 2021, 500, 114844. [Google Scholar] [CrossRef]
  4. Leal Filho, W.; Totin, E.; Franke, J.A.; Andrew, S.M.; Abubakar, I.R.; Azadi, H.; Nunn, P.D.; Ouweneel, B.; Williams, P.A.; Simpson, N.P. Understanding responses to climate-related water scarcity in Africa. Sci. Total Environ. 2022, 806, 150420. [Google Scholar] [CrossRef] [PubMed]
  5. Fellaou, S.; Ruiz-Garcia, A.; Gourich, B. Enhanced exergy analysis of a full-scale brackish water reverse osmosis desalination plant. Desalination 2021, 506, 114999. [Google Scholar] [CrossRef]
  6. Pahl-Wostl, C. Governance of the water-energy-food security nexus: A multi-level coordination challenge. Environ. Sci. Policy 2019, 92, 356–367. [Google Scholar] [CrossRef]
  7. Saleem, H.; Zaidi, S.J. Nanoparticles in reverse osmosis membranes for desalination: A state of the art review. Desalination 2020, 475, 114171. [Google Scholar] [CrossRef]
  8. Dévora-Isiordia, G.E.; González-Enríquez, R.; Ruiz-Cruz, S. Evaluación de procesos de desalinización y su desarrollo en México. Tecnol. Y Cienc. Del Agua 2013, 4, 27–46. [Google Scholar]
  9. Sarai Atab, M.; Smallbone, A.J.; Roskilly, A.P. A hybrid reverse osmosis/adsorption desalination plant for irrigation and drinking water. Desalination 2018, 444, 44–52. [Google Scholar] [CrossRef]
  10. Armendáriz-Ontiveros, M.M.; García García, A.; de los Santos Villalobos, S.; Fimbres Weihs, G.A. Biofouling performance of RO membranes coated with Iron NPs on graphene oxide. Desalination 2019, 451, 45–58. [Google Scholar] [CrossRef]
  11. Castro, M.; Alcanzare, M.; Esparcia, E.; Ocon, J. A Comparative Techno-Economic Analysis of Different Desalination Technologies in Off-Grid Islands. Energies 2020, 13, 2261. [Google Scholar] [CrossRef]
  12. Abdelkareem, M.A.; El Haj Assad, M.; Sayed, E.T.; Soudan, B. Recent progress in the use of renewable energy sources to power water desalination plants. Desalination 2018, 435, 97–113. [Google Scholar] [CrossRef]
  13. Ghaffour, N.; Lattemann, S.; Missimer, T.; Ng, K.C.; Sinha, S.; Amy, G. Renewable energy-driven innovative energy-efficient desalination technologies. Appl. Energy 2014, 136, 1155–1165. [Google Scholar] [CrossRef] [Green Version]
  14. Powar, V.; Singh, R. Stand-Alone Direct Current Power Network Based on Photovoltaics and Lithium-Ion Batteries for Reverse Osmosis Desalination Plant. Energies 2021, 14, 2772. [Google Scholar] [CrossRef]
  15. Shulga, R.N.; Putilova, I.V. Multi-agent direct current systems using renewable energy sources and hydrogen fuel cells. Int. J. Hydrog. Energy 2020, 45, 6982–6993. [Google Scholar] [CrossRef]
  16. Al-Karaghouli, A.; Kazmerski, L.L. Energy consumption and water production cost of conventional and renewable-energy-powered desalination processes. Renew. Sustain. Energy Rev. 2013, 24, 343–356. [Google Scholar] [CrossRef]
  17. Rodríguez, B.E.; Armendariz-Ontiveros, M.M.; Quezada, R.; Huitrón-Segovia, E.A.; Estay, H.; García García, A.; García, A. Influence of Multidimensional Graphene Oxide (GO) Sheets on Anti-Biofouling and Desalination Performance of Thin-Film Composite Membranes: Effects of GO Lateral Sizes and Oxidation Degree. Polymers 2020, 12, 2860. [Google Scholar] [CrossRef]
  18. Armendáriz-Ontiveros, M.M.; Villegas-Peralta, Y.; Madueño-Moreno, J.E.; Álvarez-Sánchez, J.; Dévora-Isiordia, G.E.; Sánchez-Duarte, R.G.; Madera-Santana, T.J. Modification of Thin Film Composite Membrane by Chitosan–Silver Particles to Improve Desalination and Anti-Biofouling Performance. Membranes 2022, 12, 851. [Google Scholar] [CrossRef]
  19. Ruiz-García, A.; Nuez, I.; Carrascosa-Chisvert, M.D.; Santana, J.J. Simulations of BWRO systems under different feedwater characteristics. Analysis of operation windows and optimal operating points. Desalination 2020, 491, 114582. [Google Scholar] [CrossRef]
  20. Ruiz-García, A.; Feo-Garcíab, J. Antiscalant cost and maximum water recovery in reverse osmosis for different inorganic composition of groundwater. In Proceedings of the Presented at the EDS Conference on Desalination for the Environment: Clean Water and Energy, Rome, Italy, 22–26 May 2016; p. 26. [Google Scholar]
  21. Ruiz-García, A.; de la Nuez Pestana, I. Feed Spacer Geometries and Permeability Coefficients. Effect on the Performance in BWRO Spriral-Wound Membrane Modules. Water 2019, 11, 152. [Google Scholar] [CrossRef] [Green Version]
  22. Foo, K.; Liang, Y.Y.; Weihs, G.A.F. CFD study of the effect of SWM feed spacer geometry on mass transfer enhancement driven by forced transient slip velocity. J. Membr. Sci. 2020, 597, 117643. [Google Scholar] [CrossRef]
  23. Navarro, T. Water reuse and desalination in Spain—Challenges and opportunities. J. Water Reuse Desalination 2018, 8, 153–168. [Google Scholar] [CrossRef] [Green Version]
  24. SHCP; BANOBRAS. Secretaria de Hacienda y Credito Publico, y Banco Nacional de Obras y Servicios Publicos S.N.C. Proyectos Mexico, Oportunidades de Inversion. 2022. Available online: https://www.proyectosmexico.gob.mx/proyectos/ (accessed on 29 July 2022).
  25. Rahimi, B.; Shirvani, H.; Alamolhoda, A.A.; Farhadi, F.; Karimi, M. A feasibility study of solar-powered reverse osmosis processes. Desalination 2021, 500, 114885. [Google Scholar] [CrossRef]
  26. Alghoul, M.A.; Poovanaesvaran, P.; Mohammed, M.H.; Fadhil, A.M.; Muftah, A.F.; Alkilani, M.M.; Sopian, K. Design and experimental performance of brackish water reverse osmosis desalination unit powered by 2 kW photovoltaic system. Renew. Energy 2016, 93, 101–114. [Google Scholar] [CrossRef]
  27. Elmaadawy, K.; Kotb, K.M.; Elkadeem, M.R.; Sharshir, S.W.; Dán, A.; Moawad, A.; Liu, B. Optimal sizing and techno-enviro-economic feasibility assessment of large-scale reverse osmosis desalination powered with hybrid renewable energy sources. Energy Convers. Manag. 2020, 224, 113377. [Google Scholar] [CrossRef]
  28. Eltamaly, A.M.; Ali, E.; Bumazza, M.; Mulyono, S.; Yasin, M. Optimal Design of Hybrid Renewable Energy System for a Reverse Osmosis Desalination System in Arar, Saudi Arabia. Arab. J. Sci. Eng. 2021, 46, 9879–9897. [Google Scholar] [CrossRef]
  29. Schies, A.; Went, J.; Heidtmann, C.; Eisele, M.; Kroemke, F.; Schmoch, H.; Vetter, M. Operating control strategies and dimensioning of photovoltaic powered reverse osmosis desalination plants without batteries. Desalination Water Treat. 2010, 21, 131–137. [Google Scholar] [CrossRef]
  30. Shalaby, S.M.; Elfakharany, M.K.; Moharram, B.M.; Abosheiasha, H.F. Experimental study on the performance of PV with water cooling. Energy Rep. 2022, 8, 957–961. [Google Scholar] [CrossRef]
  31. Hamzat, A.K.; Sahin, A.Z.; Omisanya, M.I.; Alhems, L.M. Advances in PV and PVT cooling technologies: A review. Sustain. Energy Technol. Assess. 2021, 47, 101360. [Google Scholar] [CrossRef]
  32. Schiro, F.; Benato, A.; Stoppato, A.; Destro, N. Improving photovoltaics efficiency by water cooling: Modelling and experimental approach. Energy 2017, 137, 798–810. [Google Scholar] [CrossRef]
  33. Bahaidarah, H.; Subhan, A.; Gandhidasan, P.; Rehman, S. Performance evaluation of a PV (photovoltaic) module by back surface water cooling for hot climatic conditions. Energy 2013, 59, 445–453. [Google Scholar] [CrossRef]
  34. Zhao, Y.; Gong, S.; Zhang, C.; Ge, M.; Xie, L. Performance analysis of a solar photovoltaic power generation system with spray cooling. Case Stud. Therm. Eng. 2022, 29, 101723. [Google Scholar] [CrossRef]
  35. Monjezi, A.A.; Chen, Y.; Vepa, R.; Kashyout, A.E.-H.B.; Hassan, G.; Fath, H.E.-B.; Kassem, A.E.-W.; Shaheed, M.H. Development of an off-grid solar energy powered reverse osmosis desalination system for continuous production of freshwater with integrated photovoltaic thermal (PVT) cooling. Desalination 2020, 495, 114679. [Google Scholar] [CrossRef]
  36. Suzuki Valenzuela, M.F.; Sánchez Soto, F.; Armendáriz-Ontiveros, M.M.; Sosa-Tinoco, I.M.; Fimbres Weihs, G.A. Improving Thermal Distribution in Water-Cooled PV Modules and Its Effect on RO Permeate Recovery. Water 2021, 13, 229. [Google Scholar] [CrossRef]
  37. Bevilacqua, P.; Bruno, R.; Arcuri, N. Comparing the performances of different cooling strategies to increase photovoltaic electric performance in different meteorological conditions. Energy 2020, 195, 116950. [Google Scholar] [CrossRef]
  38. Fimbres Weihs, G.A.; Wiley, D.E. CFD analysis of tracer response technique under cake-enhanced osmotic pressure. J. Membr. Sci. 2014, 449, 38–49. [Google Scholar] [CrossRef]
  39. Kucera, J. Reverse osmosis: Industrial Processes and Applications; John Wiley & Sons: Hoboken, NJ, USA, 2015. [Google Scholar]
  40. Treybal, R.E. Mass Transfer Operations; McGraw—Hill Book Company: New York, NY, USA, 1980; Volume 466. [Google Scholar]
  41. DesalData. Global Water Intelligence, Desalination Plants. 2021. Available online: https://www.desaldata.com/ (accessed on 8 October 2022).
  42. Prathapaneni, D.R.; Detroja, K. Optimal design of energy sources and reverse osmosis desalination plant with demand side management for cost-effective freshwater production. Desalination 2020, 496, 114741. [Google Scholar] [CrossRef]
  43. Dévora-Isiordia, G.E.; Ayala-Espinoza, A.; Lares-Rangel, L.A.; Encinas-Guzmán, M.I.; Sánchez-Duarte, R.G.; Álvarez-Sánchez, J.; Martínez-Macías, M.d.R. Effect of Temperature on Diluate Water in Batch Electrodialysis Reversal. Separations 2021, 8, 229. [Google Scholar] [CrossRef]
  44. Rotta, J.; Ozório, R.Á.; Kehrwald, A.M.; de Oliveira Barra, G.M.; de Melo Castanho Amboni, R.D.; Barreto, P.L.M. Parameters of color, transparency, water solubility, wettability and surface free energy of chitosan/hydroxypropylmethylcellulose (HPMC) films plasticized with sorbitol. Mater. Sci. Eng. C 2009, 29, 619–623. [Google Scholar] [CrossRef]
  45. Armendáriz-Ontiveros, M.M.; Álvarez-Sánchez, J.; Dévora-Isiordia, G.E.; García, A.; Fimbres Weihs, G.A. Effect of seawater variability on endemic bacterial biofouling of a reverse osmosis membrane coated with iron nanoparticles (FeNPs). Chem. Eng. Sci. 2020, 223, 115753. [Google Scholar] [CrossRef]
  46. Lee, K.P.; Arnot, T.C.; Mattia, D. A review of reverse osmosis membrane materials for desalination—Development to date and future potential. J. Membr. Sci. 2011, 370, 1–22. [Google Scholar] [CrossRef]
  47. NOM-127-SSA1-1994, Salud Ambiental, Agua Para Uso y Consumo Humano-Límites Permisibles de Calidad y Tratamiento a Que Debe Someterse el Agua Para Su Potabilización. 1994. Available online: http://dof.gob.mx/nota_detalle.php?codigo=2063863&fecha=31/12/1969 (accessed on 28 July 2022).
  48. Robles-Lizárraga, A.; Martínez-Macías, M.R.; Encinas-Guzmán, M.I.; Larraguibel-Aganza, O.J.; Rodríguez-López, J.; Dévora-Isiordia, G.E. Design of reverse osmosis desalination plant in puerto peñasco, sonora, méxico. Desalination Water Treat. 2020, 175, 1–10. [Google Scholar] [CrossRef]
  49. World Health Organization. Guidelines for Drinking-Water Quality; World Health Organization: Geneva, Switzerland, 2011; Volume 1. [Google Scholar]
  50. Armendáriz-Ontiveros, M.M.; García García, A.; Mai-Prochnow, A.; Fimbres Weihs, G.A. Optimal loading of iron nanoparticles on reverse osmosis membrane surface to reduce biofouling. Desalination 2022, 540, 115997. [Google Scholar] [CrossRef]
  51. Koutsou, C.P.; Kritikos, E.; Karabelas, A.J.; Kostoglou, M. Analysis of temperature effects on the specific energy consumption in reverse osmosis desalination processes. Desalination 2020, 476, 114213. [Google Scholar] [CrossRef]
  52. Pérez-Ruiz, E.R.; Vivoni, E.R.; Yépez, E.A.; Rodríguez, J.C.; Gochis, D.J.; Robles-Morua, A.; Delgado-Balbuena, J.; Adams, D.K. Landscape Controls on Water-Energy-Carbon Fluxes Across Different Ecosystems During the North American Monsoon. J. Geophys. Res. Biogeosci. 2021, 126, e2020JG005809. [Google Scholar] [CrossRef]
  53. Dhimish, M.; Tyrrell, A.M. Power loss and hotspot analysis for photovoltaic modules affected by potential induced degradation. NPJ Mater. Degrad. 2022, 6, 11. [Google Scholar] [CrossRef]
Figure 1. Diagram schematic of RO desalination plant.
Energies 15 07787 g001
Figure 2. (a) Spreading cooling system of the PV modules and (b) photograph of the cooling system.
Energies 15 07787 g002
Figure 3. (a) Schematic representation of temperature measurements points of 24 PV spray-cooling modules and control PV module, and (b) photograph of PV panels.
Energies 15 07787 g003
Figure 4. Working pressure and specific energy consumption.
Energies 15 07787 g004
Figure 5. Permeate salinity and salt rejection.
Energies 15 07787 g005
Figure 6. Polarization factor and diffusivity in the membrane.
Energies 15 07787 g006
Figure 7. Irradiance, cooling water and PV temperature during operation in winter, spring and summer.
Energies 15 07787 g007
Figure 8. Changes in temperature for the PV panels and cooling water after the cooling system in winter, spring and summer.
Energies 15 07787 g008
Figure 9. (a) Global heat transfer coefficient in different seasons of the year and (b) energy efficiency for the PV module in different seasons of the year. C = cooling system and WC = without cooling system.
Energies 15 07787 g009
Figure 10. Correlation between initial investment and BWRO capacity. EPC = Engineering, procurement and construction.
Energies 15 07787 g010
Table 1. Electrical generation properties for the REC Solar REC240PE-BLK modules at standard test conditions.
ParameterValue
Rated power (W)240
Rated voltage (V)30.4
Rated current (A)7.9
Short circuit current (A)8.4
Open circuit voltage (V)37.7
Efficiency (η) (%)14.5
Cells60
Effective area (AP) (m−2)1.65
Table 2. Technical specifications for the M215-60-2LL-S micro-inverter.
ParameterValue
Recommended input power (W)190–270
Maximum DC input voltage (V)48
Rated output power (W)215
Nominal frequency (Hz)60
Operating temperature (°C)−40–65
Efficiency (%)96.5
Table 3. Desalinated water cost.
T (°C)SEC (60%)c&m (27%)mp (6.5%)m (3.6%)ch (2.9%)TC
kWh m−3USD kWh−1USD m3USD m−3
204.41.020.22440.1010.0240.0130.0110.374
234.31.020.21930.0990.0240.0130.0110.366
263.91.020.19890.0900.0220.0120.0100.332
303.51.020.17850.0800.0190.0110.0090.298
Publisher’s Note: MDPI stays neutral with regard to jurisdictional claims in published maps and institutional affiliations.

