

Non-Destructive Electromagnetic Evaluation of Material Degradation Due to Steel Cutting in a Fully Stacked Electrical Machine


Abstract
:1. Introduction
2. Degradation Effects Due to Cutting Process and Lamination Stacking
- It allows complete freedom of design without accounting for any locations for welding or interlocking.
- No impact on magnetic properties.
- Improved heat dissipation and higher thermal conductivity. Furthermore, a better heat transfer between the laminations and the housing, thus a lighter and lower cost cooling unit can be utilized.
- Dimensional accuracy of the stacked laminations with the narrowest manufacturing tolerances.
- Mechanical stability without any tensions or heat expansion is similar to those caused by traditional welding.
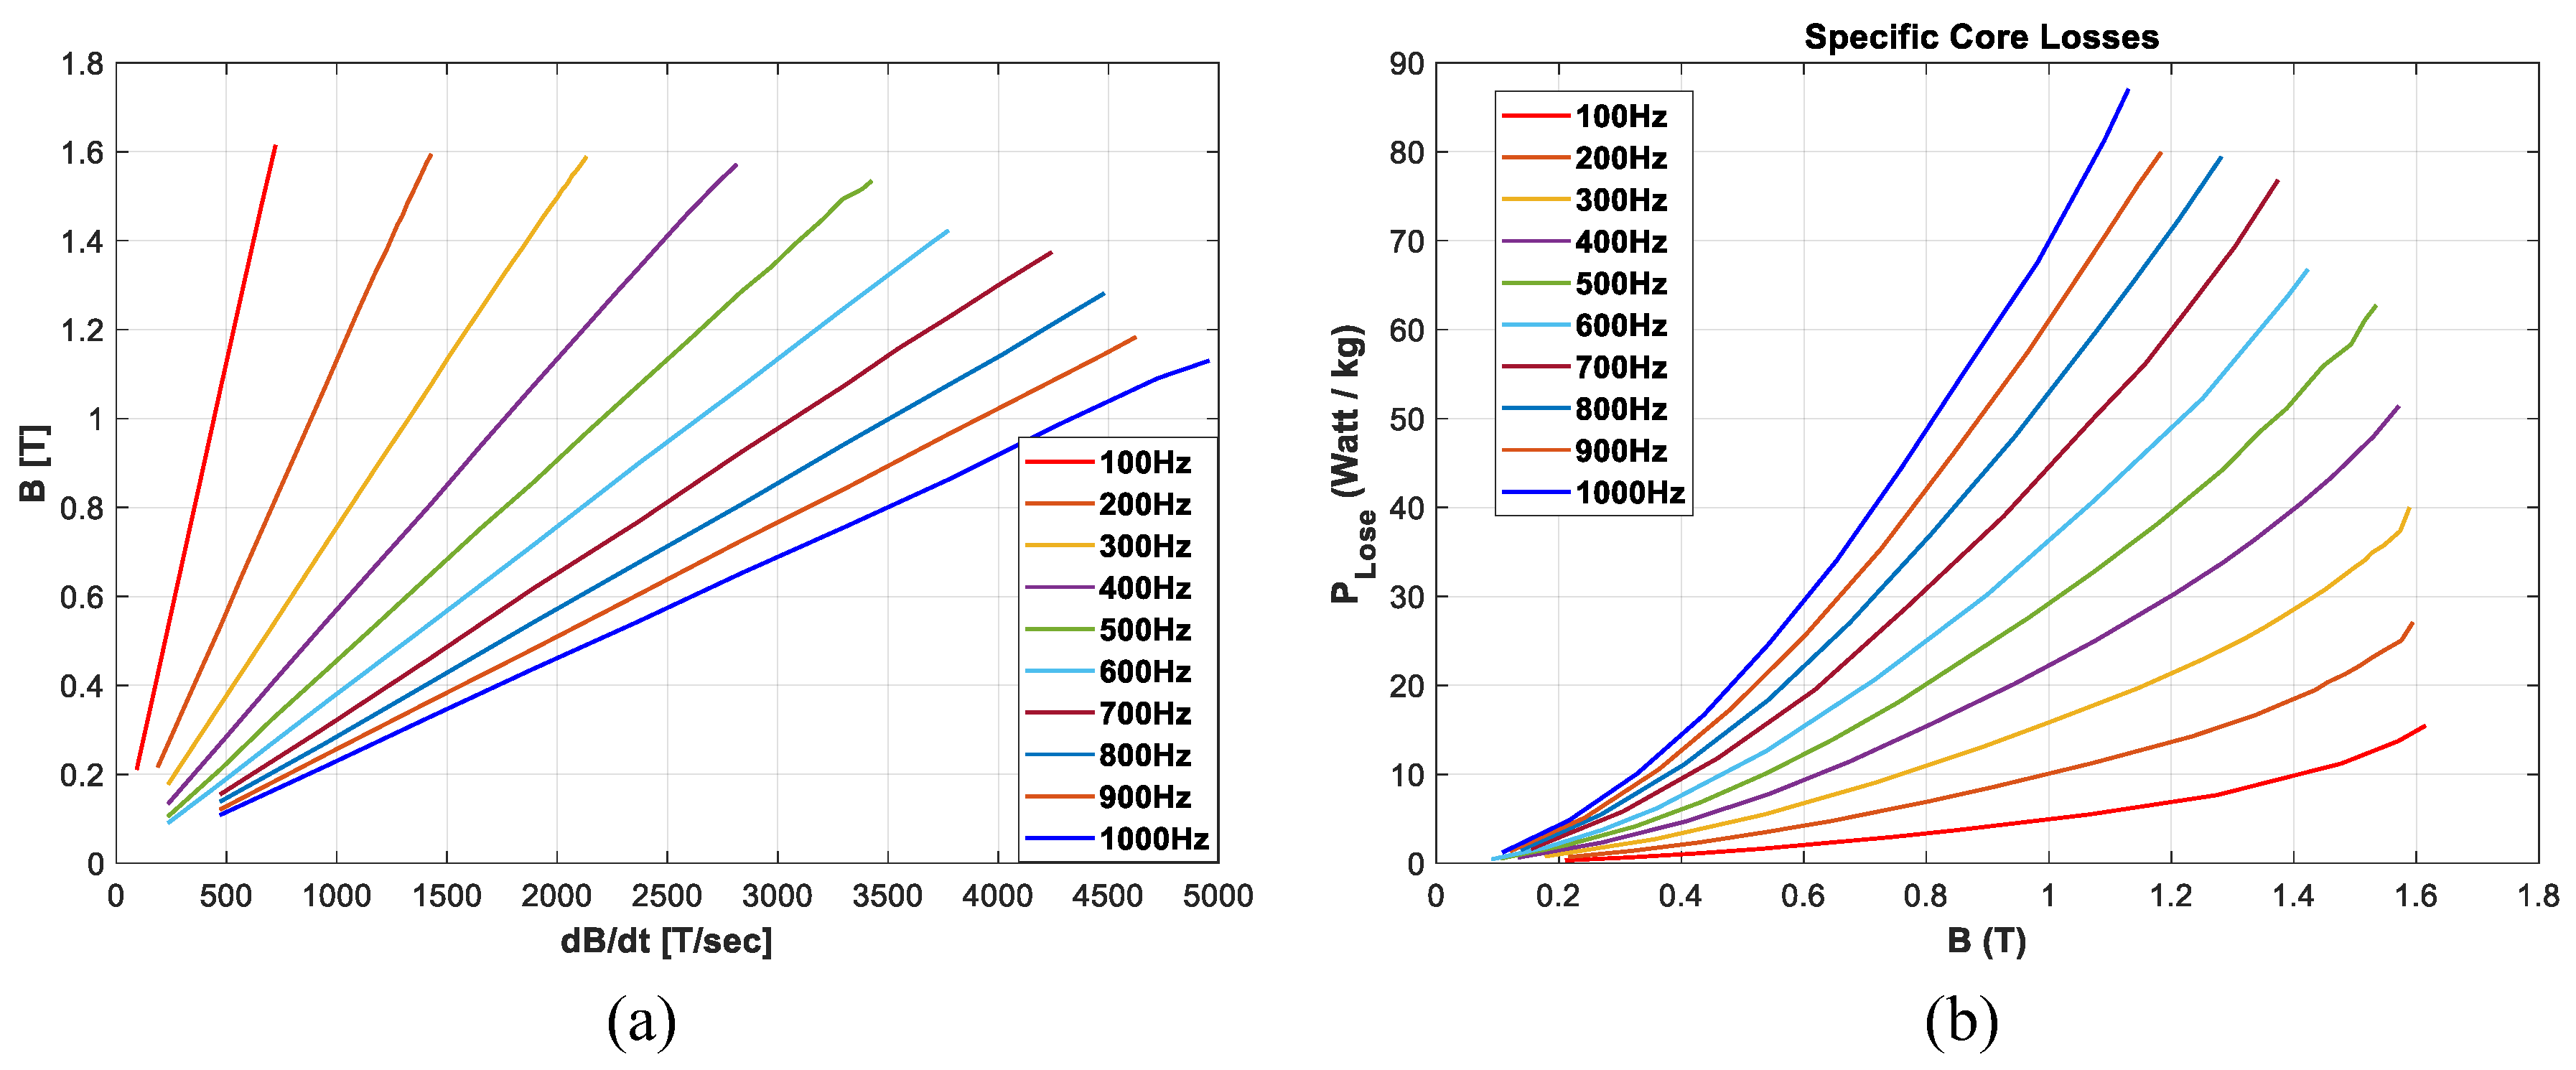
3. Magnetic Material Computations
4. Sample Preparation and Measurement Results
4.1. Individual Lamination Characterization
4.2. Characterization of Full Axial Length Stator
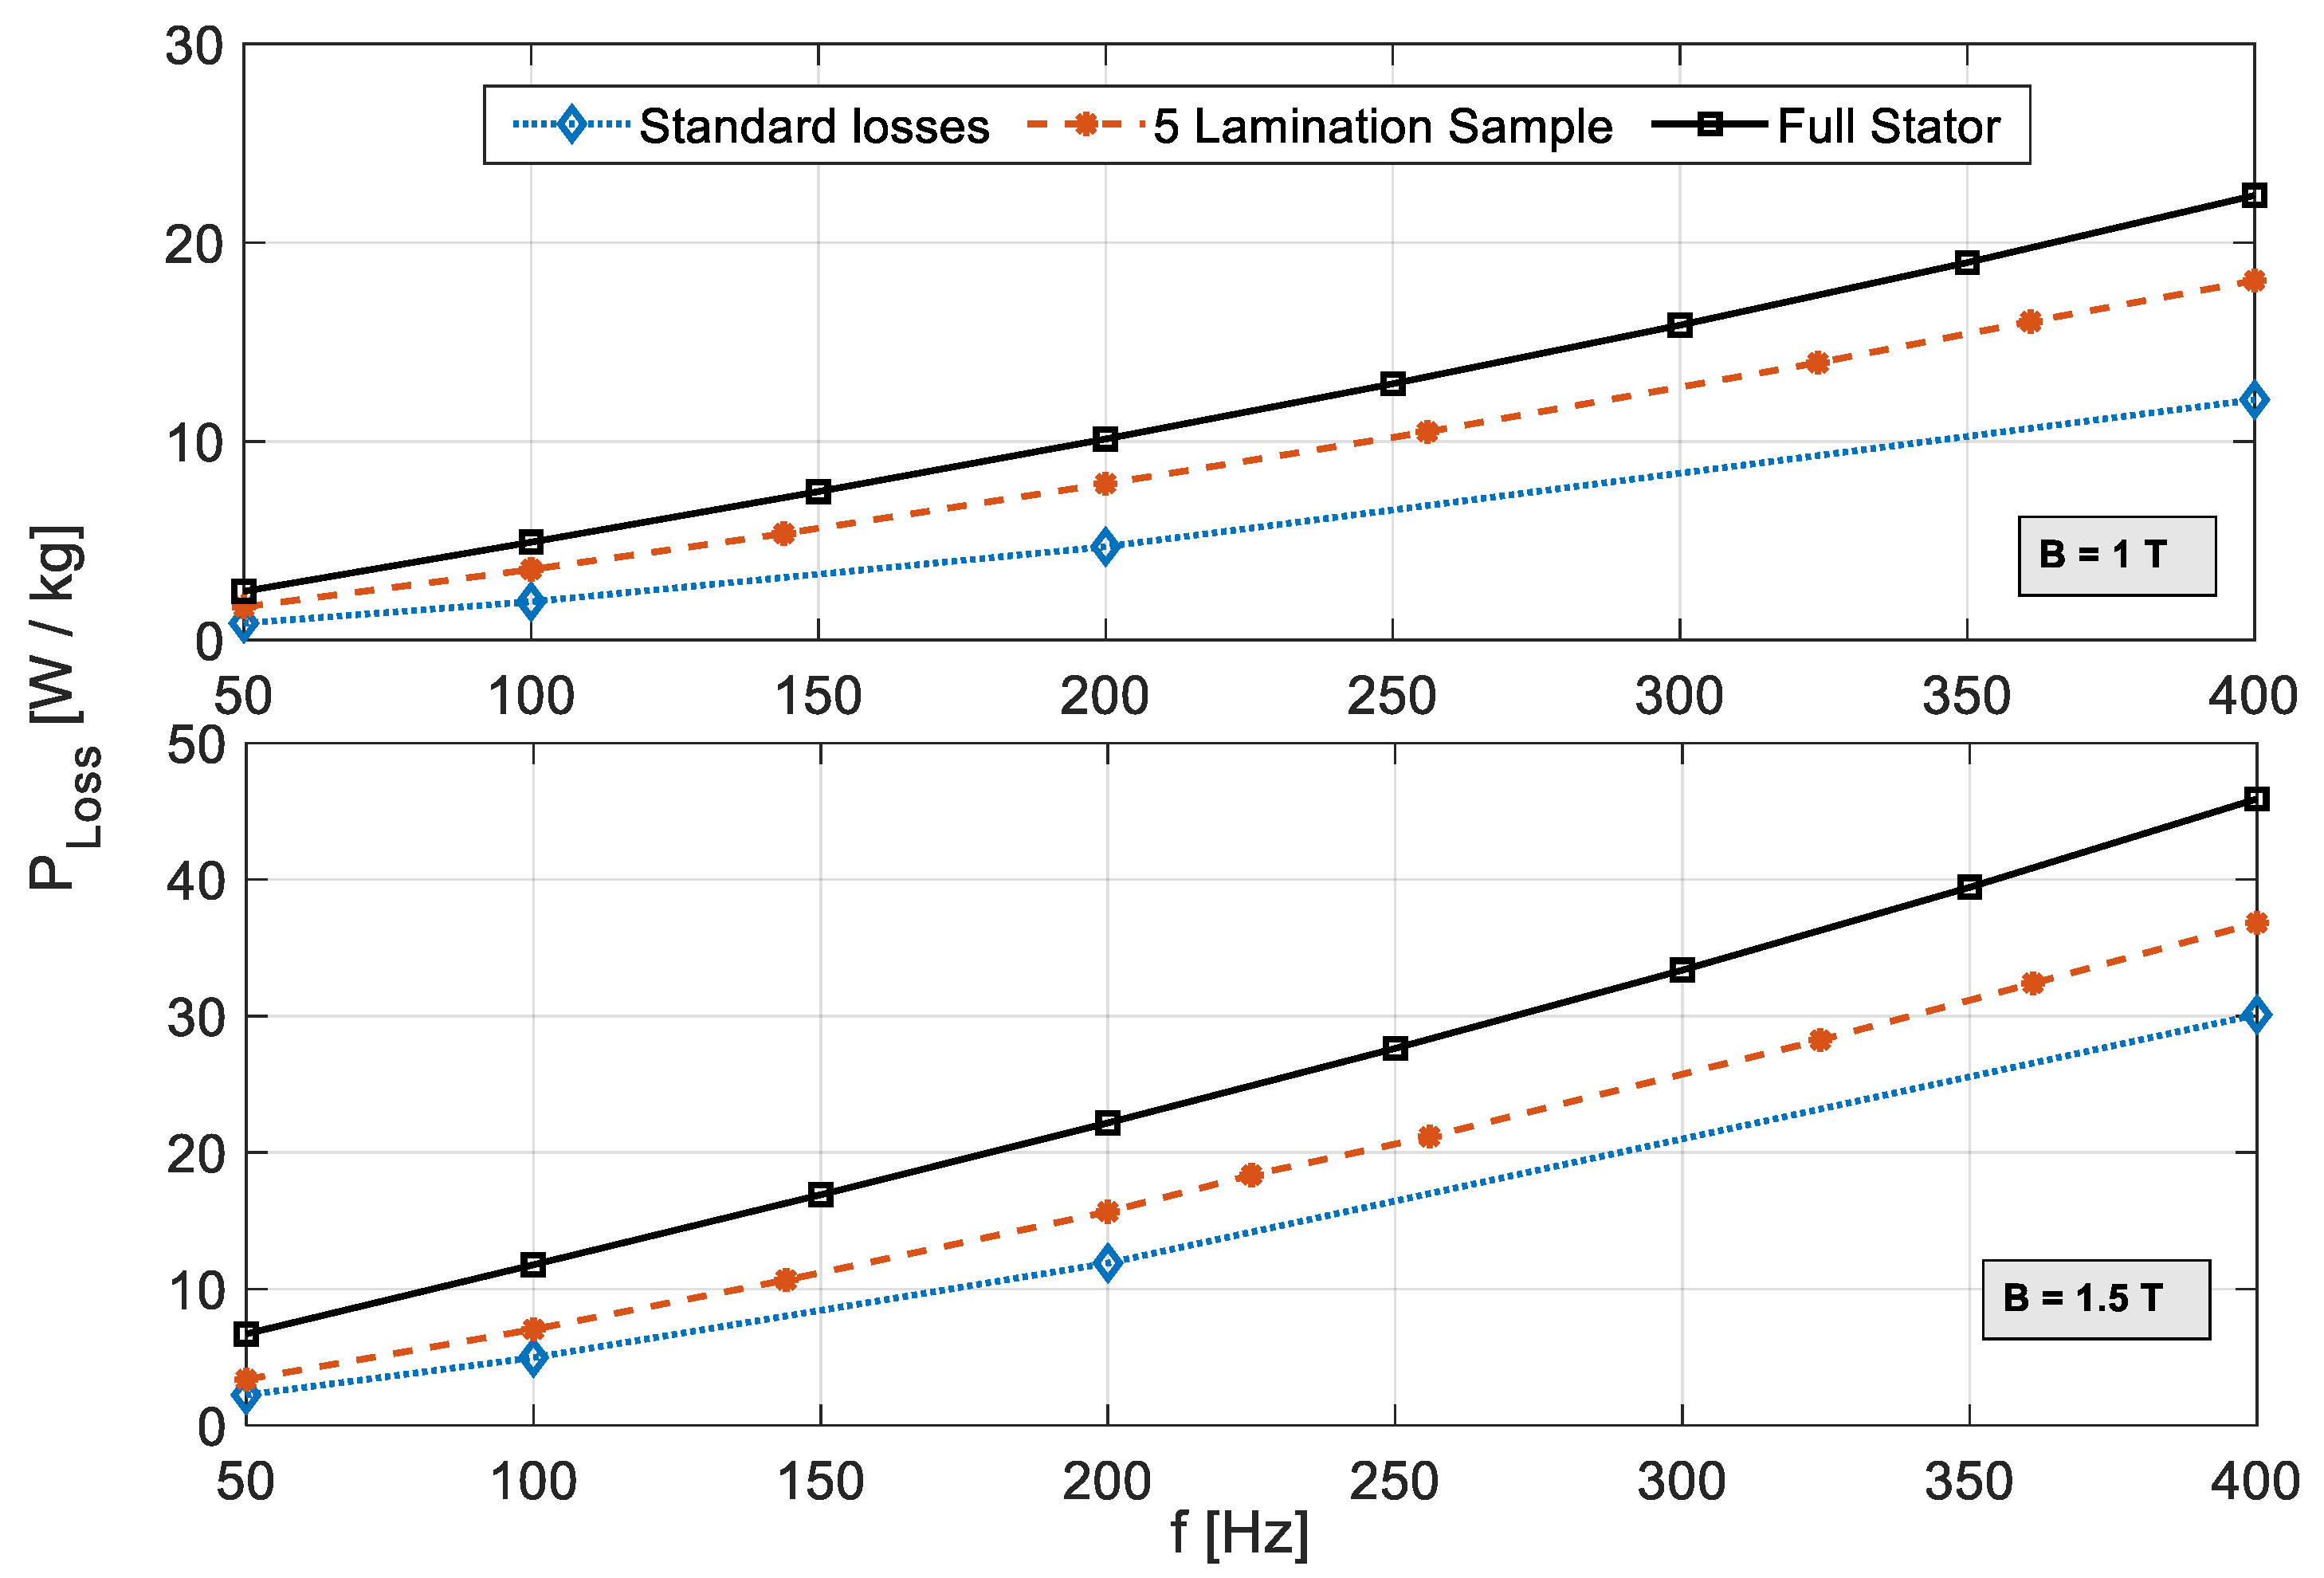
4.3. Core Losses Comparison
5. Conclusions
Author Contributions
Funding
Conflicts of Interest
Appendix A
| Property | Typical Values |
| Nominal thickness | 0.20 mm |
| Mass density | 7650 kg/m3 |
| Electrical resistivity at 23 °C | 51 μΩ·cm |
| Thermal conductivity at 23 °C | 23 Watt/(m·K) |
| Thermal expansion 0–100 °C | 12 × 10−6/°C |
| Yield strength Rp0.2 | 360 MPa |
| Tensile strength Rm | 450 MPa |
| Standard specific loss at 1.0 T and 400 Hz | 12.1 W/kg |
| Standard specific loss at 1.5 T and 400 Hz | 30.1 W/kg |
References
- Tietz, M.; Biele, P.; Jansen, A.; Herget, F.; Telger, K.; Hameyer, K. Application-specific development of non-oriented electrical steel for EV traction drives. In Proceedings of the 2012 2nd International Electric Drives Production Conference (EDPC), Nuremberg, Germany, 15–18 October 2012; pp. 1–5. [Google Scholar]
- Ibrahim, M.N.; Sergeant, P.; Rashad, E.M. Synchronous Reluctance Motor Performance Based on Different Electrical Steel Grades. IEEE Trans. Magn. 2015, 51, 7403304. [Google Scholar] [CrossRef] [Green Version]
- Fernando, N.; Vakil, G.; Arumugam, P.; Amankwah, E.; Gerada, C.; Bozhko, S. Impact of Soft Magnetic Material on Design of High-Speed Permanent-Magnet Machines. IEEE Trans. Ind. Electron. 2017, 64, 2415–2423. [Google Scholar] [CrossRef]
- Selema, A.; Ibrahim, M.N.; Sergeant, P. Metal Additive Manufacturing for Electrical Machines: Technology Review and Latest Advancements. Energies 2022, 15, 1076. [Google Scholar] [CrossRef]
- Selema, A.; Ibrahim, M.N.; Sergeant, P. Electrical Machines Winding Technology: Latest Advancements For Transportation Electrification. Machines 2022, 10, 563. [Google Scholar] [CrossRef]
- Lavers, J.; Biringer, P.; Hollitscher, H. A simple method of estimating the minor loop hysteresis loss in thin laminations. IEEE Trans. Magn. 1978, 14, 386–388. [Google Scholar] [CrossRef]
- Bertotti, G. General properties of power losses in soft ferromagnetic materials. IEEE Trans. Magn. 1988, 24, 621–630. [Google Scholar] [CrossRef]
- Atallah, K.; Zhu, Z.Q.; Howe, D. An improved method for predicting iron losses in brushless permanent magnet DC drives. IEEE Trans. Magn. 1992, 28, 2997–2999. [Google Scholar] [CrossRef]
- Miller, J.R.; Hendershot, T.J.E. Design of Brushless Permanent-Magnet Motors; Magna Physics: Mentor, OH, USA, 1994.
- Ma, L.; Sanada, M.; Morimoto, S.; Takeda, Y. Prediction of iron loss in rotating machines with rotational loss included. IEEE Trans. Magn. 2003, 39, 2036–2041. [Google Scholar] [CrossRef]
- Domeki, H.; Ishihara, Y.; Kaido, C.; Kawase, Y.; Kitamura, S.; Shimomura, T.; Takahashi, N.T.; Yamada, T.; Yamazaki, K. Investigation of Benchmark Model for Estimating Iron Loss in Rotating Machine. IEEE Trans. Magn. 2004, 40, 794–797. [Google Scholar] [CrossRef]
- Ionel, D.M.; Popescu, M.; Dellinger, S.J.; Miller, T.J.E.; Heideman, R.J.; McGilp, M.I. On the variation with flux and frequency of the core loss coefficients in electrical machines. IEEE Trans. Ind. Appl. 2006, 42, 658–667. [Google Scholar] [CrossRef]
- de la Barriere, O.; Ragusa, C.; Appino, C.; Fiorillo, F. Prediction of Energy Losses in Soft Magnetic Materials Under Arbitrary Induction Waveforms and DC Bias. IEEE Trans. Ind. Electron. 2017, 64, 2522–2529. [Google Scholar] [CrossRef]
- Chiang, C.-C.; Knight, A.M.; Hsieh, M.-F.; Tsai, M.-G.; Liu, B.H.; Chen, I.-G.; Gaing, Z.-L.; Tsai, M.-C. Effects of Annealing on Magnetic Properties of Electrical Steel and Performances of SRM After Punching. IEEE Trans. Magn. 2014, 50, 8203904. [Google Scholar] [CrossRef]
- Chiang, C.-C.; Hsieh, M.-F.; Li, Y.-H.; Tsai, M.-C. Impact of Electrical Steel Punching Process on the Performance of Switched Reluctance Motors. IEEE Trans. Magn. 2015, 51, 8113304. [Google Scholar] [CrossRef]
- Steentjes, S.; Franck, D.; Hameyer, K.; Vogt, S.; Bednarz, M.; Volk, W.; Dierdorf, J.; Hirt, G.; Schnabel, V.; Mathur, H.N.; et al. On the effect of material processing: Microstructural and magnetic properties of electrical steel sheets. In Proceedings of the 2014 4th International Electric Drives Production Conference (EDPC), Nuremberg, Germany, 30 September–1 October 2014; pp. 1–7. [Google Scholar]
- Kuo, S.-K.; Lee, W.-C.; Lin, S.-Y.; Lu, C.-Y. The Influence of Cutting Edge Deformations on Magnetic Performance Degradation of Electrical Steel. IEEE Trans. Ind. Appl. 2015, 51, 4357–4363. [Google Scholar] [CrossRef]
- Lazari, P.; Wang, J.; Atallah, K. Effects of laser cut on the performance of permanent magnet assisted synchronous reluctance machines. IEEE Trans. Magn. 2015, 51, 8114305. [Google Scholar]
- Ho, K.; Newman, S. State of the art electrical discharge machining (EDM). Int. J. Mach. Tools Manuf. 2003, 43, 1287–1300. [Google Scholar] [CrossRef]
- Schoppa, A.; Louis, H.; Pude, F.; von Rad, C. Influence of abrasive waterjet cutting on the magnetic properties of non-oriented electrical steels. J. Magn. Magn. Mater. 2003, 254–255, 370–372. [Google Scholar] [CrossRef]
- Boglietti, A.; Cavagnino, A.; Ferraris, L.; Lazzari, M. The annealing influence onto the magnetic and energetic properties in soft magnetic material after punching process. In Proceedings of the IEEE International Electric Machines and Drives Conference, Madison, WI, USA, 1–4 June 2003; Volume 1, pp. 503–508. [Google Scholar]
- Kurosaki, Y.; Mogi, H.; Fujii, H.; Kubota, T.; Shiozaki, M. Importance of punching and workability in non-oriented electrical steel sheets. J. Magn. Magn. Mater. 2008, 320, 2474–2480. [Google Scholar] [CrossRef]
- Emura, M.; Landgraf, F.J.; Ross, W.; Barreta, J. The influence of cutting technique on the magnetic properties of electrical steels. J. Magn. Magn. Mater. 2003, 254–255, 358–360. [Google Scholar] [CrossRef]
- Araujo, E.G.; Schneider, J.; Verbeken, K.; Pasquarella, G.; Houbaert, Y. Dimensional Effects on Magnetic Properties of Fe–Si Steels Due to Laser and Mechanical Cutting. IEEE Trans. Magn. 2010, 46, 213–216. [Google Scholar] [CrossRef] [Green Version]
- Selema, A. Development of a Three-Phase Dual-Rotor Magnetless Flux Switching Generator for Low Power Wind Turbines. IEEE Trans. Energy Convers. 2020, 35, 828–836. [Google Scholar] [CrossRef]
- Schoppa, A.; Schneider, J.; Roth, J.-O. Influence of the cutting process on the magnetic properties of non-oriented electrical steels. J. Magn. Magn. Mater. 2000, 215–216, 100–102. [Google Scholar] [CrossRef]
- Bourchas, K.; Stening, A.; Soulard, J.; Broddefalk, A.; Lindenmo, M.; Dahlen, M.; Gyllensten, F. Quantifying Effects of Cutting and Welding on Magnetic Properties of Electrical Steels. IEEE Trans. Ind. Appl. 2017, 53, 4269–4278. [Google Scholar] [CrossRef] [Green Version]
- Manescu-Paltanea, V.; Paltanea, G.; Nemoianu, I.V. Degradation of Static and Dynamic Magnetic Properties of Non-Oriented Steel Sheets by Cutting. IEEE Trans. Magn. 2018, 54, 2001705. [Google Scholar] [CrossRef]
- Hofmann, M.; Naumoski, H.; Herr, U.; Herzog, H.-G. Magnetic Properties of Electrical Steel Sheets in Respect of Cutting: Micromagnetic Analysis and Macromagnetic Modeling. IEEE Trans. Magn. 2016, 52, 2000114. [Google Scholar] [CrossRef]
- Crevecoeur, G.; Sergeant, P.; Dupre, L.; Vandenbossche, L.; Van de Walle, R. Analysis of the Local Material Degradation Near Cutting Edges of Electrical Steel Sheets. IEEE Trans. Magn. 2008, 44, 3173–3176. [Google Scholar] [CrossRef]
- Daem, A.; Sergeant, P.; Dupré, L.; Ibrahim, M.N. Modeling Interlocking Effects on Core Losses in Electrical Steel. IEEJ Trans. Electr. Electron. Eng. 2020, 15, 1836–1843. [Google Scholar] [CrossRef]
- Daem, A. Measuring magnetic properties in stack structures of non-grain oriented electrical steel laminations. In Proceedings of the Young Researchers Symposium, Brussels, Belgium, 7–8 December 2018. [Google Scholar]
- Sundaria, R.; Hemeida, A.; Arkkio, A.; Daem, A.; Sergeant, P.; Belahcen, A. Effect of Different Cutting Techniques on Magnetic Properties of Grain Oriented Steel Sheets and Axial Flux Machines. In Proceedings of the IECON 2019—45th Annual Conference of the IEEE Industrial Electronics Society, Lisbon, Portugal, 14–17 October 2019; pp. 1022–1027. [Google Scholar]
- Selema, A.; Osheba, D.; El-Shanawany, M.; Tahoun, S. Design and Analysis of a Brushless Three Phase Flux Switching Generator for Aircraft Auxiliary Power Unit. In Proceedings of the 2018 Twentieth International Middle East Power Systems Conference, Cairo, Egypt, 18–20 December 2018; pp. 198–202. [Google Scholar] [CrossRef]
- Selema, A.; Osheba, D.; Tahoon, S.M. El-Shanawany Design and analysis of a three-phase brushless flux switching generator for aircraft ground power units. IET Electr. Power Appl. 2019, 13, 154–161. [Google Scholar] [CrossRef]
- Sundaria, R.; Daem, A.; Osemwinyen, O.; Lehikoinen, A.; Sergeant, P.; Arkkio, A.; Belahcen, A. Effects of stator core welding on an induction machine—Measurements and modeling. J. Magn. Magn. Mater. 2020, 499, 166280. [Google Scholar] [CrossRef] [Green Version]
- Daem, A.; Sergeant, P.; Dupré, L.; Chaudhuri, S.; Bliznuk, V.; Kestens, L. Magnetic Properties of Silicon Steel after Plastic Deformation. Materials 2020, 13, 4361. [Google Scholar] [CrossRef]
- Selema, A.; Ibrahim, M.N.; Sergeant, P. Mitigation of High-Frequency Eddy Current Losses in Hairpin Winding Machines. Machines 2022, 10, 328. [Google Scholar] [CrossRef]
- Selema, A.; Ibrahim, M.N.; Sergeant, P. Winding Losses of Inverter-Fed Synchronous Reluctance Machine Using Different Magnet Wire Topologies. In Proceedings of the 2022 IEEE 2nd International Conference on Sustainable Energy and Future Electric Transportation (SeFeT), Hyderabad, India, 4–6 August 2022; pp. 1–6. [Google Scholar]
- International, A. Standard Test Method for Alternating-Current Magnetic Properties of Materials at Power Frequencies Using Wattmeter-Ammeter-Voltmeter Method and 25-cm Epstein Test Frame. Available online: https://webstore.ansi.org/Standards/ASTM/astma343a343m03 (accessed on 14 October 2022).
- Selema, A.; Ibrahim, M.N.; Vansompel, H.; Sergeant, P. Development of Yokeless Axial Flux Machine Using 3D-Printed Shape-Profiled Core. In Proceedings of the 2022 International Conference on Electrical Machines (ICEM), Valencia, Spain, 5–8 September 2022. [Google Scholar]
- Zhang, Y.; Zhao, J.; Wang, L.; Guo, Y.; Li, Z.; Huang, J. Optimization of Two-Dimensional Rotational Single Sheet Tester. In Proceedings of the 2019 22nd International Conference on Electrical Machines and Systems (ICEMS), Harbin, China, 11–14 August 2019; pp. 1–4. [Google Scholar]
- Kahveci, A.; Szary, P.; Herget, F.; Putri, A.K.; Hameyer, K. Methods for hysteresis losses determinations at non-standard ring core geometries equivalent to Epstein measurements. In Proceedings of the 2016 6th International Electric Drives Production Conference (EDPC), Nuremberg, Germany, 30 November–1 December 2016; pp. 135–142. [Google Scholar]
- Krings, A.; Soulard, J.; Wallmark, O. PWM Influence on the Iron Losses and Characteristics of a Slotless Permanent-Magnet Motor With SiFe and NiFe Stator Cores. IEEE Trans. Ind. Appl. 2015, 51, 1475–1484. [Google Scholar] [CrossRef]
- Spitzenberger PAS Series of 4-Quadrant Amplifiers. Available online: https://coromatic.dk/76786_wp-uploads/2017/05/SPS-TD-PAS-Overview-e-0001.pdf (accessed on 10 October 2022).
- Selema, A.; Ibrahim, M.N.; Sergeant, P. Additively-Manufactured Ultra-Light Shaped-Profile Windings for HF Electrical Machines and Weight-Sensitive Applications. IEEE Trans. Transp. Electrif. 2022. [Google Scholar] [CrossRef]
- Hi-lite Thin Non-Oriented Electrical Steel NO20 Data Sheet. Available online: https://www.tatasteeleurope.com/sites/default/files/tata-steel-hi-lite-electrical-steel-no20-1350n-datasheet-en.pdf (accessed on 10 October 2022).


| Parameter | Value |
|---|---|
| Stack length | 78.5 mm |
| Stator outer diameter | 120 mm |
| Stator inner diameter | 62.5 mm |
| Yoke height | 11 mm |
| Pole arc | 30° |
| Pole width | 17.5 mm |
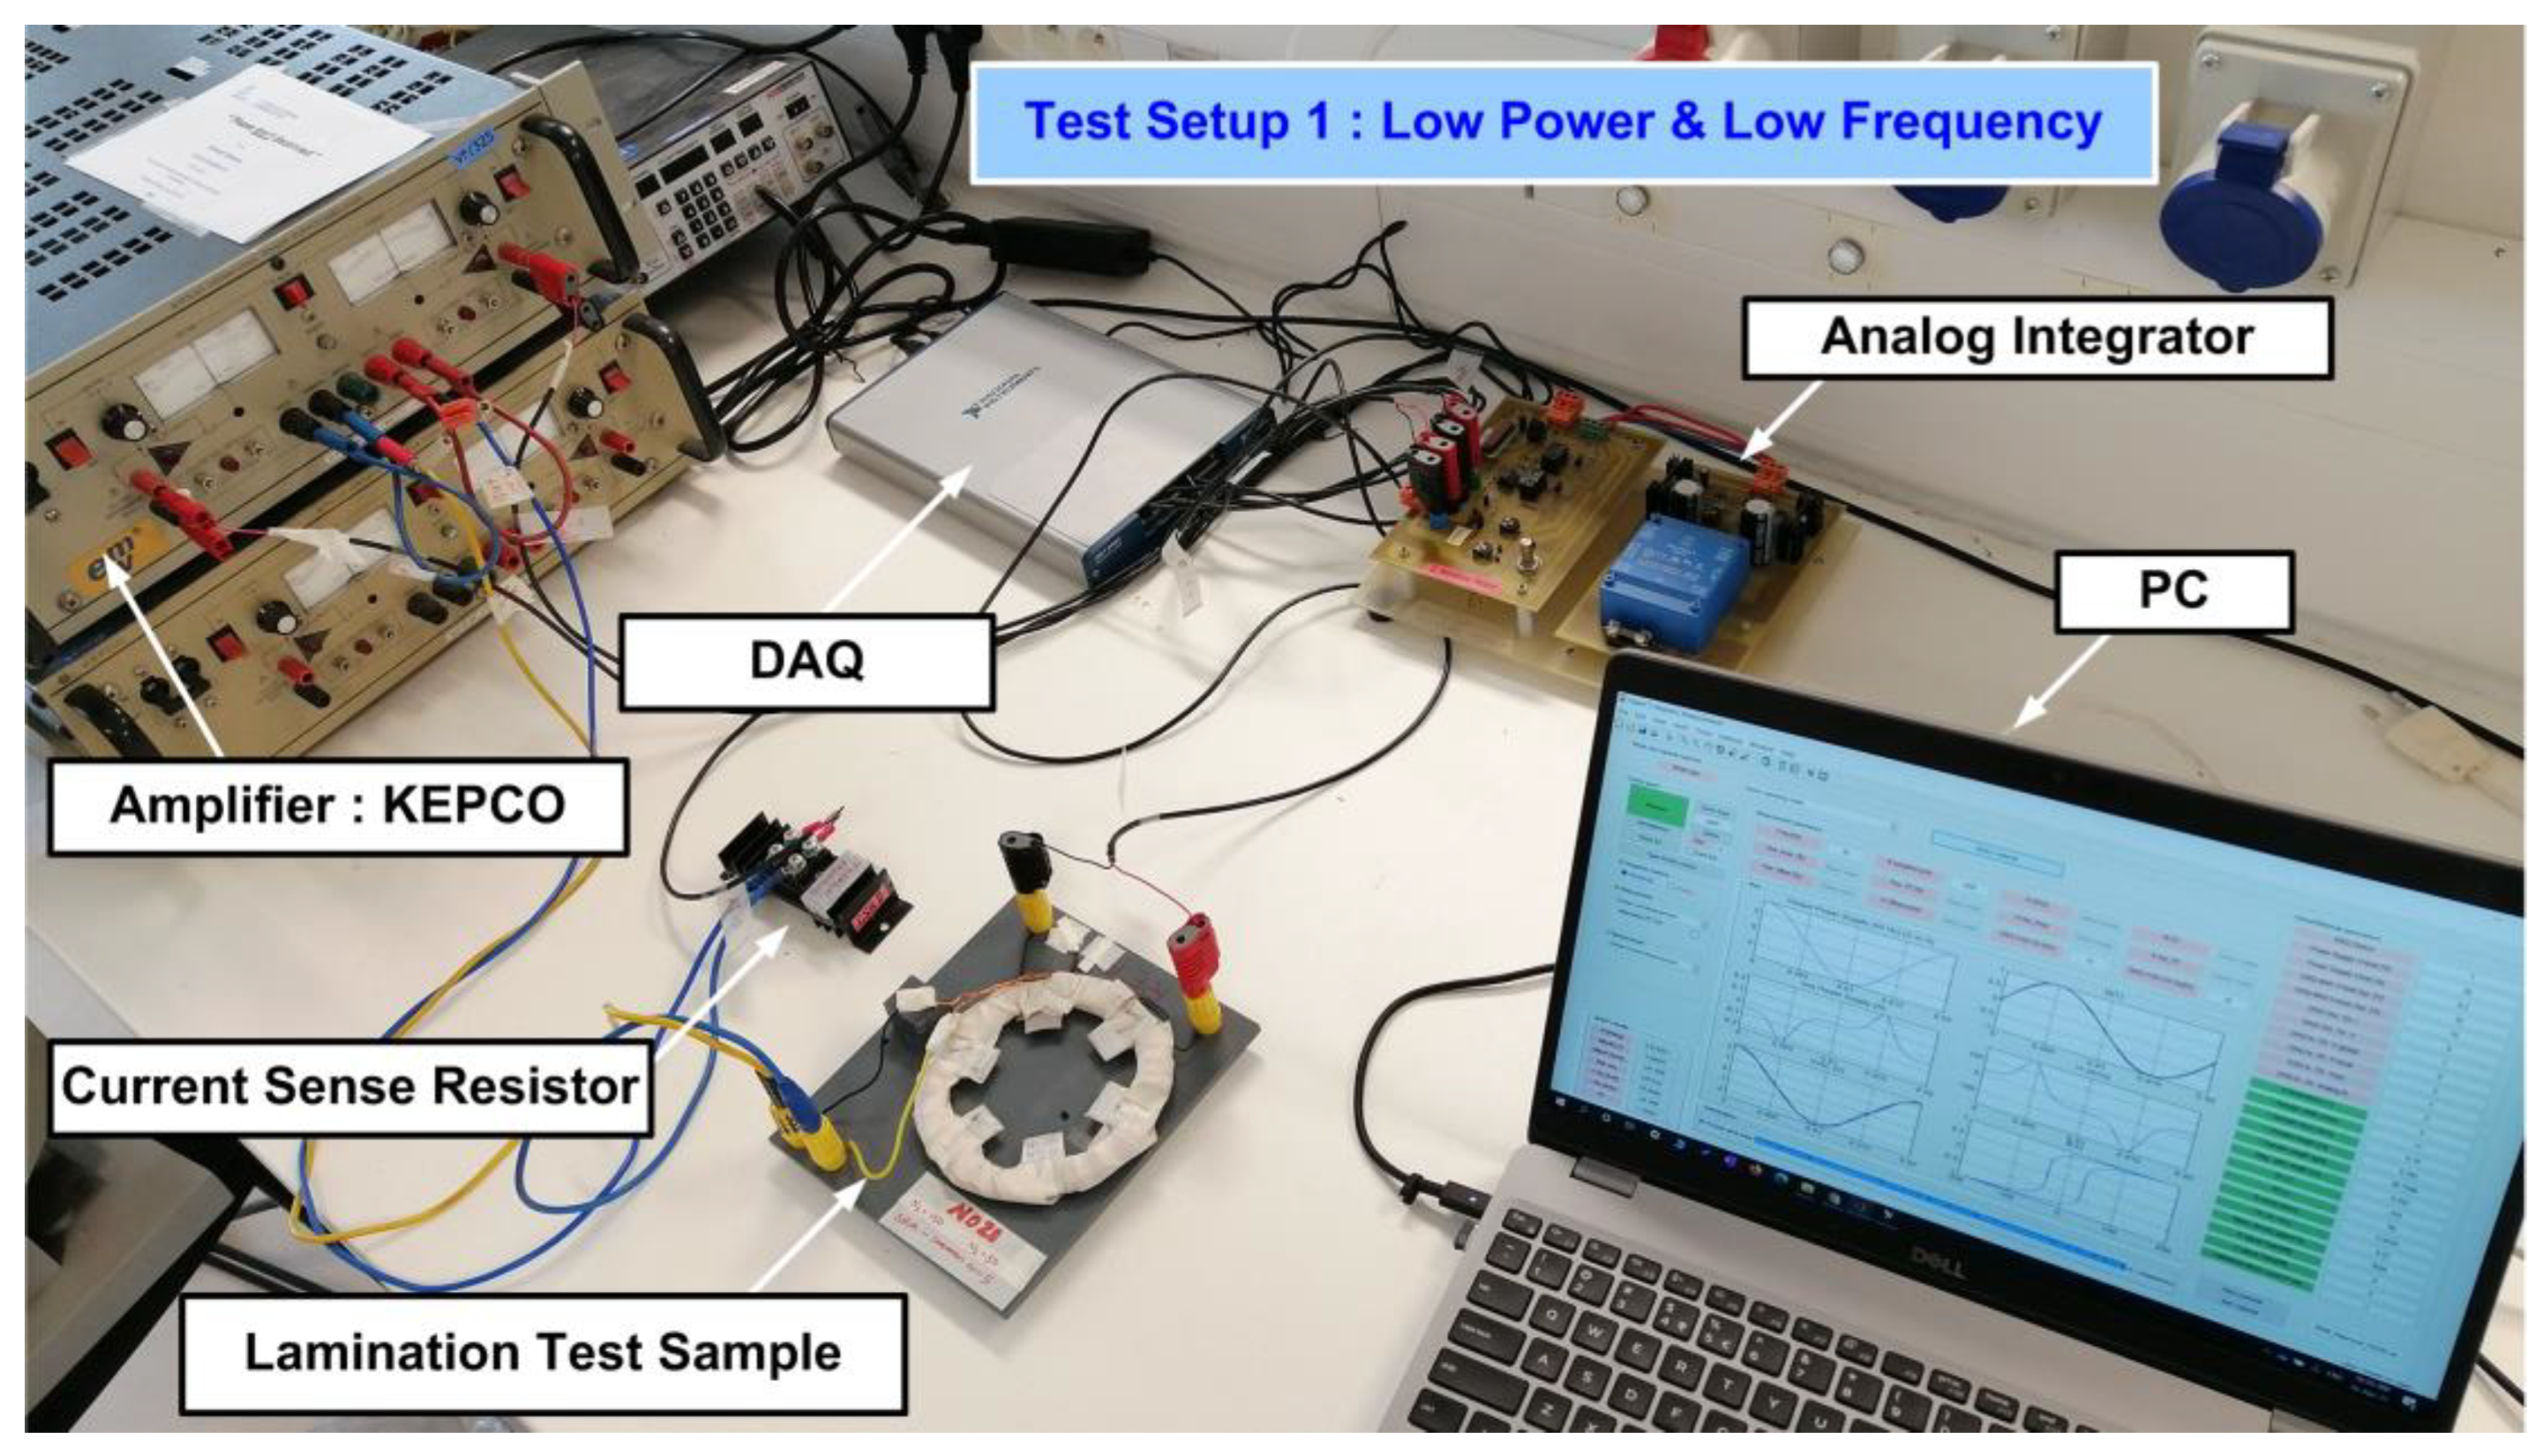
| Experimental Setup | Setup 1 | Setup 2 |
|---|---|---|
| Input power requirements | Up to 1 kVA | 1–25 kVA |
| Effective frequency range | 5–400 Hz | 50 Hz–5 kHz |
| Data acquisition card model | National Instrument 6366 | dSP MicroLabBox 1202 |
| Secondary voltage limits | ±10 V | ±1000 V |
| Sampling time | 1 × 10⁻³ | 1 × 10⁻⁴ |
| Tested sample example | Few laminations | Complete core |
| Selected input source | KEPCO | Spitzenberger |
| Model type | BOP 50–8M | PAS 10,000 |
| Peak output power | 800 VA | 10,000 VA |
| Source max voltage | 50 V | 270 V |
| Source max current | 8 A | 50 A |
| Test Sample | Sample 1 | Sample 2 |
|---|---|---|
| Material | NO20 | NO20 |
| Description | 5 laminations | SRM full stator |
| Manufacturing process | Laser cutting | Laser cutting and backlack joining |
| Primary wire | 0.25 mm2–8 Amp | 10 mm2–80 Amp |
| Primary coil | 150 turns | 24 turns |
| Secondary oil | 10 turns | 10 turns |
Publisher’s Note: MDPI stays neutral with regard to jurisdictional claims in published maps and institutional affiliations. |
© 2022 by the authors. Licensee MDPI, Basel, Switzerland. This article is an open access article distributed under the terms and conditions of the Creative Commons Attribution (CC BY) license (https://creativecommons.org/licenses/by/4.0/).
Share and Cite
Selema, A.; Ibrahim, M.N.; Sergeant, P. Non-Destructive Electromagnetic Evaluation of Material Degradation Due to Steel Cutting in a Fully Stacked Electrical Machine. Energies 2022, 15, 7862. https://0-doi-org.brum.beds.ac.uk/10.3390/en15217862
Selema A, Ibrahim MN, Sergeant P. Non-Destructive Electromagnetic Evaluation of Material Degradation Due to Steel Cutting in a Fully Stacked Electrical Machine. Energies. 2022; 15(21):7862. https://0-doi-org.brum.beds.ac.uk/10.3390/en15217862
Chicago/Turabian StyleSelema, Ahmed, Mohamed N. Ibrahim, and Peter Sergeant. 2022. "Non-Destructive Electromagnetic Evaluation of Material Degradation Due to Steel Cutting in a Fully Stacked Electrical Machine" Energies 15, no. 21: 7862. https://0-doi-org.brum.beds.ac.uk/10.3390/en15217862