
Evolution of the Anisotropic Thermal Conductivity of Oil Shale with Temperature and Its Relationship with Anisotropic Pore Structure Evolution
Abstract
:1. Introduction
2. Experimental Equipment and Experimental Procedures
2.1. Preparation of Test Pieces
2.2. Experimental Equipment and Procedures
3. Experimental Results
3.1. Oil Shale Weight Loss at Different Temperatures
- (1)
- Low-temperature weight loss stage, from room temperature to 350 °C
- (2)
- Medium temperature weight loss stage, 350~580 °C
- (3)
- High-temperature weight loss stage, 580~800 °C
3.2. Variation of the Anisotropic Pore and Fracture Structure at Different Temperatures
- (1)
- 20~300 °C
- (2)
- 300~400 °C
- (3)
- 400~600 °C
3.3. Variation of the Anisotropic Thermal Conductivity of the Oil Shale with Temperature
3.4. Variation of the Specific Heat Capacity of the Oil Shale with Temperature
4. Discussion
4.1. Relationship between Thermal Conductivity Evolution and Thermal Cracking
4.2. Application of the Experimental Results in Oil Shale Development Engineering
5. Conclusions
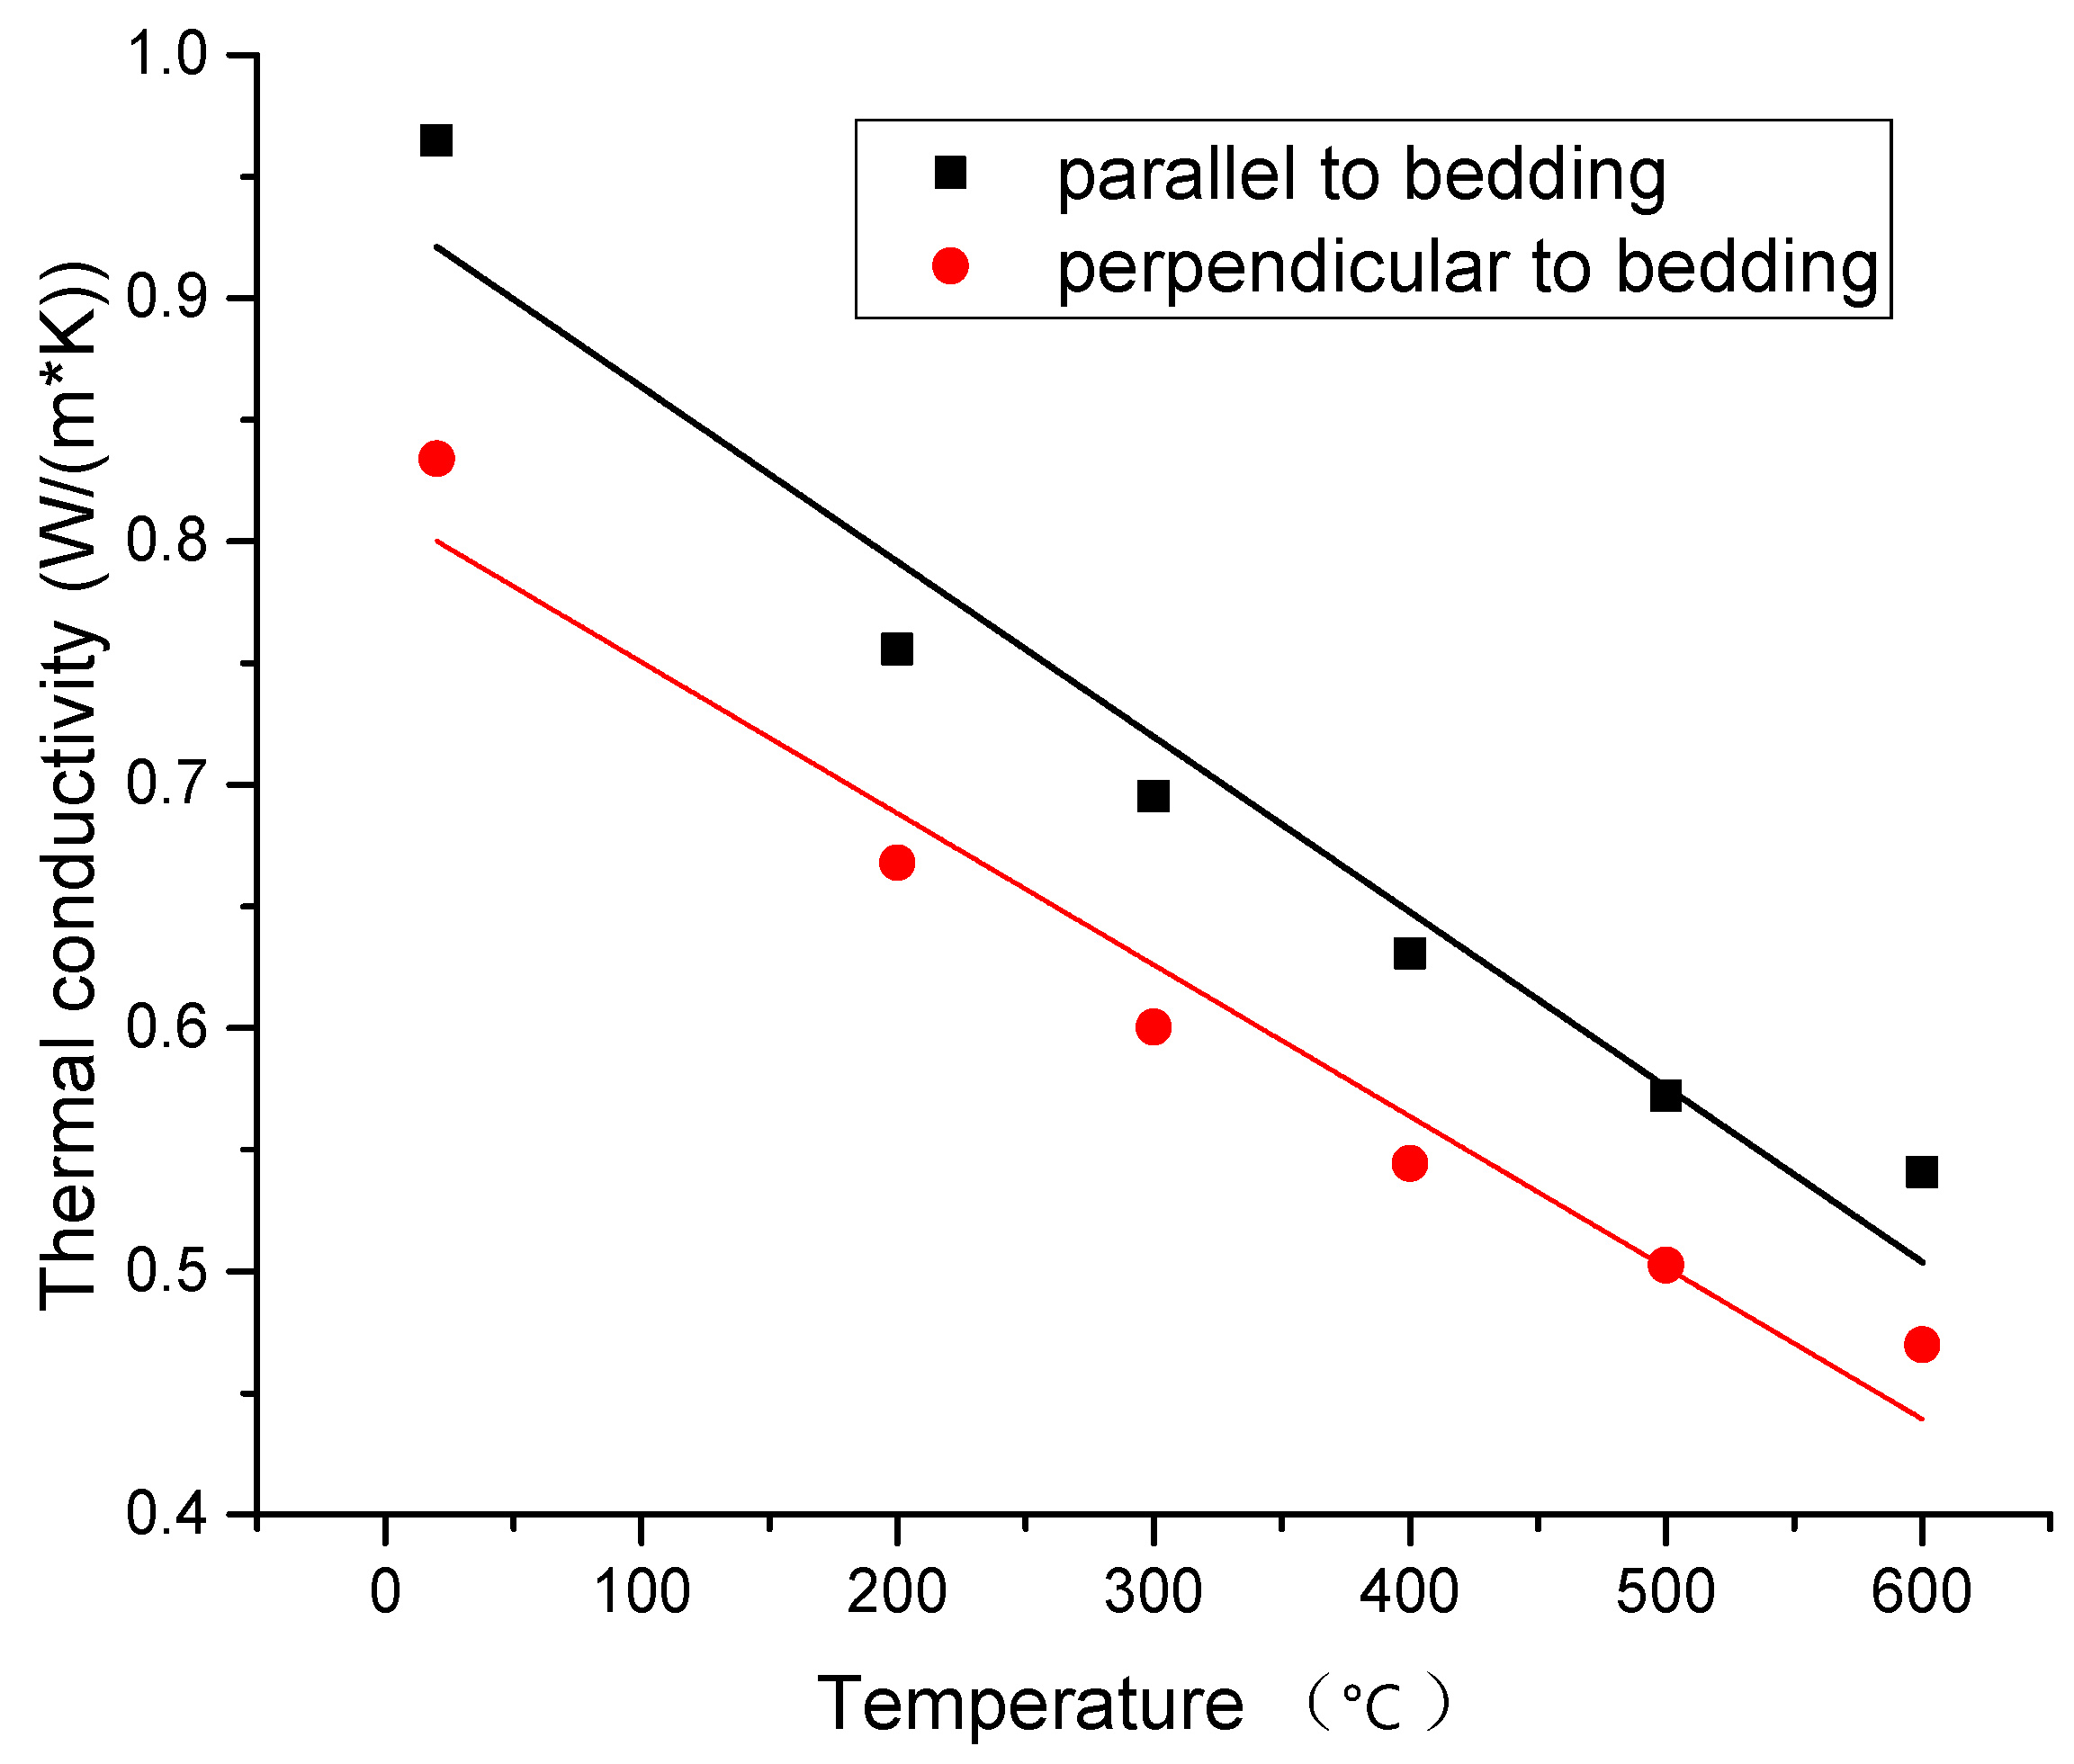
- (1)
- The thermal conductivity along the parallel bedding and the vertical bedding both decrease linearly with the increase in temperature, and the thermal conductivity along the parallel bedding is greater than that along the vertical bedding. The thermal conductivity ratio along the parallel bedding and the vertical bedding changes little with temperature.
- (2)
- The specific heat capacity first increases and then decreases with temperature and reaches its maximum at 400 °C. The reason why the maximum value is reached at 400 °C is that the pyrolysis of kerogen at 400 °C absorbs a lot of heat, resulting in the maximum specific heat capacity value being achieved.
- (3)
- The primary thermal conductivity anisotropy of oil shale is caused by sedimentary characteristics and natural fractures, while the change in the thermal conductivity anisotropy with temperature is caused by anisotropic thermal fractures.
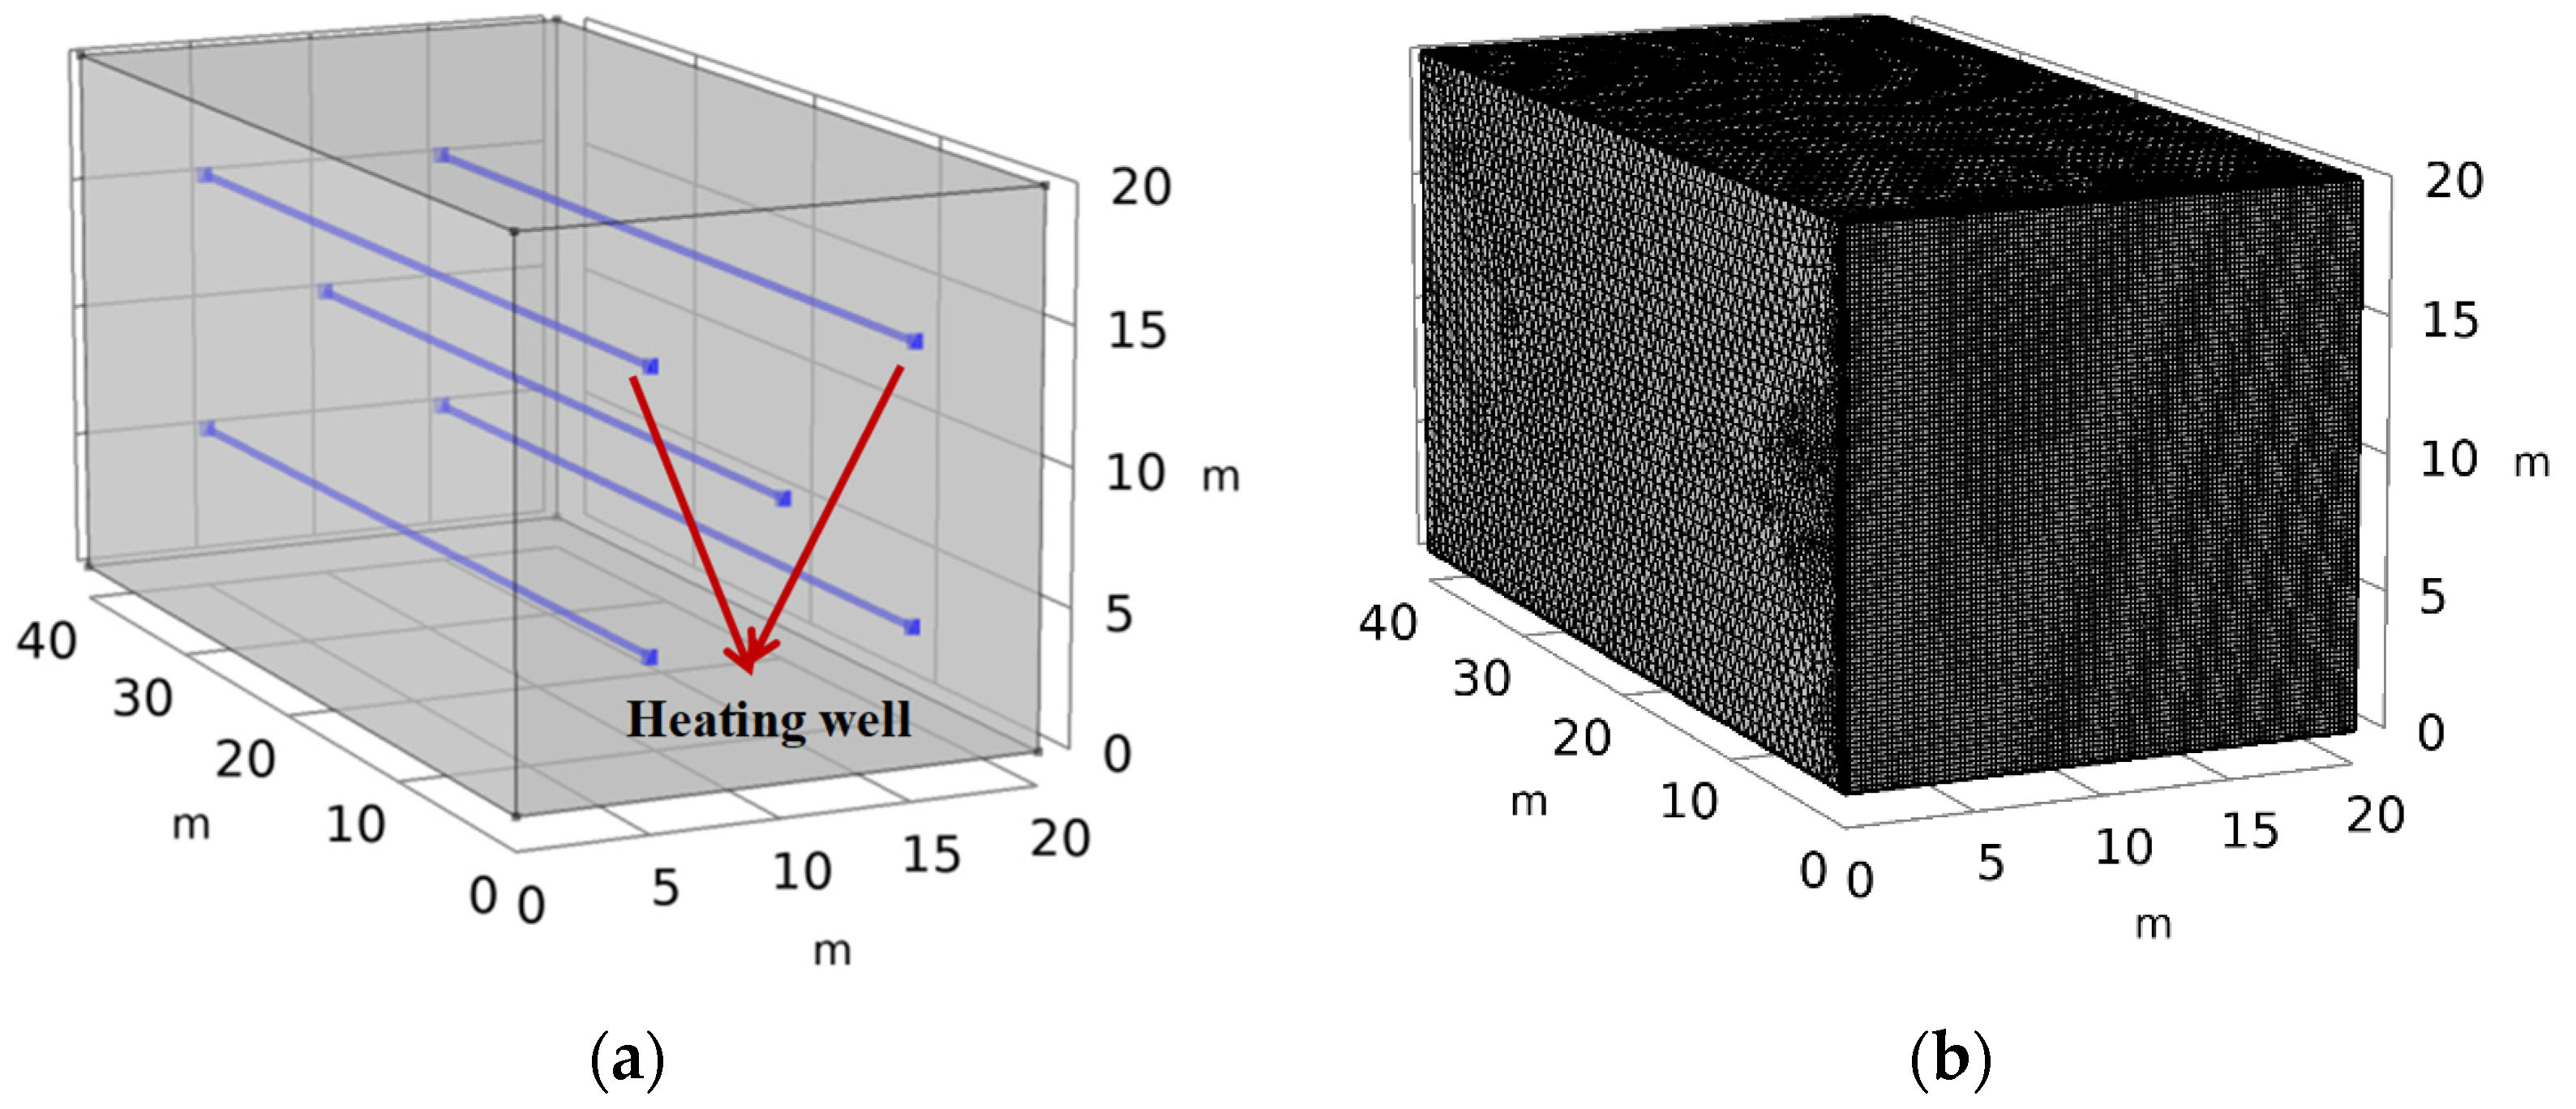
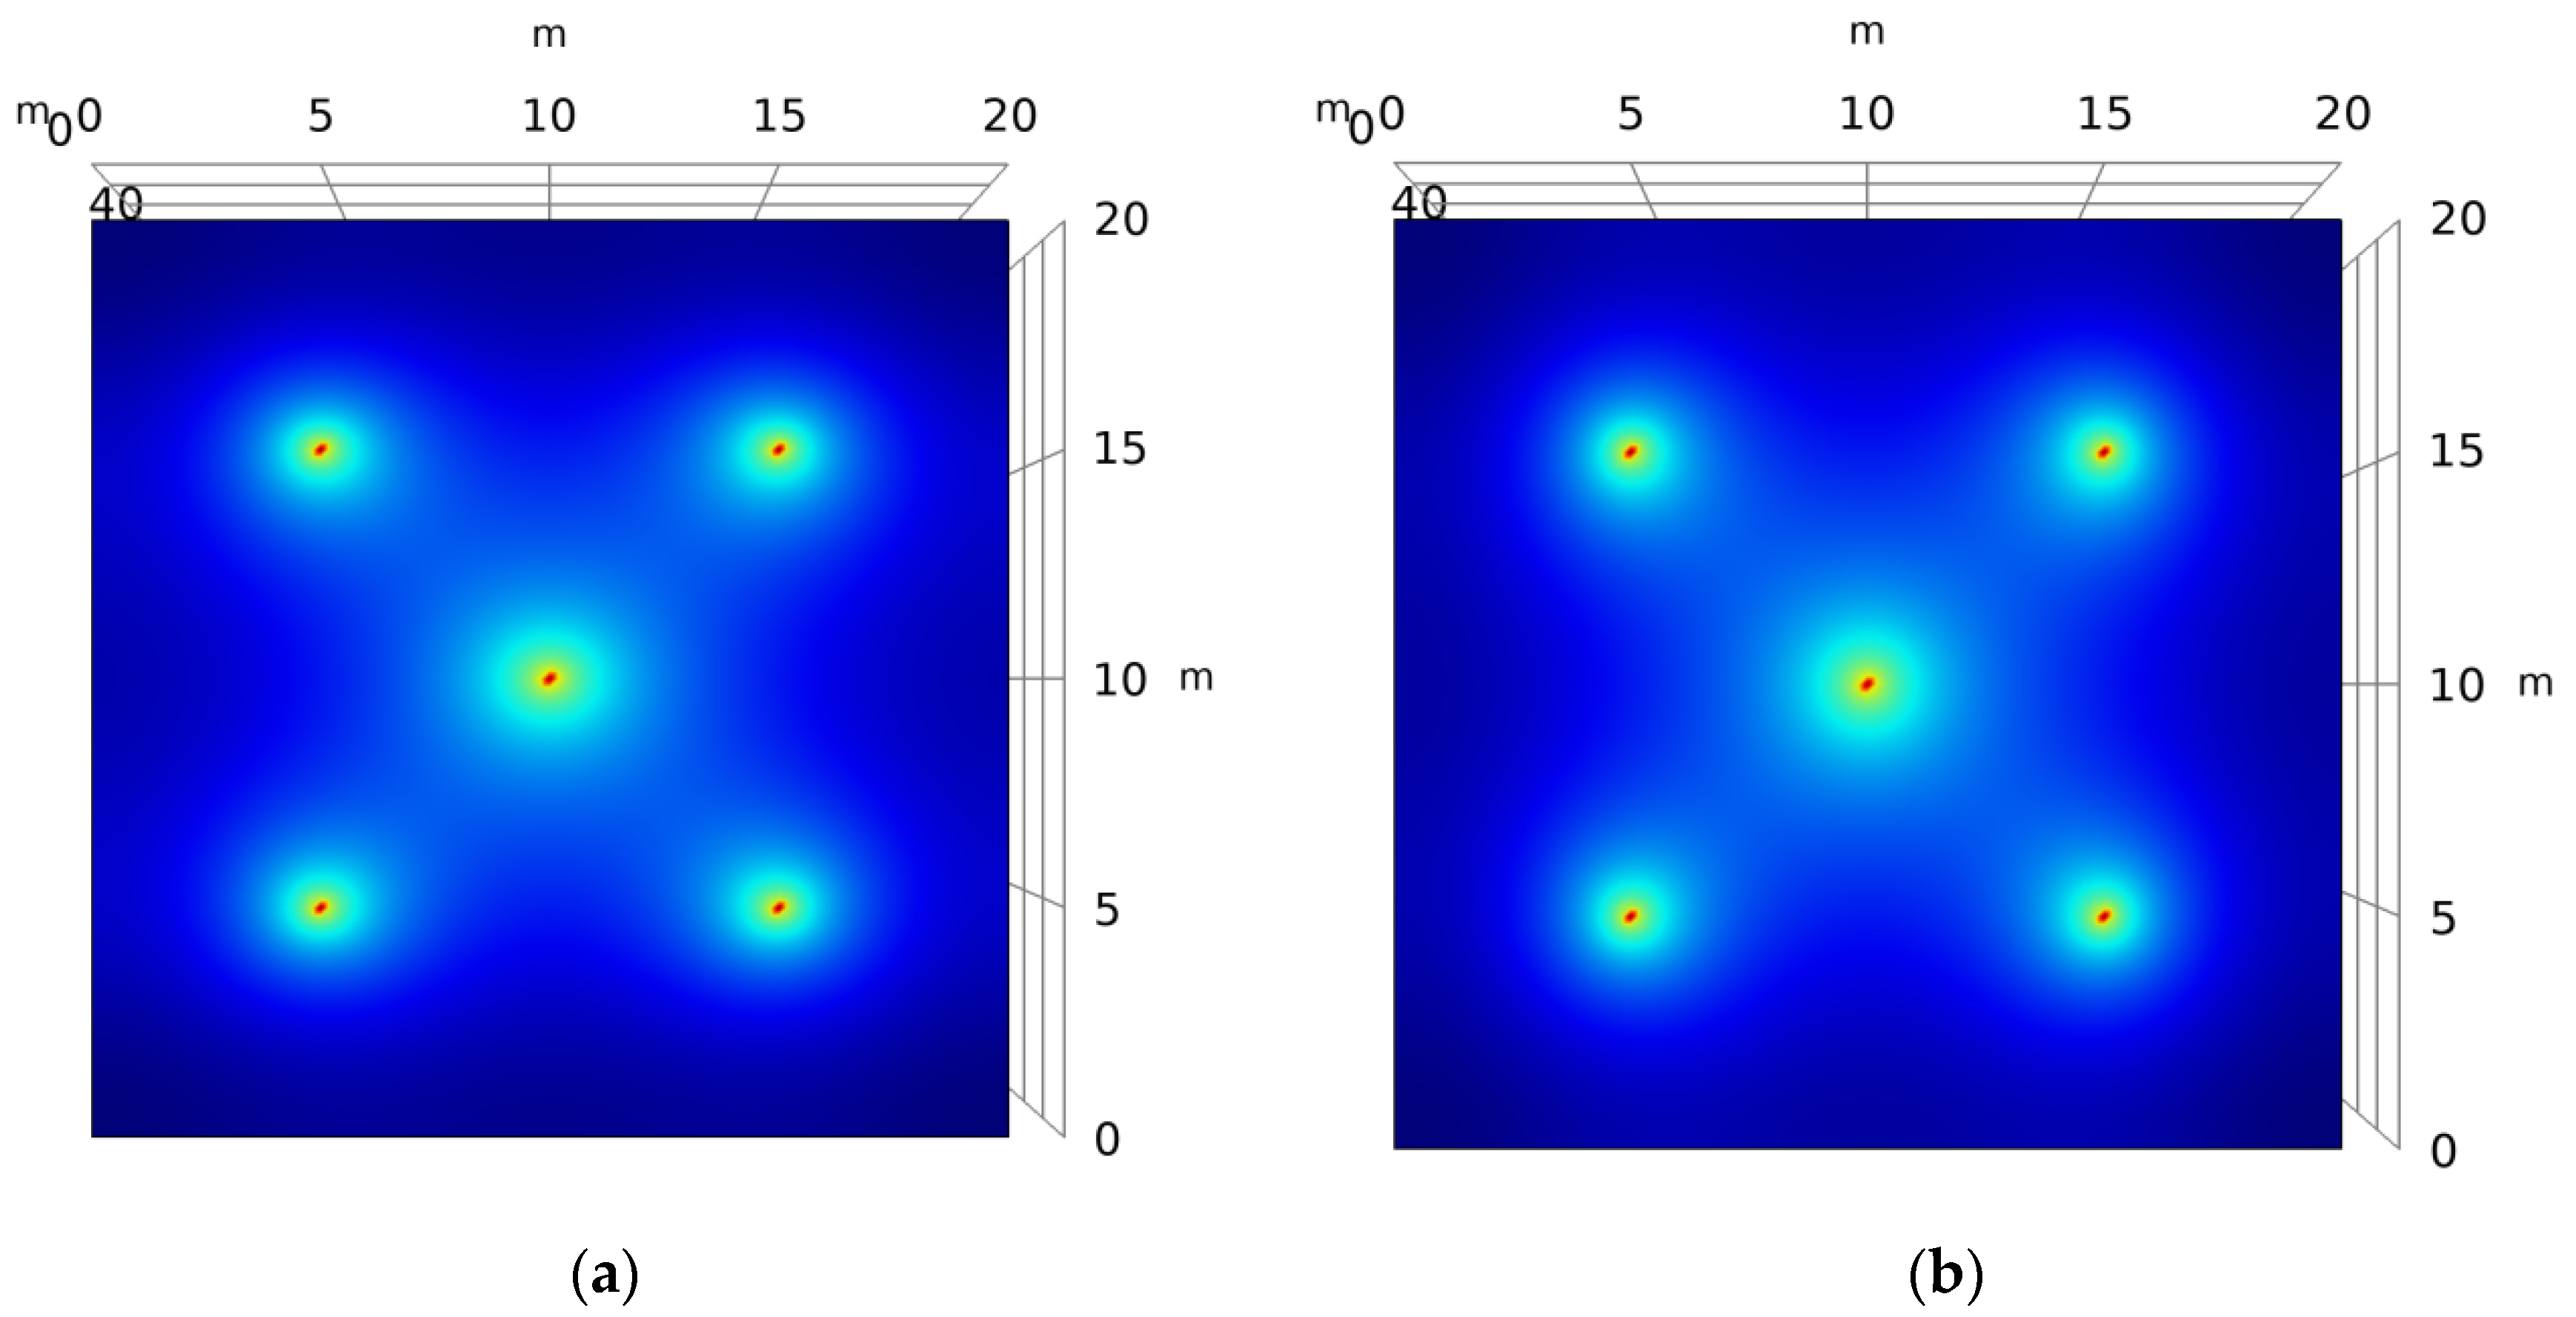
- (4)
- The anisotropic thermal conductivity of oil shale affects the distribution of the temperature field and the heating efficiency of shale produced by electric heating. The temperature undergoes anisotropic conduction in the oil shale seam, and the cloud diagram of the temperature field distribution is elliptical.
Author Contributions
Funding
Institutional Review Board Statement
Informed Consent Statement
Data Availability Statement
Acknowledgments
Conflicts of Interest
Nomenclature
| Thermal conductivity in the direction of perpendicular to bedding | |
| Thermal conductivity in the direction of parallel to bedding | |
| TG | Thermogravimetry |
| DTG | Differential thermogravimetric |
| The density of oil shale | |
| Specific heat capacity of oil shale | |
| Thermal conductivity tensor of the oil shale |
References
- Wang, J.; Feng, L.; Steve, M.; Tang, X.; Gail, T.E.; Mikael, H. China’s unconventional oil: A review of its resources and outlook for long-term production. Energy 2015, 82, 31–42. [Google Scholar] [CrossRef]
- Sun, Y.; Bai, F.; Liu, B.; Liu, Y.; Guo, M.; Guo, W.; Wang, Q.; Lü, X.; Yang, F.; Yang, Y. Characterization of the oil shale products derived via topochemical reaction method. Fuel 2014, 115, 338–346. [Google Scholar] [CrossRef]
- Qing, W.; Hongpeng, L.; Baizhong, S.; Shaohua, L. Study on pyrolysis characteristics of huadian oil shale with isoconversional method. Oil Shale 2009, 26, 148–162. [Google Scholar] [CrossRef] [Green Version]
- Li, S.Y. The developments of Chinese oil shale activities. Oil Shale 2012, 29, 101–102. [Google Scholar] [CrossRef] [Green Version]
- Tissot, B.P.; Welte, D.H. Petroleum Formation and Occurrence; Springer: New York, NY, USA, 1984. [Google Scholar]
- Soone, J.; Doilov, S. Sustainable utilization of oil shale resources and comparison of contemporary technologies used for oil shale processing. Oil Shale 2003, 20, 311–323. [Google Scholar] [CrossRef]
- Jiang, X.M.; Han, X.X.; Cui, Z.G. New technology for the comprehensive utilization of Chinese oil shale resources. Energy 2007, 32, 772–777. [Google Scholar] [CrossRef]
- Kang, Z.; Zhao, Y.; Yang, D. Review of oil shale in-situ conversion technology. Appl. Energy 2020, 269, 115121. [Google Scholar] [CrossRef]
- Wang, L.; Zhao, Y.; Yang, D.; Kang, Z.; Zhao, J. Effect of pyrolysis on oil shale using superheated steam: A case study on the Fushun oil shale, China. Fuel 2019, 253, 1490–1498. [Google Scholar] [CrossRef]
- Kang, Z.; Zhao, Y.; Yang, D.; Tian, L.; Li, X. A pilot investigation of pyrolysis from oil and gas extraction from oil shale by in-situ superheated steam injection. J. Pet. Sci. Eng. 2020, 186, 106785. [Google Scholar] [CrossRef]
- Wang, L.; Yang, D.; Kang, Z. Evolution of permeability and mesostructure of oil shale exposed to high-temperature water vapor. Fuel 2021, 290, 119786. [Google Scholar] [CrossRef]
- Meijssen, T.; Emmen, J.; Fowler, T. In-situ oil shale development in jordan through icp technology. In Proceedings of the Abu Dhabi International Petroleum Exhibition and Conference, Abu Dhabi, United Arab Emirates, 10–13 November 2014; OnePetro: Richardson, TX, USA, 2014. [Google Scholar]
- Looney, M.D. Chevron’s plans for rubblization of greenriver formation oil shale (GROS) for chemical conversion. In Proceedings of the 31th Oil Shale Symposium, Golden, CO, USA, 17–21 October 2011. [Google Scholar]
- Alfarge, D.; Wei, M.; Bai, B. Factors affecting CO2-EOR in shale-oil reservoirs: Numerical simulation study and pilot tests. Energy Fuels 2017, 31, 8462–8480. [Google Scholar] [CrossRef]
- Chinese Academy of Engineering (CAE). Research on the Energy Development Strategy of China in Mid and Long-Term (2030 & 2050); Science Press: Beijing, China, 2011. [Google Scholar]
- Feng, L.Y.; Li, J.C.; Pang, X.Q. China’s oil reserve forecast and analysis based on peak oil models. Energy Policy 2008, 36, 4149–4153. [Google Scholar] [CrossRef]
- Yang, D.; Wang, L.; Zhao, Y.; Kang, Z. Investigating pilot test of oil shale pyrolysis and oil and gas upgrading by water vapor injection. J. Pet. Sci. Eng. 2021, 196, 108101. [Google Scholar] [CrossRef]
- Gao, Q.; Tao, J.; Hu, J.; Yu, X. Laboratory study on the mechanical behaviors of an anisotropic shale rock. J. Rock Mech. Geotech. Eng. 2015, 7, 213–219. [Google Scholar] [CrossRef] [Green Version]
- Yang, S.; Yang, D.; Kang, Z. Experimental investigation of the anisotropic evolution of tensile strength of oil shale under real-time high-temperature conditions. Nat. Resour. Res. 2021, 30, 2513–2528. [Google Scholar] [CrossRef]
- Vernik, L.; Nur, A. Ultrasonic velocity and anisotropy of hydrocarbon source rocks. Geophysics 1992, 57, 727–735. [Google Scholar] [CrossRef]
- Vernik, L.; Landis, C. Elastic anisotropy of source rocks: Implications for hydrocarbon generation and primary migration. AAPG Bull. 1996, 80, 531–544. [Google Scholar]
- Vosteen, H.D.; Schellschmidt, R. Influence of temperature on thermal conductivity, thermal capacity and thermal diffusivity for different types of rock. Phys. Chem. Earth Parts A/B/C 2003, 28, 499–509. [Google Scholar] [CrossRef]
- Hajpál, M.; Török, A. Mineralogical and colour changes of quartz sandstones by heat. Environ. Geol. 2004, 46, 311–322. [Google Scholar] [CrossRef]
- Brotons, V.; Tomás, R.; Ivorra, S.; Alarcón, J.C. Temperature influence on the physical and mechanical properties of a porous rock: San Julian’s calcarenite. Eng. Geol. 2013, 167, 117–127. [Google Scholar] [CrossRef]
- Wang, G.; Yang, D.; Zhao, Y.; Kang, Z.; Zhao, J.; Huang, X. Experimental investigation on anisotropic permeability and its relationship with anisotropic thermal cracking of oil shale under high temperature and triaxial stress. Appl. Therm. Eng. 2019, 146, 718–725. [Google Scholar] [CrossRef]
- Wang, G.; Liu, S.; Yang, D.; Fu, M. Numerical study on the in-situ pyrolysis process of steeply dipping oil shale deposits by injecting superheated water steam: A case study on Jimsar oil shale in Xinjiang, China. Energy 2022, 239, 122182. [Google Scholar] [CrossRef]
- Sun, Q.; Zhang, W.; Qian, H. Effects of high temperature thermal treatment on the physical properties of clay. Environ. Earth Sci. 2016, 75, 610. [Google Scholar] [CrossRef]
- Li, Q. Temperature Field Simulation and Experiment of In-Situ Oil Shale Pyrolysis. Ph.D. Thesis, Jilin University, Changchun, China, 2012. (In Chinese). [Google Scholar]
- Wang, L. Experiment and Simulation on Thermal Conductance During In Situ Oil Shale Mining by Electric Heating. Ph.D. Thesis, Jilin University, Changchun, China, 2014. (In Chinese). [Google Scholar]
- Zhou, K.; Sun, Y.H.; Qiang, L.I.; Guo, W.; Lyu, S.D.; Han, J. Experimental research about thermogravimetric analysis and thermal physical properties of Nong’an oil shale. Glob. Geol. 2016, 35, 1178–1184. [Google Scholar]
- Yu, Y.; Liang, W.; Bi, J.; Geng, Y.D.; Zhang, C.D.; Zhao, Y.S. Thermalphysical experiment and numerical simulation on thermal cracking of oil shale at high temperature. Chin. J. Rock Mech. Eng. 2015, 34, 1106–1115. [Google Scholar]
- Kang, Z.; Yang, D.; Zhao, Y.; Hu, Y. Thermal cracking and corresponding permeability of Fushun oil shale. Oil Shale 2011, 28, 273. [Google Scholar] [CrossRef] [Green Version]
- Saif, T.; Lin, Q.; Bijeljic, B.; Blunt, M.J. Microstructural imaging and characterization of oil shale before and after pyrolysis. Fuel 2017, 197, 562–574. [Google Scholar] [CrossRef]
- Wang, G.; Yang, D.; Kang, Z.; Zhao, J. Anisotropy in thermal recovery of oil shale—Part 1: Thermal conductivity, wave velocity and crack propagation. Energies 2018, 11, 77. [Google Scholar] [CrossRef] [Green Version]
- Wang, G.; Yang, D.; Kang, Z.; Zhao, J.; Lv, Y. Numerical investigation of the in situ oil shale pyrolysis process by superheated steam considering the anisotropy of the thermal, hydraulic, and mechanical characteristics of oil shale. Energy Fuels 2019, 33, 12236–12250. [Google Scholar] [CrossRef]
- Hui, H.; Ning-Ning, Z.; Cai-Xia, H.; Yan, L.; Qing-Yong, L.; NA, D.; Xiao-Yan, H. Numerical simulation of in situ conversion of continental oil shale in Northeast China. Oil Shale 2016, 33, 45. [Google Scholar] [CrossRef]
- Yang, D.; Zhao, J.; Kang, Z.Q.; Zhao, Y. Technology and numerical analysis of in-situ electrical heating on oil shale. J. Liaoning Tech. Univ. 2010, 29, 365–368. [Google Scholar]


Publisher’s Note: MDPI stays neutral with regard to jurisdictional claims in published maps and institutional affiliations. |
© 2022 by the authors. Licensee MDPI, Basel, Switzerland. This article is an open access article distributed under the terms and conditions of the Creative Commons Attribution (CC BY) license (https://creativecommons.org/licenses/by/4.0/).
Share and Cite
Jin, J.; Liu, J.; Jiang, W.; Cheng, W.; Zhang, X. Evolution of the Anisotropic Thermal Conductivity of Oil Shale with Temperature and Its Relationship with Anisotropic Pore Structure Evolution. Energies 2022, 15, 8021. https://0-doi-org.brum.beds.ac.uk/10.3390/en15218021
Jin J, Liu J, Jiang W, Cheng W, Zhang X. Evolution of the Anisotropic Thermal Conductivity of Oil Shale with Temperature and Its Relationship with Anisotropic Pore Structure Evolution. Energies. 2022; 15(21):8021. https://0-doi-org.brum.beds.ac.uk/10.3390/en15218021
Chicago/Turabian StyleJin, Juan, Jiandong Liu, Weidong Jiang, Wei Cheng, and Xiaowen Zhang. 2022. "Evolution of the Anisotropic Thermal Conductivity of Oil Shale with Temperature and Its Relationship with Anisotropic Pore Structure Evolution" Energies 15, no. 21: 8021. https://0-doi-org.brum.beds.ac.uk/10.3390/en15218021