1. Introduction
Today, the problem of energy and environmental security remains unsolved in the world. It is quite relevant for EU countries [
1,
2,
3,
4]. To this end, the EU is tightening requirements for the quality of raw materials from which energy and fuel are obtained. This determines a number of scientific and applied problems. One of the tasks related to improving the efficiency in the TIP of the EGD is to assess the state of the project environment and the risks of stakeholders [
5,
6,
7].
Fossil fuels remain the raw material for energy production in some countries of the world [
8,
9,
10]. Their rise in price from year to year and declining stocks lead to the search for alternative raw materials. In addition, there are requirements for raw materials for clean energy from the standpoint of environmental safety [
11]. Today there are many types of raw materials for energy production and environmentally friendly fuels. At the same time, in some EU countries special attention is paid to agricultural waste as a raw material for the production of clean energy [
12,
13]. Some authors of scientific works [
14,
15,
16] point out that both in Ukraine and in some EU countries, special attention should be paid to crop waste, in particular corn [
17]. In separate works [
18,
19], approaches to planning projects with the use of plant waste, including corn, for the production of ecologically clean energy are proposed. This type of raw material can, with minimal investment in its procurement, partially ensure the energy security of individual regions [
8,
17].
The feasibility of implementing the TIP of the EGD using waste products of crop production is justified in scientific papers [
20]. At the same time, their authors note the importance of taking into account the changing design environment (availability and volume of raw materials) of individual regions where the relevant projects are implemented. It is the state of the project environment that largely determines the effectiveness of projects and their risks [
21,
22,
23,
24,
25,
26].
Vegetable agricultural waste is widely used in Europe and North America also for the production of solid biofuel. Thus, straw pellets are produced in Lithuania (Baltic Straw), Great Britain (Straw Pellets Ltd., Agripellets Ltd.), Estonia (BJ TOOTMISE OÜ), Poland (Widok Energia S.A.), Canada (Semican) and the USA (PowerStock); and straw briquettes in Estonia (BaltPellet OÜ), Denmark (C.F. Nielsen A/S), Canada (Omtec), Lithuania (Baltic Straw) and other countries. The American companies Next Step Biofuels, Pellet Technology USA and PowerStock offer on the market pellets from corn production waste for grain [
8].
To date, there are only isolated examples of energy use of corn harvest residues in Ukraine. Cherkassiteplokomunenergo uses corn stalks supplied by the Cherlys seed plant (Cherkasy) as fuel. In addition, for the second phase of the TPP with a capacity of 12 MW in the village of Ivankiv of the Kyiv region (Ukraine), the option of using corn stalks as an alternative to wood chips is also being considered. Agricultural enterprises of this area declare the availability of 90.000 tons per year of this type of biomass.
Taking into account the high natural moisture content of waste from the production of corn for grain (up to 60%), ensiling with subsequent production of biogas can be proposed as a prospective direction for their utilization for energy purposes [
19]. Another option is to switch to the “American” technology of harvesting corn, that is, leaving the stalks in the field with subsequent pressing, after the stalks have sufficiently dried in the air. The stalks collected in this way can be used for the production of pellets/briquettes or directly as fuel in boilers.
Assessing the state of the project environment of projects in various application areas is one of the most time-consuming processes, which is performed in the phase of project initiation [
25,
27]. Regarding the assessment of the project environment of the TIP of the EGD on corn waste, the researchers in a few studies only analyzed the state of corn production in some countries and regions. At the same time, the task of assessing the unevenness of production volumes for certain periods and the dispersion of raw materials in a given area for the production of clean energy was ignored. They determined the quality of assessment of changing components of the project environment, which affects the risks of stakeholders in projects using maize waste.
The scientific works of various scientists are devoted to the issue of assessing the uneven provision of natural resources of certain sectors of the economy [
8,
13,
28,
29]. Some argue that there are relationships between variables in the design environment that can be measured by the Gini index [
30,
31,
32]. The authors of these works note that the indicators of the design environment are unevenly distributed. With regard to the procurement of raw materials for the production of clean fuel, the reasons for this unevenness are the dependence of corn production on the natural potential of fields and uneven distribution of yields by year, due to climatic conditions of regions [
33].
Unfortunately, today there are no scientific papers related to the development of tools and assessment of the project environment of the TIP of the EGD using maize waste. All the above indicates the need to develop an approach to assessing the state of the project environment, which is based on determining the Gini index between the indicators of the dispersion of raw materials in a given area. This will provide a quantitative assessment of the risks of stakeholders of these projects during their initiation.
Therefore, there is a need for scientific research related to the development of an approach to the assessment of the project environment of technologically integrated projects of the “European Green Deal” using corn waste, which will take into account the changing project environment, which determines the risk of the specific cost of disposal of corn waste. The use of the specified approach makes it possible to conduct research and gain new knowledge about the trends of changes in the desired system value of such projects from the predicted characteristics of the changing project environment of individual regions. This knowledge is the basis for justifying the expediency of implementing technologically integrated projects; also, the acquired knowledge is the basis for the development of decision support systems for planning projects of the “European Green Deal” using corn waste, taking into account the risks of stakeholders, which confirms both scientific and practical value performed research.
2. Analysis of Literature Data and Problem Statement
The analysis of scientific works [
8,
17] which relate to the development of tools for the implementation of technologically integrated projects in various fields of application shows their importance for the theory of project management. At the same time, there are scientific works devoted to the assessment of the state of the project environment which have a changing nature [
5,
7,
17]. However, there are no publications related to the assessment of the state of the project environment of the TIP of the EGD on corn waste.
Much attention was paid to the processes of assessing the state of the project environment. The expediency of their implementation is prescribed in international project management standards [
34,
35,
36,
37,
38] and many scientific papers [
17,
33,
39]. Some works concerned the assessment of the changing design environment of projects in various subject areas [
38,
39,
40,
41]. However, the known works did not consider the features of the project environment of the TIP of the EGD using maize waste, which is characterized by uneven distribution of raw materials and their receipt in certain calendar years due to natural and climatic conditions of regions.
Modern tools based on the use of computational intelligence have proven themselves to be quite effective [
16,
19,
22,
39]. They are used to solve forecasting, classification and clustering problems in various applied fields. However, the use of fuzzy logic algorithms is impractical, as it is possible to assess the condition of the TIP of the EGD environment from corn waste using mathematical models. Regarding the use of machine learning (ML) algorithms to assess the condition of the project environment from corn waste, it is impossible to use them in most regions, because there are no large data that fully describe the condition of the studied objects.
Some studies related to the assessment of natural and climatic conditions on their impact on agricultural production projects are presented in [
8,
13,
33]. In addition are the known works [
42,
43,
44,
45], which are aimed at assessing the risks of projects and their project environment. However, the tools proposed by their authors cannot be used to assess the design environment in projects using maize waste, as they do not reflect the features of these projects. Noteworthy are the scientific studies that are directly devoted to solving problems of estimating the unevenness of the components of the project environment for different types of projects using the GINI index. They are represented by Anuja Raj Sharma [
31], Sareth Nhem, Young Jin Lee, Sopheap Phin [
32], Oliver T. Coomes, Yoshito Takasaki and Jeanine M. Rhemtulla [
45], Gródek-Szostak [
41], Bir Bahadur Khanal Chhetri, Patrick Asante, Atsushi Yoshimoto [
29] and others.
Bir Bahadur Khanal Chhetri, Patrick Asante and Atsushi Yoshimoto in China also directly assessed the state of resources on the basis of the Gini coefficient (GC) [
29]. They suggested using the Gini coefficient not only in its classical interpretation (when quantifying differences in individual indicators), but also when assessing the structure of rational use of natural resources, the so-called Land Gini coefficient (LGC). With the help of this index, scientists have found that in 13 years, agricultural land and unused land have been evenly distributed within China. However, the land under construction was relatively or completely unevenly distributed, which contributed to the rapid development of urbanization processes in China.
Studies by Sareth Nhem, Young Jin Lee and Sopheap Phin [
32], which analyzed the distribution of income from the use of forest resources and other variable sources of income in rural communities in the Kingdom of Cambodia (Southeast Asia) and their participation in reducing income inequalities and growing rural poverty using the GINI index, indicate that “forest incomes” are an important part of the livelihoods of poor rural households and an important source of reducing income inequality and poverty.
However, the authors of the analyzed scientific papers did not pay attention to the peculiarities of the project environment of the TIP of the EGD using maize waste. This makes it impossible to use them to assess the state of their project environment. In addition, they do not provide for the assessment of inequality data both in relation to individual years and in relation to the dispersion of raw materials in a given area for the production of clean energy. It is known that the use of the GINI index makes it possible to assess the uneven distribution of indicators in different areas. Methods of intellectual analysis of statistical data provide trends in changes in individual indicators and forecast indicators of project value. This is the basis for quantitative risk assessment of stakeholders in projects.
The aim of the work is to substantiate the approach to assessing the project environment of the TIP of the EGD using maize waste, which is based on the calculation of the GINI index between individual indicators taking into account the uneven temporal and territorial distribution of raw materials in regions, and statistical analysis, which provides a quantitative assessment of indicators and forecasting the risks of their stakeholders.
To achieve this goal should solve the following tasks:
- -
Propose an approach to assess the project environment in projects, which takes into account the uneven temporal and territorial distribution of raw materials in specific regions for clean energy production and variable components that pose a risk to stakeholders;
- -
Based on the use of the proposed approach, assess the uneven distribution of raw materials in Ukraine for the production of clean energy from corn waste.
3. An Approach to Assessing the State of the Project Environment of Technologically Integrated Projects of the “European Green Deal” in a Given Area for the Production of Clean Energy from Corn Waste
Assessing the current state and forecasting the project environment of the TIP of the EGD begins with an analysis of possible scenarios for their implementation. The basis of possible scenarios for the implementation of these projects is the type of agricultural raw materials and technology for their production. Each of the scenarios assumes the occurrence of baseline and derivative events, which is inherent in the risk. The timing of events is variable but predicted by statistics. It is the time of occurrence of events in projects that determines the need and duration of work, their volume and quality of the product, the impact on the environment as well as the risk of investors. An important component of assessing the state of the project environment is forecasting the need for variable volumes of raw materials for energy, taking into account the risks of climatic conditions (variable durations of growing raw materials that cause variable volumes in certain raw materials), and the risk of organizational and large components of the project environment are reflected in the changing demand for energy during the period for which the demand for raw materials is justified.
The scale of implementation in projects is justified on the basis of forecasting the potential of biomass in the EU and Ukraine for the production of clean fuel. It is predictable and is the subject of research by many scientists around the world [
8]. It is the potential of biomass that underlies the territorial dispersion of energy production facilities and the forecasting of investors’ profits. The latter are influenced by the cost of energy resources in the region, the market value of the resulting product of the TIP of the EGD, and so on.
For a given territory (country or its region) there is an uneven potential of raw materials (biomass) for the production of clean energy from corn waste. This indicator is one of the most important characteristics of the project environment of the TIP of the EGD. It is the basis for substantiation of implementation scenarios and configuration of these projects.
The proposed approach to assessing the state of the project environment for the implementation of projects using maize waste is presented in
Figure 1. The basis of this approach is to determine the dynamics of inequality of individual regions in terms of resource potential—the projected volume of disposal of corn waste. They are the basis for substantiating the value and configuration of environmentally friendly energy systems from corn waste [
15]. To achieve this, it is proposed to use the Gini index.
At the initial stage of the research, an administrative territory for implementation and a database of data and knowledge characterizing the project environment are formed. The main source of information is the statistical data of this administrative territory with indicators of corn cultivation for grain in previous years. At the same time, data are collected on the amount of corn sown per grain in previous years, its yield and gross harvest.
On the basis of these data and features of the use of corn waste for economic needs and soil restoration, the volumes of disposal of corn waste for the production of environmentally friendly energy are substantiated. This uses the known knowledge about the amount of disposal of corn waste [
8], in particular the relationship between the specific volume of maize waste disposal, while maintaining the balance of organic carbon, and its yield. The obtained dependence makes it possible to determine the amount of disposal of corn waste for the production of clean energy. This indicator is one of the indicators of establishing the uneven distribution of raw materials for bioenergy.
After that, the dependence of the specific value of corn waste for the production of environmentally friendly energy on the known specific volume of disposal of corn waste is substantiated. To perform this, simulation modeling of the collection of corn waste available for disposal is used, while maintaining the balance of organic carbon in the fields.
On the basis of the formed database and knowledge for the assessment of the project environment, the regions that meet the requirements for the required amount of raw materials for bioenergy production and indicators for assessing the unevenness of their dispersion are determined. For each of them, the Gini index is determined between the indicators that characterize the uneven distribution of raw materials for bioenergy [
12]:
- Indicator I
where
—the specific amount of by-products of corn which is available for alienation, provided that the balance of organic carbon in the fields, t/ha, is kept;
—corn yield per grain, t/ha.
- Indicator II
where
—the amount of disposal of corn waste for the production of clean energy, tons;
—area of maize cultivation, ha.
- Indicator III
where
—the cost of disposal of corn waste for the production of clean energy, EUR.
Indicator I provides for the establishment of inequality between the specific volume of by-products of maize in the fields and the yield of maize for grain by region. This indicator allows to form an idea of the potential of natural resources of individual regions, taking into account their natural and climatic conditions and their unevenness during certain periods.
Indicator II ensures the establishment of inequality between the amount of disposal of corn waste for the production of environmentally friendly energy and the area of maize cultivation in terms of regions with their natural and climatic zones. This indicator allows one to form an idea of the possible production of raw materials in each of the studied areas and their unevenness during certain periods, which underlies the emergence of material risks during the implementation of the TIP of the EGD.
Indicator III ensures the establishment of inequality between the cost and volume of corn waste for the production of clean energy by region. This indicator gives an idea of the impact of market prices in the region on the efficiency of production of raw materials from corn for bioenergy and provides an allocation among the studied priority regions for the implementation of the TIP of the EGD.
The Gini index is used to evaluate each of the above indicators. It is the criterion for assessing the state of the project environment for the implementation of technologically integrated projects with the use of corn waste in the specified regions. To determine the Gini index, the Lorenz curves are used, which is an alternative (in other coordinates) graphical representation of the distribution function of the studied indicators. The mathematical representation of this curve refers to the representation of distribution functions in which the shares of the volume of alienation and the cost of maize waste for the production of clean energy depending on the area of maize cultivation and its yield are accumulated. In a rectangular coordinate system, the Lorentz curve is convex downward and passes under the diagonal of a unit square located in the first coordinate quarter (
Figure 2).
Given the even distribution of individual indicators of the project environment for individual regions, there are relationships between the amount of alienation and the cost of corn waste for the production of clean energy, which are proportional to the area of corn and its yield. This case is described by the line of perfect equality, which is a line connecting the origin and the point (1; 1). In the case of complete inequality (when only a certain region has proportional volumes of alienation and the cost of maize waste for the production of clean energy), the curve (line of perfect inequality) first “approaches” the abscissa, and then from point (1; 0) goes to point (1; 1).
The Lorentz curve is constructed between the curve of equality (diagonal) and complete inequality [
31]. The Gini index is easiest to determine using the Lorentz curve. It is equal to the ratio of the area of the region “
A” (
Figure 2), formed by the Lorentz curve, and the line of absolutely uniform distribution (straight line (diagonal) at an angle of 45°) to the area of the triangle formed by the line of uniform distribution and lines and “
A +
B” [
30]:
where
—the Gini index;
—the area of the region (
Figure 2), formed by the Lorentz curve and a straight line of absolutely uniform distribution;
—the area of the region (
Figure 2) formed by the Lorentz curve and straight lines
end
.
Several methods of calculating the Gini index are used in scientific works for different subject areas [
31]. We propose to use the Brown formula to calculate this index, which requires the preliminary creation of a variation series with ranked indicators of the state of the project environment for the implementation of the TIP of the EGD:
where
—number of research periods, years;
—the cumulative share of the area under maize or its yield;
—the cumulative share of the area under maize or its yield,
.
Having obtained the quantitative values of the Gini indices for all indicators for the given regions, they are ranked in ascending order according to the unevenness of volumes and the cost of obtaining raw materials for bioenergy:
where
,
,
—the Gini indices based on the indicators of the specific volume of corn by-products, the amount of alienation and the value of corn by-products under the condition of maintaining the balance of organic carbon in the fields of
k-x regions, respectively.
Based on the ranking (6)–(8) of individual regions according to the quantitative values of the Gini indices, a number of priority regions of the feasibility of implementing projects are formed under the condition of preserving the balance of organic carbon in the fields of the regions. The regions that are the first in rows (6), (7) and (8) should be considered a priority, as they provide a minimum material risk of obtaining raw materials for the implementation of the TIP of the EGD. For the identified priority regions, quantitative risk indicators of the value of agricultural waste procurement projects for the production of clean energy from corn silage are performed.
4. The Results of Quantitative Assessment of the Uneven Distribution of Raw Materials in Ukraine for the Production of Clean Energy from Corn Waste
To form a database, we performed an analysis of official statistics on the cultivation of corn for grain in some regions of Ukraine [
46]. This analysis made it possible to build relationships between individual indicators that characterize the uneven distribution of raw materials for bioenergy. First of all, we analyzed the trends in the yield of corn for grain in some regions of Ukraine over the past 10 years (
Table 1).
Based on the statistical data of
Table 1, it is established that in Ukraine the yield of corn for grain varies in a fairly large range—2.12…10.21 t/ha. Variability is observed both in individual regions and during individual calendar years. It is known [
47,
48] that for the conditions of Ukraine about 5.5 t/ha of dry mass of corn waste grown for grain is required to ensure the balance of organic carbon during long-term cultivation.
Analyzing
Table 1, it can be noted that in 2018 Ukraine had unfavorable climatic conditions, which led to the impossibility of disposing of corn waste in all regions of Ukraine for clean energy production, as its yield did not ensure the balance of organic carbon in the fields. It is established that there are nine regions of Ukraine in terms of yield (Dnipropetrovsk, Donetsk, Zaporizhzhia, Kirovohrad, Luhansk, Mykolaiv, Odesa, Kharkiv, Chernivtsi), which do not maintain the balance of organic carbon in the fields during long-term cultivation of corn. These regions are excluded from further research, as they are unfavorable for the disposal of corn waste for the production of clean energy.
Using the results of research presented in [
47,
49], as well as established trends in the yield of corn for grain in some regions of Ukraine (
Table 1), we constructed dependence (
Figure 3), which is the basis for forecasting the amount of disposal of corn waste for production of clean energy in some regions.
The dependence of the specific volume of by-products of corn on its grain yield is described by the equation:
where
—specific volume of by-products of corn in the fields, t/ha;
—corn yield per grain, t/ha.
Based on the obtained dependence (9), calculations were performed and quantitative values of specific volumes of corn waste were available, which are available for disposal in the studied regions, provided that the balance of organic carbon in the fields is preserved (
Table 2).
The obtained results of determining the specific volumes of corn waste, which are available for disposal in some regions of Ukraine (
Table 2), as well as available statistics on corn growing areas
in these regions, made it possible to determine the amount of corn
waste disposal for clean energy production (
Table 3).
The performed research, which provided simulation modeling of maize waste collection available for disposal, made it possible to build the dependence of the specific cost of maize waste disposal on its specific volume, provided that the balance of organic carbon in the fields is preserved (
Figure 4).
The obtained dependence of the specific cost of alienation of corn waste on its specific volume, provided that the balance of organic carbon in the fields is maintained, is described by the equation:
where
—specific cost of disposal of corn waste, EUR/t;
—specific volume of corn by-products in the fields, t/ha.
The obtained results of maize waste disposal for clean energy production in some regions of Ukraine (
Table 3), as well as dependence (10), provided determination of the cost of maize waste disposal for clean energy production (
Table 4).
Based on the obtained data (
Table 1,
Table 2,
Table 3 and
Table 4), data sets were formed in the context of individual regions by indicators and to determine the Gini index (
) for each of the indicators. At the same time, the ranking by the growth of indicators was previously performed,
/
. The positive aspect of the application of the Gini index is its applied nature and flexibility in interpretation, which allows assessment of the regional inequality of distribution of raw materials in Ukraine for the production of clean energy from corn waste.
Based on the disclosure of the contents of the blocks, which are depicted in the block diagram (
Figure 1), a computer program was developed in Python 3.9. It is based on the proposed approach and makes it possible to calculate the Gini index between the outlined indicators of the state of the project environment for the implementation of the TIP of the EGD. For clarity, graphs of changes in Lorentz curves between the above indicators of the design environment for the conditions of the Khmelnytskyi region (Ukraine) are presented (
Figure 5,
Figure 6 and
Figure 7).
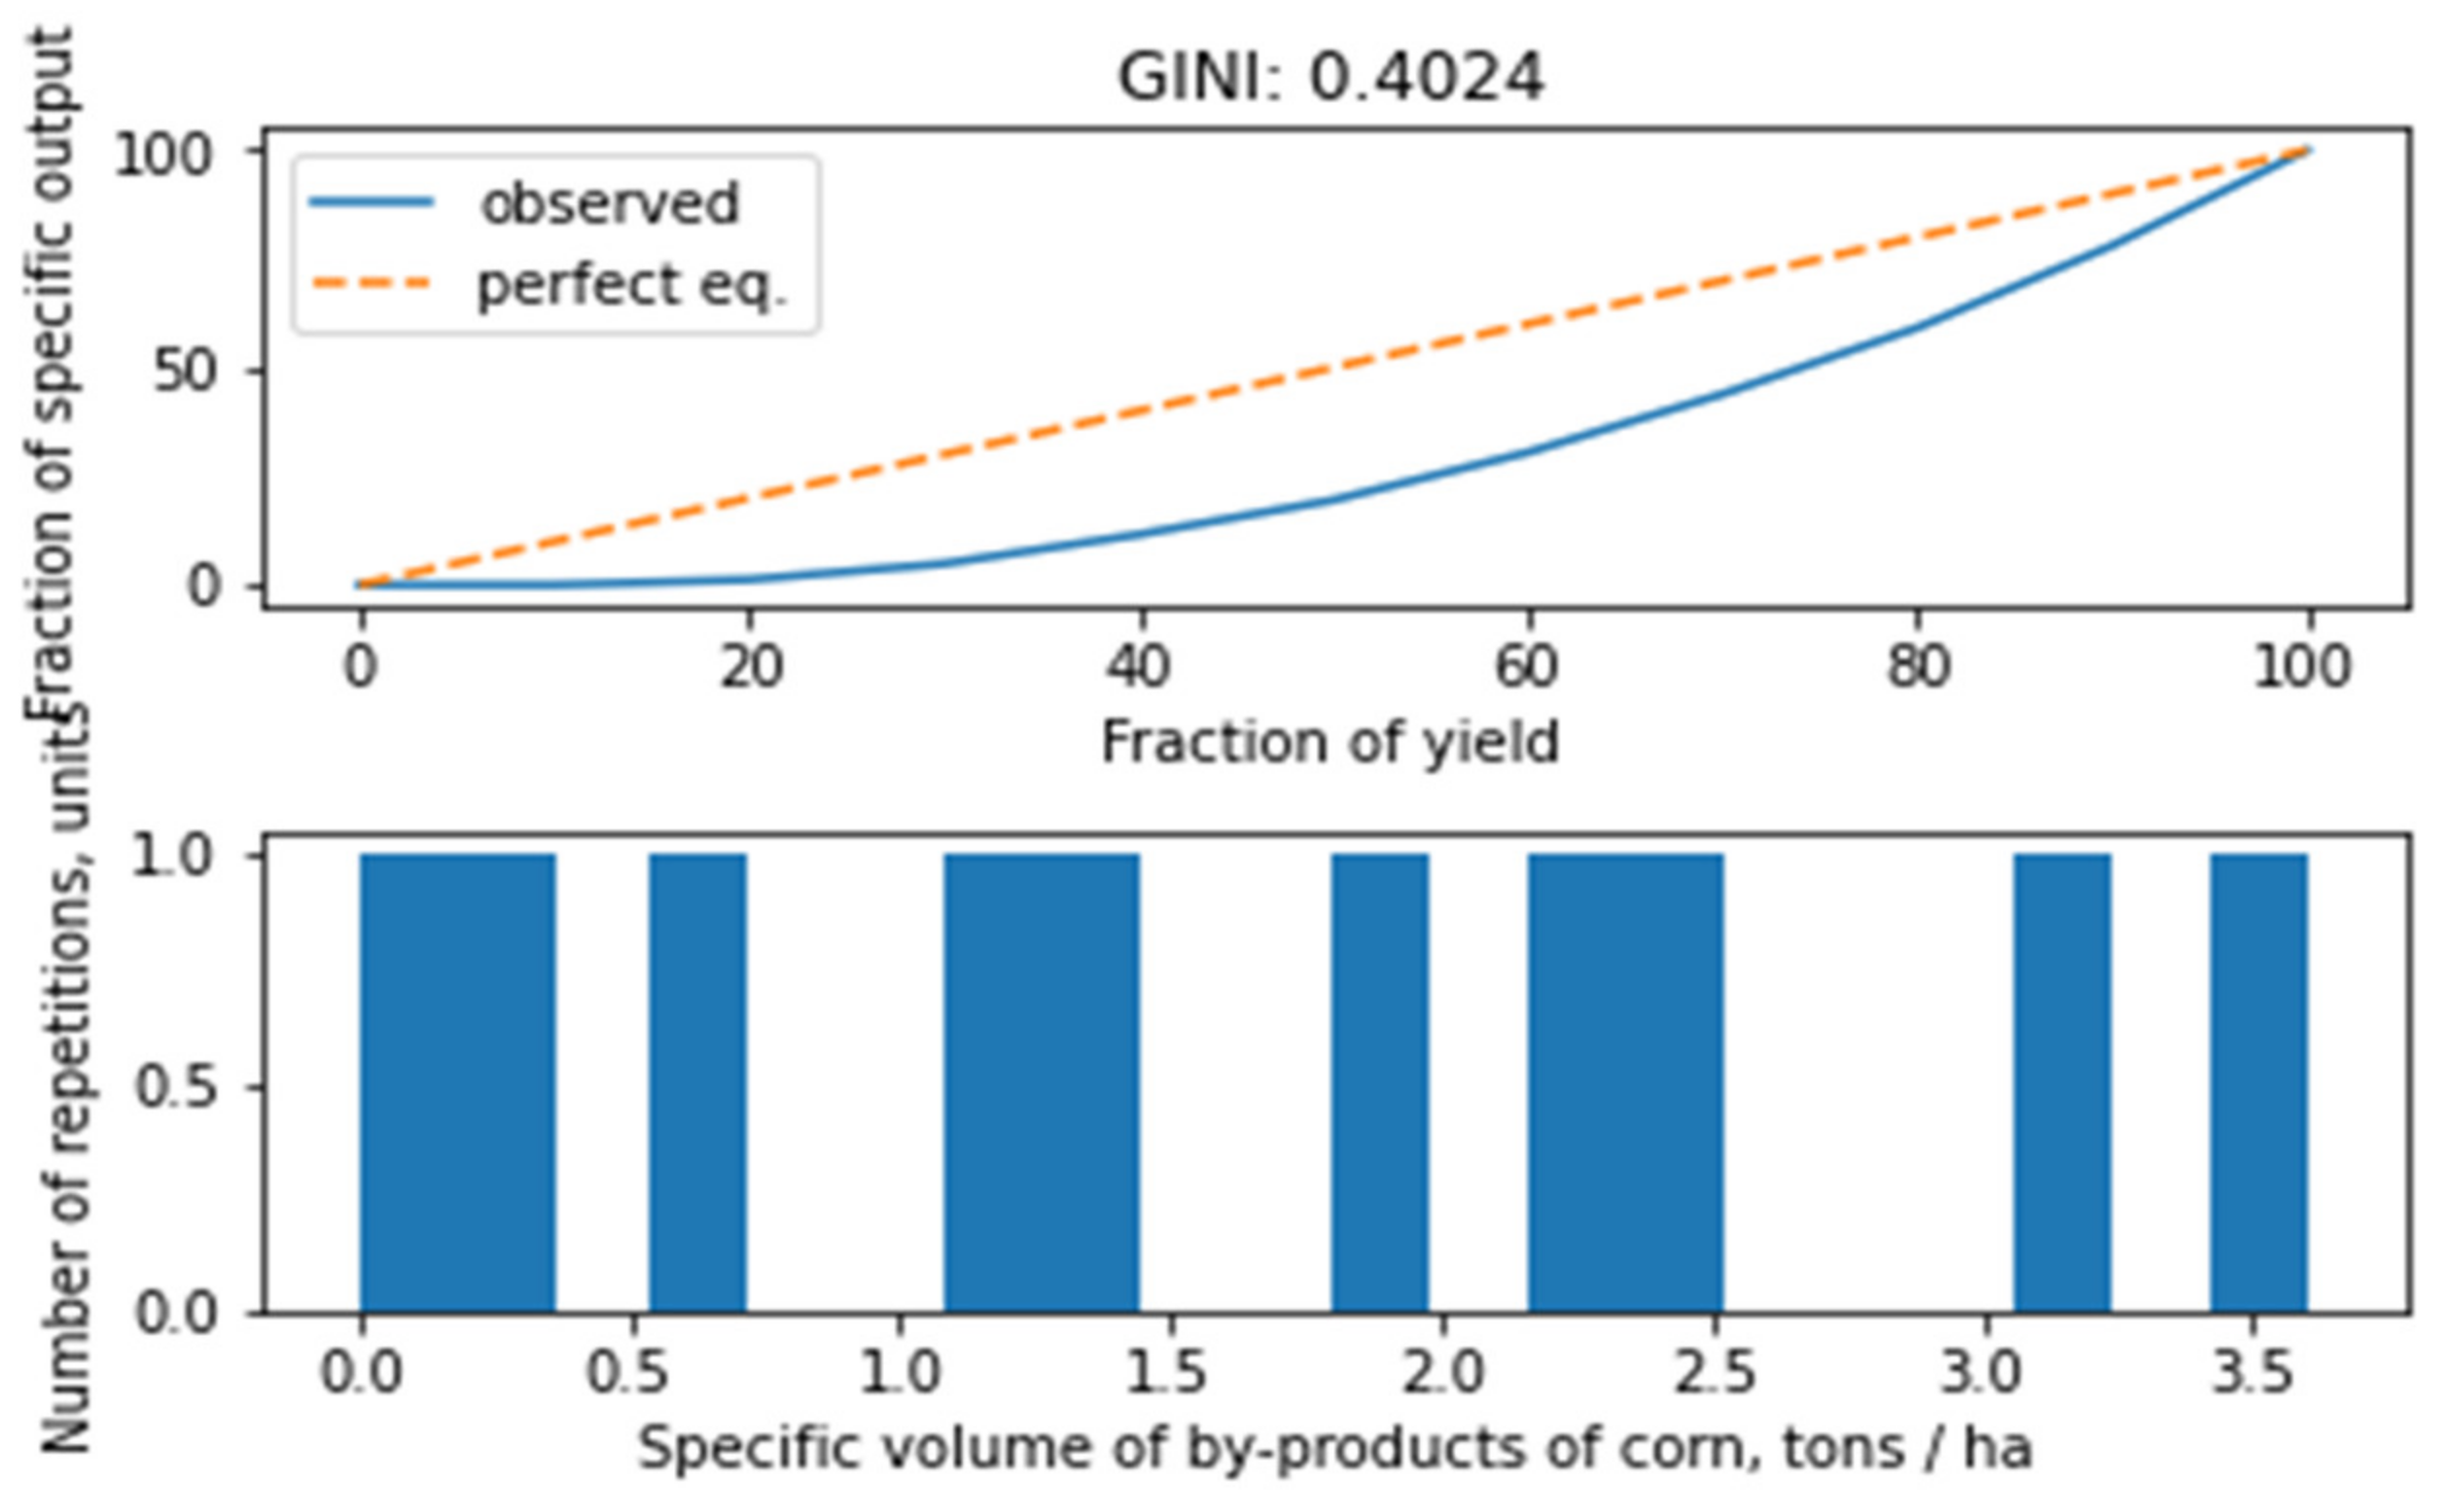
Regarding the first indicator (specific volume of corn by-products available for disposal under the condition of maintaining the balance of organic carbon in the fields, t/ha/ corn yield per grain, t/ha) the Gini coefficient is 0.402 for the Khmelnytskyi region (Ukraine).
This indicates an average inequality between
and
. Graphical representation of the obtained results describes the Lorentz curve in
Figure 5. It is established that the potential of natural resources, taking into account the natural and climatic conditions of the Khmelnytskyi region (Ukraine), is evenly distributed during the individual study periods (2011–2020).
The above graph (
Figure 5) shows that the main share of the formation of by-products of corn, which is available for disposal under the condition of maintaining the balance of organic carbon in the fields in the Khmelnytskyi region, is obtained evenly in individual fields within 0.1… 3.6 t/ha. At the same time, there is a low efficiency in the use of natural resources (individual fields) for this region.
Compared to the first indicator, the Gini coefficient of the second indicator is higher (the amount of disposal of corn waste for the production of clean energy, tons/area of corn, ha). It is 0.457 for the conditions of the Khmelnytskyi region. It is established that the amount of alienation varies within a thousand tons of corn waste for the production of clean energy, as well as the existing imbalance between and . That is, the cultivation of corn for grain is uneven in areas in some farms in the region, which leads to uneven territorial distribution of raw materials for the production of environmentally friendly fuels. In addition, in the Khmelnytskyi region there is uneven production of raw materials during certain periods, which is the basis for the emergence of material risks during the implementation of technologically integrated projects of the “European Green Deal” with the use of corn waste.
The situation is similar with the determined Gini coefficient for the distribution of the cost of disposal of corn waste for the production of clean energy between individual farms in the Khmelnytskyi region. In particular, for the third indicator, the Gini index is 0.425 (
Figure 7).
The above graph (
Figure 7) shows that the main share of the cost
of disposal of corn waste for the production of clean energy in the Khmelnytskyi region is obtained unevenly in some fields and ranges from 280 to 14,300 thousand EUR. This indicates the low efficiency of production of raw materials from corn for bioenergy in some areas of the Khmelnytskyi region. However, about 12% of this region can provide high volumes of raw materials for the production of clean energy. At the same time, about 30% of the region has a low potential for these raw materials.
We performed calculations and constructed a histogram of the Gini index change according to three separate indicators for the rest of the regions of Ukraine (
Figure 8).
The results obtained on the quantitative values of the Gini index on three indicators for individual regions of Ukraine indicate a significant unevenness of natural potential. In addition, there is an uneven distribution of raw materials in Ukraine for the production of clean energy from corn waste, which causes material risk and investor risk.
5. Discussion of Research Results
Today, there is no toolkit that takes into account the peculiarities of assessing the state of the project environment in individual regions of the TIP of the EGD implementation using corn waste. On the basis of the proposed approach and the established trends of changes in the specific volume of by-products of corn from its yield (
Figure 3) and the specific cost of disposal of corn waste from its specific volume under the condition of maintaining the balance of organic carbon in the fields (
Figure 4), a computer program in Python 3.9 was developed. It makes it possible to speed up calculations and perform a quantitative assessment according to the indicated indicators (
Figure 5,
Figure 6 and
Figure 7) of the state of the project environment in certain regions of the implementation of projects using corn waste.
The advantages of the proposed approach to the assessment of the project environment are that it takes into account the actual volumes of obtaining by-products of corn in certain regions, as well as the possibility of forecasting the cost of disposal of corn waste from its volume, provided that the feasibility of maintaining the balance of organic carbon in the fields is taken into account. In addition, the variability of the project environment, which determines the risk of the specific cost of corn waste disposal, is taken into account. The main limitation in the use of the proposed approach is the lack of a sufficient database, which is the basis for determining the uneven potential of raw materials (biomass) for the production of ecologically clean energy from corn waste.
The proposed approach to assessing the design environment of the TIP of the EGD for corn waste involves the implementation of 10 stages, the order of which is reflected in the block diagram of the developed algorithm (
Figure 1). The basis of this approach is to determine the dynamics of inequality of given regions in terms of resource potential—the projected volume of disposal of corn waste. They are the basis for substantiating the value and configuration of environmentally friendly energy systems from corn waste. It is proposed to use the Gini index to assess the relationship between the indicators of dispersion of raw materials in a given area. In addition, it is proposed to use official static data as the main source of information that underlies the assessment of corn grain production in previous years.
Based on the collected data on the volume of corn for grain in different regions of Ukraine over the past 10 years, its yield and gross harvest, trends in the relevant indicators have been identified. It is established that on the territory of Ukraine the grain yield of corn varies widely—2.12…10.21 t/ha, and variability is observed both in some regions and during certain calendar periods. Identified 9 regions of Ukraine (Dnipropetrovsk, Donetsk, Zaporizhzhia, Kirovohrad, Luhansk, Mykolaiv, Odessa, Kharkiv, Chernivtsi), which do not ensure the preservation of the balance of organic carbon in the fields during long-term cultivation of corn. These are mainly the southern and eastern regions of Ukraine, which have unfavorable natural and climatic conditions for growing corn for grain. These regions were excluded from further research because they are unfavorable for the disposal of corn waste for the production of clean energy.
The established dependence (
Figure 3) of the specific volume of by-products of corn on its grain yield determined the quantitative values of the specific volume of corn waste
available for disposal in the studied regions, while maintaining the balance of organic carbon in the fields (
Table 2). Quantitative values of maize waste disposal for clean energy production in some regions of Ukraine (
Table 3), as well as dependence (10) made it possible to determine the cost of maize waste disposal for clean energy production (
Table 4).
On the basis of the formed database and knowledge for the assessment of the project environment, the regions that meet the requirements for the required amount of raw materials for bioenergy production and indicators for assessing the unevenness of its dispersion have been identified. Based on the conducted research, data sets were formed in the context of individual regions by indicators and to determine the Gini index () by indicators: I (specific volume of by-products of corn , which is available for disposal under the condition of maintaining the balance of organic carbon in the fields, t/ha/ corn yield per grain, t/ha); II ( volume of maize waste disposal for production of environmentally friendly energy, tons/ area of maize cultivation, ha); III (cost of disposal of corn waste for the production of clean energy, thousand euros/volume of disposal of corn waste for the production of clean energy, tons).
Based on the disclosure of the contents of the blocks, which are depicted in the block diagram (
Figure 1), developed a computer program in Python 3.9. It is based on the proposed approach and makes it possible to perform appropriate calculations, to establish quantitative values of the Gini index between the outlined indicators of the state of the project environment for the implementation of TIP of the EGD. The obtained results on the quantitative value of the Gini index on three indicators for some regions of Ukraine indicate a significant unevenness of natural potential. There is also an uneven distribution of raw materials in Ukraine for the production of clean energy from corn waste, which causes material risk and investor risk.
It is established that some regions of Ukraine for which the permissible Gini index does not exceed the limit value of 0.4. In particular, according to the three considered indicators, this index does not exceed the limit value in three regions—Sumy, Rivne and Ternopil regions. In addition, in Zhytomyr and Ivano-Frankivsk oblasts, the Gini index exceeds the critical value only by the second indicator and is 0.424 and 0.415, respectively. At the same time, Zhytomyr region has a much greater potential for the production of raw corn for environmentally friendly energy.
Four regions of Ukraine (Vinnytsia, Poltava, Kherson, Zakarpattia) have an unfavorable project environment for the implementation of projects using corn waste from risk positions. In these regions, the Gini index on the three studied indicators exceeds the critical value and is greater than 0.5. The most unfavorable region is Zakarpattia. This is due to the fact that in this region there is insufficient yield of corn for grain and the volume of its cultivation. In addition, there is a significant uneven distribution of raw materials both in these regions and in relation to certain periods of production of clean energy from corn waste, which causes significant material risk and investor risk.
The obtained results of the research provided the establishment of tendencies of changes in quantitative indicators of the state of the project environment of TIP of the EGD, which are the basis for substantiation of anti-risk measures. The conducted research will be useful for project managers and will provide an opportunity to improve the quality of managerial acceptance during the implementation of these projects.
The use of the developed approach to the assessment of the project environment of the technologically integrated “European Green Deal” projects with the use of corn waste made it possible to conduct research and gain new knowledge about the trends of changes in the desired system value of these projects due to their special project environment in individual regions. The acquired knowledge is the basis of the developed computer program for planning technologically integrated projects taking into account the risks of stakeholders and determining reactions to them. Further research will require the use of a developed computer program that will make it possible to identify priority regions in different countries for the implementation of projects that will provide maximum value for their stakeholders.
In the future, if there is a large amount of data on the state of the TIP of the EGD design environment, it is possible to use one of the computational intelligence tools. In particular, this applies to machine learning (ML) algorithms, which will ensure high accuracy of forecasting the state of the project environment of the developed approach to the assessment of the project environment of technologically integrated projects of the “European Green Deal” with the use of corn waste. These machine learning algorithms made it possible to conduct research and gain new knowledge about the trends of changes in the desired system value of these projects due to their special project environment in individual regions. The acquired knowledge is the basis of the developed computer program for planning technologically integrated projects taking into account the risks of stakeholders and determining reactions to them. Further research will require the use of a developed computer program that will make it possible to identify priority regions in different countries for the implementation of projects that will provide maximum value for their stakeholders.
In the future, if there are a large amount of data on the state of the TIP of the EGD design environment, it is possible to use one of the computational intelligence tools. In particular, this applies to machine learning (ML) algorithms, which will ensure high accuracy of forecasting the state of the project environment.
6. Conclusions
The proposed approach to assessing the design environment of technologically integrated projects of the “European Green Deal” using corn waste involves the implementation of ten stages. It is based on determining the dynamics of inequality of individual regions in terms of resource potential for the production of clean energy from corn waste according to the Gini index. This index provides an assessment of three indicators that fully take into account the uneven volume and distribution of raw materials in a given area for clean energy production, which allows the pre-assessment of the risks to stakeholders of projects using corn waste.
Based on the proposed approach, a computer program in Python 3.9 was developed. It provides an opportunity to speed up the calculations and perform a quantitative assessment according to these indicators of the state of the project environment in some regions of the implementation of the TIP of the EGD. Based on the proposed tools, the uneven distribution of raw materials in Ukraine for the production of clean energy from corn waste and the risk of value for stakeholders were analyzed. It was established that nine regions of Ukraine (Dnipropetrovsk, Donetsk, Zaporizhzhia, Kirovohrad, Luhansk, Mykolaiv, Odesa, Kharkiv, Chernivtsi) do not ensure the preservation of the balance of organic carbon in the fields during the long-term cultivation of corn. These are mainly the southern and eastern regions of Ukraine, which have unfavorable natural and climatic conditions for growing corn for grain. Four regions of Ukraine (Vinnytsia, Poltava, Kherson, Zakarpattia) have an unfavorable project environment from the standpoint of risk. In these regions, the Gini index according to the three studied indicators exceeds the critical value—0.5. The most unfavorable region is Zakarpattia. Three regions of Ukraine (Sumy, Rivne and Ternopil regions) have the minimum risk for the implementation of the TIP of the EGD.

 ,
, 


