Article

Electrothermal Multicriteria Comparative Analysis of Two Competitive Powertrains Applied to a Two Front Wheel Driven Electric Vehicle during Extreme Regenerative Braking Operations

by
Khaled Itani
1 and
Alexandre De Bernardinis
2,*
1
SATIE (UMR 8029), Conservatoire National des Arts et Métiers, CEDEX 03, 75141 Paris, France
2
LMOPS (EA 4423), IUT de Thionville-Yutz, University of Lorraine, 57070 Metz, France
*
Author to whom correspondence should be addressed.
Submission received: 8 October 2022 / Revised: 7 November 2022 / Accepted: 10 November 2022 / Published: 14 November 2022

Abstract

:
The powertrain performance in an electric vehicle is fully dependent on the electrical and thermal constraints of the static converters ensuring the power transfer taking place between the energy storage systems and the electromechanical machines. These constraints depend on the architectures of the power converters, and their control strategies. Particularly, the maximal limits are reached in maneuvers such as hard regenerative braking circumstances. Indeed, braking recovery is a critical phase in the vehicle’s operation, and its duration and intensity may strongly impact the vehicle’s battery behavior or integrated hybrid storage system. The innovative objective of the paper is to propose an electrothermal multicriteria comparative study based on electrical and thermal criteria for two competitive powertrains. These semi-active power configurations (a 3-level DC/DC converter-based, and a Z-source converter-based) are implemented in a two-front wheel driven electric vehicle during extreme regenerative braking conditions. Open-loop and closed-loop controls were implemented in the Z-source using the maximal constant boost control with 3rd harmonic injection modulation technique. We considered two paralleled IGBT modules instead of the single shoot-through structure. Our approach is based on simulation during an extreme braking maneuver leading to heavy repercussions on the overall powertrain system. The aim is to investigate the challenging structure of the Z-source. Results showed that the proposed 3-level DC/DC-based topology has better performances in terms of power losses, efficiency, thermal behavior, and electromagnetic interference.

1. Introduction

1.1. General

Several reasons have led to the evolution and the emergence of electric vehicles (EV). Negative environmental impacts of ICE-based vehicles, reductions in noise levels, human health concerns, and safety improvements are directing organizations, legislators, and governments to impose a series of standards and laws encouraging the use of zero-emission vehicles. Regulations and agreements have accelerated the process of transport electrification for carmakers. In terms of market share, the electric vehicle and hybrid electric vehicle markets promise an average of EUR 250 billion in Europe itself, by 2025. This has launched a wide-open competition between car manufacturers, each claiming a big part of this promising market which guarantees a solid transformation of transportation technology toward electromobility.
Transportation electrification is a necessity at strategic levels: energy independence, environmental and health constraints, economic sustainability, presence in the transportation market… and surely research and development.
In terms of electromechanical powertrain, the technological aspects of an EV are mainly based on energy storage systems, drivetrain systems, and power electronics converters. Hybridization of the energy storage system consists of integration of several energy sources. The energy management system of the hybrid energy storage system (HESS) efficiency depends on the strategy adopted. It considers the advantages of the secondary energy storage element (taken as a high-power density device) from the perspective of improving the primary energy storage lifespan (taken as a high-energy density element). The power conversion and transfer between different DC voltage energy storages and dynamic electromechanical converters (electric motors) are controlled by power electronic based static converters. Selection of statics and dynamic converters and their related controls highly depends on many factors, such as topologies, structures, and technologies, but also, and mainly, on high transient and severe operations.
The aim of the paper is to propose an electrothermal multicriteria comparative study of two competitive conversion powertrains applied to a two-front wheel driven electric vehicle during extreme regenerative braking operations. Regenerative braking consists of transferring a part of the kinetic energy stored in the vehicle mass to the hybrid storage system in the powertrain [1,2]. During these severe transfer process, power converters undergo peak power surges, involving generation of high amplitude transient electrical signals of large values and inducing critical operating constraints on the various elements.
The simulation represents the electrothermal behavior of the whole powertrain. The aim will be to analyze the electrical transients and the various states characterizing two different hybrid energy storage systems in order to compare and validate the behavior of the various power conversion architectures and control structures associated without exceeding the electrical constraints of different elements including power switches.
In this paper, a comparison is conducted between a Z-source-based converter and a 3-level converter/SVPWM inverter (called 3-level/SVPWM) applied to an HESS consisting of a Li-ion battery as a primary source and an ultracapacitor (UC) as a secondary source. In literature, until now, such a comparative approach between the two competitive topologies for EV application and impact on the HESS has not been mentioned.

1.2. State of the Art

The Z-source inverter (ZSI), introduced in [3], was proposed to combine the functions of the DC/DC converter and the voltage source inverter. In a conventional voltage source inverter, the output voltage is always lower than the DC input voltage and the converter provides buck DC/AC power conversion. An additional boost converter is then required resulting in a two-stage power conversion system having drawbacks on the system cost, complexity, and efficiency.
The ZSI has both buck and boost abilities. It applies an impedance network to interfere between the power source and the inverter of the system [4,5]. It boosts the DC bus voltage of an inverter by using the shoot-through (ST) state. One of the advantages is that it does not require dead-time control to protect the voltage source against the same phase leg inverter switches during short-circuit. Several modulation methods can be applied to the inverter [6]. Authors in [7] studied the comparison between a modified space vector pulse width modulation (SVPWM) and the simple boost control (SBC) modulation method. The simulation results show superiority of the proposed modified SVPWM in terms of harmonic spectra distribution and power efficiency. In the same perspective, authors in [8] obtained a better voltage THD factor by proposing a modified modulation shoot-through strategy. Authors in [9] simulated and analyzed the boost factor, voltage gain, duty cycle, and voltage stress across the switches for the SBC and the maximum boost control methods. They showed that better performance would be obtained if modulation index and shoot-through duty cycle were set to a high value. A modified simple boost control with independence relation between modulation index and shoot-through duty has been simulated and analyzed in [10]. The simulation shows that the modified simple boost control, as well as the maximum boost control could utilize a high modulation index to generate output voltage that requires high voltage gain. Nevertheless, the coupling between the shoot-through duty cycle and the modulation index makes a tradeoff between the voltage gain and the output voltage harmonic [11]. A modified discontinuous PWM technique was also proposed for a three-phase ZSI offering smooth voltage gain variation, a wide operating range, reduced voltage stress, and improved total harmonic distortion [12].
Z-source applications may reach several domains as microgrids applications [13], fuel cell applications [14], and renewable energy applications [15]. For motor traction applications, by controlling the shoot-through duty cycle, the Z-source provides greater output AC voltages, ride-through capability under voltage sags, current line harmonics reduction, and output voltage range extension. The latter point allows for increasing power capacity to the motor and thus minimizing its ratings. These assumptions were supported in [16]. For EV applications, the paper in [17] proposed a small signal modeling and a voltage controller design of a bidirectional quasi-inverter (BqZSI) to be connected to the battery of an electric vehicle. A decoupled control algorithm between the DC side and the AC side of the BqZSI is achieved. The authors in [18] developed an improved control strategy for a quasi-Z-source inverter (qZSI)-fed permanent-magnet synchronous machine (PMSM)-based electric vehicle. The controller with feed forward compensation has proven its stabilizing effectiveness against disturbance during non-shoot through state [19].
The traditional Z-source inverter has a higher capacitor voltage of the capacitor and a startup shock. Researchers proposed a variety of improved Z-source topologies by increasing boost capacity or reducing capacitor voltage. In [20], a simulation based on eleven Z-source topologies analyzed in terms of boost capacity, inductance start-up current, capacitance stress, and economy was performed. Two kinds of promising topologies were suggested. Other authors worked on minimizing current ripples [21], and improving converter efficiency [22] and reducing output voltage distortions [23].
Propositions for a UC-based hybrid energy storage system for an electric vehicle were elaborated [24,25,26]. The objectives are to extend the lifetime of the battery by optimizing the energy management strategy. Some authors have simulated the power distribution strategy on the Pontryagin’s minimum principle [27], others on the genetic algorithm optimization technique [28]. The authors in [29] applied a bidirectional buck-boost DC-DC resonant converter to a kinetic energy recovery system to manage the UC pack of an electric vehicle in order to meet the dynamical tests of the Formula SAE electric competition.
When using qZSI and BqZSI, an enhanced frequency dividing coordinated control strategy is established to optimize the dynamic power regulation and the battery current stress in short timescale [30]. The asymmetric characteristic related to the uneven power distribution was discussed in [31]. In [32], a distributed energy storage design battery/UC within an electric vehicle for smarter mobility applications was introduced. Loss and the efficiency analysis of the bi-directional interleaved converter was presented.

1.3. Comparative Study between Z-Source and Classical Topologies

Comparison between a bidirectional Z-source and a two-stage design were conducted in [33]. The improved modulation techniques are based on the conventional sinusoidal PWM or the space vector PWM. These techniques can be addressed from different perspectives including processing speed, ease of digital implementation, mathematical simplification, or improvement of harmonics distortion. A novel PWM control strategy for a DC linked quasi-switched boost inverters was deployed in [34] for low voltage gain application improving the voltage and reducing the conduction loss and the inductor current ripple. Comparison has been established between a qZSI and a two-stage inverter.
A study in [35] compares a three-phase three-level voltage source inverter with an intermediate DC/DC boost converter and a quasi-Z-source inverter in terms of passive element values and dimensions, semiconductor stresses, and overall efficiency. The simulation tests and experimental set-up was performant for 1 kW, 50 Hz fundamental frequency.
Power loss comparison of a Z-source inverter and a voltage-source inverter linked to a DC/DC-boost converter was also simulated in [36] for a wind turbine application giving superiority to the DC-DC converter/inverter topology in terms of efficiency. For PV applications, a comparison of a qZSI and a traditional two-stage inverter shows lower THD and higher efficiency for the qZSI [37].
The contribution of this work is listed below:
-
Comparative study based on electrical and thermal criteria for two competitive conversion powertrains: based on a 3-level DC/DC converter, and based on a Z-source converter.
-
Open-loop and closed-loop control strategies have been implemented in the Z-source using the maximal constant boost control with the 3rd harmonic injection modulation technique.
-
The two considered structures are implemented in a two-front wheel electric vehicle during extreme regenerative braking operations in simulation environment.
-
Analysis of the different simulation results have been performed based on the cited criteria.

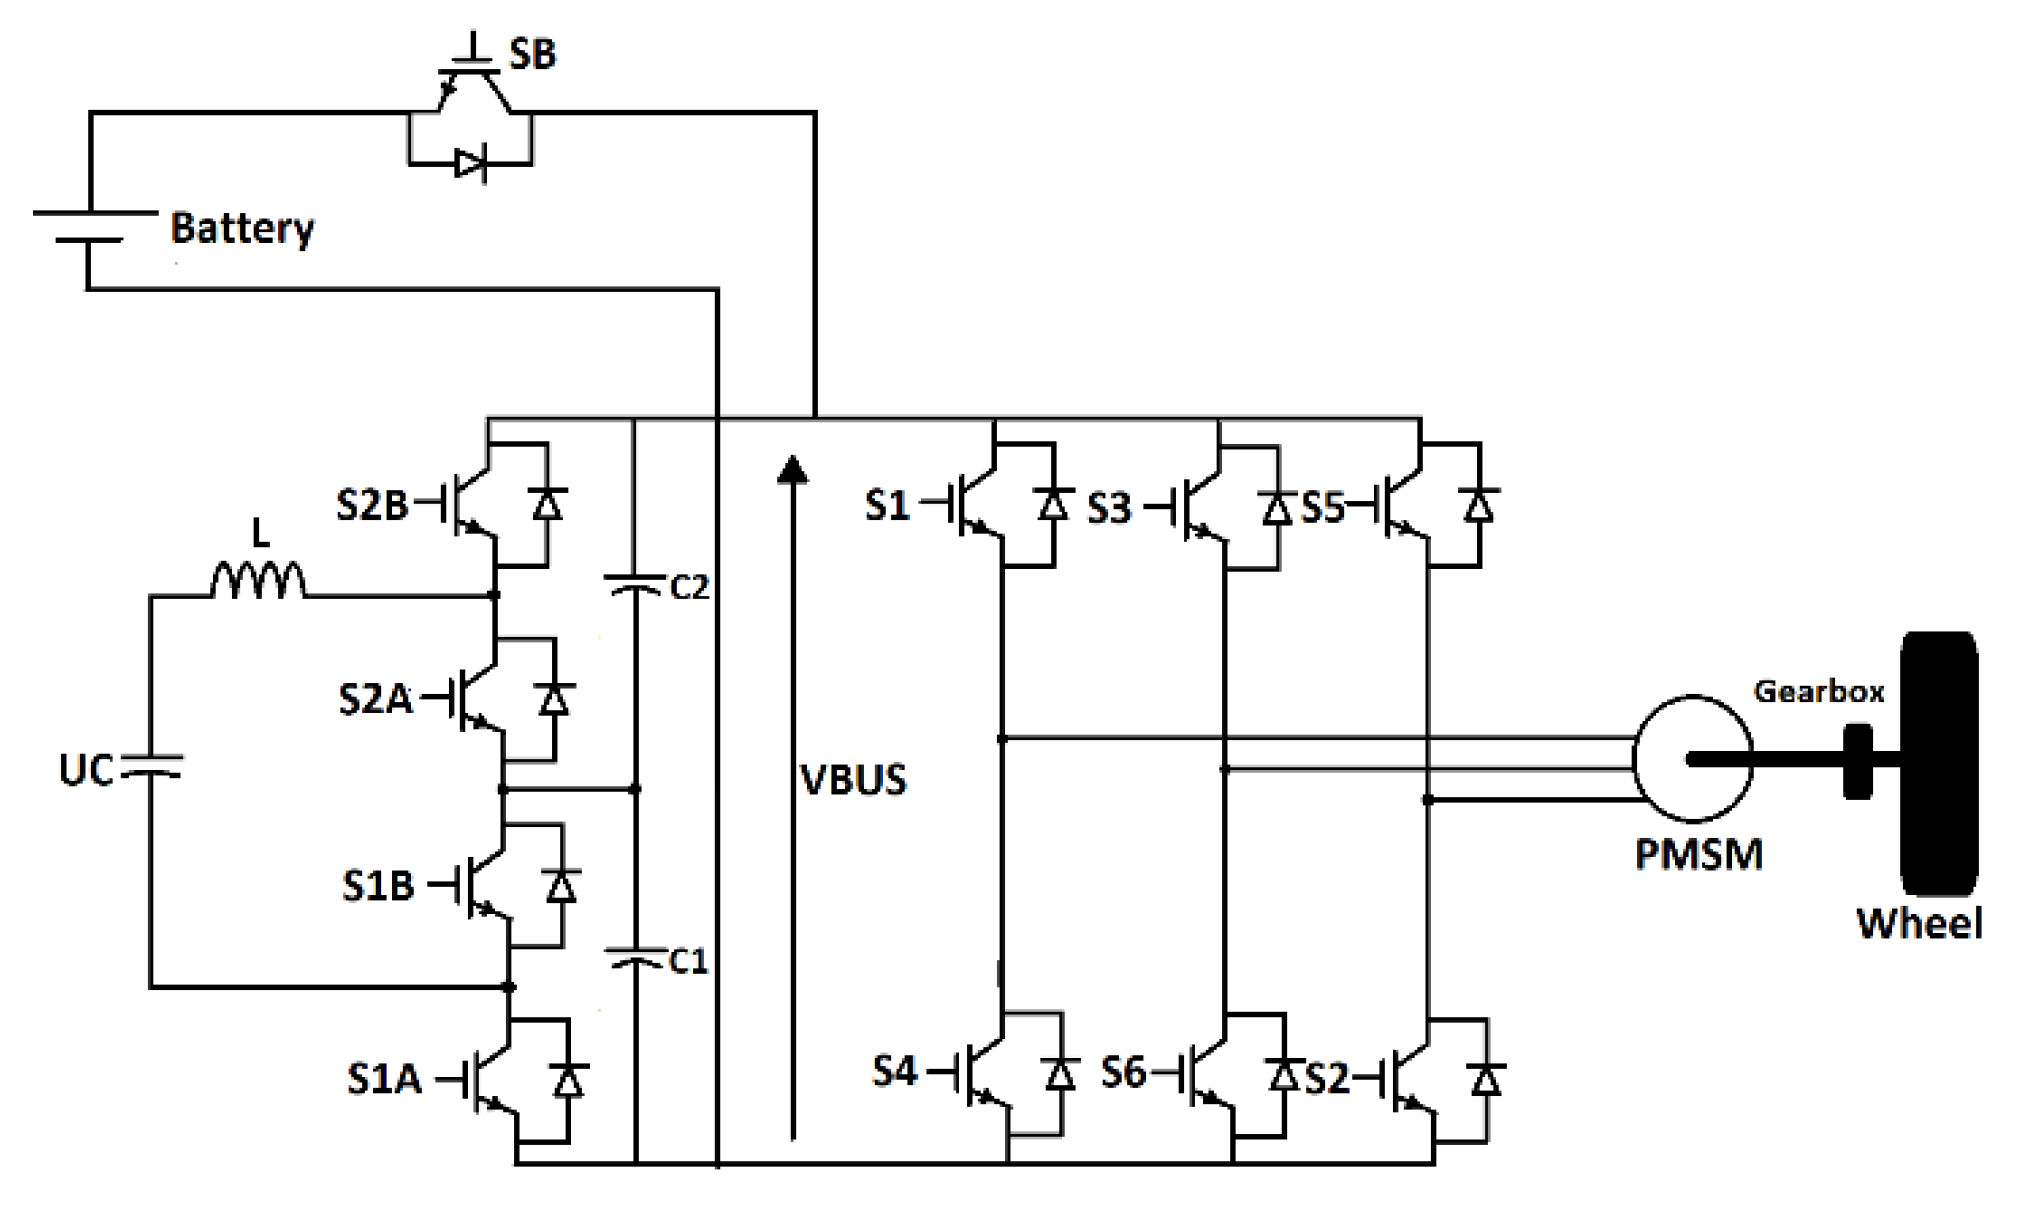
1.4. System Description

The system consists of a, two in-wheel interior permanent magnet synchronous motors (IPMSM), front driven electric vehicle. Each motor has an output power of 30 kW. The motors are supplied with a hybrid energy storage system which includes a Li-ion battery and an ultracapacitor (UC). The battery as a primary energy source delivers the main energy to the vehicle in order to ensure the drive of the vehicle. Whereas the role of the UC, as a high-power density element, is to deliver/recover energy during high peak power demand, hence protecting the battery from excessive currents and overvoltage while assuring a maximum braking capacity and a high-efficiency behavior. One goal is to minimize the intervention of the Li-ion battery, which prevents many weaknesses relative to the electrochemical processes taking place during charging and discharging phases. These processes lead to a loss of capacitance, an increase in its internal resistance, a reduction in its lifespan, and, in extreme cases, thermal runaway with risk of fire. These consequences accelerate during high transient solicitations. During these severe operations, power converters experience peak power surges, involving generation of transient signals and inducing critical operating constraints for the various power elements.
During braking, the nature and form of the electromechanical input power, coming from the wheels, is handled by DC/AC and DC/DC converters ensuring proper torque and DC bus voltage controls. This energy is adapted to be stored in the energy storage elements. During acceleration, the power flow is reversed. The topology used in the present paper is a semi-active topology. The UC is connected to the regulated DC/DC converter supplying optimal power, while the battery is used to supply or absorb power passively. The actual work is a continuity of several former research works. In fact, this system was previously studied using a 3-level converter as a DC/DC converter (Figure 1). The system has a two inverter/motor set. For simplicity, only one set will be shown. Part of the present study will complete the 3-level DC/DC analysis integrating the SVPWM modulation, dead-time delays control, and IGBT switching power losses computation.
The controls of the two converters in Figure 1 are independent. The use of a ZSI topology, instead, will have, as a first view, two advantages: only one single IGBT switch is used by the DC/DC converter and the control of this switch is directly linked to the modulation technique used by the Z-source inverter. The main contribution of the paper is to propose a simulated comparison between the two cited semi-active configurations (based on a 3-level converter, and based on a Z-source converter) integrated into a hybrid energy storage system supplying a two-front wheel driven electric vehicle. The nature of the information collected and implemented regarding the overall system will be exhaustively discussed in the present paper. The comparison is based on switches’ voltage stresses, power efficiency of the whole conversion powertrain, and delivered braking torque spectral analysis.
The objective of the present paper is not to promote one solution over another. Indeed, in our problem, the state evolution of each system depends on intrinsic parameters, controlled and uncontrolled inputs as well as the modeling choices that were made. Furthermore, we pay particular attention to improving the behavior of the system by upgrading the control system to ameliorate the system response (leading to a more complex control design) and by adding passive filters to minimize harmonics and signal distortion. In fact, the control design always falls into a comprise between robustness regarding model uncertainties and noise inputs, real time implementation, and high computational performance requirements in terms of processor speed and memory capacity.
The comparison will be carried out on a previous 3-level conversion topology discussed by authors with some additions and the Z-source converter. The latter is known for its integrated DC/DC and DC/AC conversion control and especially for the advantage of use of a single IGBT for the DC/DC structure side.
The paper layout is as follows: The Z-source is introduced in Section 2. General configurations, control structures, modulation techniques, and their relative electrical and gain equations will also be defined. Two types of control strategies will be presented (an open-loop and a closed-loop control). The 3-level converter is discussed in Section 3. The selection of IGBTs used for power loss calculations and thermal behavior of the system is also discussed in Section 2 and Section 3. Section 4 describes the thermal model and power loss computation adopted. After briefly describing the whole system model including the vehicle dynamic, the braking control, and the electric motors’ control strategies, simulation tests are performed, and the comparison analysis is provided in Section 5.

2. Z-Source Converter

2.1. Introduction

As mentioned, the Z-source inverter is a type of power converter which combines the functions of the DC-DC converter and the voltage source inverter. It can boost the DC input voltage with no requirement of a DC-DC boost converter or a step-up transformer. It provides both voltage buck and boost properties, which cannot be achieved with traditional inverters. The comparison among conventional DC-DC-boosted PWM inverter and the Z-source inverter shows that the Z-source inverter needs the lowest semiconductors and circuit control.
In traditional voltage source inverters, there are eight switching states (6 active states and 2 zero states). While the Z-source inverter comprises an additional zero state called shoot through zero state where the upper and lower switches in one or more phase legs are gated on simultaneously. This state, forbidden in a voltage source inverter, makes the Z-source inverter more robust against electromagnetic interference and parasitic turn-on of devices.

2.2. Z-Source Structures Fundamentals

This subsection will be dedicated the summary of Z-source basics. The bidirectional quasi Z-source (BqZSI) will be chosen as the technological solution for the system.

2.2.1. Three-Phase Z-Source Inverter

The configuration of a conventional 3-phase Z-source inverter is shown in Figure 2. The DC-link circuit is a symmetrical X shape network consisting of two identical inductors ( L 1 and L 2 ) and two identical capacitors ( C 1 and C 2 ). The X shape forms a unique impedance network to avoid short-circuits when the device is in the shoot-through mode. Capacitor voltages and inductors’ currents are the same.
Figure 3 shows ZSI in shoot-through state and non-shoot-through state. During the ST state, the source diode is reverse biased and the input is disconnected from the rest of the circuit. The energy is transferred during this state from C 1 to L 1 and from C 2 to L 2 ( V C = V L ) . The equation that governs this operation is
V B U S = V C 1 V L 1 = V C 2 V L 2 = V C V L = 0 .
During non-shoot-through, diode D is forward biased, and the inverter bridge acts as a current source. The energy is transferred from L 1 to C 2 and L 2 to C 1 . The equation that governs this operation is
V U C = V C 1 + V L 2 = V C 2 + V L 1 = V C + V L .
The equation of V B U S in the non-shoot-through state could be written as
V B U S = 2 V C V U C = T T 1 T 0 V U C = B × V U C ,
where T is the switching period, T 0 is the shoot-through period, and T 1 is the non-shoot through period. B is called the boost factor and can be expressed as
B = T T 1 T 0 = 1 1 2 D 0 ,
D 0 is the shoot-through duty cycle ( D 0 = T 0 T ) .
The average DC bus voltage applied to the inverter is
v B U S ( t ) = 1 D 0 1 2 D 0 V U C .
In the traditional 3-phase PWM inverter, the equation of AC output voltage is
V O U T = M × V U C 2 ,
M is the index of modulation.
In the Z-source inverter, boost factor B is added to the parameter control having
V O U T = B × M × V U C 2 = G × V U C 2 ,
G   ( = B × M ) is the inverter gain.
The advantage of this structure is that it realizes the boost function and DC-AC conversion in one active stage. This configuration of ZSI inverter has a unidirectional power flow, discontinuity of the input current, high inrush startup current, high voltage stress on switches, and high voltage across capacitor.

2.2.2. Bidirectional Quasi-Impedance Source Inverter

The quasi-impedance source inverter (qZSI), ref. [38] was proposed to overcome the problems of ZSI. The improved Z-source network has a continuous input current, a low voltage stress on capacitors, and sharing of the input/output grounds. As shown in Figure 4, to achieve power bidirectionality, the diode is replaced by active switch S7 with a reverse diode. S7 operates during the regenerative mode and its signal is the complement of the shoot-through signal.
The DC bus link ripple current will be absorbed by the two capacitors, which provides a better operating condition for the UC pack. The discontinuous conduction mode can be avoided and the BqZSI has better performance under low power factor condition (motor operating at light load). The BqZSI will be adopted in our study.

2.2.3. Passive Components Requirements

Passive components can be chosen depending on the capacitor voltage ripple and the inductor current ripple of the Z-source inverter as
C = P m a x   T S   D 0 V U C   Δ V C , and
L = V U C   ( 1 D 0 )   T S   D 0 Δ I L   ( 1 2 D 0 ) ,
where P m a x is the maximum output power, T S the switching period, D 0 the shoot-through duty cycle, V U C the voltage of the ultracapacitor (taken at its minimal value), Δ V C the required capacitor voltage ripple, and Δ I L the required inductor current ripple.

2.2.4. Types of Modulation Techniques

In Z-source inverter, there are various types of PWM techniques used for control. These techniques are simple boost control (SBC), maximum boost control (MBC), maximum boost control with third harmonics injection, maximum constant boost control (MCBC), and maximum constant boost control with third harmonic injection [39]. The MCBC with third harmonic injection will be selected as the most appropriate for our study.
The SBC is derived from the traditional sinusoidal PWM. Its main drawback is the restriction of the shoot-through time period (and thus the limitation of the boost factor) as well as an increasing device stress and switching power loss. Whereas the boost factor in the MBC technique will reduce the devices’ stress in comparison to SBC. Nevertheless, the variation of shoot-through time period, generating low frequency harmonics in the passive component, will increase the cost and volume of the circuit.
MCBC (Figure 5) uses maximal boost factor and constant shoot-through time period to eliminate low frequency surge in the impedance-source network components. The MCBC will be also implemented using third harmonic injection by replacing the modulating signals by 1/6 third harmonic injection to increase the modulation index by 2 3 . It will be used in our study to conduct the comparison with the 3-level/SVPWM configuration.

2.2.5. Open-Loop Control

Based on Equation (5), the average value of the DC bus voltage can be determined according to the modulation technique. The open-loop control consists of imposing the index modulation M to the modulation strategy control system according to the required average DC bus voltage value.
We note that the voltage across the ultracapacitor is a fast-changing value depending on the rate of the input braking power. For the MCBC control technique, the equation is expressed by
M = 2   v B U S ( t ) 3 ( 2   v B U S ( t ) V U C ) .

2.2.6. Closed-Loop Control

DC Side Control

The modeling and control of a bidirectional ZSI can be found in the literature [40]. The authors in [41] worked on a small signal model of a BqZSI. In a Z-source, the average voltage value applied to the DC bus is equal to the average voltage value of the capacitor C 1   (or C 2 ),
v B U S ( t ) = V C .
The transfer function of the capacitor voltage, v c 1 ( s ) , can be expressed as
v c 1 ( s ) = G v 2 d ( s )   d ( s ) + G v 2 i n ( s )   v U C ( s ) ,
The ultracapacitor voltage is considered as a disturbance effect in the closed loop control structure. A PI antiwindup controller will be used for the DC bus voltage controller in order to compensate the saturation effect (Figure 6).

AC Side Control

From the AC side control (Figure 7), the objective is to provide a braking torque at a certain wheel speed rotation. The authors have already described the torque control strategy based on the regeneration of current references in [42].

2.2.7. IGBT Power Switches Selection for Z-Source Closed-Loop Control

For designing the electric power system, three major issues come to mind, such as losses, harmonics, and electromagnetic interference. The mentioned issues affect the system in terms of quality, efficiency, size, and cost. The key factor in a power converter is power switches; categorized based on capability of handling the power and their switching speed maximizing voltage blocking and carrying current.
An IGBT cannot withstand a surge current pulse due to the current saturation characteristic of the device. In failure conditions, the IGBT switches are driven into pulse-blocking mode. This leads to an asymmetric short circuit of the load producing additional stress due to the undesirable alternating torques.
Robustness of IGBTs regarding surge-current mode is then essential for some failure modes. A comparison of different IGBT designs at 4 ms and 10 ms high-current pulses with an applied gate voltage above the rated datasheet value is performed in [43]. The authors showed that the increase of the emitter side carrier concentration leads to lower power dissipation and thus to an increased robustness during surge current events. the authors in [44] studied the possibility of symmetrizing the load short circuit with active turned on IGBTs.
For reasons that will be explained later, the selection of the IGBT for the BqZSI will be based on the closed-loop control. Due to the high loss in the ST switching device, a proposition will be made to replace the switching device with two parallel switching devices with lower current specifications in order to minimize the losses and thus the temperature rise within the semi-conductor module (Figure 8).
We have chosen Fuji Electric as the manufacturer of the IGBT modules. Our main criteria are to maintain the same manufacturer for all the power switches used in our two compared power structures. The selection of the power semi-conductors is based on the current/voltage ratings obtained during simulation. The choice of power switches is made based on matching between voltage and current ratings during the critical transient phenomenon [45].
For the ST IGBT device, 1MBI900V-120-50 (1200 V/900 A) will be used for the parallel switching device structure, and 1MBI600VC-120 P (1200 V/1600 A) for the single switching device structure. For the Z-source inverter, 6MBI300V-120-50 (1200 V/300 A) will be selected.

3. Level DC/DC Converter Associated to a SVPWM Inverter

3.1. Introduction

A three-level DC/DC converter is proposed as the interface between the UC and the DC bus (Figure 1). This power architecture allows the UC voltage to be used in a large range, maximizing the energy recovered. The reasons for choosing a three-level converter are justified in minimizing by half, the voltage constraints across the electronic power switches, reducing the size of the inductor and improving the dynamic performance of the converter. However, the controller design is much more complex relative to a classical buck-boost converter topology which involves UC and batteries HESS [46,47,48]. The authors have already proposed the proper sizing of elements and control design of the 3-level converter in [49]. Dead-time delay and space vector pulse width modulation is added to the system control simulation.

3.2. 3-Level DC/DC Converter Control Introduction

Three control loops were designed in [49]. The variables to be controlled are the UC current and voltage as well as the voltage of the DC bus. From the UC current point of view, the DC/DC converter is modeled in Figure 9 as a large-signal average model.
The capacitance C is expressed by:
C m a x ( P m a x   ( 1 2 D m i n ) Δ V B U s   V B U S   f s w , P m a x   ( 3 2 3 ) Δ V B U s   V B U S   f s w ) ,
where f s w is the switching frequency, V B U S the DC bus voltage, Δ V B U s   the required DC bus voltage ripple, D m i n the minimal duty cycle, and P m a x the maximal admissible power.
The inductance L 0   is expressed by
L 0 V B U S m a x 16   Δ i c 0 m a x   f s w ,
where V B U S m a x is the maximal DC bus voltage and Δ i c 0 m a x   the maximal ultracapacitor current ripple.
The duty cycles d 1 and d 2   are generated by nonlinear controller such that
d 1 = u 0 + u c 0 v B U S + Δ d ,   and
d 2 = u 0 + u c 0 v B U S Δ d ,
where u 0 is the main control variable generated by the current controller, and Δ d ( s ) is the balancing duty cycle as an auxiliary control variable generated by the voltage error controller ( Δ v c ( s ) ) .
The transfer functions in a matrix form can be expressed as
[ i c 0 ( s ) Δ v c ( s ) ] = [ G i c 0 u 0 ( s ) G i c 0 Δ d ( s ) G v c u 0 ( s ) G v c Δ d ( s ) ] [ u 0 ( s ) Δ d ( s ) ] + [ G i c 0 B ( s ) G v c B ( s ) ] Δ i B ( s ) ,
where [ i c 0 ( s ) ,   Δ v c ( s ) ]t is the output vector, [ u 0 ( s ) , Δ d ( s ) ]t is the control vector, and Δ i B ( s )   is the perturbation signal.
Whereas for the control of the voltages, the transfer functions of the system can be deduced as
[ u c 0 ( s ) v B U S ( s ) ] = [ G c 0 ( s ) G B U S ( s ) ] i c 0 ( s ) + [ 0 G P ( s ) ] p L O A D ( s ) .
The transfer function Gc0(s) relates the UC voltage u c 0 ( s ) to the UC current i c 0 ( s ) . The DC bus voltage v B U S ( s ) is related to i c 0 ( s ) taken as a control variable (according to the G B U S ( s ) transfer function) and to the load power p L O A D taken as a perturbation variable (according to the G P ( s ) transfer function). The right-half plane zero present in the transfer function G B U S had been neglected due to the fact that the switching frequency is quite greater than the bandwidth of the DC bus voltage control loop in the DC/DC converter.
The DC bus voltage control scheme is presented in Figure 10.

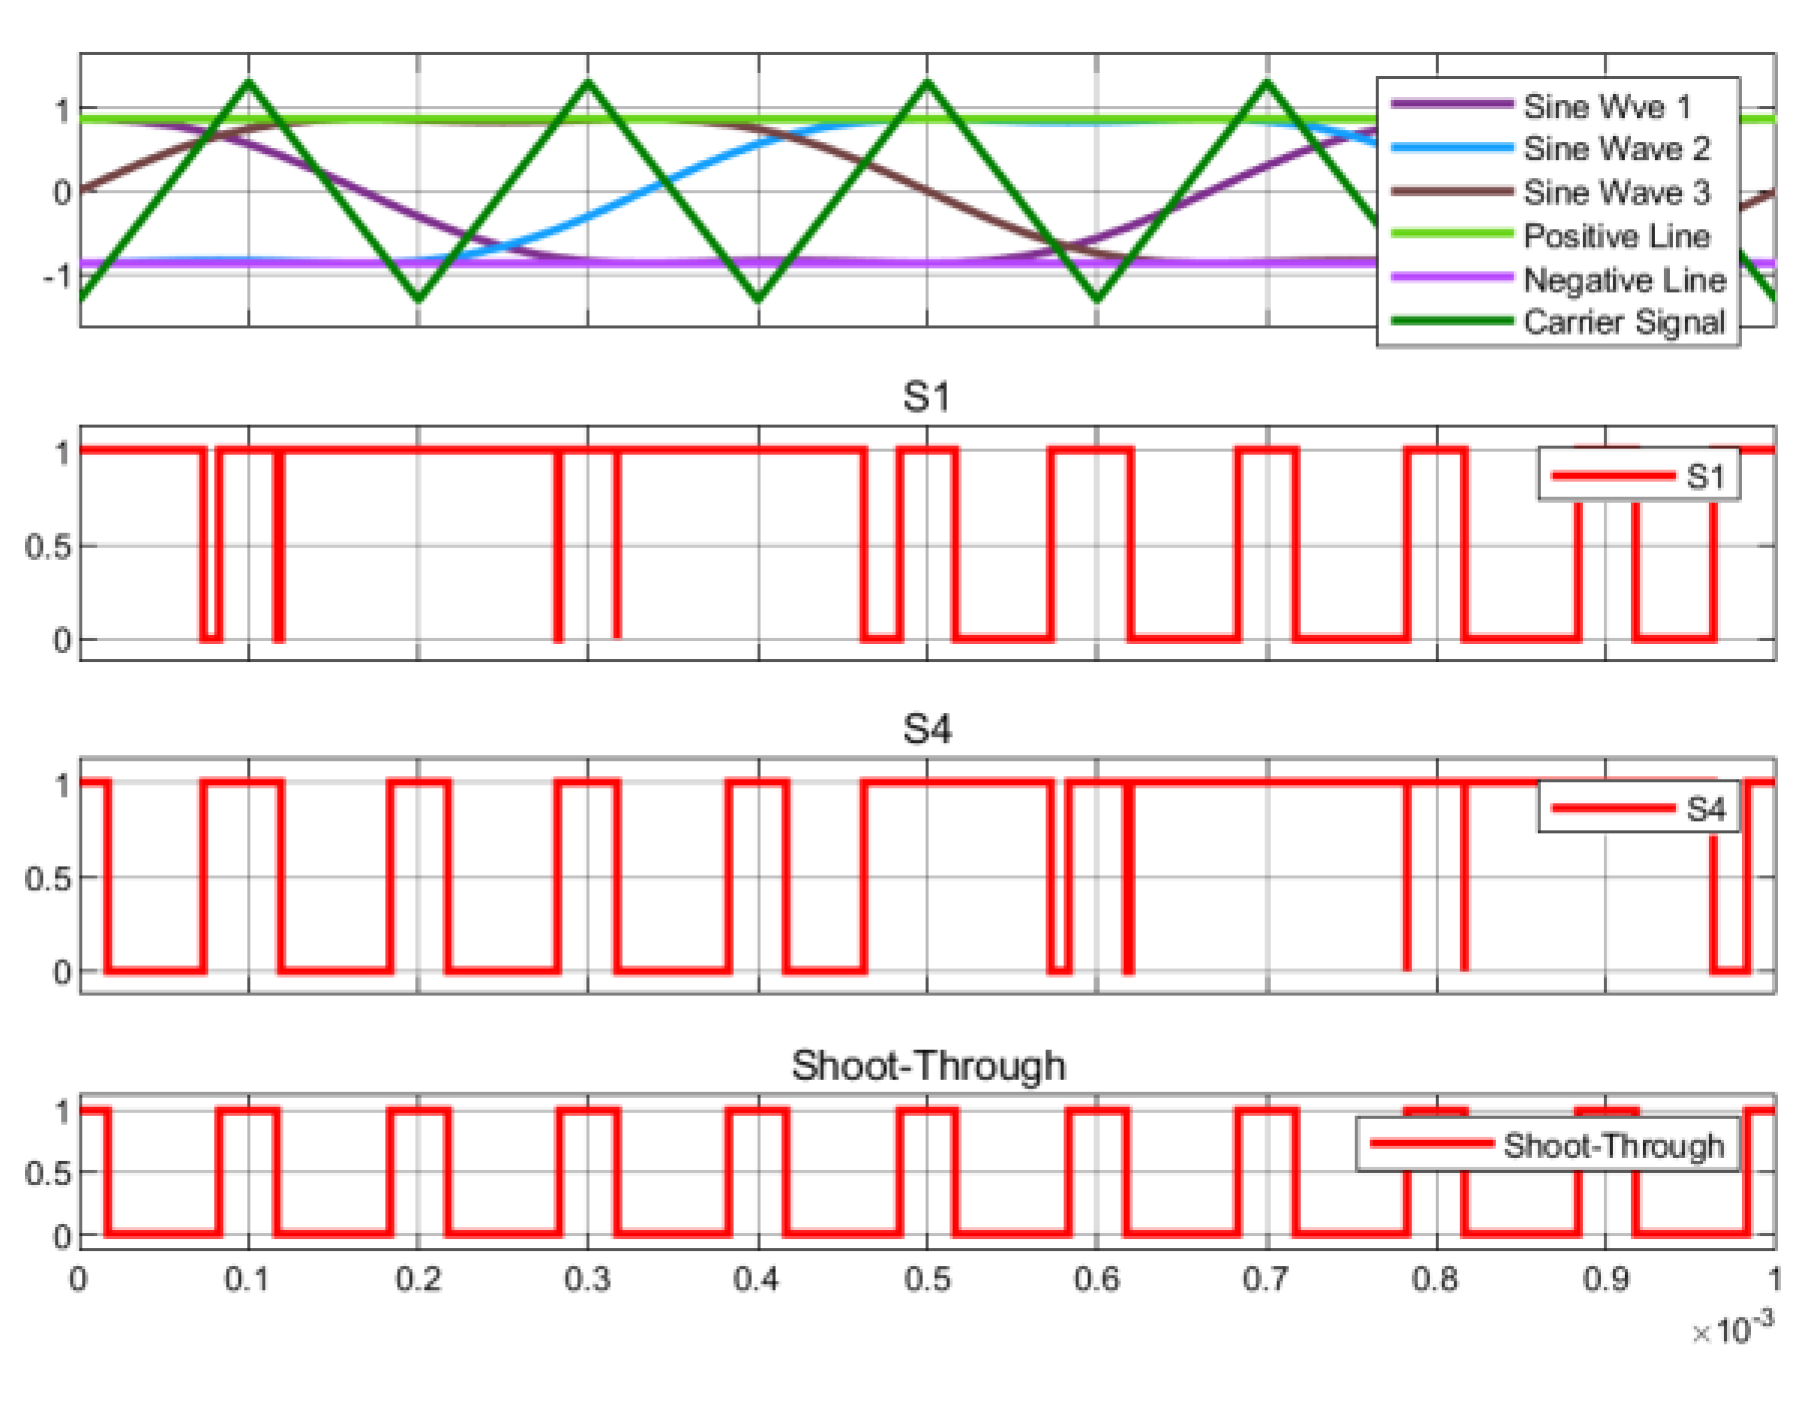
3.3. DC/AC Converter Modulation Technique

The generation of reference voltages for the SVPWM control are based on an optimal traction and regenerative braking current synthesis for an IPMSM using three combined torque control methods for an EV. In order to impose torque at higher speed, the flux should be weakened by injecting negative current into the d-axis. The torque/speed characteristics will be decomposed into five zones of operation delimited by three methods of control: maximum torque per ampere, voltage current limited maximum torque, and constant power region [42].
SVPWM allows higher output voltage compared to the conventional sinusoidal PWM technique. Its implementation is based on the search of the fundamental voltage reference in the αβ plan and on finding the proper applied voltages by the inverter to be imposed and their respective times in one commutation period. The symmetrical distribution of the voltages in a onetime commutation period assures low harmonics distortion.

3.4. IGBT Power Switches Selection

Based on Fuji Electric IGBT modules, electrical and thermal specifications are determined. The 2MBI300VB-060-50 (600 V/300 A) module was selected for the 3-level DC/DC converter, and the 6MBI180VB-120-50 (1200 V/180 A) module for the inverter.

4. Thermal Model and Power Loss Calculation

4.1. Introduction

In terms of power losses in the electric vehicle traction system, the thermal behavior of each major element should be analyzed (storage elements, static and dynamic power converters, passive elements, etc.). The losses in the storage elements involve a deeper study of the physical effects and electrochemical effects. Among the drive losses, control circuit losses and passive elements losses, the semiconductor power switching devices’ losses are the largest. In this paper, the focus is concerned with the static power converters’ losses. Calculating power losses of the inverter plays an important role in improving system efficiency and power density, designing heat dissipation system, and selecting power devices.
The DC/DC converter and inverter losses include the IGBTs and diode losses in terms of conduction and switching losses. Estimation of IGBT switching losses under hard switching using Matlab/Simulink for a step-down converter is proposed in [50]. The authors in [51] used a parabola interpolation method to calculate the inverter losses. The method used parabola interpolation to fit the losses’ characteristic curves instead of linear approximation. High switching frequency is always desired for better performance in terms of signal distortion. In [52], the frequency dependent switching power losses are discussed for a 5 MVA multi-level converter. A synthesis of different electrical methods used to estimate the temperature of power switching devices with thermo-sensitive electrical parameters is discussed in [53]. These methods are then compared in terms of sensitivity, linearity, accuracy, genericity, calibration needs, and possibility of characterizing the thermal impedance or the temperature during the operation of the converter. A general method for estimating junction temperature is studied by using an adaptive thermal network model in [54], considering both the temperature influence on the extraction of parameters and the errors caused by the physical structure.
In this paper, look-up tables based on manufacturers’ data sheet specifications for IGBTs would be used in order to compute power switch losses.

4.2. Thermal Model

Thermal state-space representations for IGBT and its reversed diode are used to build a Cauer network. The state space equations are given below
X ˙ ( t ) = [ 1 R t h   C t h ]   X ( t ) + [ 1 R t h   C t h 1 C t h ]   [ T c P l ] , and
[ T j P c ] = [ 1 1 R t h ]   X ( t ) + [ 0 0 1 R t h 0 ]   [ T c P l ] ,
where, T j is the junction temperature of the device (IGBT or reversed diode), P c the heat flow from junction to case, P l the power loss across the device, T c the case temperature, R t h the junction to case thermal resistance, and C t h the thermal capacitance of the junction. The junction temperature T j will be used as input in the look-up tables to calculate the power losses in the device, and P c as input to Simscape models to compute case and sink temperatures.

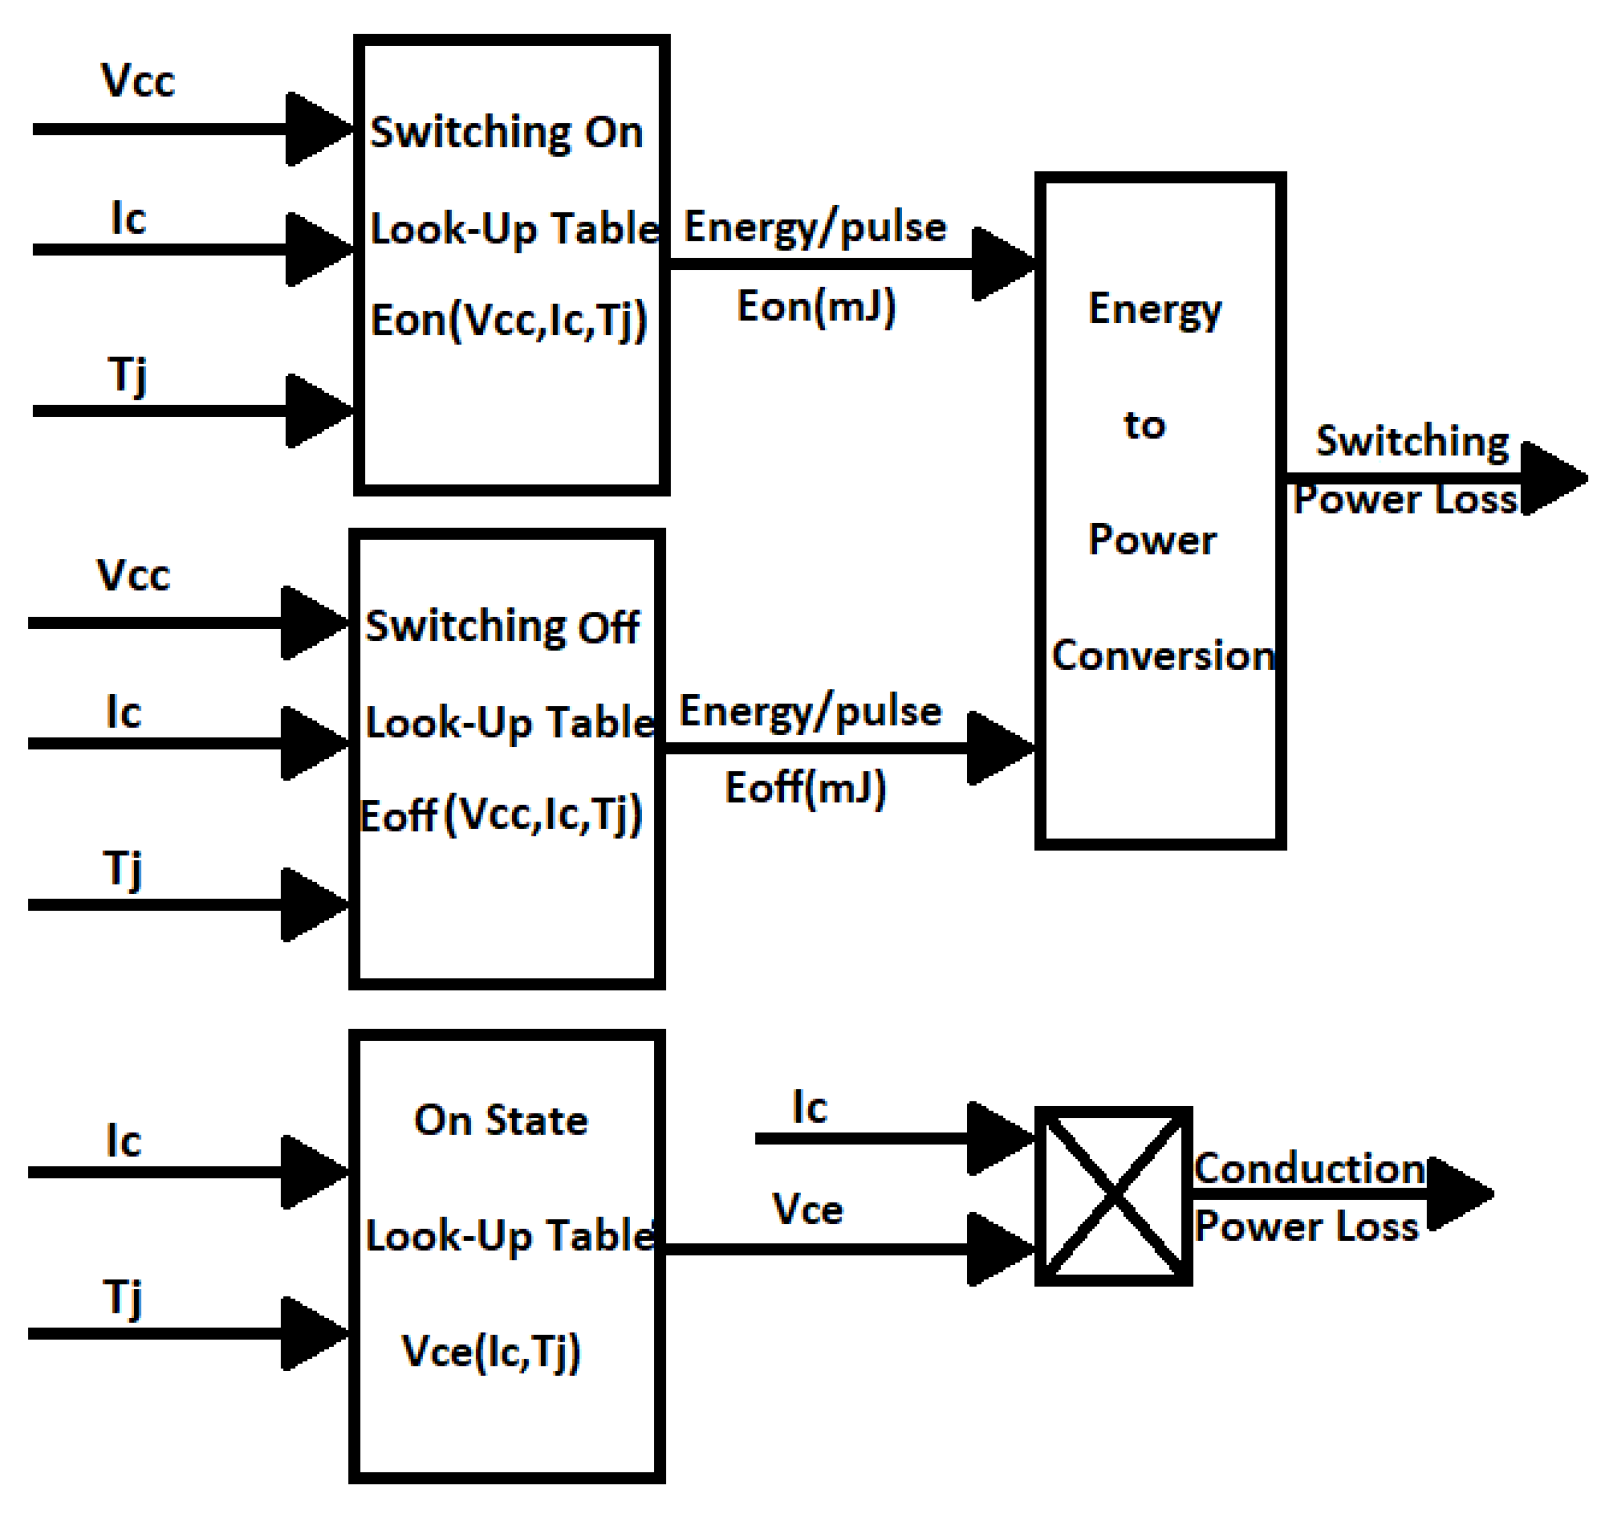
4.3. Power Losses Calculation of the Switching Devices

Power switch device computations will be based exclusively on manufacturer data sheet specifications and characteristics curves for IGBT and its reversed diode.

4.3.1. IGBT Power Losses

For IGBT, turn-on and turn-off switching losses ( E o n and E o f f ) are a function of supply voltage ( V C C ), collector current ( I C ), and junction temperature ( T j ). Collector-emitter voltage V C E (on-state), used to quantify conduction power losses, depends on I C and T j . Three look-up tables (two 3-dimensional tables and one 2-dimesional table) are used to generate energy switching losses and V C E (Figure 11).

4.3.2. Diode Power Losses

For the diode, reverse recovery energy loss ( E r e c ) is a function of the supply voltage ( V c c ), the forward current ( I F ), and the junction temperature ( T j ). Forward voltage V F (on-state), used to quantify conduction power losses, depends on I F and Tj. Two look-up tables (one 3-dimensional table and one 2-dimesional table) are used to generate energy recovery losses and V F (Figure 12).

5. Simulation Validation

5.1. Introduction

HESS are generally implemented to minimize the stress on the battery (as a main energy density storage element) and to respond to the required dynamic power demand during high current demand. In our scope, focusing on the battery lifespan, a non-classical but extreme regenerative braking will be taken into account for the generation of the high-power demand. The test is performed under asphalt dry road conditions. The driver requires an urgent and immediate full stop. This maneuver will be investigated in the present paper.
Previous works from authors have validated some of the Simulink block models. The developed subsystems (vehicle model, driven motors model, 3-level-based converter, and associated controllers) are modeled starting from their primitive state equations. This design strategy will still be adopted for the actual work facilitating integration of new blocks in the global system. This choice has been adopted in order to analyze and study multiple fields such as the effect of the braking action on the vehicle behavior and on the energy regeneration [55] as well as the control of the 3-level converter based in the HESS [49]. In the mentioned papers, the inverter was taken as a unity gain in order to accelerate simulation time. Even so, the performed simulation tests were highly time and memory consuming.
The simulation tests will be used to compare two semi-active HESS structures. The HESS has a Li-ion battery as the main energy storage system and an ultracapacitor as a secondary energy storage. The first HESS is quasi-bidirectional Z-source based, while the other is 3-level DC/DC-inverter based. The UC is sized to absorb the total braking energy. The simulation tests should show the response of each system according to its control design, the power efficiency of the overall power conversion chain, the signals distortion in terms of UC voltage and braking torque, the voltage stress on the semi-conductor power switching devices, and the thermal behavior of the system in terms of temperature increasing.
The simulations will be performed on a high-friction good-condition asphalt road. The objective is to impose a maximal power flow, recovered from the wheels, and passing throughout the motors, generating a peak power of 60 kW, inverters, DC/DC converters, and to be stored in the ultracapacitor. This power is conveyed according to the numerous control systems implemented throughout the various converters in order to reach the secondary energy storage system. The choice of an initial speed at 80 km/h was made for two main reasons. The first reason is that the ECE R13H regulations [56] recommend a ‘type 0 braking test’ at speed of 80 km/h for M1 category vehicles (same as the used electric vehicle). The braking control system was developed and validated by the authors [55]. The second reason is that the maximum power of 60 kW is generated from a speed relatively close to 50 km/h performed on a high-friction good-condition asphalt road. The vehicle will initially be running at 80 km/h in order to reach more than 60 kW as maximal power input (depending on the 30 kW IPMSM motor’s control [42]). The test will impose high voltage stress on the switching devices and high-power losses.

5.2. Simulation Models

The model of the vehicle is developed using the basic state primitive equations to analyze the kinematics and dynamics of the vehicle with respect to the braking and traction methods validated [55]. The Simulink model of the conversion powertrain contains all the storage elements, the models of the two IPMSM motors, the converters, the associated control systems, the thermal behavior models, etc.
Figure 13 shows the general blocks of the overall system models. The inputs are:
  • the initial speed of the motor (at rest for traction test or running at a certain velocity for braking test);
  • the steering angle (taken at 0°) of the front wheels: the test is performed for a longitudinal motion. The vehicle model has been developed using the dynamic and kinematic equations of a 5 DoF (degrees of freedom) vehicle (four rotation wheels and yawing movement). The actual objective is to evaluate the HESS performance in terms of electrical transients’ comportment, energy recuperation, and power efficiency. The stability of the vehicle in extreme braking condition while steering is yet an interesting research topic;
  • The braking or acceleration severity: extreme braking conditions will be performed assuring extreme power regeneration depending on the road condition and wheels’ torque distribution according to the ECE R13H assuring safety of the driver on one hand and the stability of the vehicle on the other hand;
  • Road conditions: which will have a significant effect on the torque distribution and thus on the power regeneration scope at the HESS level.
Figure 14 shows overall models involved in the HESS block. The battery interference will not be treated in the current paper. The UC handles all the power regenerated by the braking which will minimize the battery solicitation during extreme maneuvers.

5.3. Simulation Tests

5.3.1. Simulation Set-Up

Even though the modeling complexity of the overall system is obvious, the obtained results, at each step, demonstrate the realistic and the coherent aspects of the designed models and controls, showing more and more the functionality of the simulation as a first step to the final prototype.
The software simulation tool used is Matlab/Simulink. At the start of the simulation, a Matlab script will be launched to execute multiple sub-programs in order to define the mandatory elements of the system: (1) the vehicle parameters, the external dynamic, and the road type parameters; (2) the vehicle driving motor’s parameters, limiting operation points, and regulators gains; (3) the HESS characteristic parameters, sizing elements, and corresponding regulators’ gains of the different power electronics-based converters; and (4) the semi-conductors’ power switches device look-up tables generation and data specifications definition.
For each test, after defining the initial system state (initial vehicle velocity, initial UC voltage, road surface type, etc.) and generating all the above quantities, a Simulink program will be launched. At the end of the simulation, a Matlab program script plots the corresponding figures and delivers the characteristic values of the overall system.

5.3.2. Simulation Parameters

A list of parameters is summarized in the following tables (Table 1, Table 2, Table 3 and Table 4).
The voltage of the ultracapacitor has a minimal voltage of 165 V and a maximal voltage of 325 V. The tests have been performed at minimal voltage in order to size power switches at their highest current values.
The nominal voltage of the Li-ion battery is taken as 360 V. The regulated DC bus voltage is set to 400 V.

5.3.3. Controller Settings

The gain controllers for the two topologies are expressed in Table 5. The vehicle model sizing is based on a Nissan Leaf electric vehicle. Two identical 30 kW motors will be used. We note that the BqZSI modulation technique selected to do the comparison with the 3-level/SVPWM topology is the MCBC control with third harmonic injection. The selection is due to the advantages with regards to the other techniques enumerated previously. The switching frequency is chosen to be 5 kHz.

5.4. Simulation Results and Comparison

The test simulation consists of the extreme braking maneuver of an electric vehicle initially running at 80 km/h. The type of road adopted is a good condition asphalt road. This typology of braking operation involves a worst-case scenario power flow according to the power converters and energy storage elements because it generates the highest electrical transients leading to extreme power losses and thus critical thermal constraints. Particular interest will be focused on voltage and current transients, overall powertrain efficiency, and thermal behavior, nevertheless one should not forget that the goal is to ensure a proper control of the braking torque and the voltage of the DC bus at 400 V.

5.4.1. Voltage and Current Stresses of DC/DC Converters IGBT Modules

The voltage stresses applied to one of the paralleled IGBTs of the Z-source and one of the IGBT of the 3-level DC/DC converter are showed in Figure 15. The peak voltage in the first case reaches 753 V and 287 V in the second case.
The current flowing through each of the paralleled IGBT modules forming the Z-source converter has a transient of −745 A/+988 A for the OL control, whereas it reaches a maximum current of −185 A/+658 A for the CL control (Figure 16). The current flowing through one IGBT module in the 3-level DC/DC converter has a smoothed form reaching only 262 A. As a consequence, OL control will be excluded from the comparison race. This is due to the high transient values. In fact, the OL control is characterized by a sudden non-corrective response. The zero-order hold should be set at a sampling time of 10−7 which leads to high memory burden and excessive switching losses due to the impracticable switching frequencies. Choosing greater sampling time greatly deteriorates the controlled quantities (DC bus voltage and output torque).
As mentioned before, the IGBT modules selected for the Z-source paralleled ST switch are the 1MBI900V-120-50 (1200 V/900 A) and 2MBI300VB-060-50 (600 V/300 A) for the 3-level DC/DC converter. In the case that one single switch should play the role of the shoot-through control, the 1MBI600VC-120 P (1200 V/1600 A) will be selected.

5.4.2. DC Bus Voltage

Figure 17 shows the DC voltage regulation for the BqZSI (open-loop and closed-loop control) and for the 3-level/SVPWM topologies. A low cut-off speed control has been integrated, in order to avoid a UC discharging current at low speed. At open-loop control (OL), the DC voltage reaches a peak of 1071 V. Whereas the peak voltage in closed-loop control reaches 753 V for the Z-source and 740 V for the 3-level/SVPWM topology.

5.4.3. Voltage and Current Stresses of the Inverters IGBT Modules

The comparison will be focused between the closed-loop MCBC 3rd harmonic injection BqZSI and the 3-level DC-DC converter/SVPWM inverter. Figure 18 shows the current and voltage stresses of each of the inverters. As cited in Section 2.2.7 and Section 3.4, the IGBT modules selected for the Z-source inverter are the 6MBI300V-120-50 (1200 V/300 A) and 6MBI180VB-120-50 (1200 V/180 A) for the inverter.

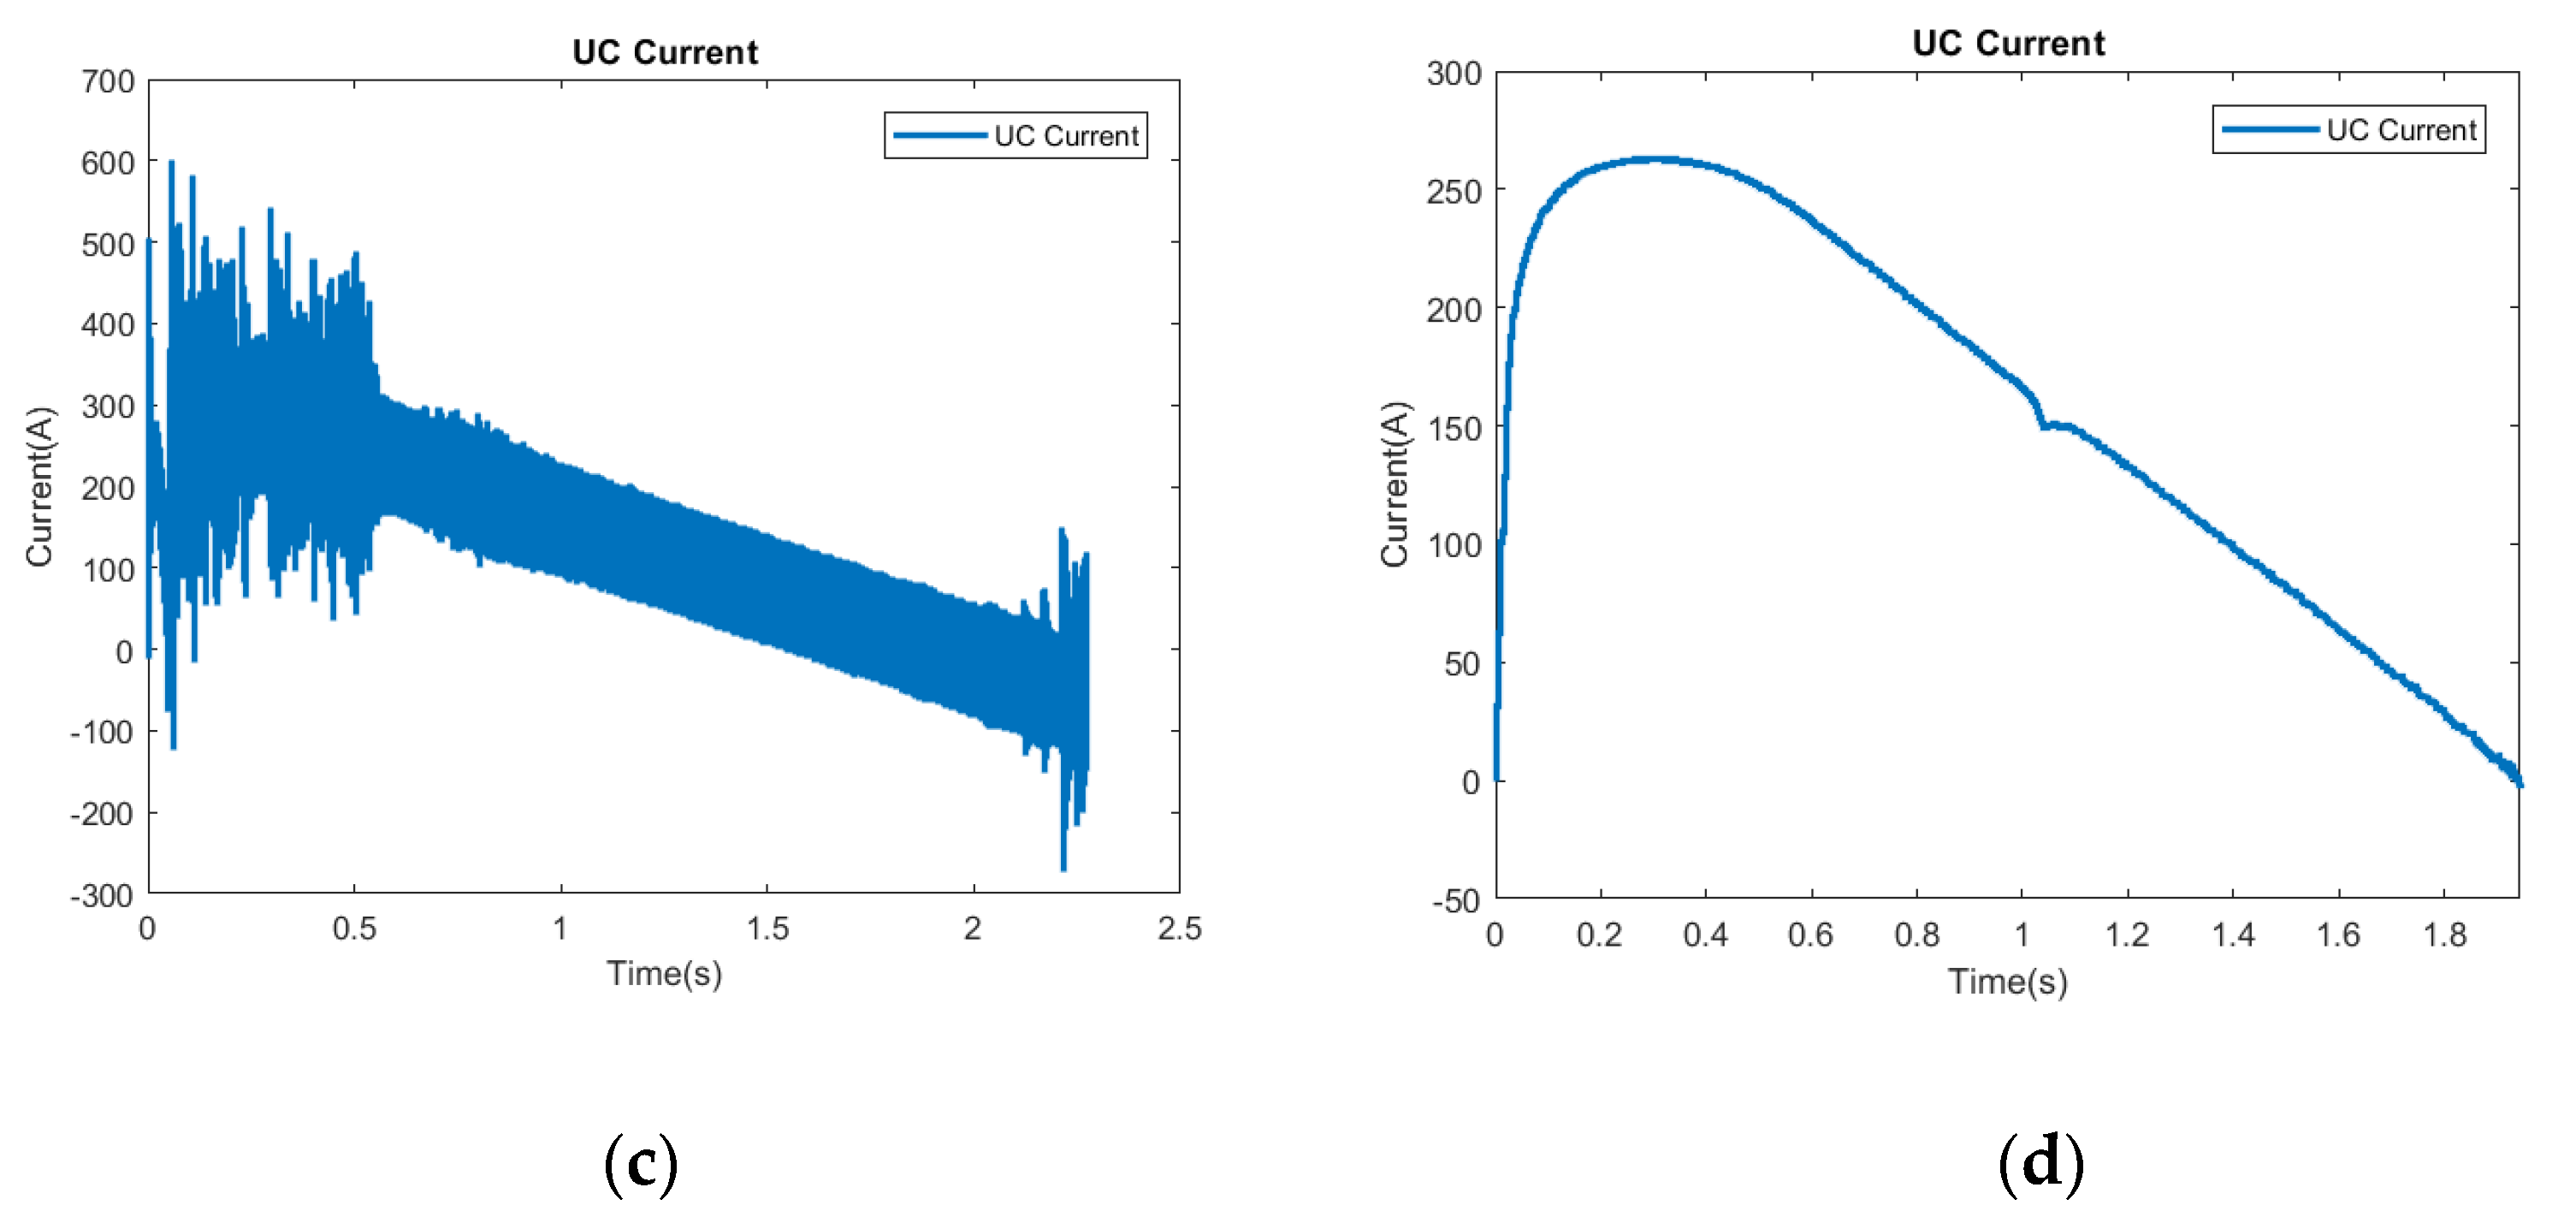
5.4.4. Ultracapacitor Voltage and Current

Figure 19 shows the voltage and charging current of the UC during the extreme braking maneuver. The UC voltage is initially set at its minimal value of 165 V. The voltage and current controls for the 3-level topology are obvious; whereas the charging current for the BqZSI topology has high discharging transient of −113 A and charging transient of 600 A with a steady current ripple of 130 A. This has a repercussion of a 9 V ripple voltage corresponding to the multiplication of the internal resistor of the UC (Rc0 = 70 mΩ) and the current ripple. The current ripple could have significant effects on UC kinetic ageing and reliability. The bending curve of the UC voltage throughout the braking process is related to the decreasing current. According to the following equation:
V U C = E + R c 0   I U C ,
where E is the voltage of the UC at open circuit configuration, as the current decreases, the voltage drop across R c 0 will also decrease.
The voltage and current of the ultracapacitor are better controlled in the 3-level DC/DC converter HESS due to a stricter control than those in the bidirectional quasi-Z source inverter. The current in the latter contains a lot of ripples. Nevertheless, the means values of the current and voltage of the UC are not very different than those ensured by the 3-level DC/DC converter. Indeed, the voltage of the UC at the end of the braking process is 196.9 V for the 3-level DC/DC converter and 194.2 V for the other structure. This slight difference of 2 V is due to a higher loss in the quasi-Z source inverter structure.

5.4.5. Torque and Power Generated

Figure 20 shows the total generated by the two 30 kW IPMSM motors and the associated braking torque for each motor for the two topologies. At the beginning of the braking, the torque ripples related to the BqZSI topology are higher than those of the SVPWM topology. At the end of the braking, the ABS system is activated ensuring a zero-torque reference. The torque control has responded accordingly. This phenomenon has not been realized on the SVPWM control due to the low cut-off speed control activation. According to the optimal control methods designed by the authors [42], for a speed higher than the base speed (4457 rpm), the voltage and current limited maximum torque (VCLMT) could ensure more torque than the maximum torque per ampere control, and thus more power. The figure shows a power increase which could attain 69.5 kW for the BqZSI and 65.1 kW for the SVPWM inverter instead of a maximal power of 60 kW (for the two motors). The 4-kW difference between the two topologies ensures the boosting voltage capability of the Z-source converter.

5.4.6. Power Losses and Efficiencies

Figure 21 shows the losses in the two topologies. According to Section 4.3, the losses cover commutation and conduction losses for the switching modules (IGBTs and reversed diodes). Results will focus on the overall losses for the DC/DC converters and inverters. The total power dissipated in the two paralleled ST switches is far less than the power dissipated in one single ST switch. At the peak power generation of 70 kW, the power loss attains 1100 W in lieu of 2275 W. The value of 1100 W is close to the 3-level DC/DC converter power losses which attain a value of 950 W at maximum power generation (of 65 kW generated in that case).
For the inverter losses, the advantage goes to the SVPWM inverter with losses remaining around 450 W all along the braking process. Whereas for the MCBC 3rdH inverter, power losses are increasingly higher than 1000 W, attaining 2500 W at lower speed.
In terms of efficiency (Figure 22), the 3-level/SVPWM holds a good efficiency throughout the braking process. The decreasing part corresponds to the constancy of the inverter loss even if the flowing power decreases. For the BqZSI topology, the efficiency is lower than that of the 3-level/SVPWM topology, especially at low speed due to the increasing power losses in the inverter.
The voltage and the current in the 3-level converter are highly controlled values (a). Its efficiency curve will follow, inversely, the power curve in Figure 21c (also depending on the controlled current, Figure 19d). At the end, as the transferred power tends to zero, the efficiency tends to 100%.
The speed trajectory of the vehicle is shown in Figure 23. The braking conditions are performed on a high friction coefficient road surface, according to the ECE R13 H regulation, with an anti-lock braking system (ABS) implemented in the braking control system.

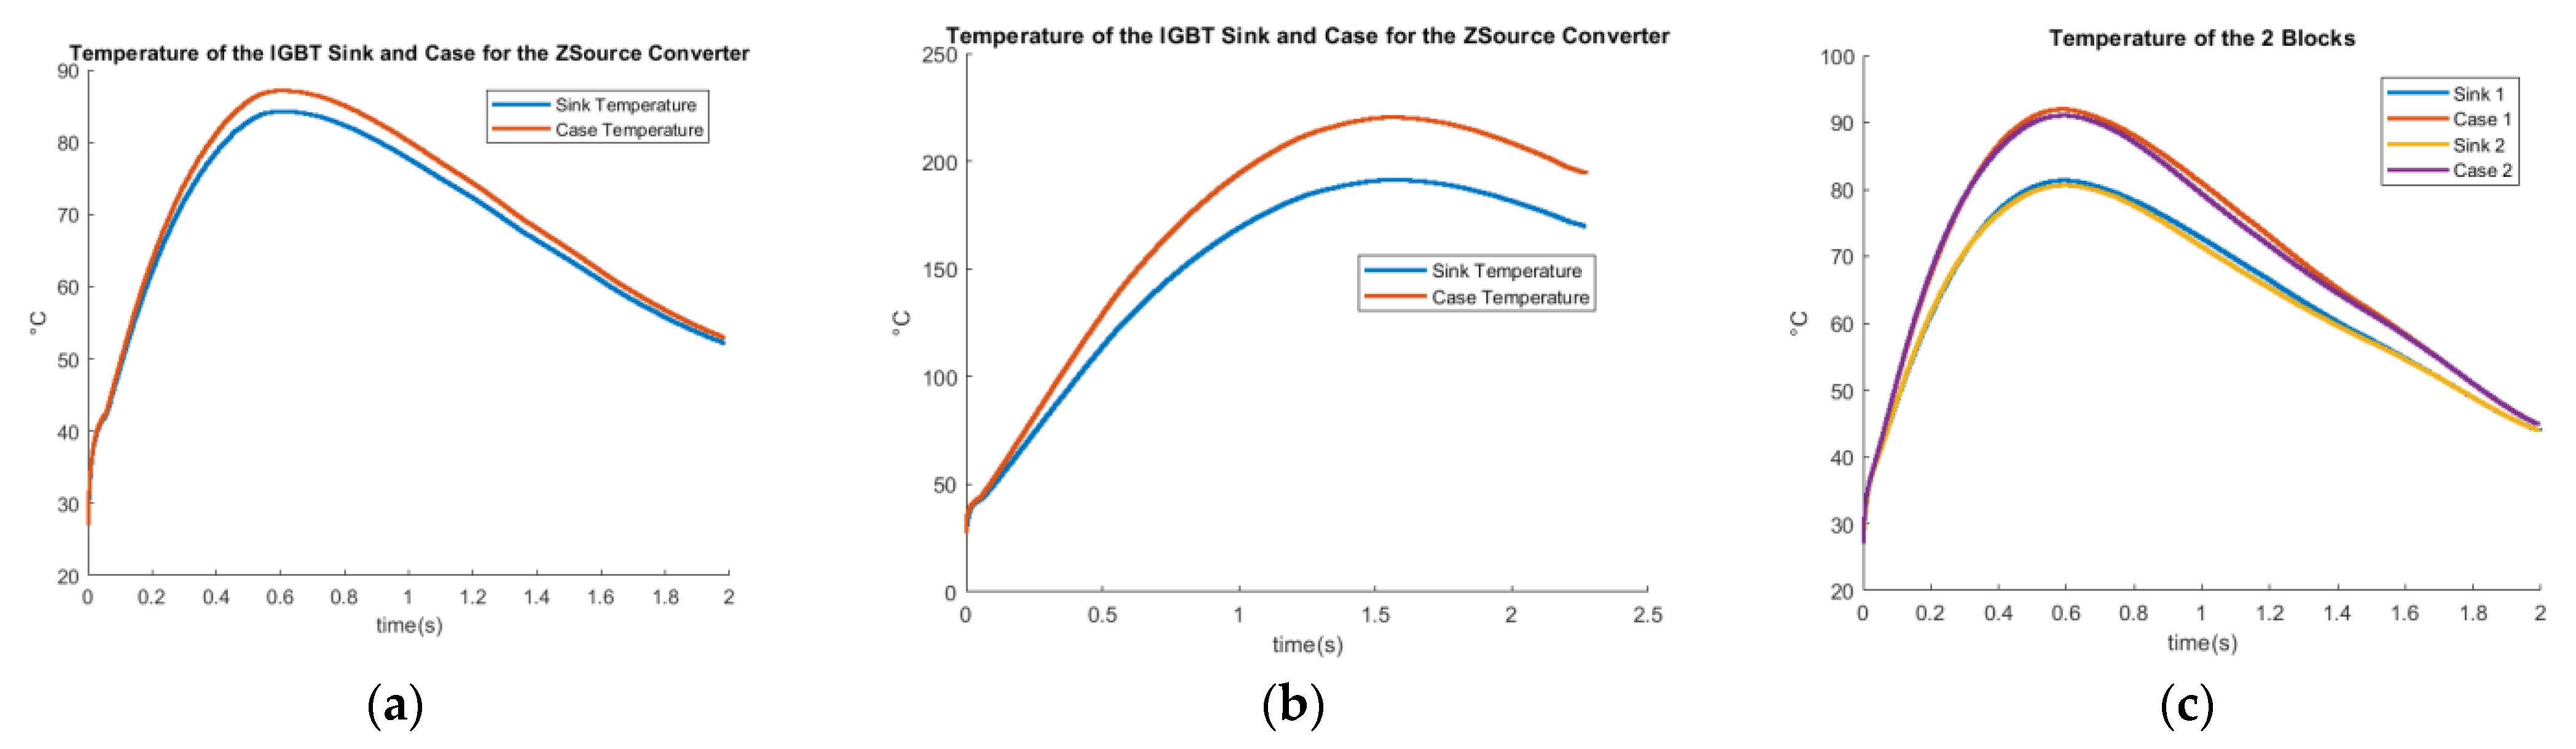
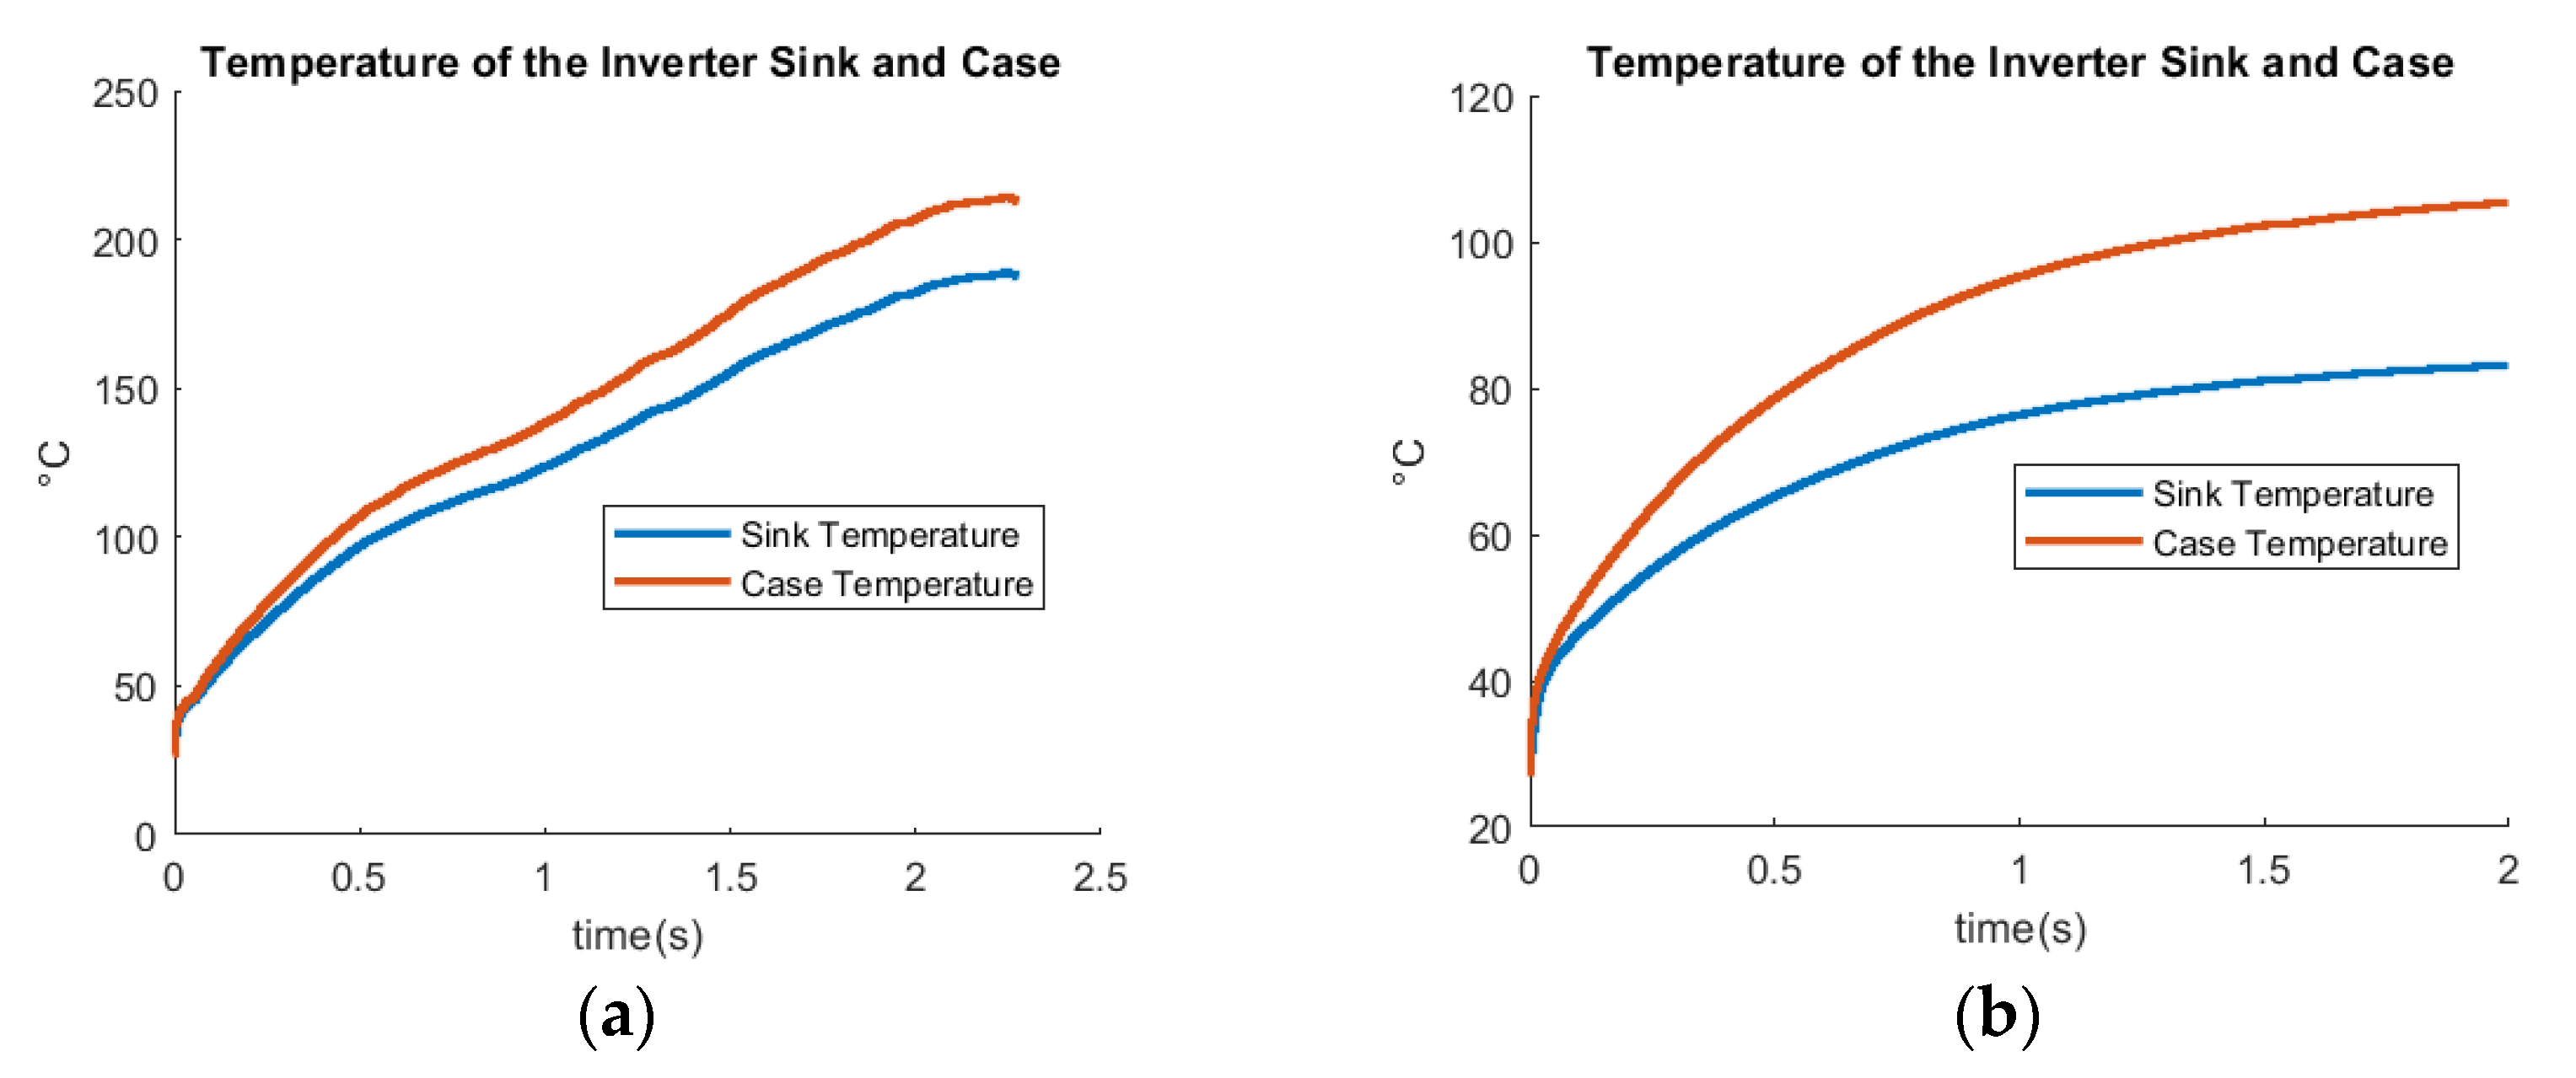
5.4.7. Temperature Evolution

The temperatures of the DC/DC converters are presented in Figure 24. It is good to mention that the heatsink selected has a sink to air ambient thermal resistance of R t h ( s a ) = 0.097   K / W . The thermal behavior of the two paralleled ST switches’ DC/DC Z-source converter and of the 3-level DC/DC are quite acceptable. It is known that for the 3-level DC/DC converter, two modules of two IGBTs in one package has been used. Whereas, for the single ST IGBT package, the temperature of the module could exceed the limits and lead to an improper functioning of the IGBT module.
The inverter temperatures for the two topologies are presented in Figure 25. The temperature rise for the BqZSI inverter could be of concern for the proper functioning of the inverter modules. This has been expected due to the increased power loss at low speed. The implementation of a forced ventilation system is a necessity in this case. Whereas for the SVPWM-based inverter, the temperature rise is relatively adequate.

5.4.8. Spectral Analysis

The spectrogram will be used to study the harmonic spectra distribution over time of the UC voltage and the motor torque. Low and high frequencies could have effects on UC ageing. The inverter output voltage analysis is also a cause of increased ion losses (eddy current losses, hysteresis losses), electromagnetic interference, and formation of destabilizing torque. The presence of high frequencies in the BqZSI is noticeable comparing to the 3-level/SVPWM topology (Figure 26) leading to higher influences of the perturbations and losses cited.

6. Discussion

A comparison between two semi-active configurations (based on a 3-level converter, and based on a Z-source converter) integrated into an HESS supplying a two-front wheel driven electric vehicle has been proposed. Innovative aspects lead to the fact that we have performed a multicriteria comparison of the two cited power electronic topologies that could be used in EV powertrains, particularly for the management of extreme regenerative braking operations.
A topology of two paralleled IGBT modules is introduced instead of the single shoot-through IGBT module in order to minimize power losses and make the Z-source comparable to the 3-level/SVPWM topology in terms of efficiency and power loss. Open-loop and closed-loop controls were implemented in the Z-source. At first glance, the structural simplicity of Z-source could defy the complexity control of the 3-level DC/DC converter.
The simulation tests were performed during extreme braking maneuvers. This type of braking operation involves a worst-case scenario power flow according to the power converters and energy storage elements. The comparison was based on switches’ voltage stresses, power efficiency of the whole conversion powertrain, temperature rise, and spectral analysis of the main quantities. Results showed that the proposed 3-level/SVPWM topology provides better performances in terms of power losses, efficiency, thermal behavior, and electromagnetic interference.
The simulation provided a flexible and configurable toolbox for a software powertrain environment taking into consideration the surface road type, the vehicle sizing, the energy storage types, the power electronics configurations, and all the appropriate control strategies for the different elements constituting the power conversion chain and process.
Authors are trying to improve the overall power transmission and conversion system of the electric vehicle, by considering the hybridization effect of the energy storage system. For that purpose, after validating the adopted power electronic architectures and control methods solutions, the next step is to work on an energetic-based simulation platform. This platform will involve simplified averaged models enabling fast computation of the energetic behavior for standard drive cycles and allowing the implementation of innovative energy management strategies. Second, further work could concern the impact of the ABS control system on the robustness of the control algorithms and its repercussion on the whole powertrain system.

Author Contributions

Conceptualization, K.I. and A.D.B.; methodology, K.I. and A.D.B.; software, K.I.; validation, K.I. and A.D.B.; formal analysis, K.I. and A.D.B.; investigation, K.I.; resources, K.I. and A.D.B.; data curation, K.I.; writing—original draft preparation, K.I.; writing—review and editing, K.I. and A.D.B.; visualization, K.I. and A.D.B.; supervision, A.D.B. All authors have read and agreed to the published version of the manuscript.

Funding

This research received no external funding.

Conflicts of Interest

The authors declare no conflict of interest.

References

  1. Sandrini, G.; Chindamo, D.; Gadola, M. Regenerative Braking Logic That Maximizes Energy Recovery Ensuring the Vehicle Stability. Energies 2022, 15, 5846. [Google Scholar] [CrossRef]
  2. Vodovozov, V.; Raud, Z.; Petlenkov, E. Review on Braking Energy Management in Electric Vehicles. Energies 2021, 14, 4477. [Google Scholar] [CrossRef]
  3. Peng, F.Z. Z-source inverters. In Wiley Encyclopedia of Electrical and Electronics Engineering; 1999; pp. 1–11. Available online: https://0-onlinelibrary-wiley-com.brum.beds.ac.uk/doi/abs/10.1002/047134608X.W8348 (accessed on 7 October 2022).
  4. Peng, F.Z. Z-Source Inverter. IEEE Trans. Ind. Appl. 2003, 39, 504–510. [Google Scholar] [CrossRef]
  5. Battiston, A.; Martin, J.-P.; Miliani, E.-H.; Nahid-Mobarakeh, B.; Pierfederici, S.; Meibody-Tabar, F. Comparison Criteria for Electric Traction System Using Z-Source/Quasi Z-Source Inverter and Conventional Architectures. IEEE J. Emerg. Sel. Top. Power Electron. 2014, 2, 467–476. [Google Scholar] [CrossRef]
  6. Ibtissam, C.; Asma, B.; Zahra, H.F.; Ouarda, B.; El-Madjid, B. Comparative study between diffirent control strategy of the z-source inverter. In Proceedings of the 5th International Conference on Electrical Engineering, Boumerdes, Algeria, 29–31 October 2017. [Google Scholar]
  7. Cong-Thanh, P.; Anwen, S.; Phan Quoc, D.; Nguyen Bao, A.; Nguyen Xuan, P. A comparison of control methods for Z-source inverter. Energy Power Eng. 2012, 4, 20233. [Google Scholar]
  8. Adle, R.V.; Renge, M.M. Comparison of Shoot through Technique for Series Z-Source Inverter. HELIX 2020, 10, 241–244. [Google Scholar] [CrossRef] [Green Version]
  9. Husodo, B.; Anwari, M.; Ayob, S. Analysis and simulations of Z-source inverter control methods. In Proceedings of the Conference Proceedings IPEC, Singapore, 27–29 October 2010. [Google Scholar]
  10. Tong, W.P.Q.; Ramadan, B.M.; Logenthiran, T. A Comparative Analysis between Z-Source and Quasi-Z-Source Inverters for Boost Operation. In Proceedings of the Asian Conference on Energy, Power and Transportation Electrification (ACEPT), Singapore, 30 October–2 November 2018. [Google Scholar]
  11. Mohammadi, M.; Moghani, J.; Milimonfared, J. A novel dual switching frequency modulation for Z-source and quasi-Z-source inverters. IEEE Trans. Ind. Electron. 2017, 65, 5167–5176. [Google Scholar] [CrossRef]
  12. Hossameldin, A.A.; Abdelsalam, A.K.; Ibrahim, A.A.; Williams, B.W. Enhanced performance modified discontinuous PWM technique for three-phase Z-source inverter. Energies 2020, 13, 578. [Google Scholar] [CrossRef] [Green Version]
  13. Khajesalehi, J.; Hamzeh, M.; Sheshyekani, K.; Afjei, E. Modeling and control of quasi Z-source inverters for parallel operation of battery energy storage systems: Application to microgrids. Electr. Power Syst. Res. 2015, 125, 164–173. [Google Scholar] [CrossRef]
  14. Peng, F.Z.; Shen, M.; Holland, K. Application of Z-Source Inverter for Traction Drive of Fuel Cell—Battery Hybrid Electric Vehicles. IEEE Trans. Power Electron. 2007, 22, 1054–1061. [Google Scholar] [CrossRef]
  15. Sathishkumar, R.; Malathi, V.; Sakthivel, E. Real Time Implementation of Quazi Z-Source Inverter Incorporated with Renewable Energy Source. Energy Procedia 2017, 117, 927–934. [Google Scholar] [CrossRef]
  16. Peng, F.; Yuan, X.; Fang, X.; Qian, Z. Z-source inverter for adjustable speed drives. IEEE Power Electron. Lett. 2003, 1, 33–35. [Google Scholar] [CrossRef]
  17. Guo, F.; Fu, L.; Lin, C.-H.; Li, C.; Wang, J. Small signal modeling and controller design of a bidirectional Quasi-Z-Source inverter for electric vehicle applications. In Proceedings of the IEEE Energy Conversion Congress and Exposition (ECCE), Raleigh, NC, USA, 15 September 2012; pp. 2223–2228. [Google Scholar]
  18. Battiston, A.; Miliani, E.; Pierfederici, S.; Meibody-Tabar, F. Efficiency improvement of a quasi-Z-source inverter-fed permanent-magnet synchronous machine-based electric vehicle. IEEE Trans. Transp. Electrif. 2016, 2, 14–23. [Google Scholar] [CrossRef]
  19. Guo, F.; Fu, L.; Lin, C.; Choi, L.C.W.; Wang, J. Development of an 85-kW bidirectional quasi-Z-source inverter with DC-link feed-forward compensation for electric vehicle applications. IEEE Trans. Power Electron. 2013, 28, 5477–5488. [Google Scholar] [CrossRef]
  20. Li, T.; Cheng, Q. A comparative study of Z-source inverter and enhanced topologies. CES Trans. Electr. Mach. Syst. 2018, 2, 284–288. [Google Scholar] [CrossRef]
  21. Tang, Y.; Xie, S.; Ding, J. Pulsewidth Modulation of Z-Source Inverters With Minimum Inductor Current Ripple. IEEE Trans. Ind. Electron. 2013, 61, 98–106. [Google Scholar] [CrossRef]
  22. Liu, Y.; Ge, B.; Abu-Rub, H.; Peng, F.Z. Overview of Space Vector Modulations for Three-Phase Z-Source/Quasi-Z-Source Inverters. IEEE Trans. Power Electron. 2013, 29, 2098–2108. [Google Scholar] [CrossRef]
  23. Rymarski, Z.; Bernacki, K.; Dyga, Ł. Controlled Energy Flow in Z-Source Inverters. Energies 2021, 14, 7272. [Google Scholar] [CrossRef]
  24. Yaici, W.; Kouchachvili, L.; Entchev, E.; Longo, M. Dynamic Simulation of Battery/Supercapacitor Hybrid Energy Storage System for the Electric Vehicles. In Proceedings of the 8th International Conference on Renewable Energy Research and Applications (ICRERA), Brasov, Romania, 3–6 November 2019. [Google Scholar]
  25. Grün, T.; Doppelbauer, M. Comparative Concept Study of Passive Hybrid Energy Storage Systems in 48 V Mild Hybrid Vehicles Varying Lithium-Ion Battery and Supercapacitor Technologies. World Electr. Veh. J. 2019, 10, 71. [Google Scholar] [CrossRef] [Green Version]
  26. Vladimir, P.; Iurii, P.; Nikita, P. Three-Loop Control System of Energy Storage Device in the Frequency-Controlled Electric Drive. In Proceedings of the 26th International Workshop on Electric Drives: Improvement in Efficiency of Electric Drives (IWED), Moscow, Russia, 30 January–2 February 2019. [Google Scholar]
  27. Zheng, C.; Li, W.; Liang, Q. An energy management strategy of hybrid energy storage systems for electric vehicle applications. IEEE Trans. Sustain. Energy 2018, 9, 1880–1888. [Google Scholar] [CrossRef]
  28. Masih-Tehrani, M.; Dahmardeh, M. A Novel Power Distribution System Employing State of Available Power Estimation for a Hybrid Energy Storage System. IEEE Trans. Ind. Electron. 2017, 65, 6676–6685. [Google Scholar] [CrossRef]
  29. Dolara, A.; Leva, S.; Moretti, G.; Mussetta, M.; De Novaes, Y.R. Design of a Resonant Converter for a Regenerative Braking System Based on Ultracap Storage for Application in a Formula SAE Single-Seater Electric Racing Car. Electronics 2021, 10, 161. [Google Scholar] [CrossRef]
  30. Hu, S.; Liang, Z.; Fan, D.; He, X. Hybrid Ultracapacitor–Battery Energy Storage System Based on Quasi-Z-source Topology and Enhanced Frequency Dividing Coordinated Control for EV. IEEE Trans. Power Electron. 2016, 31, 7598–7610. [Google Scholar] [CrossRef]
  31. Hu, S.; Liang, Z.; He, X. Ultracapacitor-Battery Hybrid Energy Storage System Based on the Asymmetric Bidirectional Z -Source Topology for EV. IEEE Trans. Power Electron. 2015, 31, 7489–7498. [Google Scholar] [CrossRef]
  32. Raman, S.R.; Cheng, K.-W.; Xue, X.-D.; Fong, Y.-C.; Cheung, S. Hybrid Energy Storage System with Vehicle Body Integrated Super-Capacitor and Li-Ion Battery: Model, Design and Implementation, for Distributed Energy Storage. Energies 2021, 14, 6553. [Google Scholar] [CrossRef]
  33. Omran, K.C.; Mosallanejad, A. SMES/battery hybrid energy storage system based on bidirectional Z-source inverter for electric vehicles. IET Electr. Syst. Transp. 2018, 8, 215–220. [Google Scholar] [CrossRef]
  34. Nguyen, M.-K.; Duong, T.-D.; Lim, Y.-C.; Choi, J.-H.; Vilathgamuwa, D.M.; Walker, G.R. DC-Link Quasi-Switched Boost Inverter With Improved PWM Strategy and its Comparative Evaluation. IEEE Access 2020, 8, 53857–53867. [Google Scholar] [CrossRef]
  35. Panfilov, D.; Husev, O.; Blaabjerg, F.; Zakis, J.; Khandakji, K. Comparison of three-phase three-level voltage source inverter with intermediate dc–dc boost converter and quasi-Z-source inverter. IET Power Electron. 2016, 9, 1238–1248. [Google Scholar] [CrossRef]
  36. Franke, W.-T.; Mohr, M.; Fuchs, F.W. Comparison of a Z-source inverter and a voltage-source inverter linked with a DC/DC-boost-converter for wind turbines concerning their efficiency and installed semiconductor power. In Proceedings of the IEEE Power Electronics Specialists Conference, Rhodes, Greece, 15–19 June 2008. [Google Scholar]
  37. Ayad, A.; Hanafiah, S.; Kennel, R. A comparison of quasi-Z-source inverter and traditional two-stage inverter for photovoltaic application, in Proceedings of PCIM Europe 2015. In Proceedings of the International Exhibition and Conference for Power Electronics, Intelligent Motion, Renewable Energy and Energy Management, Nuremberg, Germany, 19–20 May 2015. [Google Scholar]
  38. Aravindan, M.; Balaji, V.; Saravanan, V.; Arumugam, M. Topologies of single phase Z source inverters for photovoltaic systems. In Proceedings of the Biennial International Conference on Power and Energy Systems: Towards Sustainable Energy (PESTSE), Bengaluru, India, 21–23 January 2016. [Google Scholar]
  39. LATIFI, H. Enhanced Performance Bidirectional Quasi-Z-Source Inverter Controller; University of East London: Oxon, UK, 2015. [Google Scholar]
  40. Ellabban, O.; Van Mierlo, J.; Lataire, P. Control of a Bidirectional Z-Source Inverter for Electric Vehicle Applications in Different Operation Modes. J. Power Electron. 2011, 11, 120–131. [Google Scholar] [CrossRef] [Green Version]
  41. Jokar Kouhanjani, M.; Seifi, A.R.; Mehrtash, M. Dynamic model and small signal analysis of Z-source inverter. IETE J. Res. 2019, 65, 342–350. [Google Scholar] [CrossRef]
  42. Itani, K.; De Bernardinis, A.; Khatir, Z.; Jammal, A. Optimal traction and regenerative braking reference current synthesis for an IPMSM motor using three combined torque control methods for an electric vehicle. In Proceedings of the IEEE Transportation Electrification Conference and Expo (ITEC), Dearborn, MI, USA, 27–29 June 2016. [Google Scholar]
  43. Kowalsky, J.; Simon, T.; Geske, M.; Basler, T.; Lutz, J. Surge current behaviour of different IGBT designs. In Proceedings of the Proceedings of PCIM Europe 2015, Nuremberg, Germany, 19–20 May 2015. [Google Scholar]
  44. Basler, T.; Lutz, J.; Jakob, R.; Brückner, T. Surge current capability of IGBTs. In Proceedings of the International Multi-Conference on Systems, Signals & Devices, Chemnitz, Germany, 20–23 March 2012. [Google Scholar]
  45. Global, F.E. IGBT Modules. Available online: https://www.fujielectric.com/products/semiconductor/parametric-search/ (accessed on 10 January 2020).
  46. Grbovic, P.J.; Delarue, P.; Le Moigne, P.; Bartholomeus, P. Modeling and Control of the Ultracapacitor-Based Regenerative Controlled Electric Drives. IEEE Trans. Ind. Electron. 2011, 58, 3471–3484. [Google Scholar] [CrossRef]
  47. Grbovic, P.J.; Delarue, P.; Le Moigne, P.; Bartholomeus, P. A Bidirectional Three-Level DC–DC Converter for the Ultracapacitor Applications. IEEE Trans. Ind. Electron. 2010, 57, 3415–3430. [Google Scholar] [CrossRef]
  48. Wang, B.; Zhang, X.; Manandhar, U.; Gooi, H.B.; Liu, Y.; Tan, X. Bidirectional Three-Level Cascaded Converter With Deadbeat Control for HESS in Solar-Assisted Electric Vehicles. IEEE Trans. Transp. Electrification 2019, 5, 1190–1201. [Google Scholar] [CrossRef]
  49. Itani, K.; De Bernardinis, A.; Khatir, Z.; Jammal, A.; Oueidat, M. Regenerative Braking Modeling, Control, and Simulation of a Hybrid Energy Storage System for an Electric Vehicle in Extreme Conditions. IEEE Trans. Transp. Electrification 2016, 2, 465–479. [Google Scholar] [CrossRef]
  50. Ivakhno, V.; Zamaruiev, V.V.; Ilina, O. Estimation of Semiconductor Switching Losses under Hard Switching using Matlab/Simulink Subsystem. Electr. Control Commun. Eng. 2013, 2, 20–26. [Google Scholar] [CrossRef]
  51. Wei, K.; Zhang, C.; Gong, X.; Kang, T. IGBT losses analysis and calculation of inverter for two-seat electric aircraft application. Energy Procedia 2017, 105, 2623–2628. [Google Scholar] [CrossRef]
  52. Al Hadi, A.; Challoo, R.; Fu, X. IGBT module loss calculation and thermal resistance estimation for a grid-connected multilevel converter. Wide Bandgap Power Energy Devices Appl. III 2018, 10754, 107540F. [Google Scholar]
  53. Avenas, Y.; Dupont, L.; Khatir, Z. Temperature measurement of power semiconductor devices by thermo-sensitive electrical parameters—A review. IEEE Trans. Power Electron. 2011, 27, 3081–3092. [Google Scholar] [CrossRef] [Green Version]
  54. An, N.; Du, M.; Hu, Z.; Wei, K. A High-Precision Adaptive Thermal Network Model for Monitoring of Temperature Variations in Insulated Gate Bipolar Transistor (IGBT) Modules. Energies 2018, 11, 595. [Google Scholar] [CrossRef] [Green Version]
  55. Itani, K.; De Bernardinis, A.; Khatir, Z.; Jammal, A. Comparison between two braking control methods integrating energy recovery for a two-wheel front driven electric vehicle. Energy Convers. Manag. 2016, 122, 330–343. [Google Scholar] [CrossRef]
  56. U. Nations, ECE/324/Rev.1/Add.12/Rev.8, Addendum 12: Regulation No.13, Agreement Concerning the Adoption of Uniform Technical Prescriptions for Wheeled Vehicles, Equipment and Parts which can be Fitted and/or be Used on Wheeled Vehicles and the Conditions for Recipro, United Nations. 3 March 2014. Available online: https://unece.org/fileadmin/DAM/trans/main/wp29/wp29regs/2015/R013r8e.pdf (accessed on 17 November 2014).
Figure 1. 3-Level DC/DC converter and SVPWM inverter in a semi-active topology.
Energies 15 08506 g001
Figure 2. 3-phase Z-source inverter.
Energies 15 08506 g002
Figure 3. Equivalent circuit of a ZSI: (a) Shoot-through state; (b) non-shoot-through state.
Energies 15 08506 g003
Figure 4. BqZSI structure.
Energies 15 08506 g004
Figure 5. MCBC-3rd harmonic injection modulation technique.
Energies 15 08506 g005
Figure 6. DC bus control structure.
Energies 15 08506 g006
Figure 7. AC control structure.
Energies 15 08506 g007
Figure 8. Two shoot-through switching devices in parallel.
Energies 15 08506 g008
Figure 9. Large-signal average model of 3-level DC/DC converter [47].
Energies 15 08506 g009
Figure 10. DC bus voltage controller.
Energies 15 08506 g010
Figure 11. IGBT power losses calculation using look-up tables.
Energies 15 08506 g011
Figure 12. Reversed diode power losses calculation using look-up tables.
Energies 15 08506 g012
Figure 13. General overall system.
Energies 15 08506 g013
Figure 14. Models at HESS level.
Energies 15 08506 g014
Figure 15. Voltage stresses applied in (a) the Z-source ST module and (b) one IGBT switch of the 3-level DC/DC converter.
Energies 15 08506 g015
Figure 16. Current flowing in the ST-IGBT of the Z-source in an (a) open-loop control, (b) closed-loop control, and (c) the IGBT modules in a 3-level/SVPWM topology.
Energies 15 08506 g016
Figure 17. Voltage of the DC bus for (a) open-loop control BqZSI, (b) closed-loop control BqZSI, and (c) 3-level/SVPWM topology.
Energies 15 08506 g017
Figure 18. Voltage stress applied to inverter IGBT modules for the (a) MCBC 3rdH modulated inverter, (b) SVPWM inverter, as well as the current flowing through, respectively (c,d).
Energies 15 08506 g018aEnergies 15 08506 g018b
Figure 19. Voltage and charging current of the UC for the Z-source topology (a,c) and for the 3-level/SVPWM topology (b,d).
Energies 15 08506 g019aEnergies 15 08506 g019b
Figure 20. Total generated power by the two 30 kW motors and the associated braking torque for each motor for the BqZSI topology (a,c) and 3-level/SVPWM topology (b,d).
Energies 15 08506 g020aEnergies 15 08506 g020b
Figure 21. Overall losses in the powertrain conversion of (a) the two paralleled ST IGBT BqZSI topology, (b) single ST IGBT BqZSI topology, and (c) 3-level DC-DC/SVPWM.
Energies 15 08506 g021
Figure 22. Overall efficiency of the powertrain conversion of (a) the two paralleled ST IGBT BqZSI topology, (b) single ST IGBT BqZSI topology, and (c) 3-level DC-DC/SVPWM.
Energies 15 08506 g022
Figure 23. Speed trajectory (in m/s) for high friction coefficient road surface.
Energies 15 08506 g023
Figure 24. Sink and case temperatures for (a) one IGBT module in the two paralleled ST IGBT module in the BqZSI topology, (b) single ST IGBT module in the BqZSI topology, and (c) the two packages of the 2 modules forming the 3-level DC-DC converter.
Energies 15 08506 g024
Figure 25. Sink and case temperatures for (a) the inverter module of the BqZSI topology and (b) the inverter module of the 3-level DC/DC converter.
Energies 15 08506 g025
Figure 26. Spectrogram of the UC voltage and motor braking torque of the BqZSI topology (a,c) and for the 3-level/SVPWM topology (b,d).
Energies 15 08506 g026
Table 1. IPMSM used parameters [42].
ParameterSymbolValue
Stator winding resistance R s 0.45 (Ω)
d-axis inductance L s d 0.54 (mH)
q-axis inductance L s q 1.05 (mH)
Number of pole pairsp3
Permanent magnet flux linkage Λ m 0.148 (mWb)
Viscous friction coefficientB0
Motor moment of inertia J m 0.3 (kg·m2)
Nominal powerP30 (kW)
Line to line voltage V s n 230 (V)
Maximal current I s n 100 (A)
Table 2. UC characteristics.
ParameterSymbolValue
Maximal voltageUc0max325 (V)
Minimal voltageUc0min165 (V)
Stored energyEs108.8 Wh (SoCmin = 25%)
Table 3. 3-Level DC/DC/SVPWM topology.
ParameterSymbolValue
Ultracapacitor Capacitance C 0 10 (F)
Ultracapacitor Series Resistance R C 0 70 (mΩ)
Inductor L 0 50 (mH)
Inductor Series Resistance R L 0 50 (mΩ)
CapacitorsC1 (mF)
Capacitors Series Resistance R L 0 20 (mΩ)
Table 4. Bidirectional quasi-Z-source inverter topology.
ParameterSymbolValue
Inductors L 1 , L 2 0.1 (mH)
Inductor Series Resistance R L 1 , R L 2 20 (mΩ)
Capacitors C 1 , C 2 706 (μF)
Capacitors Series Resistance R C 1 ,   R C 1 18 (mΩ)
Table 5. Controllers settings and modulation techniques.
TopologyController Type Gain
Common SettingsMotor Current Controllersd-axis Controller current Proportional Gain k p d 0.54
Integral Gain k i d 450
q-axis Current ControllerProportional Gain k p q 1.05
Integral Gain k i q 450
3-Level DC/DC/SVPWM TopologyDC Bus Voltage Controller Proportional Gain k p v b u s −0.1407
Integral Gain k i v b u s −13.2236
Antiwindup gain k p w v b u s −3
UC Voltage Controller Proportional Gain k p u c 140
Integral Gain k i u c Calculated in real time
Antiwindup Gain k p w u c 1
UC Current Controller Proportional Gain k p i c 312.5
Integral Gain k i i c 300
Modulation Technique Space Vector PWM
Bidirectional Quasi-Z-Source Inverter TopologyIndex Modulation Controller Proportional Gain k p M 0.0001
Integral Gain k i M 0.05
Antiwindup gain k p w M 1
Modulation Technique Maximum Constant Boost Control with Third Harmonic Injection
Publisher’s Note: MDPI stays neutral with regard to jurisdictional claims in published maps and institutional affiliations.

