
Projected Changes in Solar PV and Wind Energy Potential over West Africa: An Analysis of CORDEX-CORE Simulations
 ,
,
Abstract
:1. Introduction
2. Materials and Methods
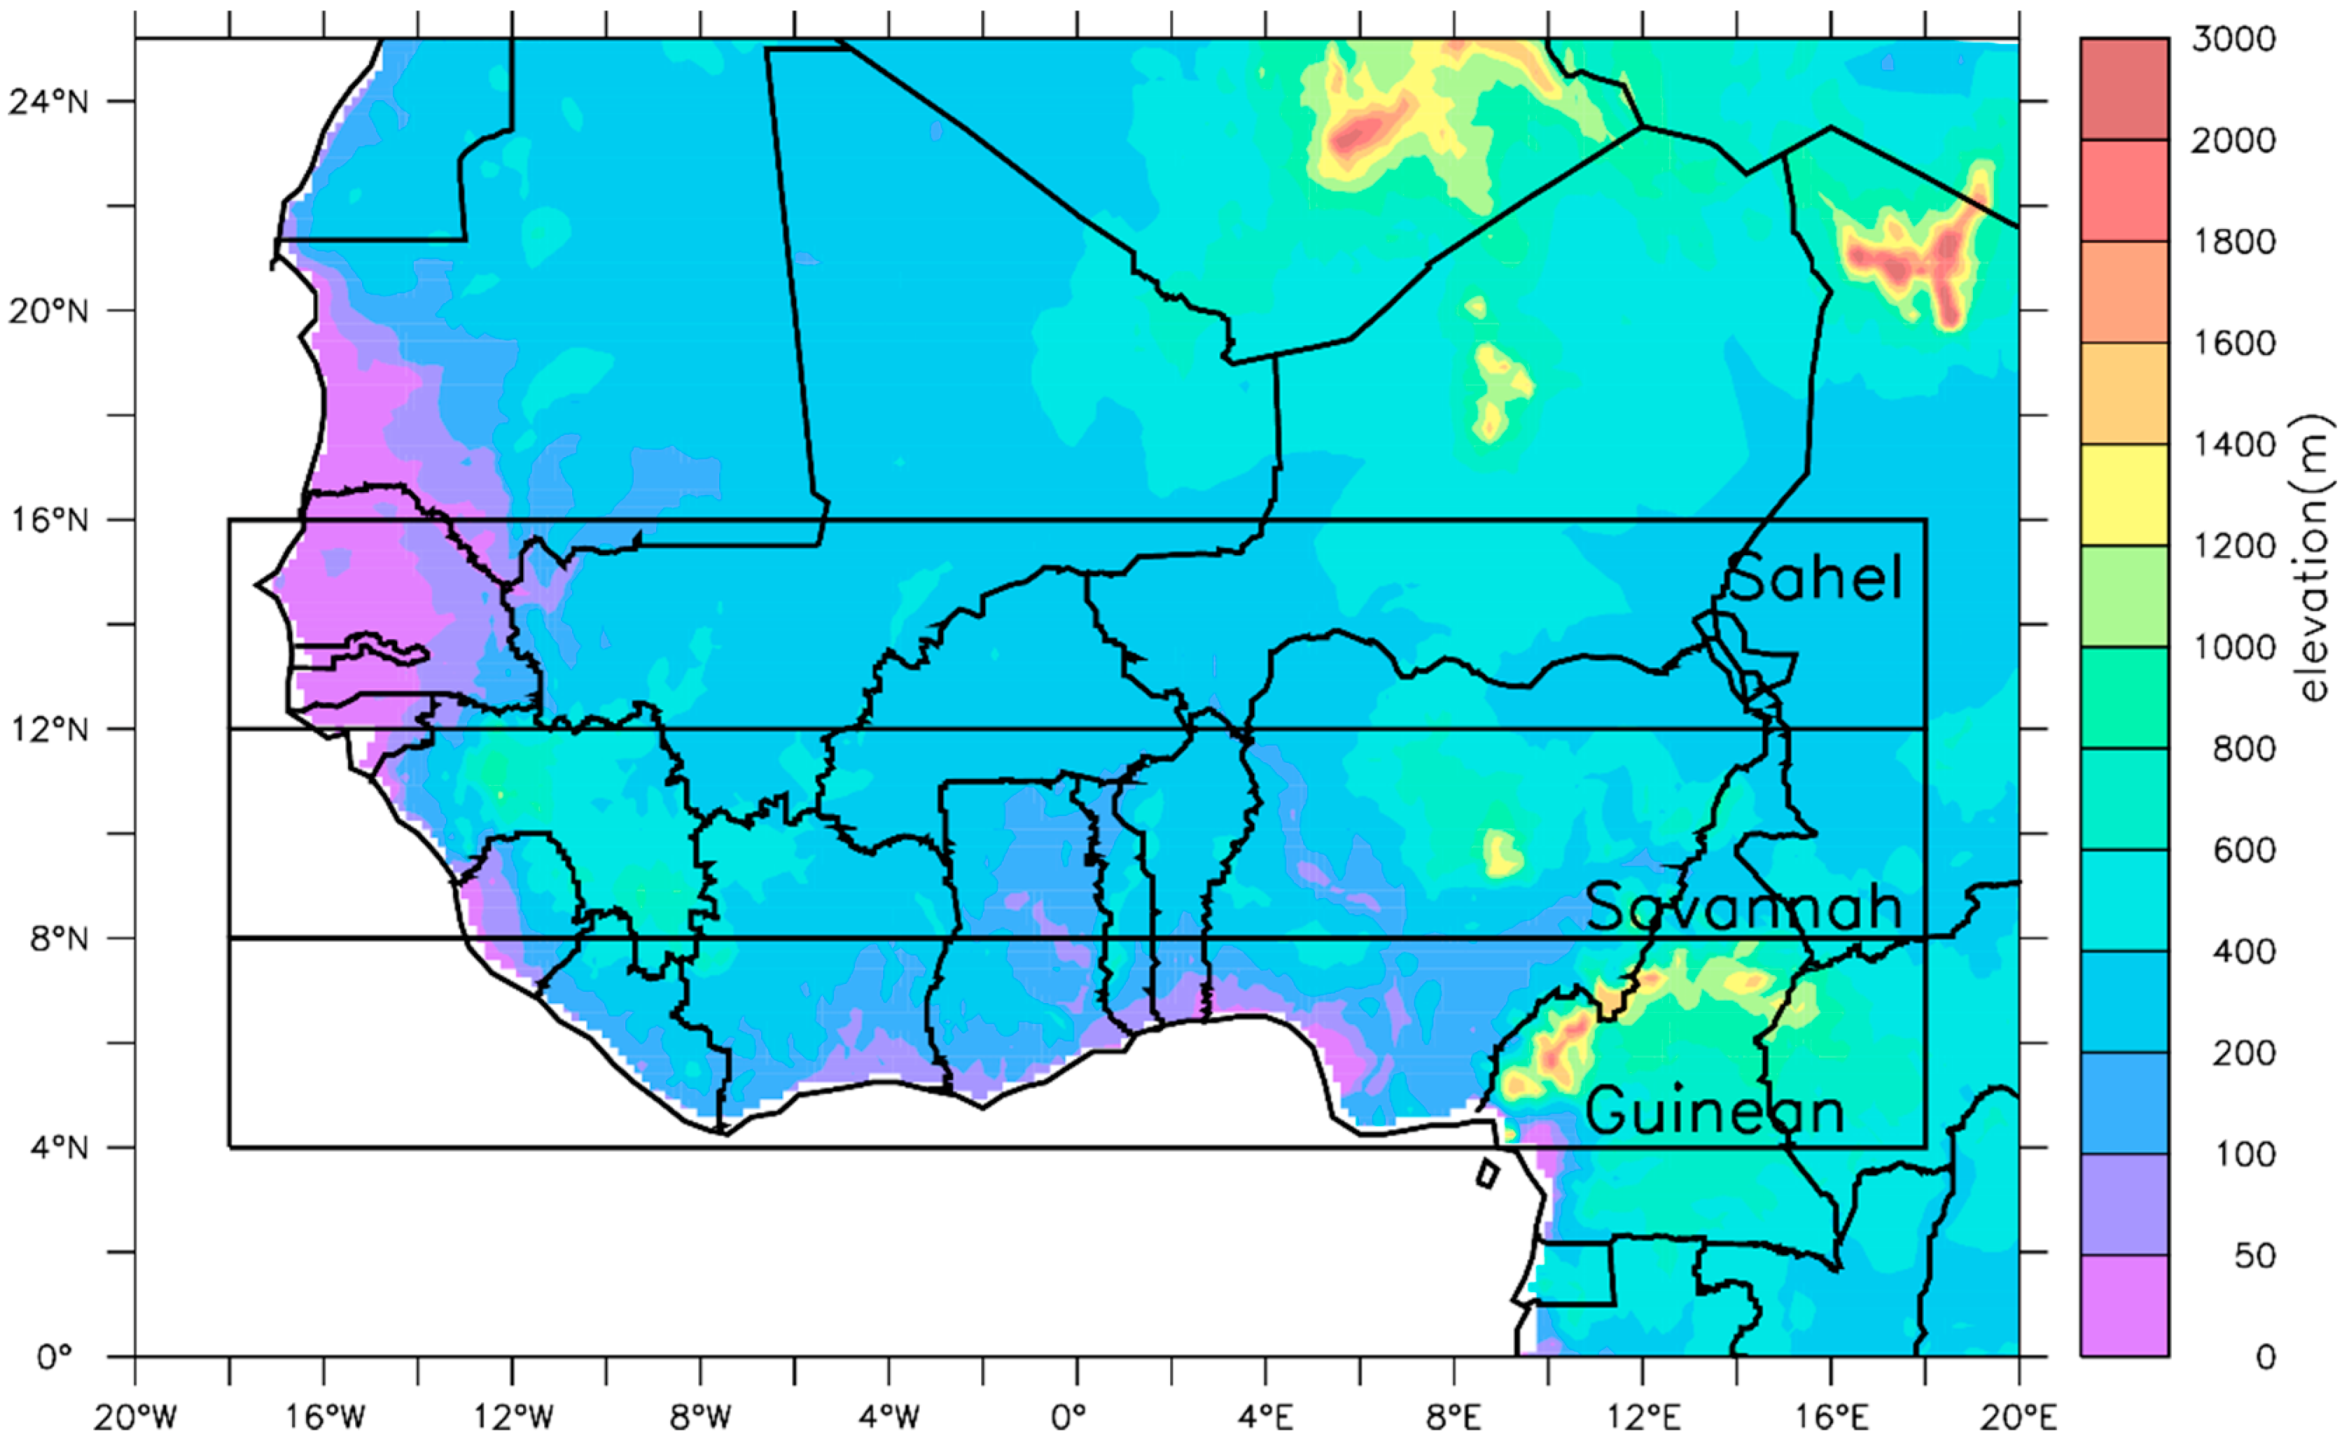
2.1. Study Area
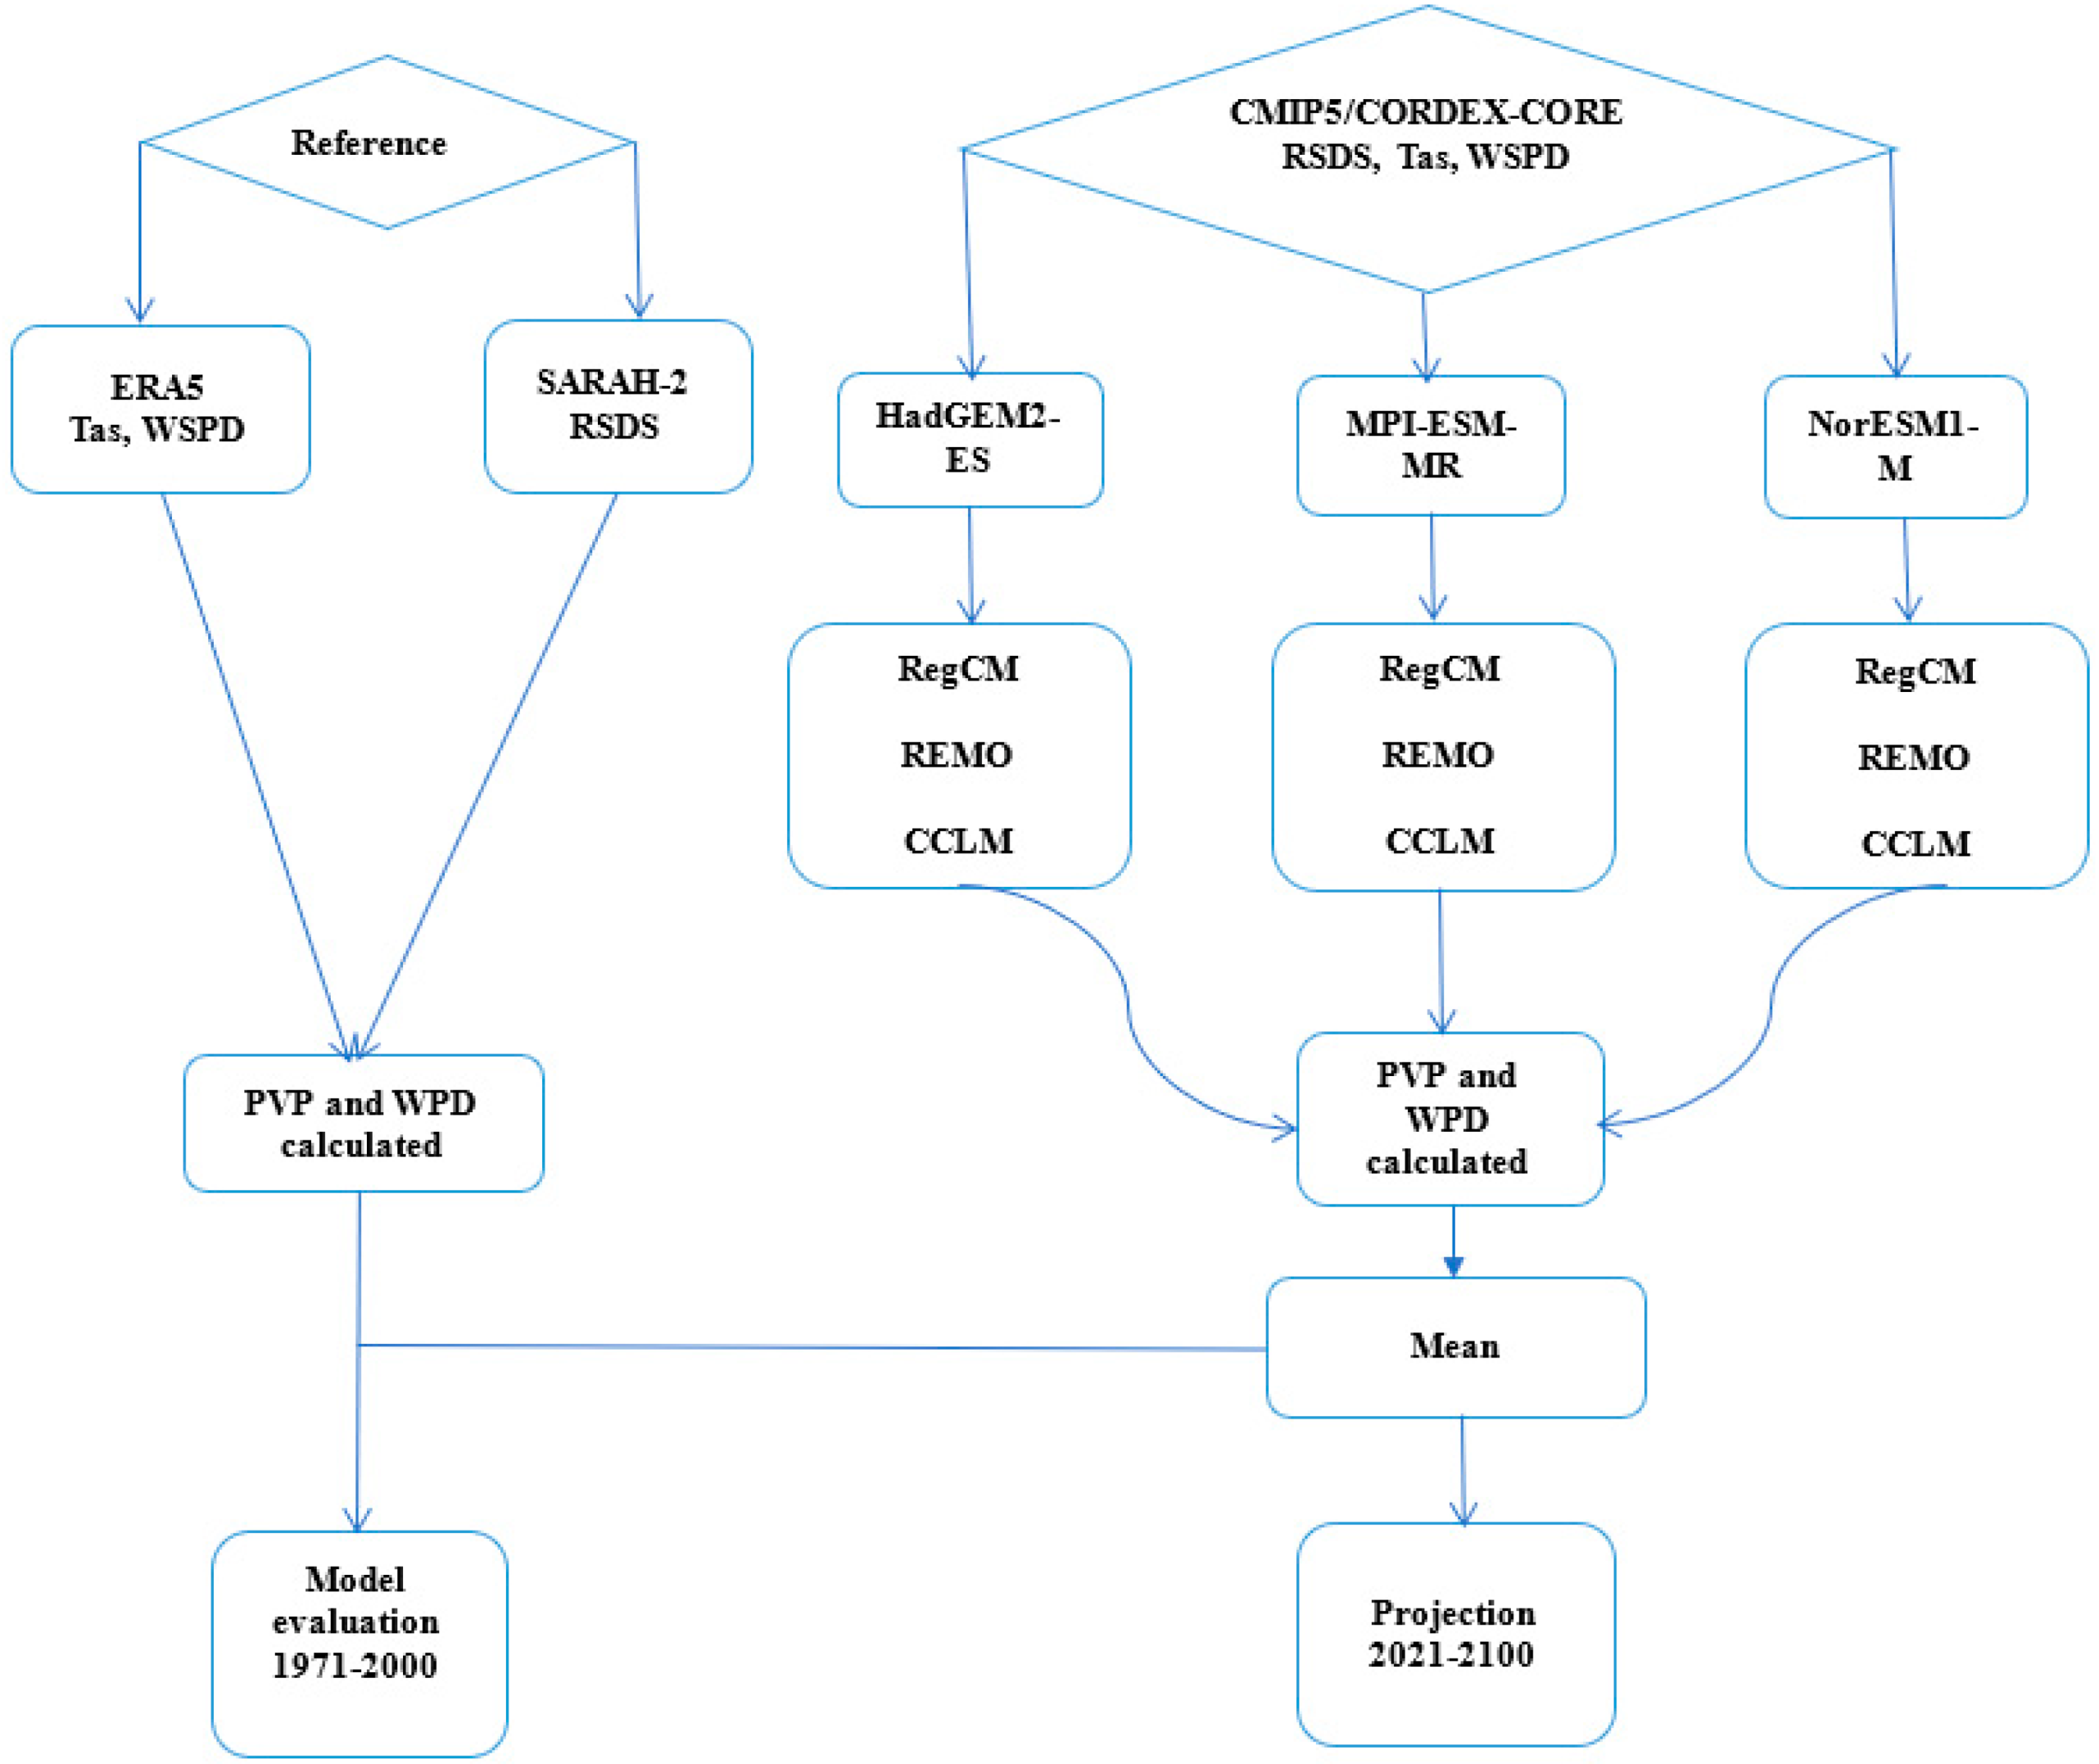
2.2. Data
2.3. Methods
2.3.1. Solar PV Potential (PVP)
2.3.2. Wind Power Density Estimation
2.3.3. RCMs Evaluation and Impact Analysis
3. Results and Discussion
3.1. Evaluation and Validation of the Model
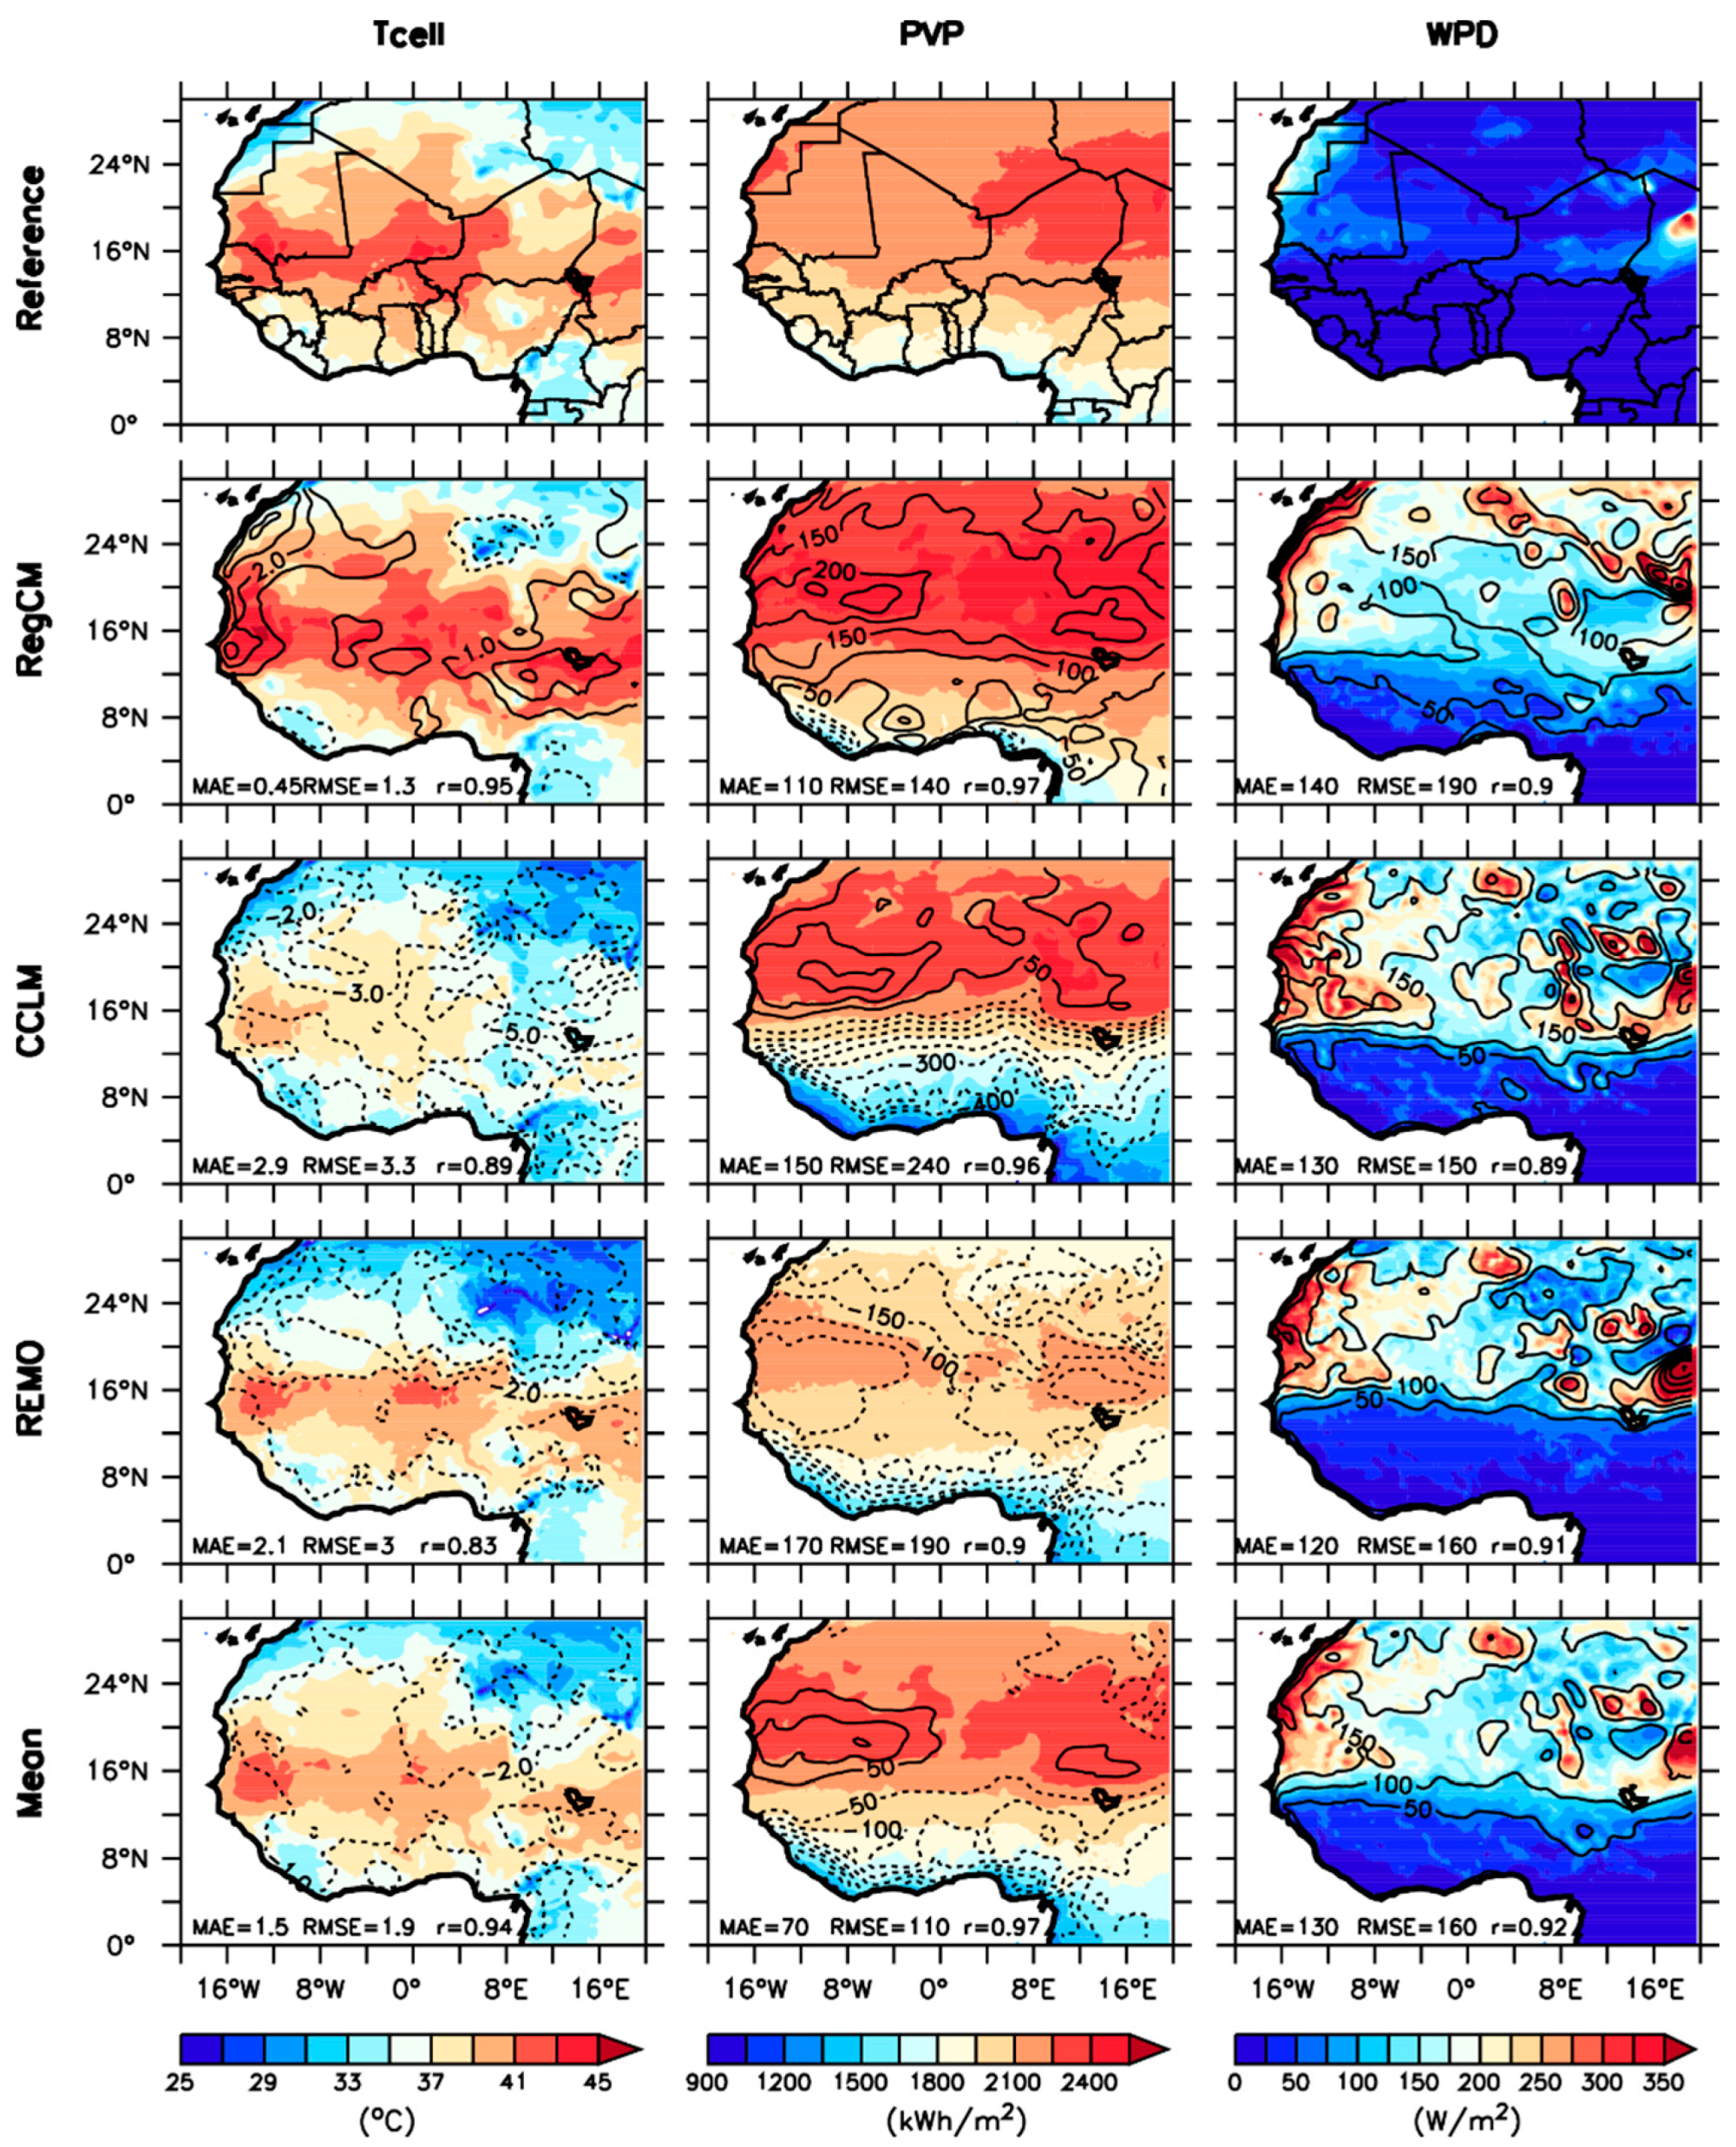
3.1.1. Annual Patterns of the Climate Variables in the Reference Period
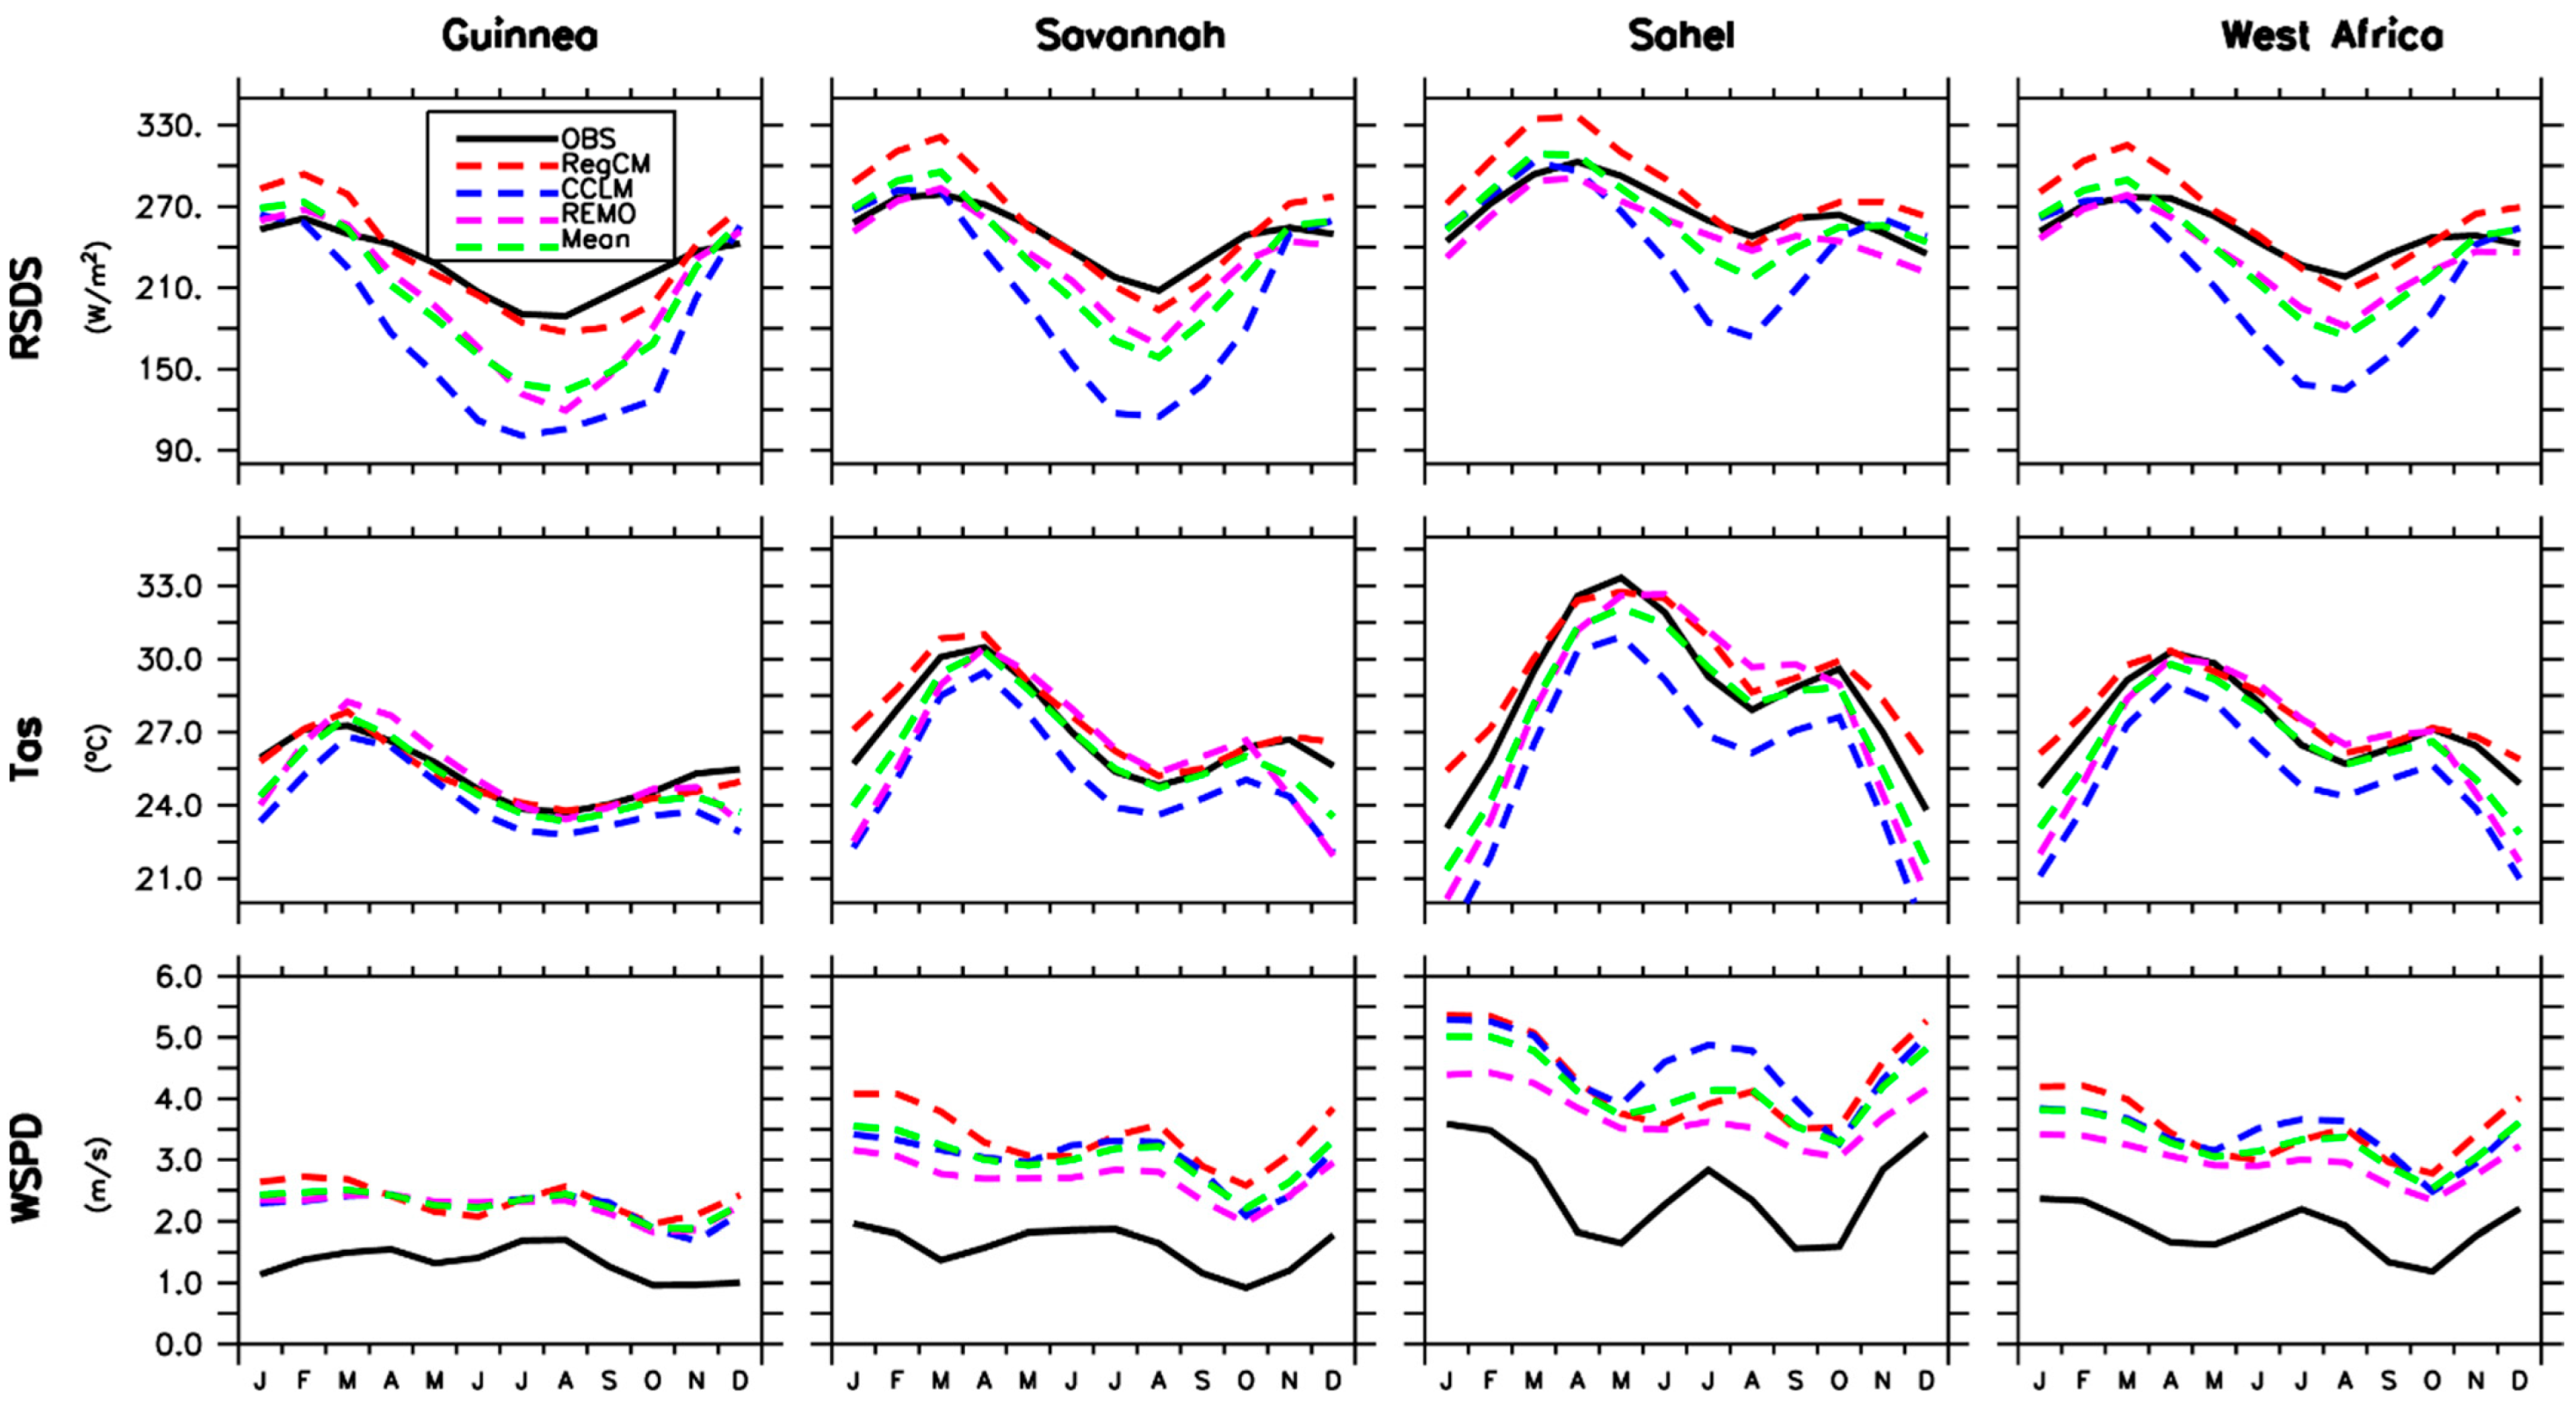
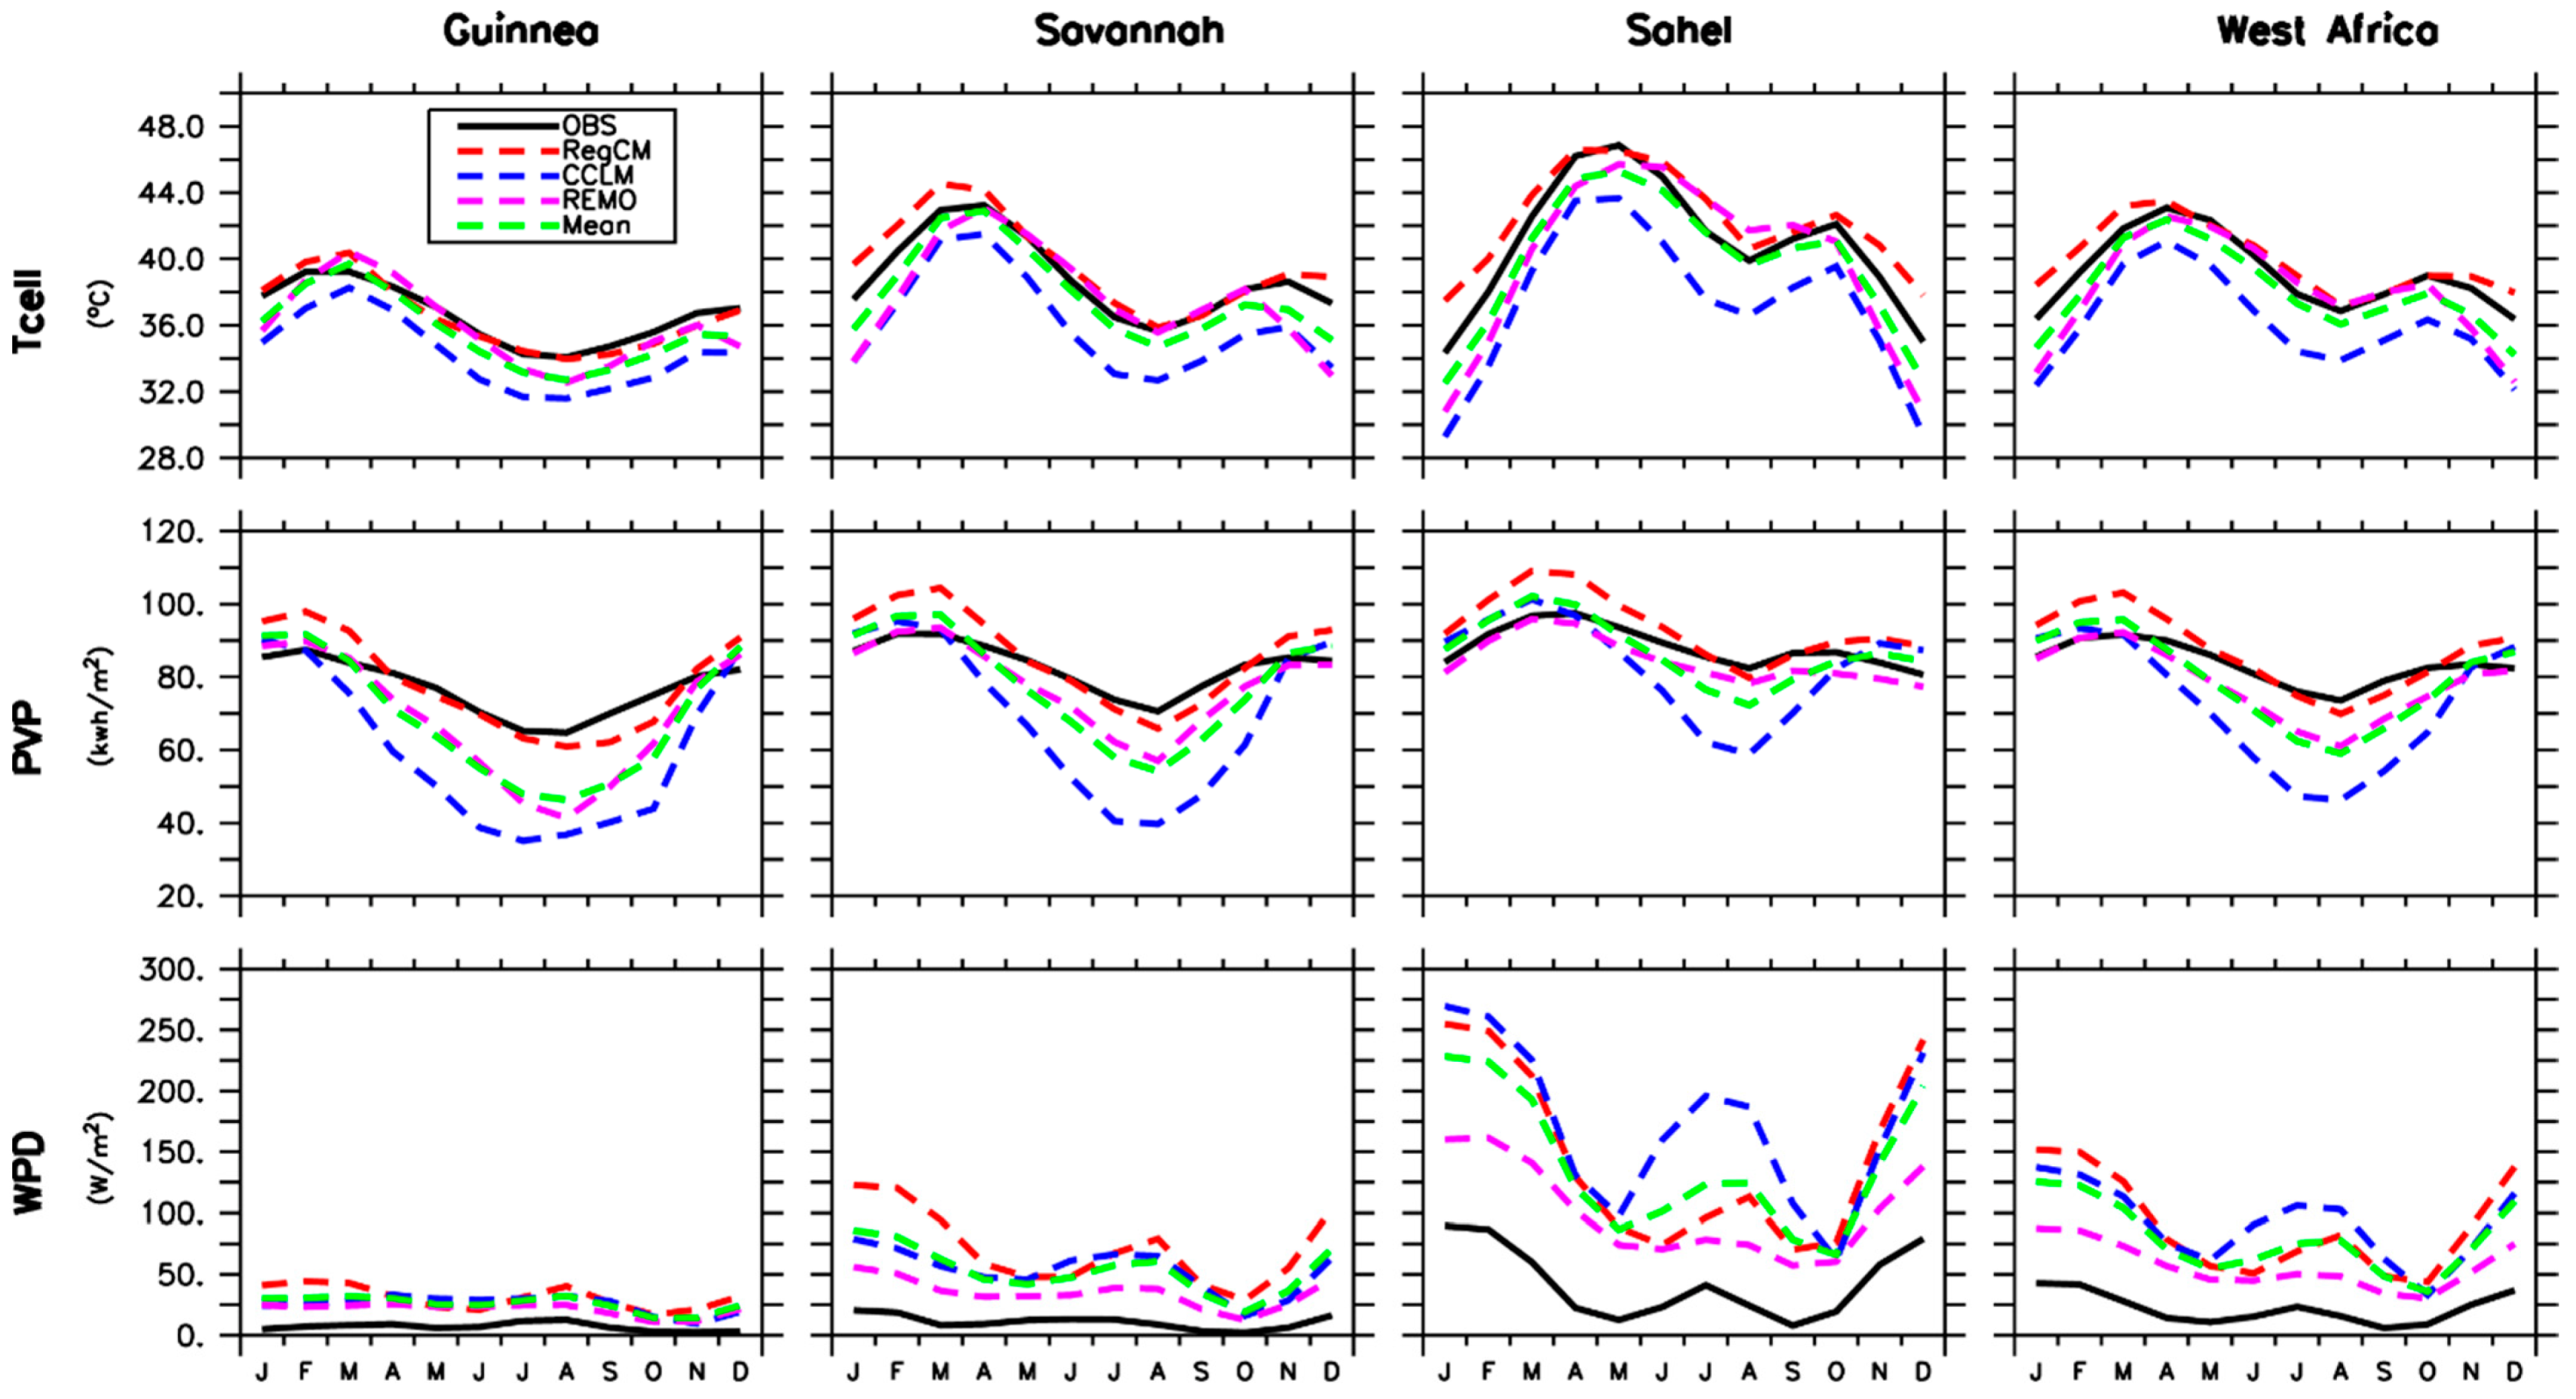
3.1.2. Annual Cycle of the Climate Variables in the Reference Period
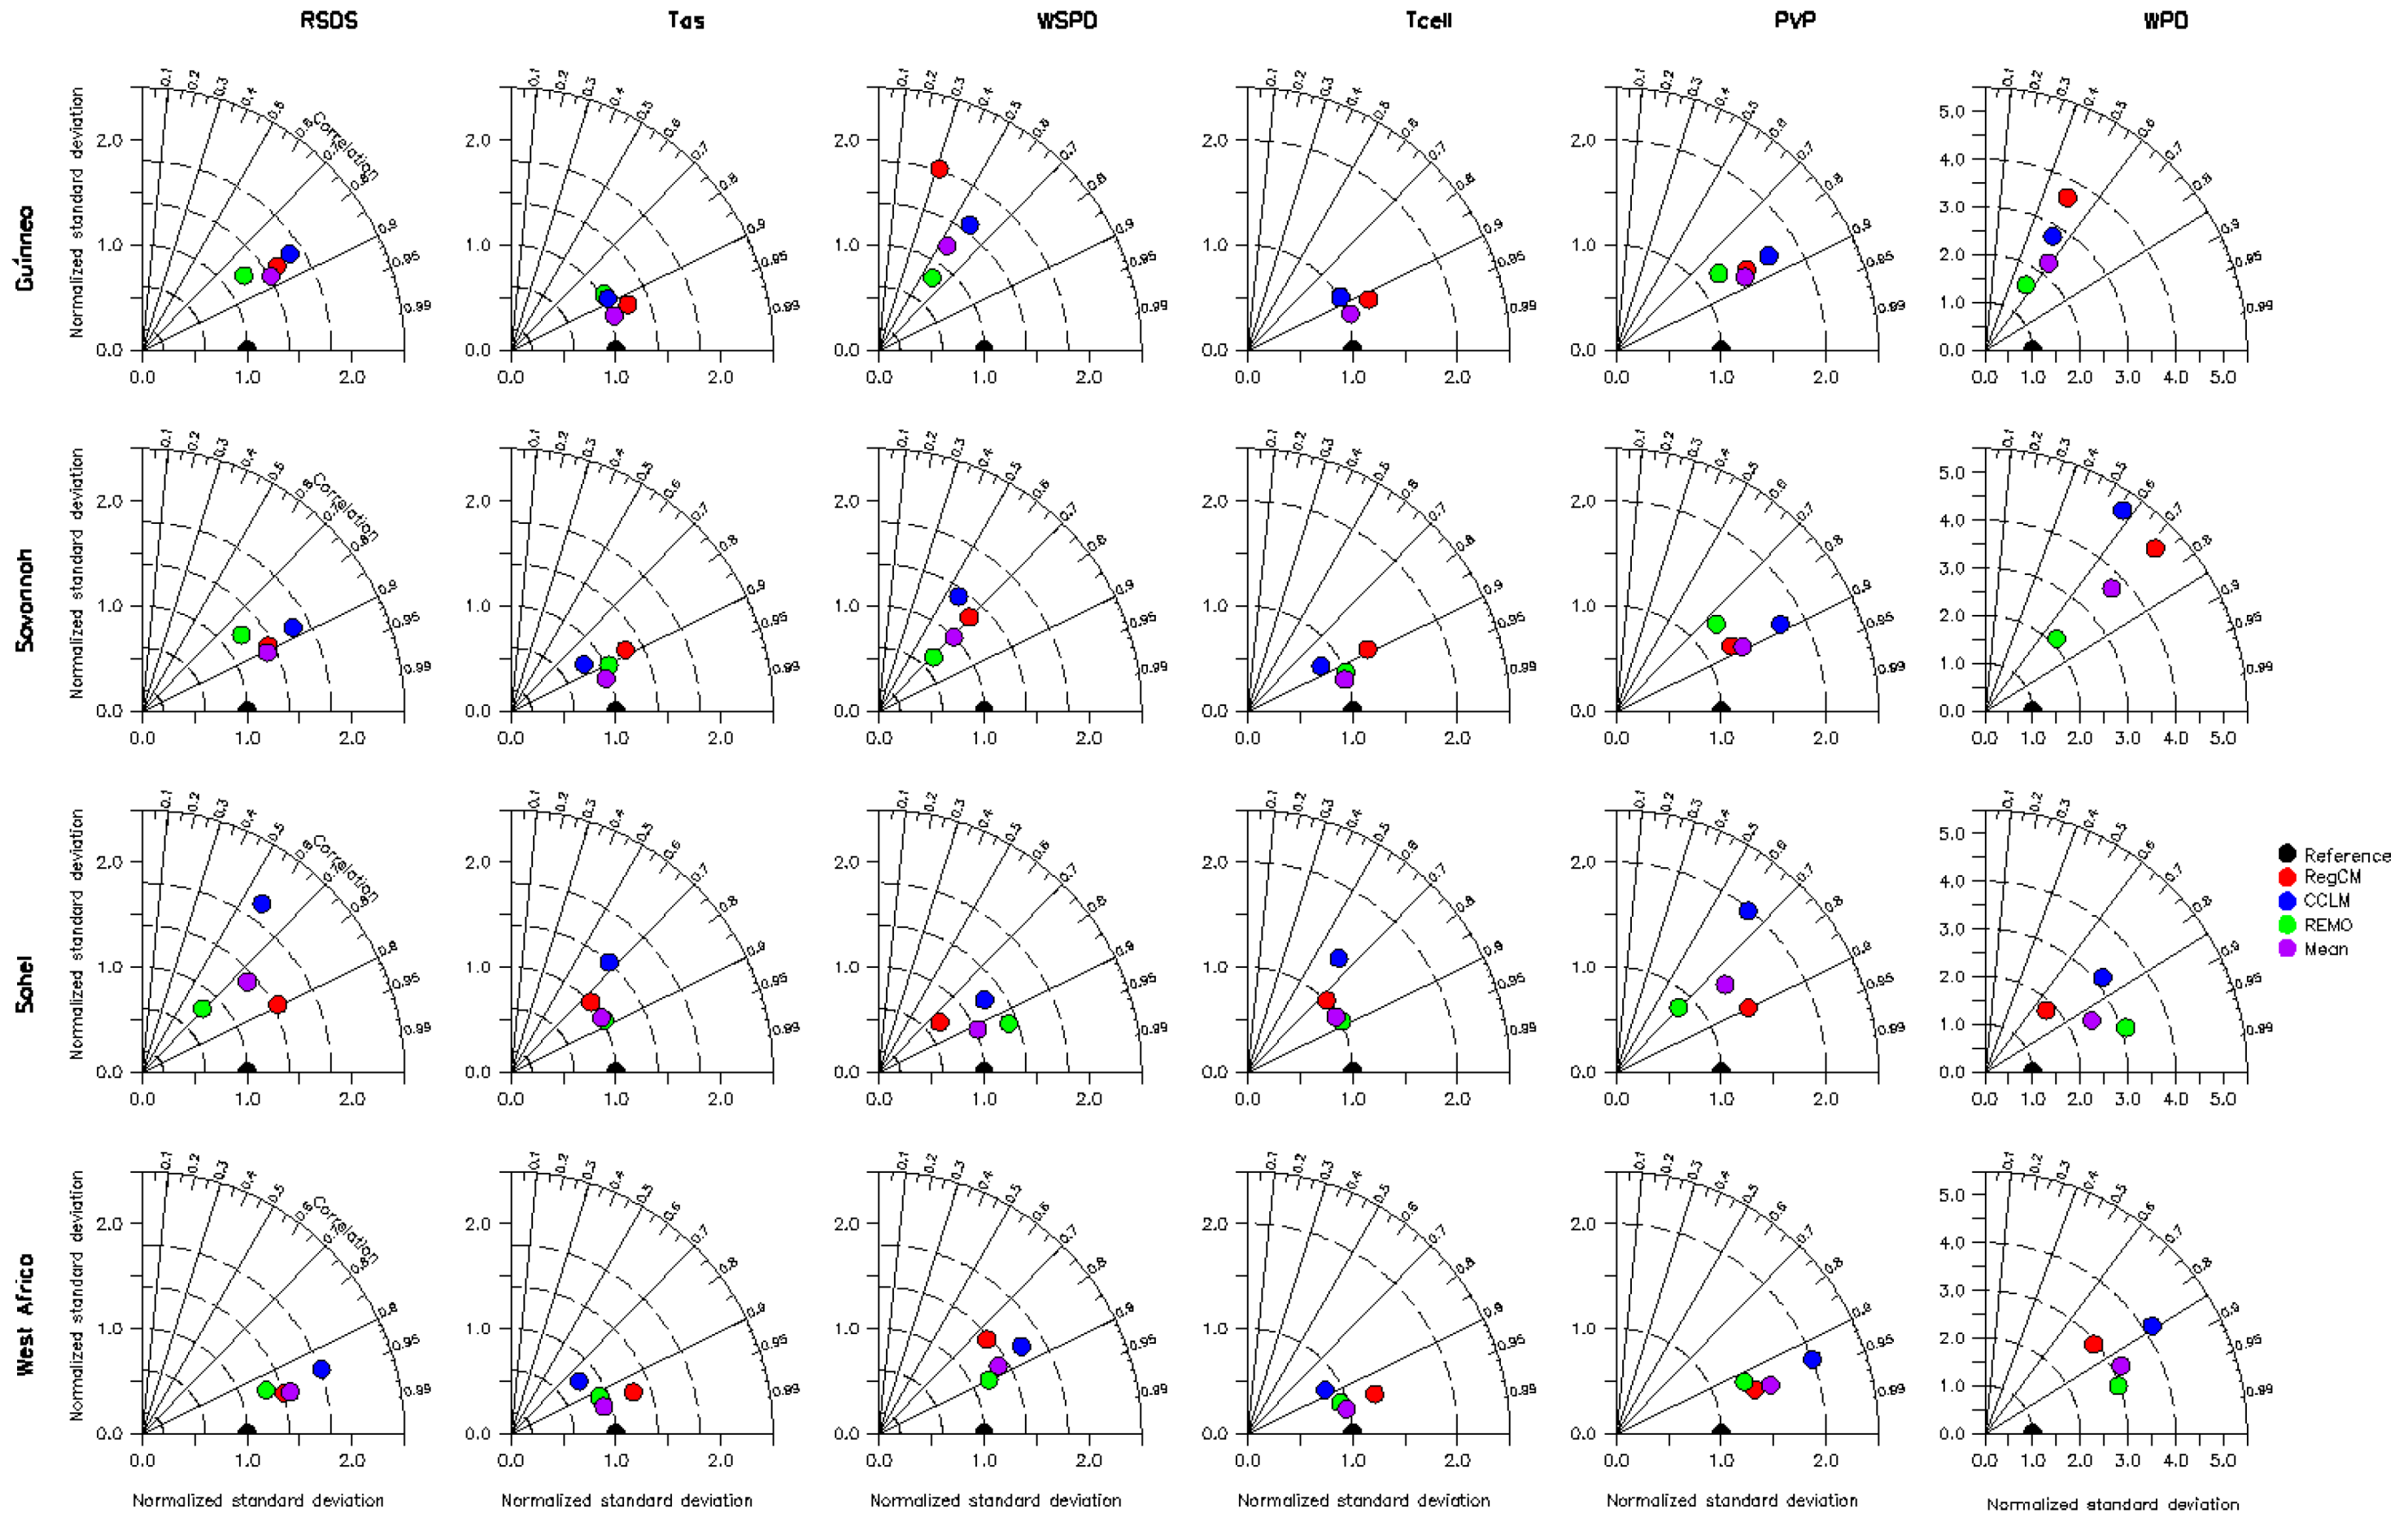
3.1.3. Model Performance in the Reference Period
3.2. Projected Climate Changes
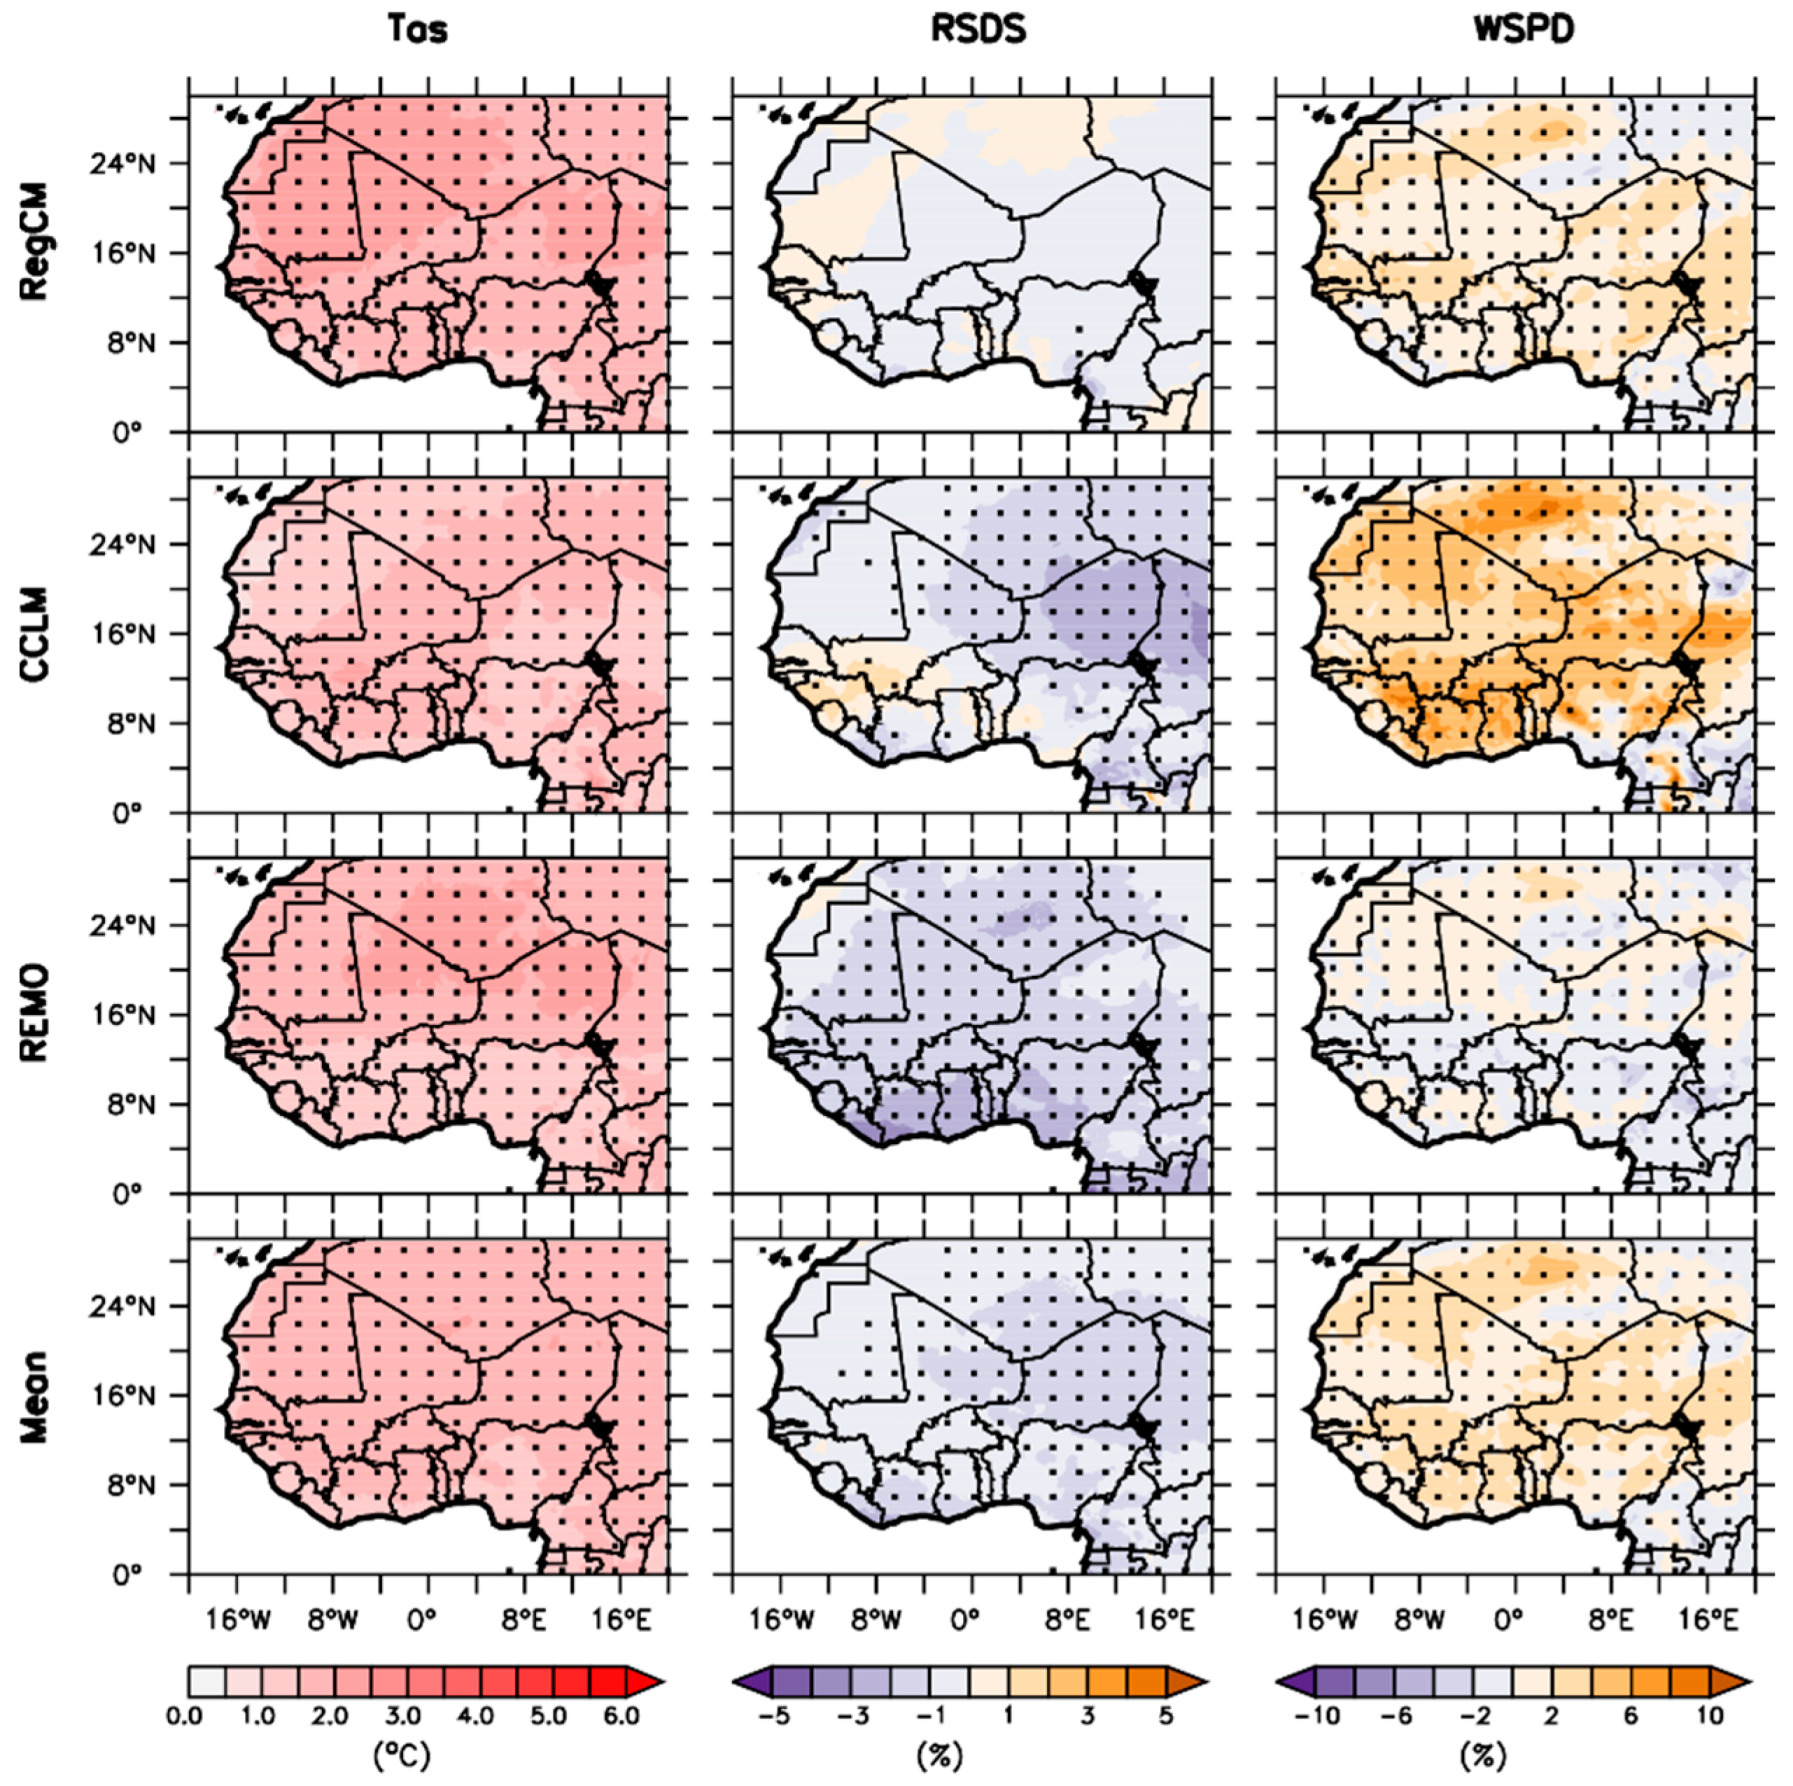
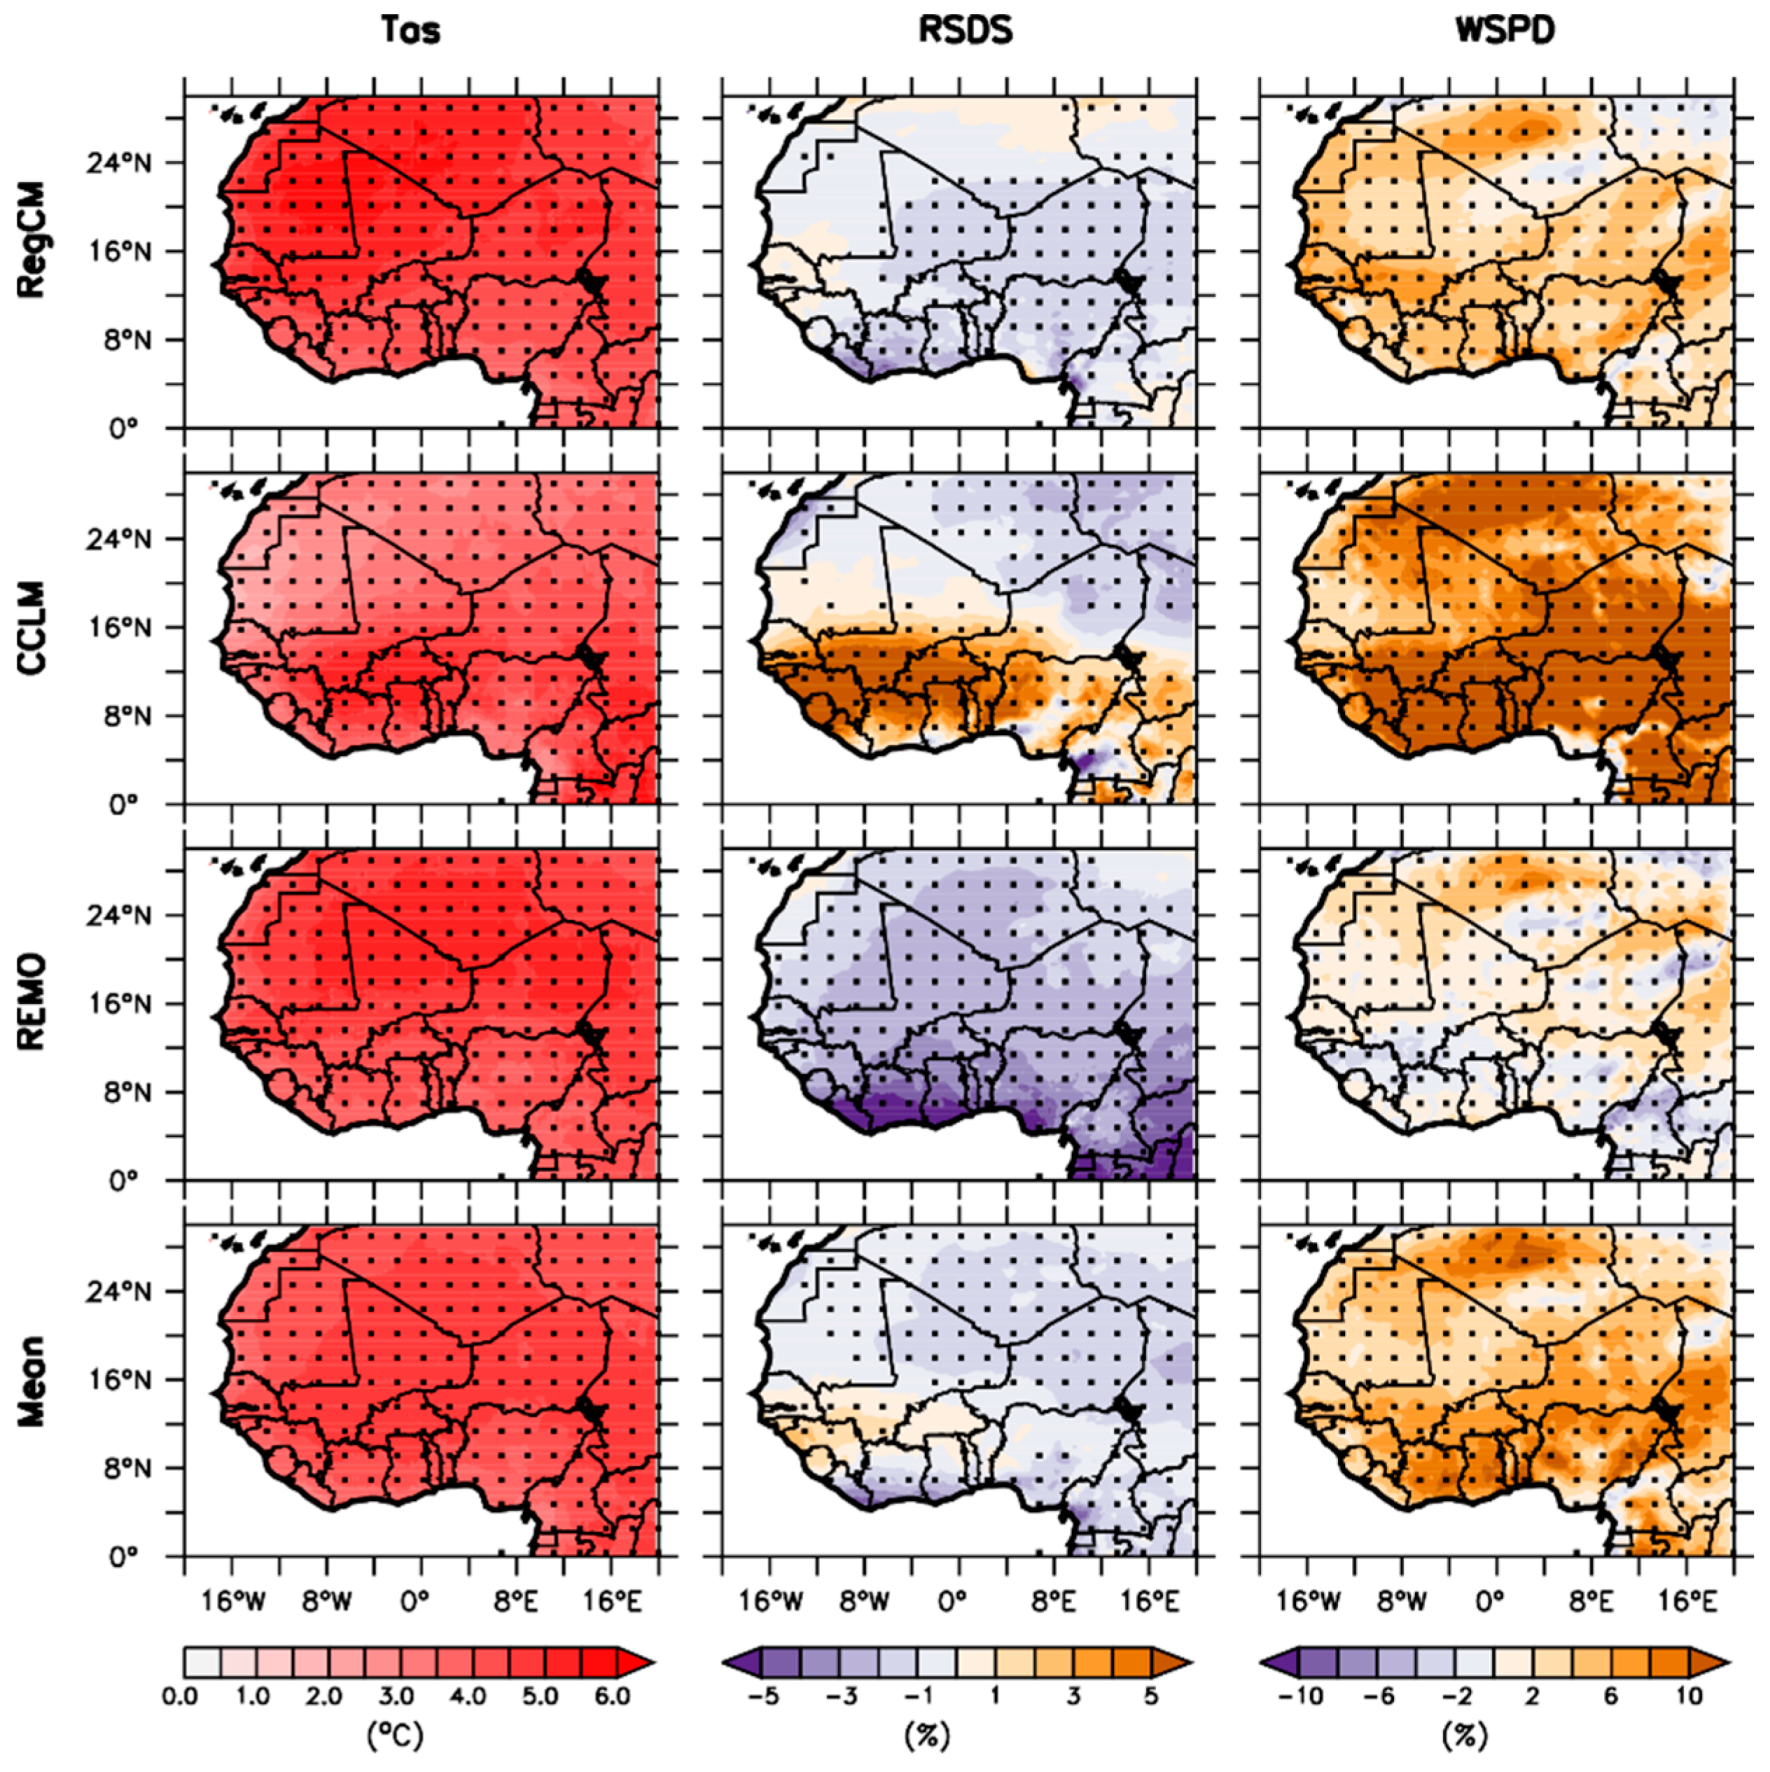
3.2.1. Future Temperature, Shortwave Solar Radiation, and Wind Speed Changes
3.2.2. Changes in Cell Temperature, PV Potential and Wind Power Density
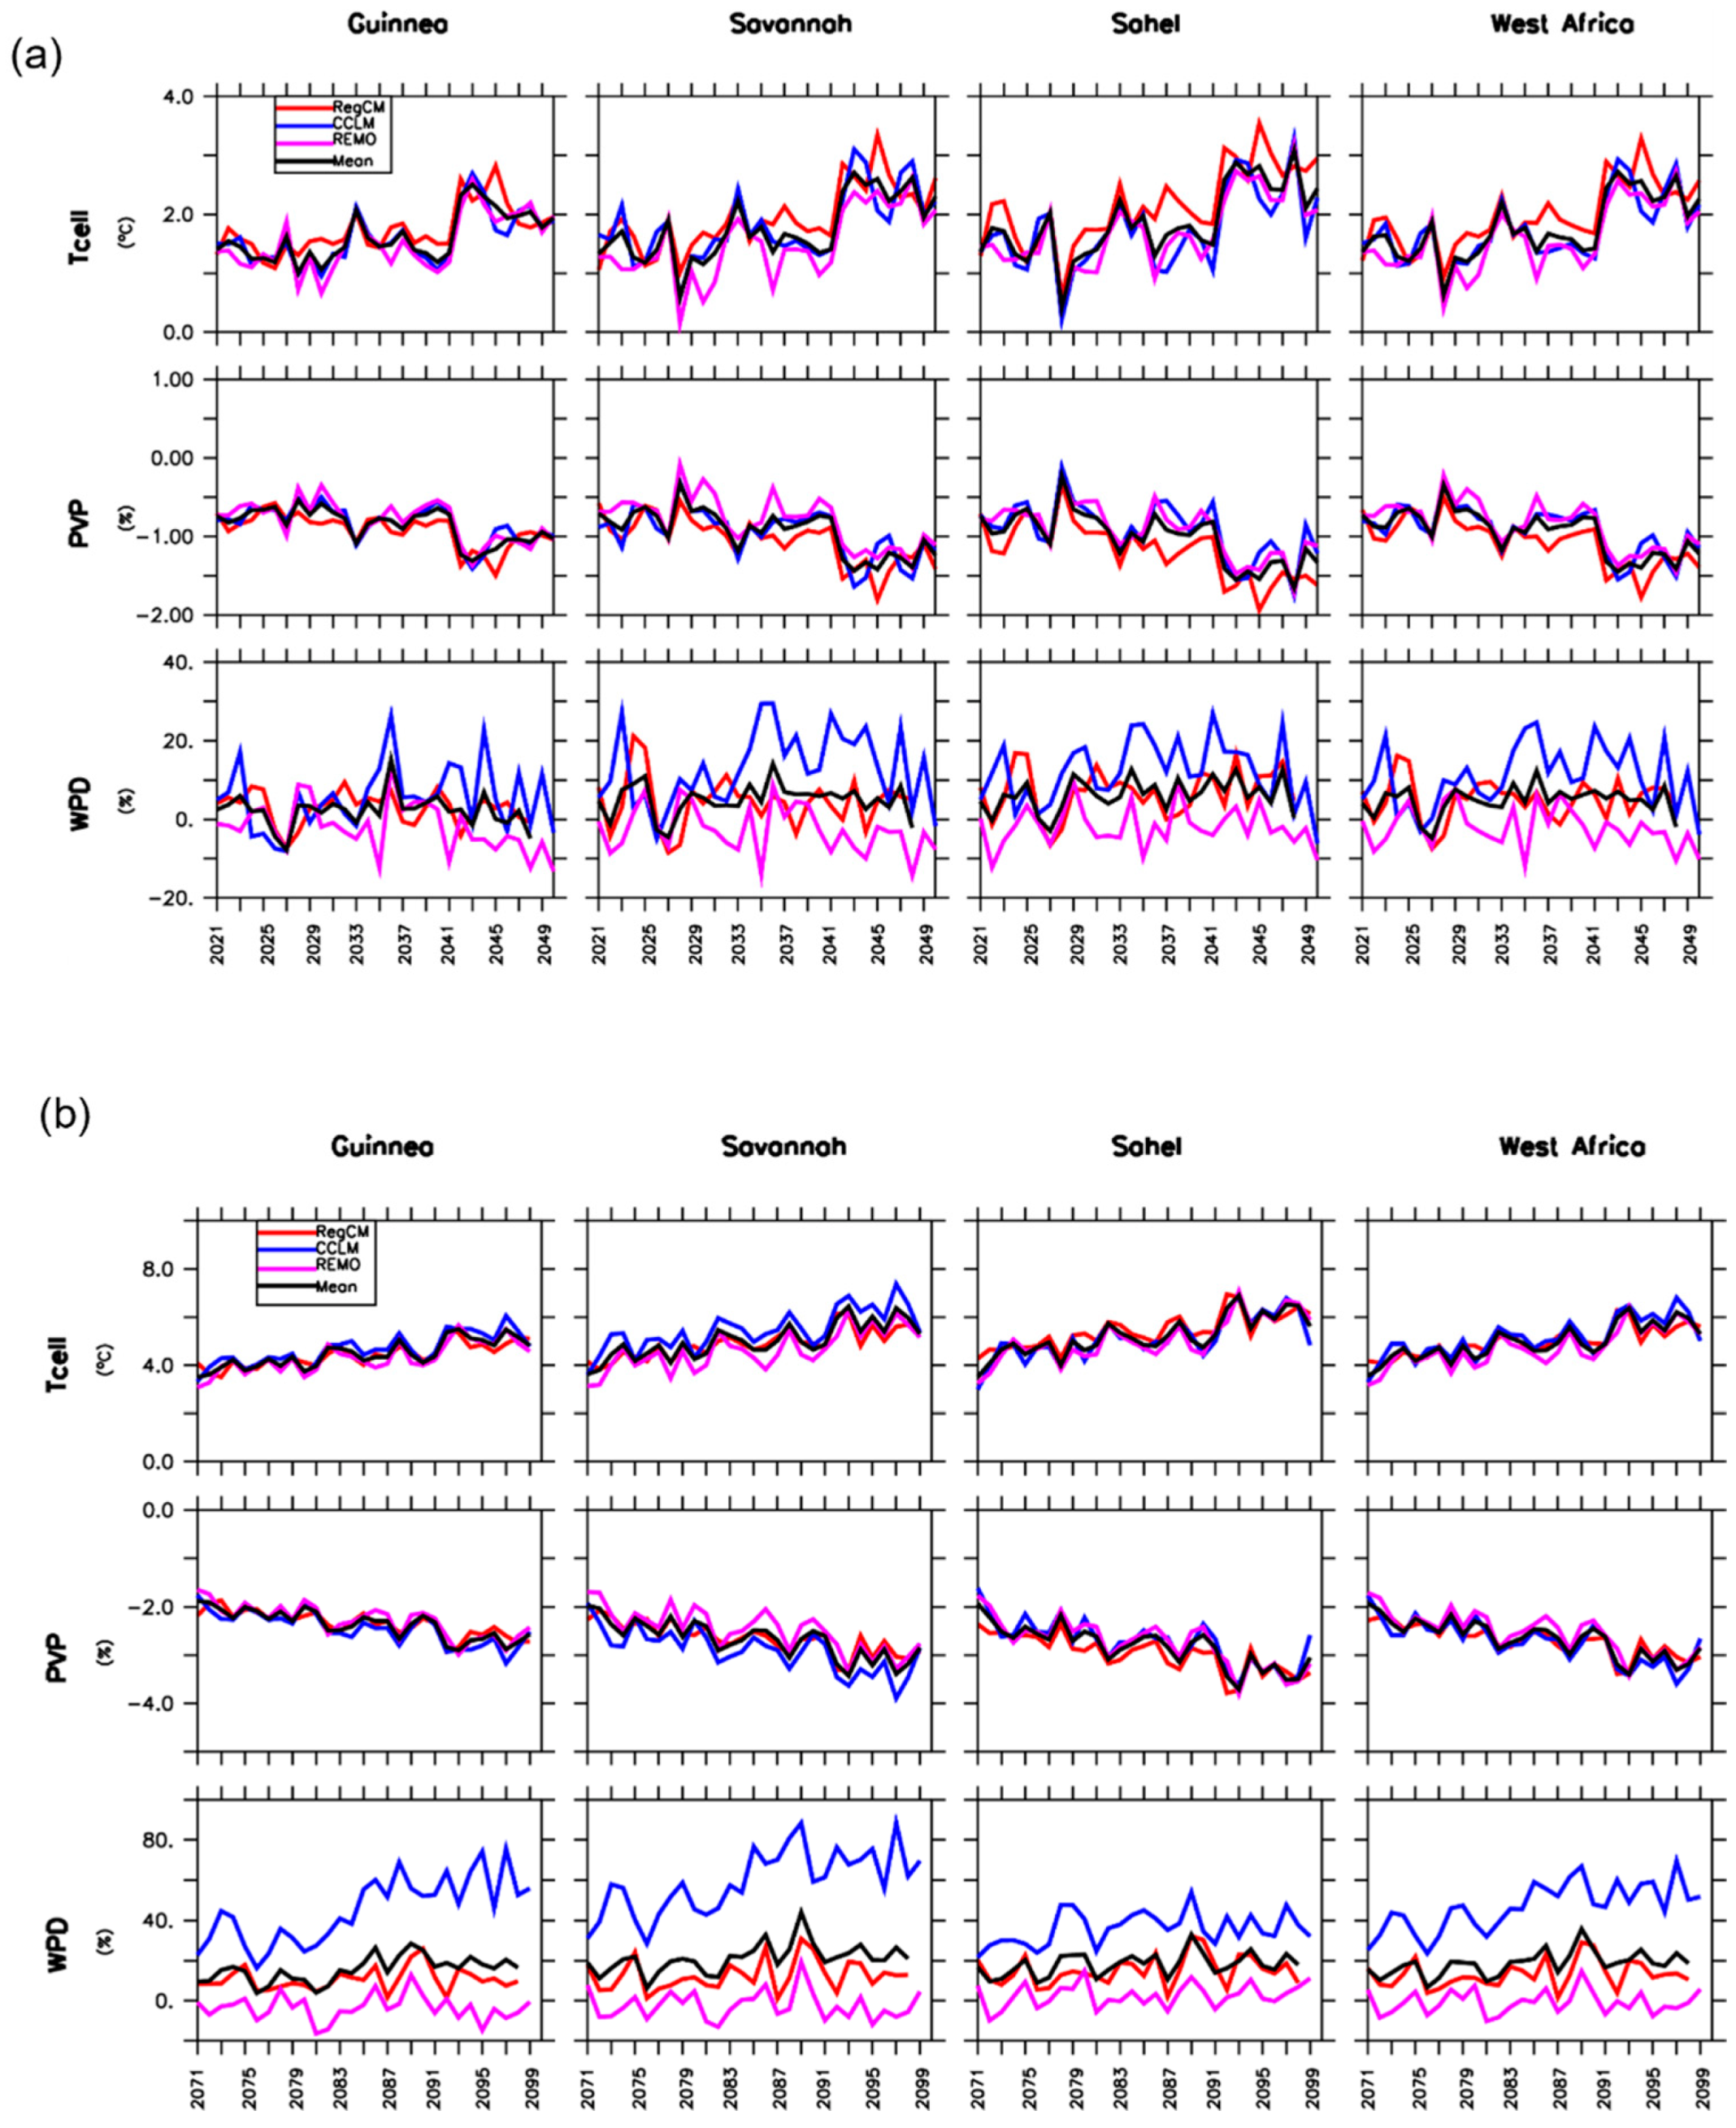
3.3. Inter-Annual Variability
3.4. Models’ Agreement on the Projected Changes
4. Summary and Conclusions
- ▪
- The model evaluation shows a relatively good representation of selected annual and monthly patterns of the simulated solar PV potential, the wind power density, and related variables, with high spatial correlations ranging between 0.82 and 0.97. However, we also identified strong under and overestimations of the RCM simulations, especially for the wind variables.
- ▪
- RegCM is the best model among the RCMs for the simulations of the solar irradiance and the solar PV potential and the sub-regions.
- ▪
- REMO is the best model for wind speed and wind power density simulation over the region.
- ▪
- For the air temperature, both REMO and RegCM had a good performance. CCLM was the least efficient model for this simulation.
- ▪
- A better simulation of these variables with less biases is noted when using the ensemble mean.
- ▪
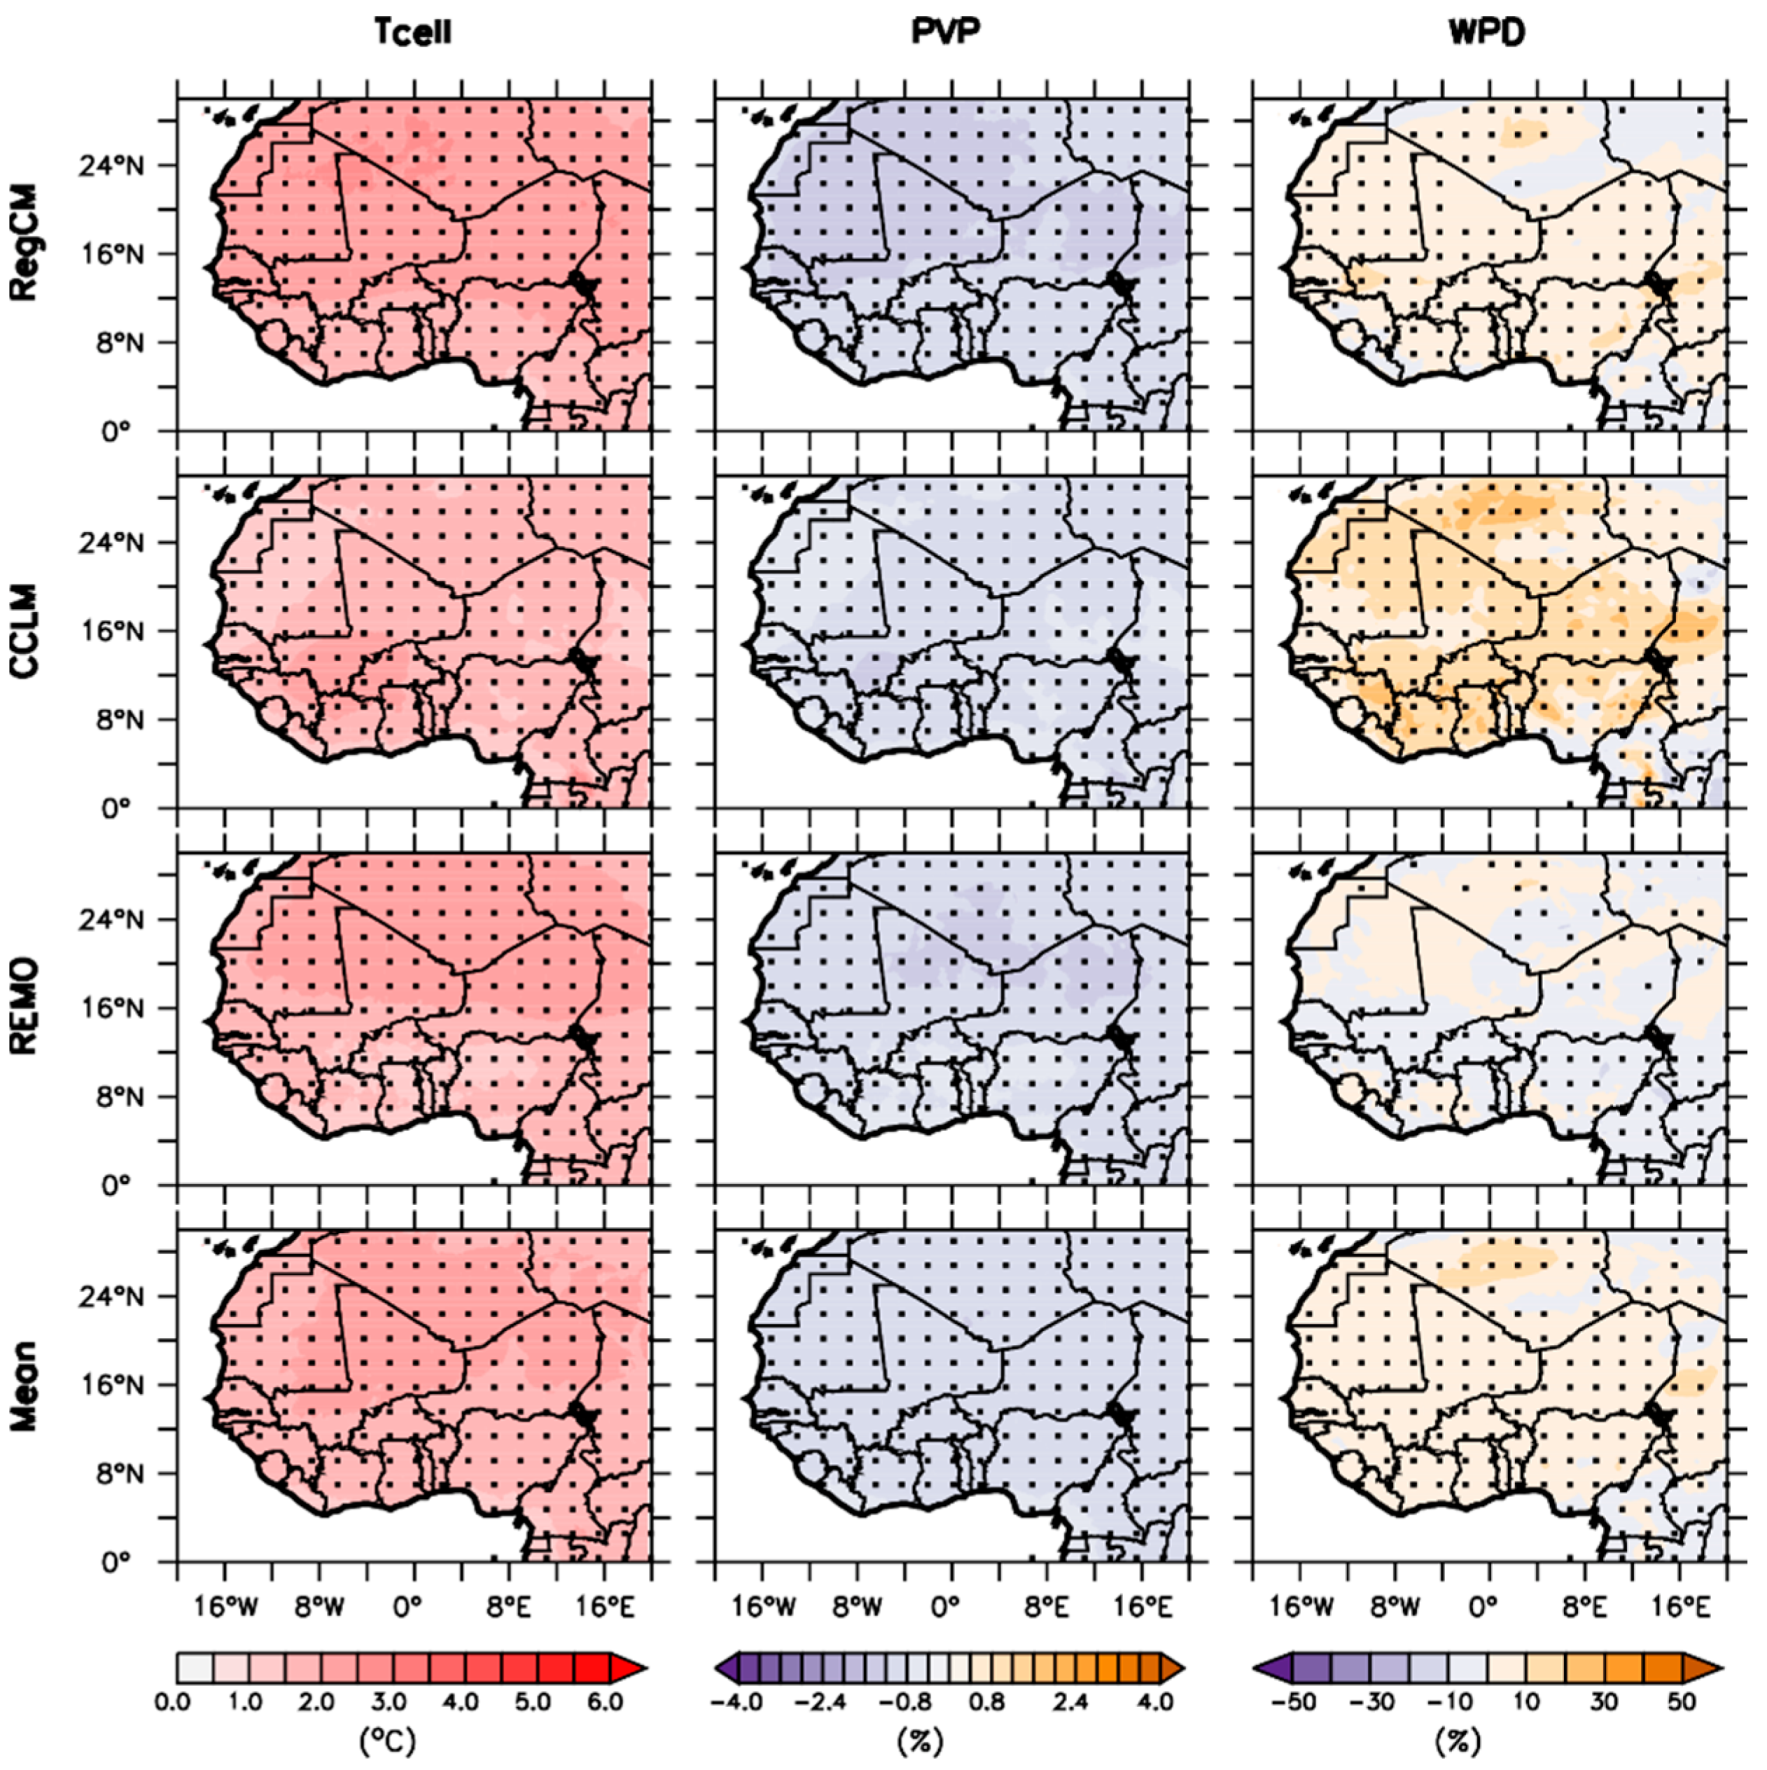
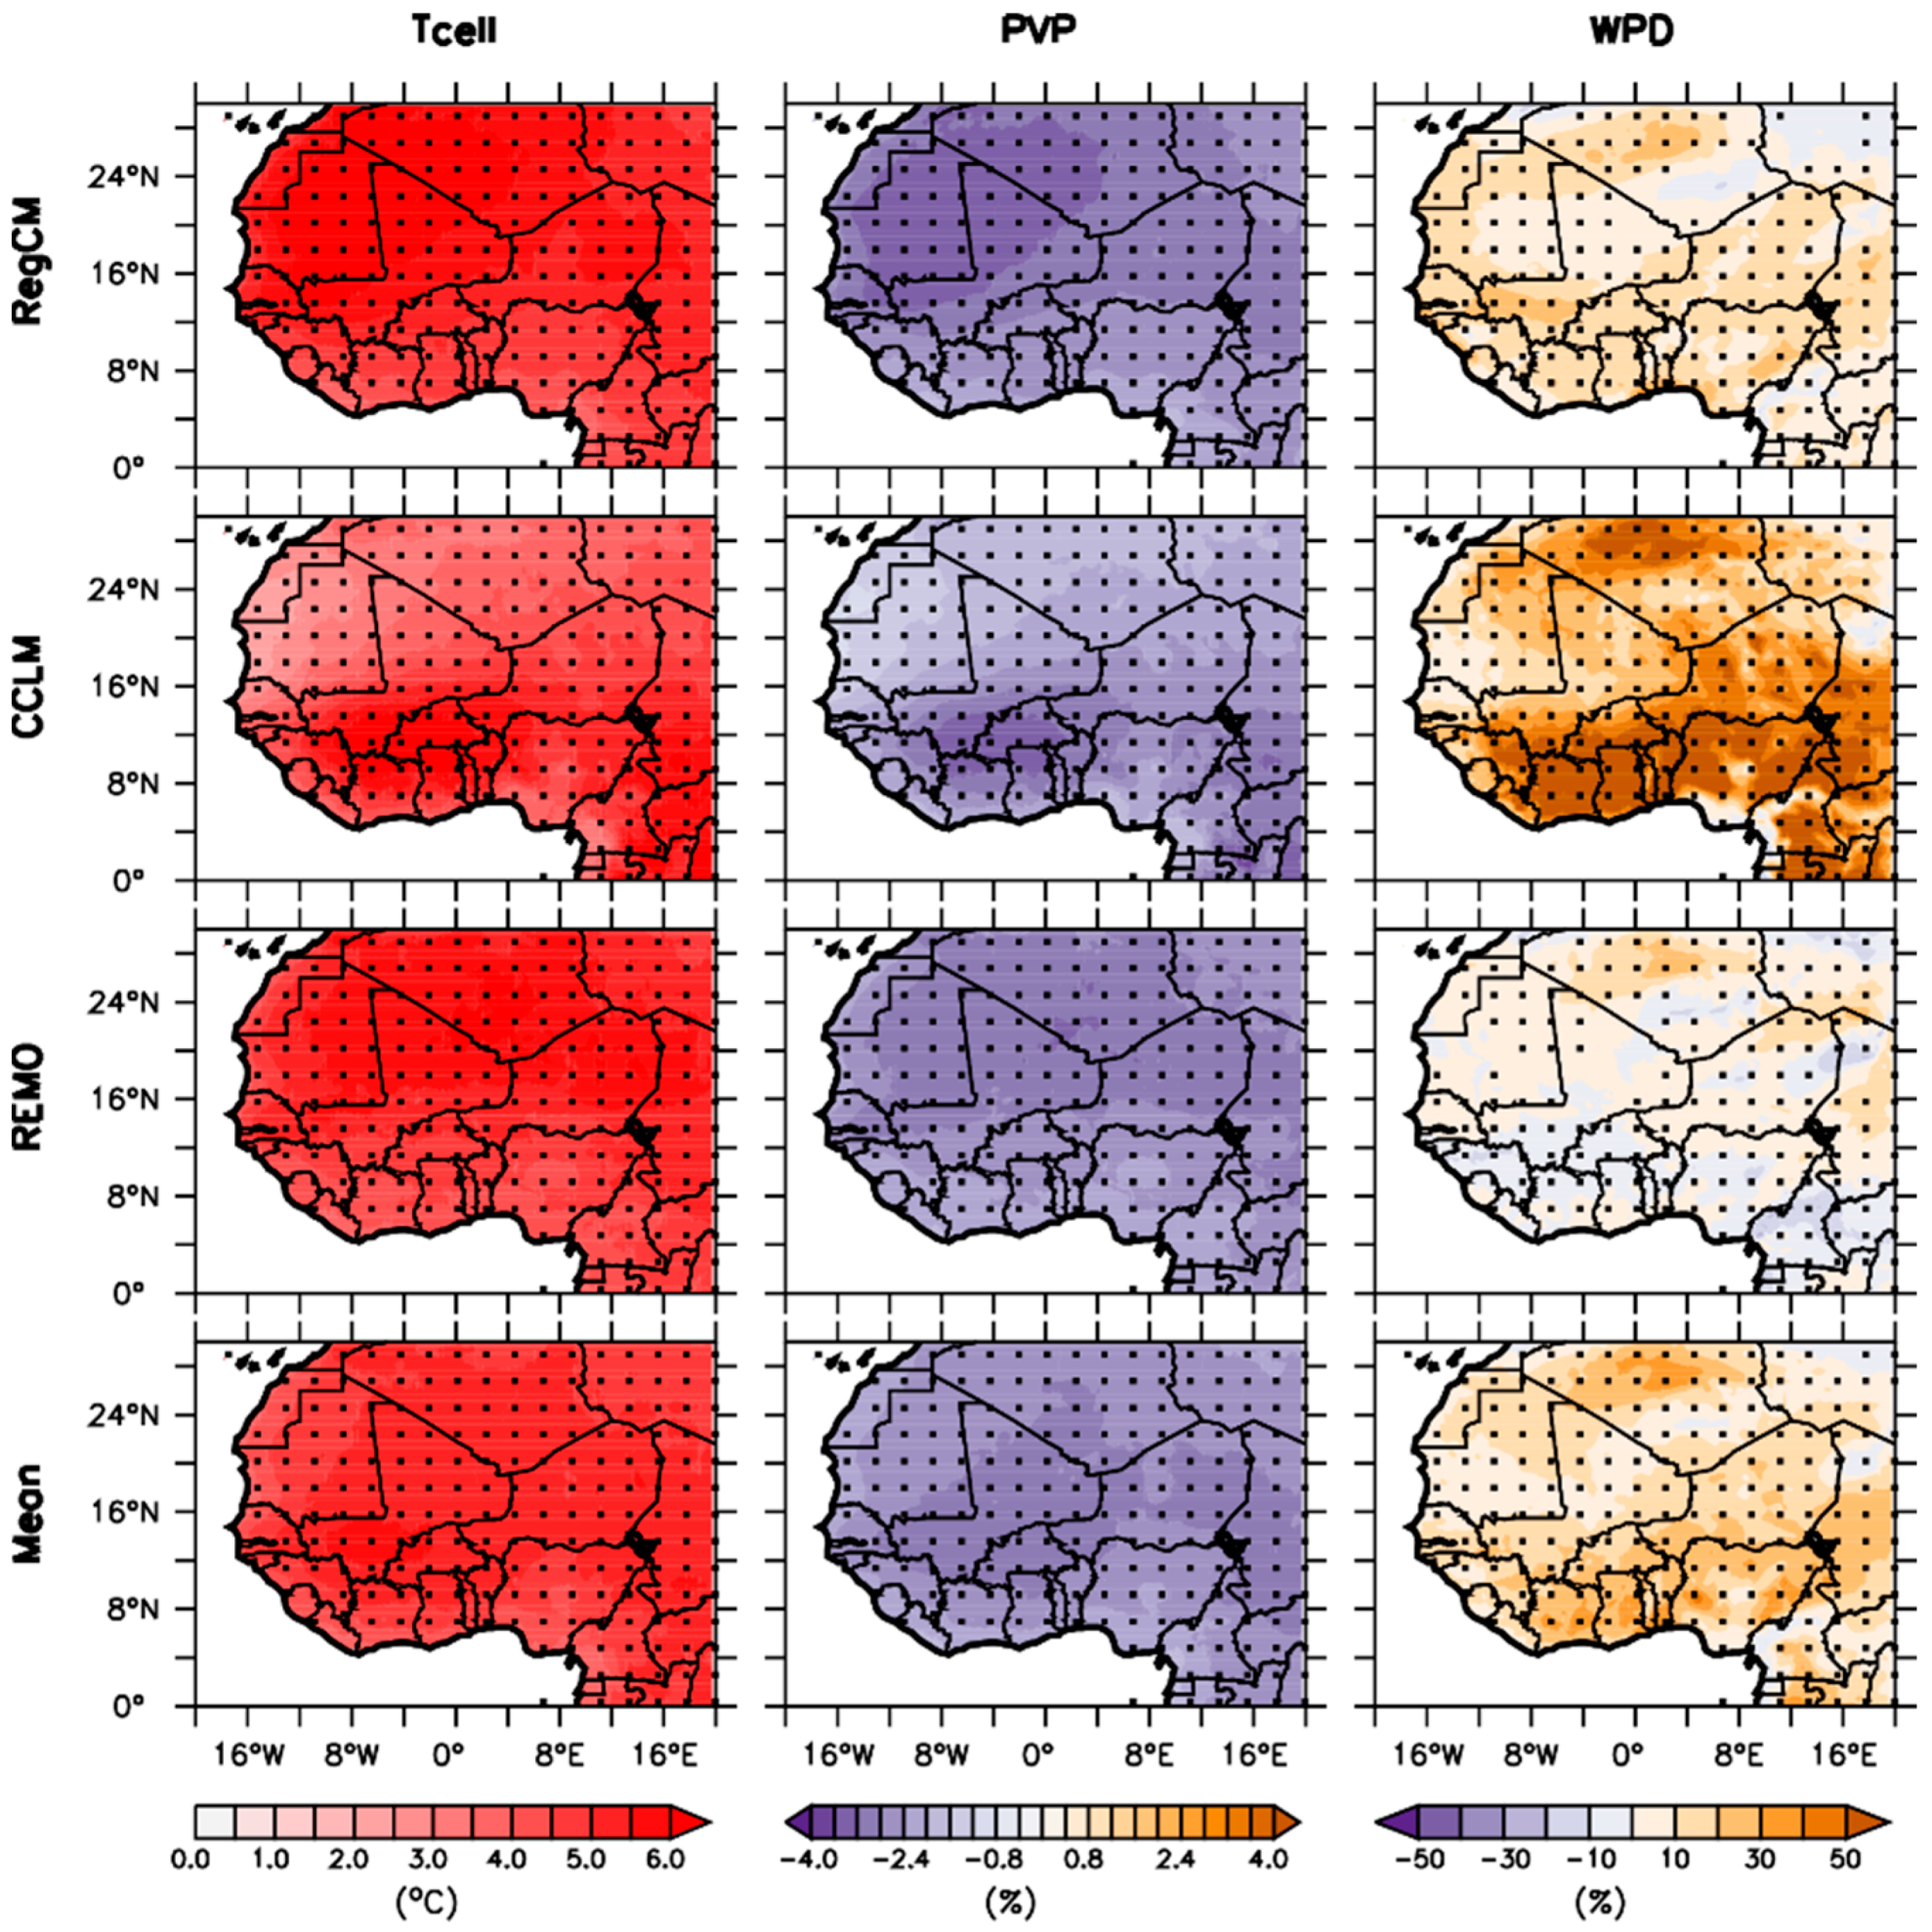
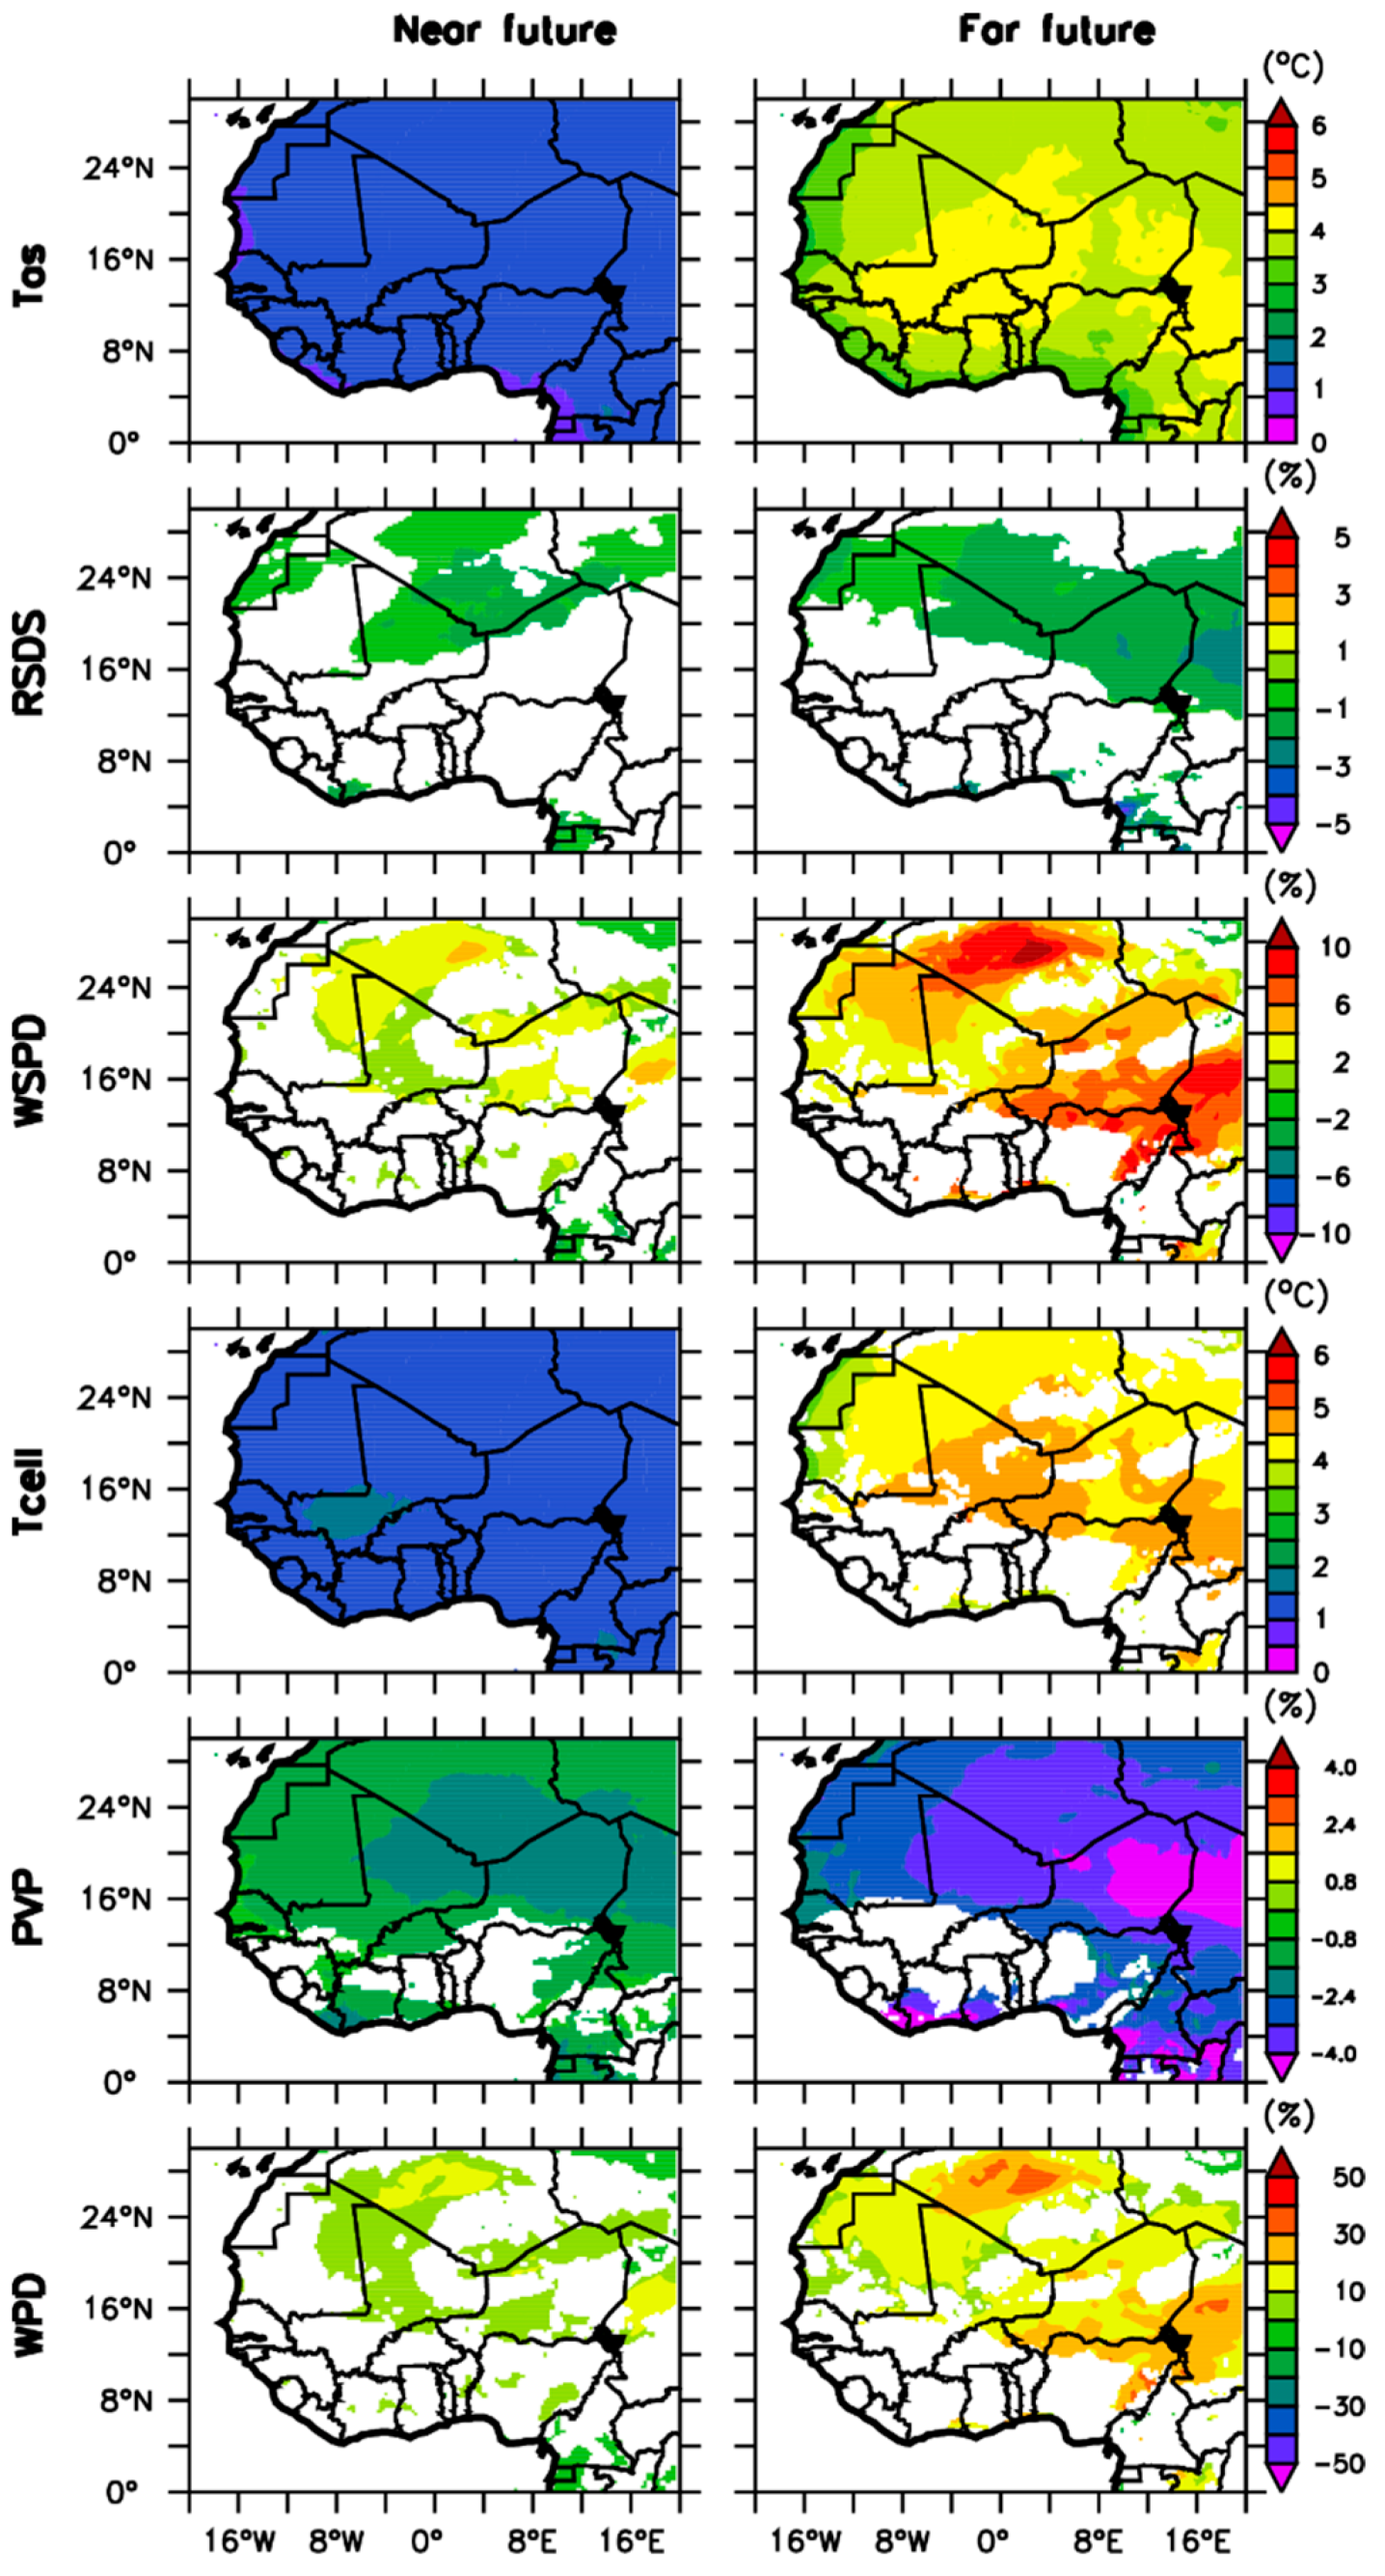
- The projection under the RCP8.5 scenario indicates a decrease in solar irradiance and solar PV potential. The solar PV potential is expected to have a significant decrease for all the RCMs and the ensemble mean, as well as for the near (2021–2051) and far future (2071–2100), and under the RCP8.5 scenario. The decrease concerns the whole of West Africa and varies from ~−2 to about −4% in the considered period. This is mainly due to the increase in cell temperature and the decrease in solar radiation over the region.
- ▪
- The wind power projection shows a predominant increase over West Africa, with a projection of about 20 to 40% by the ensemble mean and for the two future periods. The RCMs convey more consistency in the projection of the other climate variables than the wind speed and the wind power density. The latter is subject to some divergences, with REMO expecting a decrease, RegCM and Mean an increase, and CCLM a high increase.
Author Contributions
Funding
Data Availability Statement
Acknowledgments
Conflicts of Interest
References
- U.S. Energy Information Administration. International Energy Outlook 2019. 2019. Available online: www.eia.gov/ieo (accessed on 2 March 2022).
- Foster and Elzing, United Nation Website, December 2015. Available online: https://www.un.org/en/chronicle/article/role-fossil-fuels-sustainable-energy-system (accessed on 2 March 2022).
- Eyring, V.; Gillett, N.P.; Rao, K.M.A.; Barimalala, R.; Parrillo, M.B.; Bellouin, N.; Cassou, C.; Durack, P.J.; Kosaka, Y.; McGregor, S.; et al. Human Influence on the Climate System. In Climate Change 2021: The Physical Science Basis. Contribution of Working Group I to the Sixth Assessment Report of the Intergovernmental Panel on Climate Change; Cambridge University Press: Cambridge, UK, 2021; pp. 423–552. [Google Scholar] [CrossRef]
- Moomaw, W.; Yamba, F.; Kamimoto, M.; Maurice, L.; Nyboer, J.; Urama, K.; Weir, T.; Bruckner, T.; Jäger-Waldau, A.; Krey, V.; et al. Renewable Energy and Climate Change. In IPCC Special Report on Renewable Energy Sources and Climate Change Mitigation; Cambridge University Press: Cambridge, UK, 2011; pp. 161–208. [Google Scholar] [CrossRef]
- International Energy Agency. Renewables. 2019. Available online: www.iea.org/renewables2019 (accessed on 4 March 2022).
- Chandramowli, S.; Felder, F.A. Impact of climate change on electricity systems and markets – A review of models and forecasts. Sustain. Energy Technol. Assess. 2014, 5, 62–74. [Google Scholar] [CrossRef]
- Troccoli, A.; Goodess, C.; Jones, P.; Penny, L.; Dorling, S.; Harpham, C.; Dubus, L.; Parey, S.; Claudel, S.; Khong, D.-H.; et al. Creating a proof-of-concept climate service to assess future renewable energy mixes in Europe: An overview of the C3S ECEM project. Adv. Sci. Res. 2018, 15, 191–205. [Google Scholar] [CrossRef]
- Pryor, S.; Barthelmie, R. Climate change impacts on wind energy: A review. Renew. Sustain. Energy Rev. 2010, 14, 430–437. [Google Scholar] [CrossRef]
- Tobin, I.; Vautard, R.; Balog, I.; Bréon, F.-M.; Jerez, S.; Ruti, P.M.; Thais, F.; Vrac, M.; Yiou, P. Assessing climate change impacts on European wind energy from ENSEMBLES high-resolution climate projections. Clim. Change 2014, 128, 99–112. [Google Scholar] [CrossRef]
- Müller, J.; Folini, D.; Wild, M.; Pfenninger, S. CMIP-5 models project photovoltaics are a no-regrets investment in Europe irrespective of climate change. Energy 2018, 171, 135–148. [Google Scholar] [CrossRef]
- Breslow, P.B.; Sailor, D.J. Vulnerability of wind power resources to climate change in the continental United States. Renew. Energy 2002, 27, 585–598. [Google Scholar] [CrossRef]
- Crook, J.A.; Jones, L.A.; Forster, P.M.; Crook, R. Climate change impacts on future photovoltaic and concentrated solar power energy output. Energy Environ. Sci. 2011, 4, 3101–3109. [Google Scholar] [CrossRef]
- De Jong, P.; Barreto, T.B.; Tanajura, C.A.; Kouloukoui, D.; Oliveira-Esquerre, K.P.; Kiperstok, A.; Torres, E.A. Estimating the impact of climate change on wind and solar energy in Brazil using a South American regional climate model. Renew. Energy 2019, 141, 390–401. [Google Scholar] [CrossRef]
- Sawadogo, W.; Abiodun, B.J.; Okogbue, E.C. Impacts of global warming on photovoltaic power generation over West Africa. Renew. Energy 2019, 151, 263–277. [Google Scholar] [CrossRef]
- Soares, P.M.M.; Lima, D.C.; Semedo, A.; Cabos, W.; Sein, D.V. Climate change impact on Northwestern African offshore wind energy resources. Environ. Res. Lett. 2019, 14, 124065. [Google Scholar] [CrossRef]
- Sawadogo, W.; Abiodun, B.J.; Okogbue, E.C. Projected changes in wind energy potential over West Africa under the global warming of 1.5 °C and above. Theor. Appl. Clim. 2019, 138, 321–333. [Google Scholar] [CrossRef]
- Ogunjobi, K.O.; Ajayi, V.O.; Folorunsho, A.H.; Ilori, O.W. Projected changes in wind energy potential using CORDEX ensemble simulation over West Africa. Arch. Meteorol. Geophys. Bioclimatol. Ser. B 2022, 134, 48. [Google Scholar] [CrossRef]
- Huber, I.; Bugliaro, L.; Ponater, M.; Garny, H.; Emde, C.; Mayer, B. Do climate models project changes in solar resources? Sol. Energy 2016, 129, 65–84. [Google Scholar] [CrossRef]
- Bazyomo, S.D.Y.B.; Lawin, E.A.; Coulibaly, O.; Ouedraogo, A. Forecasted Changes in West Africa Photovoltaic Energy Output by 2045. Climate 2016, 4, 53. [Google Scholar] [CrossRef] [Green Version]
- Sawadogo, W.; Reboita, M.S.; Faye, A.; Da Rocha, R.P.; Odoulami, R.C.; Olusegun, C.F.; Adeniyi, M.O.; Abiodun, B.J.; Sylla, M.B.; Diallo, I.; et al. Current and future potential of solar and wind energy over Africa using the RegCM4 CORDEX-CORE ensemble. Clim. Dyn. 2021, 57, 1647–1672. [Google Scholar] [CrossRef]
- Danso, D.K.; Anquetin, S.; Diedhiou, A.; Lavaysse, C.; Hingray, B.; Raynaud, D.; Kobea, A.T. A CMIP6 assessment of the potential climate change impacts on solar photovoltaic energy and its atmospheric drivers in West Africa. Environ. Res. Lett. 2022, 17, 044016. [Google Scholar] [CrossRef]
- Gutowski, J.W.; Giorgi, F.; Timbal, B.; Frigon, A.; Jacob, D.; Kang, H.S.; Raghavan, K.; Lee, B.; Lennard, C.; Nikulin, G.; et al. WCRP COordinated Regional Downscaling EXperiment (CORDEX): A diagnostic MIP for CMIP6. Geosci. Model. Dev. 2016, 9, 4087–4095. [Google Scholar] [CrossRef] [Green Version]
- Giorgi, F.; Coppola, E.; Teichmann, C.; Jacob, D. Editorial for the CORDEX-CORE Experiment I Special Issue. Clim. Dyn. 2021, 57, 1265–1268. [Google Scholar] [CrossRef]
- Olusegun, C.F.; Awe, O.; Ijila, I.; Ajanaku, O.; Ogunjo, S. Evaluation of dry and wet spell events over West Africa using CORDEX-CORE regional climate models. Model. Earth Syst. Environ. 2022, 8, 4923–4937. [Google Scholar] [CrossRef]
- Dosio, A.; Jury, M.W.; Almazroui, M.; Ashfaq, M.; Diallo, I.; Engelbrecht, F.A.; Klutse, N.A.B.; Lennard, C.; Pinto, I.; Sylla, M.B.; et al. Projected future daily characteristics of African precipitation based on global (CMIP5, CMIP6) and regional (CORDEX, CORDEX-CORE) climate models. Clim. Dyn. 2021, 57, 3135–3158. [Google Scholar] [CrossRef]
- Torres-Alavez, J.A.; Das, S.; Corrales-Suastegui, A.; Coppola, E.; Giorgi, F.; Raffaele, F.; Bukovsky, M.S.; Ashfaq, M.; Salinas, J.A.; Sines, T. Future projections in the climatology of global low-level jets from CORDEX-CORE simulations. Clim. Dyn. 2021, 57, 1551–1569. [Google Scholar] [CrossRef]
- Coppola, E.; Raffaele, F.; Giorgi, F.; Giuliani, G.; Gao, X.; Ciarlo, J.M.; Sines, T.R.; Torres-Alavez, J.A.; Das, S.; di Sante, F.; et al. Climate hazard indices projections based on CORDEX-CORE, CMIP5 and CMIP6 ensemble. Clim. Dyn. 2021, 57, 1293–1383. [Google Scholar] [CrossRef]
- Tebaldi, C.; Knutti, R. The use of the multi-model ensemble in probabilistic climate projections. Philos. Trans. R. Soc. A Math. Phys. Eng. Sci. 2007, 365, 2053–2075. [Google Scholar] [CrossRef] [PubMed]
- Renewable Energy Agency. Unleashing the Solar Potential in ECOWAS: Seeking Areas of Opportunity for Grid-Connected and Decentralised PV Applications. An Opportunity-Based Approach about IRENA. 2013. Available online: www.irena.org (accessed on 7 March 2022).
- Nicholson, S.E. The West African Sahel: A Review of Recent Studies on the Rainfall Regime and Its Interannual Variability. ISRN Meteorol. 2013, 2013, 453521. [Google Scholar] [CrossRef]
- Lewis, K.; Buontempo, C. Climate Impacts in the Sahel and West Africa: The Role of Climate Science in Policy Making; West African Papers, No. 02; OECD Publishing: Paris, France, 2016. [Google Scholar] [CrossRef]
- Abiodun, B.J.; Adeyewa, Z.D.; Oguntunde, P.; Salami, A.; Ajayi, V.O. Modeling the impacts of reforestation on future climate in West Africa. Arch. Meteorol. Geophys. Bioclimatol. Ser. B 2012, 110, 77–96. [Google Scholar] [CrossRef]
- Heinzeller, D.; Dieng, D.; Smiatek, G.; Olusegun, C.; Klein, C.; Hamann, I.; Salack, S.; Bliefernicht, J.; Kunstmann, H. The WASCAL high-resolution regional climate simulation ensemble for West Africa: Concept, dissemination and assessment. Earth Syst. Sci. Data 2018, 10, 815–835. [Google Scholar] [CrossRef] [Green Version]
- Dieng, D.; Laux, P.; Smiatek, G.; Heinzeller, D.; Bliefernicht, J.; Sarr, A.; Gaye, A.T.; Kunstmann, H. Performance Analysis and Projected Changes of Agroclimatological Indices Across West Africa Based on High-Resolution Regional Climate Model Simulations. J. Geophys. Res. Atmos. 2018, 123, 7950–7973. [Google Scholar] [CrossRef]
- Akinsanola, A.A.; Ogunjobi, K.O.; Gbode, I.E.; Ajayi, V.O. Assessing the Capabilities of Three Regional Climate Models over CORDEX Africa in Simulating West African Summer Monsoon Precipitation. Adv. Meteorol. 2015, 2015, 1–13. [Google Scholar] [CrossRef] [Green Version]
- Biasutti, M. Rainfall trends in the African Sahel: Characteristics, processes, and causes. WIREs Clim. Change 2019, 10, e591. [Google Scholar] [CrossRef] [Green Version]
- Hersbach, H.; Bell, B.; Berrisford, P.; Hirahara, S.; Horanyi, A.; Muñoz-Sabater, J.; Nicolas, J.; Peubey, C.; Radu, R.; Schepers, D.; et al. The ERA5 global reanalysis. Q. J. R. Meteorol. Soc. 2020, 146, 1999–2049. [Google Scholar] [CrossRef]
- Pfeifroth, U.; Kothe, S.; Müller, R.; Trentmann, J.; Hollmann, R.; Fuchs, P.; Werscheck, M. Surface Radiation Data Set—Heliosat (SARAH)—Edition 2 (Version 2.0) [Data Set]; Satellite Application Facility on Climate Monitoring (CM SAF): Deutscher, Germany, 2017. [Google Scholar] [CrossRef]
- Taylor, K.E.; Stouffer, R.J.; Meehl, G.A. An Overview of CMIP5 and the Experiment Design. Bull. Am. Meteorol. Soc. 2012, 93, 485–498. [Google Scholar] [CrossRef] [Green Version]
- Giorgi, F.; Coppola, E.; Jacob, D.; Teichmann, C.; Omar, S.A.; Ashfaq, M.; Ban, N.; Bülow, K.; Bukovsky, M.; Buntemeyer, L.; et al. The CORDEX-CORE EXP-I Initiative: Description and Highlight Results from the Initial Analysis. Bull. Am. Meteorol. Soc. 2022, 103, E293–E310. [Google Scholar] [CrossRef]
- Giorgi, F.; Coppola, E.; Solmon, F.; Mariotti, L.; Sylla, M.B.; Bi, X.; Elguindi, N.; Diro, G.T.; Nair, V.; Giuliani, G.; et al. RegCM4: Model description and preliminary tests over multiple CORDEX domains. Clim. Res. 2012, 52, 7–29. [Google Scholar] [CrossRef] [Green Version]
- Elguindi, N.; Turuncoglu, U.; Giorgi, F. Assessment of CMIP5 global model simulations over the sub-set of CORDEX domains used in the Phase I CREMA. Clim. Change 2013, 125, 3121. [Google Scholar]
- McSweeney, C.F.; Jones, R.G.; Lee, R.W.; Rowell, D.P. Selecting CMIP5 GCMs for downscaling over multiple regions. Clim. Dyn. 2015, 44, 3237–3260. [Google Scholar] [CrossRef] [Green Version]
- Jacob, D.; Elizalde, A.; Haensler, A.; Hagemann, S.; Kumar, P.; Podzun, R.; Rechid, D.; Remedio, A.R.; Saeed, F.; Sieck, K.; et al. Assessing the Transferability of the Regional Climate Model REMO to Different COordinated Regional Climate Downscaling EXperiment (CORDEX) Regions. Atmosphere 2012, 3, 181–199. [Google Scholar] [CrossRef] [Green Version]
- Remedio, A.R.; Teichmann, C.; Buntemeyer, L.; Sieck, K.; Weber, T.; Rechid, D.; Hoffmann, P.; Nam, C.; Kotova, L.; Jacob, D. Evaluation of New CORDEX Simulations Using an Updated Köppen–Trewartha Climate Classification. Atmosphere 2019, 10, 726. [Google Scholar] [CrossRef]
- Kouassi, A.A.; Kone, B.; Silue, S.; Dajuma, A.; N’Datchoh, T.E.; Adon, M.; Yoboue, V.; Diedhiou, A. Sensitivity Study of the RegCM4’s Surface Schemes in the Simulations of West Africa Climate. Atmospheric Clim. Sci. 2022, 12, 86–104. [Google Scholar] [CrossRef]
- Paeth, H.; Hall, N.M.; Gaertner, M.A.; Alonso, M.D.; Moumouni, S.; Polcher, J.; Ruti, P.M.; Fink, A.H.; Gosset, M.; Lebel, T.; et al. Progress in regional downscaling of west African precipitation. Atmos. Sci. Lett. 2011, 12, 75–82. [Google Scholar] [CrossRef]
- Paxian, A.; Sein, D.; Panitz, H.-J.; Warscher, M.; Breil, M.; Engel, T.; Tödter, J.; Krause, A.; Narvaez, W.D.C.; Fink, A.H.; et al. Bias reduction in decadal predictions of West African monsoon rainfall using regional climate models. J. Geophys. Res. Atmos. 2016, 121, 1715–1735. [Google Scholar] [CrossRef] [Green Version]
- Dosio, A.; Panitz, H.-J. Climate change projections for CORDEX-Africa with COSMO-CLM regional climate model and differences with the driving global climate models. Clim. Dyn. 2015, 46, 1599–1625. [Google Scholar] [CrossRef] [Green Version]
- Dieng, D.; Smiatek, G.; Bliefernicht, J.; Heinzeller, D.; Sarr, A.; Gaye, A.T.; Kunstmann, H. Evaluation of the COSMO-CLM high-resolution climate simulations over West Africa. J. Geophys. Res. Atmos. 2017, 122, 1437–1455. [Google Scholar] [CrossRef]
- Müller, R.; Pfeifroth, U.; Träger-Chatterjee, C.; Trentmann, J.; Cremer, R. Digging the METEOSAT Treasure—3 Decades of Solar Surface Radiation. Remote Sens. 2015, 7, 8067–8101. [Google Scholar] [CrossRef] [Green Version]
- Pfeifroth, U.; Sanchez-Lorenzo, A.; Manara, V.; Trentmann, J.; Hollmann, R. Trends and Variability of Surface Solar Radiation in Europe Based On Surface- and Satellite-Based Data Records. J. Geophys. Res. Atmos. 2018, 123, 1735–1754. [Google Scholar] [CrossRef]
- Pal, J.S.; Small, E.E.; Eltahir, E.A.B. Simulation of regional-scale water and energy budgets: Representation of subgrid cloud and precipitation processes within RegCM. J. Geophys. Res. Atmos. 2000, 105, 29579–29594. [Google Scholar] [CrossRef] [Green Version]
- Tiedtke, M. A comprehensive mass flux scheme for cumulus parameterization in large-scale models. Mon. Weather Rev. 1989, 117, 1779–1800. [Google Scholar] [CrossRef]
- Kain, J.S.; Fritsch, J.M. A one-dimensional entraining/detraining plume model and its application in convective parameterization. J. Atmos. Sci. 1990, 47, 2784–2802. [Google Scholar] [CrossRef]
- Holtslag, A.A.M.; De Bruijn, E.I.F.; Pan, H.L. A high resolution air mass transformation model for short-range weather forecasting. Mon. Weather Rev. 1990, 118, 1561–1575. [Google Scholar] [CrossRef]
- Kiehl, J.T.; Hack, J.J.; Bonan, G.B.; Boville, B.A.; Briegleb, B.P.; Williamson, D.L.; Rasch, P.J. Description of the NCAR Community Climate Model (CCM3); National Center for Atmospheric Research: Boulder, CO, USA, 1996. [Google Scholar]
- Solmon, F.; Giorgi, F.; Liousse, C. Aerosol modelling for regional climate studies: Application to anthropogenic particles and evaluation over a European/African domain. Tellus B Chem. Phys. Meteorol. 2006, 58, 51. [Google Scholar] [CrossRef]
- Zakey, A.S.; Solmon, F.; Giorgi, F. Implementation and testing of a desert dust module in a regional climate model. Atmos. Meas. Tech. 2006, 6, 4687–4704. [Google Scholar] [CrossRef] [Green Version]
- Zakey, A.S.; Giorgi, F.; Bi, X. Modeling of sea salt in a regional climate model: Fluxes and radiative forcing. J. Geophys. Res. Earth Surf. 2008, 113. [Google Scholar] [CrossRef] [Green Version]
- Lohmann, U.; Roeckner, E. Design and performance of a new cloud microphysics scheme developed for the ECHAM general circulation model. Clim. Dyn. 1996, 12, 557–572. [Google Scholar] [CrossRef]
- Nordeng, T.E. Extended Versions of the Convective Parametrization Scheme at ECMWF and Their Impact on the Mean and Transient Activity of the Model in the Tropics; Technical Report No. 206; European Centre for Medium-Range Weather Forecasts: Reading, UK, 1994. [Google Scholar]
- Pfeifer, S. Berichte Zur Erdsystemforschung. Modeling Cold Cloud Processes with the Regional Climate Model REMO. 2006. Available online: www.mpimet.mpg.de (accessed on 7 June 2022).
- Louis, J.-F. A parametric model of vertical eddy fluxes in the atmosphere. Bound.-Layer Meteorol. 1979, 17, 187–202. [Google Scholar] [CrossRef]
- Morcrette, J.J.; Smith, L.; Fourquart, Y. Pressure and temperature dependance of the absorption in longwave radiation parameterizations. Beitr. Phys. Atmos. 1986, 59, 455–469. [Google Scholar]
- Giorgetta, M.; Wild, M. The Water Vapour Continuum and Its Representation in Echam4; Report No. 162; Max-Planck-Institute for Meteorology: Hamburg, Germany, 1995. [Google Scholar]
- Tanre, D.; Geleyn, J.-F.; Slingo, J.M. First Results of the Introduction of an Advanced Aerosol-Radiation Interaction in the ECMWF Low Resolution Global Model, Aerosols and Their Climatic Effects; Gerber, H., Deepak, A., Eds.; Deepak Publ.: Hampton, VA, USA, 1984; pp. 133–177. [Google Scholar]
- Doms, G.; Forstner, J.; Heise, E.; Herzog, H.-J.; Raschendorfer, M.; Schrodin, R.; Reinhardt, T.; Vogel, G. A Description of the Nonhydrostatic Regional Model LM, Part II: Physical Parameterization; Deutscher Wetterdienst: Offenbach, Germany, 2007. [Google Scholar]
- Herzog, H.-J.; Schubert, U.; Vogel, G.; Fiedler, A.; Kirchner, R. LLM—The High-Resolving Nonhydrostatic Simulation Model in the DWD-Project LITFASS. Part I: Modelling Technique and Simulation Method; COSMO Technical Report No. 4; Deutscher Wetterdienst: Offenbach, Germany, 2002. [Google Scholar]
- Ritter, B.; Geleyn, J.F. A comprehensive radiation scheme for numerical weather prediction models with potential applications in climate simulations. Mon. Weather Rev. 1992, 120, 303–325. [Google Scholar] [CrossRef]
- Mavromatakis, F.; Makrides, G.; Georghiou, G.; Pothrakis, A.; Franghiadakis, Y.; Drakakis, E.; Koudoumas, E. Modeling the photovoltaic potential of a site. Renew. Energy 2010, 35, 1387–1390. [Google Scholar] [CrossRef]
- Jerez, S.; Tobin, I.; Vautard, R.; Montávez, J.P.; López-Romero, J.M.; Thais, F.; Bartok, B.; Christensen, O.B.; Colette, A.; Déqué, M.; et al. The impact of climate change on photovoltaic power generation in Europe. Nat. Commun. 2015, 6, 10014. [Google Scholar] [CrossRef] [Green Version]
- Bichet, A.; Hingray, B.; Evin, G.; Diedhiou, A.D.; Kebe, C.M.F.; Anquetin, S. Potential impact of climate change on solar resource in Africa for photovoltaic energy: Analyses from CORDEX-AFRICA climate experiments. Environ. Res. Lett. 2019, 14, 124039. [Google Scholar] [CrossRef]
- Feron, S.; Cordero, R.R.; Damiani, A.; Jackson, R.B. Climate change extremes and photovoltaic power output. Nat. Sustain. 2020, 4, 270–276. [Google Scholar] [CrossRef]
- Poddar, S.; Evans, J.P.; Kay, M.; Prasad, A.; Bremner, S. Estimation of future changes in photovoltaic potential in Australia due to climate change. Environ. Res. Lett. 2021, 16, 114034. [Google Scholar] [CrossRef]
- Tonui, J.; Tripanagnostopoulos, Y. Performance improvement of PV/T solar collectors with natural air flow operation. Sol. Energy 2008, 82, 1–12. [Google Scholar] [CrossRef]
- Chenni, R.; Makhlouf, M.; Kerbache, T.; Bouzid, A. A detailed modeling method for photovoltaic cells. Energy 2007, 32, 1724–1730. [Google Scholar] [CrossRef]
- Emeis, S. Wind Energy Meteorology: Atmospheric Physics for Wind Power Generation; Springer: Berlin/Heidelberg, Germany, 2013. [Google Scholar]
- Emeis, S. How well does a power law fit to a diabaticboundary-layer wind profile. DEWI Mag. 2005, 26, 59–62. [Google Scholar]
- Hausfather, Z.; Peters, G.P. Emissions—The ‘business as usual’ story is misleading. Nature 2020, 577, 618–620. [Google Scholar] [CrossRef] [PubMed] [Green Version]
- Riahi, K.; Rao, S.; Krey, V.; Cho, C.; Chirkov, V.; Fischer, G.; Kindermann, G.E.; Nakicenovic, N.; Rafaj, P. RCP 8.5—A scenario of comparatively high greenhouse gas emissions. Clim. Change 2011, 109, 33–57. [Google Scholar] [CrossRef] [Green Version]
- Ehret, U.; Zehe, E.; Wulfmeyer, V.; Liebert, J. Should we apply bias correction to global and regional climate model data? HESS 2012, 16, 3391–3404. [Google Scholar]
- Neher, I.; Crewell, S.; Meilinger, S.; Pfeifroth, U.; Trentmann, J. Photovoltaic power potential in West Africa using long-term satellite data. Atmos. Meas. Tech. 2020, 20, 12871–12888. [Google Scholar] [CrossRef]
- Tall, M.; Albergel, C.; Bonan, B.; Zheng, Y.; Guichard, F.; Dramé, M.S.; Gaye, A.T.; Sintondji, L.O.; Hountondji, F.C.C.; Nikiema, P.M.; et al. Towards a Long-Term Reanalysis of Land Surface Variables over Western Africa: LDAS-Monde Applied over Burkina Faso from 2001 to 2018. Remote Sens. 2019, 11, 735. [Google Scholar] [CrossRef] [Green Version]
- Dieng, D.; Cannon, A.J.; Laux, P.; Hald, C.; Adeyeri, O.; Rahimi, J.; Srivastava, A.K.; Mbaye, M.L.; Kunstmann, H. Multivariate Bias-Correction of High-Resolution Regional Climate Change Simulations for West Africa: Performance and Climate Change Implications. J. Geophys. Res. Atmos. 2022, 127. [Google Scholar] [CrossRef]
- Seaby, L.; Refsgaard, J.; Sonnenborg, T.; Stisen, S.; Christensen, J.; Jensen, K. Assessment of robustness and significance of climate change signals for an ensemble of distribution-based scaled climate projections. J. Hydrol. 2013, 486, 479–493. [Google Scholar] [CrossRef]
- Tebaldi, C.; Arblaster, J.M.; Knutti, R. Mapping model agreement on future climate projections. Geophys. Res. Lett. 2011, 38. [Google Scholar] [CrossRef]
- Pirtle, Z.; Meyer, R.; Hamilton, A. What does it mean when climate models agree? A case for assessing independence among general circulation models. Environ. Sci. Policy 2010, 13, 351–361. [Google Scholar] [CrossRef]
- Moemken, J.; Reyers, M.; Feldmann, H.; Pinto, J.G. Future changes of wind speed and wind energy potentials in EURO-CORDEX ensemble simulations MiKlip View project DFG-Project. J. Geophys. Res. Atmos. 2018, 123, 6373–6638. [Google Scholar] [CrossRef]
- Deme, A.; Gaye, A.; Hourdin, F. Climate projections in West Africa: The obvious and the uncertain. In Rural Societies in the Face of Climatic and Environmental Changes in West Africa; Sultan, B., Lalou, R., Sanni, M., Oumarou, A., Soumare, M., Eds.; IRD Editions: Marseille, France, 2017; pp. 61–86. [Google Scholar]
- Akinsanola, A.A.; Ogunjobi, K.; Abolude, A.T.; Salack, S. Projected changes in wind speed and wind energy potential over West Africa in CMIP6 models. Environ. Res. Lett. 2021, 16, 044033. [Google Scholar] [CrossRef]
- Giorgi, F.; Francisco, R. Evaluating uncertainties in the prediction of regional climate change. Geophys. Res. Lett. 2000, 27, 1295–1298. [Google Scholar] [CrossRef]


| RegCM | REMO | CCLM | |
|---|---|---|---|
| Institution | Abdus Salam International Center for Theoretical Physics (ITCP) | Climate Service Centre Germany (GERICS) | Consortium for Small-Scale Modelling (COSMO) community, the German Weather Service (DWD) |
| Microphysics | SUBEX Pal et al. [53] | Lohmann and Roeckner [61] | Doms et al. [68] |
| Cumulus convection | Tiedtke and Kain-Fritsch Tiedtke [54] Kain and Fritsch [55] | Tiedtke [54] Nordeng [62] Pfeifer [63] | Tiedtke [54] being modified by D. Mironow (DWD) |
| Planetary boundary layer | Holtslag Holtslag et al. [56] | Monin-Obukhov similarity theory Louis [64] | Herzog et al. [69] |
| Radiation scheme | Kiehl et al. [57] | Morcrette et al. [65] Giorgetta and Wild [66] | Ritter and Geleyn [70] |
| Interactive aerosols | Organic and black carbon, SO4 (Solmon et al. [58]) Dust (Zakey et al. [59]) Sea salt (Zakey et al. [60]) | No aerosol module is included. The information about aerosols, for example in the radiation scheme is based on the climatology from Tanre et al. [67]. | No aerosol module is included. |
Publisher’s Note: MDPI stays neutral with regard to jurisdictional claims in published maps and institutional affiliations. |
© 2022 by the authors. Licensee MDPI, Basel, Switzerland. This article is an open access article distributed under the terms and conditions of the Creative Commons Attribution (CC BY) license (https://creativecommons.org/licenses/by/4.0/).
Share and Cite
Ndiaye, A.; Moussa, M.S.; Dione, C.; Sawadogo, W.; Bliefernicht, J.; Dungall, L.; Kunstmann, H. Projected Changes in Solar PV and Wind Energy Potential over West Africa: An Analysis of CORDEX-CORE Simulations. Energies 2022, 15, 9602. https://0-doi-org.brum.beds.ac.uk/10.3390/en15249602
Ndiaye A, Moussa MS, Dione C, Sawadogo W, Bliefernicht J, Dungall L, Kunstmann H. Projected Changes in Solar PV and Wind Energy Potential over West Africa: An Analysis of CORDEX-CORE Simulations. Energies. 2022; 15(24):9602. https://0-doi-org.brum.beds.ac.uk/10.3390/en15249602
Chicago/Turabian StyleNdiaye, Aissatou, Mounkaila Saley Moussa, Cheikh Dione, Windmanagda Sawadogo, Jan Bliefernicht, Laouali Dungall, and Harald Kunstmann. 2022. "Projected Changes in Solar PV and Wind Energy Potential over West Africa: An Analysis of CORDEX-CORE Simulations" Energies 15, no. 24: 9602. https://0-doi-org.brum.beds.ac.uk/10.3390/en15249602