
The Mediating Role of Public Health between Environmental Policy Tools and Economic Development

1
Dong Fureng Institute of Economic and Social Development, Wuhan University, Wuhan 430072, China
2
School of Applied Economics, Renmin University of China, Beijing 100872, China
3
School of Economics and Management, North China Electric Power University, Beijing 102206, China
4
School of Economics and Management, Wuhan University, Wuhan 430072, China
*
Authors to whom correspondence should be addressed.
Energies 2022, 15(3), 835; https://0-doi-org.brum.beds.ac.uk/10.3390/en15030835
Submission received: 20 October 2021
/
Revised: 6 January 2022
/
Accepted: 6 January 2022
/
Published: 24 January 2022
(This article belongs to the Special Issue Artificial Intelligence Applications in Petroleum Supply and Management)
Abstract
:Environmental pollution damages public health and affects economic development. Environmental regulation is the main way for the government to solve environmental pollution. So what type of environmental regulation works better for public health and economic development? Can environmental regulation have an influence on economic development through public health? To solve these problems, this research uses China’s provincial panel data from 2013 to 2017 to divide environmental regulation into command-control policy tools and economic incentive policy tools and uses the mediating effect model to examine the relationship among environmental regulation, public health and economic development. The results show that: (1) There is a positive correlation between economic incentive policy tools and economic development; while no significant relationship between command-control policy tools and economic development is founded; (2) The relationship between command-control policy tools and public health is not significant, while the relationship between economic incentive policy tools and public health is positive; (3) Public health does not play a mediating role between command-control policy tools and economic development but plays a partial mediating role between economic incentive policy tools and economic development. Therefore, the government should strengthen the use of economic incentive policy tools to promote public health and sustainable economic development.
1. Introduction
1.1. Background
Since the reform and opening-up, China’s Gross Domestic Product (GDP) has achieved breakthrough growth. With the rapid economic development and the accumulation of material wealth, extensive industrialization has brought severe environmental pollution problems. According to the 2020 Global Environmental Performance Index Assessment Report, China’s environmental performance index ranks 60th from the bottom among 180 participating countries and regions. Severe environmental pollution has become a bottleneck limiting economic development. Due to the obvious externality of environmental pollution, marketization is not the solution to the environmental pollution problem [1]. Therefore, the government must regulate environmental pollution to achieve sustainable economic development, either directly or indirectly.
Public health cannot be guaranteed without a good living environment. Environmental pollution can cause some damage to public health. According to epidemiological surveys, 213,000 people suffer from pulmonary heart disease and 1.5 million from chronic bronchitis each year in China due to air pollution. Therefore, in the revised Environmental Protection Law in 2014, the protection of public health is regarded as one of the legislative purposes. Environmental regulation is an essential tool for the state to improve environmental quality, directly impacting environmental pollution. Hence, the implementation of environmental regulation can restrict the emission behaviour of polluting enterprises and effectively restrict the accumulation of pollution and protect public health.
Public health is a crucial factor influencing economic development. On the one hand, damage to public health can exacerbate the social burden of disease and affect the quality of human capital. This directly reduces attendance, social work hours, and productivity and ultimately hinders economic development. On the other hand, damage to public health promotes the emergence of the health demand market and promotes economic growth. It follows that the positive and negative effects of public health damage can directly impact economic development. At present, China is in a critical period of economic transformation and upgrading. The further growth of the economy puts forward higher and higher requirements for the quality of human capital. Promoting economic development through public health is a strategic choice that can stabilize growth, adjust the structure, and benefit both the current and the long-term. Therefore, the government should pay more attention to health in economic development and do something to promote the sustainable and stable growth of the national economy.
So what is the influence of existing environmental regulation on economic development and public health? What types of environmental regulation work better for economic development and public health? Does environmental regulation have a more profound impact on economic development through the mediating role of public health? How should the Chinese government develop its future environmental regulatory policy? The study on the above problems is not only a strong practical guide to the formulation of environmental regulation policies under the background of the new normal, but also conducive to the protection of public health, development of ecological civilization construction, and improvement of sustainable economic and social development. Therefore, this paper divides environmental regulation into command-control policy tools and economic incentive policy tools. Then, the mediating effect model is used to empirically examine the relationship among environmental regulation, public health, and economic development. On this basis, this study gives corresponding policy implications for the Chinese government to formulate objective and effective environmental regulation policies.
1.2. Literature Review
The impact of environmental regulation on economic development has always been the focus of academic circles and policy-makers. However, there are many arguments about the relationship between the two. At present, there are three kinds of arguments about the impact of environmental regulation on economic development: positive correlation, negative correlation, and uncertainty. The positive view holds that in the long run, environmental regulation pushes technological innovation of enterprises. Induce enterprises to increase investment in green innovation to achieve energy conservation, emission reduction and efficiency improvement, thus promoting economic development. For example, ref. [2] studied the influence of environmental regulation on social production and economic development by constructing an endogenous economic growth model. The outcomes showed that environmental regulation increased the average labour productivity of the productive sector and the benefits of the commodity market scale. The negative view thinks that the tightening of environmental regulations directly raises production costs, weakens enterprises’ price advantage in the market, and hinders economic development. For example, ref. [3] studied the sector efficiency of manufacturing in 48 states of the United States from 1982 to 1994 and believed that implementing environmental regulations led to low technical efficiency and inhibited economic development. The uncertain view emphasizes that the relationship between environmental regulation and economic development is difficult to determine due to industrial characteristics and environmental barriers. For example, ref. [4] used a spatial panel data model to explore the relationship between environmental regulation and economic development in the Yangtze River Delta area from 2002 to 2010. The results showed that there was an inverted U-shaped relationship between environmental regulation and economic development.
In terms of the influence of environmental regulation on public health, many scholars think that environmental regulation can improve public health. Environmental regulation can restrain the pollution behaviour of enterprises, promote the energy conservation and emission reduction of enterprises, and form an excellent ecological environment. An excellent ecological environment is conducive to the improvement of public health [5]. For example, ref. [6] studied the relationship between environmental regulatory policies and health risks. The results showed that environmental regulation was a powerful tool to reduce health risks. Ref. [7] believed that environmental regulation was an important factor in determining population health. Ref. [8] verified the positive influence of environmental regulation on public health by applying the panel data of 30 provinces in China from 2002 to 2014 based on the SEM model. Ref. [9] analysed the influence of environmental regulations on public health costs and air and water pollution using Granger causality tests. The results showed that environmental regulation has important common benefits for high-quality environmental development and public health.
In the research on public health and economic development, many studies prove that public health promotes economic development. Among them, Refs. [10,11] studied the impact of public health on economic development by applying the panel data of Chinese provinces from 1996 to 2015 and from 2006 to 2019, respectively. The results showed that public health promoted economic development. Ref. [12] used panel co-integration and Granger causality studies to analyze 20 years of panel data for 16 major states in India. The results suggested that public health contributed to economic growth in the long run. Ref. [13] used state-level data from 1963 to 2015 to study the empirical link between public health and economic development. The results suggested a positive relationship between public health and economic development, even after controlling for the offsetting effects of necessary taxation and government budget constraints. Ref. [14] conducted a comprehensive study of environmental pollutants, economic development and public health, applying data from OECD economies from 2002 to 2018. The results showed that investment in renewable energy could improve health care and promote economic development.
From the above studies, scholars at home and abroad have conducted many analyses on environmental regulation, public health, and economic development, but there are still certain research gaps. Firstly, the above studies focus on the two-dimension survey of the relationship among environmental regulation, public health, and economic development. There are few analyses on the intermediate function logic and transmission chain between environmental regulation and economic development. Secondly, most studies measure environmental regulation as a whole and do not divide environmental regulation into policy tools to explore its impact on health and the economy.
1.3. Innovation and Structure of the Paper
Compared with the existing literature, this research has two contributions. Firstly, this research introduces the mediating role of public health to explore the relationship between environmental regulation and economic development with a clearer logical chain. Secondly, environmental regulation is divided into different policy tools to explore its impact on health and economy through empirical analysis, which makes up for the blank of related research. Therefore, this paper defines what kind of policy tools is better for economic development and public health. This provides essential policy suggestions for the Chinese government to coordinate environmental construction, people’s livelihood construction, and economical construction.
2. Mechanism Analysis
2.1. Environmental Regulation and Economic Development
There are two main viewpoints about the impact of environmental regulation on economic growth: cost theory and innovation compensation theory [15]. According to the cost theory, the implementation of environmental regulation directly or indirectly increases the production cost of enterprises. The increase in cost enhances the burden on enterprises, which in turn reduces production efficiency and inhibits regional economic growth. Innovation compensation theory holds that high-intensity environmental regulation forces polluting enterprises to innovate to improve production efficiency, thus enhancing enterprise competitiveness, optimizing the industrial structure and promoting regional economic growth.
2.2. Environmental Regulation, Public Health and Economic Development
According to the health demand theory, health can be regarded as a consumer good for residents [16]. Environmental degradation increases the shadow price of health, reduces the health demand of residents, and finally leads to the decline of the health level. Environmental regulation can improve environmental quality [17]. The improvement of environmental quality can reduce the shadow price of health, increase public health demand, and promote the improvement of health levels.
According to the research results of existing literature, public health can also affect economic development in three ways. Firstly, the improvement of health level helps to improve production efficiency. At the micro-level, good health helps improve workers’ mental state, and companies can have a more productive workforce. Secondly, health affects the accumulation of physical capital. Higher life expectancy can effectively reduce the future discounted value of consumers. In this context, people not only focus on immediate benefits but also consider future consumption and increase their savings in the current period, thus increasing the accumulation of physical capital. Thirdly, health affects the accumulation of other human capital. For example, health can affect the accumulation of education, work experience. Higher levels of health mean access to higher levels of education, more work experience, which in turn affects economic growth through increased productivity.
3. Data and Methodology
3.1. Variables
3.1.1. Dependent Variables
GDP and per capita GDP are two main indicators to measure regional economic development. In China, the level of economic development varies greatly in different regions. Compared with GDP, per capita GDP excludes the influence of population and growth rate factors and is a more scientific index to measure regional economic development. Therefore, this study chooses per capita GDP as the index to measure regional economic development. The per capita GDP is calculated by the proportion of the actual GDP of each province to the total population.
3.1.2. Independent Variables
At present, there are two ways to measure environmental regulation policies: single index and multiple indexes. However, environmental regulation policies are multi-dimensional, and a single indicator cannot comprehensively measure the implementation intensity of environmental regulations [18]. Many scholars tend to use multiple secondary indicators to construct classified comprehensive indicators of environmental regulation. For example, ref. [1] constructed a combination indicator of command-control, economic incentive, and voluntary environmental regulation. Since voluntary policy tools are not commonly applied in China, most enterprises lack the awareness to voluntarily disclose environmental data [19]. Therefore, this paper mainly considers the influence of command-control tools and economic incentive tools.
Command-control policy tool is an environmental governance tool widely used in the field of environmental protection all over the world. It plays an essential role in solving ecological and environmental problems. According to neoclassical economics, the Pareto Optimality can be achieved in a perfectly competitive market. However, in reality, due to the limitations of various factors, the Pareto Optimality cannot be realized, and there is market failure in environmental problems [1]. Therefore, the government must intervene in environmental problems. The command-control policy tool is a government-led coercive environmental regulation policy. It uses laws and other administrative measures to limit pollution emissions and improve environmental quality. This paper selects the number of local cumulative effective environmental regulations, the number of administrative rules, and the number of admissible environmental administrative penalties to measure the command-control policy tool [20,21].
The economic incentive policy tool is a kind of market policy tool with an incentive effect. It guides enterprises in decision-making through market signals, directly linking their costs and benefits to environmental management practices. Give enterprises the right to make their own choices and use the minimum cost to achieve the desired environmental effect to achieve the best allocation of social resources. Environmental problems have the characteristics of externality. The way to solve environmental problems is to internalize external effects, which is also the main idea of economic incentive policy tools [22]. Economic incentive policy tools mainly include environmental protection tax, environmental trade, and subsidies. As the predecessor of environmental protection tax, pollutant discharge fee is an indicator to measure economic incentive policy tools. For environmental trade, this paper selects two proxy indicators, SO2 emission right trade and C emission right trade [23]. For subsidies, the EPS index measures the government’s actual subsidies to renewable energy power generation by the ratio of benchmark electricity price for the wind-slar generation to average electricity price. As the portion of benchmark electricity price for the wind-solar generation is higher than the benchmark electricity price for local coal-fired units, the Chinese government gives subsidies [24]. Therefore, inspired by the EPS index, this paper selects the proportion of benchmark electricity price for the wind-solar generation to the benchmark electricity price for local coal-fired units to measure the actual degree of government subsidies.
This paper adopts a comprehensive indicator construction method to construct command-control environmental regulation comprehensive indicators and economic incentive environmental regulation comprehensive indicators, respectively [25,26].
First, as in Equation (1), the paper standardises the various individual indicators. Where, is the original value of index j in area i; and represent the maximum and minimum values of index j in all provinces, respectively; is the standardized value of index j.
Second, this paper uses the index reflecting the regional industrial scale and the number of enterprises to calculate the adjustment coefficient. This could partly avoid the potential distortion of indicators to the actual situation. As in Equation (2), is the adjustment coefficient of index j in area i, and are the variables that are supposed to control the possible influencing factors. For command-control policy tools, and are represented by industrial value added and the number of industrial enterprises above the size respectively, a bigger value for command-control policy tools literally means the higher efficiency or scale effect of firms, which generally means more government involvement in China’s political and economic system. For economic incentive policy tools, and are scaled by total GDP and industrial GDP instead, this is supposed to adjust the potential influences of industrial structure to the measured policy tools.
Finally, as in Equation (3), this paper calculates environmental regulation intensity for command-control policy tools and economic incentive policy tools respectively. Where, represents the intensity of different types of environmental regulations in area ; denotes different types of environmental regulation; denotes the number of basic indicators.
3.1.3. Mediator Variables
When checking the mediating role of public health between environment regulation and economic development, the common practice for the measurement of public health is to use relevant variables [27]. Among all proxy variables, the total health expenditure is one of the most effective indicators to measure a country’s medical and health status, which reflects national support for health and the importance people attach to health. For example, Refs. [28,29] show that the investment of health resources does not worsen national health but rather contributes to its improvement.
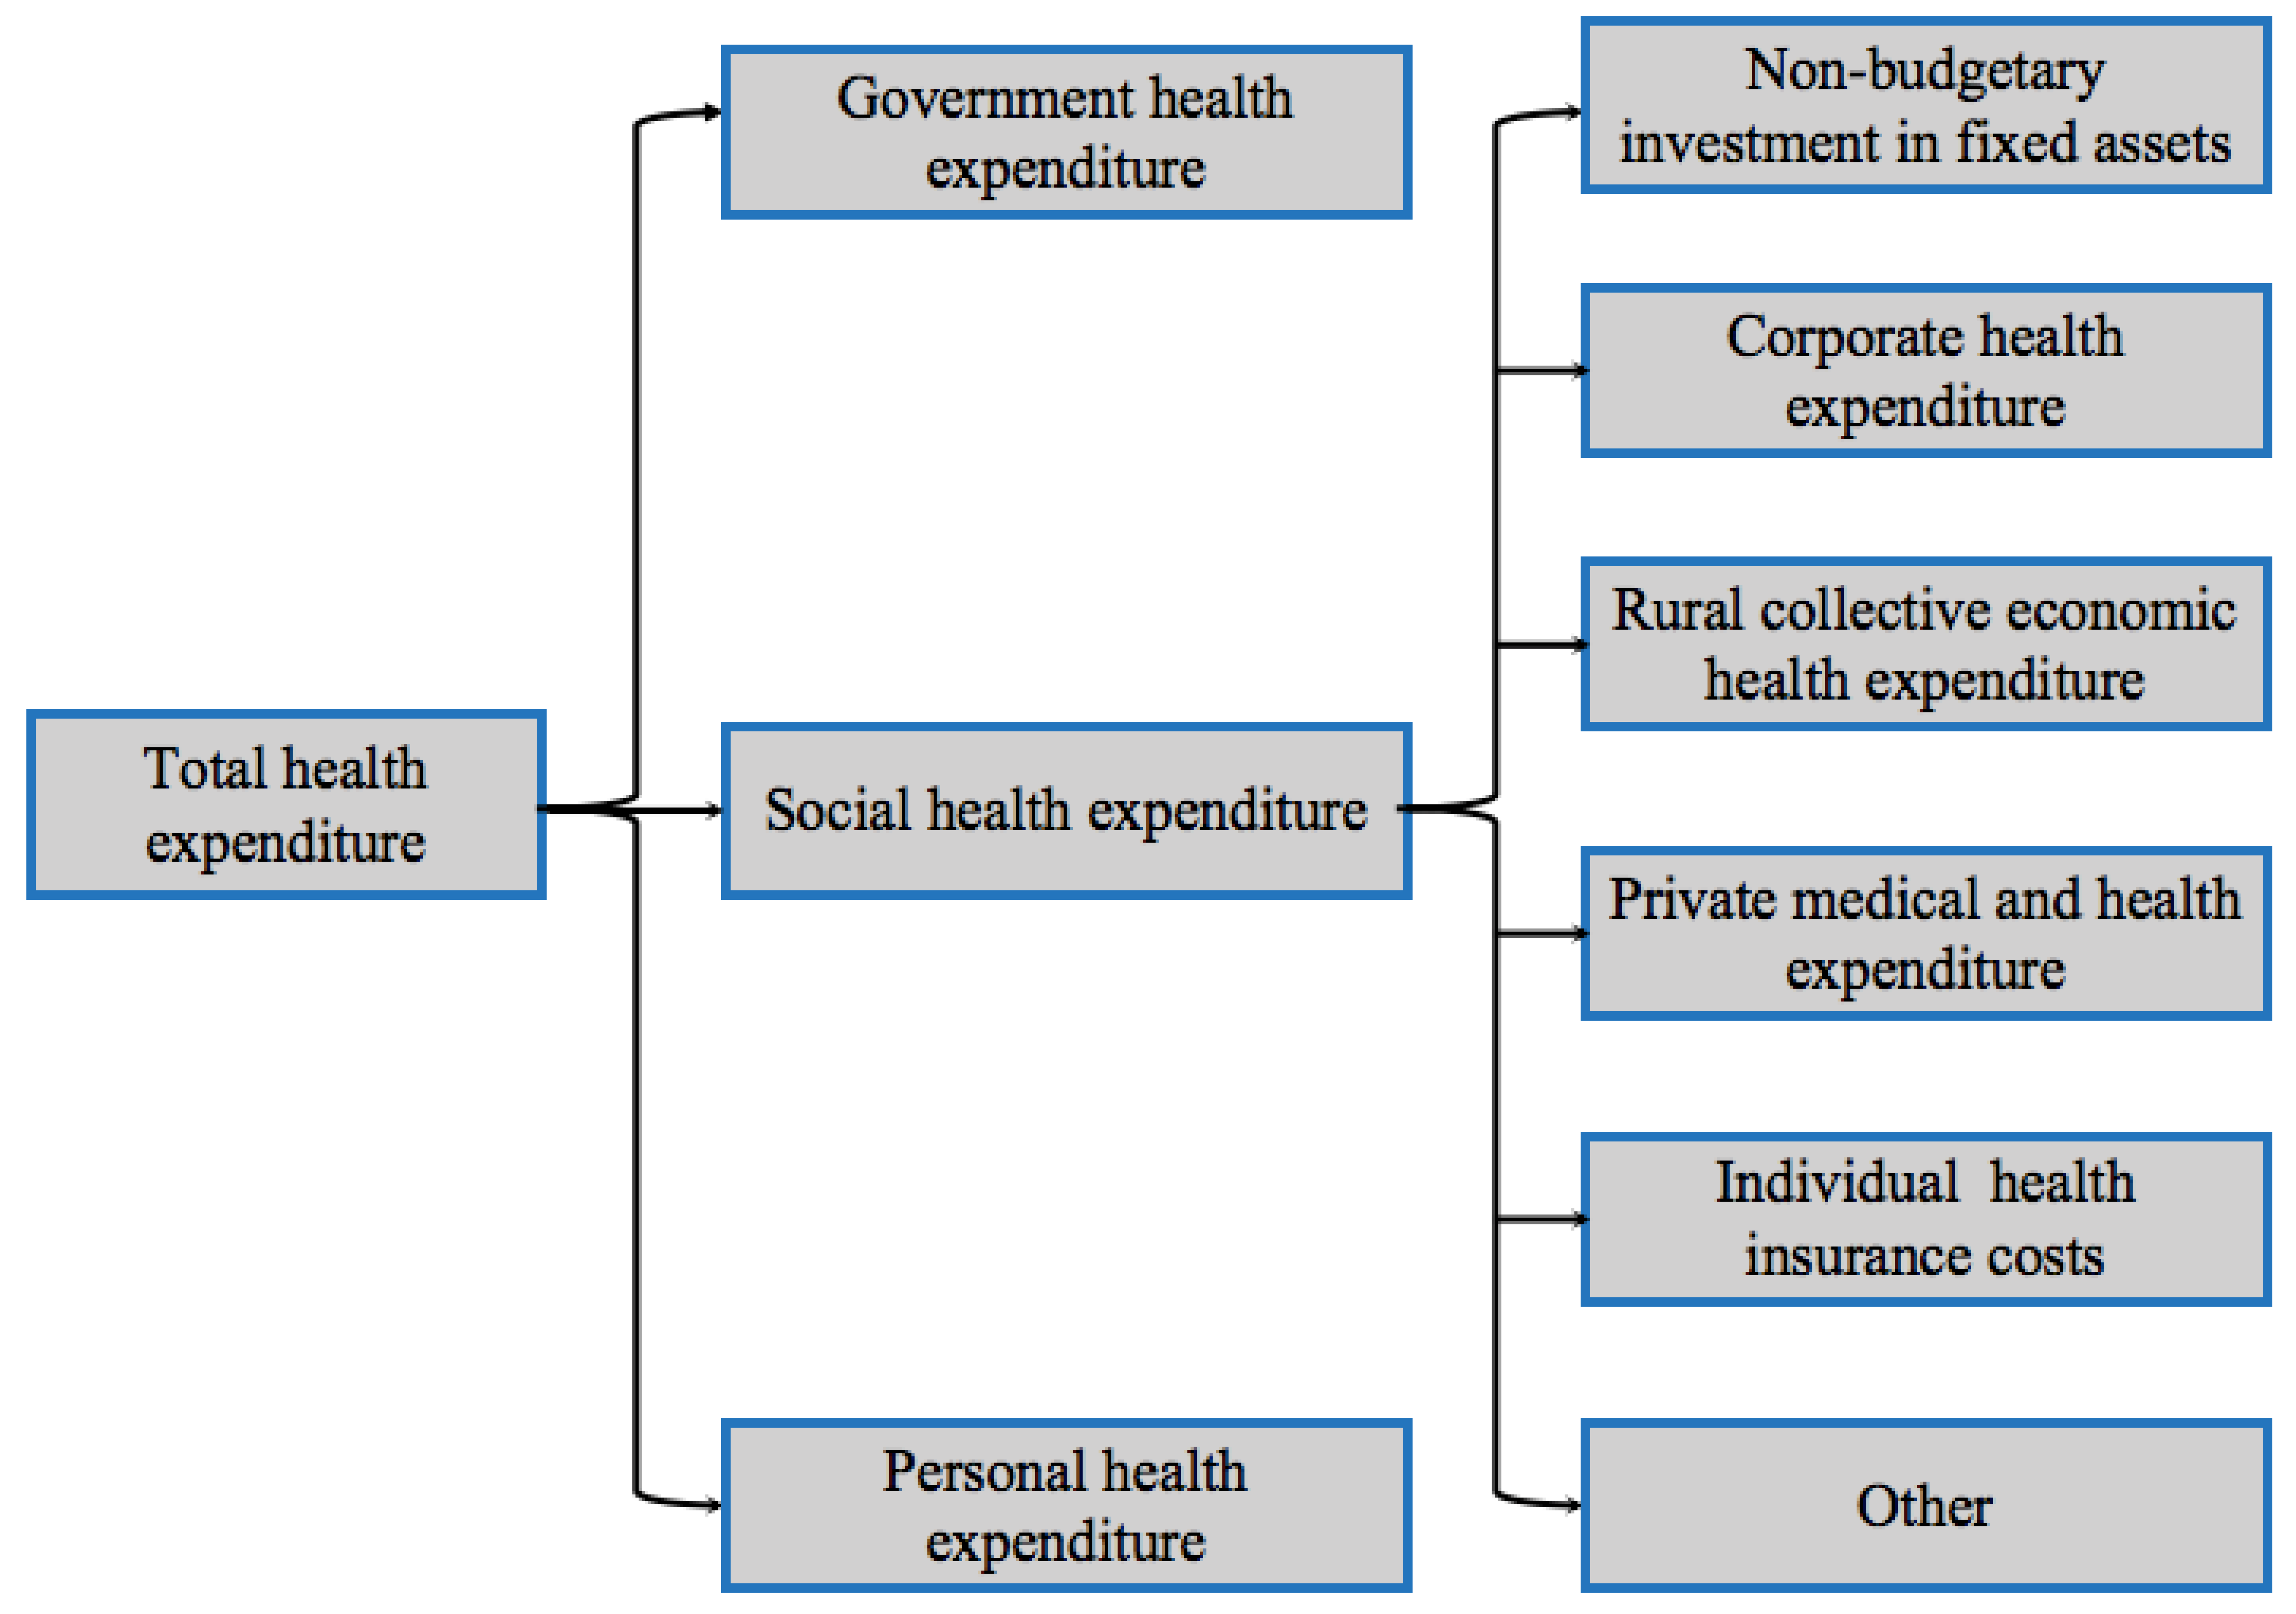
However, the public health could be better scaled by using actual public health indicators, and the real effect of public health on environment and economy can thus be tested further. Plus, using health expenditure as a proxy variable may suffer from the problem of preset conclusion. As shown in Figure 1, the total health expenditure consists of three components: government health expenditure, social health expenditure, and personal health expenditure. Intuitively, as these categories of expenditure relate to the government control, public investment, and personal health respectively, it can be easily linked to the existence of the mediating role of total health expenditure on environment and economy. As a result, we use provincial death rate to measure the public health, and it is more suitable than some specific morbidity and mortality indicators considering other data used in this work.
3.1.4. Control Variables
The quantity and quality of elemental inputs are essential factors influencing economic development. Based on current research on the factors affecting economic development and the reality of China, this research selects capital, labour productivity, technological progress, urbanization level and environmental quality as the control variables of the model. Table 1 shows the detailed definitions of the control variables. Note that the environmental quality is scaled by the Days of Air Quality Equal to or Above Grade II (based on Technical regulation on ambient air quality index (HJ633-2012)).
3.2. Econometric Model
It is sometimes necessary to add the square items of the core explanatory variables to capture the non-linear relationship between the main dependent and independent variables. The choice of square items could be based on experience, theoretical ground or empirical evidence, etc. In order to avoid subjective judgement, some use a preliminary fitness curve to determine whether a U shape or an inverted U shape exist. However, for the short panel data used in this paper, it is not proper to use this method. We then adopt an alternative and conservative strategy to determine whether to add the square term. That is, we fitted the relationship between independent variables and two main dependent variables, and then we determined whether to consider the nonlinear relationship in our econometric model by the gradient of the curve. For example, Figure 2 and Figure 3 show the scatter plots between command-control policy tools and economic-incentive policy tools and economic development, respectively. The fitted line in Figure 2 is sharp, this indicates that it is very likely that there is a high dimensional relationship between command-control policy tools and economic development. Whereas, the curve in Figure 3 is relatively smooth, it is insufficient to make further judgment.
Therefore, this paper introduces the square term of command-control policy tools into the model, takes economic development as the dependent variable, takes command-control policy tools and economic incentive policy tools as the core explanatory variables, and takes public health as the mediator variable to examine the role of environmental regulation policy tools in economic development and whether there is a mediating effect of public health. At the same time, to better fit the regression model, this paper introduces capital, labour productivity, technological progress, urbanization level and environmental quality as control variables into the regression equation.
This study uses the mediating effect model [30] to examine the relationship among environmental regulation, public health and economic development and establishes the following three models, as shown in Figure 4.
Equation (4) represents the relationship between environmental regulation and economic development when no mediating variables are included. Equation (5) tests the relationship between public health and environmental regulation. Equation (6) incorporates public health into Model 1 to test for the presence of public health mediating effects. In the above formula, i represent area, t represent time; denotes constant coefficient; are all the parameters to be estimated; represents individual fixed effects; represents time fixed effects; represents the random error term; ED denotes economic development level; CC denotes command-control policy tools; CCS denotes the squared term for command-control policy tools; EI denotes economic incentive policy tools; FA denotes the capital investment; LP stands for labor productivity; TI denotes technological progress; CL denotes urbanization level; EQ denotes environmental quality; PH denotes the level of public health.
3.3. Data Sources
In 2013, a series of important changes took place in China’s environmental protection system. China’s National Development and Reform Commission divided the country into three types of solar energy resource areas for pricing. At the same time, China has also started the pilot work of the carbon trading market. Therefore, given data availability, this research selects the panel data of 29 Chinese provinces except for Xinjiang, Tibet, Taiwan, Hong Kong, and Macao from 2013 to 2017.
Table 2 reveals descriptive statistics of the variables. Among them, the data for solar photovoltaic benchmark feed-in tariff, wind power benchmark feed-in tariff, and coal-fired unit benchmark feed-in tariff by province are from WIND database; the data on the number of patent applications are from the Chinese Patent Online Databases; the rest of the data are from China Environment Yearbook [31], China Health Statistics Yearbook [32], China Statistics Yearbook [33] and China Statistics Yearbook on Science and Technology [34].
4. Empirical Analysis and Discussion
4.1. Impact of Environmental Regulation on Economic Development
When dealing with panel data, this research should primarily determine whether to choose a fixed-effects model or a random-effects model. According to Table A1 in Appendix A, the F-test for Model 1 indicates that the fixed-effects model outperforms the mixed fixed-effects model. According to Table A2 in Appendix A, the Hausman test results of Model 1 reveal that the fixed-effects model outperforms the random-effect model. Therefore, this research selects the fixed-effects model for regression. Table 3 reveals the regression results of Model 1.
In Model 1, the regression coefficient of the economic incentive policy tool is significantly positive at the 5% level, economic incentive policy tools significantly positively influence economic development. Economic incentive policy tools give enterprises a higher degree of freedom of choice and enable them to make optimal choices with their own economic efficiency [35]. This helps reduce the environmental costs and improve the technological level of enterprises, thus maximizing the economic and environmental benefits for society as a whole.
The regression coefficients of the first-order and squared terms of the command-control policy tool are both positive, which are not significant. In the model without mediating variables, the relationship between command-control policy tools and economic development neither presents a U-shaped or an inverted U-shaped relationship. This is less intuitive, as the regulatory approach of command-control policy tools reflects the coercive nature of government in managing environmental pollution problems. Enterprises have to adjust their production modes to fulfil the required energy saving and emission reduction tasks. In the short term, command-control policy tools can quickly show the effects of regulation. However, in the long run, command-control policy tools tend to lack flexibility and easily cause policy failure, which leads to the gradual weakening of the government’s regulatory effect. We argue that this may be resulted from our data sample. As data availability, this paper only adopts a 5-year short panel data, which means some longer effects could be missed. In other means, even though there is an inverted U shape relationship between environmental regulation and economic development, the sample is not long enough to capture that.
4.2. Impact of Environmental Regulation on Public Health
The F-test and Hausman test results of Model 2 reveal that the fixed-effects model should be selected for regression. Although the regression results considering fixed effects reports a significant relationship between EI and ED and thus supports the existence of mediating effect, the goodness of fit is unacceptable (R2 below 0.1). So, we use OLS estimator for Model 2 as an alternative, Table 4 reveals the regression results of Model 2.
In Model 2, the regression coefficient of command-control policy tools is not significant; The regression coefficient of the economic incentive policy tool is significantly negative at the 1% level. This suggests that command-control policy tools have no significant influence on public health; economic incentive policy tools significantly positively affect public health.
Command-control policy tools mostly use coercive means such as laws to control environmental pollution. Although command-control policy tools can achieve pollution control quickly, they suffer from efficiency shortcomings. Command-control policy tools require the government to have a lot of information to formulate appropriate environmental pollution standards. The government usually adopts completely uniform standards for enterprises of different natures, scales, and regions for a long time. Such rules fail to efficiently allocate the emission level of pollutants among enterprises, hinder the implementation of environmental regulations, and ultimately lead to the insignificant effect of command-control policy tools on public health. In contrast to command-control policy tools, economic incentive policy tools can provide direct economic incentives to actors through other measures such as sewage charges. The sewage charges are decided by the number of emissions from the enterprise. This can directly establish the relationship between policy and behaviour and then realize the purpose of environmental protection legislation to protect public health.
4.3. Impact of Environmental Regulation on Economic Development Considering Mediating Role of Public Health
According to Table A1 in Appendix A, the F-test for Model 3 indicates that the fixed-effects model outperforms the mixed fixed-effects model. According to Table A2 in Appendix A, the Hausman test results of Model 3 reveal that the fixed-effects model outperforms the random-effect model. Therefore, this research selects the fixed-effects model for regression. Table 5 reveals the regression results of Model 3.
The test results of Model 2 show that command-control policy tools have no significant impact on public health. Therefore, public health has no mediating effect between command-control policy tools and economic development. Then, this study analyses the mediating effect of economic incentive policy tools. In Model 3, the impact of public health on economic development is not significant, so we further conduct Bootstrapping test (Table A3), which confirms that public health is the mediation variable of economic incentive policy tools affecting economic development and plays the partial mediating effect. Meanwhile, the regression coefficient of economic incentive policy tools is significantly positive at the 5% level. This indicates that after the mediating variable public health is included in Model 1, economic incentive policy tools still have a significant positive impact on economic development.
The economic incentive policy tool encourages enterprises to choose between the emission cost and benefit by charging or subsidizing, which determines enterprises’ production technology level and pollution volume. On the one hand, economic incentive policy tools can directly motivate enterprises to engage in technological innovation and promote economic development. On the other hand, the implementation of economic incentive policy tools can effectively improve environmental quality. According to Grossman’s health demand theory, health can be regarded as consumer goods for residents [16]. Improvements in environmental quality can reduce the shadow price of health, lead to the rise of public health demand, and promote economic development. Therefore, economic incentive policy tools can directly affect economic development and indirectly affect economic development through public health.
5. Conclusions and Policy Implications
Most of the existing literature focuses on the two dimensions of environmental regulation, public health and economic development. However, there is little analysis of the intermediate effect between environmental regulation policy and economic development. Moreover, the existing literature often ignores the differences between different policy tools when measuring environmental regulation. Therefore, this paper divides environmental regulation policy into command-control policy tools and economic incentive policy tools and uses the mediating effect model to empirically examine the relationship among environmental regulation, public health and economic development. The conclusions are as follows: (1) There is a positive correlation between economic incentive policy tools and economic development; while no significant relationship between command-control policy tools and economic development is founded; (2) The relationship between command-control policy tools and public health is not significant, while the relationship between economic incentive policy tools and public health is positive; (3) Public health does not play a mediating role between command-control policy tools and economic development, but plays a partial mediating role between economic incentive policy tools and economic development.
Based on the above findings, this research gives the following suggestions:
- (1)
- Determine the appropriate environmental regulation intensity. There is an insignificant relationship between command-control policy tools and economic development whereas a positive relationship between economic incentive policy tools and economic development. Therefore, while the government should set reasonable environmental quality standards, pollution emission limits and other mandatory environmental regulations to promote economic development, it should further strengthen economic incentive regulations such as sewage charges and subsidies. By adjusting the intensity of environmental regulation, we can promote economic development from the two levels of government and market.
- (2)
- The regulation mode should move from control to incentive. Command-control policy tools achieve environmental governance primarily through a dualistic pattern of government control over the business. The relationship between the two is command and obedience, standard and compliance, violation and punishment [36]. Although, in the short term, command-control policy tools have an implementation effect, the (long term) effectiveness of environmental governance is unsure from this study. In contrast, economic incentive policy tools can fundamentally motivate enterprises to energy conservation and environmental protection and improve the public health level and economic growth. Therefore, the regulatory approach should move from control to incentive.
- (3)
- Strengthen investment in the health care sector. While the focus is on economic development, more attention should be given to public health. Firstly, at the level of government health expenditure, local governments should optimise the fiscal expenditure structure and appropriately expand the scale of government health expenditure to achieve a positive interaction between economic development and the improvement of people’s livelihood. Secondly, at the level of social health expenditure, the government should promote the health insurance system in an all-around way. Strengthen the interface between various social health insurance systems, appropriately increase the relevant financial subsidies and improve the financial compensation mechanism. Finally, at the level of personal health expenditure, the government should establish an effective reimbursement system for medical expenses and increase financial support for vulnerable groups.
Author Contributions
W.P. and M.X. contributed to study design. W.-Q.D., H.X., G.H., W.-L.P. and C.H. collected and analysed the data. H.X. interpreted results. W.P., and M.X. wrote the manuscript. W.-L.P. conducted the review. All authors have read and agreed to the published version of the manuscript.
Funding
This research was funded by the National Natural Science Foundation of China (NSFC) (Grant No. J2024015, 71871169, U1933120) and supported by the fund for building world-class universities (disciplines) of Renmin University of China. Project No. KYGJC2021005.
Data Availability Statement
Data is contained within the article.
Conflicts of Interest
The authors declare no conflict of interest.
Appendix A

Table A1.
F test.
| Fixed Effect Test | Model 1 | Model 2 | Model 3 |
|---|---|---|---|
| Statistic Prob | 19.419 | 26.937 | 18.006 |
| 0.000 *** | 0.000 *** | 0.000 *** |
Significance code: “***” 1%.
Table A2.
Hausman test.
| Random Effect Test | Model 1 | Model 2 | Model 3 |
|---|---|---|---|
| Statistic Prob | 86.208 | 16.913 | 22.961 |
| 0.000 *** | 0.031 ** | 0.006 *** |
Significance code: “**” 5%, “***” 1%.
Table A3.
Bootstrapping test.
| Estimate | 95%CI Lower | 95%CI Upper | p-value | |
|---|---|---|---|---|
| ACME | 0.4747 | 0.1329 | 0.95 | 0.004 ** |
| ADE | 1.8173 | 1.0538 | 2.56 | 0.000 *** |
| TOTAL | 2.292 | 1.4213 | 3.28 | 0.000 *** |
| Prop. Mediated | 0.2024 | 0.0717 | 0.36 | 0.004 ** |
| Sample Size Used: 145; Simulations: 1000 | ||||
Significance code: “**” 5%, “***” 1%.
References
- Zhao, X.; Meng, X.; Zhou, Y.; Li, P. Policy inducement effect in energy effi-ciency: An empirical analysis of China. Energy 2020, 211, 148–196. [Google Scholar]
- Tang, J.; Zhong, S.; Xiang, G. Environmental Regulation, Directed Technical Change, and Economic Growth: Theoretic Model and Evidence from China. Int. Reg. Sci. Rev. 2019, 42, 519–549. [Google Scholar] [CrossRef]
- Chintrakam, P. Environmental regulation and US states’ technical inefficiency. Econ. Lett. 2008, 100, 363–365. [Google Scholar] [CrossRef]
- Cao, Y.; Wan, N.; Zhang, H.; Zhang, X.; Zhou, Q. Linking environmental regulation and economic growth through technological innovation and resource consumption: Analysis of spatial interaction patterns of urban agglomerations. Ecol. Indic. 2020, 112, 106062. [Google Scholar] [CrossRef]
- Gao, J.; Woodward, A.; Vardoulakis, S.; Kovats, S.; Wilkinson, P.; Li, L.; Xua, L.; Liag, J.; Yanga, J.; Li, J.; et al. Haze, public health and mitigation measures in China: A review of the current evidence for further policy response. Sci. Total Environ. 2017, 578, 148–157. [Google Scholar] [CrossRef]
- McKelvey, W.; Blank, J.; Kheirbek, I.; Torin, B. Using Tracking Data to Promote Environmental Public Health Through Regulatory and Legislative Processes in New York City. J. Public Health Manag. Pract. 2017, 23, S32–S38. [Google Scholar] [CrossRef]
- Samet, J.; Burke, A. Deregulation and the Assault on Science and the Environment. Annu. Rev. Public Health 2020, 41, 347–361. [Google Scholar] [CrossRef] [Green Version]
- Lu, Z.N.; Chen, H.; Hao, Y.; Wang, J.; Song, X.; Mok, T.M. The dynamic relationship between environmental pollution, economic development and public health: Evidence from China. J. Clean. Prod. 2017, 166, 134–147. [Google Scholar] [CrossRef]
- Tang, L.; Li, K.; Jia, P. Impact of Environmental Regulations on Environmental Quality and Public Health in China: Empirical Analysis with Panel Data Approach. Sustainability 2020, 12, 623. [Google Scholar] [CrossRef] [Green Version]
- Haini, H. Spatial spillover effects of public health and education expenditures on economic growth: Evidence from China’s provinces. Post-Communist Econ. 2020, 32, 1111–1128. [Google Scholar] [CrossRef]
- Li, X.; Chen, F.; Hu, S. Spatial Spillover Effect of Government Public Health Spending on Regional Economic Growth during the COVID-19 Pandemic: An Evidence from China. Complexity 2021, 2021, 5552552. [Google Scholar] [CrossRef]
- Mohapatra, S. Economic growth, public expenditure on health and IMR in India An econometric investigation of causal linkages. Int. J. Soc. Econ. 2017, 44, 2002–2018. [Google Scholar] [CrossRef]
- Atems, B. Public health expenditures, taxation, and growth. Health Econ. 2019, 28, 1146–1150. [Google Scholar] [CrossRef]
- Mujtaba, G.; Shahzad, S. Air pollutants, economic growth and public health: Implications for sustainable development in OECD countries. Environ. Sci. Pollut. Res. 2021, 28, 12686–12698. [Google Scholar] [CrossRef]
- Meng, X. Research on technological innovation effect of environmental regulation from perspective of industrial transfer: Evidence in China’s thermal power industry. Clean. Eng. Technol. 2021, 4, 100178. [Google Scholar]
- Grossman, M. On the Concept of Health Capital and the Demand for Health. J. Polit. Econ. 1972, 80, 223–255. [Google Scholar] [CrossRef] [Green Version]
- Chen, S.; He, L. Environment, Health and Economic Growth: An optimal allocation of energy tax revenues. Econ. Res. 2017, 4, 120–134. [Google Scholar]
- Brunel, C.; Levinson, A. Measuring the stringency of environmental regulations. Rev. Environ. Econ. Policy 2016, 10, 47–67. [Google Scholar] [CrossRef]
- Li, D. The interaction of regulation policy instruments, environmental technological innovation and performance. Stud. Sci. Sci. 2018, 36, 2270–2279. [Google Scholar]
- Bo, W.; Xu, W.; Wang, J. Local government competition and environ-mental regulation heterogeneity: Race to the bottom or race to thetop? China Soft Sci. 2018, 11, 76–93. [Google Scholar]
- Chen, Z.; Kahn, M.; Liu, Y.; Wang, Z. The consequences of spatially differentiated water pollution regulation in China. J. Environ. Econ. Manag. 2018, 88, 468–485. [Google Scholar] [CrossRef]
- Xiao, Y.; Yong, L. Effect of environmental regulation policy tools on the quality of foreign direct investment: An empirical study of China. J. Clean. Prod. 2020, 270, 122346. [Google Scholar]
- Shen, C.; Li, S.; Huang, L. Different types of environmental regulation and the green transformation of Chinese industry: Path selection and mechanism analysis. Nankai Econ. Stud. 2018, 5, 95–114. [Google Scholar]
- Dong, C.; Zhou, R.; Li, J. Rushing for subsidies: The impact of feed-in tariffs on solar photovoltaic capacity development in China. Appl. Energy 2021, 281, 116007. [Google Scholar] [CrossRef]
- Han, G.; Shao, Z. The impact of environmental regulation and Local Government competition Strategy on overcapacity. Res. Financ. Econ. Issues 2020, 3, 29–38. [Google Scholar]
- Ren, S.; Jiang, T.; Li, X.; Yuan, B. Differentiation mechanism of impacts of environmental regulation types on regional ecological efficiency in China. Econ. Manag. 2016, 38, 157–165. [Google Scholar]
- Qu, W.; Yan, Z. The influence of environmental pollution, economic growth and healthcare services to public health based on China’s provincial panel data. Chin. J. Manag. Sci. 2015, 23, 166–176. [Google Scholar]
- Barnato, A.; Chang, C.; Farrell, M.; Lave, J.; Roberts, M.; Angus, D. Is Survival better at Hospitals with Higher “End-of-life” Treatment Intensity? Med. Care 2010, 2, 125–132. [Google Scholar] [CrossRef] [Green Version]
- Li, Y.; Cheng, Q.; Zhang, S. Health Expenditure Scale Regional Difference and Health of Residents:Based on the Analysis of CLDS Survey Data. Northwest Popul. J. 2020, 41, 104–115. [Google Scholar]
- Wen, Z.; Liu, H.; Hou, J. Moderating Effect and Mediating Effect Analysis; Education Science Press: Hong Kong, China, 2012. [Google Scholar]
- National Bureau of Statistics of China (NBSC-a). China Environment Yearbook; China Statistics Press: Beijing, China, 2013–2017.
- National Bureau of Statistics of China (NBSC-b). China Health Statistics Yearbook; Peiking Union Medical College Press: Beijing, China, 2013–2017.
- National Bureau of Statistics of China (NBSC-c). China Statistical Yearbook; China Statistics Press: Beijing, China, 2013–2017.
- National Bureau of Statistics of China (NBSC-d). China Statistical Yearbook on Science and Technology; China Statistics Press: Beijing, China, 2013–2017.
- Cools, M.; Moons, E.; Janssens, B.; Wets, G. Shifting towards environment-friendly modes: Profiling travelers using Q-methodology. Transportation 2009, 36, 437–453. [Google Scholar] [CrossRef]
- Liu, C. Regulation, interaction and environmental pollution by a third party. China Popul. Resour. Environ. 2015, 25, 96–104. [Google Scholar]
Figure 1.
Method of dividing China’s national health accounts.

Figure 2.
Scatterplot between command-control policy tools and economic development.

Figure 3.
Scatterplot between economic incentive policy tools and economic development.

Figure 4.
Research model.

Table 1.
Definitions of control variables.
| Control Variables | Variable Meaning |
|---|---|
| Capital | Investment in fixed assets after deflating |
| Labour productivity | the level of education per capita |
| Technological progress | Number of patent applications |
| Urbanization level | Urbanisation level statistics |
| Environmental quality | Days of “good” air quality |
Table 2.
Descriptive statistics.
| Variable | Explanation | Mean | Std.Dev | Min | Max |
|---|---|---|---|---|---|
| ED | Per capita GDP (ten thousand yuan) | 5.495 | 2.453 | 2.315 | 12.899 |
| CC | Command-control environmental regulation comprehensive indicators | 0.147 | 0.185 | 0.001 | 1.102 |
| EI | Economic incentive environmental regulation comprehensive indicators | 0.301 | 0.190 | 0.052 | 0.957 |
| FA | Investment in fixed assets after deflating (trillion yuan) | 11.407 | 6.964 | 1.952 | 29.688 |
| LP | Per capita education years | 9.182 | 0.901 | 7.474 | 12.665 |
| TI | Number of patent applications (million) | 9.480 | 12.105 | 0.1099 | 62.783 |
| CL | Urbanization level | 0.580 | 0.120 | 0.378 | 0.896 |
| EQ | Environmental quality (hundred day) | 2.545 | 0.574 | 1.282 | 3.610 |
| PH | Death rate (%) | 6.137 | 0.741 | 4.320 | 7.400 |
| Note: N = 145 | |||||
Table 3.
Regression results of Model 1.
| Model 1 | |
|---|---|
| CC | 0.298 (0.463) |
| CCS | 0.245 (0.613) |
| EI | 1.420 ** (0.626) |
| FA | 0.908 *** (0.129) |
| LP | 0.972 *** (0.200) |
| TI | −0.019 (0.015) |
| CL | −1.678 (3.076) |
| EQ | 0.199 (0.156) |
| Number of observations | 145 |
| R2 | 0.752 |
Significance code: “**” 5%, “***” 1%.
Table 4.
Regression results of Model 2.
| Model 2 | |
|---|---|
| CC | 0.309 (0.687) |
| CCS | −0.360 (0.916) |
| EI | −0.814 *** (0.307) |
| FA | 0.044 *** (0.012) |
| LP | −0.200 (0.142) |
| TI | −0.020 *** (0.007) |
| CL | −1.206 (1.040) |
| EQ | −0.120 (0.116) |
| Constant | 8.893 *** (1.025) |
| Number of observations | 145 |
| R2 | 0.376 |
Significance code: “***” 1%.
Table 5.
Regression results of Model 3.
| Model 3 | |
|---|---|
| CC | 0.300 (0.466) |
| CCS | 0.237 (0.617) |
| EI | 1.443 ** (0.636) |
| FA | 0.905 *** (0.130) |
| LP | 0.973 *** (0.201) |
| TI | −0.018 (0.015) |
| CL | −1.721 (3.095) |
| EQ | 0.032 (0.143) |
| PH | 0.199 (0.156) |
| Number of observations | 145 |
| R2 | 0.752 |
Significance code: “**” 5%, “***” 1%.
Publisher’s Note: MDPI stays neutral with regard to jurisdictional claims in published maps and institutional affiliations. |
© 2022 by the authors. Licensee MDPI, Basel, Switzerland. This article is an open access article distributed under the terms and conditions of the Creative Commons Attribution (CC BY) license (https://creativecommons.org/licenses/by/4.0/).
Share and Cite
MDPI and ACS Style
Xu, H.; Pan, W.; Xin, M.; Hu, C.; Pan, W.-L.; Dai, W.-Q.; Huang, G. The Mediating Role of Public Health between Environmental Policy Tools and Economic Development. Energies 2022, 15, 835. https://0-doi-org.brum.beds.ac.uk/10.3390/en15030835
AMA Style
Xu H, Pan W, Xin M, Hu C, Pan W-L, Dai W-Q, Huang G. The Mediating Role of Public Health between Environmental Policy Tools and Economic Development. Energies. 2022; 15(3):835. https://0-doi-org.brum.beds.ac.uk/10.3390/en15030835
Chicago/Turabian StyleXu, Hui, Wei Pan, Meng Xin, Cheng Hu, Wu-Lin Pan, Wan-Qiang Dai, and Ge Huang. 2022. "The Mediating Role of Public Health between Environmental Policy Tools and Economic Development" Energies 15, no. 3: 835. https://0-doi-org.brum.beds.ac.uk/10.3390/en15030835
Note that from the first issue of 2016, this journal uses article numbers instead of page numbers. See further details here.