Article

A Heuristic Charging Cost Optimization Algorithm for Residential Charging of Electric Vehicles

1
Department of Electrical and Electronic Engineering, Data Science Institute, National University of Ireland Galway, H91 TK33 Galway, Ireland
2
National Mobile Communications Research Laboratory, Southeast University, Nanjing 210096, China
3
Department of Computer Science, Attock Campus, COMSATS University Islamabad, Attock 43600, Pakistan
4
College of Science and Engineering, National University of Ireland Galway, H91 TK33 Galway, Ireland
5
Department of Computer Science, Shangla Campus, University of Swat, Shangla 19100, Pakistan
6
Mathematics, Physics and Electrical Engineering, City Campus, Northumbria University, Newcastle upon Tyne NE1 8ST, UK
7
School of Computer Science, National University of Ireland Galway, H91 TK33 Galway, Ireland
*
Author to whom correspondence should be addressed.
Submission received: 5 January 2022 / Revised: 31 January 2022 / Accepted: 7 February 2022 / Published: 11 February 2022
(This article belongs to the Special Issue Optimization for Charging and Discharging of Electric Vehicles)

Abstract

:
The charging loads of electric vehicles (EVs) at residential premises are controlled through a tariff system based on fixed timing. The conventional tariff system presents the herding issue, such as with many connected EVs, all of them are directed to charge during the same off-peak period, which results in overloading the power grid and high charging costs. Besides, the random nature of EV users restricts them from following fixed charging times. Consequently, the real-time pricing scenarios are natural and can support optimizing the charging load and cost for EV users. This paper aims to develop charging cost optimization algorithm (CCOA) for residential charging of EVs. The proposed CCOA coordinates the charging of EVs by heuristically learning the real-time price pattern and the EV’s information, such as the battery size, current state-of-charge, and arrival & departure times. In contrast to the holistic price, the CCOA determines a threshold price value for each arrival and departure sequence of EVs and accordingly coordinates the charging process with optimizing the cost at each scheduling period. The charging cost is captured at the end of each charging activity and the cumulative cost is calculated until the battery’s desired capacity. Various charging scenarios for individual and aggregated EVs with random arrival sequences of EVs against the real-time price pattern are simulated through MATLAB. The simulation results show that the proposed algorithm outperforms with a low charging cost while avoiding the overloading of the grid compared to the conventional uncoordinated, flat-rate, and time-of-use systems.

1. Introduction

Global warming affects human life in various ways, such as increasing temperature, rising sea levels, and severe floods. It is mainly caused by the massive CO2 emission from petroleum, natural gas, coal, geothermal, and automobile industries due to internal combustion engines (ICEs) automobiles discharging unhealthy CO2. Cars and trucks emit almost 26%, while other transportation methods account for about 12% of carbon dioxide emissions [1]. In the USA, transportation is the second-largest source (34%) of CO2 emission, where light-duty vehicles (passenger cars and light trucks) and medium- and heavy-duty vehicles are responsible for almost 60% and 23%, respectively [2]. In 2019 about 1817 MMT emission of CO2 from the transportation sector was recorded by the US department of energy [3]. Besides, the transportation sector is heavily dependent on the use of fossil fuels. Consequently, the automobile industry is rapidly moving towards electrified transportation, reducing CO2 and dependencies on fossil fuels. Electric vehicles (EVs) possess numerous potential advantages over traditional vehicles, such as being environment friendly, the low cost of fuel, safety, being reliable, compact, and lightweight [4]. The EVs can be used as a distributed storage and could support power grid and microgrids, especially during peak demand through vehicle-to-grid (V2G) technology [5]. However, a large-scale penetration of EVs overloads the power grid with additional power demand, which may cause overloading of the transformer, feeder congestion, circuit faults, and instability in the overall grid operation [6]. The additional power demand requires the installation of new power generating sources and upgrading the existing power grid. However, this is not a feasible option, due to the high generation and infrastructure upgrade cost. A more feasible option is to shift the charging load from on-peak to off-peak time, assuming that the EVs are plugged in for charging in the evening after arrival at home [7]. This case takes advantage of the electricity tariff system and the dwell time of EVs to shift the charging load from on-peak to off-peak times and thereby respecting the grid operational boundaries. The utility companies provide different tariff systems with peak, mid-peak, and off-peak rates for customer convenience. These tariff systems provide fixed prices for specific times known as a time-of-use (TOU) tariff system. EV owners have the choice to either charge their EVs with or without fixed rate tariff systems. However, due to the uncertain nature of EV owners, it is difficult for them to follow the fixed TOU system. Besides, due to the fixed prices, the EVs herd toward the off-peak period, which results in overloading the grid [8]. Therefore, compared to the TOU system, the real-time prices (i.e., often update every 15 min) are more economical for grid operators and EV owners [9]. However, the charging control algorithm requires inputs, such as driving habits (i.e., arrival and departure time), battery characteristics (i.e., battery capacity and state-of-charge (SoC), and electricity market price using a communication network [10,11].
The proposed charging cost optimization algorithm (CCOA) considered various factors such as driving habits (i.e., arrival and departure times), battery characteristics (i.e., SoC and battery capacity), and real-time electricity market price pattern along with a proper communication network system [12,13,14]. An EV initiates a charging request after being plugged into the charging station. The CCOA loads data from the EV and day-ahead electricity price pattern (i.e., considering that the current day has a similar consumption and pattern) from the utility company. In contrast to the holistic price, the proposed CCOA computes a threshold price value for each arrival and departure sequence of EVs and accordingly controls the charging process with optimizing the cost at each scheduling period. The charging cost is captured at the end of each charging activity and the cumulative cost is calculated until the battery’s desired capacity. Various charging scenarios with different characteristics of EVs against the real-time prices profile were simulated through MATLAB. The simulation result shows that the proposed algorithm outperforms with a low charging cost in comparison to the uncoordinated, flat-rate, and time-of-use systems. The main contribution of this work is three fold:
  • We developed a charging cost optimization algorithm that learns the characteristics of EVs and real-time price patterns and computes a threshold value of price for each arrival and departure sequence of EVs. The threshold value is utilized to schedule the charging operation of EVs with minimizing the charging cost and respecting the operational constraints of the power grid.
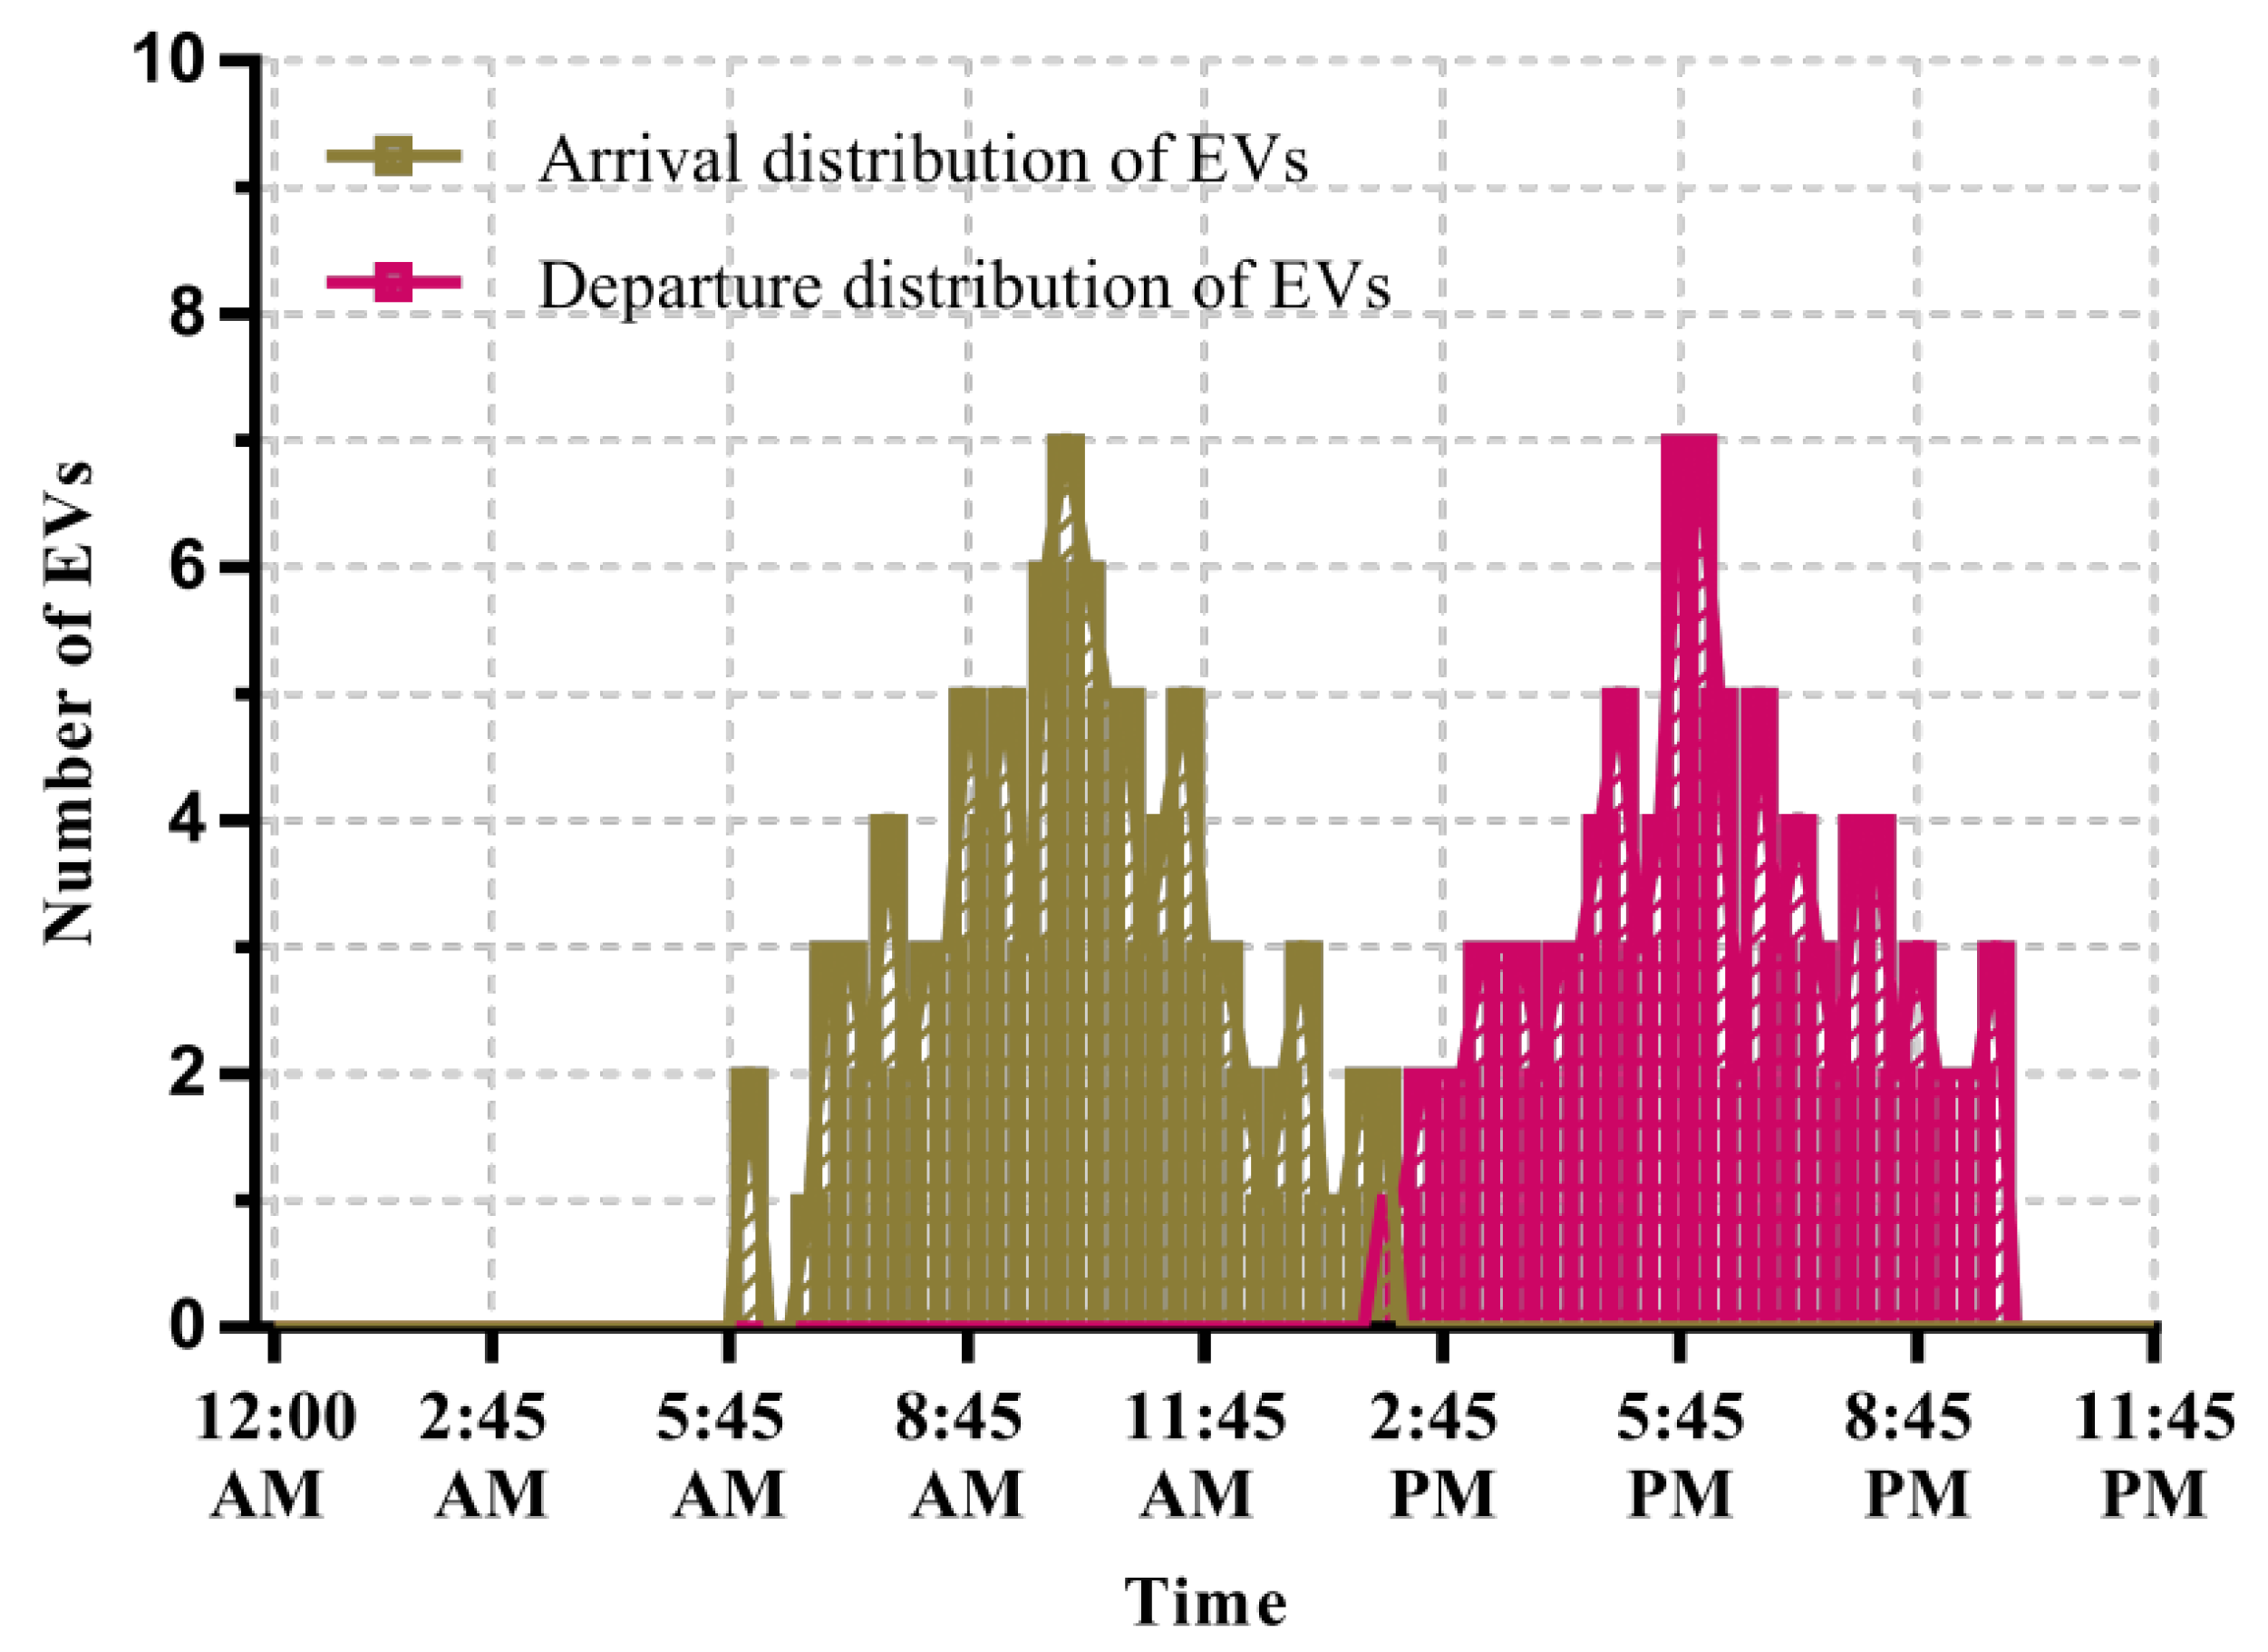
  • We show how the different schemes influence the charging cost and grid overloading by developing charging scenarios for individual and aggregated EVs with fixed and random arrival and departure sequences against the real-time electricity price patterns.
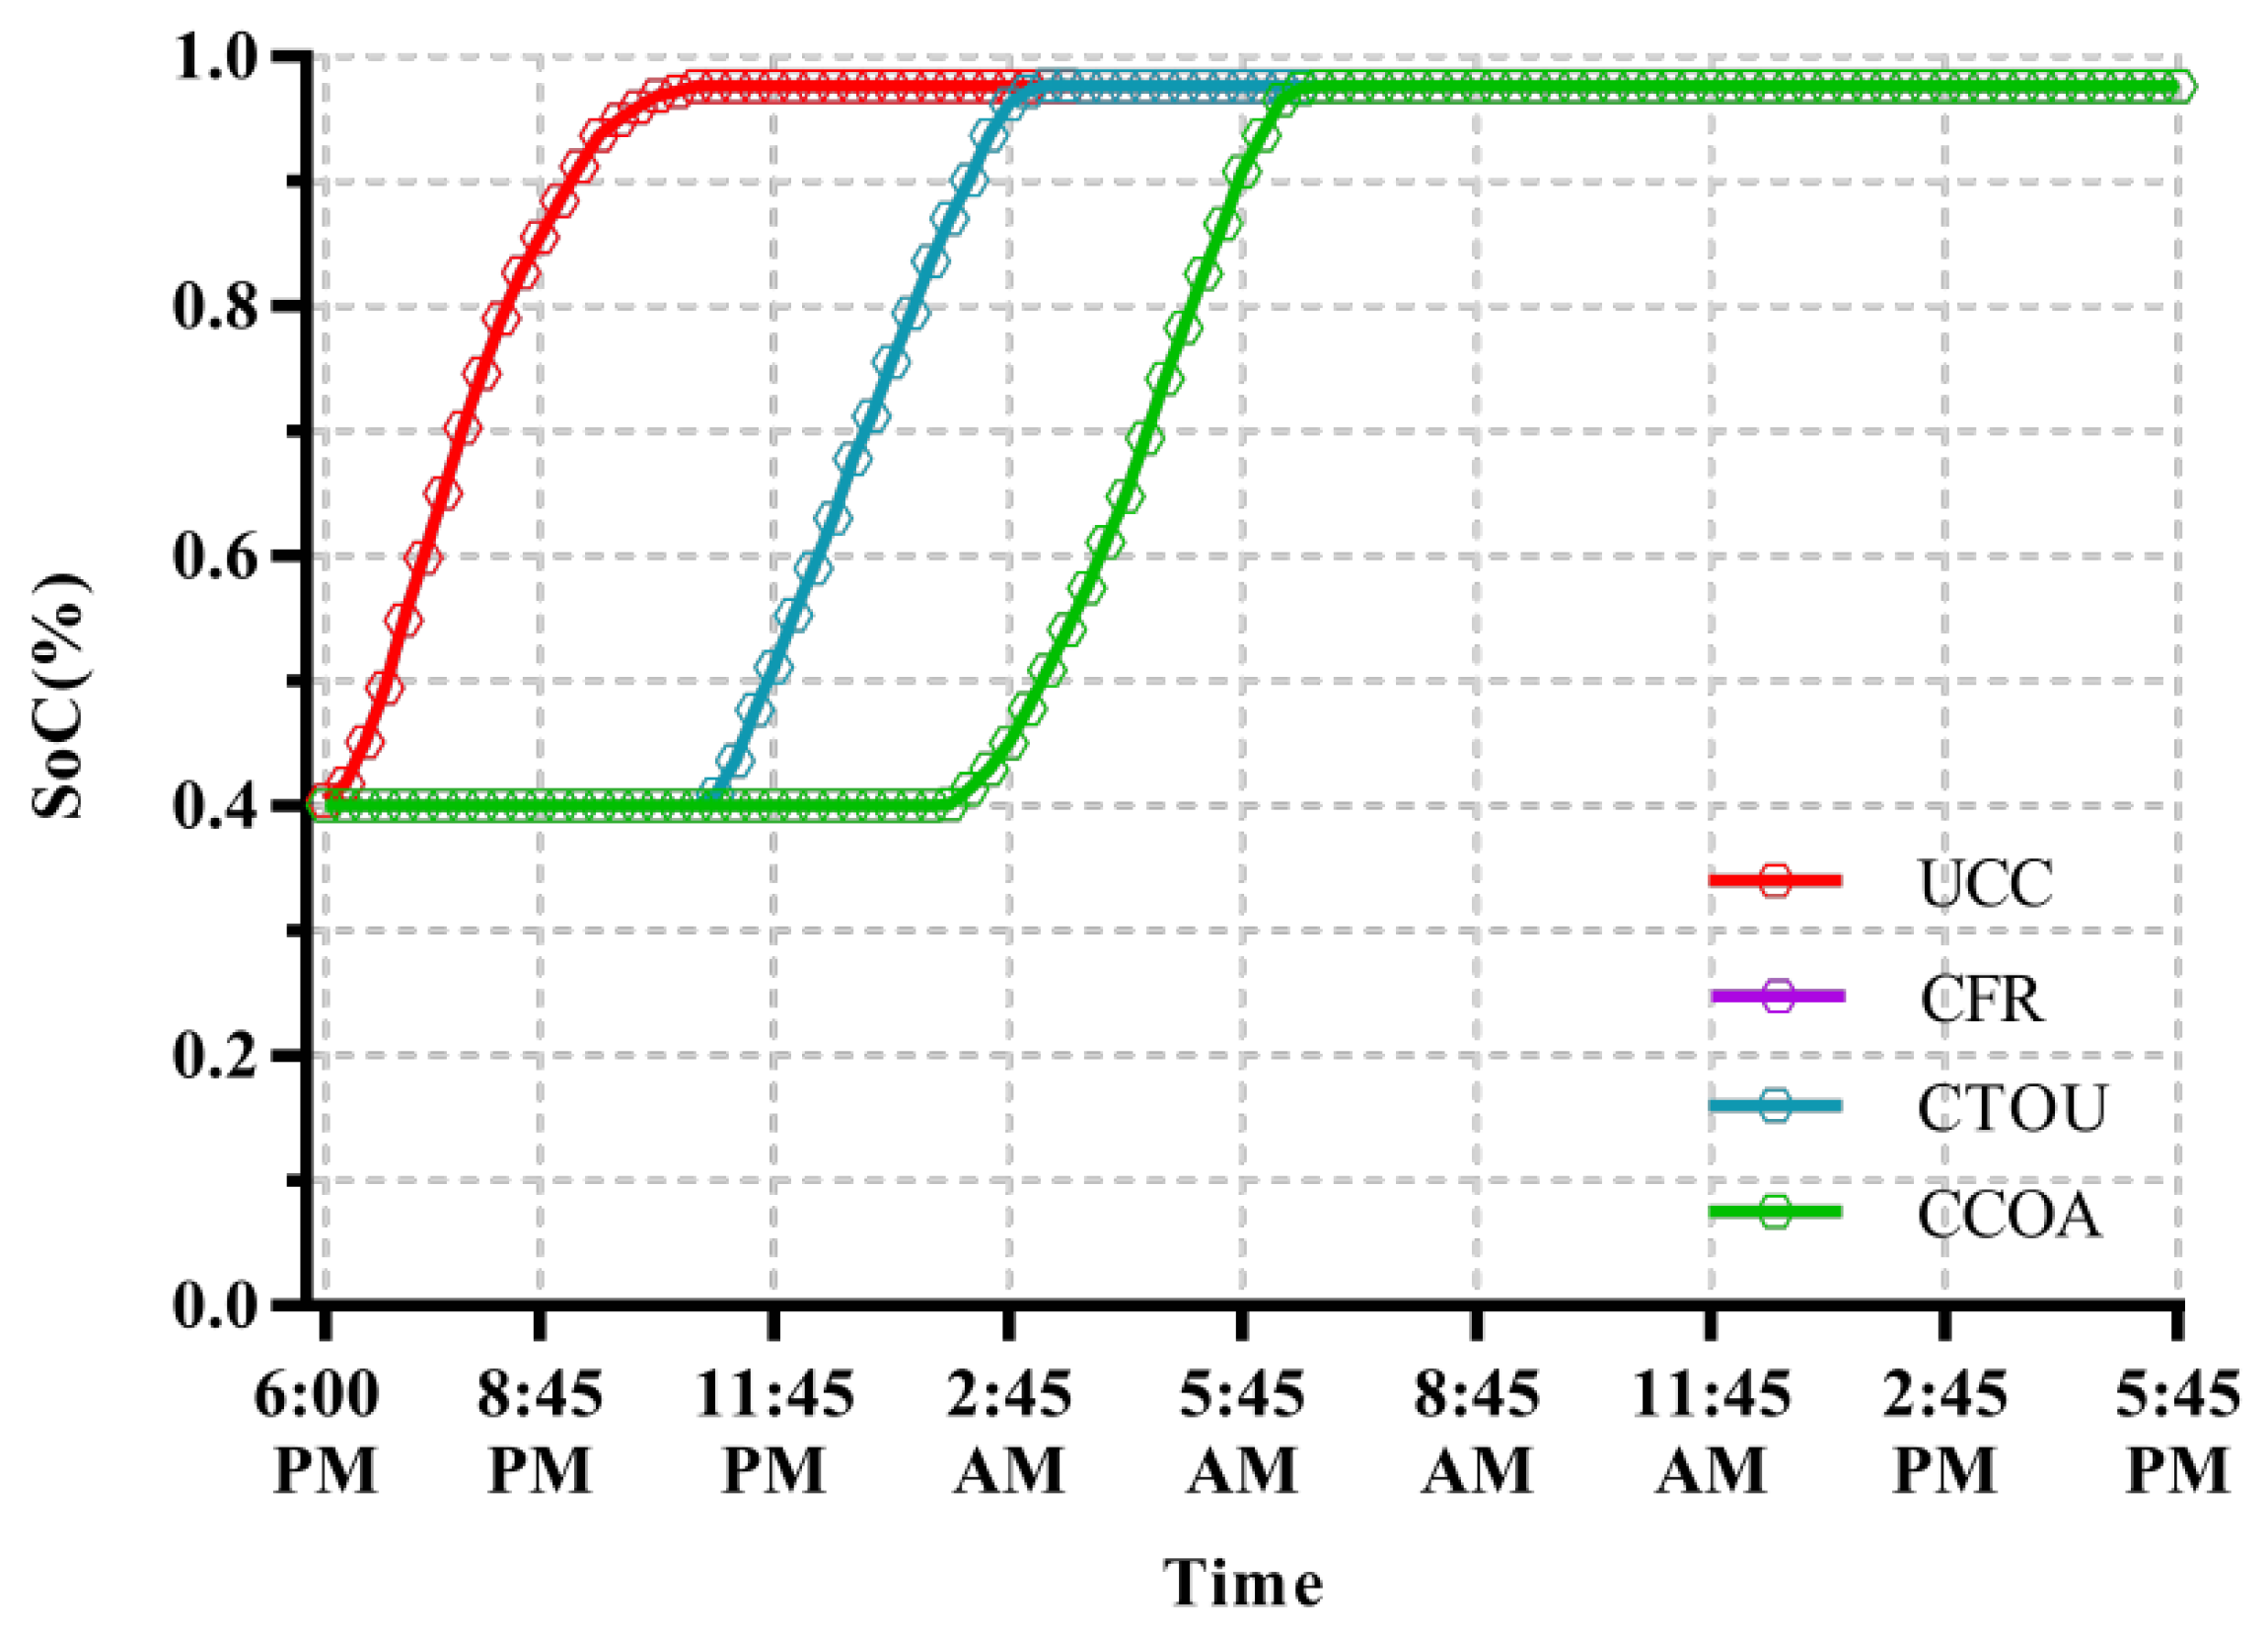
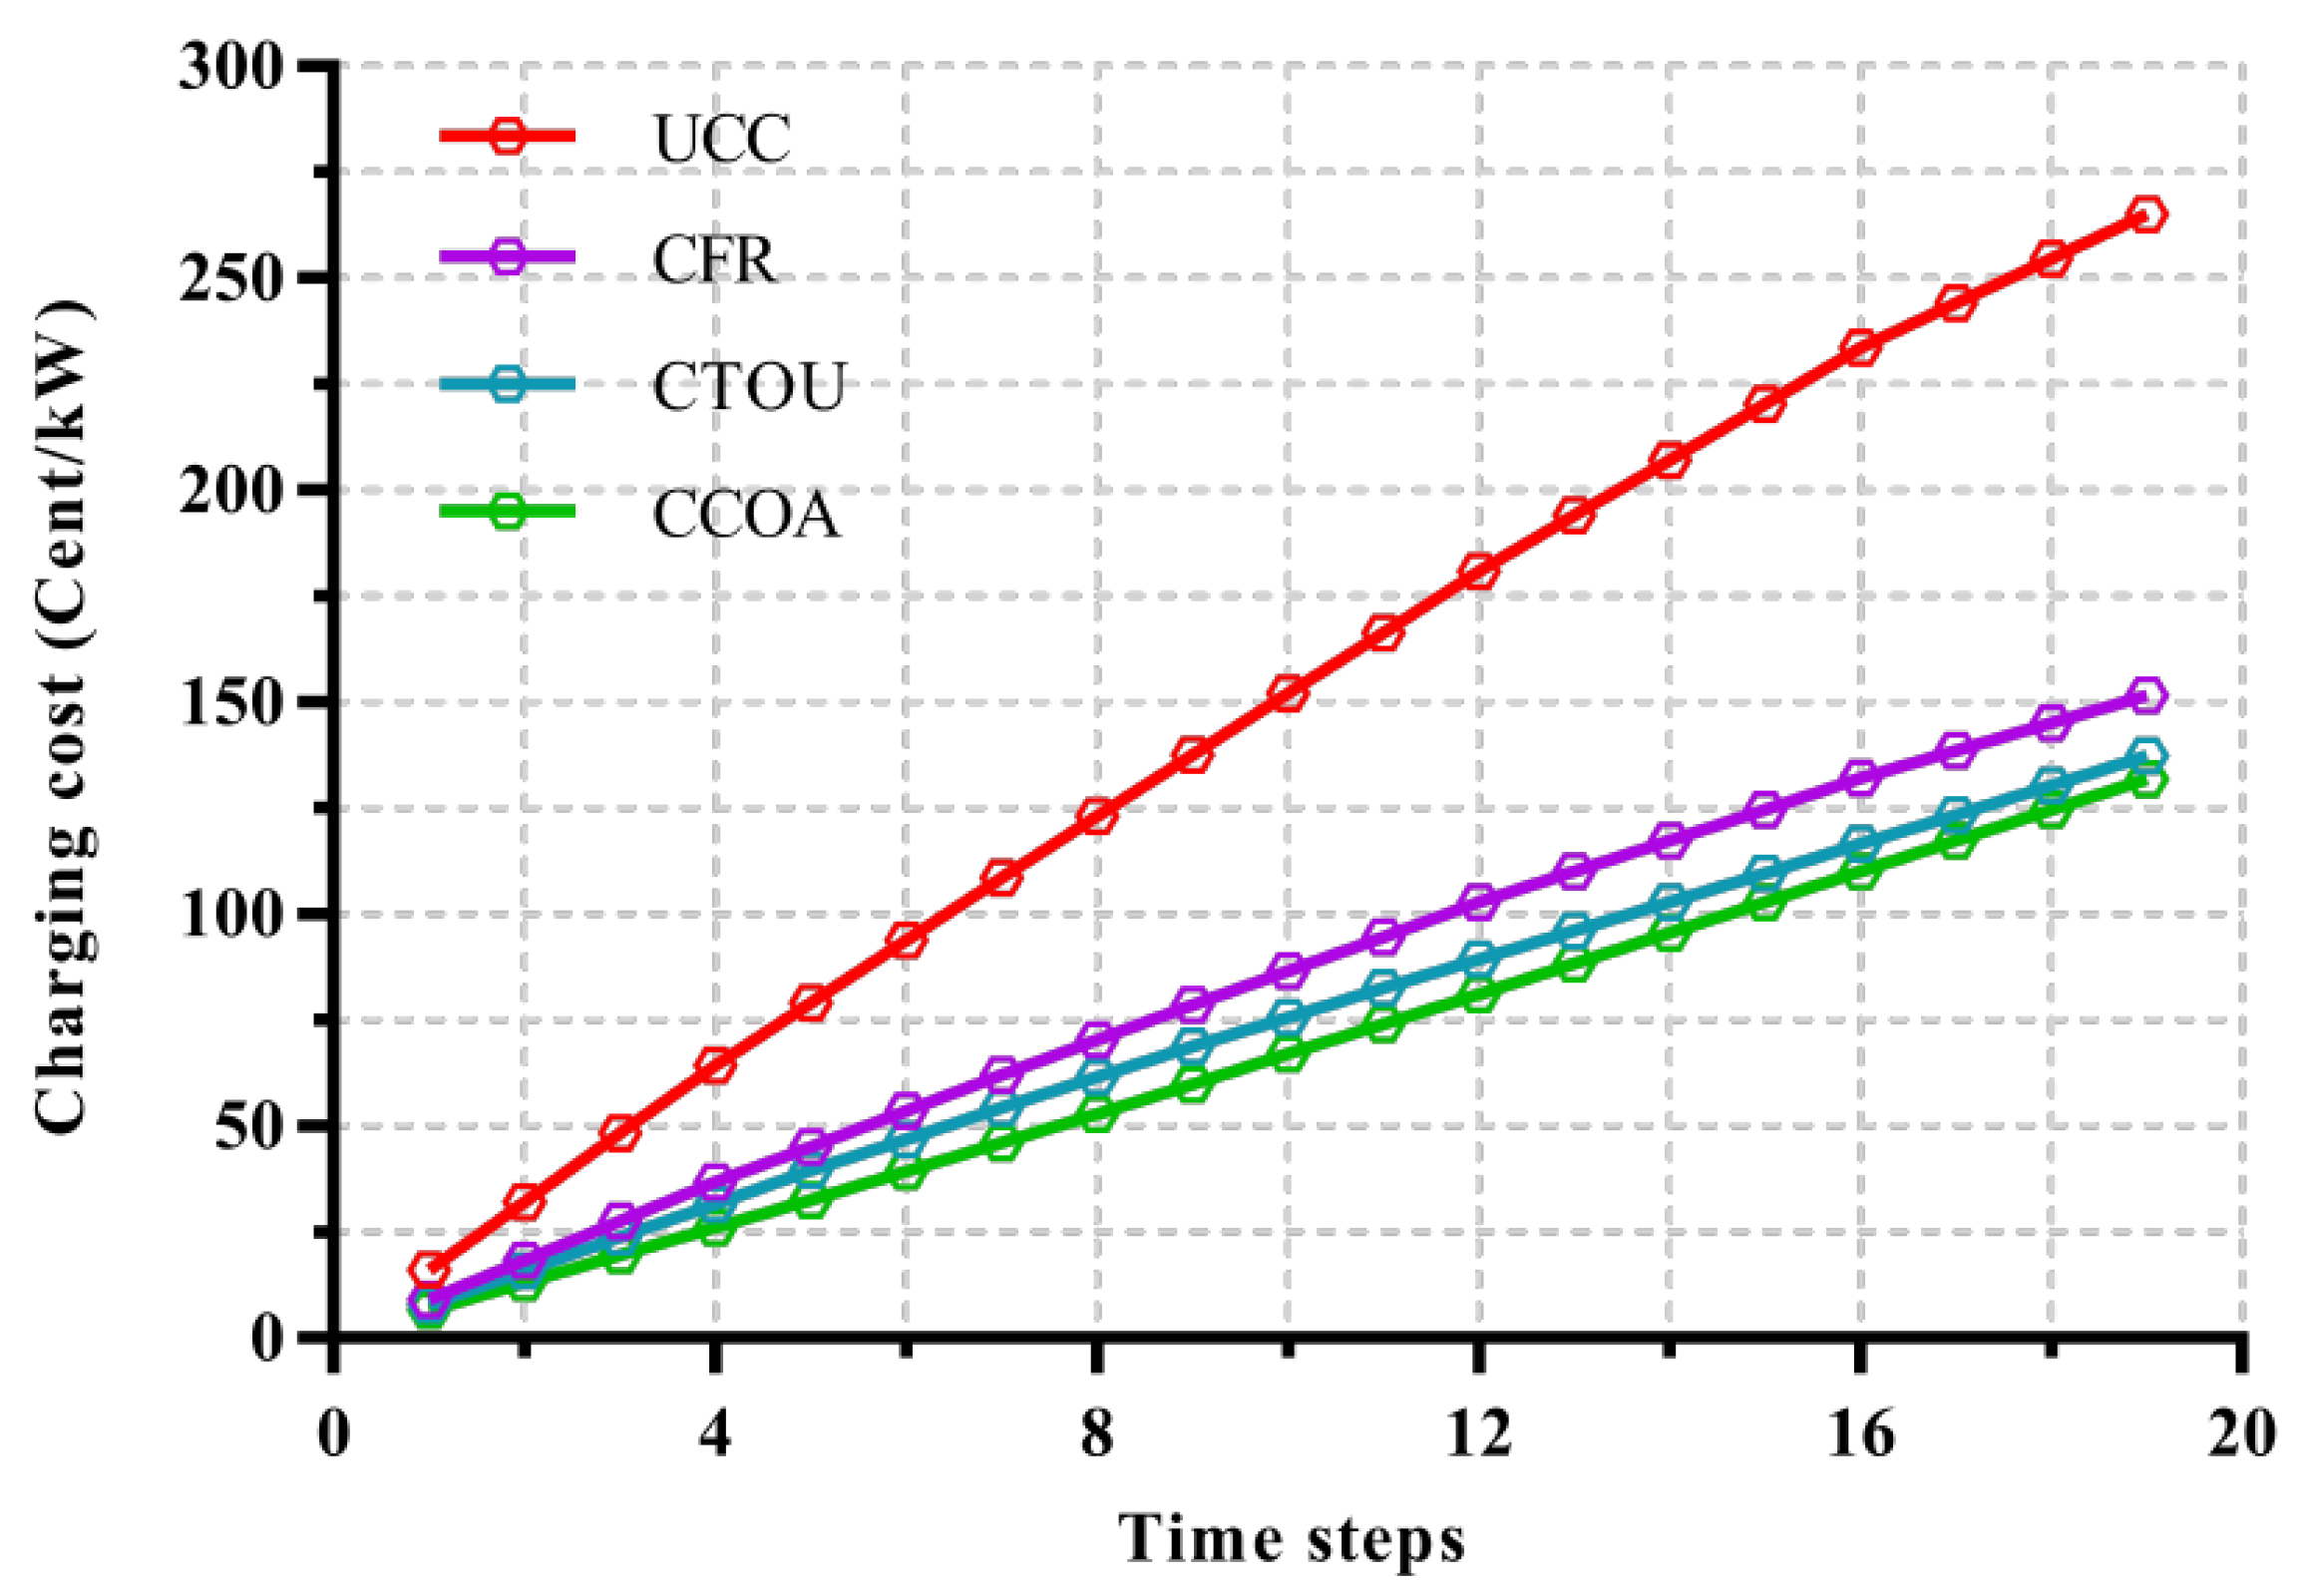
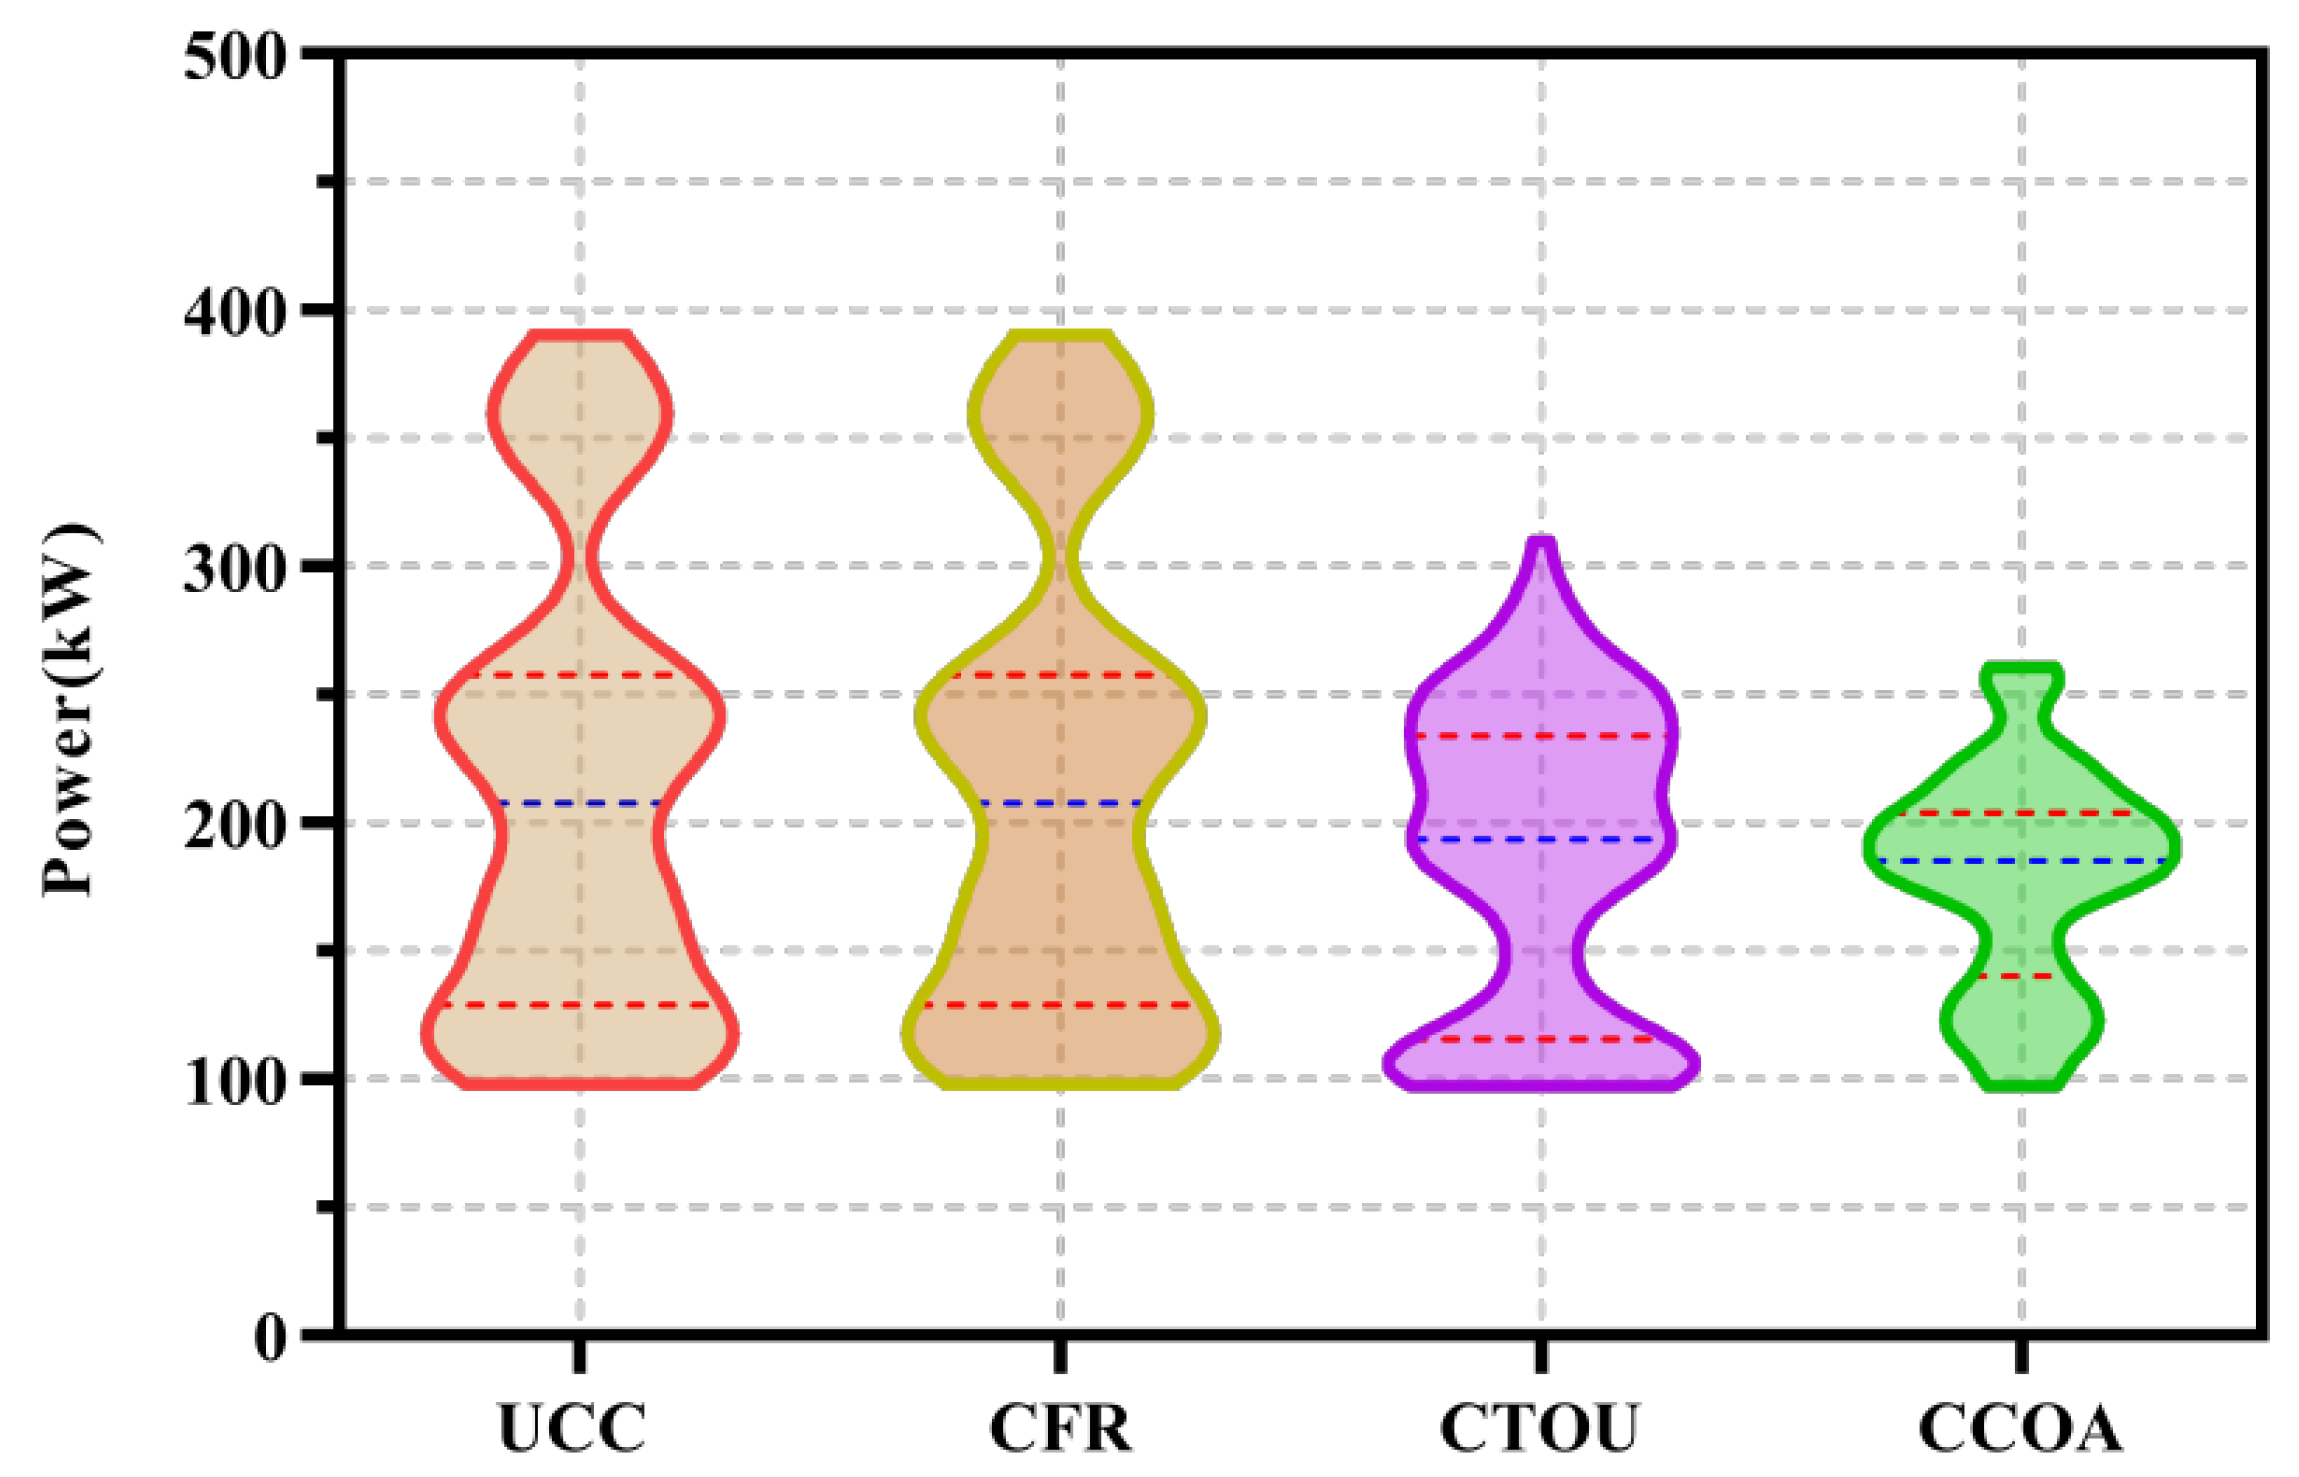
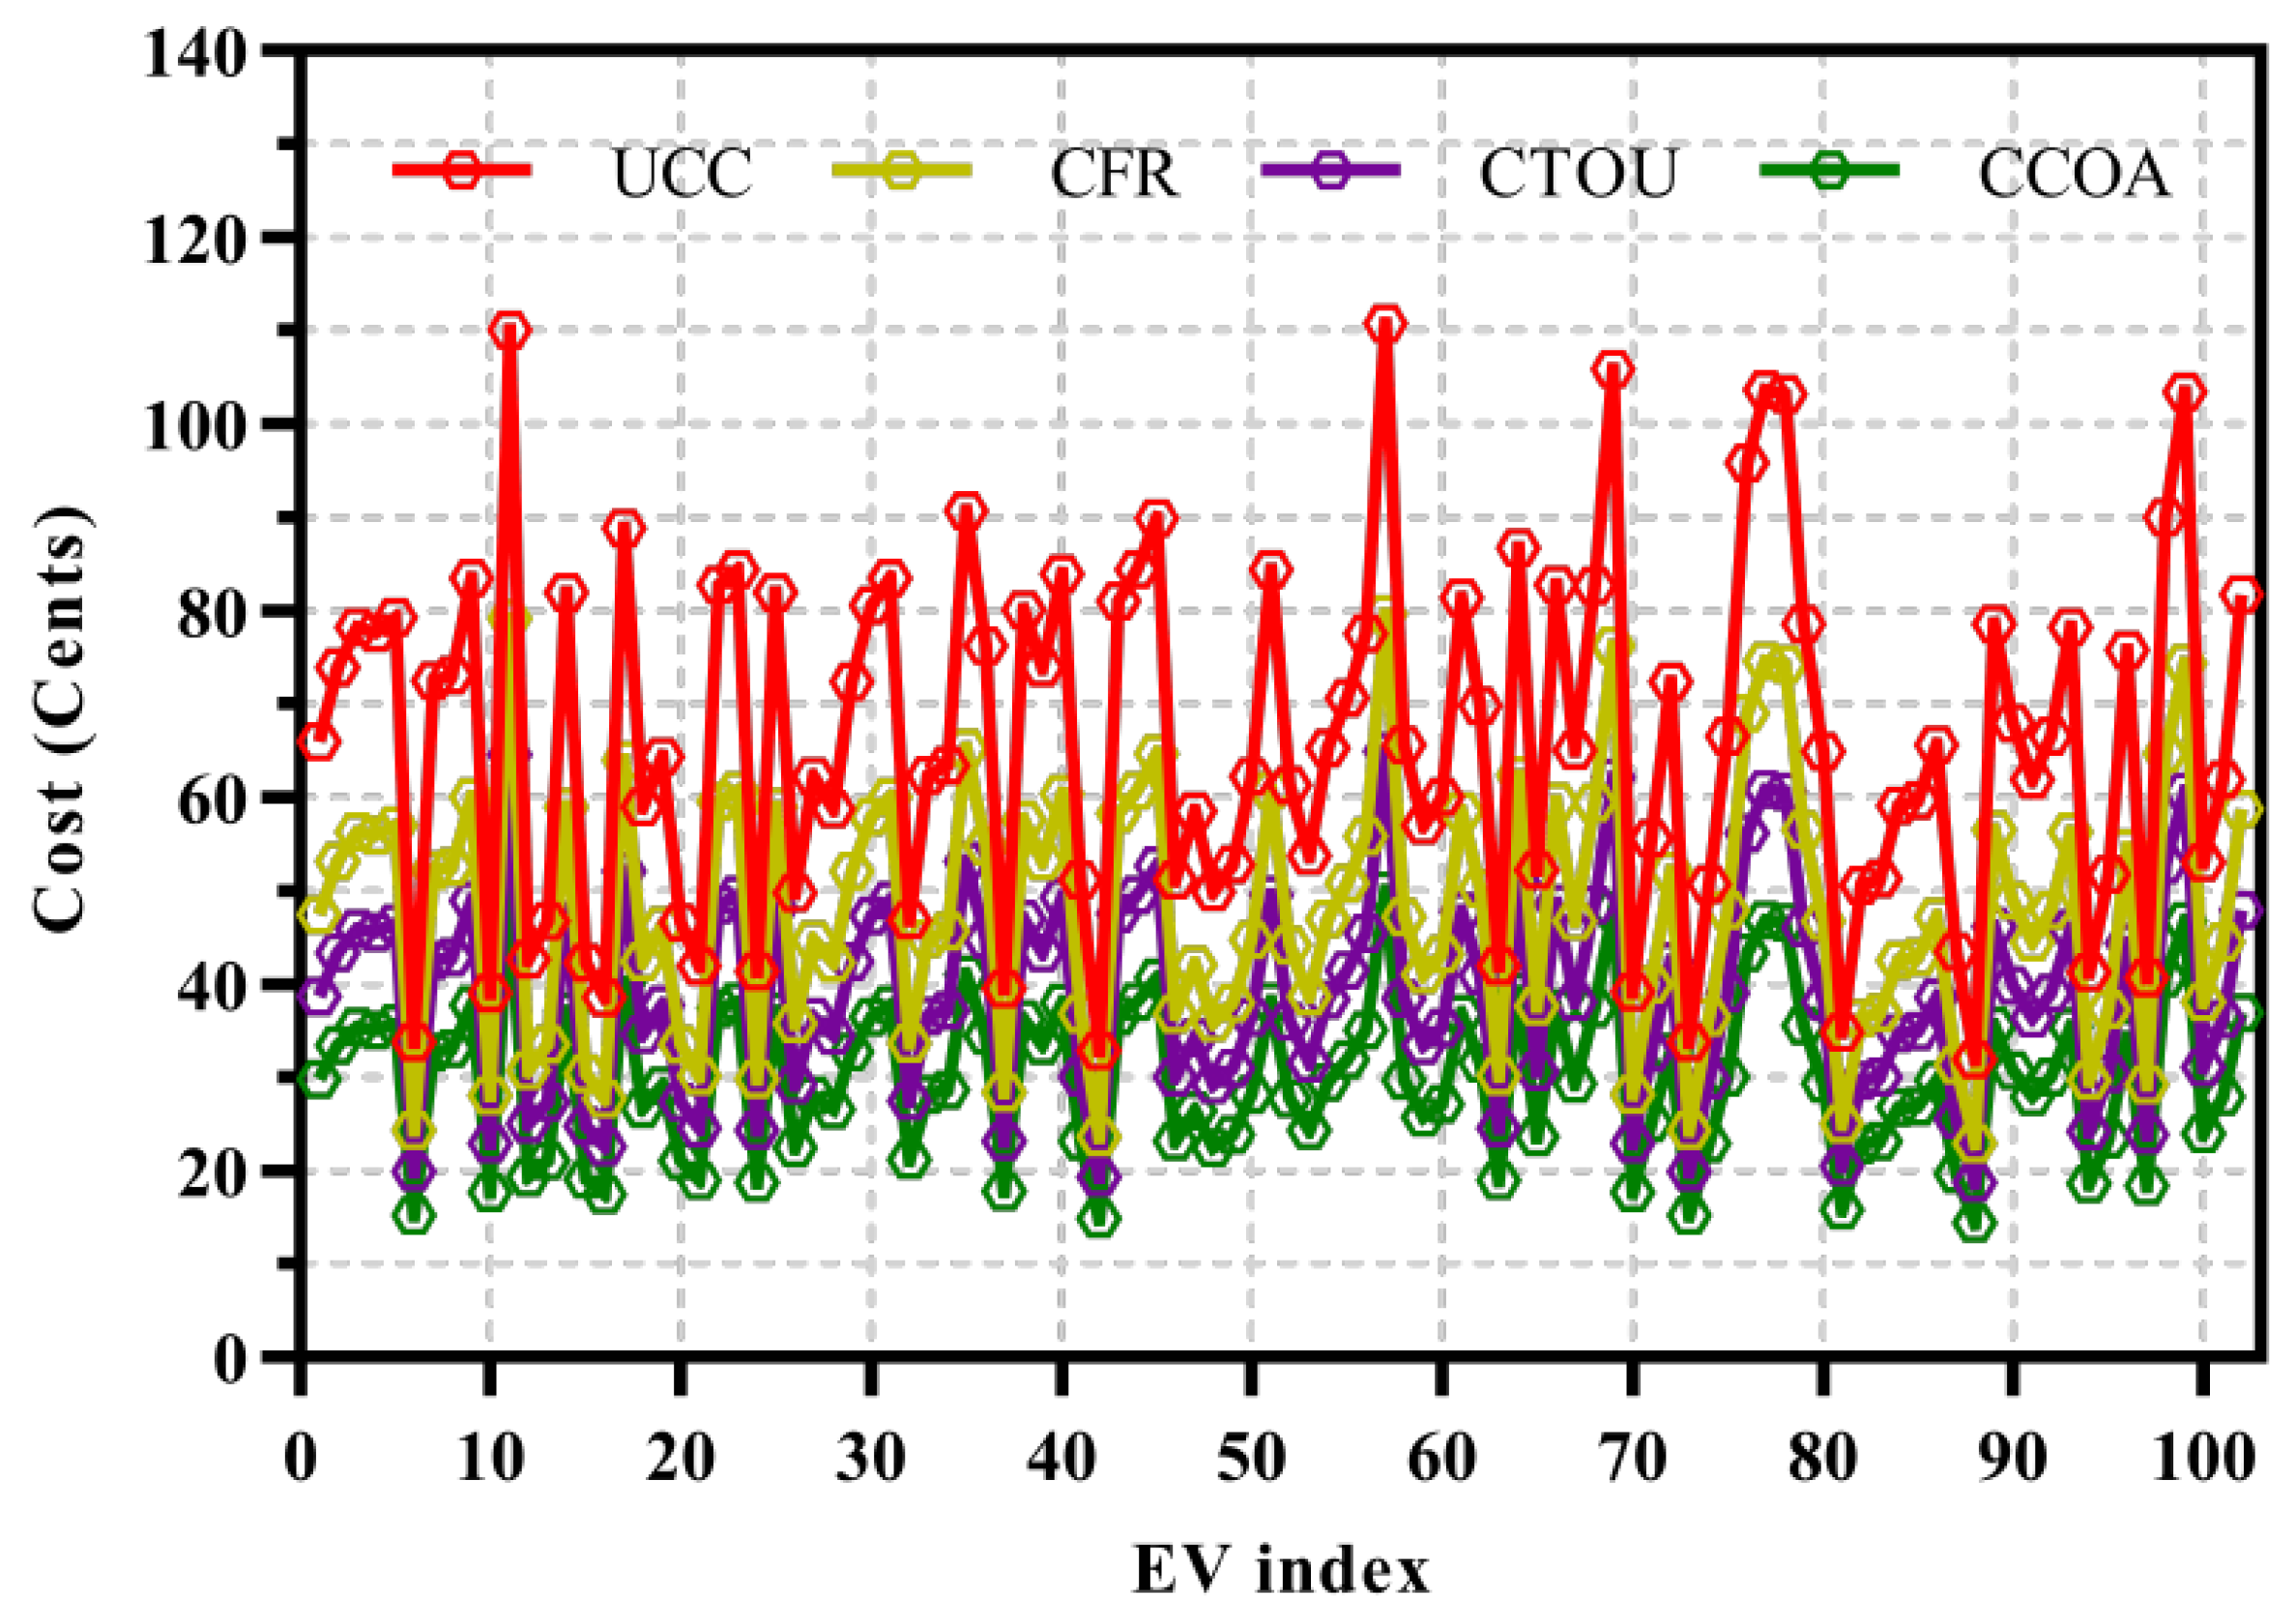
  • We evaluated the performance of the proposed CCOA against the uncoordinated, flat-rate, and time-of-use systems in terms of charging cost and grid overloading.
The rest of this paper is organized as follows. Section 2 discusses the literature survey. Section 3 presents the proposed algorithm. The simulation results and discussion are presented in Section 4 and Section 5 concludes the paper with related future work.

2. Literature Survey

In the EVs research, various studies considered the power and daily commute distance patterns with the objective functions of minimizing the power losses, voltage deviation, and fleet consumption for aggregated EVs [15,16,17]. A charging load optimization algorithm for a fleet of EVs based on dynamic programming with the assumption of arrival and departure sequence of 8:00 AM and 6:00 PM was studied in [9]. Their proposed scheme showed approximately, a 17% reduction in the daily load profile compared to the conventional dumb charging scheme. The authors in [18] studied the charging load optimization of aggregated households through V2G technology. The study considered 63 households, such that each household was assigned a random electric load profile obtained from Belgian households, and the EV’s SoC was approximated, between 20% and 60% through uniform distribution. The authors in [19] considered various factors (i.e., transformer’s load, voltage limits, and parking availability) and employed a genetic algorithm (GA) for computing an optimal load pattern for the aggregated EVs. The study investigated various uncontrolled and controlled charging case studies with different penetration ratios of EVs and concluded, that about 85% and 5% were allowed to charge at the valley and peak periods, while in the remaining hours, 10% EVs were charged. The study in [20] suggested a Monte Carlo-based charging control method for aggregated EVs by utilizing the available data on the distribution of departure time, commuting distance, and average power consumption. The work in [21] analyzed the stochastic characteristics of EVs by obtaining the datasets from the Netherlands transportation network. The time of each trip and the traveling distance were considered stochastic variables, and the battery SoC was obtained using the traveled history. Then the power demand of EVs based on the real commuting distance for domestic charging was modeled using a Monte Carlo simulation approach. The authors in [22] developed a multi-location charging scheme for EVs using their travel distances. In this work, the national household travel survey (NHTS) driving dataset was used to derive statistical distributions of travel patterns. Then a simulation was performed to generate trip chains using start time, end time, driving distance, and the end location from the NHTS dataset. The work in [23] presented a data-driven stochastic optimization algorithm for reducing the energy cost of commercial buildings in the Southern California region. The work considered the uncertainty associated with the availability of plug-in electric vehicles (PEVs) for charge and discharge and modeled the energy cost optimization problem using mixed integer linear programming (MILP). The study in [24] considered the local electricity market to develop an energy trading mechanism for consumers and prosumers to reduce congestion, energy cost, and intermediate players, such as retailers. In our previous works [25,26,27], we highlighted the requirements of the power grid, parking lot operators, and developed charging and discharging algorithms based on fuzzy inference systems. The developed fuzzy inference system was able to incorporate the uncertain available power, the SoC, and the dwell time of EVs into an aggregated control variable. The developed algorithm utilized the aggregated control variable to coordinate the charging and discharging of EVs in each sampling period. The authors in [28] considered the driving cycles from traffic information for optimal management of EV charging. The proposed scheme was simulated with several standard driving cycles, and the results showed significant improvement in comparison to rule-based control and a depletion sustenance control scheme. A game-theoretic with a non-cooperative strategy coupled with the electricity prices for minimizing the charging cost of PEVs was proposed in [29].
In contrast to the electricity prices profiles, these papers mostly studied the power consumption pattern while optimizing the charging and discharging of a load of EVs. The study in [30] introduces three different tariff systems (i.e., electricity rates) for coordinating the charging operations of EVs at residential premises. These tariff systems correspond to fixed electricity rates (i.e., constant rates), time-of-use electricity rates (i.e., dual rates, according to off-peak and on-peak periods), and real-time rates (i.e., the rates which vary according to the time of day). The work combined the electricity tariff systems, the vehicle commuting distances, and the battery types to approximate the charging start time and the overall duration of the charging for each type of battery. The proposed method is applied to a 38-node distribution system from the U.K. and compared with four different charging scenarios (i.e., uncontrolled domestic charging, uncontrolled off-peak domestic charging, smart domestic charging, and uncontrolled public charging). The performance was measured through electric load profiles for different penetration levels of EVs.
However, this work assumed a long stay time of EVs while ignoring the dwell time of EVs, and thereby the computed charging schedule may not be feasible for EVs with different dwell times. To fill the gap, we develop a charging CCOA that utilizes the battery size, current SoC, arrival departure times, and the real-time price profile for coordinating the charging schedules within the dwell times of the EVs with optimizing the cost at each scheduling period. The developed CCOA captures the charging cost of each charging activity and aggregates the holistic cost until the battery’s desired capacity of each EV.

3. Proposed Charging Cost Optimization Algorithm

The charging process of EVs can be performed via either uncoordinated or coordinated charging. The former case depends on the connection and starts charging immediately once the EVs are plugged into the CSs. In contrast, the latter case coordinates the charging of EVs by considering some external factors such as the power system requirements, the driving behavior, the charging time and cost, and the power demand of EVs. This section provides a detailed discussion on the two charging categories and presents the underlying mechanism of the proposed CCOA.

3.1. Uncoordinated Charging

The uncoordinated charging is generally based on the EV user’s energy requirements and the availability of the CS. For instance, the EVs need a recharge to fulfill the charging need for their next trip journey. The uncoordinated charging begins the charging process as soon as an EV is plugged into a CS. By modeling the uncoordinated charging method, it is possible to find the consequences of the charging behavior on the grid side, such as the electric load and the charging cost at the customer’s premises. In this work, we are interested in modeling the charging activities of EVs for analyzing the cogent effect on the charging cost. A detailed procedure of the uncoordinated charging process is illustrated in the flowchart in Figure 1. At any t, the algorithm checks whether an EV is plugged or not. If no connection is detected, the algorithm increments the t and repeats the checking process again. However, if an EV is connected, it collects the data from the EVs and checks the SoC against the BC, and calculates the electric load and cost for each charging activity. This process continues until the battery is fully charged. Then it checks the time against the maximum time limit and accordingly increments the time step to either repeat the procedure or terminate the algorithm.

3.2. Coordinated Charging

In contrast to uncoordinated charging, the coordinated charging algorithms aim to determine the time moments (i.e., charging schedule) that represent the start or stop of the battery charging process. Therefore, the algorithms are modeled based on external factors such as electric load profile, vehicle trip distance, electricity tariff-based system, and real-time electric load and price profiles. This section presents a detailed discussion concerning the TOU tariff systems and the proposed CCOA algorithms.

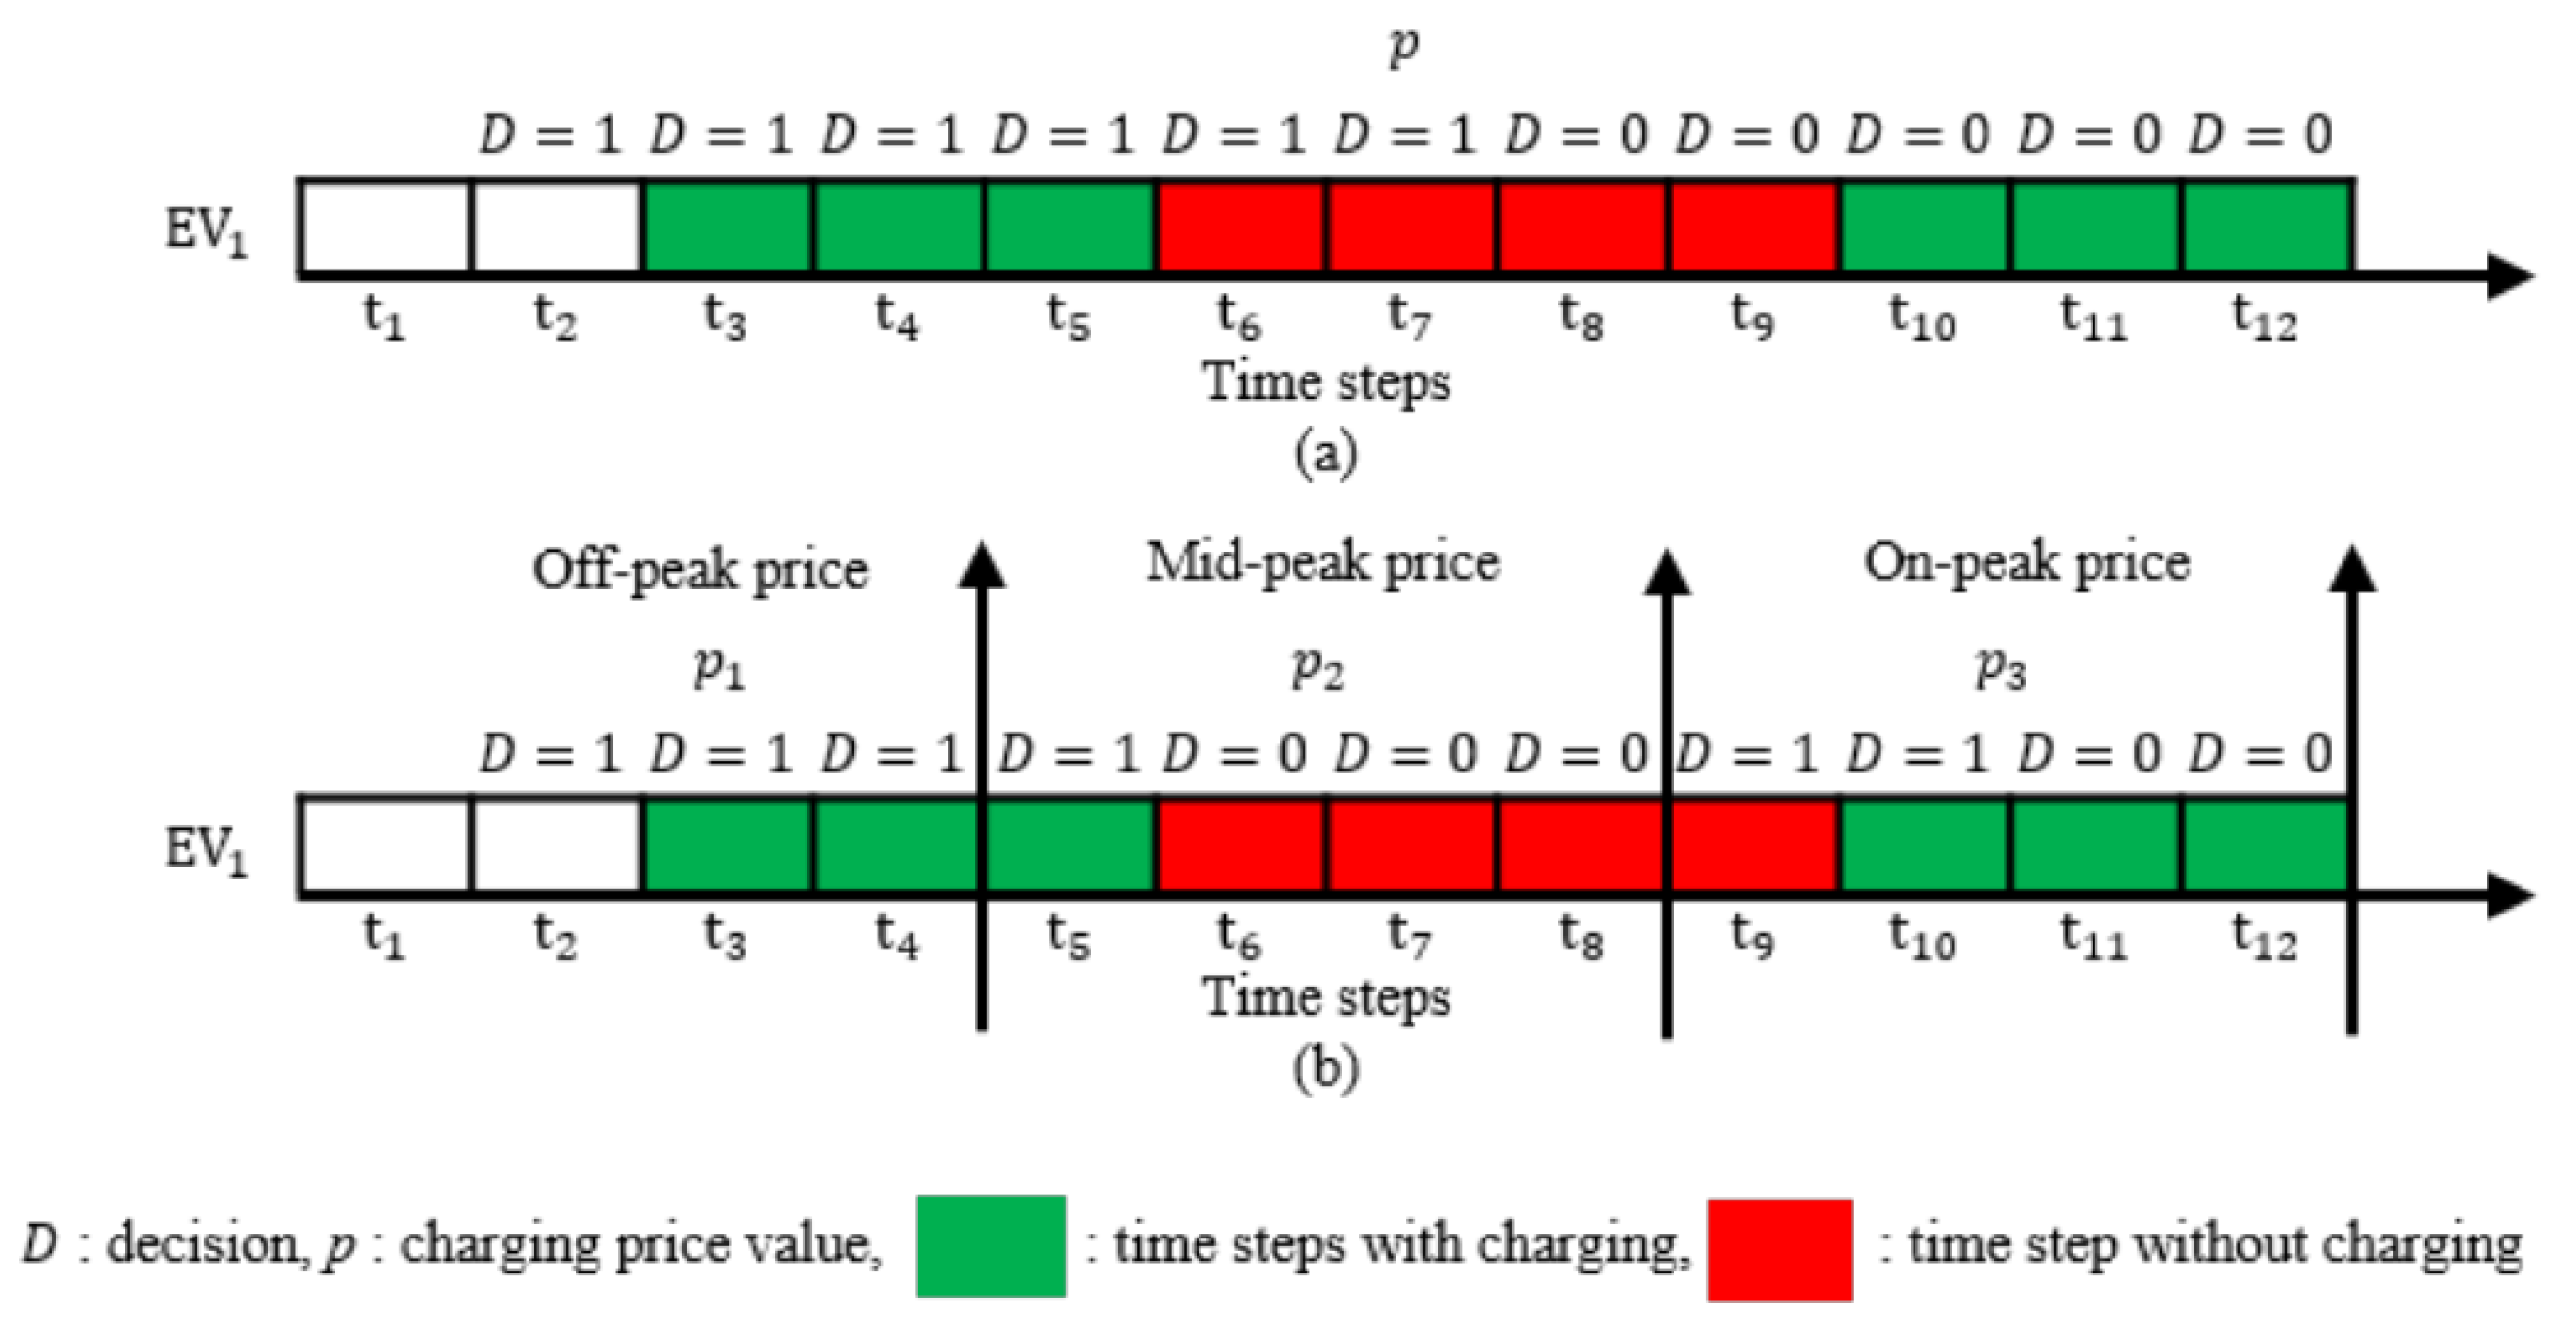
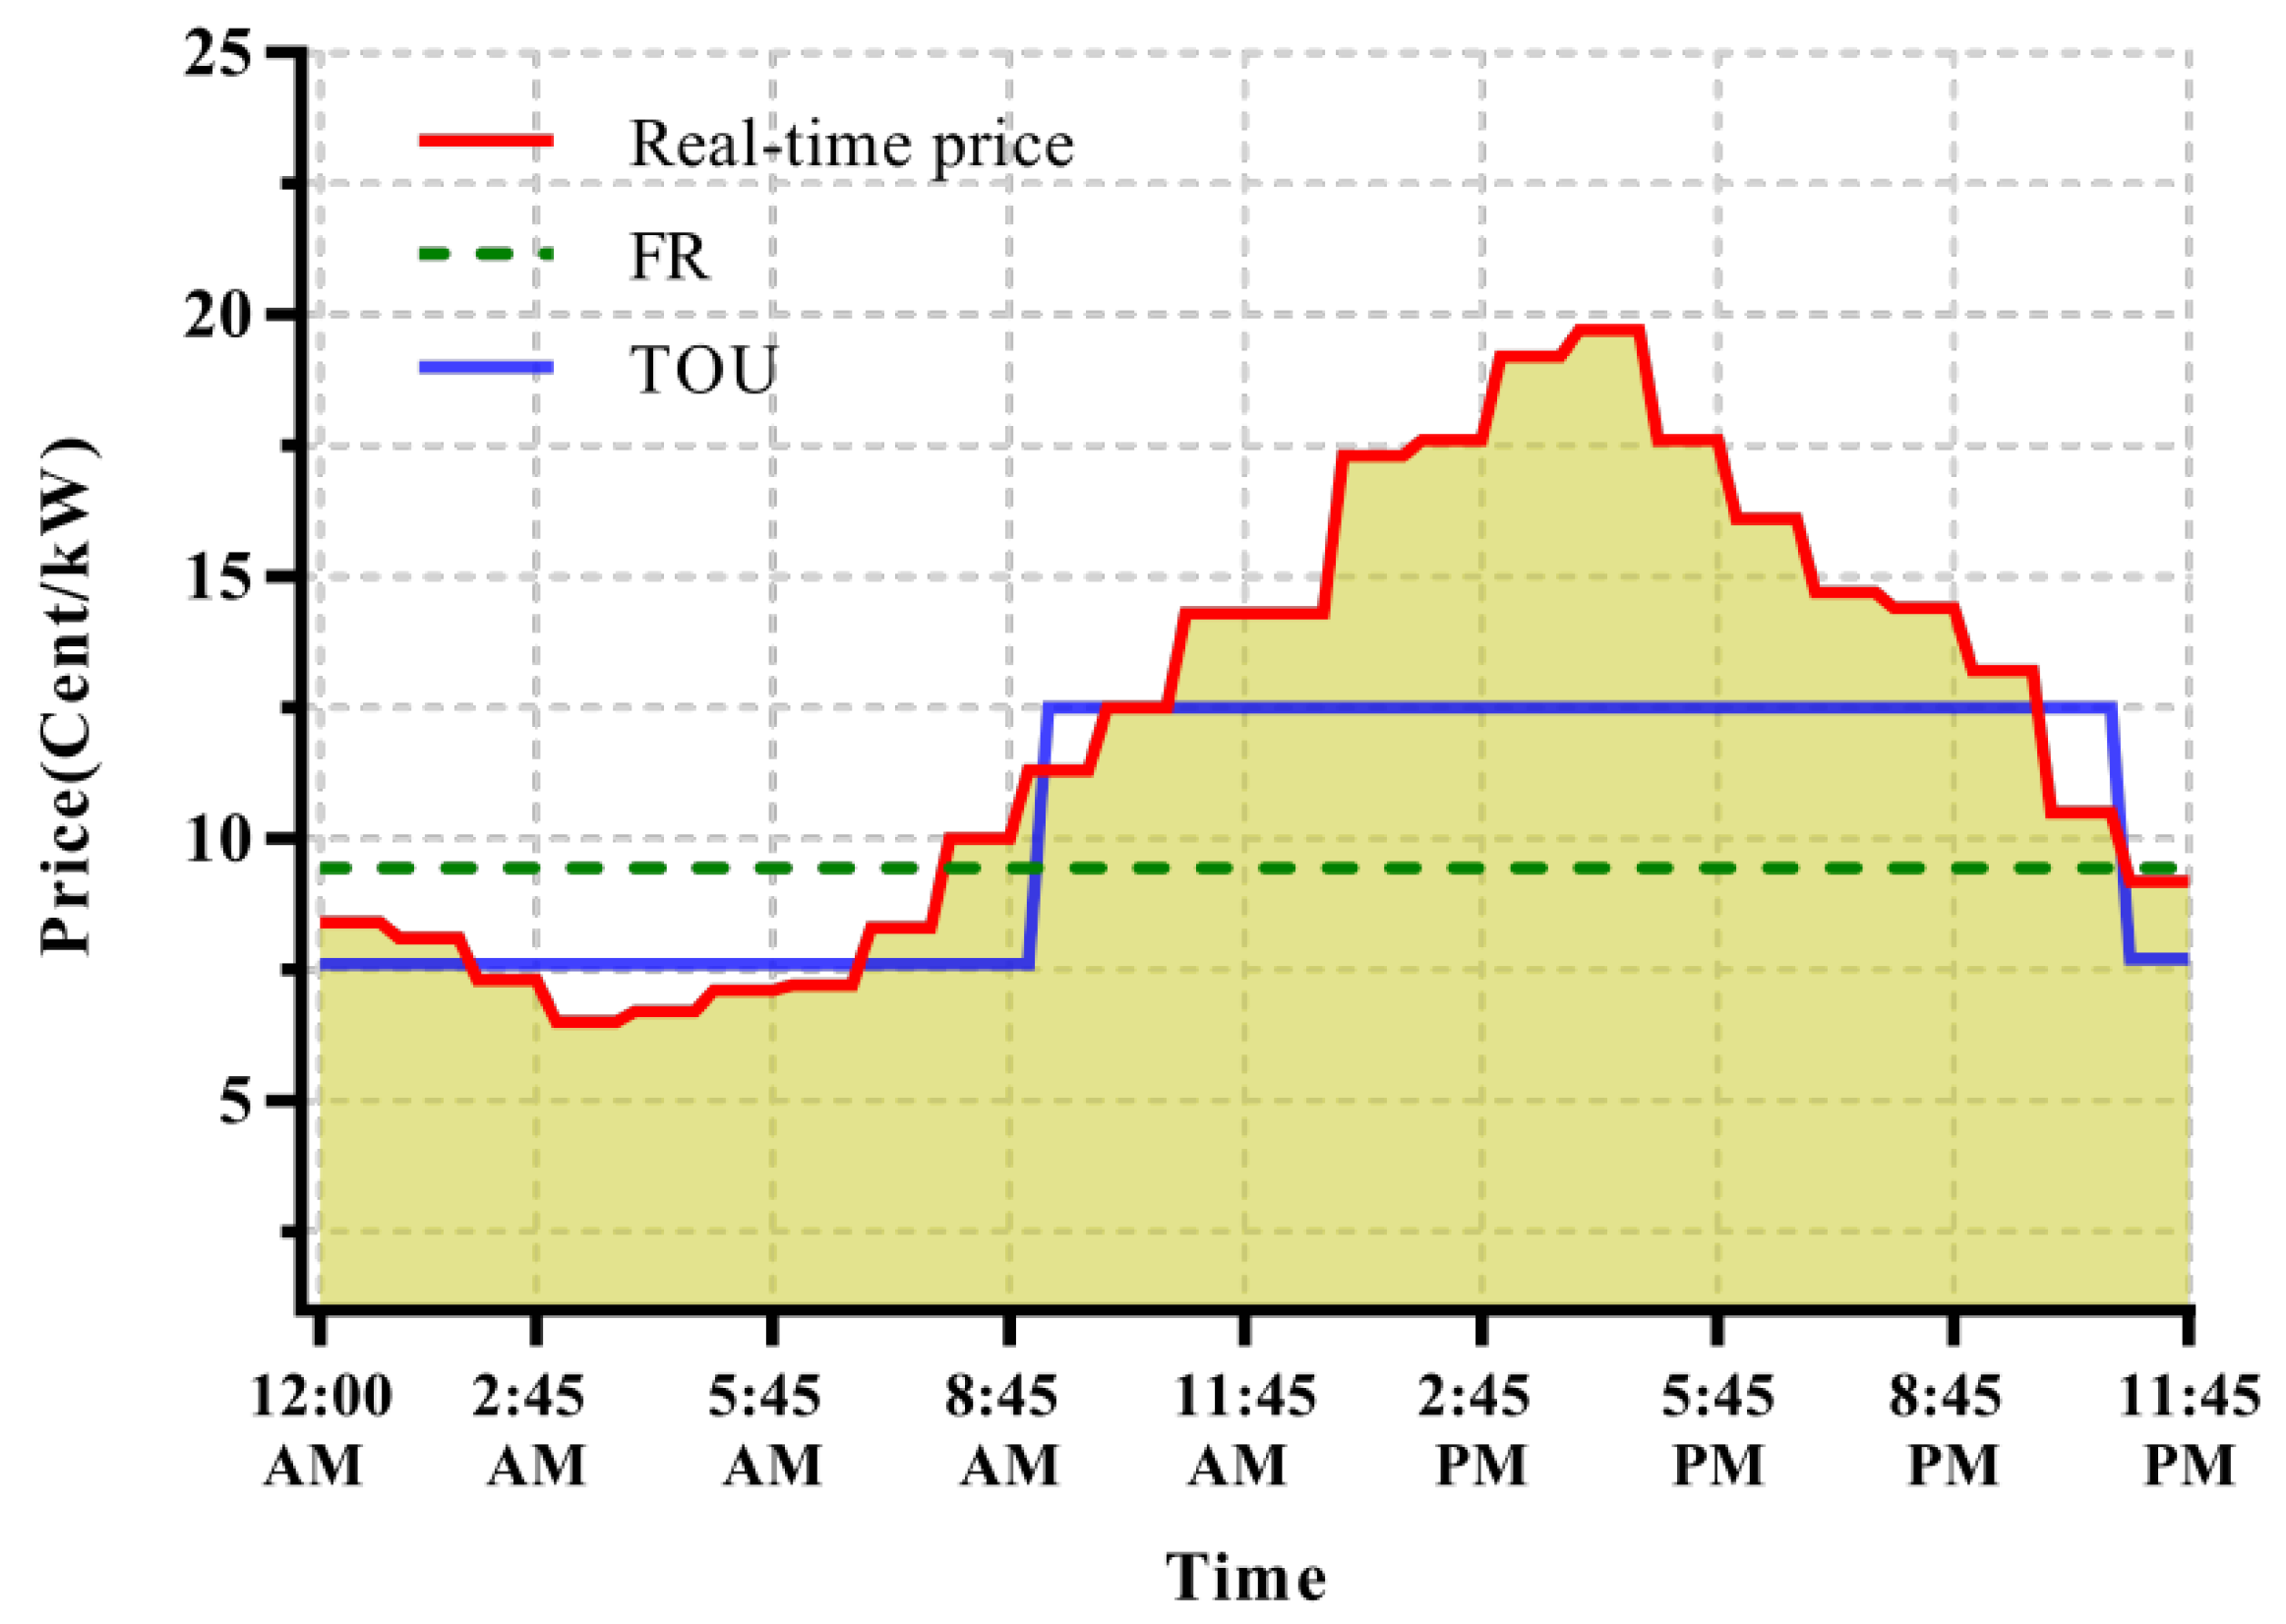
3.2.1. Time-of-Use Tariff Systems

The tariff system defines electricity rate structures concerning different periods, thus called TOU [31]. These systems are adopted to encourage the EV owners to recharge vehicles during off-peak time. Three different tariff system such as flat, single, and multitariff systems are discussed in [30]. According to their work, the standard tariff system uses a fixed electricity rate. In the presence of TOU, the C for i-th is a function of the E consumption with the P in that particular time of use period. Considering the following example with discrete time steps, we deduce the formulation for the charging cost C of an i-th EV.
Let us consider the scheduled EV1 (Figure 2b) discussed in [32] having a battery capacity of 40 kWh. The EV1 has an t a and t d such that ( t a = 3, t d = 12) and has a SoC of 25% (10 kWh). Considering the arrival and departure sequence, the S t is computed to be 10 time steps i.e., ( S t = t d t a + 1) such that the arrival is at the start while the departure is at the end of time steps t a = 3 and t d = 12. It is envisioned that each time step is 15 min with delivering energy E = 5 kW/t) and thereby requires 6 time steps to complete the charging requirements. The coordinated charging considers a decision variable D for EV1 (i.e., D E V 1 ) to control the charging process according to the three tariff systems as illustrated in Figure 2. First is the flat-rate tariff in which the EV is charged with an average fixed price P for every kWh, as shown in Figure 2a. In this case, each of the time steps costs the same price, and thereby the charging cost is proportional to the energy consumption. Second is the TOU tariff, in which the prices are based on the time of use of energy consumption and remain constant until a certain period.
Usually, the prices are average prices linked to the day-ahead spot price. Depending on the TOU, there can be three different possible prices, the P1, P2, and P3 [33]. The charging cost of EV1 can be computed according to the sum of the product of charging power (charging energy), charging price, and the decision variable at each time. Let C E V 1 denote the charging cost of EV1 for the consumed energy E with the charging price P in each time step t. The charging cost based on a flat rate tariff can be computed as C E V 1 = ( E × P × D ( t 3 ) ) + ( E × P × D ( t 4 ) ) + ( E × P × D ( t 5 ) ) + ( E × P × D ( t 10 ) ) + ( E × P × D ( t 11 ) ) + ( E × P × D ( t 12 ) ) . The charging cost with TOU tariff is C E V 1 = ( E × P 1 × D ( t 3 ) ) + ( E × P 1 × D ( t 4 ) ) + ( E × P 2 × D ( t 5 ) ) + ( E × P 3 × D ( t 10 ) ) + ( E × P 3 × D ( t 11 ) ) + ( E × P 3 × D ( t 12 ) ) . This implies that with constant energy consumption E in each time step t, the charging cost C E V i for the i-th EV is computed for each of the tariff systems using Equation (1).
C E V i ( t ) = t = t a t d ( E ( t ) × P i ( t ) × D ( t ) ) P i = P flat   price t = t a t d ( E ( t ) × P i ( t ) × D ( t ) ) P i , P 1 P 2 P 3 Time-of-Useprice
where the flat prices are the average constant charging cost in each time step and are usually computed for 24 h. Similarly, the tariff system corresponds to different prices according to the off-peak, mid-peak, and on-peak time steps, with a constant average cost for four h (i.e., 00:00–04:00, 01:00–05:00, 02:00–06:00, 03:00–07:00, and 04:00–08:00) [28]. However, the dynamic nature of EV owner’s behavior on arrival, departure & stay time, and their distinct energy requirements are the major obstacles in following the TOU tariff systems. The real-time prices are a more natural option for optimizing the charging cost but present complexity and challenges when dealing with the multiple inputs from both the EVs and the power grid in each time step [34].

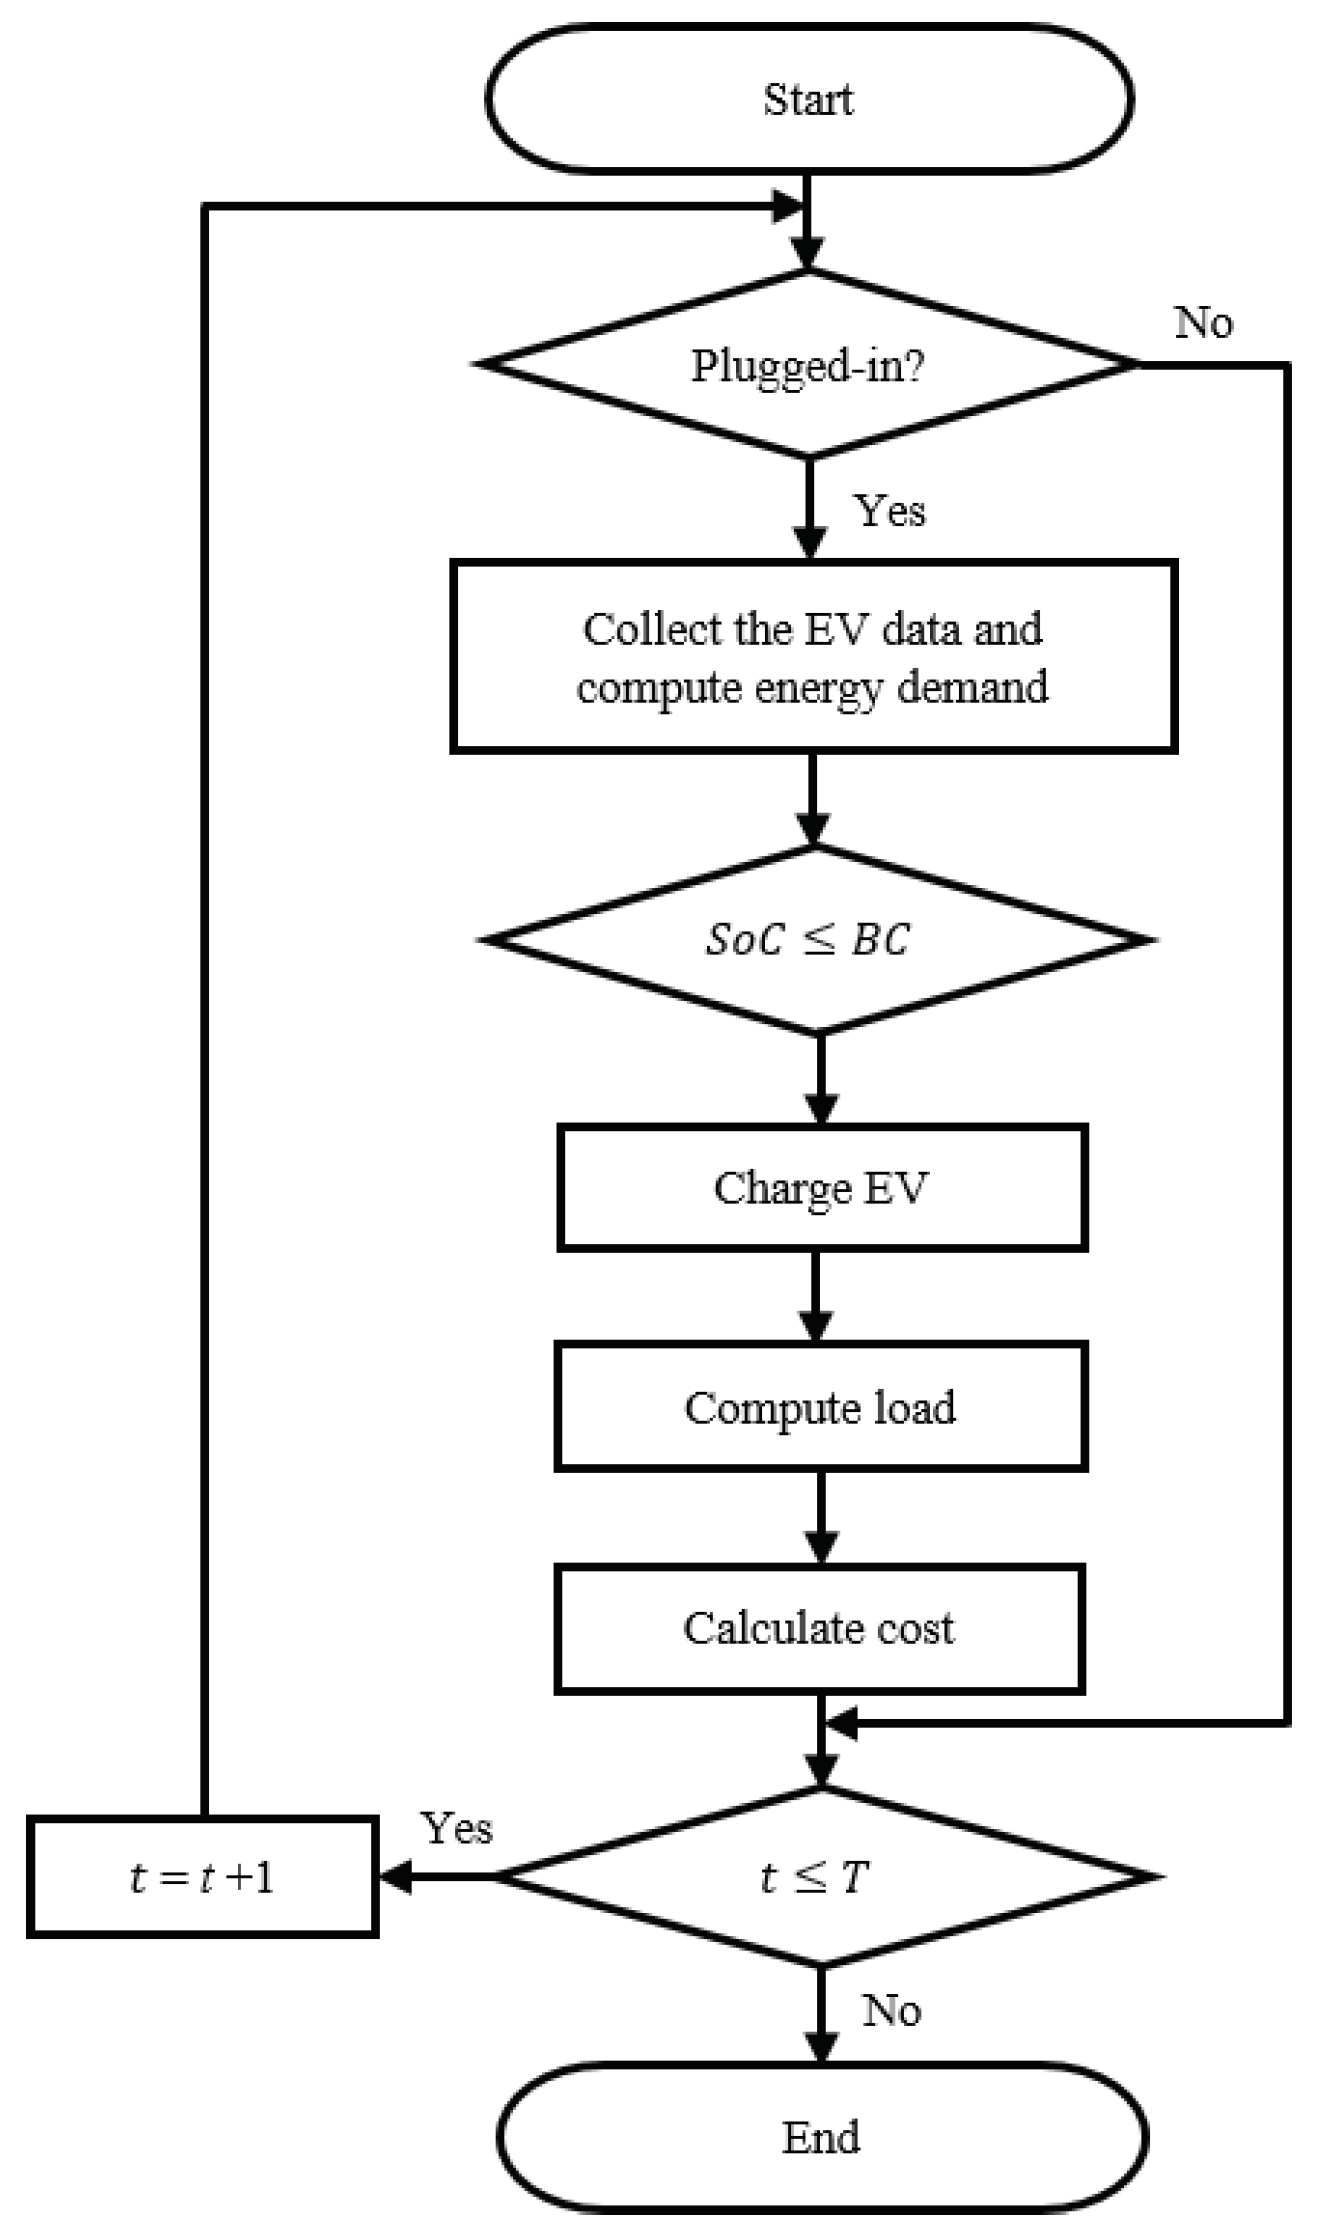
3.2.2. The Proposed Charging Cost Optimization Algorithm

The proposed CCOA optimizes the charging cost of EVs through real-time prices following the system model, as shown in Figure 3. It consists of several functional components including, the power grid, grid operators (i.e., TSO, DSO, and the utility grid operators), the LV distribution network, CCOA, and the households with EVs. The power grid is the power generation source from various sources such as coal, natural gas, nuclear, and renewable energies sources (i.e., solar and wind) [35]. The TSO is responsible for the smooth operations and reliable transmission of power from generation (power grid) to the given area (i.e., DSO) by a high voltage transmission, as well as robust and cost-efficient network [36].
In coordination with the TSO, the DSO facilitates the end-users by managing and distributing the energy from the power grid to the consumers through the LV-distribution network [37]. The utility company deals with the economic aspect of electricity in the wholesale and retail markets. The wholesale and retail markets correspond to the electricity trade between the utility company, the power grid, and consumers [38]. The CCOA deals with the retail market prices and coordinates the charging operation of EVs according to the real-time price within their stay time. The stay time S t of an i-th EV (i.e., S t i ) is a function of the arrival–departure sequence ( t a i ,   t d i ) , and the E r is the function of SoC and BC as given by Equations (2) and (3):
S t i = t d i t a i
E i r ( t ) = ( 1 S o C i ( t ) ) × B C i If   charge   until   full   battery ( S o C i r ( t ) S o C i ( t ) ) × B C i If   charge   until   required   SoC .
Considering a constant C r at each time step t, the RT and i-th EV (i.e., R T i ) depend upon the amount of energy demanded as computed in Equation (4). The P h can thus be computed according to price vector P and the stay time S t , for each arrival and departure sequence ( t a , t d ) as given in Equation (5):
R T i = E i C r
P h = 1 S t i t = t a t d × P ( t ) .
The energy consumption E at each time step t is a function of SoC, BC, and the C r as computed in Equation (6). We define the objective function of minimizing the charging cost C for the i-th EV, which is defined as the sum of the product of the energy consumption E and the charging price P, as computed in Equation (7).
E i = ( S o C i ( t 1 ) × B C i ) + ( η × D ( t ) × C r )
min ( D , t , i ) C i = t = t a i t d i E i ( t ) × D i ( t ) × P ( t )
subject to : R T i S t i
P ( t ) P h
C r m i n ( t ) C r ( t ) C r m a x ( t )
S o C m i n ( t ) S o C i ( t ) S o C m a x ( t )
where D is the binary decision control variable with values [0, 1] representing postpone and charge operations. The objective function Equation (7) is subject to several linear constraints, for example the required time RT to charge should be less than the stay time S t and the price P at any time step t, and should be less than the computed threshold price values P h as given in Equations (8) and (9). Similarly, the charging rate C r should be within C r m i n and C r m i n while the SoC should follow the S o C m i n and S o C m a x boundaries as defined by Equations (10) and (11) [39,40]. To resolve the objective function for optimizing the charging cost, we present two algorithms given in Algorithms 1 and 2 with the following details.
Algorithm 1 Main Algorithm of the proposed charging cost optimization algorithm (CCOA)
Input: Arrival and departure times, battery capacity, state-of-charge, and price profile
Output: Optimal charging cost and electric load profiles
  1: Initialize the system local and global variables
  2: Load the electric load (L) and price (P) vectors
  3: for t 1 to | T | do
  4:     for i 1 to | N | do
  5:         Compute S t and E r According to Equations (2) and (3)
  6:         Compute R T and P h According to Equations (4) and (5)
  7:          Validate constraint defined in Equation (9)
  8:         for j 1 to | P | do
  9:              if ( P [ j ] P h [ i ] ) then▹ Validate constraint defined in Equation (8)
10:                   F T S [ i ] P [ j ] ▹ Feasible time steps for charging
11:              end if
12:               j j + 1
13:         end for
14:     end for
15:      t e m p F T S [ 1 ]
16:     for i 1 to | N | do
17:         for k 2 to | F T S | do
18:              while ( l | R T [ i ] | ) do
19:                  if ( F T S [ k ] t e m p ) then
20:                      O T S [ l ] F T S [ k ] ▹ Optimal time steps with lowest cost
21:                      D [ i ] 1
22:                      t e m p F T S [ k ]
23:                  end if
24:                   l l + 1
25:                end while
26:         end for
27:         Charge_Control( N [ i ] , O T S [ l ] , R T [ i ] , S o C [ i ] , B C [ i ] , E r [ i ] , D [ i ] , P , L )
28:         Print the updated results
29:     end for
30:      t t + 1
31: end for
Step 1.
Initialize all the system local and global variables (i.e., N, t, i , j , k , and the arrays) and load L and price P vectors.
Step 2.
Collect the input data and compute the stay time S t , required energy E r , required time steps RT, and the threshold price P h value for each of the i-th EVs, using Equations (2)–(5). Moreover, for each EV, validate the constraint defined in Equation (9).
Step 3.
Collect the FTS for charging each of the i-th EVs according the threshold price value defined within their arrival and departure sequence in lines 7 to 12.
Step 4.
Get the first price value from the feasible time steps FTS a.k.a. the feasible solution set and compute the OTS by setting the decision D variable for each of the i-th EV in lines 15 to 25.
Step 5.
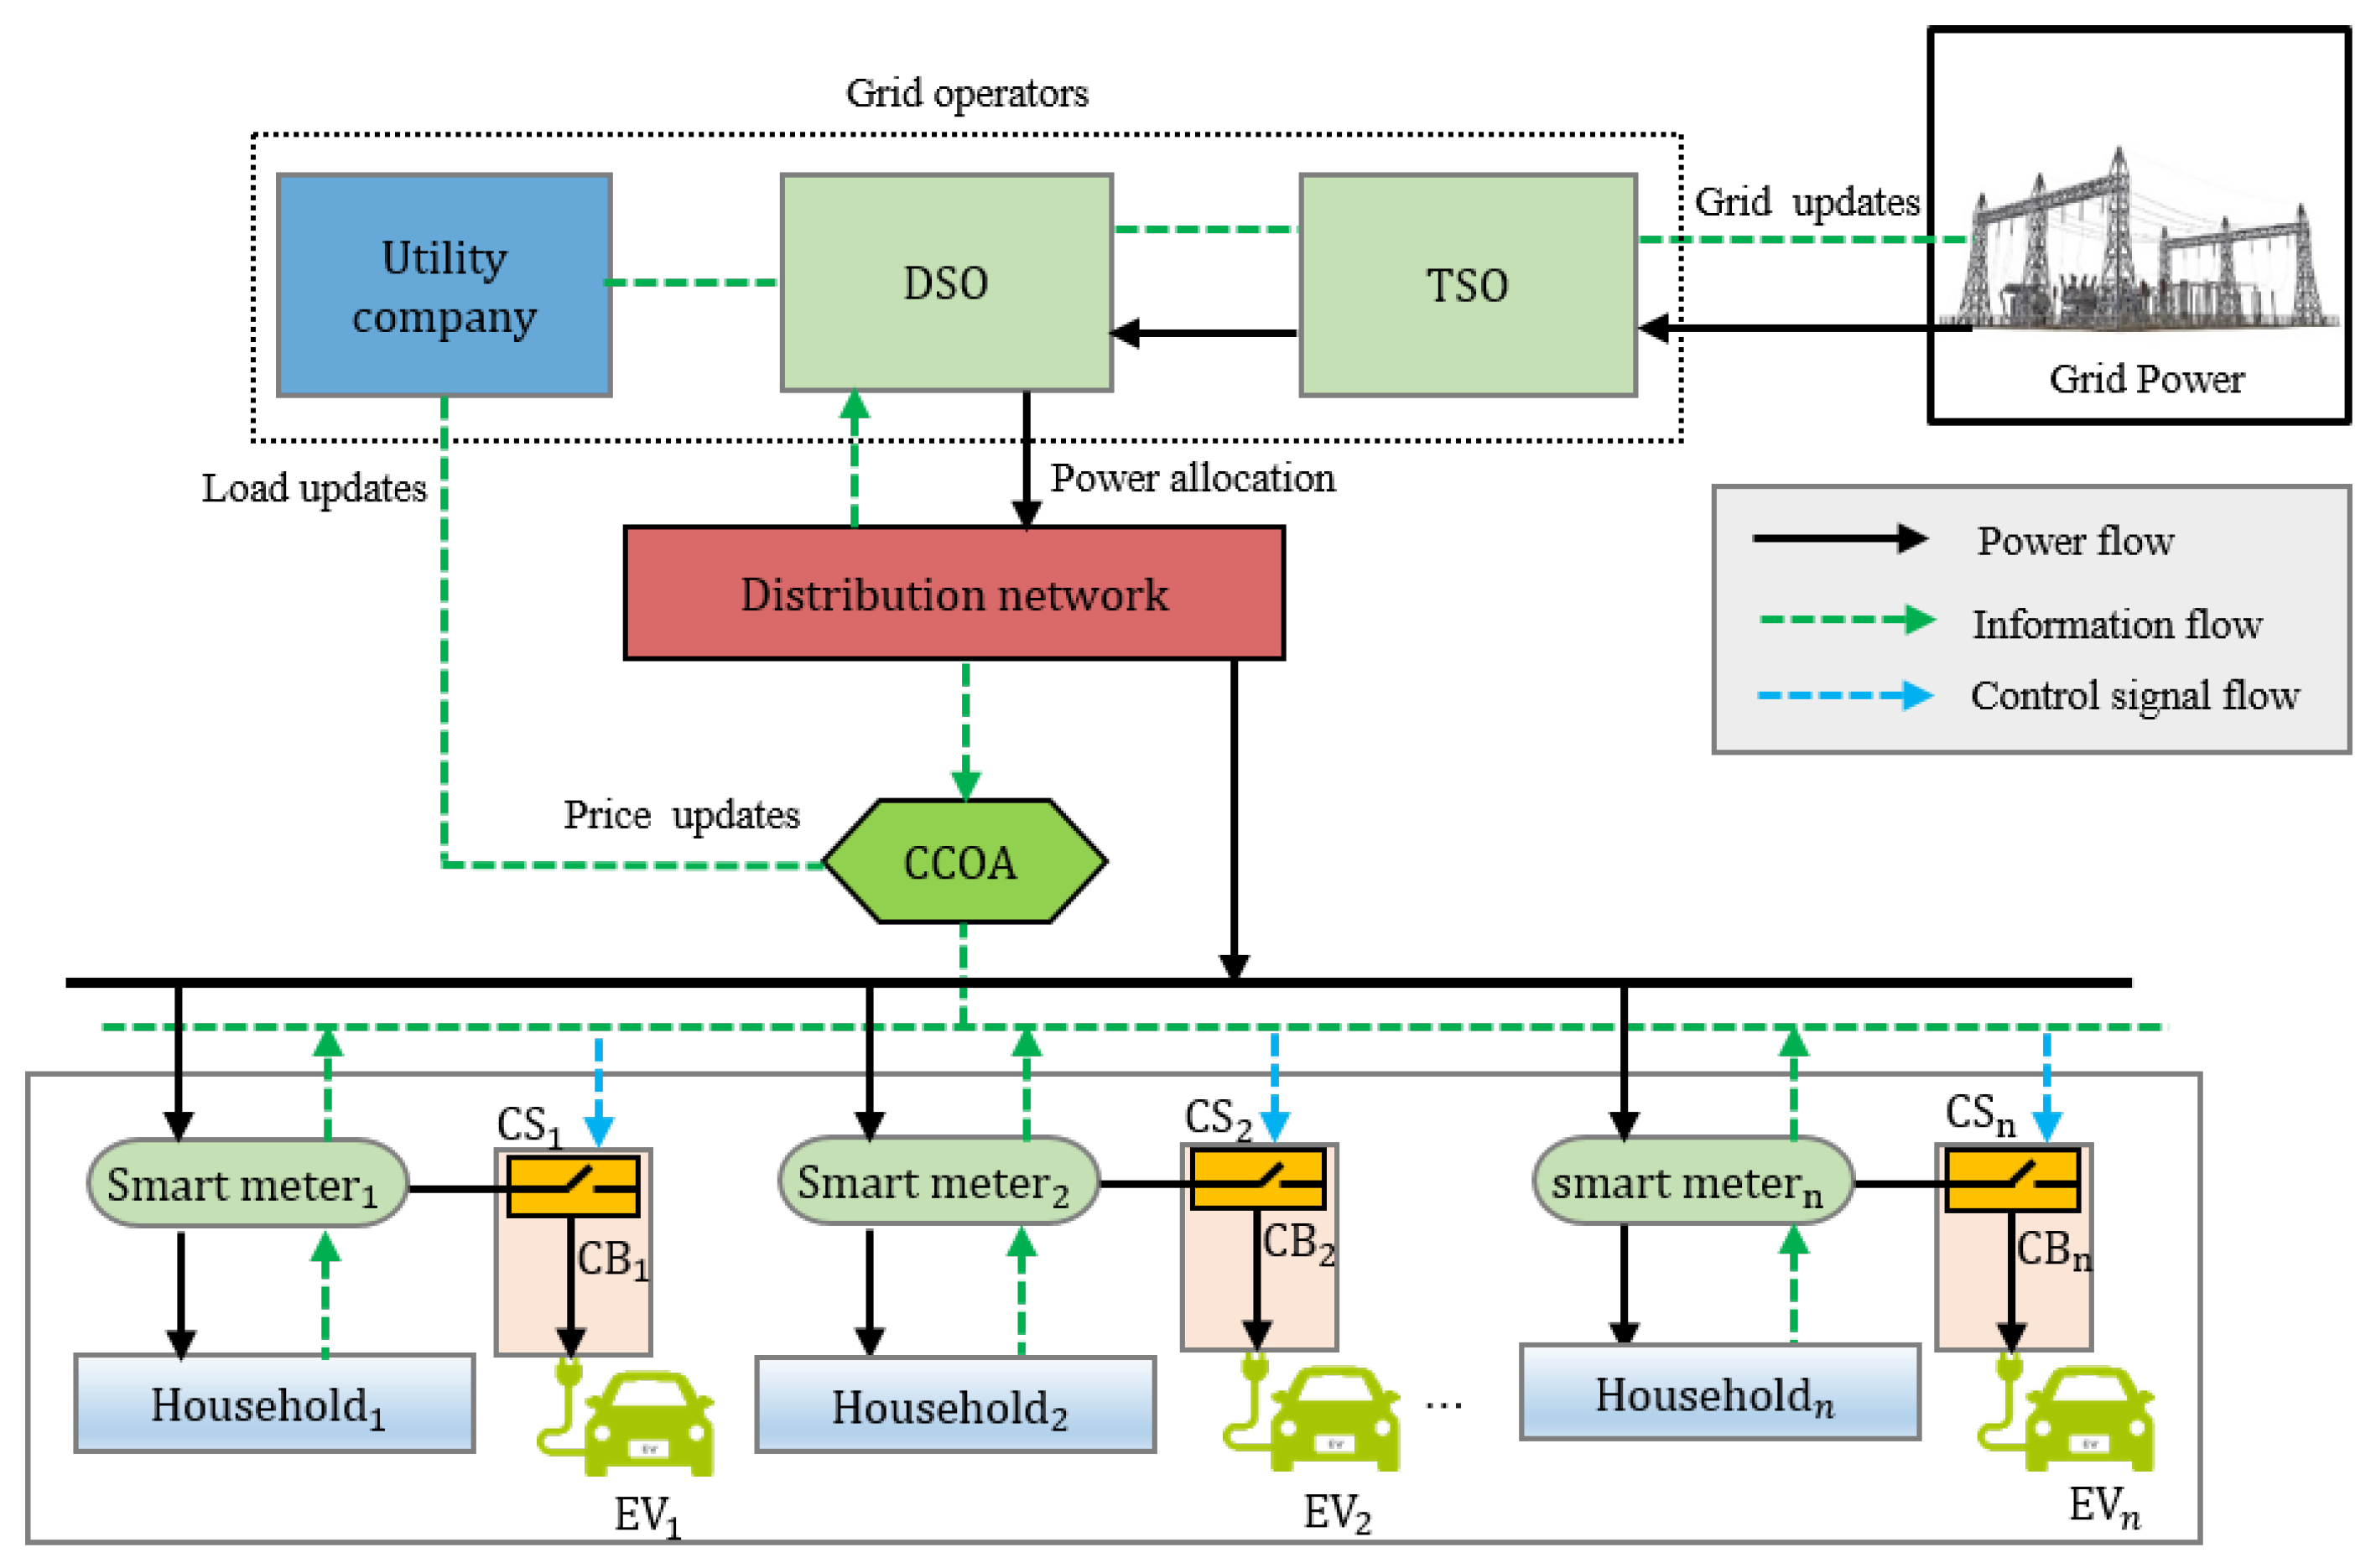
Call the subroutine Charge_Control (i.e., Algorithm 2). First, it validates constraints defined by Equations (10) and (11). Then, it checks the optimal charging steps, the decision variable, and the energy requirements and thereby controls the charging process of EVs according to their optimal schedules. For each charging, the activity updates the charging cost and the electric load vectors in lines 6 to 12. Finally, it returns the updated SoC, charging cost C, and electric load L vectors to Algorithm 1.
Step 6.
Print the updated results. Increment the time step t and repeat the process for the remaining intervals.
Algorithm 2 Charge_Control( N [ i ] , O T S [ l ] , R T [ i ] , S o C [ i ] , B C [ i ] , E r [ i ] , D [ i ] , P , L )
  1: Initialize local variables
  2: for j 1 to | P | do
  3:       while ( l | R T [ i ] | ) do
  4:             Validate constraint defined in Equations (10) and (11)
  5:             if ( ( P [ j ] = = O T S [ l ] | | D [ i ] = = 1 ) & & S o C [ i ] E r [ i ] ) then
  6:                    ( S o C [ i ] × B C [ i ] ) ( S o C [ i ] × B C [ i ] ) + ( η × C r ) ▹ Charge i-th EV
  7:                    C [ l ] C [ l ] + C [ l + 1 ] ▹ Update charging cost
  8:                    L [ l ] L [ l ] + ( S o C [ i ] × B C [ i ] ) ▹ Update electric load
  9:             else
10:                    S o C [ i ] S o C [ i 1 ]
11:                    C [ l ] C [ l ]
12:                    L [ l ] L [ l ]
13:             end if
14:              l l + 1
15:       end while
16: end for
17: Return updated ( S o C [ i ] , C [ l ] , and L [ l ] )

4. Simulation Results and Discussion

The simulation is based on three types of price profiles, including real-time, flat-rate, and time-of-use TOU [41], as illustrated in Figure 4. Moreover, we conduct charging scenarios for individual and aggregated EVs with fixed and random arrival and departure sequences to evaluate the efficiency of the proposed CCOA against UCC, CFR, and CTOU, respectively. For all these scenarios, we assume a η = 0.95 [42], charging rate ( C r = 6.6 kWh) [43], and time step (t = 15 min), while the rest of their details are presented as follows.

4.1. Individual Charging Scenario

In this scenario, we consider a single household with the baseload (i.e., electric load) profile shown in Figure 5. Moreover, it assumes the EV with known parameters such as arrival & departure time sequence, SoC, V, and i, as given in Table 1. The battery charging process with different charging schemes is shown, in Figure 6. The battery charges in different time steps according to the different schemes. Depending on the connection and flat charging cost, the charging process starts immediately with UCC and CFR charging schemes. The CTOU delays charging until the off-peak period, while the proposed CCOA finds the most optimal time steps and controls the charging process according to the real-time price pattern. Following the charging process, each charging scheme has a different charging load, as shown in Figure 7. All three schemes, except the CCOA, result in a new peak load. The new peak with UCC and CFR is 3.56 kW, while it is 3.27 kW with the CTOU scheme.
The efficiency of CTOU depends on the required time RT steps for charging and thereby exceeding the RT from the TOU period results in overloading the grid load. However, the CCOA learns the real-time prices to find the most optimal time steps for charging such that it avoids grid overload. Following the charging schedules and the grid load, a comparison of charging cost with UCC, CFR, CTOU, and CCOA is illustrated in Figure 8. Compared to all three schemes, the CCOA results in optimal charging cost, and thereby the accumulated charging cost is 265.10, 151.50, 137.27, and 131.90 cents concerning the UCC, CFR, CTOU, and CCOA, respectively. This implies that for an EV, the proposed CCOA reduces the charging cost by 133.20, 19.60, and 5.37 cents compared to the UCC, CFR, and CTOU methods.

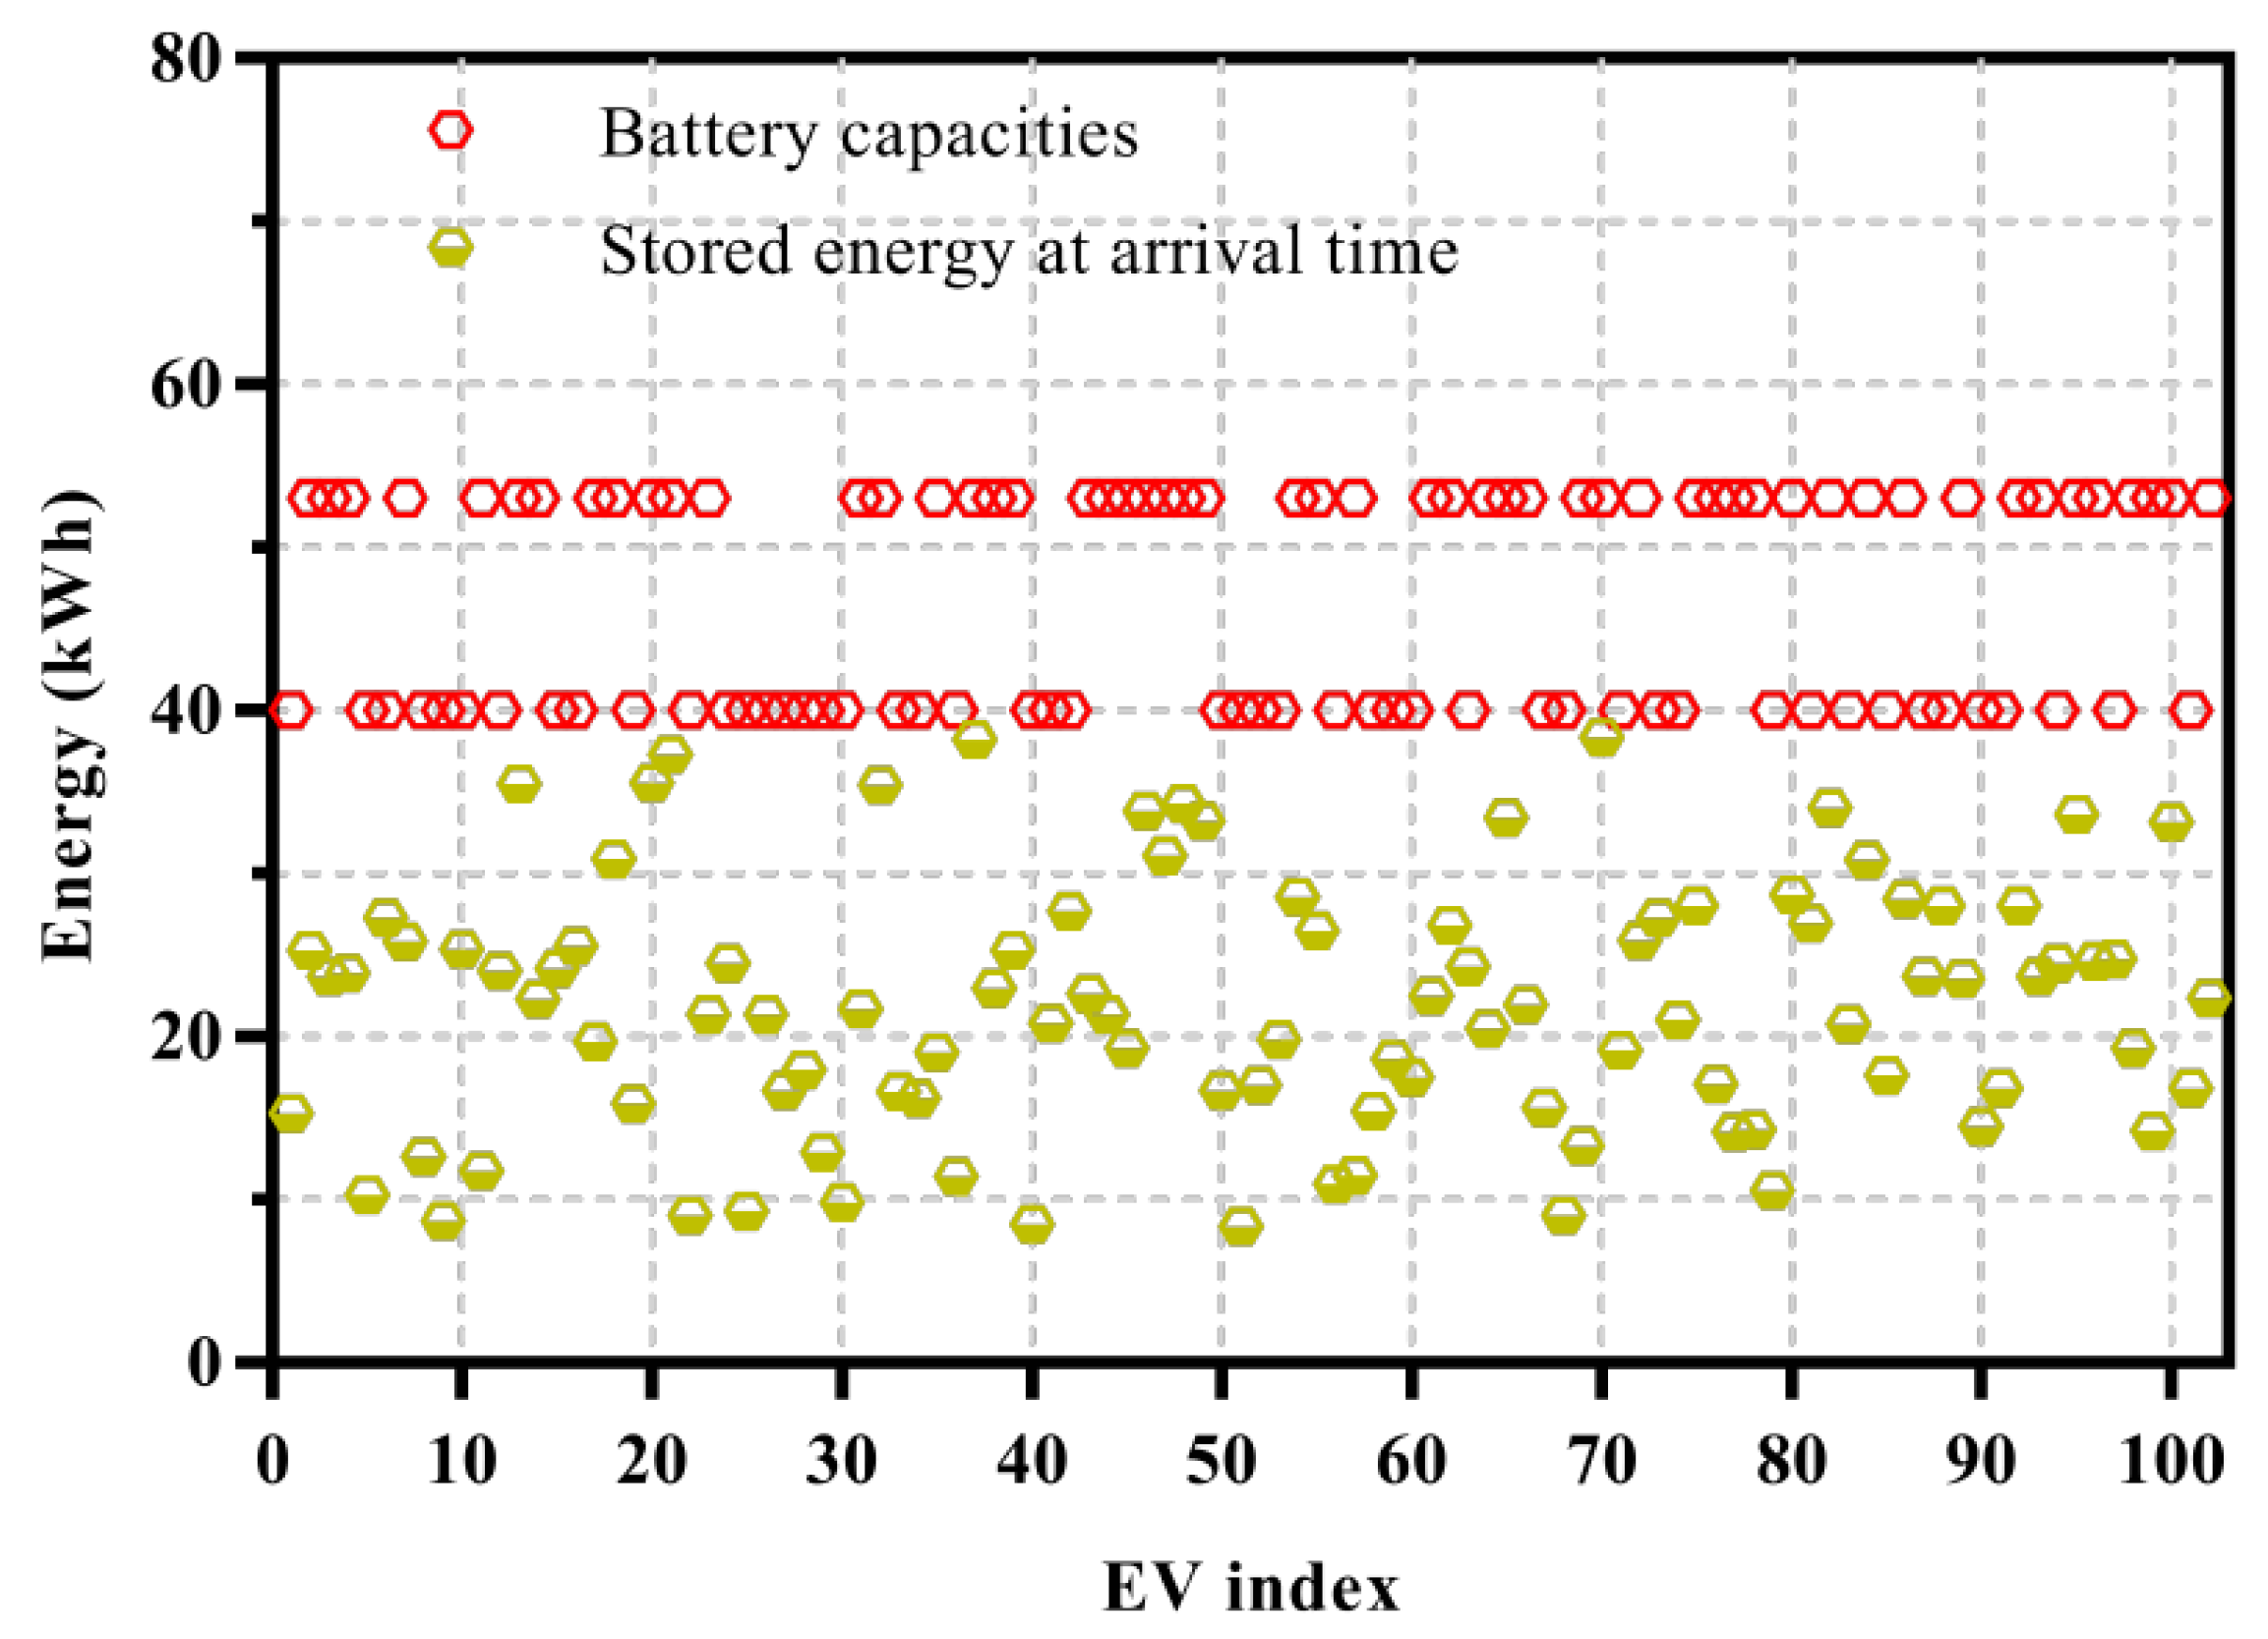
4.2. Aggregated Charging Scenario

To investigate the impact of aggregated EVs on the distribution level, we considered a LV distributed network connecting 102 houses, as shown in Figure 9 [25]. The electric load on the LV distributed network is the sum of all the baseloads of the connected houses and the EVs energy consumption. In realistic situations, the LV distribution network supports EVs with different battery types and capacities. Consequently, EVs with battery capacities of 40 kWh and 53 kWh with a 50% penetration level for each battery type are considered in an aggregated scenario [42,45]. To realize the distinct behavior of the EV users, we generate a random arrival and departure sequences using Gaussian distribution with μ = 6:00 PM, σ = 3 h and μ = 10:00 AM, σ = 2.5 h, obtained from the PDF of NHTS [46], respectively as given in Figure 10. The arrival time SoC for the EVs are distributed through uniform distribution between 20% to 50% of their battery capacities, as given in Figure 11. The different charging methods correspond to different charging loads. A comparison of the charging load concerning the UCC, CFR, CTOU, and CCOA is shown as a violin graph in Figure 12. The average load is about 213.76 kW with the UCC and CFR methods, while it is 185.51 kW and 178.68 kW with the CTOU and CCOA methods. Thus, the CCOA reduces the average charging load by 35.08 kW and 6.83 kW compared to the UCC and CFR, and CTOU methods. The proposed CCOA efficiently handles the charging that helps to maintain the load, while the UCC and CFR, and the CTOU result in new peak loads. The charging cost for the UCC, CFR, CTOU, and CCOA is compared in Figure 13. The figure shows that the UCC has the highest charging cost followed by the CFR and CTOU, while the proposed CCOA has the least cost. The average charging cost is 66.25, 47.65, 38.86, and 29.93 cents with respect to UCC, CFR, CTOU, and CCOA methods, respectively. This implies that the CCOA reduces the average charging cost by 60.00%, 43.00%, and 35.00% cents/kW compared to the UCC, CFR, and CTOU methods, respectively.

5. Conclusions

In this paper, we developed charging cost optimization algorithms CCOA based on real-time prices for the residential charging of EVs. The proposed CCOA computes a threshold price value for each arrival and departure sequence of EVs and accordingly coordinates the charging process with optimizing the cost while avoiding gird overloading at each scheduling period. The CCOA computes the holistic charging cost until the battery’s desired capacity by capturing the cost of each charging activity. Various charging scenarios with individual and aggregated EVs against the real-time price pattern are simulated through MATLAB. The simulation results are verified against the UCC, CFR, and CTOU methods. In the case of individual charging scenarios, the CCOA reduced the charging cost by 133.20, 19.60, and 5.37 cents/kW while avoiding grid overloading compared to the UCC, CFR, and CTOU methods. Considering the aggregated scenario, the CCOA reduced the average load by 35.08 kW and 6.83 kW compared to the UCC and CFR, and CTOU methods. The average charging cost is minimized by 60.00%, 43.00%, and 35.00% cents compared to the UCC, CFR, and CTOU methods, respectively.
This work utilized the day-ahead electric load and price profiles assuming similar household consumption and prices patterns; however, forecasting the electric load and price profiles using neural network algorithms will result in more accurate and realistic analysis. Consequently, in future, the proposed work will focus on incorporating the electric load and prices historical data and neural network-based models.

Author Contributions

Conceptualization, S.H., S.S. and Q.J.; methodology, S.H., S.S. and Q.J.; software, S.H.; validation, S.H., S.S., S.T., I.A., F.K. and M.G.M.; writing—original draft preparation, S.H., S.S., Q.J., I.A., F.K. and M.M.; writing—review and editing, S.H., S.S., Q.J., S.T., M.M., M.G.M. and J.G.B.; supervision, J.G.B. and S.T.; project administration, S.T.; funding acquisition, J.G.B. and S.T. All authors have read and agreed to the published version of the manuscript.

Funding

This publication has emanated from research supported in part by a grant from Cooperative Energy Trading System (CENTS) under grant number REI1633, and also by grants from Science Foundation Ireland under Grant Numbers 12/RC/2289_P2 (Insight), 16/RC/3918 and 16/RC/3835 co-funded by the European Regional Development Fund. For the purpose of Open Access, the author has applied a CC BY public copyright licence to any Author Accepted Manuscript version arising from this submission.

Conflicts of Interest

The authors declare no conflict of interest.

Nomenclature

EVselectric vehicles
CCOAcharging cost optimization algorithms
CO2carbon dioxide
ICEsinternal combustion engines
MMTmillion metric ton
V2Gvehicle-to-grid
TOUtime of use
SoCstate-of-charge
SoCminminimum state-of-charge
SoCmaxmaximum state-of-charge
GAgenetic algorithm
NHTSNational Household Travel Survey
PEVsplug-in electric vehicles
MILPmixed integer linear programming
CSscharging stations
ttime step
BCbattery capacity
Ccharging cost
iindex of an EV
Eenergy
Pcharging price
taarrival time
tddeparture time
Ststay time
Ddecision control variable
kWhkilowatt-hour
P1off-peak/valley price
P2mid-peak price price
P3on-peak price price
TSOtransmission system operator
DSOdistribution system operator
LVlow-voltage
Errequired amount of energy
BCbattery capacity
Crcharging rate
C r m i n minimum charging rate
C r m a x maximum charging rate
RTrequired time to charge
Phthreshold price value
Lelectric load
Nnumber of EVs array/vector
Tmaximum number of simulation steps
i, j, kloop control variables
FTSfeasible time steps array/vector
OTSoptimal time steps array/vector
UCCuncoordinated charging
CFRcoordinated charging based on flat-rate
CTOUcoordinated charging based on time-of-use
Vvoltage
Icurrent
μmean
σstandard deviation
ηcharging efficiency
PDFprobability distribution function

References

  1. Beliveau, M.; Rehberger, J.; Rowell, J.; Xarras, A. A Study on Hybrid Cars: Environmental Effects and Consumer Habits. Bachelor’s Thesis, Worcester Polytechnic Institute, Worcester, MA, USA, 2010. [Google Scholar]
  2. Lee, W.; Schubert, E.; Li, Y.; Li, S.; Bobba, D.; Sarlioglu, B. Electrification of turbocharger and supercharger for downsized internal combustion engines and hybrid electric vehicles-benefits and challenges. In Proceedings of the 2016 IEEE Transportation Electrification Conference and Expo (ITEC), Dearborn, Michigan, 27–29 June 2016; pp. 1–6. [Google Scholar]
  3. Domke, G.M.; Walters, B.F.; Nowak, D.J.; Smith, J.; Nichols, M.C.; Ogle, S.M.; Coulston, J.; Wirth, T. Greenhouse gas emissions and removals from forest land, woodlands, and urban trees in the United States, 1990–2019. In Resource Update FS–307; US Department of Agriculture, Forest Service, Northern Research Station. 5: Madison, WI, USA, 2021; Volume 307. [Google Scholar]
  4. Arora, S.; Priolkar, J. Simulation and analysis of hybrid energy source for electric vehicle. In Proceedings of the 2016 IEEE 1st International Conference on Power Electronics, Intelligent Control and Energy Systems (ICPEICES), Delhi, India, 4–6 July 2016; pp. 1–6. [Google Scholar]
  5. Lee, E.H.P.; Lukszo, Z. Scheduling fuel cell electric vehicles as power plants in a community microgrid. In Proceedings of the 2016 IEEE Pes Innovative Smart Grid Technologies Conference Europe (Isgt-Europe), Ljubljana, Slovenia, 9–12 October 2016; pp. 1–6. [Google Scholar]
  6. Shao, S.; Pipattanasomporn, M.; Rahman, S. Grid integration of electric vehicles and demand response with customer choice. IEEE Trans. Smart Grid 2012, 3, 543–550. [Google Scholar] [CrossRef]
  7. Khan, R.H.; Stüdli, S.; Khan, J.Y. A network controlled load management scheme for domestic charging of electric vehicles. In Proceedings of the 2013 Australasian Universities Power Engineering Conference (AUPEC), Hobart, Australia, 29 September–3 October 2013. [Google Scholar]
  8. Rahim, M.H.; Javaid, N.; Shafiq, S.; Iqbal, M.N.; Khalid, M.U.; Memon, U.U. Exploiting heuristic techniques for efficient energy management system in smart grid. In Proceedings of the 2018 14th International Wireless Communications & Mobile Computing Conference (IWCMC), Limassol, Cyprus, 25–29 June 2018; pp. 54–59. [Google Scholar]
  9. Detzler, S.; Eichhorn, C.; Karnouskos, S. Charging optimization of enterprise electric vehicles for participation in demand response. In Proceedings of the 2015 International Symposium on Smart Electric Distribution Systems and Technologies (EDST), Vienna, Austria, 7–11 September 2015; pp. 284–289. [Google Scholar]
  10. Shahzad, A.; Xiong, N.; Irfan, M.; Lee, M.; Hussain, S.; Khaltar, B. A SCADA intermediate simulation platform to enhance the system security. In Proceedings of the 2015 17th International Conference on Advanced Communication Technology (ICACT), Phoenix Park, Korea, 1–3 July 2015; pp. 368–373. [Google Scholar]
  11. Hussain, S.; Kim, Y.C. Simulation studies of resilient communication network architecture for monitoring and control wind power farms. In Proceedings of the 2015 17th International Conference on Advanced Communication Technology (ICACT), Phoenix Park, Korea, 1–3 July 2015; pp. 653–658. [Google Scholar]
  12. Hussain, S.; Kim, Y.C. Multilayer communication network architecture for wind power farm. In Proceedings of the 2014 IEEE 19th International Workshop on Computer Aided Modeling and Design of Communication Links and Networks (CAMAD), Athens, Greece, 1–3 December 2014; pp. 105–109. [Google Scholar]
  13. Carli, R.; Dotoli, M. A distributed control algorithm for waterfilling of networked control systems via consensus. IEEE Control Syst. Lett. 2017, 1, 334–339. [Google Scholar] [CrossRef]
  14. Hussain, S.; Kim, Y.C.; Jan, Q.; Ali, Z. Simulation Studies of Reconfigurable Communication Network for Southwest Offshore Wind Farm South Korea. In Proceedings of the 2019 2nd International Conference on Communication, Computing and Digital systems (C-CODE), Islamabad, Pakistan, 6–7 March 2019; pp. 58–63. [Google Scholar]
  15. Panday, A.; Bansal, H.O. A review of optimal energy management strategies for hybrid electric vehicle. Int. J. Veh. Technol. 2014. [Google Scholar] [CrossRef] [Green Version]
  16. Braun, A.; Rid, W. The influence of driving patterns on energy consumption in electric car driving and the role of regenerative braking. Transp. Res. Procedia 2017, 22, 174–182. [Google Scholar] [CrossRef]
  17. Paterakis, N.G.; Gibescu, M. A methodology to generate power profiles of electric vehicle parking lots under different operational strategies. Appl. Energy 2016, 173, 111–123. [Google Scholar] [CrossRef] [Green Version]
  18. Mets, K.; Verschueren, T.; De Turck, F.; Develder, C. Exploiting V2G to optimize residential energy consumption with electrical vehicle (dis) charging. In Proceedings of the 2011 IEEE First International Workshop on Smart Grid Modeling and Simulation (SGMS), Brussels, Belgium, 17 October 2011; pp. 7–12. [Google Scholar]
  19. Alonso, M.; Amaris, H.; Germain, J.G.; Galan, J.M. Optimal charging scheduling of electric vehicles in smart grids by heuristic algorithms. Energies 2014, 7, 2449–2475. [Google Scholar] [CrossRef]
  20. Sandels, C.; Franke, U.; Ingvar, N.; Nordström, L.; Hamren, R. Vehicle to grid—Monte Carlo simulations for optimal aggregator strategies. In Proceedings of the 2010 International Conference on Power System Technology, Hangzhou, China, 24–28 October 2010; pp. 1–8. [Google Scholar]
  21. Lojowska, A.; Kurowicka, D.; Papaefthymiou, G.; van der Sluis, L. From transportation patterns to power demand: Stochastic modeling of uncontrolled domestic charging of electric vehicles. In Proceedings of the 2011 IEEE Power and Energy Society General Meeting, Detroit, MI, USA; 2011; pp. 1–7. [Google Scholar]
  22. Wang, D.; Guan, X.; Wu, J.; Gao, J. Analysis of multi-location PEV charging behaviors based on trip chain generation. In Proceedings of the 2014 IEEE International Conference on Automation Science and Engineering (CASE), Taipei, Taiwan, 18–22 August 2014; pp. 151–156. [Google Scholar]
  23. Yusuf, J.; Watanabe, R.; Ula, S.; Todd, M.; Gomez, H. Data Driven Stochastic Energy Cost Optimization with V2G Operation in Commercial Buildings. In Proceedings of the 2020 52nd North American Power Symposium (NAPS), Tempe, AZ, USA, 11–13 April 2021; pp. 1–6. [Google Scholar]
  24. Faia, R.; Soares, J.; Vale, Z.; Corchado, J.M. An optimization model for energy community costs minimization considering a local electricity market between prosumers and electric vehicles. Electronics 2021, 10, 129. [Google Scholar] [CrossRef]
  25. Hussain, S.; Ahmed, M.A.; Kim, Y.C. Efficient power management algorithm based on fuzzy logic inference for electric vehicles parking lot. IEEE Access 2019, 7, 65467–65485. [Google Scholar] [CrossRef]
  26. Hussain, S.; Lee, K.B.; A Ahmed, M.; Hayes, B.; Kim, Y.C. Two-stage fuzzy logic inference algorithm for maximizing the quality of performance under the operational constraints of power grid in electric vehicle parking lots. Energies 2020, 13, 4634. [Google Scholar] [CrossRef]
  27. Hussain, S.; Kim, Y.S.; Thakur, S.; Breslin, J.G. Optimization of Waiting Time for Electric Vehicles Using a Fuzzy Inference System. IEEE Trans. Intell. Transp. Syst. 2022. [CrossRef]
  28. Qian, K.; Zhou, C.; Allan, M.; Yuan, Y. Modeling of load demand due to EV battery charging in distribution systems. IEEE Trans. Power Syst. 2010, 26, 802–810. [Google Scholar] [CrossRef]
  29. Ma, Z.; Callaway, D.S.; Hiskens, I.A. Decentralized charging control of large populations of plug-in electric vehicles. IEEE Trans. Control. Syst. Technol. 2011, 21, 67–78. [Google Scholar] [CrossRef]
  30. Zhang, P.; Qian, K.; Zhou, C.; Stewart, B.; Hepburn, D. Demand response for optimisation of power systems demand due to EV charging load. In Proceedings of the 2012 Asia-Pacific Power and Energy Engineering Conference, Shanghai, China, 27–29 March 2012; pp. 1–4. [Google Scholar]
  31. Ansarin, M.; Ghiassi-Farrokhfal, Y.; Ketter, W.; Collins, J. The economic consequences of electricity tariff design in a renewable energy era. Appl. Energy 2020, 275, 115317. [Google Scholar] [CrossRef]
  32. Hussain, S.; Ahmed, M.A.; Lee, K.B.; Kim, Y.C. Fuzzy logic weight based charging scheme for optimal distribution of charging power among electric vehicles in a parking lot. Energies 2020, 13, 3119. [Google Scholar] [CrossRef]
  33. Chen, L.; Huang, X.; Zhang, H.; Luo, Y. A study on coordinated optimization of electric vehicle charging and charging pile selection. Energies 2018, 11, 1350. [Google Scholar] [CrossRef] [Green Version]
  34. Soltani, N.Y.; Kim, S.J.; Giannakis, G.B. Real-time load elasticity tracking and pricing for electric vehicle charging. IEEE Trans. Smart Grid 2014, 6, 1303–1313. [Google Scholar] [CrossRef]
  35. Ghenai, C.; Bettayeb, M. Data analysis of the electricity generation mix for clean energy transition during COVID-19 lockdowns. In Energy Sources, Part A: Recovery, Utilization, and Environmental Effects; Taylor & Francis: Boca Raton, FL, USA, 2021; pp. 1–21. [Google Scholar]
  36. Venegas, F.G.; Petit, M.; Perez, Y. Active integration of electric vehicles into distribution grids: Barriers and frameworks for flexibility services. Renew. Sustain. Energy Rev. 2021, 145, 111060. [Google Scholar] [CrossRef]
  37. Lonergan, K.E.; Sansavini, G. Business structure of electricity distribution system operator and effect on solar photovoltaic uptake: An empirical case study for Switzerland. Energy Policy 2022, 160, 112683. [Google Scholar] [CrossRef]
  38. Kuiken, D. Regulating electricity network reliability. In Elgar Encyclopedia of Environmental Law; Edward Elgar Publishing Limited: Cheltenham, UK, 2021; pp. 611–620. [Google Scholar]
  39. Carli, R.; Dotoli, M. A distributed control algorithm for optimal charging of electric vehicle fleets with congestion management. IFAC-PapersOnLine 2018, 51, 373–378. [Google Scholar] [CrossRef]
  40. Stüdli, S.; Crisostomi, E.; Middleton, R.; Shorten, R. A flexible distributed framework for realising electric and plug-in hybrid vehicle charging policies. Int. J. Control 2012, 85, 1130–1145. [Google Scholar] [CrossRef]
  41. Algarni, A.; Siegel, H.J.; Maciejewski, A.A.; Suryanarayanan, S. Incorporation of Survey-based Data into an Aggregation Algorithm for Residential Demand Response. In Proceedings of the 2021 IEEE Madrid PowerTech, Madrid, Spain, 28 June–2 July 2021; pp. 1–5. [Google Scholar]
  42. Dickerman, L.; Harrison, J. A new car, a new grid. IEEE Power Energy Mag. 2010, 8, 55–61. [Google Scholar] [CrossRef]
  43. Marková, I.; Oravec, M.; Osvaldová, L.M.; Sventeková, E.; Jurč, D. Magnetic Fields of Devices during Electric Vehicle Charging: A Slovak Case Study. Symmetry 2021, 13, 1979. [Google Scholar] [CrossRef]
  44. Sarabi, S.; Kefsi, L.; Asma, M.; Robyns, B. Supervision of Plug-In Electric Vehicles Connected to the Electric Distribution Grids. Int. J. Electr. Energy 2013, 1, 256–263. [Google Scholar] [CrossRef] [Green Version]
  45. Tamura, S.; Kikuchi, T. V2G strategy for frequency regulation based on economic evaluation considering EV battery longevity. In Proceedings of the 2018 IEEE International Telecommunications Energy Conference (INTELEC), Turino, Italy, 7–11 October 2018; pp. 1–6. [Google Scholar]
  46. Preethi, A.A.; Nesamalar, J.J.D.; Suganya, S.; Raja, S.C. Economic scheduling of Plug-In Hybrid Electric Vehicle considering various travel patterns. In Proceedings of the 2018 National Power Engineering Conference (NPEC), Madurai, India, 9–10 March 2018; pp. 1–7. [Google Scholar]
Figure 1. Flowchart of uncoordinated charging of electric vehicles (EVs).
Energies 15 01304 g001
Figure 2. Illustration of charging process and the cost. (a). Standard tariff with flat rate (b). Different time-of-use (TOU) tariff systems.
Energies 15 01304 g002
Figure 3. System model of the proposed charging cost optimization algorithm (CCOA).
Energies 15 01304 g003
Figure 4. Real-time, flat-rate, and time-of-use price profiles.
Energies 15 01304 g004
Figure 5. Electric load (i.e., baseload) profile of a typical household.
Energies 15 01304 g005
Figure 6. Battery charging process with uncontrolled charging (UCC), coordinated charging based on flat-rate (CFR), coordinated charging based on time-of-use (CTOU), and charging cost optimization algorithm (CCOA).
Energies 15 01304 g006
Figure 7. Electric load profiles concerning UCC, CFR, CTOU, and CCOA charging schemes.
Energies 15 01304 g007
Figure 8. Charging costs concerning UCC, CFR, CTOU, and CCOA charging schemes.
Energies 15 01304 g008
Figure 9. Low voltage distribution network with aggregated households and EV loads.
Energies 15 01304 g009
Figure 10. Arrival and departure distribution of electric vehicles (EVs).
Energies 15 01304 g010
Figure 11. Arrival time state-of-charge (SoC) distribution against each type of battery capacity.
Energies 15 01304 g011
Figure 12. Violin graph of charging load profile concerning UCC, CFR, CTOU, and CCOA schemes.
Energies 15 01304 g012
Figure 13. Charging cost of EVs concerning UCC, CFR, CTOU, and CCOA schemes.
Energies 15 01304 g013
Table 1. Input parameters for an individual charging scenario.
ParametersValuesDescriptionReference
V220 VVoltage[42]
I30 AmpCurrent
Cr6.6 kWhFast charger
BC53 kWhTesla
ta5:45 PMArrital time[44]
td9:15 AMDeparture time
SoC0.4Stored energy-
SoCmin0.2Minimum energy
SoCmax1Until BC
RT19.5Required time stepsEquation (4)
Publisher’s Note: MDPI stays neutral with regard to jurisdictional claims in published maps and institutional affiliations.

