
Smart Thermostats for a Campus Microgrid: Demand Control and Improving Air Quality


Institute of System and Robotics, Department of Electrical and Computer Engineering, University of Coimbra, 3030-290 Coimbra, Portugal
*
Author to whom correspondence should be addressed.
Energies 2022, 15(4), 1359; https://0-doi-org.brum.beds.ac.uk/10.3390/en15041359
Submission received: 31 December 2021
/
Revised: 1 February 2022
/
Accepted: 8 February 2022
/
Published: 14 February 2022
(This article belongs to the Special Issue Improving the Energy Efficiency of Buildings)
Abstract
:Achieving nearly zero-energy buildings (nZEB) is one of the main objectives defined by the European Union for achieving carbon neutrality in buildings. nZEBs are heavily reliant on distributed renewable generation energy sources, which create new challenges associated with their inherent intermittency. To achieve nZEB levels, demand management plays an essential role to balance supply and demand. Since up to two-thirds of the total consumed energy in buildings is dispended for Heating, Ventilation and Air Conditioning (HVAC) operations, intelligent control of HVAC loads is of utmost importance. The present work aims to offer a solution to improve a building microgrids’ flexibility by shifting thermal loads and taking advantage of room thermal inertia. Innovation is present in using the internet of things to link several decentralized local microcontrollers with the microgrid and in the applicability of different control algorithms, such as the pre-emptive heating/cooling of a room. The developed solution relies on smart thermostats, which can be integrated into a building management system, or in a microgrid, and are capable of fulfilling the occupants’ need for comfort while complementing the building with needed power flexibility. The equipment is capable of controlling several HVAC systems to guarantee thermal and air quality comfort, as well as coordinate with a building/microgrid operator to reduce energy costs by shifting thermal loads and enacting demand control strategies. The smart thermostat uses an algorithm to calculate room inertia and to pre-emptively heat/cool a room to the desired temperature, avoiding peak hours, taking advantage of variable tariffs for electricity, or periods of solar generation surplus. The smart thermostat was integrated into a university campus microgrid and tested in live classrooms. Since the work was developed during the COVID-19 pandemic, special attention was given to the air quality features. Results show that smart HVAC control is a viable way to provide occupant comfort, as well as contribute to the integration of renewable generation and increase energy efficiency in buildings and microgrids.
1. Introduction
1.1. Motivation
The world is facing new challenges resulting from increased energy demand, resource high costs/scarcity and the urgent need to combat climate change. Reducing greenhouse gas emissions is one of the reasons for the paradigm shift to a fully decarbonized economy. To achieve this, worldwide efforts are being made to increase the penetration of renewable energy sources and improve energy efficiency. Energy efficiency is a valuable tool to address these challenges and to manage energy demand: It reduces primary energy consumption, reduces costs and resources and reduces greenhouse gas emissions. In the European Union, buildings account for 40% of the total energy consumption and 36% of the greenhouse gas emissions [1]. To promote energy efficiency in buildings, the EU has established several directives [2,3] that cover measures and policies to boost EU energy performance such as promoting building renovation, issuing energy certificates and making it obligatory for all new buildings built after 2020 to be near zero-energy buildings (nZEB) [4].
High penetration of renewable generation is desirable but not without its own new challenges. In the majority of the currently used renewable energy sources (solar and wind), generation is variable and intermittent, which disturbs the power balance for safe operation. This increases the need for flexibility in the power grid to be able to maintain operation during unexpected events and to cope with uncertainty on the supply and demand sides [5]. An ongoing research topic concerning flexibility and energy efficiency is the use of resilient microgrids. Microgrids present new solutions tailored for local needs while avoiding the high costs of reinforcing infrastructure or centralized generation [6]. The benefits of microgrids include increased load flexibility, more efficient integration of intermittent renewable generation, reduced transmission and distribution losses, the provision of ancillary services, as well as economic and environmental benefits. An important characteristic of microgrids is their ability to work autonomously from the main utility grid using local generation and energy storage, taking advantage of flexible load demand. When considering the implementation of a building microgrid, a high amount of flexibility is desirable to ensure stable operation. Loads that are neither critical nor necessary to a microgrid operation are prime targets for demand control measures due to their ease of being shifted, temporarily reduced or eliminated. Such is the case for HVAC loads in residential or office workplaces.
Additionally, recent worldwide events have raised attention to the need for maintaining good air quality. In 2021, the global average of atmospheric carbon dioxide hit a new record: 421 parts per million (ppm), and the rate that carbon dioxide has been accumulating in the atmosphere is now 100 times faster than it was 60 years ago, and faster than any known natural causes [7,8]. As well as the effects caused by carbon dioxide in the atmosphere such as the well-known greenhouse effect, carbon dioxide also has visible effects on the health of humans. In outdoor spaces, the concentration is not enough to cause difficulties, but in indoor shut spaces without ventilation, it is common for people to experience headaches, drowsiness and other effects. Air quality is not only gaining importance due to air pollution and rising environmental awareness, but the recent COVID-19 pandemic reinforced the need for improving air quality for sanitary and health reasons. Therefore, many companies have started focusing on improving the employee’s wellbeing by promoting varied programs focused on physical exercise, diet and mainly on ensuring a healthy work environment. Research has shown that workspace air quality is correlated with productivity, much like thermal comfort. As shown in [9], exposure to high levels of CO2 leads to lower cognitive function scores in office workers when compared to ventilated workspaces since employees in a ‘green’ environment performed 61% better in cognitive tasks than in standard office conditions. Another study found that working in a well-ventilated environment leads to 30% fewer respiratory and headache complaints, as well as better sleep quality and increased productivity [10].
As well as productivity, there is increasing evidence that correlates carbon dioxide levels in buildings with respiratory diseases and airborne infections, and these studies have received renewed attention due to the COVID-19 pandemic. Since CO2 is released through respiration, a high concentration of CO2 can be correlated with the level of occupancy in a given space. Since airborne infectious diseases spread through aerosols and water particles, which are also present in human respiration, the concentration of CO2 in a room can be used as an indirect signal to the risk of disease propagation, much like a canary used in a mine. Therefore, maintaining thermal comfort and monitoring CO2 concentration is of utmost importance to achieve a healthy and productive workspace.
This work extends to previous work regarding the implementation of a campus microgrid [11]. The microgrid is installed on a university campus, namely at the Department of Electrical and Computer Engineering of the University of Coimbra. The microgrid currently has renewable generation through solar photovoltaic (PV) panels, energy storage using lithium-ion batteries and controls unidirectional and bi-directional charging of electric vehicles (EV) using conventional and state of the art bi-directional silicon-carbide chargers. However, a higher demand flexibility level is needed in order to improve the matching between the local generation and demand. To achieve that objective, Heating, Ventilation and Air Conditioning (HVAC) systems are one of the main loads that can be controlled for improving flexibility. During the winter months, the building has a high HVAC demand in periods of low PV generation. Similarly, during the summer months, the PV generation surplus is being stored, but the energy storage capacity is limited and it may be more efficient to consume it, in, for example, pre-emptively cooling down rooms during lunch hours. The main relevance of this work is in using the HVAC loads’ inherent flexibility towards benefits to the building microgrid, such as reduced energy consumption, costs and improved predictability, hence, improving overall operation. Innovation is present in using the internet of things to link several decentralized local microcontrollers with a microgrid and in the applicability of different control algorithms, such as the pre-emptive heating/cooling of a room. This provides the operator with the means to enact building-wide demand control measures, therefore improving energy efficiency. The system is scalable and modular, being able to easily adopt new features, as was the case of air quality. The new options provided by a microgrid system coupled with the high presence of heating loads in most buildings highlight the opportunity for the smart control of electric heating loads. The developed smart thermostat intends to offer a solution to provide comfort conditions, load flexibility and improve energy efficiency.
1.2. Related Works
In the topic of energy savings and efficiency measures, ref. [11] has shown that there is a large amount of HVAC energy demand in winter months and PV generation surplus during summer, which makes HVAC loads ideal for demand response and flexibility measures. The study developed in [12] concluded that for schools and campuses, there is potential for energy savings through the rescheduling of thermal energy loads and fans. By optimizing the working schedules of ventilation and space conditioning of a school, a decrease of between 20 and 36% of thermal energy consumption was achieved. The authors of [13] conclude that it is possible to use a building’s thermal mass and heat pumps jointly as a flexible load, fulfilling space conditioning needs and reducing electricity costs. Remarking on the impact for the national electric diagram, it was found that there is the potential to consume up to 30% of the produced renewable energy during the night through pre-heating and that temporarily shutting down heat pumps is a viable way to compensate for quick variations and forecasting errors in the early hours.
A method where HVAC units are controlled using a temperature priority list to adjust their power consumption is presented in [14]. The amount of HVAC power needed for relevant load balancing is also investigated. Results suggest that integrated into a smart grid, both direct and indirect revenue can be achieved by service providers and customers by submitting their loads to load balancing services. The work in [15] uses smart thermostats to trial strategies based on occupancy and load shifting. The smart thermostats were installed in two residential buildings in Toronto and load shifting was implemented by pre-conditioning rooms before peak hours. It was found that an occupancy-based control reduces HVAC usage by 5.9%. However, in the studied cases, load shifting did not significantly reduce HVAC runtime, but only peak hour consumption was reduced. In [16], an HVAC control system is implemented that calculates room inertia and uses that inertia to pre-heat and pre-cool classrooms. The system has web integration and is able to provide monitoring in real time and schedule operations. The author of [17,18] developed several control strategies for optimizing HVAC operation in meeting thermal comfort. The employed strategies include a predicted mean vote (PMV) model to optimize deviations in the controlled parameters and feedforward hybrid layer’s control (FHLC) to address the complex non-linear dynamic behaviour of modern HVACs that PID controllers cannot tackle. All strategies achieved an increase in thermal performance with less energy consumption when compared with the benchmarks. Results show that, with adequate control, energy consumption can be reduced without hindering thermal performance. In [19], two novel controllers are developed for HVAC systems aimed at reducing the long response time and eliminating a steady-state error in temperature. The combination of the two controllers greatly improves starting times and avoids the temperature hysteresis, or cycling, commonly seen in existing HVAC systems. The method also achieves a reduction in 37% of energy consumption by avoiding the On/Off type cycle typical of most HVAC systems. However, these control models rely on altering the HVAC internal operation, whereas the developed solution works on an outside level to facilitate installation and improve modularity. The authors of [20] develop a novel energy management system for microgrids to achieve a flexible time frame for distributed energy resources scheduling with an optimal power flow to achieve economic and secure operation. The method optimizes the schedule of controllable resources to minimize operation costs over a selected time horizon. The EMS considers factors such as utility electricity price, energy storage utilization, asset characteristics (generators, power lines) and load forecasts to generate real-time controls for controllable resources.
In the field of air quality research, the works previously mentioned in [9,10] have shown that carbon dioxide negatively affects workplace productivity and is a source of health issues. Similarly, in [21], the importance of monitoring indoor CO2 is reinforced and [22] uses CO2 monitoring in schools and offices as a measure of air quality. In [23], CO2 is used as an indicator for air quality and is correlated to the number of people in a room and, consequently, the concentration of volatile organic compounds (VOCs) and of airborne particles through respiration. Several experiments were made in different types of rooms, such as meeting rooms, large offices, cafeterias and residential homes. The author concludes that natural ventilation through windows is quite efficient at maintaining acceptable CO2 levels, but is not viable during extreme weather or in windowless rooms. Additionally, indoor air recycling produces no effect on air quality since fresh air is needed.
In [24], a review of several studies is conducted regarding the effects of air pollution on health. Since 2014, there has been an increase in publications regarding this topic and most studies support the association between air pollution and hazardous health effects. The American Society of Heating, Refrigerating and Air Conditioning Engineers (ASHRAE) defines in Standard 62 the conditions for acceptable ventilation system requirements to guarantee indoor air quality [25]. The standard has been revised in 2019 and considers that, per person, a ventilation rate of 7.5 L/s is required for classrooms and 9.4 L/s for offices. The World Health Organization (WHO) published in March a roadmap to promote good indoor ventilation practices for the prevention of COVID-19. The document aims to establish a simple procedure to assess indoor ventilation needs and steps to reach recommended ventilation levels. It includes recommendations specifically for health care, residential and non-residential settings. Due to the highly infectious nature of COVID-19, WHO considers a minimum rate of 10 L/s per person for residential and non-residential settings [26].
Several works and research projects have already shown that enclosed spaces are infection grounds for COVID-19 [27,28,29,30,31,32]. The Department of Education of England will spend 25 million pounds installing 300,000 CO2 monitors in classrooms in state schools and colleges. The purpose is to ensure information for staff regarding the lack of ventilation and to provide additional reassurance regarding classroom safety [33]. Similarly, in [34], several experts advise the Portuguese Education Ministry to test air quality in classrooms and implement monitoring devices for CO2. Regarding the COVID-19 infection rate, it has been repeatedly affirmed that direct contact and aerosols are the main carriers of infection. However, the authors of [35,36] consider that the role played by airborne particles in disease transmission has been diminished and air quality control has been disregarded in lieu of protective measures focused on avoiding human contact and interaction. They assert that measures for air quality are non-negligible and are as important as distancing and using masks, but due to higher cost and implementation barriers, such measures have been placed on the side.
The aforementioned works show that HVAC loads are very effective at implementing demand control strategies, being a source of flexibility to buildings and grids. As well as thermal comfort and energy efficiency, air quality is becoming an increasingly important factor, which is normally related and integrated into HVAC systems. Most of these works present solutions to improve the energy efficiency of HVAC systems or microgrid operation. However, research is lacking regarding how to use existing loads in buildings to facilitate the implementation or operation of microgrids. The current research aims to integrate the energy efficiency achievable through a smart thermostat, to complement the microgrid flexibility and operation without the loss of thermal comfort or sanitary conditions, alongside demand control strategies.
1.3. Contribution
Considering the referred microgrid, the need for higher energy demand flexibility levels and the new challenges regarding air quality in workplaces, this work designed, implemented and tested a smart thermostat. This smart thermostat can be installed in classrooms and meeting rooms and monitors several ambient conditions, such as temperature, humidity, CO2 concentration and power consumption. The device controls ventilation and heat pumps to maintain the air quality within the acceptable parameters and at a comfortable temperature and enables the implementation of demand response actions. System flexibility is increased by optimizing the integration of renewable energy production, peak demand shaving and by taking advantage of room inertia to pre-emptively heat or cool a room. An important additional feature was developed, focused on reducing the risk of airborne diseases contagion by using a dynamic forced ventilation system that monitors the CO2 concentration and ventilates the room to maintain healthy concentration levels. The contributions of this paper can be briefly summarized as follows:
- A prototype for scalable smart thermostat using the internet of things;
- Control of temperature, CO2 and power consumption of several HVAC systems simultaneously;
- Integration into a building microgrid to improve energy efficiency, flexibility, reduce supply–demand mismatch and load prediction;
- Ability to implement different control algorithms to reduce energy consumption such as pre-emptive heating/cooling of a room to avoid peak hours;
- Monitoring and controlling of air quality to improve workspace health standards;
In this paper, the implementation of the smart thermostat is presented, as well as the experimental results achieved in a classroom regarding air quality and the integration in the building microgrid.
1.4. Paper Organization
The remainder of this paper is structured as follows: Section 2 presents the smart thermostat architecture, operation and method of operation, including the details about the evaluation of the time needed for pre-emptive heating/cooling, as well as how the system works to maintain air quality standards and how the system is integrated in the existing microgrid. Section 3 presents the results of the field tests of the smart thermostat in a classroom with real attendance. Section 4 discusses the results and Section 5 summarizes the paper, highlighting the main conclusions and pointing directions to potential future work.
2. Materials and Methods
2.1. Smart Thermostat
The presented smart thermostat is part of an internet of things (IOT) system of distributed modules and sensors. The architecture was defined to ensure ease of integration and scalability of the solution. These modules communicate via Message Queuing Telemetry Transport (MQTT).
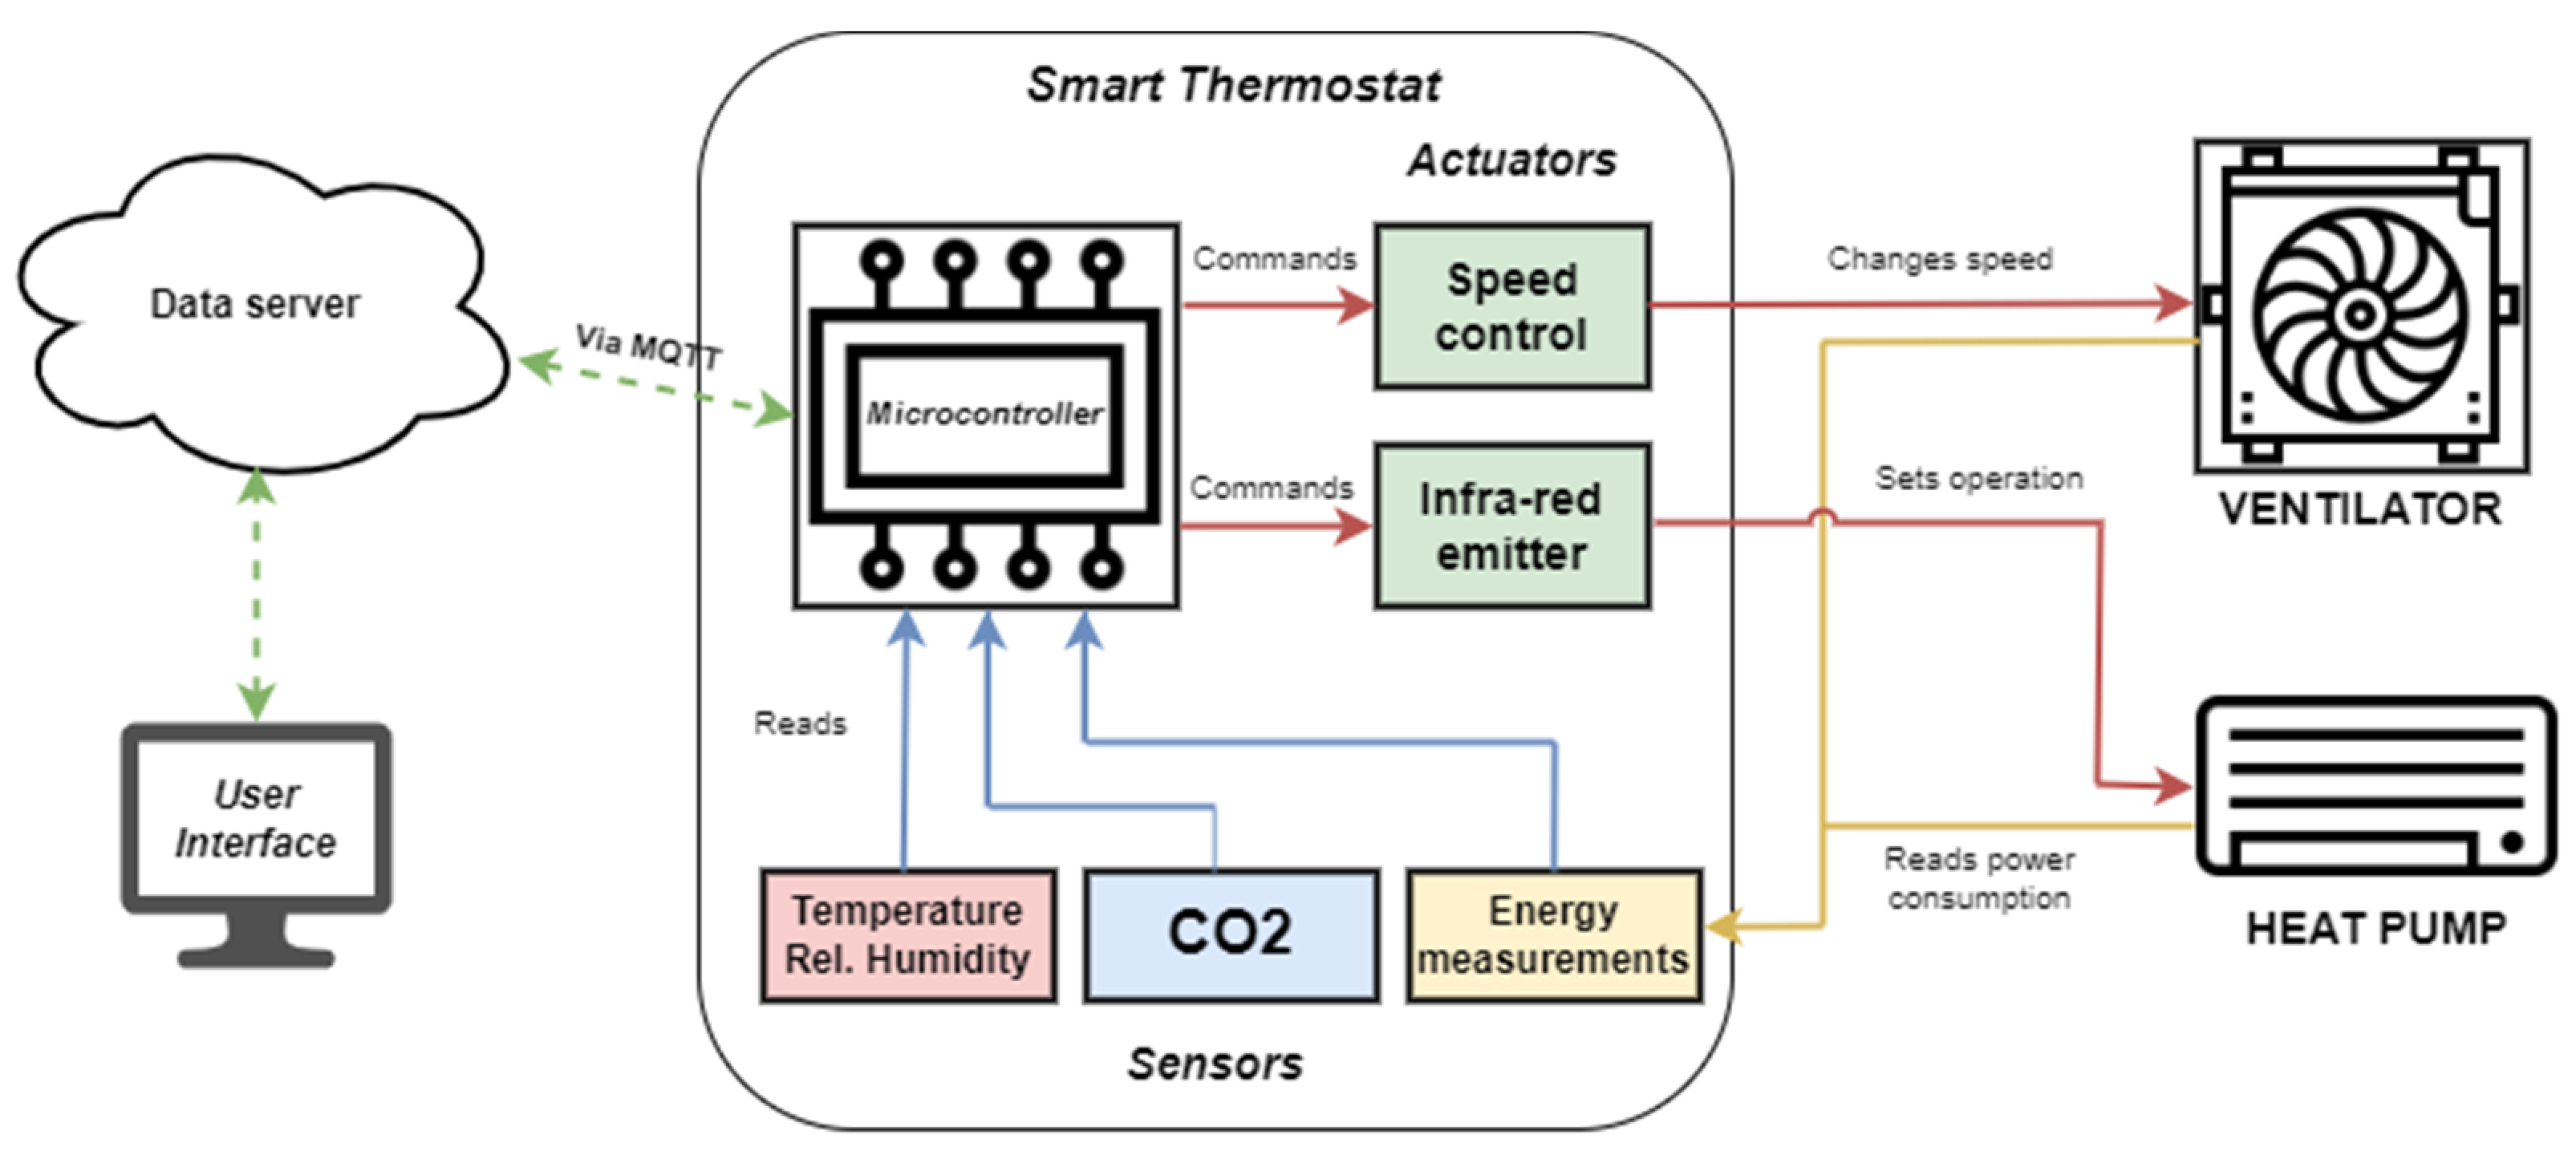
The main purpose of the smart thermostat is to monitor and control air quality and thermal comfort inside classrooms, as well as to be integrated into the building microgrid and pursue energy efficiency and demand control measures. The control software of the smart thermostat can be programmed to schedule the heating or cooling of a room, as well as to maintain air quality by keeping a CO2 concentration below a defined threshold. The system can include multiple smart thermostats installed in the same building, and is connected to the building management system that coordinates operation to ensure energy demand flexibility, for instance, in response to a high (or low) tariff period, a PV generation surplus period or a peak demand period. The smart thermostat is constituted by several modules with different tasks, as presented in Figure 1.
The smart thermostat microcontroller reads data from the available sensors, such as temperature, relative humidity, CO2, energy consumption and other statuses. The ventilation and thermal control are implemented through a heat pump and a ventilator installed in each classroom. The smart thermostat controls the ventilator speed using Pulse Width Modulation (PWM), and the heat pump by emulating the IR remote control of this device. The electrical energy consumption is measured by reading the voltage and current of the ventilator and of the heat pump. Measurement data are sent wirelessly to the system MQTT broker (which also receives data from other devices). The data are stored in a server database and can be accessed via the User Interface (UI). The use of MQTT facilitates the scalability of the system, being easy to integrate additional smart thermostat models inside the same UI frame and database.
The system has three modes of operation: local, remote and dynamic. The local mode allows a user, e.g., the professor, to manually increase/decrease the ventilation and temperature levels. The remote mode allows the system to be controlled through a computer or smartphone by sending commands through MQTT. In the dynamic mode, the system follows an algorithm to choose the best time to heat and cool the room and maintains the CO2 concentration levels below a set threshold by reading the measured CO2 concentration and changing the ventilation power accordingly. The minimum limit to turn on ventilation was chosen to be 800 ppm, as will be explained in Section 2.4. To avoid successive on/off commutations when reaching values near the limits, a hysteresis function was also implemented. In dynamic mode, it is also possible to set a heating/cooling schedule, as well as other operations in coordination with the microgrid energy management system. Only one control mode is active each time, being the standard mode, the dynamic mode. However, the local and remote modes can override the dynamic mode.
2.2. Microgrid Integration
The smart thermostat is being implemented in an existing university campus microgrid. The microgrid is located in the Department of Electrical and Computer Engineering of the University of Coimbra. Figure 2 presents the existing microgrid, as well as the power flow and the information pathways that control the system. Currently, the microgrid is comprised of a PV generation system (79 kWp DC), a battery storage system (27.9 kWh), grid-to-vehicle and vehicle-to-grid ready chargers, as well as a monitoring and control system.
The building presents a good matching between the local PV generation and electricity demand, but there is a generation surplus in periods with a lower occupancy of the building (mainly during the weekend or holidays), leading to a small injection of the PV generation into the grid. From the economic point-of-view, this is not attractive since the price paid for consumed energy is much higher than the price received for energy injected into the grid. Therefore, the microgrid was designed to ensure the use of flexibility options to increase the matching between generation and demand, as well as to allow the future increase in the installed power of the solar PV system [11,37]. In the effort to increase flexibility, options such as battery systems and vehicle-to-grid chargers were installed. However, more options are needed, including flexible loads associated with HVAC systems.
Figure 3 presents a comparison between a winter day and a day with average temperatures, where there is no need for heating or cooling. As can be seen, heating leads to an increase of 50 to 60% on the electricity demand of the building when compared with a day without heating requirements. Since the building has about forty mono-split reversible air-to-air heat pumps to ensure the HVAC in classrooms, offices and labs, a major opportunity to ensure energy flexibility is to install programable controllers and enact demand response measures during cold winters and hot summers. By having controllable loads it is possible to better predict consumption, avoid excessive peak loads and increase the overall flexibility of the microgrid, reducing costs and improving the operating efficiency.
Therefore, the developed smart thermostat must have the capacity to set desired temperature levels, turn systems on/off, schedule operation, monitor the ambient conditions and electrical consumption of the equipment in real time and send data to a local server. This allows control of the HVAC operation of the whole building, by reducing temperature setpoints, pre-heating/cooling in off-peak periods or shutting down heat pumps in already climatized areas to compensate for the variations in PV generation and to reduce total peak load. Additionally, having the whole building equipped with smart thermostats provides the building management system with information regarding users’ habits, classroom schedules and typical load shapes. This information is crucial not only for the better operation of the smart thermostats, but also for the coordination of the whole building microgrid. Data from HVAC controllable loads can be cross-referenced with the electric vehicle chargers and batteries’ operation schedule to improve the coordination of demand response strategies and efficiency.
2.3. Demand Response Strategies
Demand response strategies aim to manage the load to dynamically balance the intermittent supply. Benefits from demand response include optimizing the integration of renewable generation, avoiding consumption of overpriced electricity, reducing peak power and increasing grid flexibility by shifting loads. Demand response is particularly effective when working with flexible/interruptible loads, such as in the case of HVAC. The proposed method used by the smart thermostat to the microgrid is load shifting to avoid operation during higher price hours. By taking into account room inertia, HVAC loads can be shifted out of peak hours, or during times where there is an excess of renewable energy generation. The room’s thermal inertia may also be used during the cooling season. During summer, it is common for buildings to be empty during lunch times, where solar generation is highest, and, in the studied case, leads to injection of excess power to the grid. By being integrated into the building microgrid it is possible for the smart thermostat to know when there is PV generation surplus and to pre-emptively cool down the room for afternoon classes during lunch hours. By having access to the various classroom schedules it is also easy for the smart thermostat to plan operation and, on the microgrid side, it can be used to predict loads and to coordinate with other demand response strategies being currently used.
Ventilation control modules are also used to provide adequate amounts of ventilation with minimum power.
The building where the smart thermostats are installed uses a time of use tariff with four different periods. By calculating and taking into consideration each classroom’s thermal performance, the smart thermostat algorithm can calculate the optimum pre-heat/cooling times and use the room’s own thermal inertia to maintain comfort levels of temperature without operation, thus avoiding expensive peak periods.
An optional strategy could also be to set a higher target setpoint for temperature. In most daily cases, 21 °C is assumed as the standard interior temperature, but a decrease or increase of 1 °C is hardly noticeable. Setting the initial desired temperature for 22 °C or 23 °C will take advantage of room thermal inertia for longer, albeit at a higher initial consumption of the heat pump. This may be enough to ensure that the next start of operation occurs when solar PV generation is already ramped up, or the peak hours have passed.
In this work, two demand control strategies are tested. One for the heat pumps, where pre-heating is planned with the objective to shift load and to avoid high price tariffs and another for the air quality ventilators where dynamic speed control is developed and compared to a standard full power approach. Results are presented and discussed in Section 3 and Section 4, respectively.
2.4. Room Modelling
To simulate the operation of the control and for determining the optimal start and end times for pre-emptive climatization, it is important to have a model of the classroom. The thermal performance of a building depends on how effective the existing walls, windows and roofs are as insulators. The thermal mass of the building is above 400 kg/m2, as calculated in [37], leading to a relatively high thermal inertia. Therefore, there is a need for more energy to achieve thermal comfort. However, for the smart thermostat, the information about the global thermal inertia is not enough since individual data about the thermal performance in each classroom are needed.
In buildings, the thermal envelope performance is quantified through the heat transfer coefficient U (W/m2 K) and the building’s thermal capacity value C (J/°C). These coefficients are characteristics of the construction of the building and the materials and structure of the room. The estimation of the U and C values for each room, along with other known parameters from the heat pump and the outdoor and indoor temperatures, allow the system to automatically calculate the thermal performance of the room and, therefore, to decide about the needed pre-heating periods [16].
To simplify the analysis of the heat transfer process, the Lumped Thermal Capacity Model was used. This method reduces the thermal system into discrete blocks, neglecting internal temperature differences and assuming a uniform temperature spatial distribution [38]. The method uses electrical symbols (resistors, capacitors, power sources) as an analogy to the relevant parameters of a thermal system. Figure 4 presents the simplified equivalent diagram for a room’s thermal system, where Ti and To are the indoor and outdoor temperatures, respectively, Rt is the total thermal resistance of the room and Ct is the room’s total thermal capacitance. The larger the Rt, the slower the temperature gain will be or decay, whereas the larger the Ct the more energy can be stored in the room and the slower the temperature decay will be.
The transient temperature response between time steps t1 and t2 is determined by Equation (1) [38], where Tix is the thermal equivalent temperature at time x (°C), To is the outdoor temperature (°C), U and C have already been defined and QP is the thermal power of the heat pump (W).
The thermal power is given by Equation (2), where P is the electrical power of the equipment (W) and COP is the coefficient of performance given by the heat pump manufacturer.
In the absence of a heat source, QP is zero and the simplified Equation (3) is obtained, which relates the temperature decay in the room without a heat source.
Manipulating Equation (1), the interval of time corresponding to the heating period can be obtained by
These equations allow the calculation of the time required for a room to reach the required temperature Ti2 or to calculate the temperature reached at a given time assuming a constant heating power. For the tested room, the calculated values for the thermal parameters were U = 596.2 W/m2 K and C = 36.7 MJ/°C. As can be seen, the transient of the room temperature is affected by the difference in temperatures in two spaces, the transferred heat power QP and the characteristics of the building present in the heat transfer coefficient U and thermal capacity C.
2.5. Indoor Air Quality (IAQ)
For indoor air quality assessment, the most common test is to measure the CO2 concentration levels [39] since it is a good proxy to monitor the concentration of VOCs released by humans and other sources. In most cases, indoor CO2 concentration is determined by the number of people inside a room and the fresh air ventilation rate. Recently, and due to the COVID-19 pandemic, air quality has gained new relevance as an indicator for the risk of infection by airborne pathogens. Symptoms of excessive exposure to CO2 range from sleepiness, headaches, dizziness, breathing difficulty, fatigue and increased heart rate. The typical levels of CO2 concentration in the air and potential health hazards are [40]:
- 400–450 ppm: average outdoor air level;
- 450–1000 ppm: levels in occupied indoor spaces with good air ventilation;
- 1000–2000 ppm: levels where the air starts getting ‘heavy’ and drowsiness occurs;
- 2000–5000 ppm: levels causing adverse health effects, namely increased heart rate, headaches, nausea;
- 5000–10,000 ppm: toxic levels for health, being the maximum legal exposure limit for daily workspace;
- 10,000 ppm: highly toxic levels, leading to oxygen deprivation, being the maximum recommended exposure 15 min.
Thus, a good level of ventilation is crucial to maintaining healthy air quality levels and for improving the workspace. Figure 5 presents the typical rate of oxygen consumption, carbon dioxide production and breathing rate for a person. These parameters are dependent on the physical activity and metabolism of each person, and the outdoor airflow rate needed to maintain steady-state CO2 concentration is given by Equation (5) [41], where V0 is the outdoor airflow rate per person, N is the CO2 generation rate per person, Cs is the CO2 concentration in the considered space and C0 is the CO2 concentration in outdoor air.
Using Equation (5), it is possible to calculate the ventilation rate needed per person to maintain the CO2 concentrations below a defined threshold. For a sitting person, which is most common in classrooms, the MET rate is around 1.3, which corresponds to a generation of CO2 of about 0.35 L/min. Internationally, 1000 parts per million are the level above which air quality is considered bad, and, as such, it was decided that one of the objectives of the smart thermostat is to maintain air quality below this CO2 level. Considering an outdoor CO2 concentration of 415 ppm, the result of Equation (5) will be Equation (6).
This results in the need for 10 L/s of airflow per person to maintain indoor carbon dioxide concentration below the defined 1000 ppms. The pre-pandemic ASHRAE standard [25] sets that for classrooms or conference rooms there is the need for a ventilation level of 7.5 L/s per person. As mentioned before, WHO has recommended that, during the coronavirus pandemic, the level be increased to 10 L/s per person, which is very close to the level achieved in the calculations. The installed ventilator in the classroom has a maximum rated airflow of 368.25 L/s, which is enough to guarantee good air quality for around 50 persons pre-pandemic and 36 persons according to WHO needs. Since one of the objectives for air quality is to maintain CO2 levels below 1000 ppm, it was decided that the ventilator should turn on when reaching 800 ppm to give a head start and avoid reaching the limit.
The following stages have been defined for the ventilator dynamic operation:
- CO2 < 800 ppm, ventilator turned off;
- 800 < CO2 < 1000 ppm, ventilator at 35% power;
- 1000 < CO2 < 1500 ppm, ventilator at 65% power;
- CO2 > 1500 ppm, ventilator at 100% power.
Alternatively, a constant concentration level can be defined and the ventilation level be controlled by the CO2 sensor feedback loop, in order to keep the concentration constant at defined level.
The SARS-CoV-2 virus has a spheroid shape and a diameter of 80 to 140 nm (≈0.1 µm), making it classified as a breathable particle and with penetration level at the bronchioles and alveoli, as presented in Figure 6.
The virus may spread through direct contact, droplets (speaking, sneezing, coughing) or airborne transmission. For particles less than 10 µm (aerosols), the aerodynamic drag forces outweigh the force of gravity; thus, the particle floats and remains in suspension and can be transmitted through inhalation. In [42], several studies on the survival of viruses in the air are reported. The persistence of the virus is dependent on several atmospheric factors and whether the virus has a protective layer of fat or not. In the case of SARS-CoV-2, it has an outer shell of fat making it more persistent in dry environments. Another relevant factor is solar radiation. Sunlight has a component of ultraviolet radiation that will impair the virus survivability. Where masks, frequent cleaning and distancing reduce the risk of infection through direct contact and droplets, to decrease the concentration of infected aerosols, fresh or filtered air have to be provided by a ventilation process [36]. In summary, SARS-CoV-2 (and other bioaerosols) has a high persistence in dry environments that are devoid of natural lighting and with no air renovation.
Thus, it is fair to conclude that enclosed spaces with high and frequent human presence, such as classrooms, meeting rooms and conference rooms are places of high risk of airborne contamination. The more people that are present in each room, the greater will be the droplets and evaporation caused by breathing, talking, coughing and sneezing, and the larger the infectious payload in the indoor air will be, followed by an increased risk of disease.
The viruses’ persistence has been notorious in its high levels of incidence even though several and varied measures have been applied in different countries, and even in scenarios with a highly vaccinated population. As of December 2021, the vaccination effort, although proven effective in reducing the severity of disease, has not yet been able to reduce infection rates to desirable levels. This has changed the course of action of government officials. Instead of hoping to wipe out the virus, civilization will have to live with it and overcome it through other means in the coming years. Guaranteeing adequate air renovation in every indoor room is crucial to reducing not only the risk of COVID-19 disease but also for other particles that may cause future respiratory complications, alongside the already mentioned benefits of having a workspace with good air quality.
3. Results
In this section, the experimental results of the developed smart thermostat are presented. Two sets of tests were conducted. The first round of tests was focused on using the software features for scheduling pre-emptive heating and smart energy management to achieve energy savings. The second set of tests was focused on achieving the air quality objectives.
3.1. Smart Control Tests
The smart control tests for energy efficiency were conducted inside an isolated classroom for several days. They were executed at night to limit outside energy gains. The tests were made using different operation modes for the heat pump, and inside and outside temperatures were registered as well as the power consumption of the equipment.
3.1.1. Test A
The objective of Test A was to emulate the common practice of turning up the heat at maximum power for achieving quick thermal comfort. As presented in Figure 7, from the initial temperature, 16.6 °C, to the 20 °C mark, it took around 1 h 30 min and the temperature reached 23 °C after around 4 h 30 min of operation. After shutting off, the temperature started decaying but after 1 h had passed, the temperature was still at levels considered comfortable (>20 °C).
3.1.2. Test B
The objective of Test B was to test heating operation with the power saving feature. In this feature, the heat pump works to maintain the desired temperature inside a 1 °C interval. As presented in Figure 8, after the initial start, the pump shuts off and resumes operation when needed to maintain the temperature inside controlled levels.
3.1.3. Test C
The objective of Test B was to test the smart thermostat algorithm’s ability to choose a start time to pre-heat a room to the desired temperature (applying Equation (4)). The chosen temperature was 25 °C at 8 h 00. The control algorithm then computed the optimal start time to be at 3 h 22. At the start of the test, the indoor temperature was 17.1 °C and the outdoor was 13.9 °C. The achieved results are presented in Figure 9.
3.2. Air Quality Field Tests
In this section, the experimental results of the air quality tests are presented. Data were collected during several classes and days. Due to COVID-19 restrictions, presential attendance was lower than usual since the room capacity was limited. Nevertheless, the smart thermostat was able to be tested and operated at full functionality.
3.2.1. Test A
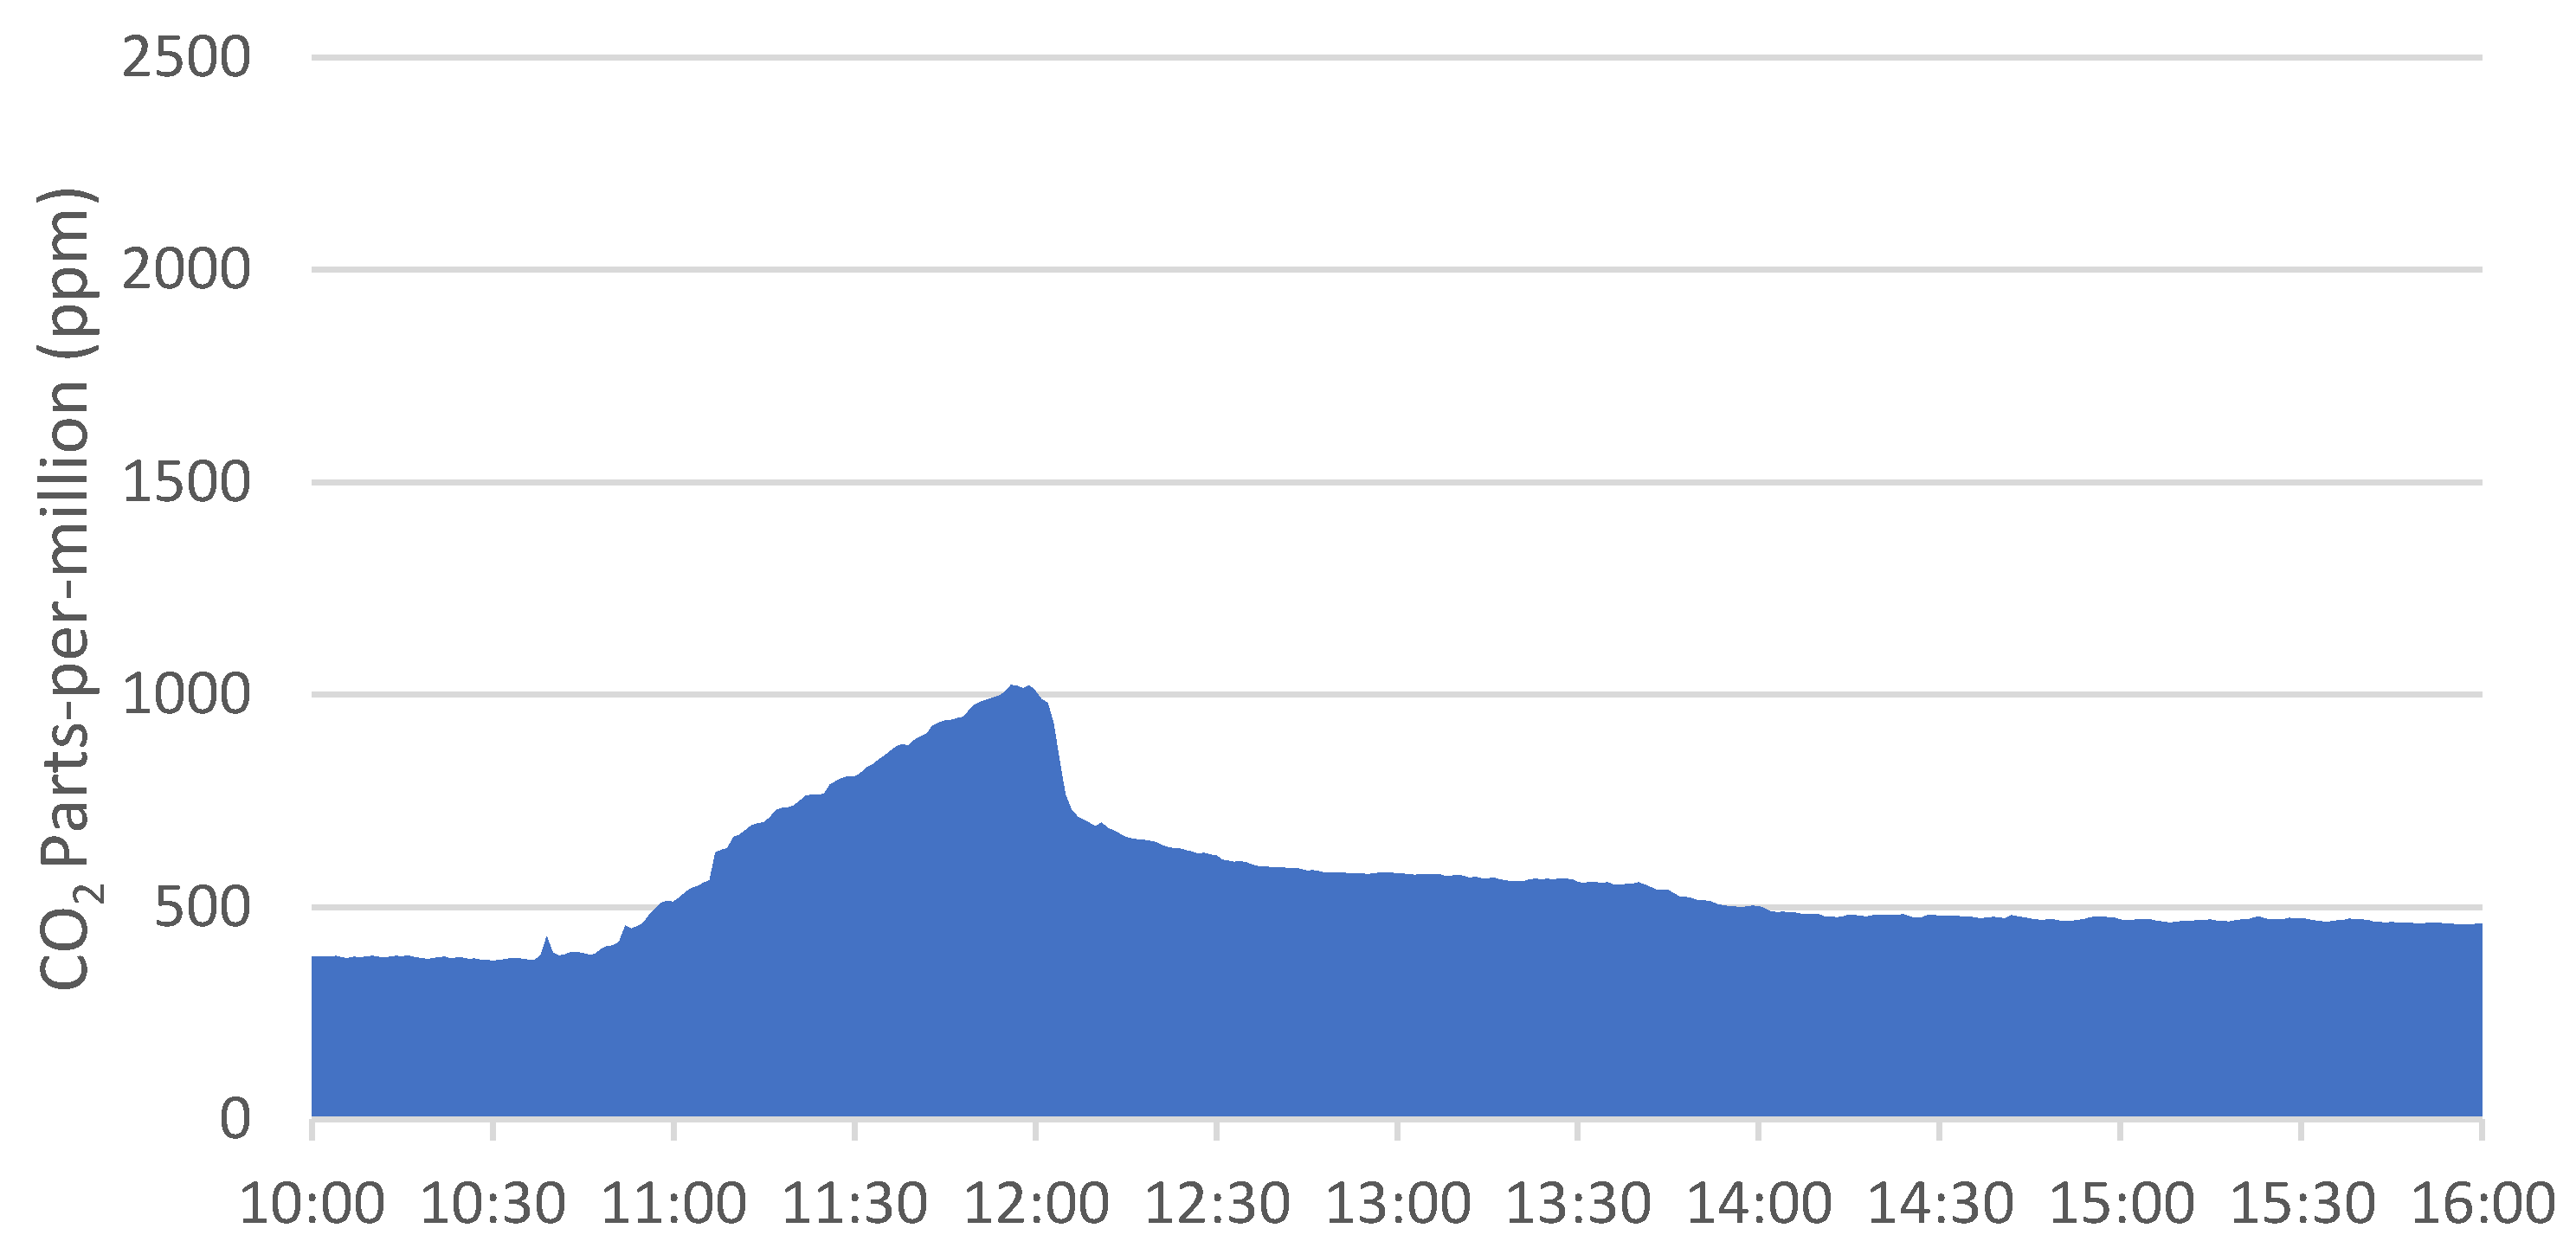
The objective of Test A was to measure the rise in CO2 in an isolated classroom (with the windows and doors closed) with full attendance, without air circulating from the exterior. The classroom was in use from around 10 h to 13 h with some short intervals in between. The steep drops presented in Figure 10 are due to students leaving early and opening the door. At around 13 h, after classes ended, the door and window were left open to circulate the air. In about 15 min, the air CO2 dropped below 600 ppm.
3.2.2. Test B
The objective of Test B was to register the effect of ventilation in the air quality of an isolated classroom with full attendance. After reaching the 1000 ppm mark, ventilation was turned on at maximum power. Due to COVID-19, full attendance was not reached, but the effects of ventilation were considered visible (in Figure 11) and satisfactory for assessing the operation of the ventilation system.
3.2.3. Test C
The objective of Test C was to test the operation of the dynamic response of the ventilator. The test is presented in Figure 12. As explained in Section 2.4, an algorithm was developed to maintain CO2 levels below 1000 ppm while not using the ventilator at full power to save energy. The green line represents the activation limit, at 800 ppm, and the yellow area and orange area show the time when the ventilator operated at 35% and 65% power, respectively.
4. Discussion
4.1. Smart Control Tests
The first thing to notice in the test results is that the heat pump takes about one hour to heat the room to temperatures considered comfortable (>20 °C). Similarly, after shutting down the heat pump, with an initial inside temperature of 23.3 °C and an outside average constant temperature of 12.3 °C, the temperature decay has a calculated rate of 1.34 °C/h, (note: the decay rate is a function of the inside–outside temperature differential and will vary accordingly).
This means that, if the desired target temperature is set at 23 °C, there is a time interval of about two hours where the temperature is considered at comfortable levels. The peak tariff of the building occurs between 9 h 30 and 12 h, with classes starting at 8 h. All classes have a duration of 2 h. It is then plausible to take advantage of pre-heating and room thermal inertia to avoid HVAC operation during peak hours. The performed tests aimed to prove the benefits of this modus operandi.
In Test A, the room was heated using the most common method, which is turning on the heat at maximum power and leaving it on. This test serves as a basis for comparison in terms of economic benefits. Test B was successful in maintaining the temperature inside a range of comfortable temperatures, and Test C demonstrated the ability of the algorithm to choose and pre-heat the room to the desired temperature, which was achieved. It is important to notice that, in all tests, the HVAC operated for around the same duration, which will be considered as 4 h 30 for comparison fairness. The energy consumption of the three tests for the considered duration was as follows: Test A: 9.2 kWh; Test B: 7.53 kWh; Test C: 7.96 kWh. As expected, Test A was the least energy efficient since the room was heated to desired conditions but at the expense of inefficient energy use. In comparison, Test B, where the heat pump was periodically shut off, proved to be the most efficient in conjugating thermal comfort with energy efficiency. Test C is situated in between both tests, but the highlight of this test was the ability to pre-heat the room to the desired temperature level without a major increase in energy consumption.
Considering the electricity tariffs of the building, as presented in Table 1, the estimated operational costs throughout the tests for a daily morning schedule of classes from 8 h 30 to 13 h were as follows:
- Test A (operation from 8 h 30 to 13 h): EUR 1.40
- Test B (operation from 8 h 30 to 13 h): EUR 1.15
- Test C (operation from 3 h 30 to 8 h): EUR 0.63
From these results, it can be concluded that, although pre-heating the room may lead to an increase in energy consumption, energy is overall cheaper than the operation during work hours. Applying this measure to an entire campus is liable to significantly reduce peak hours consumption and have a significant impact on the monthly bill. By pre-heating the room to a temperature one or two degrees above the desired temperature, it is possible to maintain thermal comfort during peak hours by using the room’s thermal inertia and the heat produced by occupants.
A new scenario, D, can be devised where pre-heating is conducted in the room and, afterward, the heat pump operates with a periodic shutdown, that is, mixing pre-heating (Test C) with the efficient operation (Test B). Considering the hours needed for pre-heating, and that between 8 h to 10 h the heat pump is not needed due to the room’s thermal inertia and the occupant’s produced heat, the heat pump will be turned on again at around 10 h until the end of classes at 13 h. As such, the calculated energy consumption and costs using the existing results from Test C, and half of Test B will be: 11.27 kWh and EUR 1.013. In this scenario, the energy usage is the most but the costs are nevertheless lower than standard operation. This highlights the weight that peak hour tariffs have in the monthly bill. However, the large increase in energy consumption, even if, overall, that energy is cheaper than operation at peak hours may nullify the benefits intended with reducing the energy consumption of the building. The increase in energy consumption can be minimized by the introduction of PV generation. If the building has enough PV generation, it is plausible to consider that, between 10 h to 13 h, a large part of that energy will come from PV generation, which adds up to reducing the overall costs and lowering energy consumption from the grid. A summary of all the scenarios is presented in Figure 13.
4.2. Air Quality Field Tests
It was concluded from the initial control tests that, with closed doors and windows, the room has a very low rate of air renovation. A single person is capable of raising the CO2 levels to near 600 ppm and, without forced air renovation, it takes upwards of 12 h for the room to return to standard CO2 levels through infiltration. Test A shows the increase in CO2 if the room is isolated and with around half occupancy. It takes around one hour for the CO2 to reach unhealthy levels, and in two hours the CO2 is enough to cause headaches, loss of attention and drowsiness, which hinders learning productivity. At full occupancy, it is expected to reach these targets twice as fast. Test A also shows that providing air renovation through opening windows is enough to replenish air quality to the room in around fifteen minutes. However, in extreme weather conditions or due to architectural constraints, there may be situations where direct air renovation from the exterior is not plausible. Therefore, the objective of the smart thermostat air quality algorithm is to prevent high levels of CO2 and to replenish air quality in between lectures in the most energy-efficient way possible. The next two tests assert the ability of the ventilator to fulfill that mission.
In Test B, a lecture with nearly full attendance was registered. As expected, in around one hour, the room CO2 levels surpassed the acceptable levels and the ventilator turned on at full power. A steep decrease is registered with new air entering the room. In the following phase, a point of near equilibrium is reached in which the generated CO2 is equal to the capacity of the ventilator for renovation. After the lecture ends, concentration returns to normal levels in around ten minutes. Although full power ventilation is the most effective at air renovation it is not energy efficient as the ventilation rate was far higher than what was required.
To achieve the objective of maintaining air quality using energy-efficient methods, Test C was performed, which shows the dynamic algorithm in operation, using the power stages defined in Section 2.4. When the concentration surpasses 800 ppm, the ventilator turns on at 35% power. Since that is not enough to halt the rise in concentration, the next stage is activated when CO2 surpasses 1000 ppm. Concentration begins to decline, with the power once again adjusted when it goes below the 800 ppm mark. The ventilator uses a high efficiency permanent magnet synchronous motor. Figure 14 shows the ventilator power–speed curve. At full power, the rated airflow is 368.25 L/s.
In Test C, the ventilator started operation at 13 h 18 and stopped at 14 h 48. In this period, the calculated energy consumed was 65.97 kWh when using the dynamic ventilation algorithm. If, instead, as is common practice, full power was used, in the same time interval the energy consumption would be 261 kWh. The algorithm managed to achieve a reduction in 75% of the ventilation consumption while achieving the same air quality objectives, albeit at a slightly later delay.
5. Conclusions
This paper presented a smart thermostat that was developed to be integrated into a building microgrid to optimize the integration of renewable energies, and to improve energy efficiency and indoor air quality. The smart thermostat is made of several distributed modules and sensors communicating via MQTT publish–subscribe protocol. During its development, and due to the SARS-CoV-2 pandemic, special attention was dedicated to a ventilation and air quality control module capable of maintaining healthy air standards indoors. The equipment is intended to be installed in multiple classrooms, offices and laboratories to manage existing space conditioning and ventilation equipment in building-wide coordination. To improve energy efficiency, a strategy where a room is pre-heated to avoid peak hour operation was tested and compared with the most common utilization in heating equipment. Using a mathematical model of the room, the smart thermostat calculates the starting time required to have the room heated to the desired temperature at a given time. It was also seen that to take advantage of the room’s thermal inertia for a longer duration, it is better to set the temperature setpoint a few degrees Celsius above the defined comfortable temperature (21 °C). Energy efficiency tests showed that the smart thermostat successfully managed to pre-heat a room. In this scenario, energy consumption is slightly increased but energy costs are reduced due to the avoidance of peak rate costs when compared to standard operation. Pre-heating a room was confirmed as a viable strategy to avoid HVAC operation during peak hours. A microgrid operator can viably shift heating loads away from peak hours without the loss of thermal comfort due to room inertia. In the same way, in situations where surplus generation is present, rooms can be climatized to avoid energy injection into the grid. The ability to schedule loads can also be used to increase load predictability and improve upon existing demand control measures. Regarding air quality, the results show that the smart thermostat dynamic operation is effective in maintaining air quality below the desired maximum CO2 concentration threshold, and its operation is more energy efficient than standard and manual operation. For future work, the system is expected to encompass the whole building where demand measures with a higher impact can be tested and islanding operation of the microgrid can be tested.
Author Contributions
Conceptualization, A.C.; Data curation, L.M.F.; Formal analysis, A.C.; Funding acquisition, A.T.d.A.; Methodology, L.M.F.; Project administration, A.T.d.A.; Resources, L.M.F.; Software, L.M.F.; Supervision, P.C. and P.M.; Writing—original draft, A.C.; Writing—review & editing, P.M. and A.T.d.A. All authors have read and agreed to the published version of the manuscript.
Funding
The authors acknowledge Fundação para a Ciência e a Tecnologia (FCT) for the financial support to the project UIDB/00048/2020.
Conflicts of Interest
The authors declare no conflict of interest.
References
- Fernbas Energy Performance of Buildings Directive. Available online: https://ec.europa.eu/energy/topics/energy-efficiency/energy-efficient-buildings/energy-performance-buildings-directive_en (accessed on 27 October 2021).
- EUR-Lex-32010L0031-EN-EUR-Lex. Available online: https://eur-lex.europa.eu/legal-content/EN/ALL/?uri=CELEX%3A32010L0031 (accessed on 27 October 2021).
- Directive 2012/27/EU of the European Parliament and of the Council of 25 October 2012 on Energy Efficiency, Amending Directives 2009/125/EC and 2010/30/EU and Repealing Directives 2004/8/EC and 2006/32/EC Text with EEA Relevance; Official Journal of the European Union: Luxembourg, 2012; pp. 202–257.
- Nearly Zero-Energy Buildings. Available online: https://ec.europa.eu/energy/topics/energy-efficiency/energy-efficient-buildings/nearly-zero-energy-buildings_en (accessed on 27 October 2021).
- Impram, S.; Nese, S.V.; Oral, B. Challenges of renewable energy penetration on power system flexibility: A survey. Energy Strateg. Rev. 2020, 31, 100539. [Google Scholar] [CrossRef]
- Majzoobi, A.; Khodaei, A. Application of Microgrids in Supporting Distribution Grid Flexibility. IEEE Trans. Power Syst. 2017, 32, 3660–3669. [Google Scholar] [CrossRef] [Green Version]
- Earth’s CO2 Home Page. Available online: https://www.co2.earth/ (accessed on 13 September 2021).
- Luthi, D.; Le Floch, M.; Bereiter, B.; Blunier, T.; Barnola, J.-M.; Siegenthaler, U.; Raynaud, D.; Jouzel, J.; Fischer, H.; Kawamura, K.; et al. High-resolution carbon dioxide concentration record 650,000–800,000 years before present. Nature 2008, 453, 379–382. [Google Scholar] [CrossRef] [PubMed]
- Allen, J.G.; MacNaughton, P.; Satish, U.; Santanam, S.; Vallarino, J.; Spengler, J.D. Associations of cognitive function scores with carbon dioxide, ventilation, and volatile organic compound exposures in office workers: A controlled exposure study of green and conventional office environments. Environ. Health Perspect. 2016, 124, 805–812. [Google Scholar] [CrossRef] [Green Version]
- MacNaughton, P.; Satish, U.; Laurent, J.G.C.; Flanigan, S.; Vallarino, J.; Coull, B.; Spengler, J.D.; Allen, J.G. The impact of working in a green certified building on cognitive function and health. Build. Environ. 2017, 114, 178–186. [Google Scholar] [CrossRef]
- Moura, P.; Correia, A.; Delgado, J.; Fonseca, P.; De Almeida, A. University campus microgrid for supporting sustainable energy systems operation. In Proceedings of the 2020 IEEE/IAS 56th Industrial and Commercial Power Systems Technical Conference (I&CPS), Virtual, 27–30 April 2020; IEEE: Las Vegas, NV, USA, 2020; pp. 1–7. [Google Scholar]
- Pereira, L.D.; Lamas, F.B.; Da Silva, M.C.G. Improving energy use in schools: From IEQ towards energy-efficient planning—method and in-field application to two case studies. Energy Effic. 2019, 12, 1253–1277. [Google Scholar] [CrossRef]
- Carvalho, A.D.; Mendrinos, D.; De Almeida, A.T. Ground source heat pump carbon emissions and primary energy reduction potential for heating in buildings in europe—results of a case study in portugal. Renew. Sustain. Energy Rev. 2015, 45, 755–768. [Google Scholar] [CrossRef]
- Lu, N. An Evaluation of the HVAC Load Potential for Providing Load Balancing Service. IEEE Trans. Smart Grid 2012, 3, 1263–1270. [Google Scholar] [CrossRef]
- Stopps, H.; Touchie, M.F. Load shifting and energy conservation using smart thermostats in contemporary high-rise residential buildings: Estimation of runtime changes using field data. Energy Build. 2021, 255, 111644. [Google Scholar] [CrossRef]
- Conde, N.L. Intelligent System for Load Monitoring and Control: Sustainable Comfort, Health and Flexible Electricity Consumtion. Ph.D. Thesis, Universidade de Coimbra, Coimbra, Portugal, 21 December 2020. [Google Scholar]
- Homod, R.Z. Assessment regarding energy saving and decoupling for different AHU (air handling unit) and control strategies in the hot-humid climatic region of Iraq. Energy 2014, 74, 762–774. [Google Scholar] [CrossRef]
- Homod, R.Z. Analysis and optimization of HVAC control systems based on energy and performance considerations for smart buildings. Renew. Energy 2018, 126, 49–64. [Google Scholar] [CrossRef]
- Homod, R.Z.; Gaeid, K.S.; Dawood, S.M.; Hatami, A.; Sahari, K.S. Evaluation of energy-saving potential for optimal time response of HVAC control system in smart buildings. Appl. Energy 2020, 271, 115255. [Google Scholar] [CrossRef]
- Yang, F.; Feng, X.; Li, Z. Advanced Microgrid Energy Management System for Future Sustainable and Resilient Power Grid. IEEE Trans. Ind. Appl. 2019, 55, 7251–7260. [Google Scholar] [CrossRef]
- Prill, R. Why Measure Carbon Dioxide Inside Buildings? Washington State University Extension Energy Program 5: Pullman, WA, USA, 2000. [Google Scholar]
- North Carolina Energy Office Ventilation and Indoor Air Quality Energy Saving–Fact Sheet 2010. Available online: https://deq.nc.gov/media/1440/download (accessed on 1 October 2021).
- Hara, S. Monitoring Carbon Dioxide Concentration in a Room as an Indicator of Ventilation|COVID-19 AI and Simulation Project, AIST. Available online: https://www.covid19-ai.jp/en-us/presentation/2020_rq2_infection_prevention/articles/article010/ (accessed on 1 October 2021).
- Dominski, F.H.; Branco, J.H.L.; Buonanno, G.; Stabile, L.; da Silva, M.G.; Andrade, A. Effects of air pollution on health: A mapping review of systematic reviews and meta-analyses. Environ. Res. 2021, 201, 111487. [Google Scholar] [CrossRef]
- ASHRAE Standards 62.1 & 62.2. Available online: https://www.ashrae.org/technical-resources/bookstore/standards-62-1-62-2 (accessed on 5 August 2021).
- World Health Organization. Roadmap to Improve and Ensure Good Indoor Ventilation in the Context of COVID-19. Available online: https://www.who.int/publications/i/item/9789240021280 (accessed on 1 October 2021).
- Birnir, B. Ventilation and the SARS-CoV-2 coronavirus: Analysis of outbreaks in a restaurant and on a bus in china, and at a call center in South Korea. medRxiv. 2020. [Google Scholar] [CrossRef]
- Birnir, B.; Angheluta, L. The Build-Up of droplet/Aerosols carrying the SARS-CoV-2 coronavirus, in confined spaces. medRxiv. 2020. [Google Scholar] [CrossRef]
- Arumuru, V.; Pasa, J.; Samantaray, S.S.; Varma, V.S. Breathing, virus transmission, and social distancing—An experimental visualization study. AIP Adv. 2021, 11, 045205. [Google Scholar] [CrossRef]
- Anderson, E.L.; Turnham, P.; Griffin, J.R.; Clarke, C.C. Consideration of the Aerosol Transmission for COVID-19 and Public Health. Risk Anal. 2020, 40, 902–907. [Google Scholar] [CrossRef]
- Berry, G.; Parsons, A.; Morgan, M.; Rickert, J.; Cho, H. A review of methods to reduce the probability of the airborne spread of COVID-19 in ventilation systems and enclosed spaces. Environ. Res. 2021, 203, 111765. [Google Scholar] [CrossRef]
- Carbon Dioxide Monitoring to Lower the Coronavirus Threat. Available online: https://smartbuildingsmagazine.com/features/carbon-dioxide-monitoring-to-lower-the-coronavirus-threat (accessed on 4 September 2021).
- Covid: Classrooms in England to Get CO2 Monitors to Help with Ventilation. Available online: http://www.theguardian.com/education/2021/aug/21/classrooms-england-monitor-air-quality-effort-combat-covid-better-ventilation (accessed on 31 August 2021).
- Escolas Deviam Testar a Qualidade do ar. Available online: https://www.dn.pt/sociedade/escolas-deviam-testar-a-qualidade-do-ar-14061766.html (accessed on 1 September 2021).
- Correia, G.; Rodrigues, L.; Da Silva, M.C.G.; Gonçalves, T. Airborne route and bad use of ventilation systems as non-negligible factors in SARS-CoV-2 transmission. Med. Hypotheses 2020, 141, 109781. [Google Scholar] [CrossRef]
- Da Silva, M.G. An Analysis of the Transmission Modes of COVID-19 in Light of the Concepts of Indoor Air Quality. REHVA J. 2020, 3, 46–54. [Google Scholar]
- Fonseca, P.; Moura, P.; Jorge, H.; De Almeida, A. Sustainability in university campus: Options for achieving nearly zero energy goals. Int. J. Sustain. High. Educ. 2018, 19, 790–816. [Google Scholar] [CrossRef]
- Incropera, F.P.; DeWitt, D.P.; Bergman, T.L.; Lavine, A.S. Fundamentals of Heat and Mass Transfer, 6th ed.; John Wiley: Hoboken, NJ, USA, 2007; ISBN 978-0-471-45728-2. [Google Scholar]
- CO2 Monitoring: A Benchmark for Indoor Air Quality? Available online: https://www.pressac.com/insights/co2-levels-a-benchmark-for-indoor-air-quality/ (accessed on 1 October 2021).
- United States Environmental Protection Agency APPENDIX B–Overview of Acute Health Effects. Available online: https://www.epa.gov/sites/default/files/2015-06/documents/co2appendixb.pdf (accessed on 1 October 2021).
- American Society of Heating, Refrigerating and Air-Conditioning Engineers ANSI/ASHRAE Addendum d to ANSI/ASHRAE Standard 62.1-2016. Available online: https://www.ashrae.org/technical-resources/standards-and-guidelines/standards-addenda/addenda-to-standard-62-1-2016 (accessed on 1 October 2021).
- Morawska, L. Droplet fate in indoor environments, or can we prevent the spread of infection? Indoor Air 2006, 16, 335–347. [Google Scholar] [CrossRef] [PubMed] [Green Version]
Figure 1.
Diagram showing the smart thermostat components.

Figure 2.
Schematic of the existing microgrid.

Figure 3.
Comparison between the load diagrams in January and September.

Figure 4.
Room simplified equivalent thermal diagram.

Figure 5.
Oxygen consumption, carbon dioxide production and breathing rate versus physical activity in METs (metabolic equivalent task) [41].
Figure 5.
Oxygen consumption, carbon dioxide production and breathing rate versus physical activity in METs (metabolic equivalent task) [41].

Figure 6.
Size ranges of main particles in indoor air.

Figure 7.
Test A: Power consumption, inside and outside temperature evolution over time since start.
Figure 7.
Test A: Power consumption, inside and outside temperature evolution over time since start.

Figure 8.
Test B: Power consumption, inside and outside temperature evolution over time.

Figure 9.
Test C: Power consumption, inside and outside temperature evolution over time.

Figure 10.
Test A: Full attendance classroom with no air circulation.

Figure 11.
Test B: Full attendance classroom with ventilation.

Figure 12.
Test C: Full attendance classroom with dynamic ventilation. Ventilator operation starts above the 800 ppm line.
Figure 12.
Test C: Full attendance classroom with dynamic ventilation. Ventilator operation starts above the 800 ppm line.

Figure 13.
Summary of energy consumption and costs for Tests A to C and scenario D.

Figure 14.
Ventilator power-speed curve.


Table 1.
Energy tariffs and prices for Portugal.
| Tariff | Time period | Price |
|---|---|---|
| Peak | 9 h 30–12 h/18 h 30–21 h | 0.185 EUR/kWh |
| Normal | 7 h–9 h 30/12 h–18 h 30 | 0.11 EUR/kWh |
| Off-peak | 0 h–2 h/6 h–7 h | 0.079 EUR/kWh |
| Super off-peak | 2 h–6 h | 0.0715 EUR/kWh |
Publisher’s Note: MDPI stays neutral with regard to jurisdictional claims in published maps and institutional affiliations. |
© 2022 by the authors. Licensee MDPI, Basel, Switzerland. This article is an open access article distributed under the terms and conditions of the Creative Commons Attribution (CC BY) license (https://creativecommons.org/licenses/by/4.0/).
Share and Cite
MDPI and ACS Style
Correia, A.; Ferreira, L.M.; Coimbra, P.; Moura, P.; de Almeida, A.T. Smart Thermostats for a Campus Microgrid: Demand Control and Improving Air Quality. Energies 2022, 15, 1359. https://0-doi-org.brum.beds.ac.uk/10.3390/en15041359
AMA Style
Correia A, Ferreira LM, Coimbra P, Moura P, de Almeida AT. Smart Thermostats for a Campus Microgrid: Demand Control and Improving Air Quality. Energies. 2022; 15(4):1359. https://0-doi-org.brum.beds.ac.uk/10.3390/en15041359
Chicago/Turabian StyleCorreia, Alexandre, Luís Miguel Ferreira, Paulo Coimbra, Pedro Moura, and Aníbal T. de Almeida. 2022. "Smart Thermostats for a Campus Microgrid: Demand Control and Improving Air Quality" Energies 15, no. 4: 1359. https://0-doi-org.brum.beds.ac.uk/10.3390/en15041359
Note that from the first issue of 2016, this journal uses article numbers instead of page numbers. See further details here.