Article

Co-Processing Lignocellulosic Biomass and Sewage Digestate by Hydrothermal Carbonisation: Influence of Blending on Product Quality

by
Kiran R. Parmar
1,
Aaron E. Brown
1,
James M. Hammerton
1,
Miller Alonso Camargo-Valero
2,3,
Louise A. Fletcher
2 and
Andrew B. Ross
1,*
1
School of Chemical and Process Engineering, University of Leeds, Leeds LS2 9JT, UK
2
BioResource Systems Research Group, School of Civil Engineering, University of Leeds, Leeds LS2 9JT, UK
3
Departamento de Ingeniería Química, Universidad Nacional de Colombia, Campus La Nubia, Manizales 170001, Columbia
*
Author to whom correspondence should be addressed.
Submission received: 14 January 2022 / Revised: 7 February 2022 / Accepted: 9 February 2022 / Published: 15 February 2022
(This article belongs to the Section A: Sustainable Energy)

Abstract

:
Hydrothermal carbonisation (HTC) can be integrated with anaerobic digestion (AD) for the treatment of digestate, resulting in a solid hydrochar or bio-coal and a process water, which can be recirculated back into AD to produce biogas. The properties of digestate-derived hydrochars do not lend themselves to producing high quality bio-coal and blending with lignocellulosic feedstocks can improve its properties. This study investigates the co-processing of sewage sludge (SS) digestate with three lignocellulosic biomass (grass, privet hedge, and woodchip). The calorific value of the resulting bio-coal is increased following co-processing, although feedstock interactions result in non-additive behaviour. The largest increase in calorific value was observed for co-processing with woodchip. There is evidence for non-additive partitioning of metals during co-processing resulting in only moderate improvements in ash chemistry during combustion. Co-processing also effects the composition of process waters, influencing the potential for biogas production. Experimental biomethane potential (BMP) tests indicate that grass clippings are the most suitable co-feedstock for maintaining both calorific value and biogas production. However, above 200 °C, BMP yields appear to decrease, suggesting the process water may become more inhibitory. Co-processing with wood waste and privet hedge produce the higher CV bio-coal but significantly reduced BMP.

1. Introduction

The UK Environmental Agency (EA) Sludge Strategy is in the process of changing its regulatory framework, moving beyond SUiAR (Sludge Use in Agriculture Regulation, 1989) to give greater focus to Environmental Permitting Regulation (EPR) to tackle the issue of diffusion pollution from agricultural land, i.e., run-off and leaching of nutrients into surface and ground water. The rules governing the use and spreading of organic manures were set in the “Farming Rules for Water” policy paper. Notably, organic manure (including sewage sludge digestate/biosolids) cannot be applied to land if it is to be left bare over winter. An application for permission to dispose of digestate to land in the autumn period can be sought up to February 2022; however, land managers must comply with the regularity requirements thereafter [1].
As a result of the regulatory requirement, both producers and users of organic manures face a challenge in the storage of organic manures until they can legally spread to land. Storage of the organic manure poses impacts to operational management and risk of pollution to the environment. Therefore, the alternative outlets for digestate materials required to reduce the pressure on material management and increase revenues. The Biosolids Recycling to Agricultural Land Position Statement by Assured Biosolids Limited [2] highlights the need to continue recycling biosolids and avoiding combustion for energy recovery. The statement signposts potential alternative outlets for biosolids using modern thermal processes, including hydrothermal carbonisation.
Hydrothermal carbonisation (HTC) has the potential to become an environmentally friendly conversion process for the production of value added products and multiple energy vectors [3,4]. This includes the opportunity to integrate HTC with other biological systems such as anaerobic digestion (AD) within a biorefinery concept [5,6], a timely approach due to the introduction of the Green Gas Support Scheme (GGSC), which provides financial incentives for new AD plants to increase the proportion of biomethane in the gas grid. As a result, investigations of the integration of HTC and AD within existing treatment infrastructure are now increasingly been being studied and being adopted in the waste water sector [7]. These outputs show that treating digestate biomass via HTC enhances biogas production via AD, including the potential for the production of solid fuels or soil amendment products [5,8].
Figure 1 illustrates the integration approach of HTC post AD, primarily for the treatment of digestate. This requires little change to the current AD operating procedure, as the incoming waste stream remains relatively unchanged, apart from the discharging of HTC process water into the AD facility, potentially increasing biogas production. HTC is generally operated at lower temperatures to maximize the biodegradability of the process waters and optimise the overall energetics of the HTC process. The digestate is transformed into a more manageable hydrochar since its volume is reduced after HTC treatment. This can be regarded as a ‘digestate enhancement process’, improving dewatering due to the hydrophobicity of the resulting hydrochar, generating a more stable product. Due to the inherent composition of the digestate, the resultant hydrochar has a low quality as a solid bio-coal, largely due to high levels of ash and inorganic content, resulting in low calorific value and potential problems associated with slagging and fouling, attributed to its ash chemistry [5].
The quality of the hydrochar as a solid fuel can be improved by co-processing the digestate with additional feedstocks, such as lignocellulosic biomass, which have higher carbon and lower ash contents. The combustion quality of the resulting bio-coal improves by reducing the ash content and increasing its calorific value. The hydrothermal carbonisation of lignocellulosic materials has been shown to result in significant energy densification and improved combustion behaviour compared to the initial biomass [9,10].
An added benefit of adding a co-feedstock with lower moisture content is to reduce the need for dewatering and thickening of the digestate before hydrothermal conversion, which improves the overall energetics of the process. Digestate has a low solid content; therefore, co-processing of the digestate with a lower moisture, lower ash, and higher carbon content co-feedstock can improve hydrochar properties. The amount of blended lignocellulosic feed will affect the overall characteristics of the hydrochar and its suitability for use as a solid fuel. The combustion behaviour of the resulting bio-coal can also be improved by reducing the inorganic content of the hydrochar by operating hydrothermal carbonisation in the presence of mineral acids [11]. This has been shown to reduce the ash content and facilitate the recovery of nutrients such as phosphorus [11].
To avoid excessive consumption of energy to heat up large volumes of water, the solid content of the HTC feed should be increased to as high as possible, although feeding of heavy slurries greater than 20% solids can be challenging. Therefore, a constant supply of co-feedstock is required to improve process efficiencies.
Studies have shown that co-processing of high ash feedstocks such as sewage sludge and swine manure, as well as high fat, protein, and starch-containing materials, such as food waste with waste lignocellulosic materials (sawdust and corn stalk), enable the tailoring of the hydrochar as a solid fuel through enhanced dewaterability and lower moisture content [12], resulting in increased yields, carbon content, calorific value and nutrient retention [13,14], reduction of heavy metals and combustion performance [15,16], and reduced energy consumption for pelletisation of the hydrochar including an increase in pellet tensile strength [17]. The co-processing of lignocellulosic biomass with high-ash feedstocks will influence the levels and ash behaviour of the resulting hydrochar during combustion. However, the influence of co-processing has received less attention, in particular the effect of blending digestate from wastewater treatment with lignocellulosic biomass. The understanding of the influence of co-processing on the composition and biochemical methane potential (BMP) of the process water is also limited.
This investigation seeks to understand the effects of HTC co-processing of sewage sludge digestate with three dissimilar lignocellulosic wastes (grass clippings, garden hedge pruning, and woodchip). Given the significant availability of these wastes in the UK [18,19], they have potential for blending with digestate and other high ash feedstocks. The objectives are to understand the effect of the composition of blended materials and the HTC process conditions on product yields and properties of the hydrochar and process waters. Furthermore, this study seeks to determine how the addition of lignocellulosic biomass affects the hydrochar quality as a solid fuel; in particular, its ash behaviour during combustion, as well as the effects on process water composition and its subsequent biochemical methane potential (BMP).

2. Materials and Methods

2.1. Source and Preparation of Materials

Dewatered digestate was obtained from Yorkshire Water, UK, following anaerobic digestion of sewage sludge (SS) comprising of pre-treated primary and secondary bio-solids. Grass clippings were collected by the University of Leeds Estate Services and frozen at −18 °C. Privet hedge prunings (Ligustrum ovalifolium) were obtained from Burley Model Allotments, Leeds, before air drying. Woodchip, with specification G30 and G50, was sourced from Garforth Log Supplies (Peckfield House Farm, Garforth, Leeds, UK), which consists of both premium grade Larch and Spruce softwoods. The digestate, garden hedge, and wood chip samples were milled to a particle size of less than 2 cm, before blending.

2.2. Hydrothermal Carbonisation (HTC)

Hydrothermal carbonisation (HTC) reactions were performed using a 600 mL stainless steel Parr 4836 reactor (Parr, Moline, IL, USA). Reactions were conducted at 150, 200, and 250 °C for a 1 h retention time. A 40 g subsample of oven dried biomass was mixed with 200 mL of deionised water to achieve a 20% solid loading ratio. Reactions were conducted using a quartz silica internal reactor liner to facilitate accurate material balance measurements. Once the reaction was complete, the reactor was allowed to air cool in a vented fume hood. Once cooled, the gaseous products were vented and the liquid and solid products separated through Grade 1 qualitative circles (1001-150, Whatman, UK) using Büchner filtration. Solid residues were air dried overnight and then subsequently oven dried at 60 °C for approximately 48 h. Calculated yield data assumes hydrochars undergo 100% dewatering during oven drying. Gas yields were calculated as the difference between the total input and output masses.

2.3. Feedstock and Hydrochar Analysis

Solid materials were air dried and homogenised in a grinder (Jaw Crusher BB 200, Retsch, Haan, Germany) for chemical analysis. Particles were further ground and sieved through a 100 μm apertures until homogeneous.

2.3.1. Biochemical Analysis of the Feedstocks

The biochemical composition of the feedstocks (cellulose, hemicellulose, and lignin) was determined using a modified Van Soest method [20]. Protein content was calculated according to Equation (1), using the total nitrogen value obtained from elemental analysis.
Protein ( % ) = 6.25 × Nitrogen ( % )

2.3.2. Proximate and Ultimate Analysis and Predictive Higher Heating Value (HHV)

Proximate analysis was determined using thermo-gravimetric analysis (TGA/DSC 1, Mettler Toledo GmbH, Switzerland). Approximately 10 mg of sample was heated under N2 (50mL/min) from 25 to 105 °C at a rate of 25 °C/min and held for 10 min, followed by heating to 900 °C held for 10 min, at which point air is added for 15 min. Differential thermogravimetric (DTG) curves, obtained from the TGA data, also illustrates the differences in biochemical composition of the biomasses.
Carbon, hydrogen, nitrogen, and sulphur content were analysed using a CHNS Elemental Analyser (Flash 2000, Thermo Scientific, Waltham, MA, USA). Certified biomass reference materials (Elemental Microanalysis, UK) were used to calibrate the instrument. Hydrogen content was corrected for moisture, and oxygen content was calculated by difference. HHV (MJ/kg) was calculated based on Equation (2) [21] using the values obtained from elemental analysis, presented on a dry basis (db). The energy densification (ED) of the hydrochars, compared to the parent biomass, were calculated according to Equation (3) [8]. The energy yield (EY) recovered by the hydrochars was calculated according to Equation (4) [8].
HHV = 3.55 C 2 232 C 2230 H + 51.2 C H + 131 N + 20600
ED = HHV Hydrochar HHV Biomass
EY = ED × Hydrochar   Yield ( % )

2.3.3. Inorganics Analysis

The composition of inorganic elements was determined using X-ray fluorescence (XRF) spectroscopy (ZSX Primus II, Rigaku, Tokyo, Japan). Biomass and hydrochars were prepared for analysis in the form of fused beads. For this, ashes were created using a muffle furnace maintained at 550 °C for 2 h. Samples were then removed and homogenised by mixing. The samples were then heated to 850 °C for a further 2 h to reduce potassium devolatilisation, as described in [22]. The resultant ashes were ground using a pestle and mortar, to reduce the particle size to <106 μm. A 0.7 g sample of ash was mixed with 6.3 g of flux and a fused bead generated using an electric fluxer (Katana K1 Prime, Quebec, QC, Canada) at a temperature of 1100 °C.

2.3.4. Predictive Slagging and Fouling Indices

A range of indices were used predict the likelihood of slagging and fouling behaviour during combustion. These indices are calculated based on the inorganic composition of the fuels. The equations for calculating predictive slagging and fouling indices equations for alkali index (AI), bed agglomeration index (BAI), acid base ratio (Rb/a), slagging index (SI), and fouling index (FI) are provided by Parmar and Ross [5]. The interpretation of these indices is displayed in Table 1 [23]. The interpretation of 2S/Cl is also presented in Table 1, according to the discussion outlined by [24].

2.4. Process Water Analysis

Total organic carbon (TOC) content of the process waters was determined using a TOC analyser (IL 550, Hach Lange GmbH, Düsseldorf, Germany). Chemical oxygen demand (COD), phenols and total nitrogen (TN) were determined by spectrophotometry using HACH cuvette test kits (LCK014, LCK338, and LCK345) (Hach Lange GmbH, Germany). Total volatile fatty acids (VFA) were determined by gas chromatography (GC) (Agilent Technologies, 7890A) with flame ionization detection (FID) using a DB-FFAP column (30 m × 0.32 mm ID × 0.5 µm film), using a 5:1 split ratio. Helium was used as the carrier gas, with a flow of 10 mL/min. The GC method was calibrated with SUPELCO Volatile Fatty Acid Standard Mix. This standard mix includes acetic, propionic, iso-butryric, butryric, iso-valeric, valeric, iso-caproic, caproic, and heptanoic acids. The process waters were passed through a 0.2 µm syringe filter before GC-FID analysis. The CHNS content of the process waters was calculated by drying a known volume at 60 °C for 48 h. The dried samples were then analysed using a CHNS Elemental Analyser (Flash 2000, Thermo Scientific, USA). Oxygen was then calculated by difference. Total solids (TS) and ash content within the process waters were calculated by heating to 105 °C and then 550 °C in a muffle furnace.

2.5. Biomethane Production and Biodegradability

2.5.1. Experimental Biochemical Methane Potential (BMPexp)

Experimental BMP tests (BMPexp) were conducted using an Automatic Methane Potential Test System (AMPTS II) (Bioprocess Control, Lund, Sweden). Process waters were diluted to 10 g COD/L, using distilled water and 200 mL added to the reactors, achieving the equivalent of 2 g COD of process water added. Inoculum was also diluted to 10 g COD /L and 200 mL added to each reactor, achieving 1:1 inoculum-to-substrate ratio as recommended in the guidelines for the standardisation of biomethane potential tests [25]. BMPexp were conducted under mesophilic conditions (37 °C) for a 30-day duration. Reactors were automatically agitated for 60 s every 10 min. The measured volumes of biomethane produced were automatically normalised to standard conditions (1atm, 0 °C, and zero moisture content). Before starting the reactions, all bottles were flushed with nitrogen to ensure anaerobic conditions. Inoculum was collected one month prior to use from the outlet of an anaerobic reactor, used for digesting sewage sludge, at Yorkshire Water’s Esholt WWTW in Bradford, UK. Once collected, the inoculum was stored at 4 °C to facilitate the exhausting of endogenous methane emissions. A positive control using cellulose yielded a BMP value of 380 NmL CH4/g volatile solids (VS), indicating the inoculum was active.

2.5.2. Biodegradability Calculation

The biodegradability of the process waters was calculated as the difference in process water COD concentration remaining after BMPexp tests minus the inoculum COD added and was determined according to Equation (5). Where CODWD is the COD value in g/L for the whole digestate after BMPexp. It is assumed there is no increase in inoculum-derived microbial colonies during the digestion period.
BD CH 4 ( % ) = 50 ( 0.4 × COD WD + 4 )

2.6. Assessment of Error and Statistical Analysis

Hydrothermal carbonisation experiments were performed in duplicate. The repeatability in solid yields was typically ±3 wt.%. All analyses of product streams were performed in duplicate with the exception of XRF and VFA analyses. Average values are reported together with standard error in tables and figures. In addition, analysis using TOC is based on multiple sample injections until a maximum standard deviation of ±2% is achieved. Experimental BMP tests were also performed in duplicate with positive and inoculum controls.

3. Results and Discussion

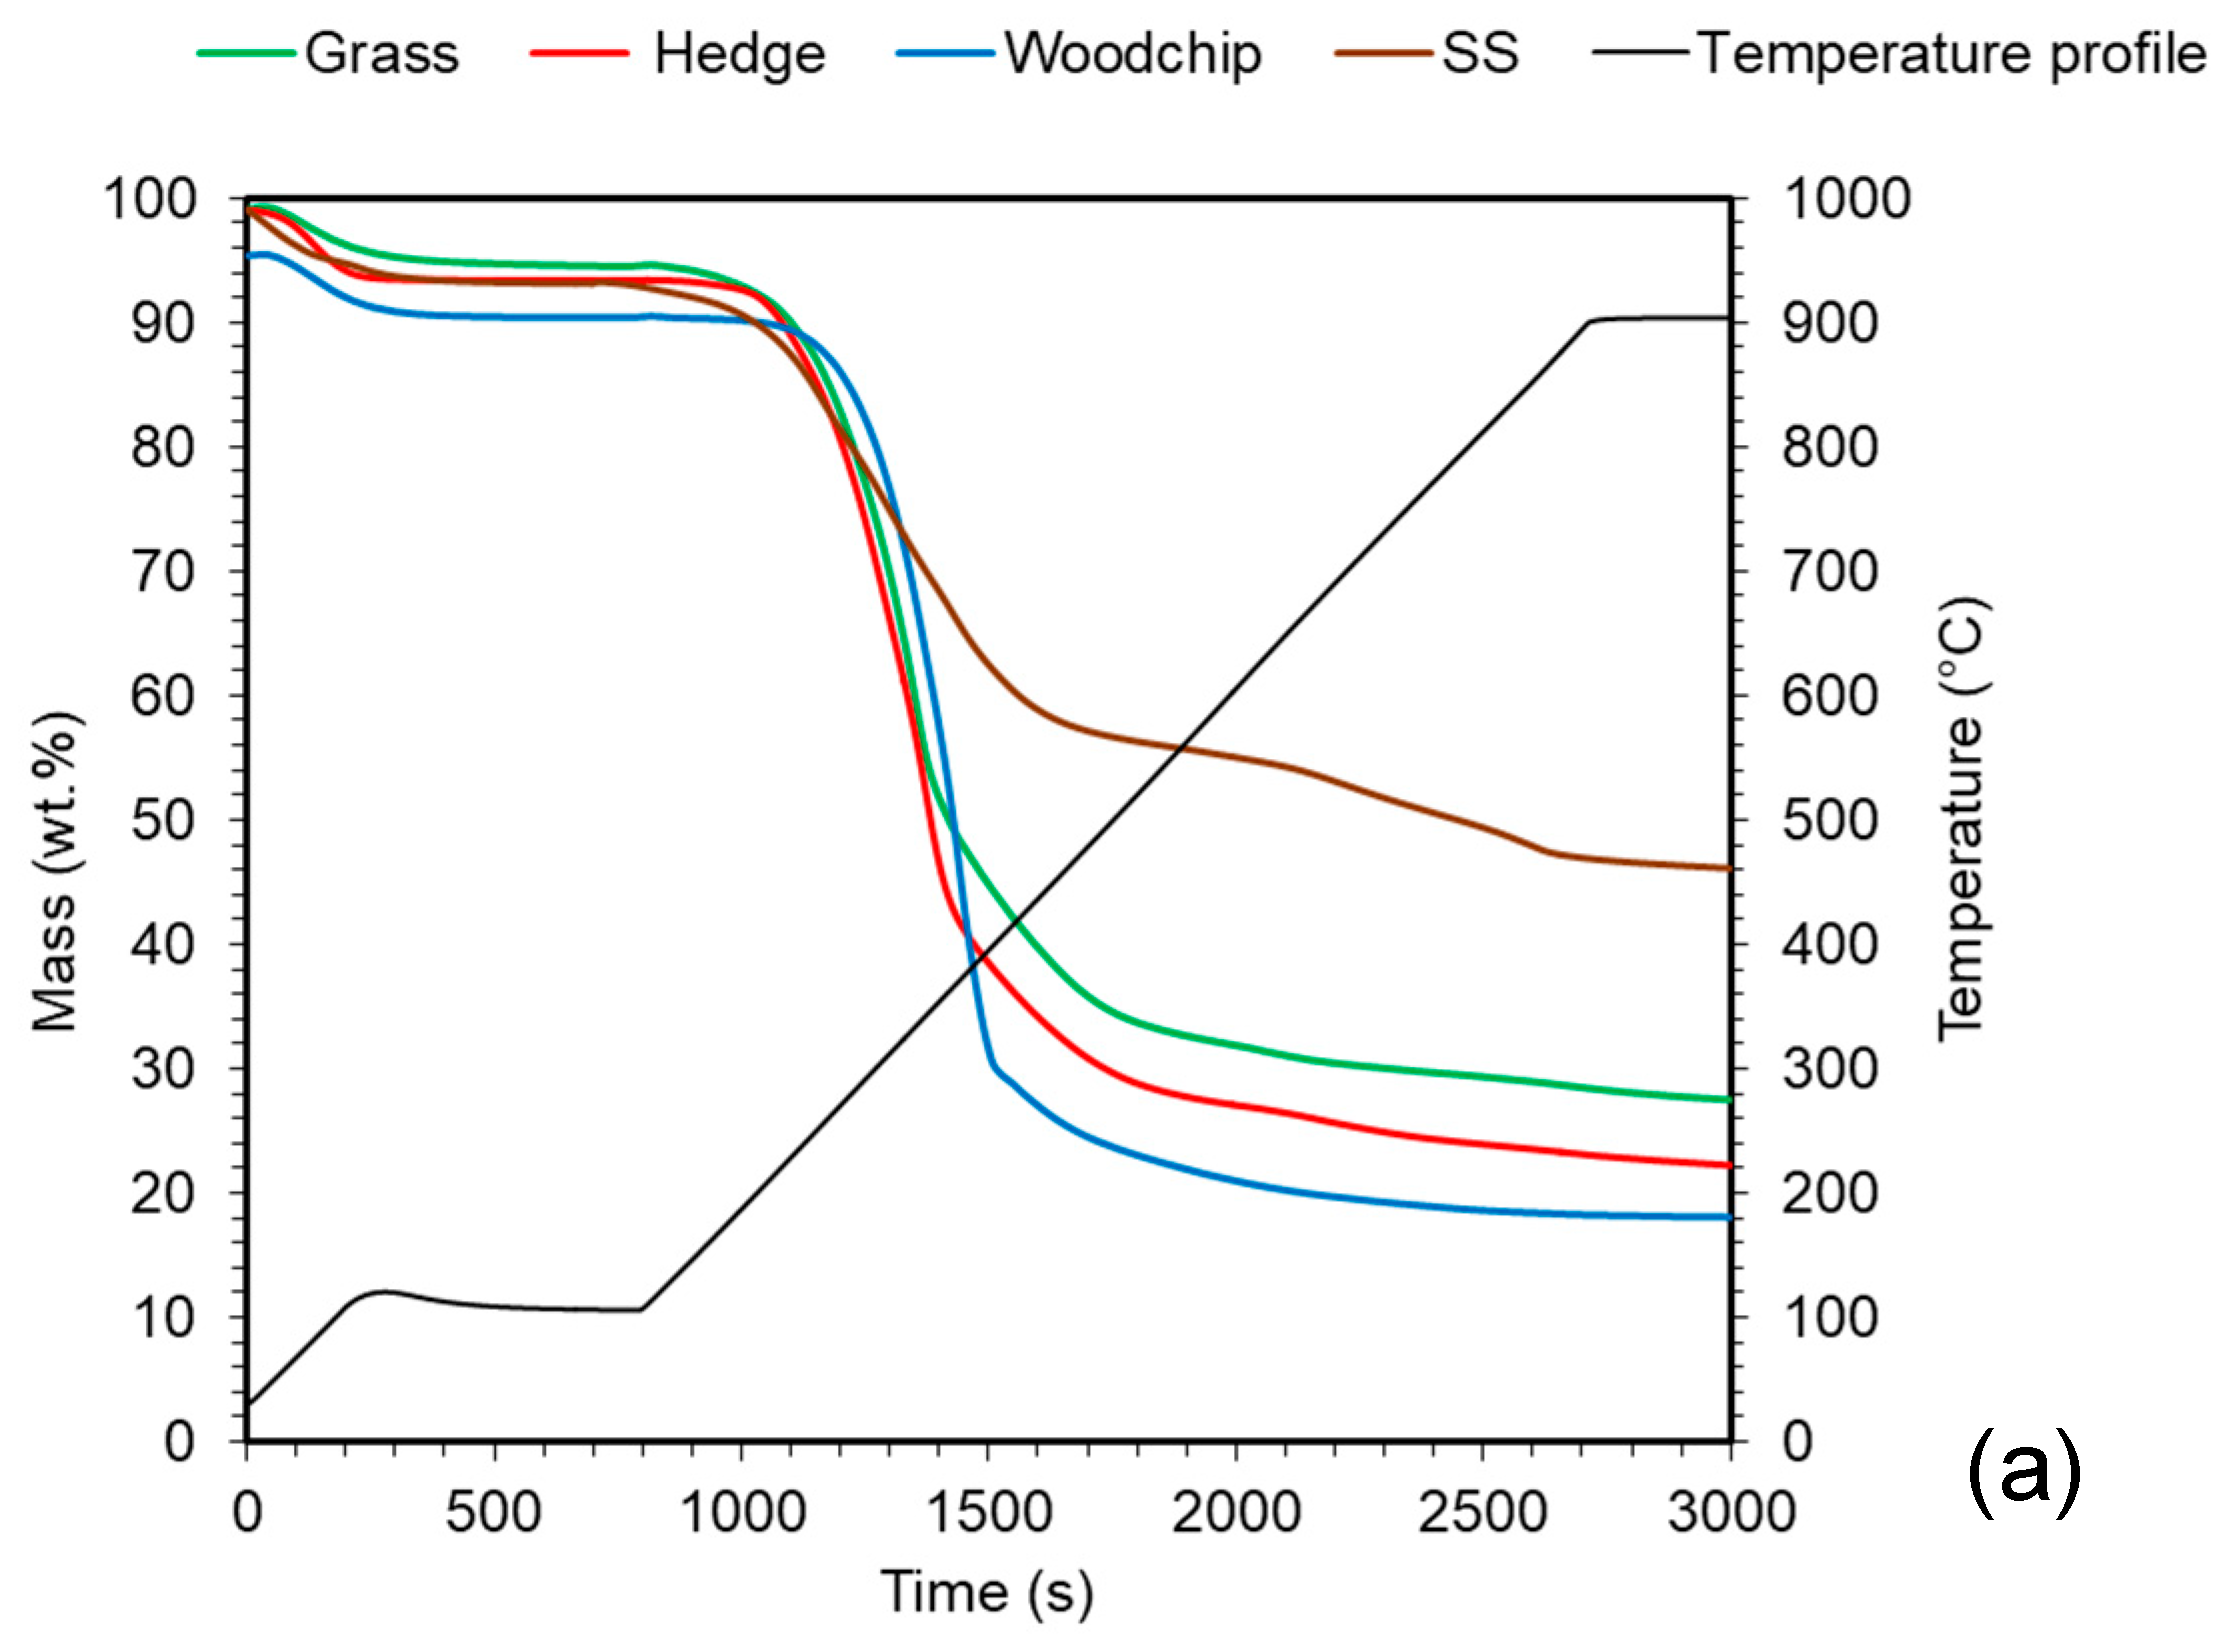
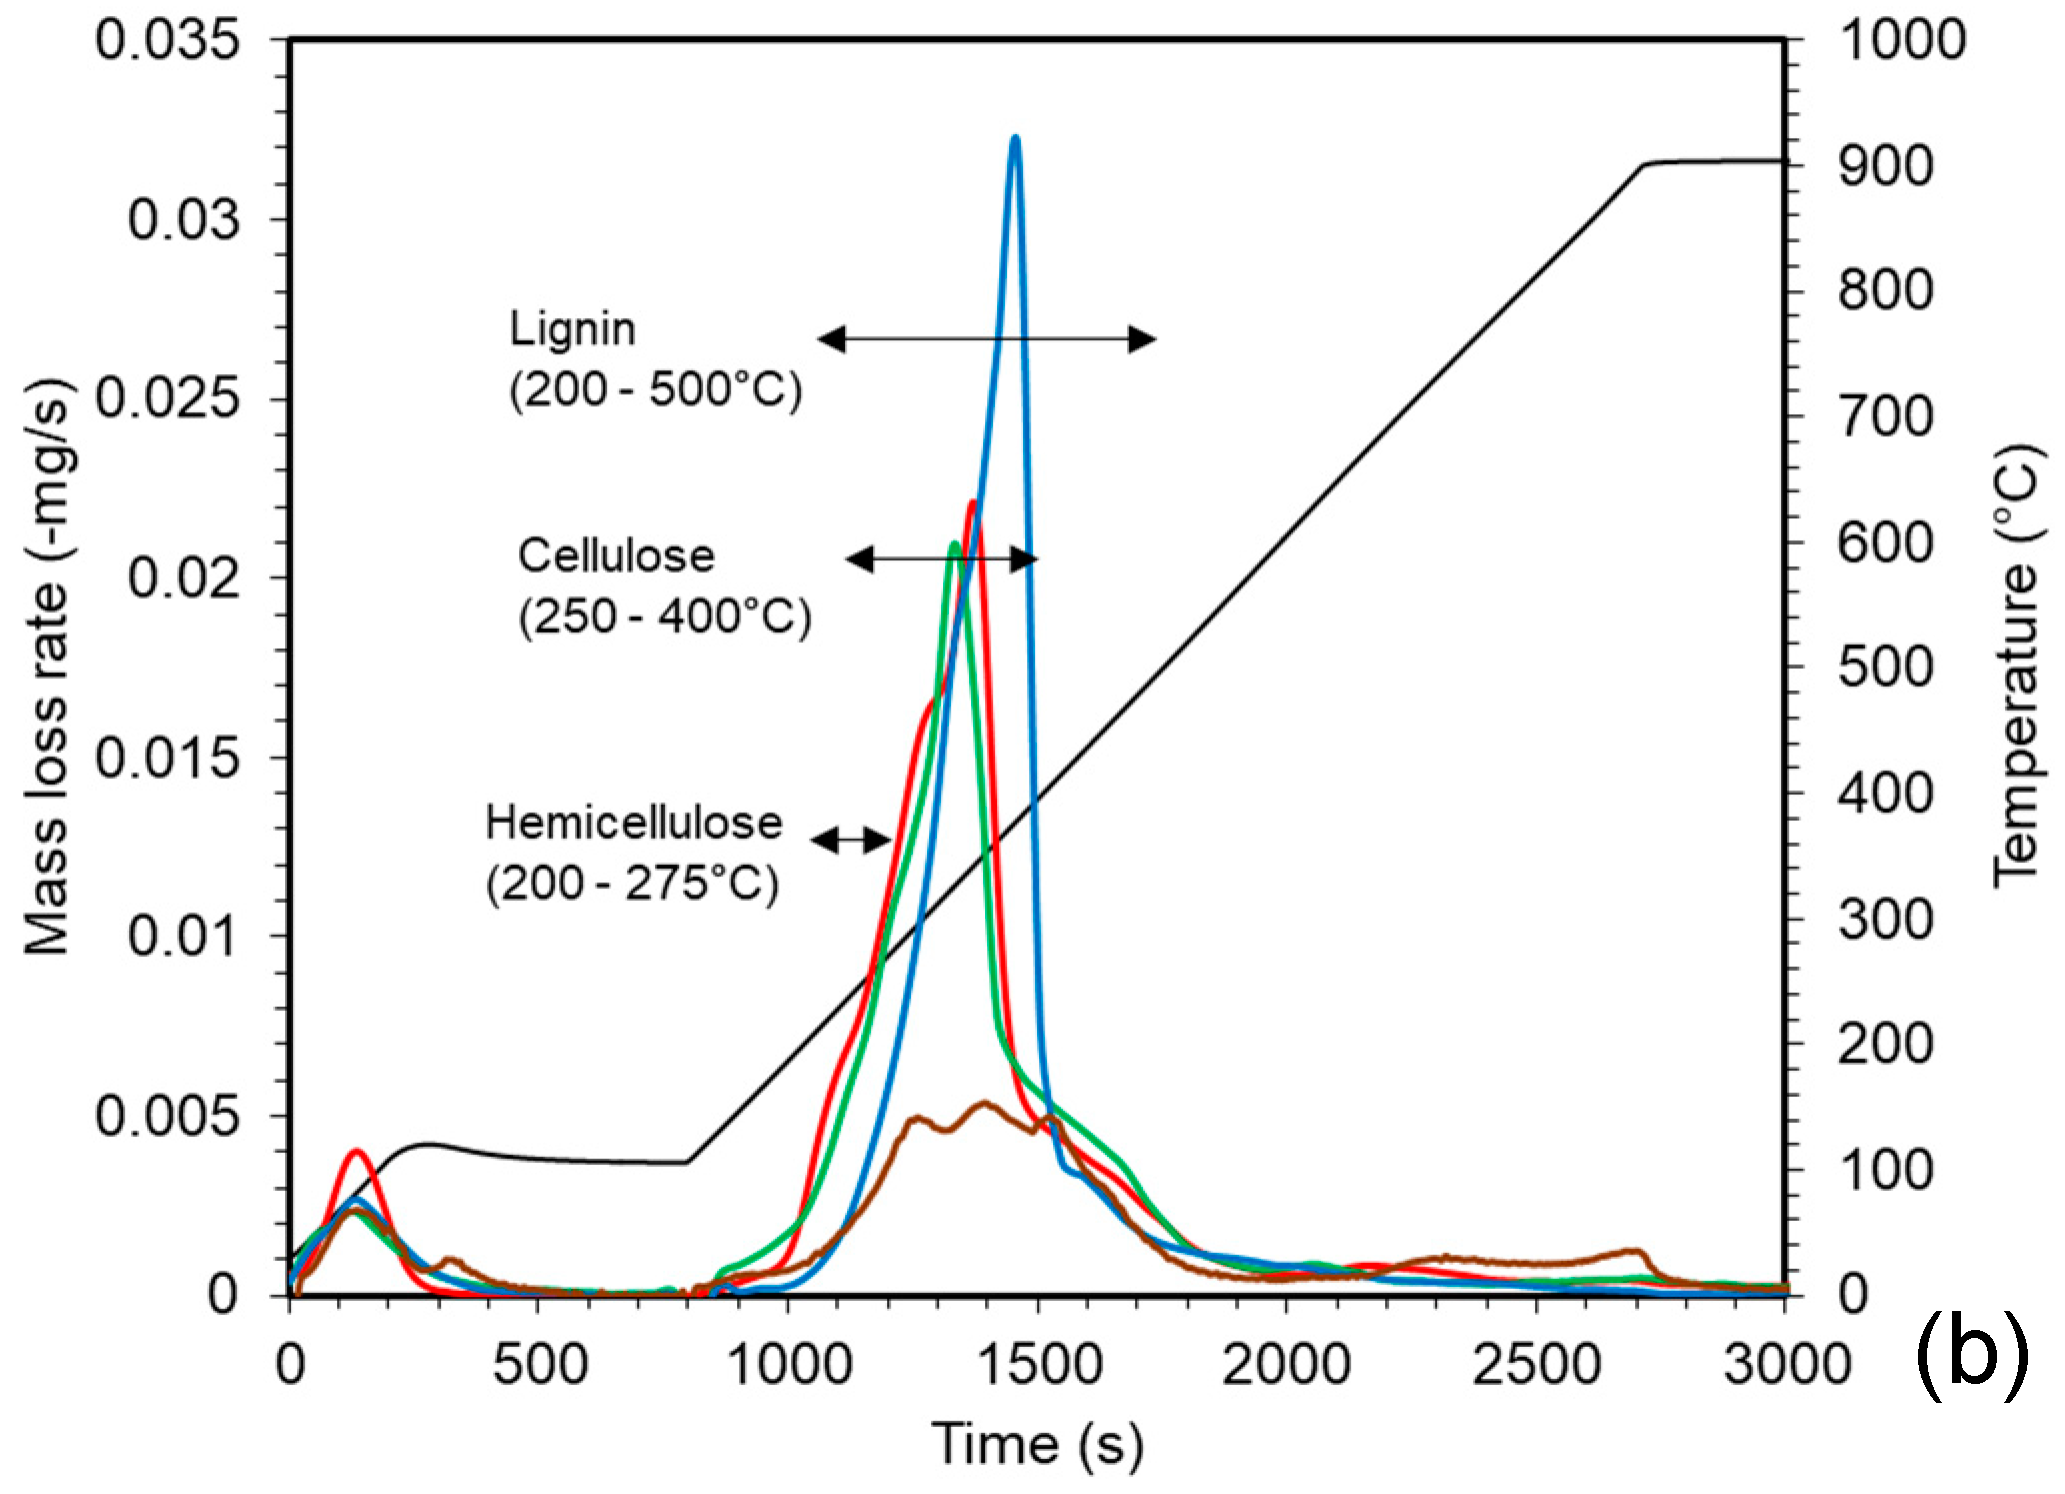
3.1. Characterisation of Feedstocks

The proximate and ultimate analysis, biochemical analysis, and calorific value of the sewage sludge digestate and three lignocellulosic biomass are listed in Table 2. The main difference between the lignocellulosic biomass and the SS digestate is the lower ash content of the lignocellulosics. The digestate sample contains 46.9 wt.% ash, whereas the lignocellulosic biomass has an ash content ranging between 7.2 and 12.4 wt.%. The ash content of the lignocellulosic biomass follows the order grass > privet > woodchip. The calorific value of the SS digestate is 14.9 MJ/kg, whereas the lignocellulosics are considerably higher, ranging between 18.4 and 19.9 MJ/kg. Woodchip has the lowest ash content, followed by the privet hedge and grass clippings.
Figure 2a shows a comparison of the mass loss curves determined for the four feedstocks. Lignin decomposes between 200 and 500 °C, whereas cellulose decomposes between 250 and 400 °C and hemicellulose between 200 and 275 °C. Each of the lignocellulosic biomass contain a higher cellulose and hemicellulose content than the digestate sample. Woodchip contains the highest level of cellulose and lignin. The lignocellulosic biomass also have a much higher fixed carbon content compared to the digestate. Woodchip has the highest largest fixed carbon content (17.1 wt.%), correlating with its higher lignin content [26]. Figure 2b shows the differential thermogravimetric analysis (DTG) curves and highlights the differences in the biochemical composition of the lignocellulosic biomass and the SS digestate (Table 2). The grass clippings have the highest protein content of 21.1 wt.% followed by SS digestate (19.9 wt.%), privet (6.7 wt.%), and woodchip (2.2 wt.%). Grass clippings have the highest hemicellulose content (22.6 wt.%) followed by woodchip (13.9 wt.%), privet hedge (9.4 wt.%), and digestate (4.9 wt.%). The cellulose content is highest for the woodchip, followed by the grass clippings > privet hedge > SS digestate.

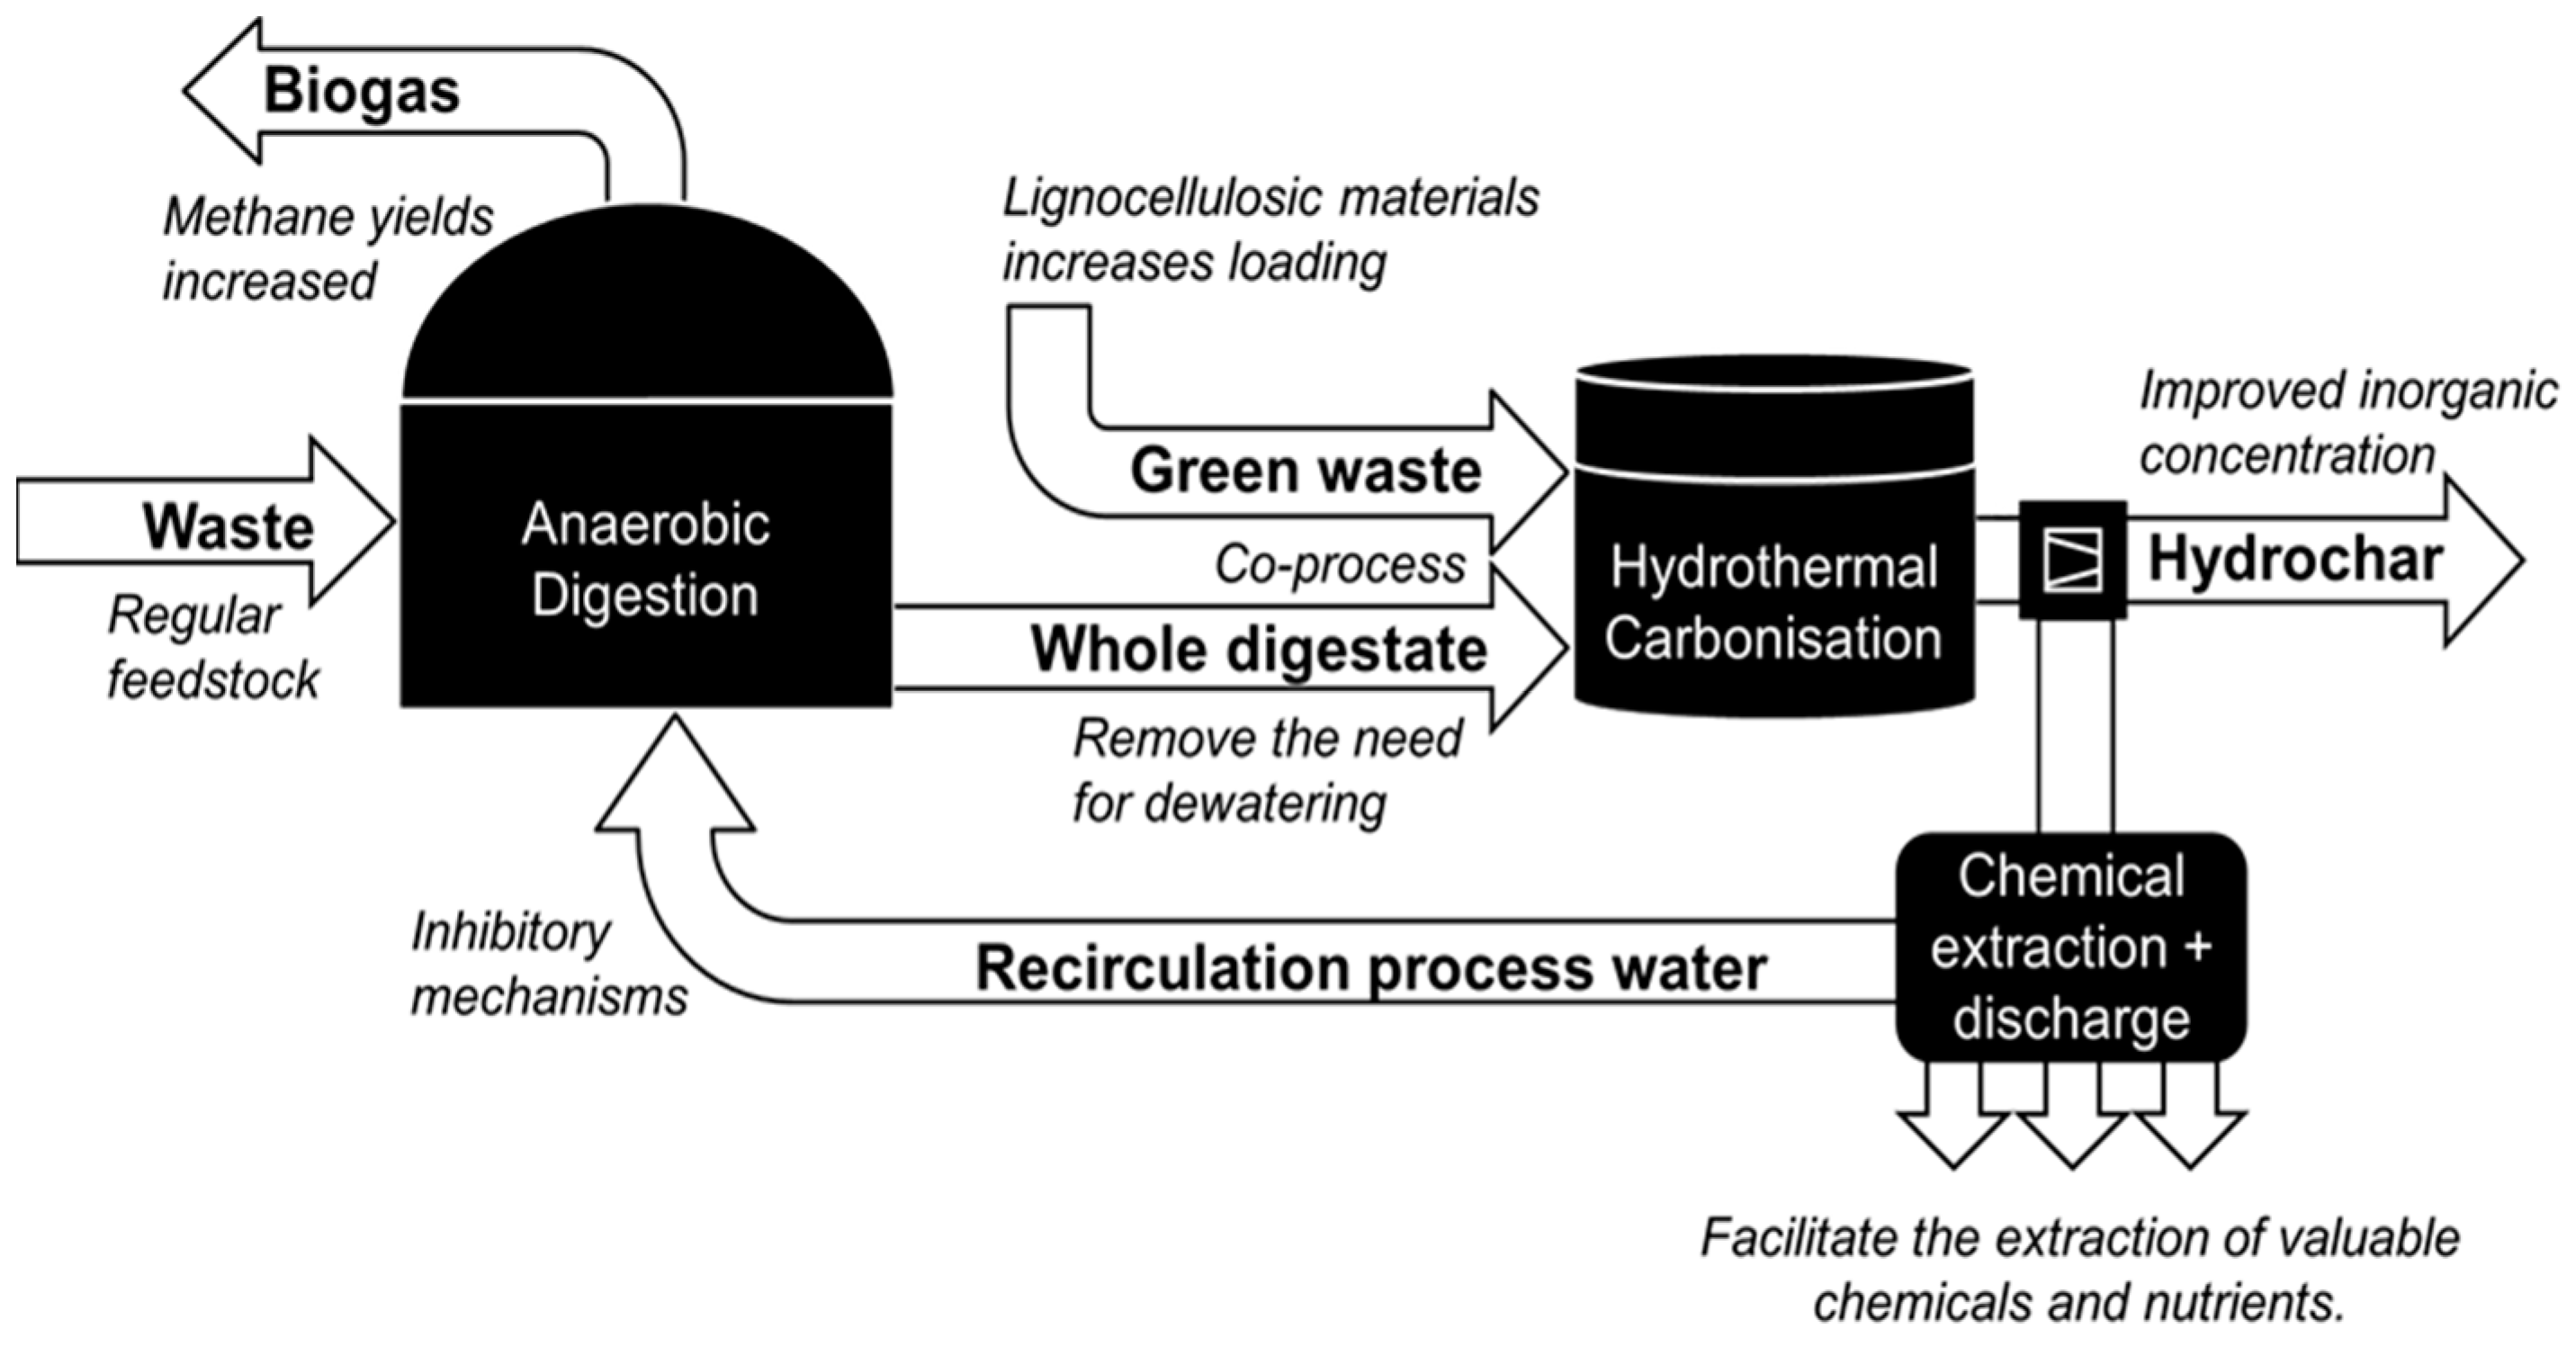
3.2. Co-Processing of Sewage Sludge Digestate with Lignocellulosic Biomass

3.2.1. HTC Product Yields

Table 3 illustrates the influence of HTC temperature on product distribution after blending of lignocellulosic biomass and SS digestate. Privet hedge exhibits a greater solubilisation into the liquid fraction across all temperatures, particularly at the higher temperature of 250 °C, which exhibits a greater yield of liquid products than solid products. The least solubilisation into the process water is observed for the woodchip, with the grass clippings somewhere in between. The protein content follows the order grass clippings > sewage sludge > privet hedge > woodchip.
The average solid yields of hydrochar decrease with increasing temperature, the yields of hydrochar generally follow the order of SS digestate > woodchip > grass clippings > privet hedge. The solubilisation of the feedstocks into the process waters follow the opposite trend. The yields of hydrochar from SS digestate are significantly higher at each temperature than the lignocellulosic biomass due to the higher ash content of the feedstock. The level of gas production slightly increases with increasing temperatures. Of the lignocellulosic biomass, woodchip is the most recalcitrant to degradation, followed by privet hedge and then grass. Of the three lignocellulosic biomasses, the yield of hydrochar follows the order woodchip > grass > privet hedge.
Co-processing of the 50/50 blends of the different lignocellulosic biomass with SS digestate results in an increase in the yield of hydrochar compared to the lignocellulosic biomass alone and a lowering in the yields of hydrochar compared to the SS digestate alone. The higher yields observed with the digestate are associated with the higher ash content. The overall yields are largely additive, suggesting that there is no significant catalytic effect of the ash during blending, although the blended hydrochar yields are slightly lower than the predicted weighted average, possibly due to small losses during workup. The level of soluble matter partitioned in the liquid phase is correspondingly reduced compared with the processing of the lignocellulosic biomass alone. The relationship between product yield and temperature exhibits a linear relationship. Co-processing also reduces the level of gas production, but this is minimal.

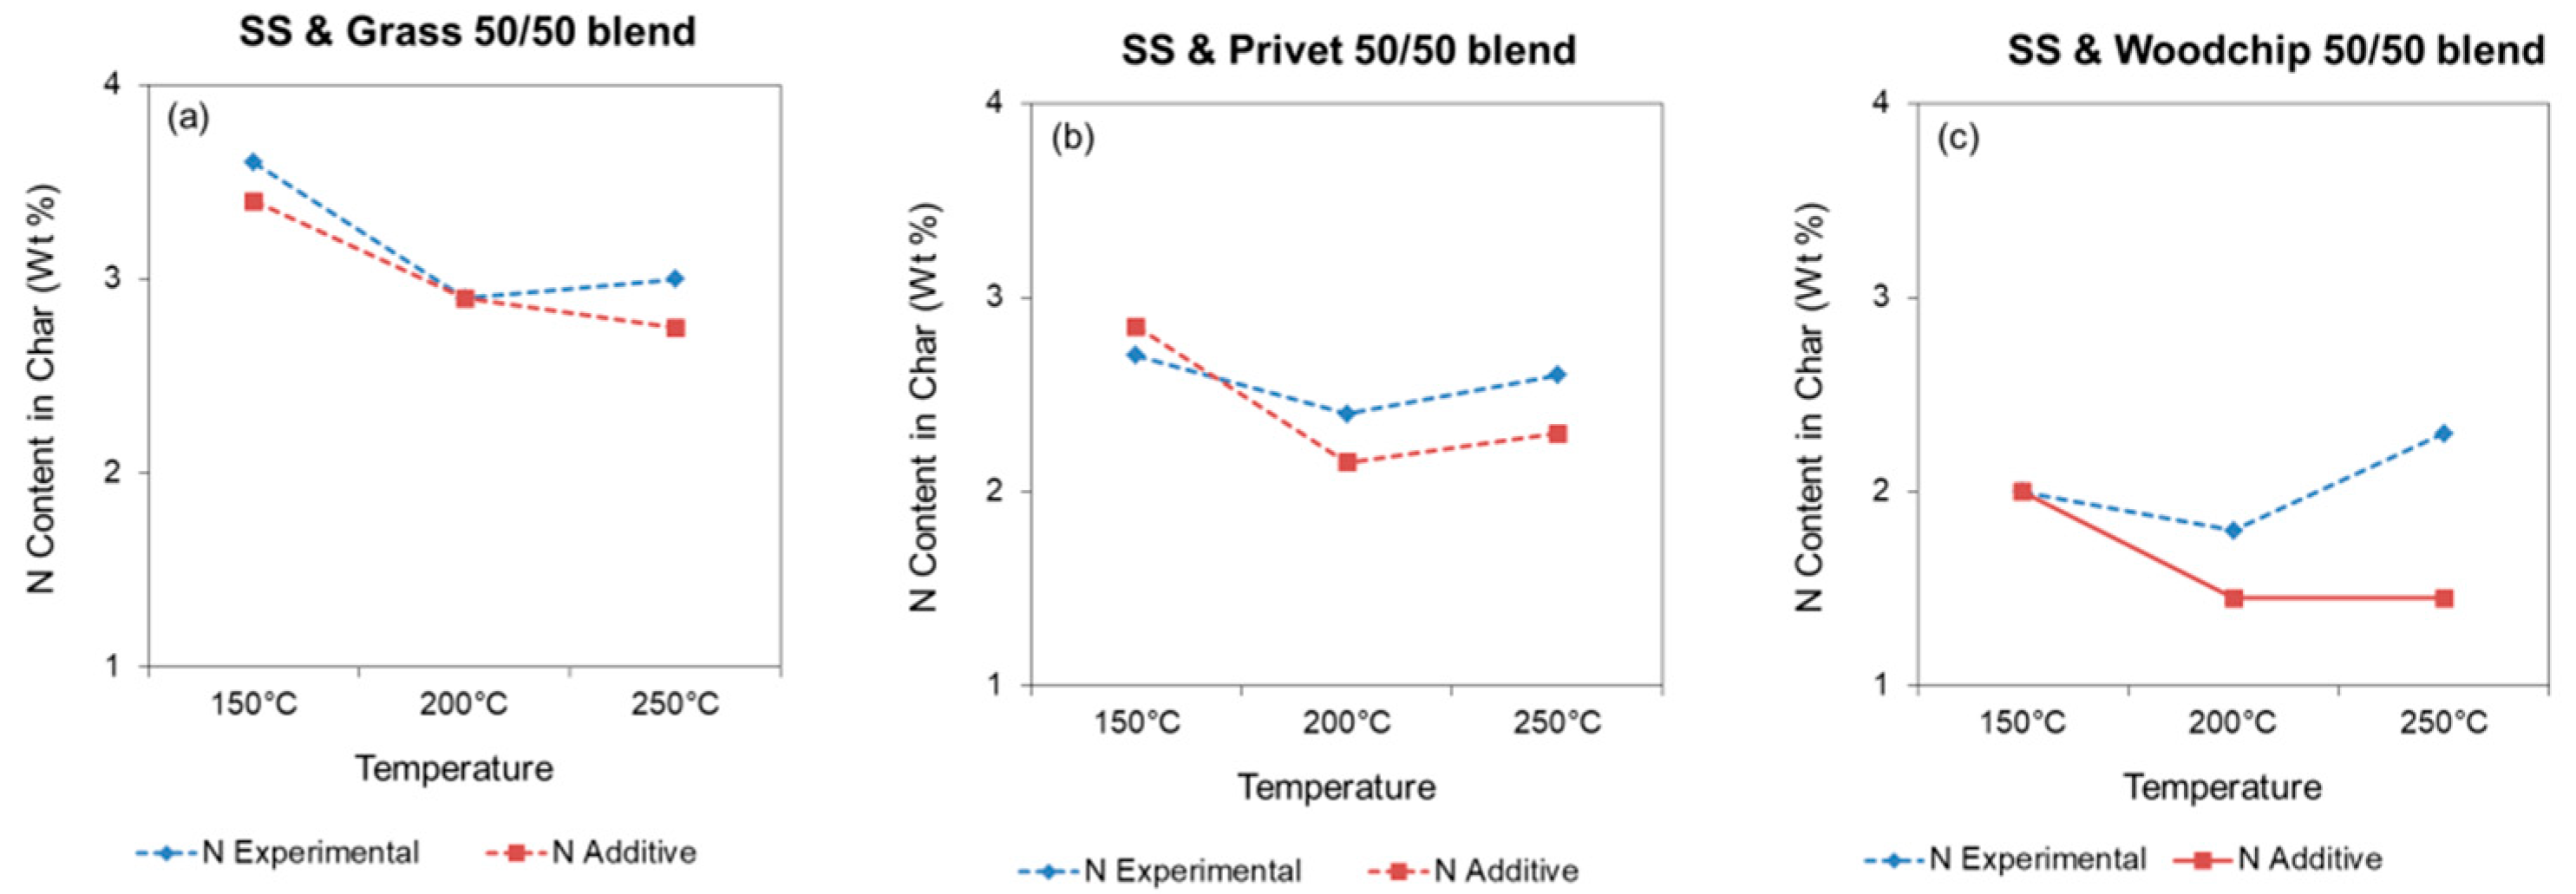
3.2.2. Hydrochar Properties

The proximate and ultimate analysis, higher heating value, H:C and O:C atomic ratios, energy densification, and energy yield for the hydrochar produced from lignocellulosic biomass, digestate, and 50/50 blends are listed in Table 4. These common correlations are typically used to describe the combustion behaviour of solid fuels. Analysis confirms that the ash contents of SS digestate hydrochars are significantly higher than the lignocellulosic biomass hydrochars, ranging between 39–49 wt.%. The ash contents of the lignocellulosics follows the order privet hedge (20–27 wt.%) > grass (10–14 wt.%) > woodchip (1.8–3.3 wt.%). The levels of carbon are highest in the woodchip-derived hydrochars, reflecting the higher lignin content of the woodchip. As a result, woodchip hydrochar generated at 250 °C has the highest HHV at 28.8 MJ/kg. The heating value of the hydrochar increases with temperature for all the lignocellulosic biomass. The increase in ED follows the trend woodchip > privet hedge > grass. The SS digestate on the other hand, has a significantly lower HHV (14.9 MJ/kg) and does not increase with increasing temperature. The ash content of the SS hydrochar at 250 °C is almost 50 wt.%. The levels of nitrogen and sulphur are highest in the digestate hydrochar, reflecting the higher protein content in the feedstock. The nitrogen content decreases with increasing temperature from a high of 3.7 wt.% at 150 °C to 2.4 wt.% at 250 °C. The sulphur content remains relatively stable at about 1 wt.%. Combustion of digestate derived hydrochar would therefore result in oxides of N and S. For the lignocellulosic feedstock, the levels of nitrogen are highest in the grass-derived hydrochar, reflecting its high protein content. In this case, the nitrogen content in the hydrochar does not decrease with increasing temperature and remains relatively stable at around 3.1 wt.%. The combination of high protein and carbohydrate will likely result in more heterocyclic N bound up in the char due to Maillard reactions and may explain the increased incorporation of N in the hydrochar. The levels of nitrogen in the privet hedge are lower and range between 2 and 2.2 wt.% for 150 and 250 °C, respectively. The levels of nitrogen in the woodchip are considerably lower, ranging between 0.3 and 0.5 wt.%, reflecting the lower nitrogen content in the raw feedstock. The levels of sulphur in each of the lignocellulosic biomass are low and generally below detection limits of 0.1 wt.%. The levels of nitrogen experimentally determined by ultimate analysis are compared in Figure 3 with the weighted values assuming additive behaviour. For each feedstock, blending the lignocellulosic biomass with digestate results in a higher N-content in the hydrochar, compared to the assumed additive behaviour. This is particularly evident at higher temperature of 250 °C. This could be due to the increased levels of carbohydrate from the lignocellulosic biomass interacting with the nitrogen from the digestate forming additional heterocyclic nitrogen compounds, resulting in more nitrogen being incorporated in hydrochar. Alternatively, this could be due to higher levels of adsorbed ammonia on the hydrochar surface; due to the lignocellulosic biomass increasing the functionality of the char towards nutrient retention. Either way, more nitrogen is bound to the hydrochar during co-processing. This may be detrimental if the hydrochar is used as a fuel but may be advantageous if it is used as a soil amendment product.
The highest ash content of the lignocellulosic derived hydrochar is from grass, followed by the privet hedge and then the woodchip hydrochar. The HHV of the lignocellulosic hydrochars follows the same trend. The hydrochar blends all have a higher ash content and lower HHV than the 100% lignocellulosic derived hydrochars. The experimental ash content and ED of the blends are compared to the weighted levels assuming additive behaviour, as seen in Figure 4.
The levels of ash appear to be slightly higher than additive in the blends from the grass and privet hedge and roughly additive in the woodchip. This suggests that there may be some interaction between the inorganics in the feedstocks. The ED for grass and privet hedge are also slightly lower than expected if following additive behaviour, whereas woodchip appears to be additive.
The increase of temperature also lowers the energy yield in the hydrochar largely due to an increase in the level of hydrocarbons partitioned into the liquid phase (see Table 3). The rate of reduction in energy yield of the hydrochar with temperature is higher with the blended materials compared to processing alone, especially with SS digestate and grass. The experimental energy yield is compared to the weighted value, assuming additive behaviour, as seen in Figure 5a–c, and indicates that energy yields in the blend are lower than that expected for additive behaviour, suggesting there is an interaction between the feedstocks. This corresponds to a higher TOC level in the process water than would be expected if simply additive, suggesting that the inorganic content may be increasing the solubilisation of organic material into the process water. Figure 5d–f compares the weighted level of TOC expected in the process waters if additive and shows that TOC levels are higher expected.
In each of the feedstocks (with the exception of digestate alone), the carbon content of the hydrochar increases with processing temperature, whereas for the digestate, the carbon content remains at about 34 wt.% under all conditions. Co-processing of the lignocellulosic biomass with SS digestate increases the oxygen and sulphur content and reduces the carbon and hydrogen content of the resultant hydrochar. This is largely due to the higher ash content of the SS digestate. The blending of SS digestate with lignocellulosics reduces the energy density of the hydrochar and reduces the energy densification (ED) compared to processing lignocellulosic biomass alone. The increase of HHV with temperature after co-processing is less than that observed following HTC of the lignocellulosic biomass alone. The increase in ED with temperature follows the order SS and woodchip (17.2 to 20.3 MJ/kg) > SS and privet (17.1 to 18.9 MJ/kg) > SS and grass (17.2 to 17.8 MJ/kg). The HHV of the grass blends is still higher than the SS digestate alone (cf. 17 to 15 MJ/kg). Blending also appears to influence the fixed carbon content of the resulting char. Figure 6 compares the weighted amount of FC, assuming additive behaviour (red line) with the experimentally determined level of FC (blue line) and for the higher ash feedstocks (grass and privet hedge), and at high temperature (250 °C), the FC is lower than that predicted by additive behaviour. This again provides evidence that the blending of the biomass components are interacting, possibly due to a catalytic effect associated with the metals, altering the structure of the resulting hydrochar.
The Van Krevelen plot for the feedstocks and hydrochars is shown in Figure 7, and plots the H:C and O:C atomic ratios of the lignocellulosic biomass and SS digestate alongside the hydrochar generated at 150, 200, and 250 °C. At each temperature, the SS digestate hydrochar exhibits a higher H:C ratio and lower O:C ratio compared to the lignocellulosic hydrochars. This trend is also observed in other studies [27] and suggests that higher inorganic content feedstock such as hydrochars favour decarboxylation reactions, compared to lower inorganic content feedstock, which favour dehydration reactions. The blended hydrochars produced at 250 °C exhibit similar H:C/O:C ratio to that of a low grade coal. The blending of lignocellulosic biomass with sewage digestate reduces the H:C ratio of the hydrochar yet reduces the O:C ratio compared to processing lignocellulosic biomass alone.

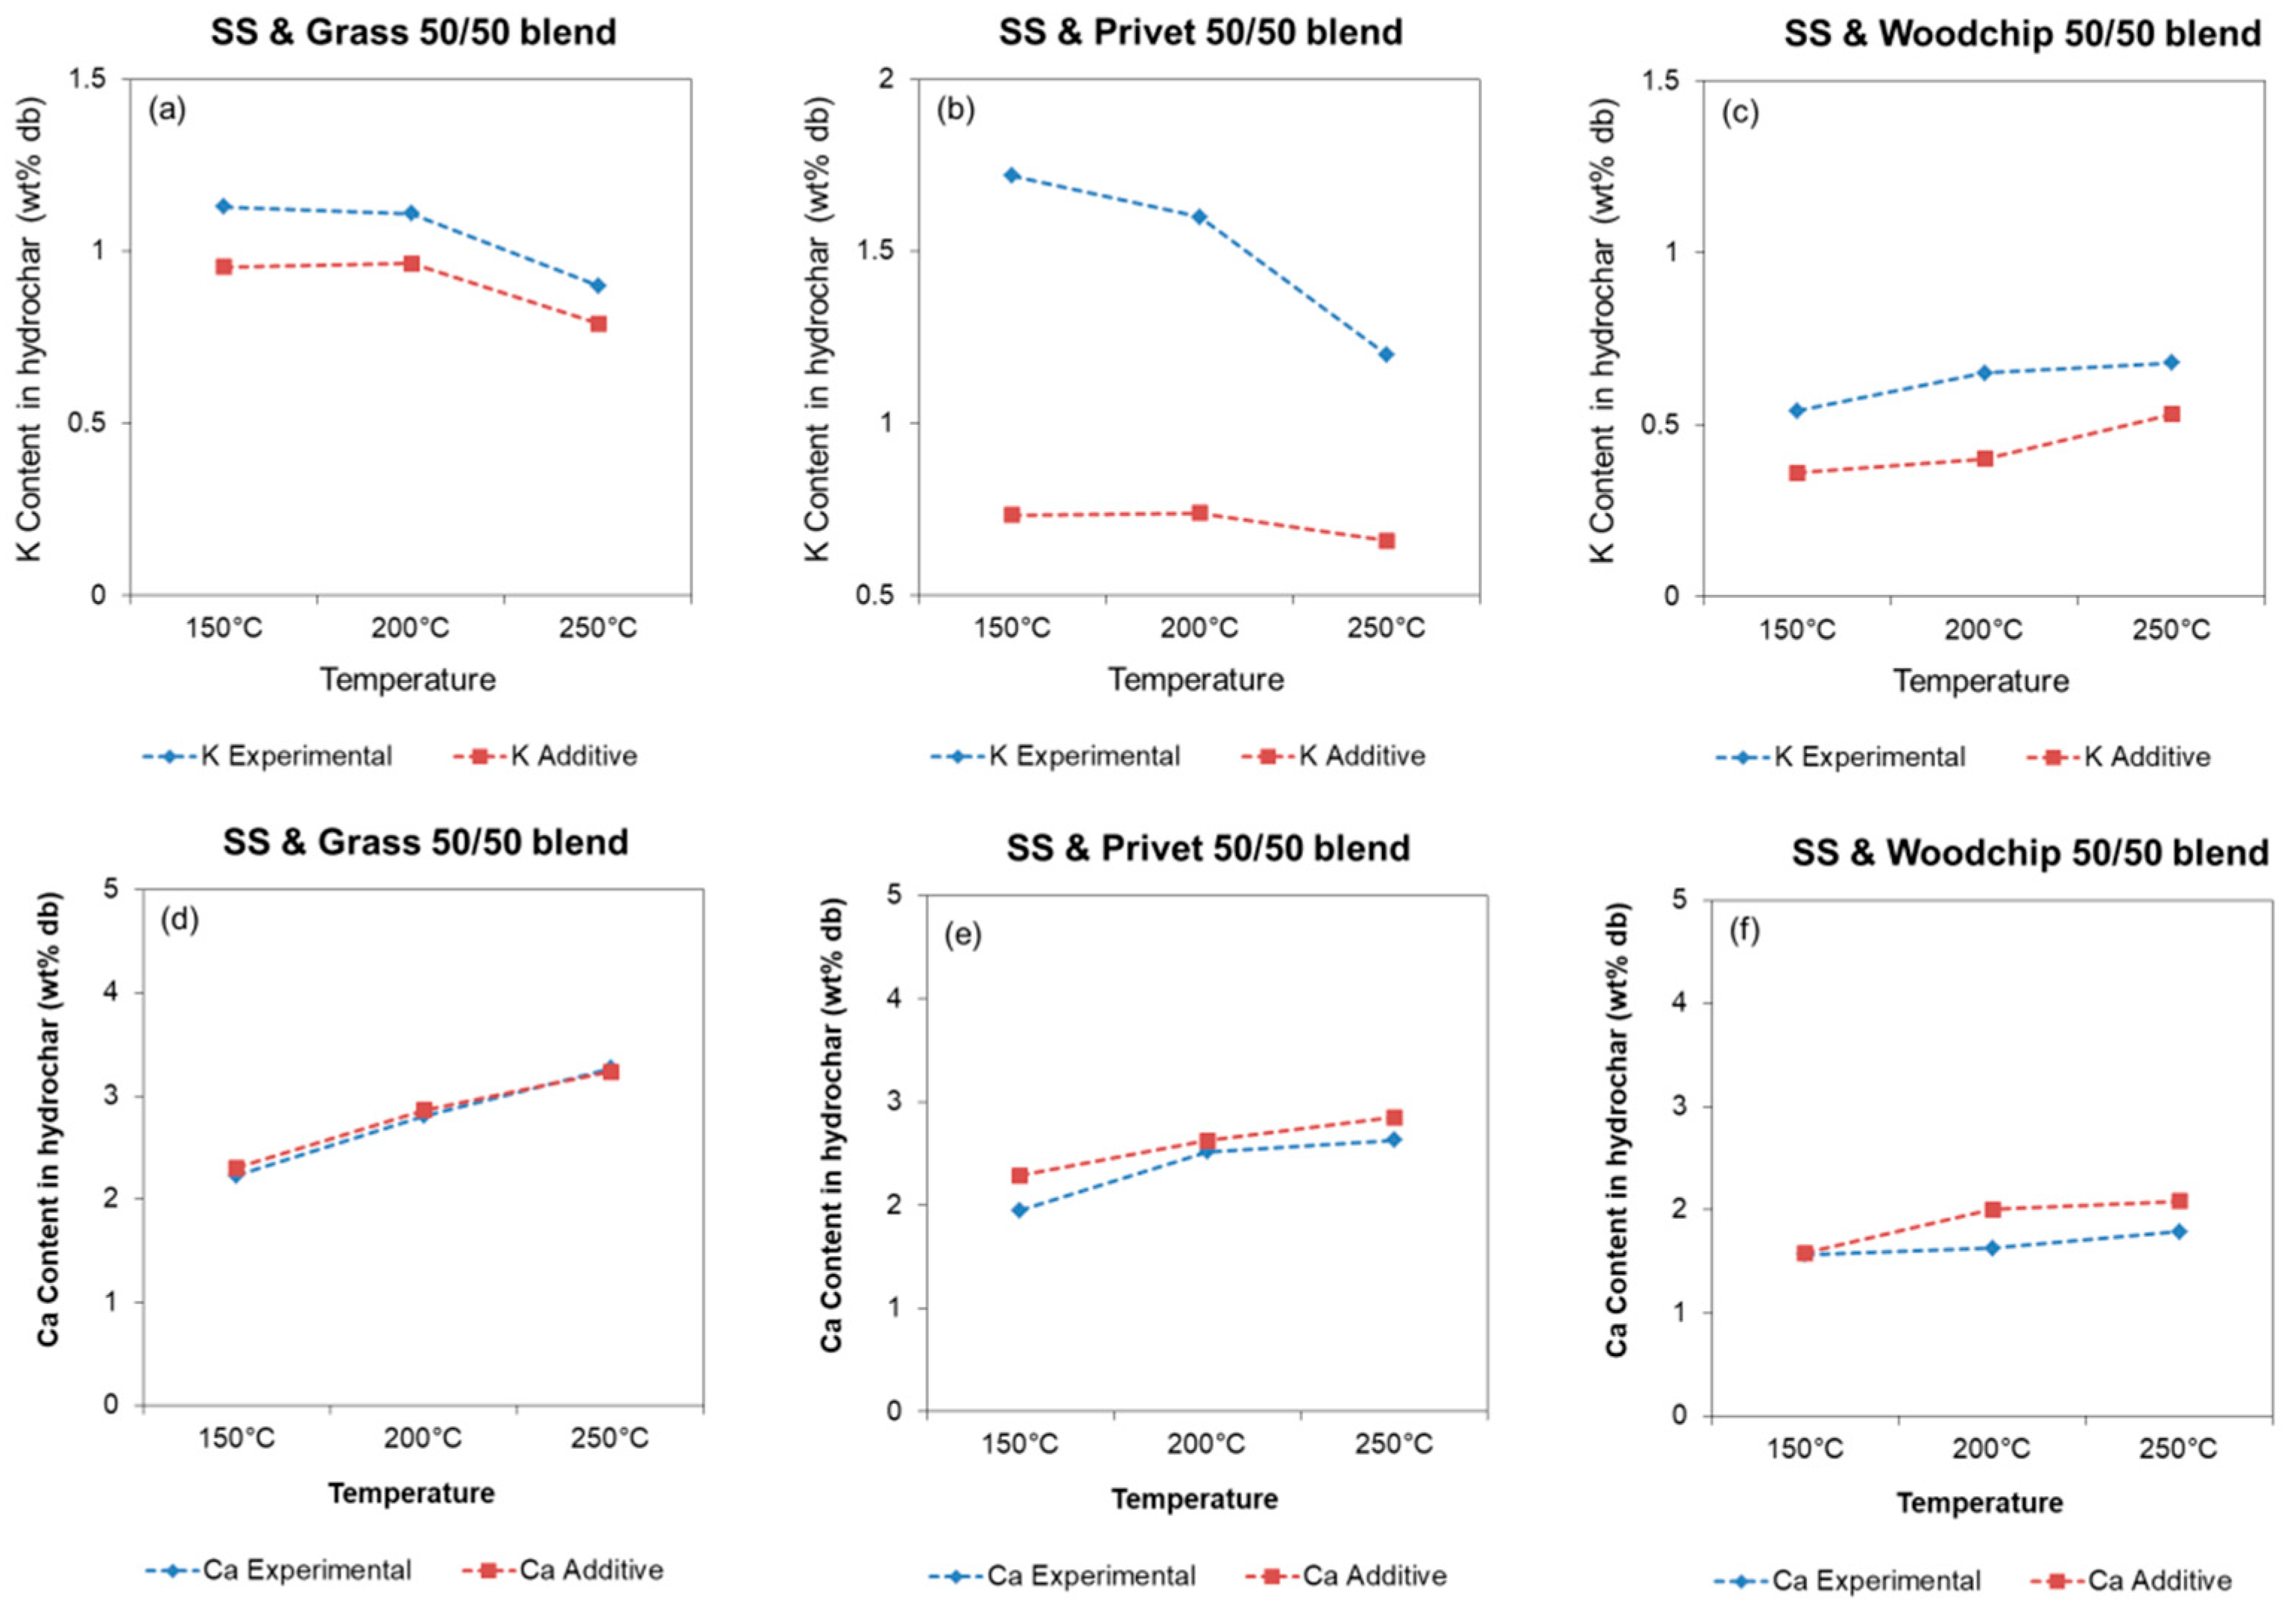
3.2.3. Inorganic Content and Influence on Combustion Behaviour

Table 5 lists the major ash forming elements in the raw feedstocks and resulting hydrochars produced from the feedstocks processed alone and in their 50/50 blends.
The sewage digestate and corresponding hydrochars contain high levels of silicon, calcium, aluminium, and iron. Each of these elements are enriched in the hydrochar following hydrothermal carbonisation due to their low solubility. The digestate also has significantly higher levels of phosphorus, which is largely retained in the hydrochar, due to the increased levels of calcium [9]. The levels of alkali metals are generally lower in the digestate samples, compared to lignocellulosic biomass feedstocks. The major metals in the lignocellulosic feedstocks and resulting hydrochar include calcium, silica, potassium, and phosphorous, in that order. The levels of silica are significantly lower than the SS digestate. The levels of alkali metals in the hydrochars generally reduce with processing temperature, agreeing with previous behaviour observed for lignocellulosics, which shows significant demineralization of alkali metals into the process waters [9]. The major metals in the blend hydrochar are similar to the SS digestate and include, in descending order, silica, calcium, aluminium, and iron. The levels of P in the blend hydrochars are higher in the grass clippings and privet hedge blends compared to the woodchip blends; this is expected to be largely due to the higher calcium content in the grass and privet hedge; increasing the partitioning of P in the hydrochars, although grass also contains the highest P content of the three lignocellulosic biomass.
Table 6 presents the slagging and fouling indices for hydrochar produced from the lignocellulosic biomass and 50/50 blends with SS digestate. Calculation of slagging and fouling indices can be used to predict the behaviour of ash during combustion of the hydrochar. Values have been color-coded based on the predicted propensity for slagging and/or fouling problems. Green signifies no major problems, amber potential problems, and red almost certain problems. SS digestate alone has been included for the purpose of comparison.
It should be noted that these predictive indices need to be interpreted carefully, as some of the indices are developed for coal [28] and so sometimes over-estimate problems [9]. They do, however, provide insight into how fuels might behave and how hydrothermal carbonisation can improves combustion performance [9]. Slagging and fouling indices evaluated include alkali index for fouling, bed agglomeration for ash sintering, base-to-acid ratio for slagging propensities, slagging index, and fouling index. The alkali index (AI) of SS digestate alone reduces following HTC; however, it still predicts problematic behaviour. The only waste not problematic is woodchip. Blending grass and privet hedge with SS digestate is predicted to increase slagging associated with alkali metals at lower temperatures, although there is some improvement as the temperature increases. Only blending with the low ash woodchip improves AI. AI is, however, not the best indicator of ash behaviour for bio-coals from HTC. Moderate improvements in the bed agglomeration index (BAI) are observed when adding lignocellulosic biomass to SS digestate. The base to acid index (Rb/a) describes the ratio of acidic ash components (e.g., SiO2 and Al2O3) to basic oxides (e.g., CaO and MgO). The SS digestate has a lower Rb/a, which predicts a reduced risk of slagging compared to the lignocellulosic biomass, which generally have higher risk of slagging. Privet hedge exhibits a high Rb/a of 11 due to the high levels of basic oxides (CaO and K2O) and is significantly reduced to 0.5 by the addition of SS digestate.
The slagging index (SI) of the SS digestate is improved following HTC and all green lignocellulosics fall within safe limits. Blending of the lignocellulosics with SS digestate reduces the SI compared to SS digestate alone and are within safe limits. Co-processing the lignocellulosics with SS digestate slightly improves the fouling index (FI), suggesting that fouling is partially reduced although only for grass and privet hedge, which exhibit a high propensity to fouling. The molar 2S/Cl ratio is an indicator of high temperature corrosion risk [24]. This indicates that grass and privet may pose a higher corrosion risk than SS digestate when processed alone (i.e., 2S/Cl ratio < 4), whereas the SS digestate processed alone has a higher 2S/Cl ratio of 16.7, suggesting almost negligible high temperature corrosion risk. The blended hydrochars all have 2S/Cl ratio > 4, which suggest that they have only minor corrosion risk. Therefore, blending the lignocellulosic biomass with SS digestate reduces the corrosion risk.
The indices generally show a slight reduction in slagging propensity following co-processing with improvements following the order woodchip > grass clippings > privet hedge cuttings. The addition of the SS digestate to lignocellulosics is expected to increase the ash melting temperature, compared to lignocellulosics alone, due to the higher aluminosilicate and calcium content of SS [29]. Co-processing generally shows an improvement in bed agglomeration index, with the exception of privet hedge, but interestingly, blending is predicted to increase fouling propensity after co-processing.
It was initially thought that blending sewage digestate with lignocellulosic biomass would improve the slagging and fouling propensity of the resulting hydrochars due to the lower ash content of the lignocellulosics; however, the data indicate this is not straightforward. Interactions between feedstocks can result in increased levels of ash, and blending does not always result in additive behaviour. Figure 8 compares the weighted levels of K and Ca in the blends assuming additive behaviour, compared to the experimentally measured values. The alkali metal K, is responsible for reducing ash melting temperatures and is higher in the blends of each feedstock compared to additive levels. Figure 8a–c shows that there is an interaction between the feedstocks resulting in additional accumulation of K in the hydrochar, which will be detrimental to using the blends as a solid fuel. Ca on the other hand (Figure 8d–f), is reduced compared to additive levels suggesting more calcium is solubilized into the process water. Ca increases the ash melting temperature and is beneficial.

3.3. Process Water Composition, Biomethane Yield, and Biodegradability

The composition of the process waters from SS digestate and lignocellulosic biomass, together with the blends, are listed in Table 7. The pH of the process waters are more acidic for the lignocellulosics than for the SS digestate. At the higher temperature of 250 °C, the SS digestate process water is basic, whereas for all lignocellulosic biomass, it is acidic. Blending generally increases the pH of the process waters. The pH of the 200 °C process waters is generally more acidic than the process waters at 150 and 250 °C, with the exception of the woodchip. At the lower temperatures, this is due to lower degradation and lower levels of VFA, whereas at higher temperatures, there is a buffering effect associated with the presence of inorganics and soluble N containing compounds (not shown). This buffering effect is lower for woodchip, probably due to the lower ash content and lower N-content. The VFA content generally increases with increasing temperature for all feedstock [30]. The acidity of the woodchip process waters is expected to promote polymerisation to hydrochar during HTC reactions, [31], which could be partially responsible for the higher solid yields and lower liquid yields. The higher levels of TN in the process waters from grass are expected and associated with the high protein content of grass. COD levels generally increase with temperature, with the exception of privet hedge cuttings, suggesting a degree of feedstock dependence.
Experimental BMP (BMPexp) for each of the process waters are shown in Table 8 and are similar to previous reports with an optimum BMPexp and biodegradability being exhibited at 200 °C [5]. A positive control using cellulose (not shown) indicated that the inoculum was active producing 380 NmL CH4/ g VS.
The C:N ratio of the lignocellulosic derived process waters vary widely due to the different protein content and are significantly higher than SS digestate alone. However, the C:N ratio of majority of process waters shown in Table 7 fall outside the optimal range of 25-30:1 [32]. Process waters from SS digestate are greatest at 200 °C producing 159.2 NmL CH4/g COD; this only slightly reduces at 250 °C to 141.8 NmL CH4/g COD. A comparison of the lignocellulosic biomass indicates the grass produces the largest BMP; again, it is highest at 200 °C, reaching 188.5 NmL CH4/g COD. However, increasing the temperature to 250 °C results in significant reduction to 45.5 NmL CH4/g COD. Once again, the lower temperature processing results in a low BMP yields. The BMP of the privet hedge clippings process water shows the next best performance. Once again, the process water produced at 200 °C results in the highest BMP yield. The wood chip appears to be inhibitory at 200–250 °C, producing very little biogas, displaying different behaviour to grass and privet hedge. Alternatively, a similar behaviour to privet hedge cuttings is observed for wood chip at 150 °C, producing a slightly higher level of methane than privet hedge cuttings of 97.8 NmL CH4/g COD, however, still lower than that from grass.
Following co-processing, the blended process waters all perform better than their performance in isolation, suggesting the SS digestate improves the biodegradability of the lignocellulosic blend waters. The highest increase is seen for the woodchip, which increases from 16.2 NmL CH4/g COD to 172.4 NmL CH4/g COD when blended with SS digestate. The grass sample alone has high BMP, yet blending with SS digestate still maintains a high BMP at 184.4 NmL CH4/g COD. The privet hedge has the lowest BMP, and blending is detrimental to overall CH4 yields.
Co-processing SS digestate with lignocellulosic biomass does result in the significant improvement of biomethane generation when compared to lignocellulosic biomass process waters alone. For the case of woodchip, blending with SS digestate improves the biomethane generation for all temperatures, thereby suggesting there is a lowering in the concentration of inhibitory compounds. However, the majority of the process waters still exhibit significant lag time indicating a level of toxification, which requires further investigation.
Ultimately, process waters generated from lignocellulosics have lower biochemical methane potential than SS digestate, with the exception of grass clippings at 200 °C. Overall, processing at 200 °C produces the highest yields of methane, suggesting that processing at intermediate temperatures is likely to improve the overall energy recovery. Grass is the best-performing blend material for co-processing although the reduction in process biodegradability when woodchip is blended is less than expected considering the behaviour of woodchip alone. While this does not fully explain potential inhibitory behaviour, it does indicate that blending of SS digestate with lignocellulosics is not a show stopper in terms of energy recovery from the process waters but intermediate HTC temperatures are likely to be better agreeing with previous reports [5,8].

4. Conclusions

The data indicates that blending of biomass during HTC can lead to complex interactions and may not necessarily result in better combustion properties. Co-processing of sewage sludge digestate with different lignocellulosic biomasses by hydrothermal carbonisation does not always result in additive behaviour. More complex interactions are observed between feedstocks, affecting the combustion behaviour of the resulting hydrochar. While HHV generally is increased, nitrogen content, ash, and alkali metals can be enhanced in the hydrochar, resulting in detrimental combustion behaviour. The high N-content of the hydrochar is likely to result in increased NOx emissions, and the incorporation of alkali metals is likely to increase the likelihood of slagging and fouling. The addition of lignocellulosic material to digestate can increase the solid loading of HTC, which may reduce the level of dewatering required and improve the overall energetics of the process. The effect of co-processing on hydrochar and process water characteristics is highly dependent on feedstock composition. The most desirable feedstock combination is likely to depend on the end use of the hydrochar. Hydrochars produced from biomass blends may for instance be more suitable as a soil additive, compared to applications as a solid fuel. The effect of blending can increase nutrient content (N, P, and K), and an increased proportion of lignocellulosic biomass may increase the humic-like substances in the hydrochars, improving their agronomic properties. The results demonstrate that the blending of lignocellulosic biomass with high-nutrient feedstocks, such as digestate, has a significant impact on the characteristics of the resulting hydrochar and presents a potential opportunity to modify hydrochar properties for particular applications.

Author Contributions

The authors contributed to this article in the following ways: conceptualization, K.R.P. and A.B.R.; methodology, K.R.P.; validation, K.R.P., A.E.B., J.M.H. and A.B.R.; formal analysis, K.R.P., A.E.B., J.M.H. and A.B.R.; investigation, K.R.P., A.E.B., J.M.H. and A.B.R.; resources, M.A.C.-V., L.A.F. and A.B.R.; data curation, K.R.P.; writing—original draft preparation, K.R.P., A.E.B., J.M.H. and A.B.R.; writing—review and editing, K.R.P., A.E.B., J.M.H., M.A.C.-V., L.A.F. and A.B.R.; visualization, K.R.P., A.E.B., J.M.H. and A.B.R.; supervision, M.A.C.-V., L.A.F. and A.B.R.; project administration, M.A.C.-V., L.A.F. and A.B.R.; funding acquisition, M.A.C.-V., L.A.F. and A.B.R. All authors have read and agreed to the published version of the manuscript.

Funding

This research was funded by the EPSRC Centre for Doctoral Training in Bioenergy at the University of Leeds (EP/L014912/1). A.E.B.’s time on this research was funded by EPSRC (grant number EP/T517860/1). J.M.H. was funded via the UK Catalysis Hub EPSRC (EP/K014714/1). The APC was funded by the University of Leeds. Thematic partnership between the University of Leeds and Indian Institute of Technology, Bombay on Conversion of Wet Wastes by Hydrothermal Carbonisation (IND/CONT/GA/18-19/18).

Institutional Review Board Statement

Not applicable.

Informed Consent Statement

Not applicable.

Data Availability Statement

Not applicable.

Acknowledgments

The authors would like to thank Simon Lloyd, Adrian Cunliffe, Karine Alves Thorne, and David Elliott for their technical assistance.

Conflicts of Interest

The authors declare no conflict of interest.

References

  1. Environment Agency. Spreading Organic Manure on Agricultural Land: RPS 252; Environment Agency: Bristol, UK, 2021. Available online: https://www.gov.uk/government/publications/spreading-organic-manure-on-agricultural-land-rps-252/spreading-organic-manure-on-agricultural-land-rps-252 (accessed on 13 January 2022).
  2. Assured Biosolids Limited. Biosolids Recycling to Agricultural Land Position Statement. 2020. Available online: https://assuredbiosolids.co.uk/position-statement-on-recycling-of-biosolids-to-agricultural-land/ (accessed on 13 January 2022).
  3. Kruse, A.; Dahmen, N. Hydrothermal biomass conversion: Quo vadis? J. Supercrit. Fluids 2018, 134, 114–123. [Google Scholar] [CrossRef]
  4. Libra, J.A.; Ro, K.S.; Kammann, C.; Funke, A.; Berge, N.D.; Neubauer, Y.; Titirici, M.-M.; Fühner, C.; Bens, O.; Kern, J.; et al. Hydrothermal carbonization of biomass residuals: A comparative review of the chemistry, processes and applications of wet and dry pyrolysis. Biofuels 2011, 2, 71–106. [Google Scholar] [CrossRef] [Green Version]
  5. Parmar, K.R.; Ross, A.B. Integration of Hydrothermal Carbonisation with Anaerobic Digestion; Opportunities for Valorisation of Digestate. Energies 2019, 12, 1586. [Google Scholar] [CrossRef] [Green Version]
  6. Ipiales, R.P.; de la Rubia, M.A.; Diaz, E.; Mohedano, A.F.; Rodriguez, J.J. Integration of Hydrothermal Carbonization and Anaerobic Digestion for Energy Recovery of Biomass Waste: An Overview. Energy Fuels 2021, 35, 17032–17050. [Google Scholar] [CrossRef]
  7. Phoenixville New Energy Optimization (PXVNEO). PXVNEO—New Energy Optimization. Available online: https://phoenixville.org/2538/PXVNEO---New-Energy-Optimization (accessed on 13 January 2022).
  8. Aragón-Briceño, C.; Ross, A.B.; Camargo-Valero, M.A. Evaluation and comparison of product yields and bio-methane potential in sewage digestate following hydrothermal treatment. Appl. Energy 2017, 208, 1357–1369. [Google Scholar] [CrossRef]
  9. Smith, A.M.; Singh, S.; Ross, A.B. Fate of inorganic material during hydrothermal carbonisation of biomass: Influence of feedstock on combustion behaviour of hydrochar. Fuel 2016, 169, 135–145. [Google Scholar] [CrossRef]
  10. Smith, A.M.; Whittaker, C.; Shield, I.; Ross, A.B. The potential for production of high quality bio-coal from early harvested Miscanthus by hydrothermal carbonisation. Fuel 2018, 220, 546–557. [Google Scholar] [CrossRef]
  11. Smith, A.M.; Ekpo, U.; Ross, A.B. The Influence of pH on the Combustion Properties of Bio-Coal Following Hydrothermal Treatment of Swine Manure. Energies 2020, 13, 331. [Google Scholar] [CrossRef] [Green Version]
  12. Zhai, Y.; Peng, C.; Xu, B.; Wang, T.; Li, C.; Zeng, G.; Zhu, Y. Hydrothermal carbonisation of sewage sludge for char production with different waste biomass: Effects of reaction temperature and energy recycling. Energy 2017, 127, 167–174. [Google Scholar] [CrossRef]
  13. Zhang, X.; Zhang, L.; Li, A. Hydrothermal co-carbonization of sewage sludge and pinewood sawdust for nutrient-rich hydrochar production: Synergistic effects and products characterization. J. Environ. Manag. 2017, 201, 52–62. [Google Scholar] [CrossRef]
  14. Zheng, C.; Ma, X.; Yao, Z.; Chen, X. The properties and combustion behaviors of hydrochars derived from co-hydrothermal carbonization of sewage sludge and food waste. Bioresour. Technol. 2019, 285, 121347. [Google Scholar] [CrossRef] [PubMed]
  15. Lang, Q.; Guo, Y.; Zheng, Q.; Liu, Z.; Gai, C. Co-hydrothermal carbonization of lignocellulosic biomass and swine manure: Hydrochar properties and heavy metal transformation behavior. Bioresour. Technol. 2018, 266, 242–248. [Google Scholar] [CrossRef] [PubMed]
  16. Lang, Q.; Zhang, B.; Liu, Z.; Chen, Z.; Xia, Y.; Li, D.; Ma, J.; Gai, C. Co-hydrothermal carbonization of corn stalk and swine manure: Combustion behavior of hydrochar by thermogravimetric analysis. Bioresour. Technol. 2019, 271, 75–83. [Google Scholar] [CrossRef] [PubMed]
  17. Wang, T.; Zhai, Y.; Li, H.; Zhu, Y.; Li, S.; Peng, C.; Wang, B.; Wang, Z.; Xi, Y.; Wang, S.; et al. Co-hydrothermal carbonization of food waste-woody biomass blend towards biofuel pellets production. Bioresour. Technol. 2018, 267, 371–377. [Google Scholar] [CrossRef] [PubMed]
  18. Di Maio, D.; Turley, D. Lignocellulosic Feedstock in the UK; NNFCC: York, UK, 2014. [Google Scholar]
  19. Phillips, D.; Mitchell, E.J.S.; Lea-Langton, A.R.; Parmar, K.R.; Jones, J.M.; Williams, A. The use of conservation biomass feedstocks as potential bioenergy resources in the United Kingdom. Bioresour. Technol. 2016, 212, 271–279. [Google Scholar] [CrossRef]
  20. Hindrichsen, I.K.; Kreuzer, M.; Madsen, J.; Knudsen, K.E.B. Fiber and lignin analysis in concentrate, forage, and feces: Detergent versus enzymatic-chemical method. J. Dairy Sci. 2006, 89, 2168–2176. [Google Scholar] [CrossRef]
  21. Friedl, A.; Padouvas, E.; Rotter, H.; Varmuza, K. Prediction of heating values of biomass fuel from elemental composition. Anal. Chim. Acta 2005, 544, 191–198. [Google Scholar] [CrossRef]
  22. Xing, P.; Mason, P.E.; Chilton, S.; Lloyd, S.; Jones, J.M.; Williams, A.; Nimmo, W.; Pourkashanian, M. A comparative assessment of biomass ash preparation methods using X-ray fluorescence and wet chemical analysis. Fuel 2016, 182, 161–165. [Google Scholar] [CrossRef] [Green Version]
  23. Mayala, T.S.; Ngavouka, M.D.; Douma, D.H.; Hammerton, J.M.; Ross, A.B.; Brown, A.E.; M’Passi-mabiala, B.; Lovett, J.C. Characterisation of Congolese Aquatic Biomass and Their Potential as a Source of Bioenergy. Biomass 2022, 2, 1. [Google Scholar] [CrossRef]
  24. Sommersacher, P.; Brunner, T.; Obernberger, I. Fuel indexes: A novel method for the evaluation of relevant combustion properties of new biomass fuels. Energy Fuels 2012, 26, 380–390. [Google Scholar] [CrossRef]
  25. Holliger, C.; Alves, M.; Andrade, D.; Angelidaki, I.; Astals, S.; Baier, U.; Bougrier, C.; Buffière, P.; Carballa, M.; De Wilde, V.; et al. Towards a standardization of biomethane potential tests. Water Sci. Technol. 2016, 74, 2515–2522. [Google Scholar] [CrossRef] [PubMed]
  26. Demirbaş, A. Relationships between lignin contents and fixed carbon contents of biomass samples. Energy Convers. Manag. 2003, 44, 1481–1486. [Google Scholar] [CrossRef]
  27. Dieguez-Alonso, A.; Funke, A.; Anca-Couce, A.; Rombolà, A.G.; Ojeda, G.; Bachmann, J.; Behrendt, F. Towards biochar and hydrochar engineering—Influence of process conditions on surface physical and chemical properties, thermal stability, nutrient availability, toxicity and wettability. Energies 2018, 11, 496. [Google Scholar] [CrossRef] [Green Version]
  28. Reza, M.T.; Lynam, J.G.; Uddin, M.H.; Coronella, C.J. Hydrothermal carbonization: Fate of inorganics. Biomass Bioenergy 2013, 49, 86–94. [Google Scholar] [CrossRef]
  29. Roberts, L.J. Additives to Mitigate against Slagging and Fouling in Biomass Combustion. Ph.D. Thesis, University of Leeds, Leeds, UK, 2018. [Google Scholar]
  30. Funke, A.; Ziegler, F. Hydrothermal carbonization of biomass: A summary and discussion of chemical mechanisms for process engineering. Biofuels Bioprod. Biorefin. 2010, 4, 160–177. [Google Scholar] [CrossRef]
  31. Ghanim, B.M.; Kwapinski, W.; Leahy, J.J. Hydrothermal carbonisation of poultry litter: Effects of initial pH on yields and chemical properties of hydrochars. Bioresour. Technol. 2017, 238, 78–85. [Google Scholar] [CrossRef]
  32. Ward, A.J.; Hobbs, P.J.; Holliman, P.J.; Jones, D.L. Optimisation of the anaerobic digestion of agricultural resources. Bioresour. Technol. 2008, 99, 7928–7940. [Google Scholar] [CrossRef]
Figure 1. Schematic of a possible HTC/AD integration strategy for the treatment of digestate.
Energies 15 01418 g001
Figure 2. (a) TGA and (b) DTG curves for SS digestate and lignocellulosic biomass.
Energies 15 01418 g002aEnergies 15 01418 g002b
Figure 3. Comparison of experimental and additive nitrogen levels in the hydrochar from 50/50 blends for (a) SS and grass at 50/50 blend, (b) SS and privet hedge at 50/50 blend, and (c) SS and woodchip at 50/50 blend.
Energies 15 01418 g003
Figure 4. Comparison of experimental and additive levels in the hydrochar of (a) ash for SS and grass at 50/50 blend, (b) ash for SS and privet hedge at 50/50 blend, (c) ash for SS and woodchip at 50/50 blend, (d) ED for SS and grass 50/50 blend, (e) ED for SS and privet hedge for 50/50 blend, and (f) ED for SS and woodchip for 50/50 blend.
Energies 15 01418 g004
Figure 5. Comparison of experimental and additive levels in the hydrochar of (a) EY for SS and grass at 50/50 blend, (b) EY for SS and privet hedge at 50/50 blend, (c) EY for SS and woodchip at 50/50 blend, (d) process water TOC for SS and grass 50/50 blend, (e) process water TOC for SS and privet hedge for 50/50 blend, and (f) process water TOC for SS and woodchip for 50/50 blend.
Energies 15 01418 g005
Figure 6. Comparison of experimental and additive levels in the hydrochar of (a) FC for SS and grass at 50/50 blend, (b) FC for SS and privet hedge at 50/50 blend, and (c) FC for SS and woodchip at 50/50 blend.
Energies 15 01418 g006
Figure 7. Van Krevelen diagram for lignocellulosic biomass, SS digestate feedstock, and resultant hydrochars, including blends on a dry ash free basis.
Energies 15 01418 g007
Figure 8. Comparison of experimental and additive levels in the hydrochar of (a) K content for SS and grass at 50/50 blend, (b) K content for SS and privet hedge at 50/50 blend, (c) K content for SS and woodchip at 50/50 blend, (d) Ca content for SS and grass 50/50 blend, (e) Ca content for SS and privet hedge for 50/50 blend, and (f) Ca content for SS and woodchip for 50/50 blend.
Energies 15 01418 g008
Table 1. Interpretation of predictive slagging and fouling indices [23,24].
KeyInterpretationSlagging and Fouling Indices
AIBAIRb/aSIFI2S/Cl
Low/safe<0.17>0.15<0.5<0.6<0.6>4
Medium/likely>0.17<0.34<0.15>0.5<0.7>0.6<2.0>0.6<40-
High/certain>0.34->0.7>2.0>40<4
Table 2. Composition analysis of digestate and lignocellulosic biomass.
SS
Digestate
Grass
Clippings
Privet HedgeWoodchip
% Protein (ar)19.9 ± 0.721.1 ± 0.66.7 ± 0.62.2 ± 0.2
% Cellulose (ar)5.823.220.532.8
% Hemicellulose (ar)4.922.69.413.9
% Lignin (ar)17.33.510.221.7
% C (db)28.6 ± 0.345.6 ± 0.246.7 ± 0.049.6 ± 0.4
% H (db)3.1 ± 0.15.3 ± 0.25.6 ± 0.16.4 ± 0.9
% N (db)3.4 ± 0.03.5 ± 0.01.1 ± 0.00.4 ± 0.0
% S (db)1.5 ± 0.00.1 ± 0.10.0 ± 0.00.0 ± 0.0
% O a (db)16.4 ± 0.333.2 ± 0.939.4 ± 0.536.9 ± 0.7
H/C (daf)1.301.371.421.55
O/C (daf)0.430.550.630.60
% VM (db)51.0 ± 0.171.1 ± 0.176.7 ± 0.176.1 ± 0.2
% FC (db)2.1 ± 0.116.6 ± 0.316.1 ± 0.217.1 ± 0.4
% Ash a (db)46.9 ± 0.012.4 ± 0.47.2 ± 0.36.8 ± 0.6
HHV (MJ/kg db) b14.918.418.619.9
ar = as received basis. db = dry basis. daf = dry ash free basis. a calculated by difference. b calculated according to Equation (2).
Table 3. Yields of products following hydrothermal carbonisation of SS digestate, lignocellulosic biomass, and 50/50 blends at 20% solid loading.
Feedstock and HTC Process ConditionsYields (wt.% db)
SolidLiquidGas
SS digestate
150 °C90.6 ± 2.39.0 ± 2.20.4 ± 0.0
200 °C77.0 ± 0.822.2 ± 0.70.8 ± 0.2
250 °C70.5 ± 0.328.0 ± 0.01.5 ± 0.3
Grass clippings
150 °C68.7 ± 2.430.7 ± 2.40.5 ± 0.0
200 °C59.8 ± 0.539.0 ± 0.41.1 ± 0.1
250 °C51.4 ± 0.346.1 ± 0.42.4 ± 0.0
SS + grass 50/50
150 °C81.0 ± 0.418.4 ± 0.10.6 ± 0.2
200 °C67.9 ± 0.130.8 ± 0.21.3 ± 0.3
250 °C56.0 ± 1.442.3 ± 1.61.7 ± 0.2
Privet hedge
150 °C65.2 ± 0.233.8 ± 0.20.9 ± 0.0
200 °C56.5 ± 1.241.8 ± 1.21.8 ± 0.1
250 °C46.6 ± 0.651.0 ± 0.62.5 ± 0.1
SS + Privet 50/50
150 °C75.7 ± 0.223.7 ± 0.30.6 ± 0.2
200 °C65.8 ± 0.132.5 ± 0.11.7 ± 0.0
250 °C56.8 ± 0.541.3 ± 0.51.9 ± 0.0
Wood chips
150 °C85.5 ± 1.214.1 ± 1.10.3 ± 0.1
200 °C73.8 ± 0.625.7 ± 0.30.5 ± 0.3
250 °C56.5 ± 0.541.8 ± 0.41.7 ± 0.0
SS + wood 50/50
150 °C87.4 ± 0.311.8 ± 0.70.8 ± 0.4
200 °C75.4 ± 0.123.5 ± 0.41.1 ± 0.4
250 °C62.9 ± 1.435.5 ± 1.51.5 ± 0.1
Table 4. Ultimate, proximate, and heating value of the hydrochars from SS, lignocellulosic biomass, and 50/50 blends.
Hydrochar (20% Solid Loading)Ultimate Analysis (wt% db)Proximate Analysis (wt% db)HHV
(MJ/kg, db)
H/C
(daf)
O/C
(daf)
EDEY
(%)
CHNSO aVMFCAsh a
SS digestate
150 °C34.2 ± 0.04.5 ± 0.03.7 ± 0.00.9 ± 0.019.9 ± 0.155.0 ± 0.05.9 ± 0.139.1 ± 0.115.21.560.281.0292.4
200 °C34.5 ± 0.04.3 ± 0.02.6 ± 0.01.1 ± 0.013.5 ± 0.751.2 ± 1.03.5 ± 1.645.3 ± 0.615.21.470.201.0278.5
250 °C34.7 ± 0.44.3 ± 0.02.4 ± 0.10.9 ± 0.19.0 ± 0.444.9 ± 0.25.6 ± 0.149.5 ± 0.015.21.460.131.0271.9
Grass clippings
150 °C49.4 ± 0.16.1 ± 0.03.1 ± 0.00.0 ± 0.033.9 ± 0.272.5 ± 0.217.0 ± 0.210.5 ± 0.120.01.480.351.0974.9
200 °C53.1 ± 0.46.0 ± 0.03.2 ± 0.00.0 ± 0.025.9 ± 0.069.2 ± 0.316.6 ± 0.214.2 ± 0.521.61.340.271.1770.0
250 °C61.4 ± 0.06.1 ± 0.13.1 ± 0.00.1 ± 0.017.3 ± 0.061.5 ± 0.025.0 ± 0.113.5 ± 0.125.71.180.181.4071.9
SS + grass 50/50
150 °C41.9 ± 0.15.2 ± 0.03.6 ± 0.00.6 ± 0.125.7 ± 0.264.0 ± 0.110.5 ± 0.225.5 ± 0.317.21.480.311.0383.4
200 °C43.4 ± 0.24.9 ± 0.02.9 ± 0.00.7 ± 0.019.5 ± 0.959.4 ± 0.810.5 ± 0.230.1 ± 0.617.61.350.251.0571.3
250 °C44.0 ± 0.04.5 ± 0.03.0 ± 0.10.7 ± 0.012.8 ± 0.151.8 ± 0.312.3 ± 0.035.8 ± 0.217.81.230.181.0759.9
Privet hedge
150 °C51.7 ± 0.46.1 ± 0.12.0 ± 0.10.0 ± 0.037.3 ± 0.376.1 ± 0.318.2 ± 0.05.7 ± 0.420.91.410.381.1273.0
200 °C58.4 ± 0.25.9 ± 0.01.7 ± 0.00.0 ± 0.030.2 ± 0.369.3 ± 0.124.9 ± 0.05.8 ± 0.023.81.200.321.2872.3
250 °C65.2 ± 0.25.9 ± 0.02.2 ± 0.10.1 ± 0.022.3 ± 0.960.5 ± 0.433.8 ± 0.15.6 ± 0.527.41.080.241.4768.5
SS + hedge 50/50
150 °C42.0 ± 0.45.1 ± 0.12.7 ± 0.00.5 ± 0.027.0 ± 0.765.0 ± 0.110.0 ± 0.125.0 ± 0.217.11.440.331.0277.2
200 °C45.7 ± 0.15.0 ± 0.02.4 ± 0.00.5 ± 0.020.3 ± 0.059.1 ± 0.113.4 ± 0.027.6 ± 0.118.31.310.261.0971.7
250 °C47.5 ± 0.44.7 ± 0.02.6 ± 0.00.6 ± 0.014.4 ± 0.553.3 ± 0.015.4 ± 0.131.3 ± 0.118.91.190.191.1364.1
Wood chips
150 °C51.2 ± 1.76.0 ± 0.10.3 ± 0.00.0 ± 0.043.9 ± 1.582.3 ± 0.315.9 ± 0.31.8 ± 0.020.51.410.461.0388.0
200 °C55.8 ± 0.85.7 ± 0.10.3 ± 0.00.0 ± 0.036.5 ± 0.775.2 ± 0.321.2 ± 0.23.7 ± 0.122.31.220.401.1282.7
250 °C69.2 ± 0.45.5 ± 0.10.5 ± 0.00.0 ± 0.023.1 ± 0.458.2 ± 0.938.5 ± 1.03.3 ± 0.128.80.950.261.4581.9
SS + wood 50/50
150 °C42.9 ± 0.65.7 ± 0.32.0 ± 0.10.4 ± 0.030.6 ± 0.966.7 ± 0.111.9 ± 0.721.4 ± 0.717.21.570.340.9986.5
200 °C46.9 ± 0.15.1 ± 0.11.8 ± 0.00.5 ± 0.024.9 ± 0.362.3 ± 0.215.2 ± 0.422.5 ± 0.218.71.290.311.0780.7
250 °C51.3 ± 0.04.8 ± 0.12.3 ± 0.00.5 ± 0.015.2 ± 0.251.6 ± 0.321.2 ± 0.127.2 ± 0.220.31.120.201.1773.6
a calculated by difference. ED = energy densification. EY = energy yield.
Table 5. Inorganic content of feedstock and 20% solid loading hydrochar from SS digestate, lignocellulosic biomass, and 50/50 blends of SS and grass clippings, garden hedging, and wood chip.
Feedstock and Hydrochar Inorganic Analysis (wt.% db)
NaMgAlSiPClKCaFe
SS digestate0.491.003.028.762.480.050.983.462.82
150 °C0.310.832.677.581.950.030.702.782.37
200 °C0.420.983.118.622.230.040.753.382.70
250 °C0.471.093.269.092.580.040.933.783.03
Grass clippings0.260.390.151.760.580.071.421.930.28
150 °C0.180.250.081.780.550.051.211.830.06
200 °C0.200.280.112.710.820.091.182.350.08
250 °C0.210.300.112.370.900.070.652.690.08
SS + grass 50/500.380.701.595.261.530.061.202.701.55
150 °C0.460.551.464.541.260.061.132.231.28
200 °C0.270.641.715.441.500.021.112.811.47
250 °C0.260.812.076.541.960.020.903.271.89
Privet hedge0.200.130.030.360.300.011.461.650.01
150 °C0.140.090.030.300.290.000.771.800.02
200 °C0.070.070.030.220.400.010.731.870.02
250 °C0.070.080.030.120.500.010.391.920.02
SS + hedge 50/500.350.571.534.561.390.031.222.561.42
150 °C0.230.451.604.621.040.021.721.951.19
200 °C0.180.531.814.921.290.021.62.521.40
250 °C0.210.632.065.681.470.001.202.631.60
Wood chips0.050.020.040.160.010.050.020.260.03
150 °C0.040.030.070.310.010.000.020.390.05
200 °C0.040.050.180.690.020.000.050.630.13
250 °C0.180.040.130.630.020.030.130.390.09
SS + wood 50/500.270.511.534.461.250.000.501.861.43
150 °C0.210.441.454.121.030.020.541.571.29
200 °C0.180.461.544.360.980.010.651.631.24
250 °C0.340.561.965.331.170.040.681.791.43
Table 6. Slagging and fouling indices for hydrochar from SS digestate, lignocellulosic biomass, and 50/50 blends.
Feedstock and Resultant HydrocharsSlagging and Fouling Indices
AIBAIRb/aSIFI2S/Cl
SS digestate1.232.190.470.71.816.7
150 °C0.832.690.430.41.416.0
200 °C0.972.630.440.51.413.9
250 °C1.152.470.480.41.713.0
Grass clippings1.130.191.420.024.40.2
150 °C0.840.051.200.119.30.1
200 °C0.780.070.930.011.00.1
250 °C0.420.111.030.18.10.8
SS and grass 50/501.870.560.830.68.79.4
150 °C1.150.930.580.34.55.6
200 °C0.971.230.550.43.116.2
250 °C0.811.890.520.42.115.5
Privet hedge1.100.015.520.0163.80.4
150 °C0.530.025.490.0107.11.6
200 °C0.410.037.280.0121.61.0
250 °C0.200.0611.000.8109.04.7
SS and hedge 50/502.700.261.361.022.813.0
150 °C1.400.710.550.35.213.8
200 °C0.671.640.500.32.218.1
250 °C0.911.320.510.32.860.0
Woodchip0.040.491.270.09.90.1
150 °C0.040.860.920.04.21.2
200 °C0.051.720.680.02.01.1
250 °C0.140.300.710.08.70.2
SS and woodchip 50/500.801.060.790.64.68.2
150 °C0.541.980.450.22.013.3
200 °C0.551.740.440.22.019.7
250 °C0.631.610.410.21.96.5
Table 7. Process water composition.
SS, Lignocellulosic Biomass and Blends Process WaterspHC:NTN
(g/L)
TOC
(g/L)
COD (g/L)Total VFA (g/L)Total Phenols (g/L)
SS digestate
150 °C6.5 ± 0.05.71.0 ± 0.45.7 ± 0.018.8 ± 0.00.20.2 ± 0.0
200 °C5.1 ± 0.06.11.4 ± 0.08.5 ± 0.136.5 ± 0.11.80.5 ± 0.0
250 °C8.0 ± 0.06.51.5 ± 0.09.8 ± 0.037.8 ± 0.44.00.2 ± 0.0
Grass clippings
150 °C5.8 ± 0.012.21.6 ± 0.019.6 ± 0.154.3 ± 0.41.50.3 ± 0.0
200 °C4.6 ± 0.06.42.8 ± 0.018.0 ± 0.249.3 ± 0.23.61.3 ± 0.0
250 °C6.2 ± 0.22.78.6 ± 0.123.0 ± 0.168.0 ± 0.04.70.1 ± 0.0
SS & grass 50/50
150 °C5.8 ± 0.07.71.8 ± 0.013.9 ± 0.039.0 ± 0.11.50.2 ± 0.0
200 °C4.7 ± 0.07.72.0 ± 1.115.4 ± 0.044.7 ± 0.02.90.3 ± 0.0
250 °C6.9 ± 0.04.63.4 ± 0.015.6 ± 0.145.1 ± 0.24.10.4 ± 0.0
Privet hedge
150 °C5.2 ± 0.0440.6 ± 0.026.4 ± 0.994.4 ± 0.42.20.5 ± 0.0
200 °C3.8 ± 0.010.72.1 ± 1.022.4 ± 0.166.3 ± 0.27.10.5 ± 0.0
250 °C5.4 ± 0.025.90.8 ± 0.020.7 ± 0.162.2 ± 0.08.20.9 ± 0.0
SS & hedge 50/50
150 °C5.5 ± 0.011.61.7 ± 0.019.7 ± 0.058.7 ± 0.11.20.5 ± 0.0
200 °C4.3 ± 0.08.12.2 ± 0.017.9 ± 0.049.8 ± 0.13.90.4 ± 0.0
250 °C5.9 ± 0.08.32.0 ± 0.216.6 ± 0.146.0 ± 1.11.50.7 ± 0.0
Woodchip
150 °C4.0 ± 0.02.73.0 ± 0.08.1 ± 0.020.3 ± 0.10.90.4 ± 0.0
200 °C4.0 ± 0.03.72.9 ± 0.010.6 ± 0.030.0 ± 0.23.20.2 ± 0.0
250 °C4.0 ± 0.063.00.2 ± 0.012.6 ± 0.032.6 ± 0.04.80.3 ± 0.0
SS & woodchip 50/50
150 °C5.6 ± 0.06.91.2 ± 0.08.1 ± 0.022.8 ± 0.40.90.1 ± 0.0
200 °C4.1 ± 0.02.24.4 ± 0.09.8 ± 0.026.0 ± 0.12.10.7 ± 0.0
250 °C5.1 ± 0.08.01.4 ± 0.010.8 ± 0.130.1 ± 0.13.70.3 ± 0.0
Table 8. Experimental biochemical methane potential (BMPexp) and biodegradability of process waters from SS digestate, lignocellulosics biomass, and 50/50 blend.
SS, Lignocellulosic Biomass and Blends Process WatersBMPexp (NmLCH4/gCOD)COD Removed (per 2g)Biodegradability (BICOD%)
SS digestate
150 °C98.2 ± 8.20.7437
200 °C159.2 ± 5.61.1658
250 °C141.8 ± 0.41.1155
Grass clippings
150 °C165.0 ± 3.71.4974
200 °C188.5 ± 0.11.4171
250 °C45.5 ± 7.00.3619
SS & grass 50/50
150 °C165.6 ± 0.51.4874
200 °C184.4 ± 9.81.6683
250 °C129.7 ± 2.71.3668
Privet hedge
150 °C61.7 ± 4.20.6332
200 °C112.4 ± 0.10.7437
250 °C96.9 ± 0.51.2261
SS & Privet 50/50
150 °C116.1 ± 14.71.2864
200 °C39.2 ± 3.10.3115
250 °C122.0 ± 3.91.2261
Woodchip
150 °C97.8 ± 7.70.5930
200 °C16.2 ± 0.30.4522
250 °C18.6 ± 2.10.2613
SS & woodchip 50/50
150 °C142.9 ± 1.11.4472
200 °C172.4 ± 0.90.9849
250 °C92.5 ± 17.00.5226
Publisher’s Note: MDPI stays neutral with regard to jurisdictional claims in published maps and institutional affiliations.

