Article

An Overview of Promising Alternative Fuels for Road, Rail, Air, and Inland Waterway Transport in Germany

1
Institute of Energy and Climate Research—Electrochemical Process Engineering (IEK-14), Forschungszentrum Jülich GmbH, 52428 Jülich, Germany
2
Chair for Fuel Cells, RWTH Aachen University, 52072 Aachen, Germany
3
Gas- und Wärme-Institut Essen e.V., 45356 Essen, Germany
4
Institute of Energy and Climate Research—Systems Analysis and Technology Evaluation (IEK-STE), Forschungszentrum Jülich GmbH, 52428 Jülich, Germany
5
Institute of Energy and Climate Research—Techno-Economic System Analysis (IEK-3), Forschungszentrum Jülich GmbH, 52428 Jülich, Germany
*
Author to whom correspondence should be addressed.
Submission received: 22 December 2021 / Revised: 4 February 2022 / Accepted: 8 February 2022 / Published: 16 February 2022
(This article belongs to the Special Issue Progress in Power-to-Gas Energy Systems)

Abstract

:
To solve the challenge of decarbonizing the transport sector, a broad variety of alternative fuels based on different concepts, including Power-to-Gas and Power-to-Liquid, and propulsion systems, have been developed. The current research landscape is investigating either a selection of fuel options or a selection of criteria, a comprehensive overview is missing so far. This study aims to close this gap by providing a holistic analysis of existing fuel and drivetrain options, spanning production to utilization. For this purpose, a case study for Germany is performed considering different vehicle classes in road, rail, inland waterway, and air transport. The evaluated criteria on the production side include technical maturity, costs, as well as environmental impacts, whereas, on the utilization side, possible blending with existing fossil fuels and the satisfaction of the required mission ranges are evaluated. Overall, the fuels and propulsion systems, Methanol-to-Gasoline, Fischer–Tropsch diesel and kerosene, hydrogen, battery-electric propulsion, HVO, DME, and natural gas are identified as promising future options. All of these promising fuels could reach near-zero greenhouse gas emissions bounded to some mandatory preconditions. However, the current research landscape is characterized by high insecurity with regard to fuel costs, depending on the predicted range and length of value chains.

Graphical Abstract

1. Introduction

Anthropogenic climate change requires a comprehensive structural change in the energy sector to be enacted [1]. With the Paris climate conference in 2015, a limit for global warming was set to a maximum of 2 K and 1.5 K compared to the pre-industrial period [2]. The annual increase in greenhouse gas emissions resulting from rising energy consumption and a growing world population also requires rapid and targeted actions. In Germany, for instance, greenhouse gases in the energy and industrial sectors were reduced by 45% and 34%, respectively, compared to 1990 [3]. In contrast, greenhouse gas emissions of the transport sector stay at the same level as 1990 despite increasing levels of engine efficiencies [3]. In order to reach the goals in the transport sector, several alternative fuels have been researched and developed in recent years, all with different properties and technical maturity. Current literature either assesses single fuels or only single criteria of these fuels like technical maturity of fuel production [4,5], net production cost [6], import [7], well-to-wheel efficiencies [8], or environmental impacts [9,10]. The literature lacks a holistic analysis considering all criteria, spanning from production to utilization, and all fuel and drivetrain options. This review aims to connect all information of different fuel and drivetrain options, elaborate on the advantages and disadvantages and identify the most promising fuels for specific applications in the transport sector. For this purpose, it classifies different fuels and drivetrain options for road, rail, air, and inland waterway transport in terms of technical maturity, costs, and environmental impacts. For the three mentioned fields, different criteria will be defined and subsequently analyzed and discussed based on existing literature. The chosen criteria will be explained in Section 2 in detail.
Figure 1 provides an overview of fuel pathways. The pathways are subdivided into primary fuels, conversion, fuels, and drive systems. This work focuses on alternative fuels from RE sources, seen on the top right-hand side of Figure 1. These fuels are subdivided into synthetic fuels obtained using renewable electricity, also known as the Power-to-Fuel, Power-to-Gas or Power-to-Liquid (PtL) concepts, and biomass-based fuels. The latter is subdivided into conventional biofuels such as fatty acid methyl esters (FAMEs) or hydrotreated vegetable oil (HVO) derived from feed crops or advanced biofuels from lignocellulose [11]. Electricity-based fuels are further subdivided into methanol and higher alcohols, ethers such as oxymethylene ether (OME), and hydrocarbons like synthetic gasoline and diesel [4]. Starting from biomass and renewable electricity as resources, different pathways may lead to the same product fuel. One example is the production of methane from biomass via fermentation and subsequently biogas upgrading, as described in [12], or synthetic electricity-based production via the PtG pathway [13]. The produced fuels are then used in different propulsion systems which are subdivided into electric and internal combustion powertrains. Internal combustion drivetrains are operated with liquid or gaseous fuels, whereas electric engines utilize electricity, which is either stored in batteries or converted from an energy carrier such as hydrogen by means of a fuel cell (see Figure 1). A combination of electric and internal combustion powertrains, as in hybrid-electric vehicles, is also common.

2. Materials and Methods

In this work, alternative fuels are investigated on the production side, as well as on the application site. Additionally, the environmental impacts of promising fuels are discussed. The production side is assessed with respect to the technical maturity of fuel production and fuel production costs, considering domestic production as well as imports. Technical maturity is assessed via technology readiness level, which is described in detail in the next section. The application side is analyzed in terms of potential mission ranges using the fuels in different vehicles and the reduction in their possibilities. For this purpose, the potential mission ranges of different vehicles are analyzed for Germany as a case study. The achievable mission range of the fuels used in propulsion systems depends on tank-to-wheel (TtW) efficiency, the consumption, the amount of saved fuel compared to a conventional drivetrain, and the fuel’s heating value. The criteria TtW efficiency and heating value are used in this work to assess the possible mission range of different fuel applications. TtW efficiencies are employed instead of maximum efficiencies for assessing the fuels, as the efficiency–load curves of the different drivetrains vary quite significantly and the load demand of different vehicle classes may also vary.

2.1. Technology Readiness Level

The technology readiness level (TLR) concept was primarily developed by the National Aeronautics and Space Administration (NASA) [15]. In the meantime, the United States Department of Defense [16], the European Space Agency [17], and the European Commission [18] adapted the method. The European Space Agency employs ISO standard 16290 Space systems—Definition of the Technology Readiness Levels (TRLs) and their criteria assessment [19]. The European Commission has also developed guidance for the application of TRL to RE technologies [20]. Table 1 lists the TRL definitions according to Rose et al. [20]. It is also noteworthy that the Joint Research Centre (JRC) expanded the TRL assessment to a commercial readiness level (CRL) [5], which was developed by the Australian Renewable Energy Agency [21] and takes into account the fact that high TRLs among particular technologies do not automatically result in market adoption, e.g., due to excessively high capital costs or regulatory burdens [5].

2.2. Identification of Required Mission Ranges for Different Means of Transport

The required mission range for road transport in Germany was analyzed using a dataset from the Federal Ministry of Transport and Digital Infrastructure (BMVI) [22]. The BMVI [22] determined, amongst other variables, the daily driven distances of the following vehicle classes: passenger cars, light duty vehicles, motorcycles, coaches, trucks, articulated trucks, other tractors, other motor vehicles, and agricultural tractors, via a survey in 2010. Even though the dataset is from 2010, it is the only currently available source containing the daily driven distance for all road transport vehicle classes in the necessary accuracy. Comparable is only the study series “Mobilität in Deutschland”, which was performed for the years 2002, 2008, and 2017 [23]. However, it only contains information about the vehicle class passenger car. Yet it shows that the following used daily driven distance is, at least for passenger cars, mostly constant from 2002 to 2017. The daily driven distance for passenger cars per person was 37 km in 2002 and 39 km in 2017 with a constant occupancy of 1.5 persons per car [23]. For other vehicle classes, other statistics from the BMVI [24] show, that driven distance will change slightly. For example, the average transport distance from trucks was 89 km in 2002 and 93 km in 2017. The explained literature justifies the use of the 2010 survey from the BMVI.
Figure 2 shows the mission range distribution of different means of transport based on the BMVI survey from 2010 [22]. To create the different distribution curves, the daily driven distance samples for each vehicle class from the dataset were assigned to 10 km classes in the range of 0 to 2500 km, normalized with the absolute number of samples, and summed up for each 10 km class, starting at 0 km. Daily mileage values of 0 km were ignored during this analysis. As an example, a Tesla Model S with a WLTP mission range of 610 km [25] would be able to cover 99.4% of all daily distances from passenger cars (see Figure 2). Figure 2 illustrates the high required mission range for articulated trucks, coaches, and other trucks. Public urban buses are not covered in the analyzed dataset, but probably require low daily ranges, as they mostly operate in urban areas. Trucks are operated as either rigid trucks without an attached trailer or trailer trucks with an attached trailer. Analyzing the dataset of Breuer et al. [26], which was published in the article by Breuer et al. [27] indicates that trailer trucks mostly operate on highways, similar to articulated trucks, whereas rigid trucks operate in urban areas. Considering this finding while investigating the results presented in Figure 2, leads to the conclusion that the curve of rigid trucks is most likely on the left-hand side of the corresponding one from all trucks, whereas the curve from trailer trucks is on the right-hand side. As a result, trailer trucks probably require drive systems with higher mission ranges and rigid trucks systems with lower ones. As can be seen in Figure 2, the road transport classes of light duty vehicles, passenger cars, motorcycles, other tractors, and agricultural tractors all have low requirements in the case of achievable mission ranges.
McKinsey & Company [28] analyzed global air transport in terms of CO2 emissions considering the different aircraft classes of commuter, regional, short-range, medium-, and long-range aircraft, as well as different mission ranges. Deviating required mission ranges from the results from McKinsey & Company [28] leads to maximum mission ranges of up to 500 km for commuter, 2000 km for regional, 4500 km for short-range, and over 10,000 km for medium- and long-range aircraft. Commuter and regional aircraft have a lower required mission range, short-range aircraft with 4500 km having a higher mission range, and medium- and long-range aircraft with >10,000 km having the highest required mission ranges. The global fleet consists of 4% commuter aircraft, 13% regional aircraft, 53% short-range aircraft, and 30% medium- and long-range aircraft. Aircraft require fuel with high gravimetric and volumetric densities, as well as high powertrain efficiencies.
Rail transport in Germany is mostly electrified in terms of transport performance. As of 2019, 53% of all rail sections were equipped with overhead catenary lines [29]. In the case of transport performance, in 2019, long-distance rail passenger transport totaled 99%, regional rail transport 79%, and rail freight transport 87% electric operation [29]. This leads to the conclusion that non-electric operation with diesel is mostly used in sections with low transport performances. Alternative fuels might be a more economical solution compared to overhead catenary lines. A high gravimetric energy density of a possible fuel seems to be more important for rail transport than a high volumetric energy density, as the maximum load in each rail section is limited. Rail sections in Germany are divided into different track classes defined by DIN EN 15528, which limits the maximum weight of operating trains to between 6.4 t/m and 8 t/m [30].
Inland waterway transport is subdivided into freight and passenger transport. Freight transport is separated into the ship classes of cargo barges, liquid cargo barges, pushed barges, and pushed tankers, with the latter two being operated by pusher boats. Passenger transport primarily takes place using day trip and cabin vessels. In addition to these, small watercraft like sporting boats are used on inland waterways.
Figure 3 shows the share of transport performance (tkm) and volume of transport (t), as well as the average trip distance of different distance classes for inland waterway freight transport in Germany in 2016, based on data from the Federal Statistical Office (Destatis). This covers the ship classes of cargo barges, liquid cargo barges, pushed barges, and pushed tankers. As can be seen in Figure 3, 42% of freight transport ships fall into the distance class of >500 km per trip, with an average trip distance of 627 km. In the case of volume of transport (t), the value is 17% lower, because this value does not cover the traveled distance. In the case of transport performance, only 11% would be covered with a mission range of 100 km, whereas 89% require a mission range of >100 km. The consumed fuel is proportional to transport performance or the distance traveled, and less to the weight of transported goods. Unfortunately, the distance class of >500 km is not defined in greater detail. Destatis also provides transport performance and transported good data for the different ship classes. Based on Destatis data, the average trip distances for cargo barges, liquid cargo barges, and pushers were calculated to be 296 km, 225 km, and 158 km with transport performances of 34 bn tkm, 11 bn tkm, and 7 bn tkm. These average trip distances are not classified for distance classes as in Figure 3, and therefore may appear smaller. Pusher boats seem to operate over shorter distances, liquid cargo barges with 225 km over medium trip distances, and cargo barges over longer ones. However, the transport performance of cargo barges is about five times larger than that of pusher boats and three times greater than the transport performance of liquid cargo barges.
Similar to rail transport, gravimetric energy density seems to be more important for inland waterway transport, as increasing the weight would also increase the energy consumption. Based on Figure 3, inland waterway freight transport is classified as a sector with a higher required mission range. Compressed natural gas (CNG) is more attractive for pusher boats due to their smaller sizes and lower daily distances [33]. In the case of inland waterway passenger transport, energy density and mission range for small craft like sport boats and ferries appear to be less important, whereas for cabin vessels, mission range could be a more important criterion.
In this section, the methodology of this work was explained. First, the technology readiness level was explained as the basis for a technological assessment. Furthermore, mission ranges of the different vehicles classes in road, air, rail, and inland waterway transport were analyzed and identified in the framework of the methodology. The analysis showed, that requirements on the drive systems and subsequently the fuel vary strongly even inside of each of the four sectors.

3. Potential, Technical Maturity, and Costs of Alternative Fuel Production

As outlined in the introduction, renewable alternative fuels are divided into biomass- and electricity-based ones. Both fuel pathways will be discussed in this section. First, the capacity of biomass-based fuels to cover energy demand in the transport sector in Germany is discussed. Second, the technical maturities of the different fuel pathways will be investigated.

3.1. Potential of Biomass-Based Alternative Fuels

Studies such as those by Robinius et al. [34] show that in order to reduce CO2 emissions in Germany by 80% or 95% by 2050 against 1990 levels, CO2 emissions from the transport sector must be reduced by 76% or 100% from 2020 to 2050. In the case of the 95% target, a complete abandonment of fossil fuels in the transport sector is essential. The Germany-wide potential of biomass is not sufficient to fully cover this demand. Electricity-based fuels can be produced locally or imported to close the gap [34]. Indeed, the global potential of wind and solar energy is already more than sufficient to meet global energy demand [35]. According to this concept, hydrogen can be produced in advantageous regions with high wind and/or solar energy potential. Studies by the Hydrogen Council, for instance, forecast a price of EUR 1.4–2.3/kgH2 in 2030 [36,37], with further current and future expected prices being discussed in Section 3.3.2 Review of Total Costs below. The following discussion of biomass potential reveals that electricity-based fuels are vital, in addition to biomass-based ones. Therefore, a selection of electricity-based fuels within their category, regardless of the achievable price of biomass-based fuels, is necessary.
Biofuels are subdivided into conventional and advanced types. Conventional biofuels contain the first-generation biofuels ethanol and biodiesel from eatable crops, whereas advanced biofuels constitute the second-, third-, and fourth-generation forms. These fuels are obtained from nonfood, sustainably-grown feedstocks, and agricultural wastes. The second-generation biofuels also encompass fuels from cellulosic biomass, whereas the third- and fourth-generation ones contain fuels from both natural and genetically-engineered algae biomass [11]. According to Ziolkowska [11], the latter are based on algae biomass at demonstration level (TRL 4–5), whereas the first generation is well-established in the market (TRL 9) and the second (TRL 9) is gaining increasing market shares.
The viewpoint on biofuels in EU countries changed with the introduction of RED II in 2018. Since then, biofuels, which are not based on food or feed crops, are promoted with increased credibility for the national targets of RE usage in transport. Furthermore, targets to achieve specific shares of advanced biofuels and renewable electricity ones are binding, whereas the targets for food-based fuels are optional [38]. RED II also limited the share of food and feed crops in EU countries as a function of total energy consumption in the transport sector to 7% of energy consumption from road and rail transport in 2020. The possibility of member states voluntarily reducing this threshold is ambiguous. Furthermore, the threshold must be reduced to 0% by 2030, with the exception of feedstocks with certified low risks for Indirect Land Use Change (ILUC) [39]. According to the EU legislation, conventionally-produced biofuels are not regarded as an option for mass application in the transport sector.
The production pathway of a fuel is essential for the assessment of its ILUC risk. Both of the most common biofuels, namely FAME and HVO, can have a high or low ILUC risk, depending on their feedstock. Feedstocks that are produced by means of BtL processes from residue or waste oil are noncritical with respect to their ILUC risk. However, FAME or HVO obtained from vegetable oil are ILUC-critical [40]. The European Commission published a report [41] assessing global increases in ILUC areas devastating plants while maintaining large quantities of carbon stock and biodiversity. The report indicates that harvesting areas of biofuel feedstock plants increased globally by 2.3% for maize, 1.2% for sugar beets, 4.0% for palm oil and 3.0% for soya beans between 2008 and 2016. These growths rates are not only related to increased biofuel production but other factors as well. Further valuations can be noted in the report [41]. The European Commission [42] published criteria to identify resources with high and low ILUC risks. These criteria identify palm oil as a resource with a high ILUC risk. The status quo of the JRC Biofuel Program in 2014 and other earlier published literature regarding feedstocks for biofuels like ethanol or FAME did not take into account ILUC or other issues such as conflict affecting food production as a limiting factor for fuel and decarbonization strategies [40].
As an interim conclusion, it can be stated that biofuels possess an ambivalent positioning in the field of alternative fuels. Furthermore, resources for biofuels vary significantly across different locations and are limited to a greater extent than electricity-based fuels. Thus, the following section discusses the biomass potential for the case of Germany.
In 2017, 1668 PJ of diesel, 791 PJ of gasoline, and 428 PJ of jet fuel were consumed in Germany, according to the Mineralöl Wirtschafts Verband e.V. (MWV) [43]. Additionally, 81 PJ of biodiesel, 0.04 PJ of vegetable oils, 31 PJ of ethanol, 2 PJ of biomethane, 43 PJ of electricity, and 6 PJ of natural gas were consumed within the country’s transport sector in 2018/2019 [24,44]. Based on data from the Federal Office for Agriculture and Food (BLE) [45], Fehrenbach [46] concluded that the 81 PJ of biodiesel consisted of 27.5 PJ produced in Germany, with 19 PJ imported as palm oil biodiesel, 31.5 PJ coming from waste oils, and 1.6 PJ from grain straw and industrial waste. Peters et al. [12] reviewed the potential of biofuels. Based on data from Billig et al. [47], Peters et al. [12] state that 270 PJ of methane could be directly produced by biogas plants in Germany in 2050. If the biogas plant-generated CO2 is combined with renewable hydrogen, an additional value of 205 PJ can be achieved [47]. The maximum amount of methane produced from this concept in 2050 is estimated to be 750 PJ, also drawing on CO2 from the cement industry and combining it with renewable hydrogen, alongside the mentioned sources [47]. In their calculated scenario, Billig et al. [47] assume a 100% waste stream feedstock for biogas plants in 2050 based on the 15.9–20.5 Mt (dry matter) of unused biomass in Germany identified by Brosowski et al. [48]. According to Brosowski et al. [49], the biomass potential of agricultural byproducts in Germany is 17.6 Mt (dry matter), comprising 52% manure and 48% grain straw. Municipal waste biomass potential is about 0.3 Mt [49]. Technical biomass potential is 141 PJ for grain straw, 70 PJ for manure, and ~4 PJ for municipal waste [49]. Between the 270 PJ calculated by Peters et al. [12] based on Billig et al. [47] and the 218 PJ of Brosowski et al. [49] is a gap of 52 PJ that may result in different conversion efficiencies. Fehrenbach [46] calculated a potential unused biomass quantity of 250 PJ based on data from Fehrenbach et al. [50] and combined it with an efficiency of 50%, leading to a biofuel potential of 130 PJ. Comparing the 130–270 PJ of the three mentioned sources [12,46,49] with the transport sector’s fossil energy demand of 2887 PJ [43] (excluding renewables, electricity, and natural gas) leads to a biomass potential of 4.5–9.4%. This value will rise to 26% (750 PJ) by upgrading CO2 from biogas plants and the cement industry, as described in Billig et al. [47]. The RED II limits will reduce the palm oil biodiesel share to 0% in 2030 [46]. Fehrenbach [46] mentioned that the RED II limits will not resolve the ILUC risk issues with biofuels. Other resources that are not classified as having a high ILUC risk according to the European Commission [42] could replace palm oil [46]. The phase-out of palm oil could prompt a boost in rapeseed production, which will then produce further ILUC effects [46]. As noted earlier, the palm oil-based biodiesel share of total biodiesel is about 23%. The potential of first-generation, conventional biomass-based fuels’ potential to satisfy transport sector energy demand is low [51,52]. Furthermore, their sustainability and macroeconomic benefit due to conflicts regarding land use for growing food, as discussed above, is questionable [51]. Assuming that conventional biofuels will drop to 0% after 2030 and advanced biofuels such as biogas methane will replace them, the calculated biomass potentials shares on total transport sector energy demand will be reduced to 0.6–5.5% (18–158 PJ) and a maximum of 22.1% (638 PJ). This share is increasable by importing biomass from other countries. In terms of biofuel imports, the current literature reveals uncertainty and concerns regarding large quantities of sustainably-produced sources [51,53,54]. With respect to land use efficiency, biofuels are, with a difference by a factor of up to 1000, significantly lower than e-fuels [53].
In its 2011 Technology Roadmap, the International Energy Agency (IEA) forecasts a marked increase in the importance of biofuels [55]. It is stated that a total global energy demand of the transport sector, including road, aviation, and shipping, of 116 EJ in 2050, could be satisfied using 32 EJ biofuels (27.5%), equivalent to around 100 Megahectares (Mha) of land used for feedstock. Comparing this area with the EU’s use of cropland, totaling 97 Mha in 2015 [56], underscores the pressing need for acreage for the high penetration of biofuels, in accordance with the IEA Roadmap for Biofuels.

3.2. TRL of Fuel Production Pathways

In this section, the technical maturity of fuel production pathways is discussed using TRL as a performance indicator. The TRL assessment of alternative fuel production pathways is illustrated in Figure 4. The striped areas represent ranges that are either caused by different process pathways or different TRL assessments. The literature sources are listed in Table A1 in Appendix A. The TRL evaluation of the fuel pathways in Figure 4 is divided into synthetic production from CO2 and renewable electricity, conventional biofuel production, and advanced biofuel production. As noted in the previous section, conventional biofuels include fuels from edible crops, whereas advanced biofuels encompass those from nonfood, sustainably-grown feedstocks, and agricultural wastes.
Hydrogen can be produced from upgraded biogas from municipal organic waste, wet manure, sewage sludge, maize, or double cropping with a TRL of 9 [5]. Production from municipal organic waste, wet manure, and sewage sludge would via definition count as advanced biofuel production, but because the process is equal to the one for maize, it is illustrated as conventional biofuel production in Figure 4. Alternatively, hydrogen is produced from farmed wood via gasification with a TRL of 8 as advanced biofuel from renewable electricity with TRL 9 [5]. However, the high TRL assessment of the hydrogen production from renewable electricity originates in using an alkaline electrolyzer. The production of hydrogen via the polymer electrolyte membrane electrolysis also has a high TRL of 9, while the production via the solid oxide electrolysis cell has a TRL of 6–7 [57].
Synthetic kerosene includes all fuels that are certified by legal ruling ASTM D7566-20b [58]. In the reviews of Wormslev and Broberg [59], the International Civil Aviation Organization (ICAO) [60], and Sustainable Aviation [61], emerging sustainable aviation fuel production plants are presented. Literature references and technical assessments of all three were, amongst other sources, used to assess the technical maturity of sustainable alternative aviation fuels in this study. Synthetic Paraffinic Kerosene (SPK) obtained via the Fischer–Tropsch (FT) process, was evaluated by Schemme et al. [4] as having a TRL of 6. An alternative pathway utilizes synthetic production, with methanol as an intermediate product. The production of methanol from CO2 and H2 was assessed by Schemme et al. [4] to have a TRL of 9. Schmidt et al. [62] determined that methanol to olefin conversion and subsequent distillate synthesis could be demonstrated in the 1980s, drawing on Tabak et al. [63] and Tabak and Yurchak [64]. Both process steps are essential to the production of synthetic kerosene from methanol. Ruokonen et al. [65] analyzed methanol-based pathways to transport fuels and rated them as having a TRL of 8. In turn, K. Zech et al. [66] evaluated the TRL of methanol-based kerosene as being 7–9. However, they note that the entire process was never tested but rather single sections of it were tested on demonstration level. Therefore, the Methanol-to-Kerosene process is determined to have a TRL of 4. The TRL of biomass-based FT-SPK achieved via gasification and the FT process, is rated as having a TRL of 9, because Fulcrum [67] and Red Rock [68] have plants under construction that will have outputs of 30 kt/year and 45 kt/year, respectively. Another biomass-based fuel is Hydroprocessed Esters and Fatty Acids Synthetic Paraffinic Kerosene (HEFA-SPK) from bio-oils, animal fat, and recycled oils. The production of HEFA-SPK is determined to have a TRL of 9, as it is already used as a commercial process by World Energy Paramount (former AltAir Paramounts LLC) [60] and Neste Oyj [69]. The sustainable aviation fuel Hydroprocessed Fermented Sugars to Synthetic Isoparaffins (HFS-SIP) is produced via the microbial conversion of sugars to hydrocarbon and is also produced in a commercial process by Amyris in Brazil [60]. Therefore, the production of HFS-SIP is rated as having a TRL of 9. Alcohol-to-Jet Synthetic Paraffinic Kerosene (ATJ-SPK) from agricultural waste products (i.e., stover, grasses, forestry slash, and crop straws) can either be produced with isobutanol or ethanol as the intermediate product. LanzaTech [70] operates a pilot plant for ATJ-SPK production, while Ekobenz operates a commercial plant with a production of 22.5 kt/year [71]. In turn, Lanzatech and Swedish Biofuels AB have planned plants at the commercial scale for the coming years [72,73]. Catalytic hydrothermolysis synthetic jet fuel (CHJ) from triglyceride-based feedstocks (plant oils, waste oils, algal oils, soybean oil, jatropha oil, camelina oil, carinata oil, and tung oil) is evaluated to have a TRL of 6–7, because ARA and euglena operate a plant on the demonstration scale [74]. The sustainable aviation fuel High Hydrogen Content Synthetic Paraffinic Kerosene (HHC-SPK), produced from biologically derived hydrocarbons such as algae, is assessed as having TRL of 4, because Ishikawajima-Harima Heavy Industries Co., Ltd. developed and certified a process that is likely on the laboratory scale [75].
As can be seen in Figure 4, HVO and FAME have both been analyzed to be TRL 9 by Müller-Langer et al. [76] and Prussi et al. [5]. Advanced or conventional classification depends on the feedstock. In the case of waste oil or algae as feedstock, the product fuel constitutes an advanced biofuel. The key process of most synthetic diesel production processes is the already-mentioned FT process. Advanced biofuel synthetic diesel is produced from lignocellulose via pyrolysis (TRL 6 [5,76]), gasification (TRL 8 [5]), or hydrothermal liquefaction and upgrading (TRL 4 [5]). Synthetic production based on CO2 and H2 can either be performed with the reverse-water-gas-shift reaction in between, limiting the TRL to 6 [4], or with the intermediate product methanol, assessed to have a TRL of 9 [5]. Synthetic gasoline can be either produced via the Methanol-to-Gasoline processes, rated to have a TRL of 9 by Schemme et al. [4], or as advanced biofuel from lignocellulose, assessed as having a TRL of 8 by Prussi et al. [5]. Ethanol is produced as a conventional biofuel from sugar and evaluated with a TRL of 9 by Müller-Langer et al. [76] and Prussi et al. [5]. The production as advanced biofuel based on lignocellulose is determined to have a TRL of 7 by Müller-Langer et al. [76] and of 8 by Prussi et al. [5]. Alternatively, ethanol is produced utilizing CO2 and H2. This pathway has been assessed by Schemme et al. [4] to have a TRL of 4. The higher alcohol butanol is produced as a conventional biofuel via fermentation and with a TRL of 7 according to Prussi et al. [5]. Alternatively, butanol is produced from CO2 and H2 in the framework of the Power-to-Fuel concept with a TRL of 4 [4]. 2-octanol has also been produced from lignocellulose on the laboratory scale, according to Leitner et al. [77]. Therefore, it is evaluated as having a TRL of 3. In the framework of the PtL concept, octanol is either produced as 1-octanol with a TRL of 1 or as iso-octanol with a TRL of 4 [4,78]. For the alternative fuels in the ethers category, the production of dimethyl ether (DME) exhibits the highest technical maturity. The production as advanced biofuel from lignocellulose is rated as having a TRL of 8 by Prussi et al. [5], whereas production from CO2 and H2 is determined to have a TRL of 9 by Prussi et al. [5] and Schemme et al. [4]. For longer ether-chains, the technical maturity is lower. Synthetic OME3-5 from CO2 and H2 can be produced through different pathways with varying technical maturity levels in the range of a TRL of 4–5 [4,79], whereas OME1 production is determined to have a TRL of 5 [4]. The production of OME1 and OME3–5 from lignocellulose as advanced biofuel is assessed as TRL 5 by Prussi et al. [5]. For OME3–5 synthesis, Prussi et al. [5] assessed the more mature pathway via OME1 and trioxane. The production of methane and liquefied methane has, in general, a high degree of technical maturity. Using the conventional biofuel production route, compressed biomethane (CBM) and liquefied biomethane (LBM) are produced at TRL 9 [5,76]. If a nonfood feedstock such as manure were to be used, the produced fuel would be assessed as an advanced biofuel, as explained previously. The potential of this resources is low, and therefore no more specific subdivision is presented in Figure 4. Synthetic natural gas (SNG) and synthetic liquefied natural gas (SLNG) as advanced biofuel from lignocelluloses such as straw are produced via gasification with TRL 7–8 [5,76]. The electricity-based production of SLNG and SNG is rated as TRL 9 by Prussi et al. [5]. The German car manufacturer Audi AG also operates an SNG plant with a possible product stream of 200 kg/h [80].

3.3. Costs

According to Germany’s National Hydrogen Strategy [81], the German government forecasts a demand of 90–110 TWh of green hydrogen in 2030 to meet decarbonization targets. The hydrogen is envisioned to be used in industry, as well as specific applications in the transport sectors. Of the total demand for green hydrogen, 14 TWh are planned to be synthesized in Germany, corresponding to 20 TWh of renewable electricity, mainly from on- and offshore wind turbines. Accordingly, around 85% of green hydrogen demand must be imported. [81] In the long term, the imported quantities of green energy carriers are forecast to rise even higher. The demand of imported green energy carriers in 2050, to be used in all sectors, is estimated to be 150–900 TWh [82]. However, Merten et al. [83] state that there is no unanimous opinion regarding import strategies. The authors list arguments against large amounts of energy imports, such as high RE potential in Germany, overestimation of RE potential in typical export regions, political instability in export regions, delay of energy transition in export countries, as well as the necessity of efficiently using excess German RE energy. In contrast, Pfennig et al. [6] state that a solely national supply of electricity-based fuels from Germany is not reasonable. This is due to significantly higher onshore electricity generation costs by around a factor of two in Germany, in comparison to the North and Baltic Sea areas and the Middle East and North Africa (MENA) region. This assumption is shared by most studies that optimize future energy systems, taking into account energy carrier imports from regions with high RE full load hours (FLH), such as Robinius et al. [34], dena [84]. Therefore, it is likely that a mix of different green energy carriers will be imported, as is common practice today. [85] Due to the fact that fuel production will experience fundamental changes independently of the fuel choice and mix, an overview of the currently described costs of energy carriers that can be utilized in the transport sector is provided. For the import of energy carriers, additional costs accrued through transportation arise, which vary between different energy carriers. Before reviewing production and end user costs, the following section presents an overview of transportation costs.

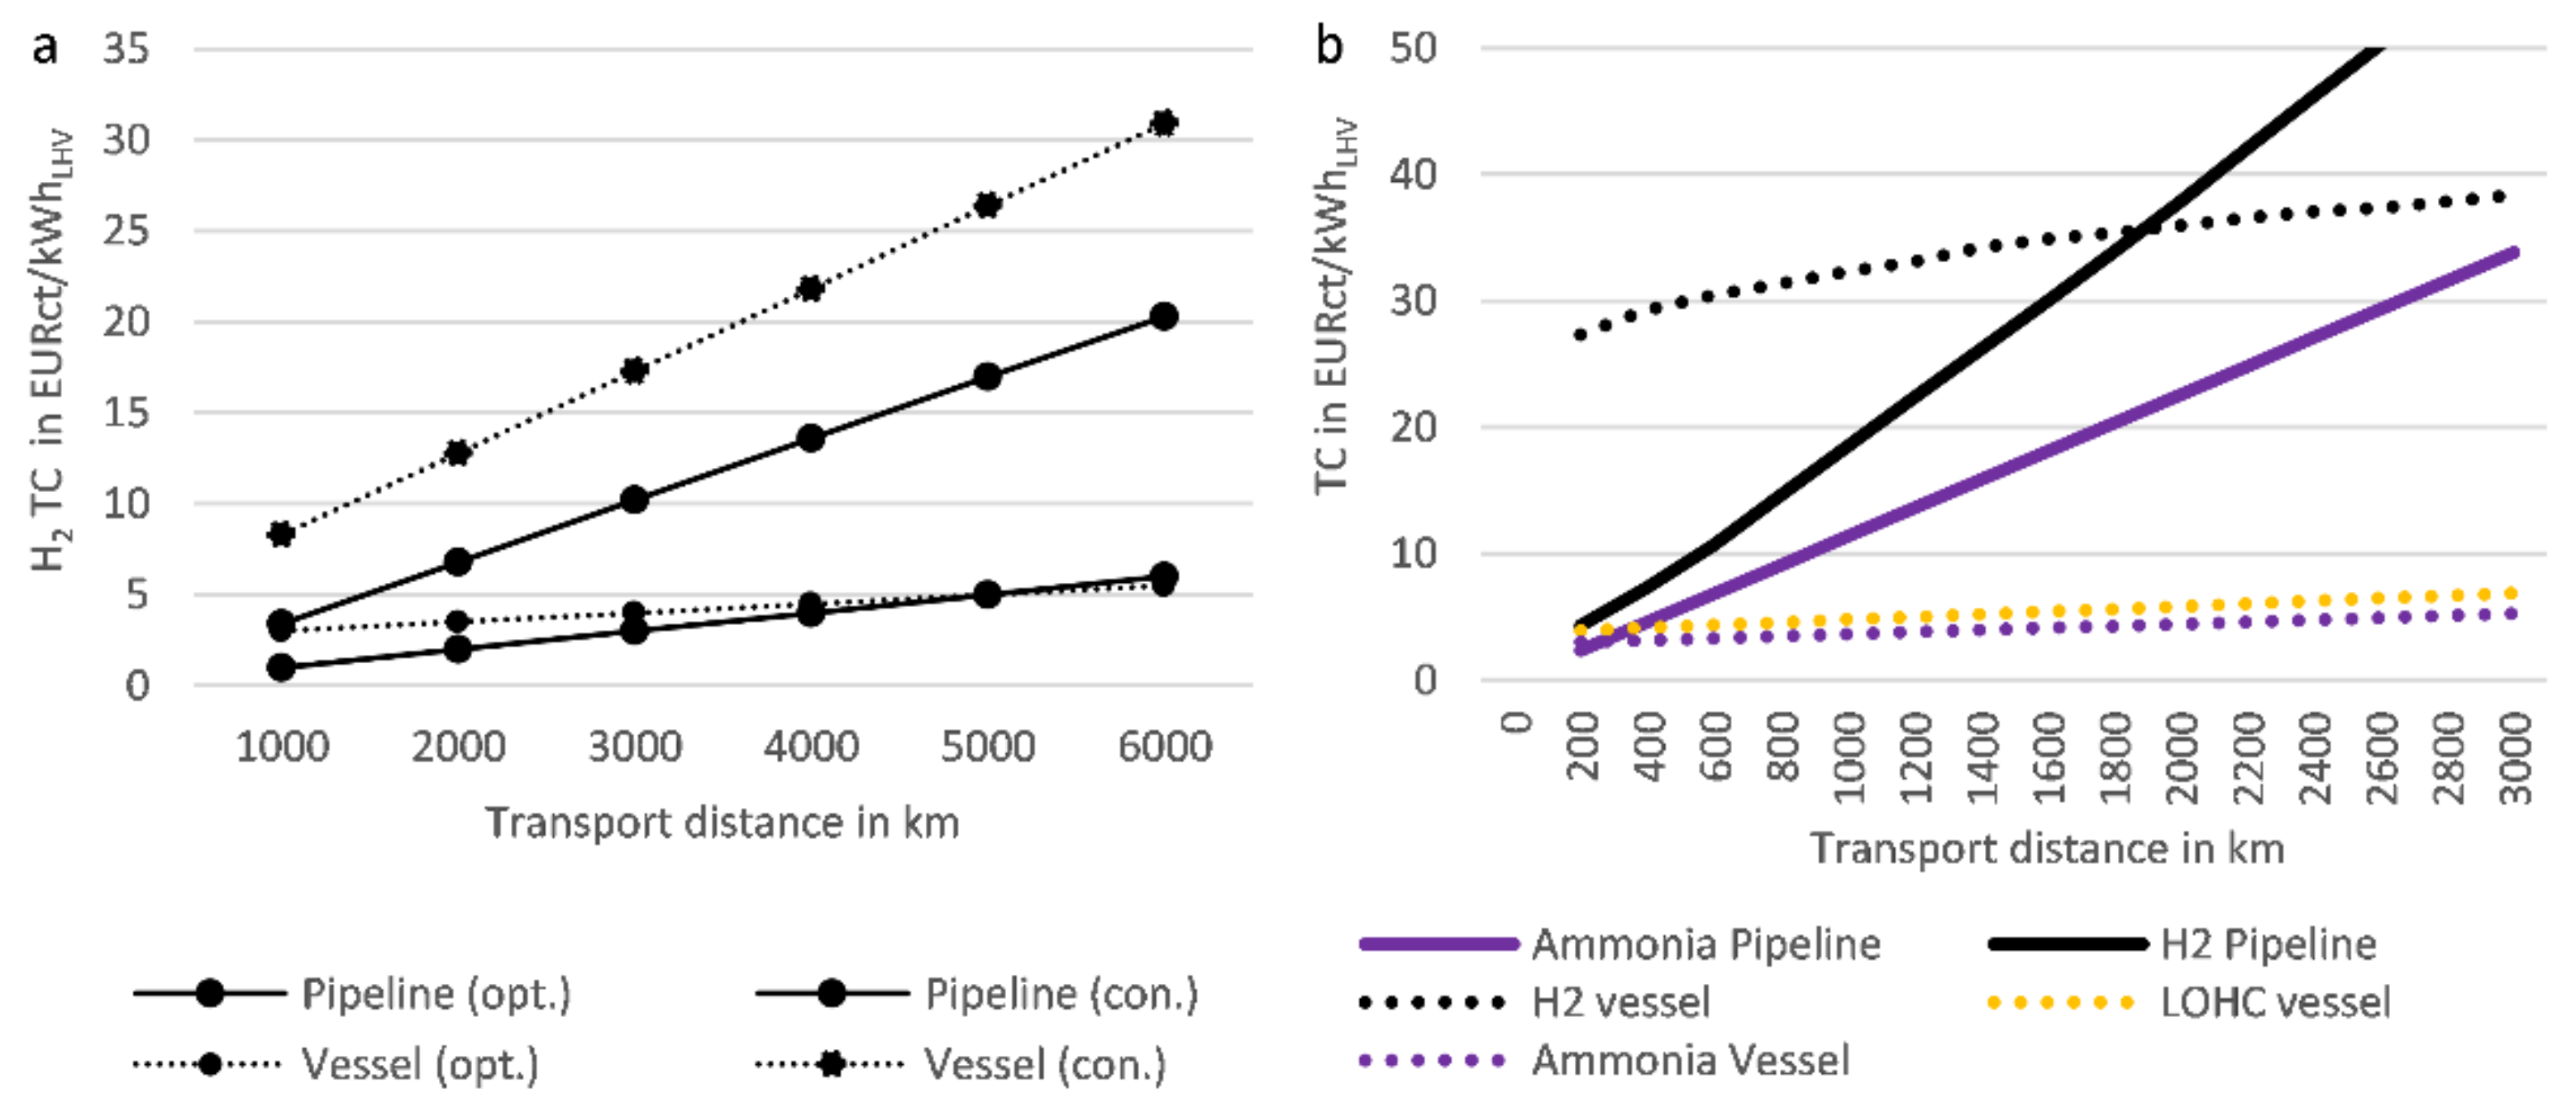
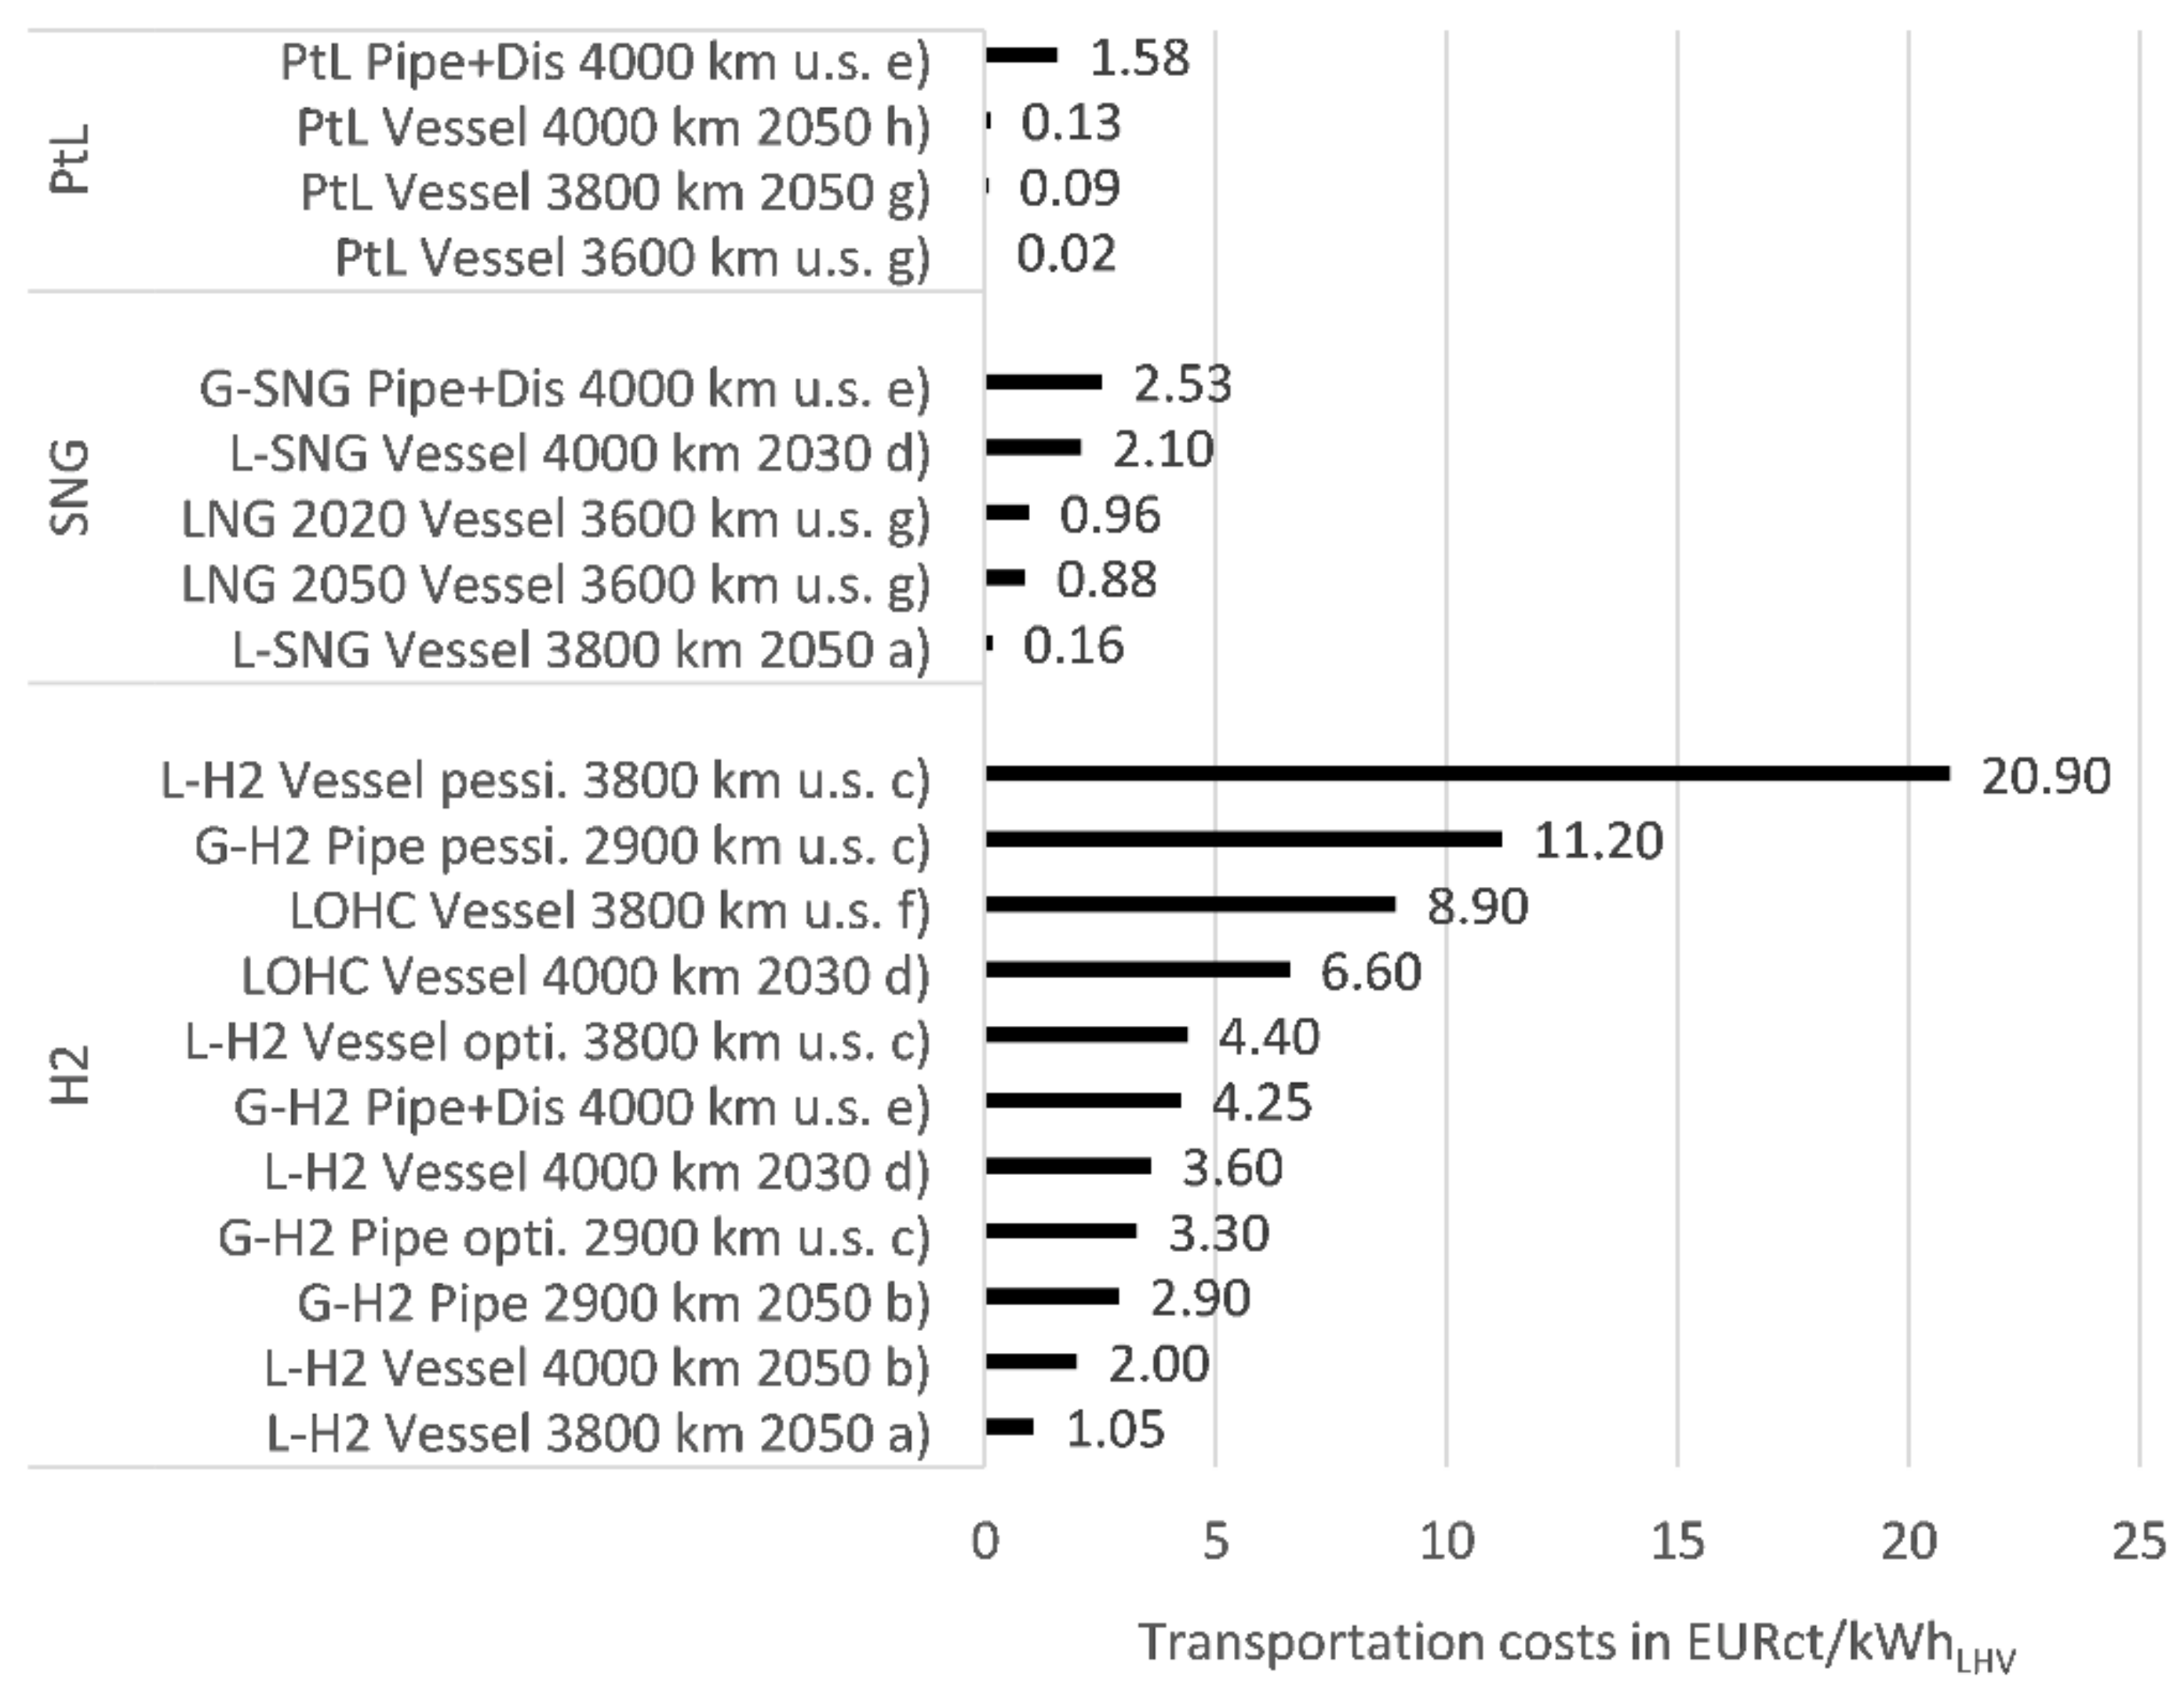
3.3.1. Import Costs of Energy Carriers

Perner et al. [85] identify electricity generation costs as being the main cost factor of electricity-based fuels. Consequently, comparative system analyses like that of Robinius et al. [34], Fasihi and Breyer [86] determine regions with high RE full load hours to ensure low energy prices. Worldwide detailed RE generations costs were determined by Fasihi and Breyer [86] and used for scenario-based import routes by Hank et al. [87]. The H2AtlasAfrica [88], funded by the Federal German Ministry of Education and Research, however, is focusing on hydrogen production from RE sources in West Africa.
Most other studies assume location-specific RE FLH and do not consider international locations for production [85,89,90]. Transport costs sum up to a relatively small share of cross-border prices for fuels, which allow transportation in existing infrastructure. However, transport costs for different fuel options substantially differ. In particular, if current infrastructure-compatible PtL fuels are compared for the transport of H2, new and costly infrastructure must be installed. In various studies, high H2 transport costs have been found to be economically decisive in favor of H2 derivatives such as liquid organic hydrogen carrier (LOHCs), SNGs, ammonia, or other PtL fuels that offer infrastructure compatibility [7,91]. The dilemma between costs for the scale-up of transport infrastructure for H2 and the less efficient process chains of PtL fuels also leads to the question of domestic H2 production, which could reduce transportation cost efforts and conversion losses before and after transportation [83].
However, if H2 import is considered, it can be transported in liquid form (LH2), bound to an LOHC, or as a derivative, such as ammonia, methane, or methanol [7]. H2 requires between 25% and 35% of its initial energy to be liquefied. Liquefied natural gas (LNG) consumes around 10% of its initial energy for liquefaction. The conversion of H2 into the derivative ammonia consumes 7–18% of its initial energy [91]. The conversion back into H2 in high purity consumes about the same amount of energy again. However, the liquefaction temperature of ammonia is −33 °C and the H2 liquefaction temperature is −253 °C, resulting in lower cooling efforts for ammonia. In the two required steps of exothermal hydrogenation and endothermal dehydrogenation, between an LOHC and H2, the processes combined consume between 35% and 40% of H2 initial energy. Another disadvantage is the necessity of transporting the dehydrogenated LOHC back to a suitable hydrogenation station. Similar issues arise for vessels that transport LH2, which must return empty. Furthermore, storing H2 at export and destination terminals is costly. IEA’s The Future of Hydrogen report [91] provides a detailed overview of the advantages and disadvantages of transporting H2 in the liquid phase, converted into ammonia or within an LOHC. Schindler [89] determines the costs of different H2 transportation possibilities from Morocco to Germany, which amounts to a shipping distance of around 3400 km. The costs of liquefaction are assumed to be 2.6 EURct/kWhGH2,LHV. Gaseous hydrogen transportation costs are estimated to be 1 EURct/MWhGH2,LHV/km for pipeline transport and 9.5 EURct/MWhGH2,LHV/km for transportation by truck. In contrast, costs for the transportation of liquefied hydrogen are 0.5 EURct/MWhLH2,LHV/km for ship transport and 2.1 EURct/MWhLH2,LHV/km by truck [89]. Kreidelmeyer et al. [92] directly compare the transportation costs for H2, SNG and PtL energy carries for an equal distance of 4000 km for 2020. The total transportation costs split up the energy demand costs for conditioning (e.g., compression or liquefication), transport energy, and CAPEX, as well as the OPEX of the transport infrastructure. The calculated transportation cost values refer to the MENA transportation route in Germany and are rated as optimistic, with 2.3 EURct/kWhSNG,LHV for SNG through a 100-bar pipeline and 3.6 EURct/kWhH2,LHV for H2, also via a 100 bar pipeline. The estimated value for unpressurized pipeline-transported PtL energy carriers is 1.5 EURct/kWhPtL,LHV. Corresponding pessimistic values are not presented [92]. These values lead to specific transportation costs of 0.575 EURct/MWhSNG,LHV/km, 0.9 EURct/MWhH2,LHV/km, and 0.475 EURct/MWhPtL,LHV/km for SNG, H2, and PtL carriers, respectively. Schorn et al. [7] compare the import costs of the energy carriers H2 and methanol for four different favorable global trade route locations for renewable electricity production, drawing on baseload hydrogen prices from the Hydrogen Council [36]. For Germany, an import scenario from Saudi Arabia via an LH2 vessel is determined. The results show that the additional costs for converting hydrogen into methanol are outbalanced by the significantly lower shipping cost of methanol, in contrast to liquid hydrogen transport. For the reference year 2030, import costs for both energy carriers were determined to be 6.5–10.8 EURct/kWhLHV, including production and transport.
Perner et al. [85] calculated liquid shipping transport costs for LNG for different export regions, which include the North and Baltic seas, North Africa and the Middle East, and Iceland, assuming that the liquefaction costs of 0.69 EURct/kWhLNG,LHV in 2020 will reduce to 0.61 EURct/kWhLNG,LHV in 2050. The authors classified these values as optimistic. Regasification costs are estimated to be 0.15 EURct/kWhLNG,LHV and remain constant between 2020 and 2050. Including the transport costs from Iceland (a 2300 km maritime distance to Hamburg), the determined transport cost range is 0.91 EURct/kWhLNG,LHV in 2020 and 0.84 EURct/kWhLNG,LHV in 2050. Equal considerations for the export region North Africa (3600 km maritime distance to Hamburg) result in transport costs of 0.96 EURct/kWhLNG,LHV in 2020 and 0.88 EURct/kWhLNG,LHV in 2050. For the Middle East region (11,000 km maritime distance to Hamburg), the transport cost values are 1.19 EUR/kWhLNG,LHV in 2020 and 1.12 EUR/kWhLNG,LHV in 2050. Pfennig et al. [6] differentiate between the costs for PtL production with different CO2 sources that commonly appear as by-products and CO2 that is captured from air (direct air capture—DAC) and LH2 onshore wind and PV hybrid systems. Shipping transportation costs are estimated to be 0.13 EURct/kWhPtL,LHV for PtL for import from Morocco (Region of Tarfaya) to Germany. In the study, different production locations such as Egypt, Somalia, Brazil, and Morocco were compared, with the latter turning out to be the most cost-competitive. Energy costs account for a share of 67% of the total costs in the calculation by Pfennig et al. [6]. For LH2, Pfennig et al. [6] calculate transportation costs of 0.27 EURct/kWHLH2,LHV for an equal shipping transport route. A specific transportation cost value for PtL is determined for an equal route with 0.13 EURct/kWHPtL,LHV for 2050. Thus, the transport costs of LH2 exceed PtL by a factor of about two.
Merten et al. [83] determine the distance-specific transportation costs of H2 vessels and pipeline transport. The advantages of pipeline transport include high capacity, high efficiency, and low OPEX. Its disadvantages include high CAPEX and the high transport quantities that are necessary to refinance investment, which can be economically disadvantageous for technology scale-up, starting with low H2 production. Vessel transport offers advantages in the ramp-up phase of H2 production through easier scalability and the meeting requirements of decentralized H2 production. Furthermore, longer transport distances can be covered with lower increases in transport costs [83]. For shorter transportation distances of around 1000 km pipeline, transport is estimated with a cost interval of 1.0–3.4 EURct/kWhH2,LHV and vessel transport with 3.0–8.3 EURct/kWhLH2,LHV, with a cost advantage for pipeline transport. According to the determined correlation, vessel transport would be advantageous for distances greater than 5000 km. An IEA study [91] calculates differing break-even transport distances, which are beneficial for vessel transport for distances higher than 1800 km. For lower transport distances, a gas pipeline would be the most cost-efficient. The assumed specific transport cost curves are illustrated in Figure 5. Hank et al. [87] also determine the distance-dependent cost functions, but for up to 18,000 km.
The estimated cost assumptions strongly depend on the transported quantities of H2, the infrastructure utilization rate, and site-specific features. Robinius [94] already presented a three-dimensional correlation of H2 costs at the destination depending on mass flow and transport distance, and cheapest transport type for the distribution purpose, with the longest transport distance of 500 km, which is therefore inadequate for overseas import considerations. In this context, it should be mentioned that the commercial readiness level of LH2 via vessels is low. This is underlined by the high spread of cost range for transport costs, which other studies also conclude [83]. Kawasaki develops a large-scale vessel based on cargo containment systems (CCS) with a storage capacity of 40,000 m3. The system’s forerunner was the SUISO FRONTIER, which has a storage capacity of 1250 m3. Kawasaki announced the development of a 160,000 m3-capacity vessel using four CCS [95]. However, the current TRL cannot be evaluated. A TRL of H2 transport via pipelines is rated higher, with 5000 km of pipelines operated worldwide, with around 400 km in Germany, 2600 km in the U.S., and 600 km in Belgium. The lifetime of H2 pipelines varies between 40 and 80 years and their installation requires high investment costs. The rededication costs of natural gas pipelines to H2 ones are below those of the new installation, and bypass the problems of acquiring way rights. Ammonia pipelines carry lower CAPEX and also have high TRL levels, and are therefore a promising transport alternative. For instance, a 4830 km pipeline is operated in the U.S. and a 2400 km one between Russia and Ukraine [91]. For all studies, which analyze the Regions of North Africa or Morocco, which are the most researched areas for synthetic energy carrier production, transportation cost values were extracted and are summarized in Figure 6. These regions are also advantageous because transportation is feasible via pipeline and vessel.
As seen in Figure 6, the transportation costs strongly vary for both transport modes; pipeline and vessel transport. The cost interval for LH2 vessel transport reaches from 1.05 EURct/kWhLH2,LHV to 20.9 EURct/kWhLH2,LHV for equal transport distances, which is a difference of around factor 20. The two cost values of transport via LOHC carrier are relatively close to each other with 6.6 EURct/kWhLHV and 8.9 EURct/kWhLHV. SNG transportation cost show lower scatter, with 0.16 EURct/kWhLSNG,LHV being the lowest and 2.1 EURct/kWhSNG,LHV being the highest value, considering only transportation cost values. The highest cost value of 2.1 EURct/kWhLSNG,LHV includes cost for liquefaction, while the lowest cost value does not. The transportation cost of PtL fuels reveals the lowest total cost and lowest spread of costs, with a range of 0.02 EURct/kWhLHV to 0.13 EURct/kWhLHV for vessel transport, which corresponds to a difference of factor 6.5. The extracted transportation cost values show a clear advantage for especially PtL fuels as well as SNG. The discussed cost values represent transport cost values for one specific region and cannot be transferred to other export regions’ transportation costs. How transportation costs affect the total cost is discussed in the following section.

3.3.2. Review of Total Costs

This section starts with the current prices of different energy carriers and furthermore aims to provide insight into future energy carrier prices. First, the different production costs of electricity-based fuels are discussed and compared with biofuel prices. For that, only production without transport and taxes are considered. Additionally, the boundary conditions considered in the reviewed articles are similar, so that a comparison is possible. Second, the review is extended to include transport as well as taxes. Only synthetic fuels are considered in that part and are classified into H2, SNG, and PtL fuels, and domestic production, as well as imports, are considered. The reviewed literature studies are summarized in Table A2 in Appendix A.
Table 2 presents an overview of the specific domestic production costs of alternative fuels, including biomass-based fuels, synthetic fuels from PtL processes, and hydrogen, as well as synthetic methane from CO2 and renewable hydrogen. The values are shown in EURct/kWh and EUR/LDE. The latter is the specific price for the energy, which represents one liter of diesel. The lower heating value of diesel is 9.96 kWh/L [97]. Schemme et al. [4] investigated the costs of synthetic fuels produced in the framework of the PtL concept. Amongst others, they assume a price of 4.6 EUR/kgH2 based on Robinius et al. [98], which is equal to 1.38 EUR/LDE. Furthermore, Peters et al. [13] calculated the price for synthetic methane, but assumed CO2 costs of 35 EUR/tCO2 instead of 70 EUR/tCO2 such as Schemme et al. [4]. The recent market prices of the biofuels FAME, HVO, bioethanol, and biomethane are 88 EURct/LDE, 73 EURct/LDE, 112 EURct/LDE, and 69–72 EURct/lDE [99,100]. The hydrogen price calculated by Robinius et al. [98] is based on an electricity price of 6 EURct/kWh, and is equal to 69 EURct//lDE. The German consumer electricity price in 2018 was 30.19 EURct/kWh [101], which corresponds to 3.01 EUR//lDE. As is shown in Table 2, the production of hydrogen, methanol, DME, and MtG is most beneficial from an economic viewpoint amongst synthetic fuels. The medium price segment of synthetic fuels includes ethanol, and SNG, as well as FT diesel and gasoline. Of biomass-based fuels, HVO and biomethane have the lowest prices, whereas the generally lower price of biofuels, compared to synthetic ones, must be considered. Detz et al. [102] state that learning curves could arise for the production of synthetic fuels, making them more competitive.
The potential of biofuels, which was outlined above in a separate section, should be drawn upon as much as possible, because they possess, in general, lower production costs. This principle applies as long as the ILUC conditions can be met. Additionally beneficial is the production of HVO and biomethane, as both production pathways are technically mature (see Figure 4) and carry the lowest production costs (see Table 2). Amongst electricity-based fuels, the fuels hydrogen, DME, MtG, methanol, and FT diesel should be preferred on the basis of their lower production costs. The production of ethanol and synthetic jet fuel is limited by the low TRL of their production pathways (see Figure 4). The biomass-based production of jet fuel has a higher TRL, and therefore constitutes a promising alternative. Other alternatives to synthetic jet fuel will be discussed in the following sections.
After comparing current alternative fuel prices, the future price ranges cited in the current literature are reviewed in the following, with a focus on synthetic fuels from CO2 and renewable hydrogen. Aside from transportation costs, end user price is decisive for market penetration, and for this reason, this section presents the results of a review of the literature regarding the costs that arise across the entire value chain. Tax and levies (T/L) strongly depend on political objectives, which is why they are subjected to independent consideration. In order to be able to compare different studies, three dominant cost levels are drawn on, if available in the literature. These are fuel production costs (PCs), transport costs (TCs = cross-border price), and third level (including T/L and end user price). In order to provide an overview of current and future expected costs, ranges with the lowest and highest specific cost values for 2020, 2030, and 2050 are extracted, which aggregate the assumptions concerning the full load hours of RES, with the choice of RE and electrolysis, CAPEX, OPEX, depreciation rate, process efficiencies, price of CO2, and water sources, weighted average cost of capital (WACC), as well as the transportation and distribution costs.

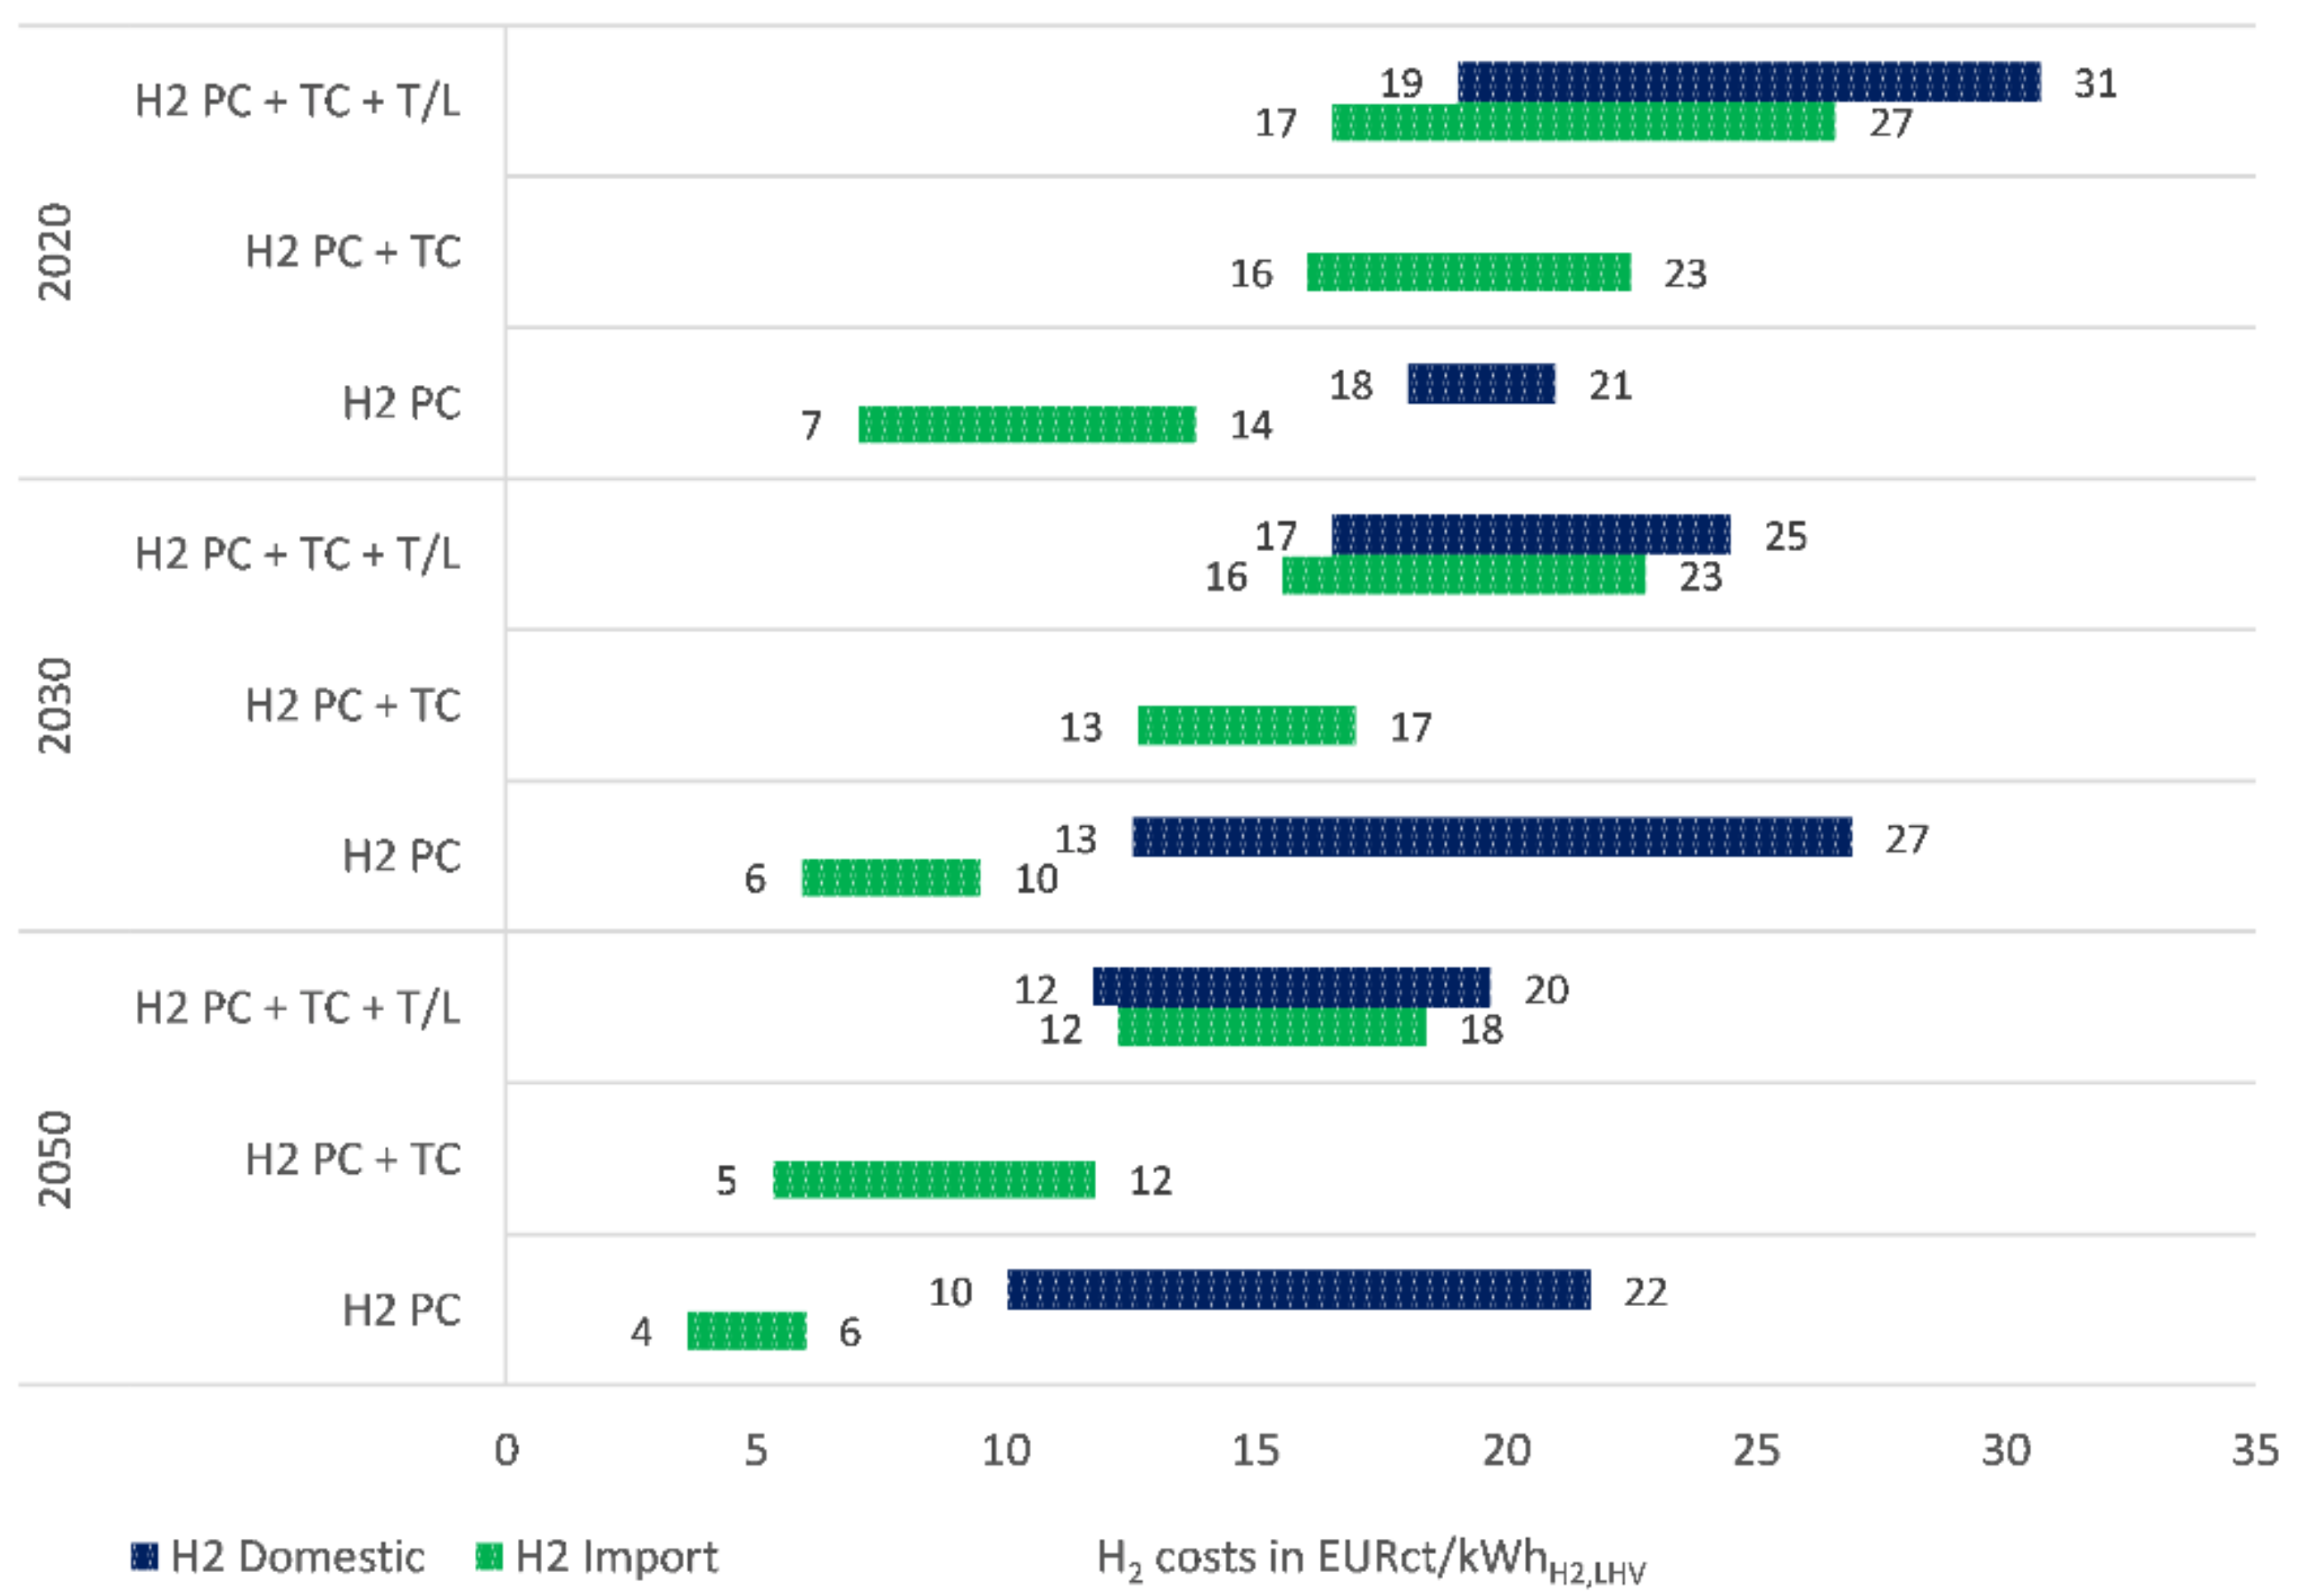
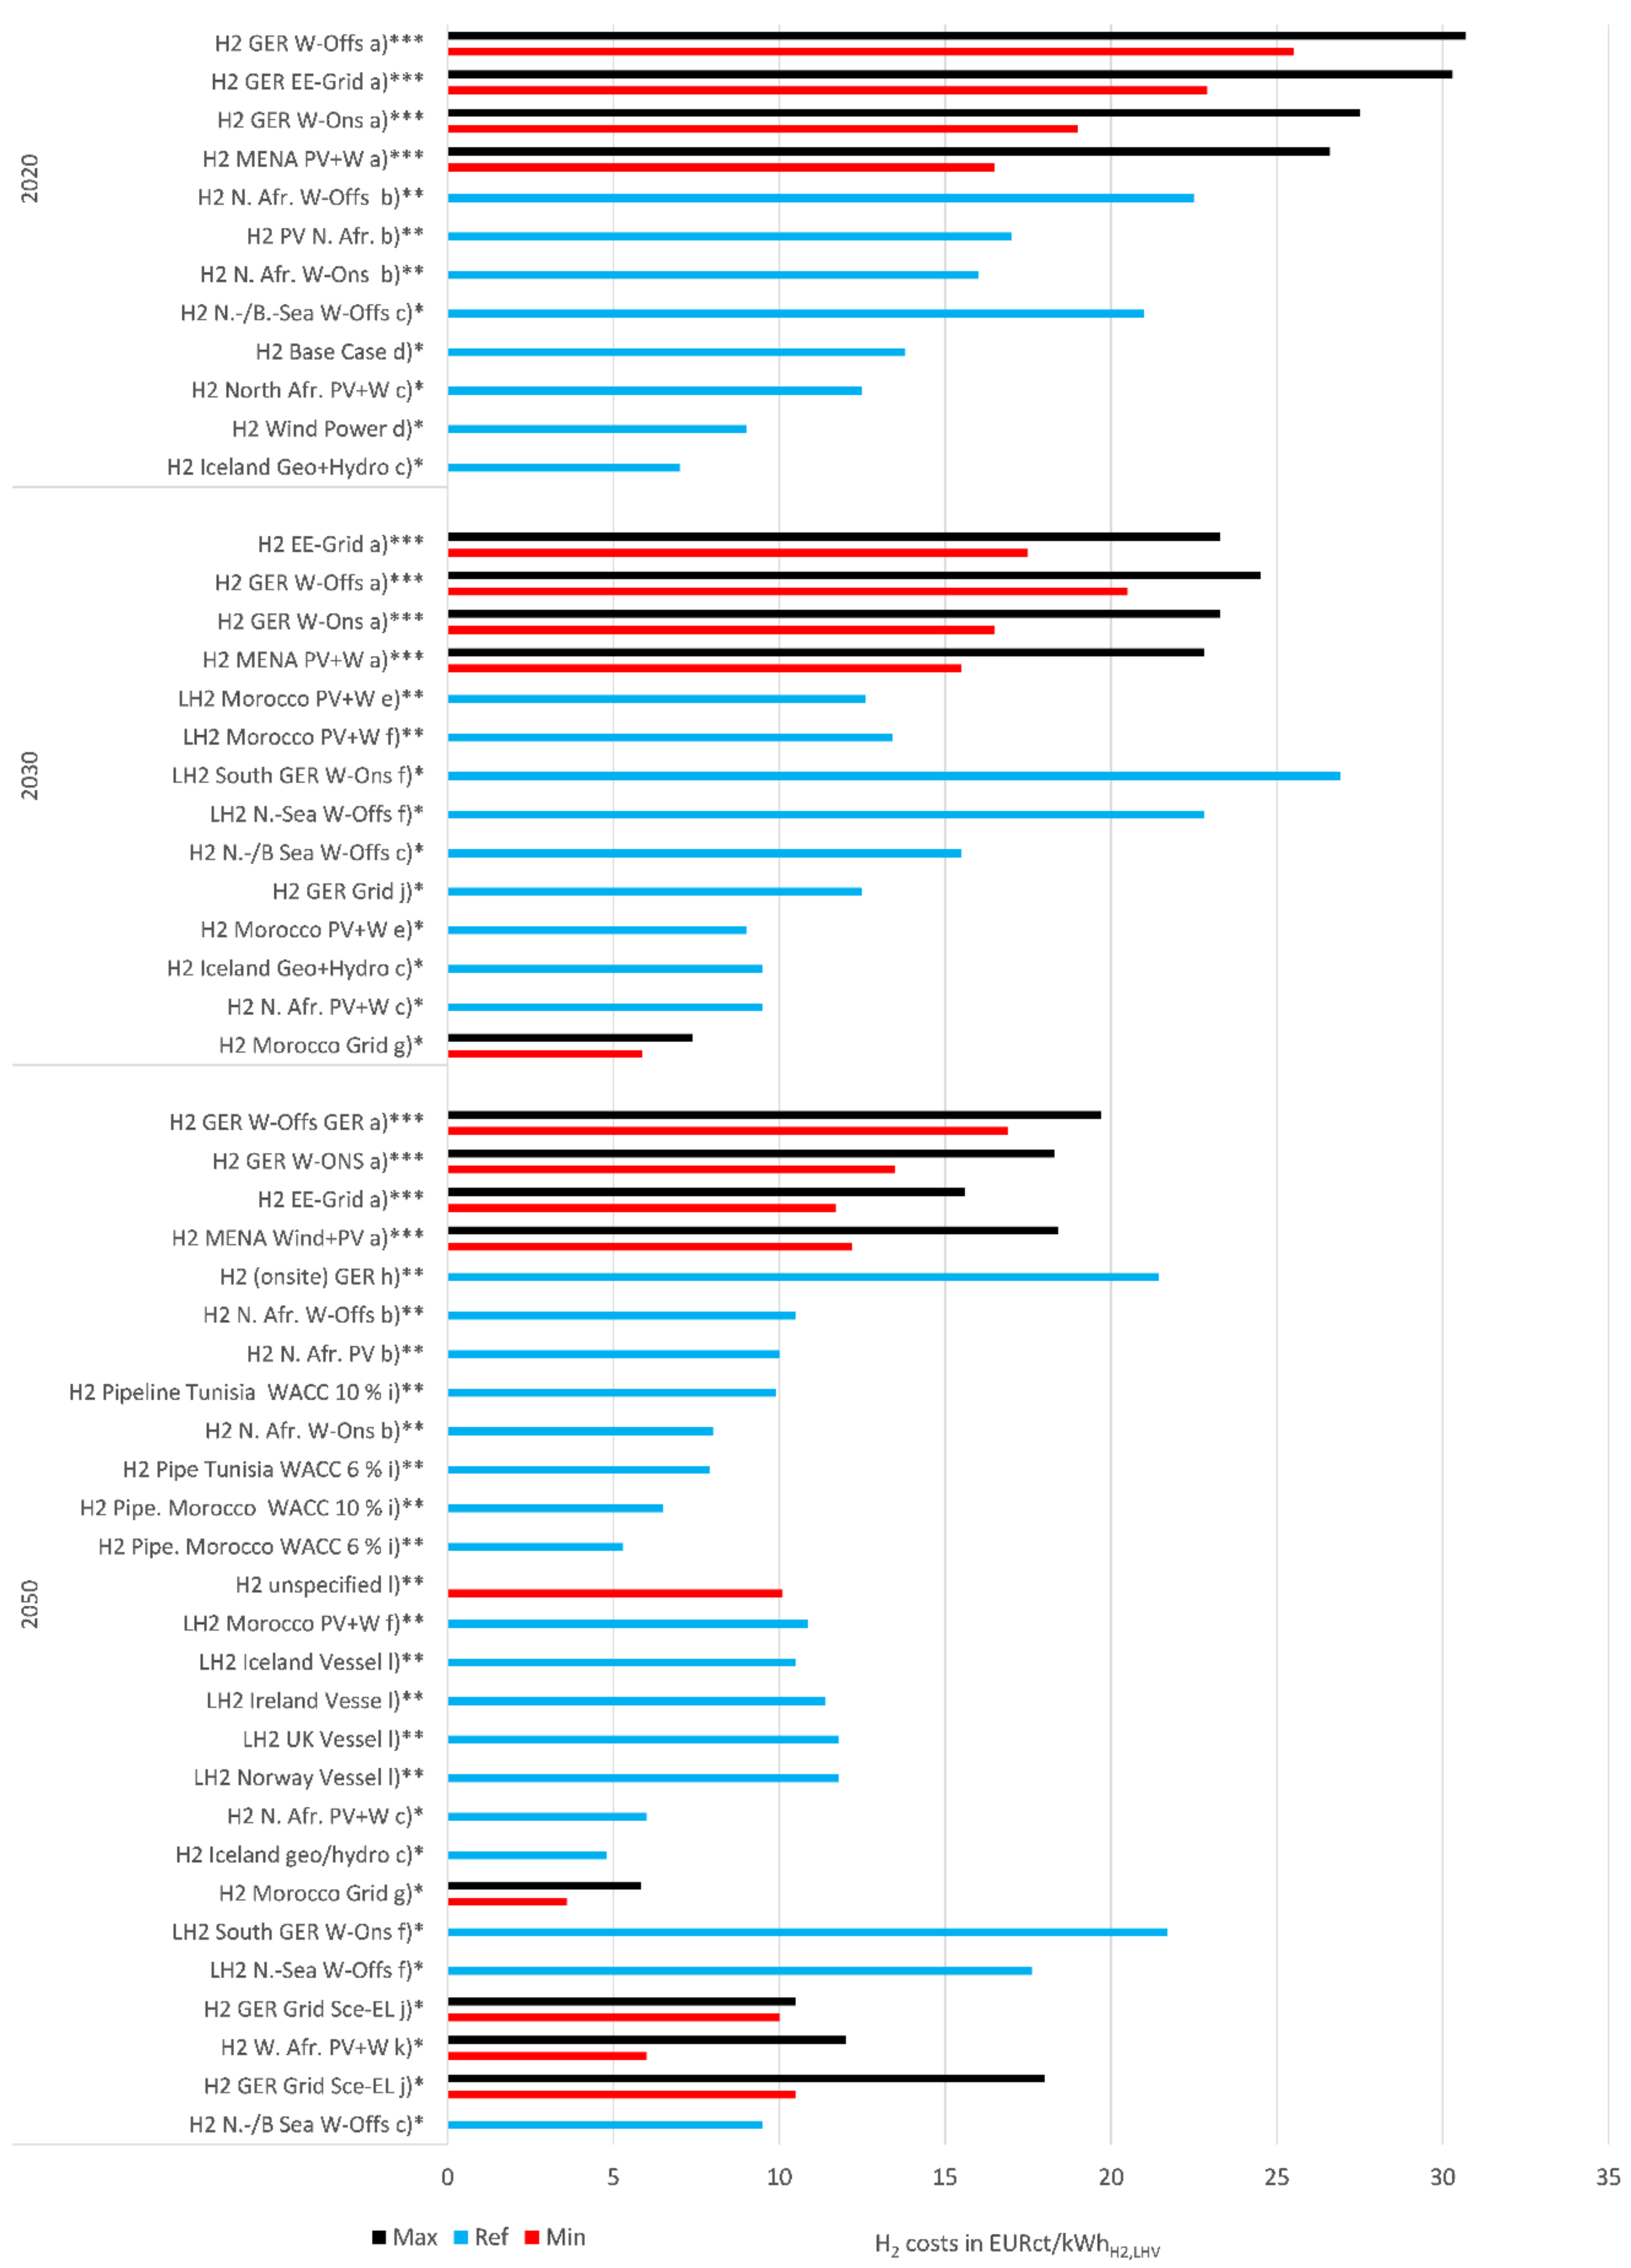
Future Cost Ranges of Hydrogen from Renewable Sources

Figure 7 displays the first results of the conducted literature review, with H2 cost ranges given for the three defined price levels and reference years. With respect to gaseous H2 and LH2 PC, the differences in Germany (H2 domestic) and favorable locations (H2 import) such as Morocco, Iceland, or the MENA region appear in all analyzed years. Robinius et al. [34] identify neighboring EU states such as Norway, the UK, and Ireland with high RE potential and optimized country-specific import prices. Most other studies have focused on North Africa and the MENA region for energy carrier importation. In more recent studies, export regions have more widely varied [34]. The already mentioned H2AtlasAfrica [88] is calculating H2 PC in West Africa considering onshore, offshore, and photovoltaic RE sources. Jensterle et al. [104] identified countries with the highest medium- and long-term suitability for exporting large quantities of H2 with consideration of the already named conditions, as well as soft factors like governmental interest, availability of skilled labor, different aspects of security, and the acceptance of the local population. The countries with the highest suitability for a 2030 perspective are Iceland, Canada, Morocco, Norway, Tunisia, and Turkey. With regard to 2050, the countries of Egypt, Algeria, Argentina, Australia, Canada, Kazakhstan, Russia, and Saudi Arabia were identified. If transportation is neglected, the advantages of higher full load hours in equatorial and coastal regions come into play, where high wind and PV FLH are ensured and appear to overweigh the higher capital and transport costs. In 2030, the high TC for hydrogen (liquefaction effort or gaseous pipeline transport) results in end user cost ranges for imported hydrogen of 15.5–22.8 EURct/kWhH2,LHV, which are optimistic and pessimistic cost values for production in the MENA region using wind, as well as PV hybrid systems and subsequently pipeline transport, as calculated by Kreidelmeyer et al. [92]. The corresponding domestic production cost ranges are optimistic cost values of 16.5 EURct/kWhH2,LHV for the case of onshore wind in Germany. The upper bound of 24.5 EURct/kWhH2,LHV corresponds to pessimistic assumptions for offshore wind in the North or Baltic seas [92]. For 2050, the lowest H2 PCs were determined by Eichhammer et al. [90] with an H2 cost of 3.6 EURct/kWhH2,LHV, whereas electrolyzers are supplied with RE in Morocco and grid connections are not taken into account. The highest regarded PC in favorable regions was calculated by Pfennig et al. [6] with 10.9 EURct/kWhLH2,LHV for Morocco, including liquefaction and wind and PV hybrid supply systems.
The lower bounded value of 9.5 EURct/kWhH2,LHV of the PC range for domestic production was determined by Perner et al. [110] for offshore wind in the North and Baltic seas. The highest PC result was for LH2 and calculated by Pfennig et al. [6] for the case of southern Germany, with 21.7 EURct/kWhLH2,LHV. For import (PC + TC), the lowest cross-border price was calculated by Gerhardt et al. [106] for Morocco with 5.3 EURct/kWhH2,LHV and gaseous pipeline transport to Germany (WACC = 6%). A 10% WACC would increase the cost to 6.5 EURct/kWhH2,LHV and liquefied vessel transport to 7.7 EURct/kWhLH2,LHV. The highest cross-border price was determined for liquefied H2 vessel transport from the UK, at 11.8 EURct/kWhLH2,LHV, by Robinius et al. [34] for the case of onshore wind in coastal regions. For the end user price of H2, Kreidelmeyer et al. [92] determined a cost range of 12.2 to 18.4 EURct/kWhH2,LHV, with the WACC varying between 6% and 12%, and the FLH of the electrolysis estimated to be 5000 h. Furthermore, the reference cases for domestic production are provided, which results in a low end user price of 11.7 EURct/kWhH2,LHV for the case of electrolysis supplied by the German electricity grid. The highest H2 end user price of 19.7 EURct/kWhH2,LHV was determined for an off-grid system combining offshore wind and electrolyzers close to the German coast and includes a gaseous pipeline transport segment of 500 km and 3000 FLH for electrolysis [92]. In general, the ranges between the highest and lowest costs are smaller for import cases due to limitations across the favorable locations.
This implies lower cost ranges, which constitutes an uncertain conclusion. Most studies focus on techno-economic analyses with a minor focus on extenuating political circumstances. Recent studies such as that by Merten et al. [83] as well as Jensterle et al. [104] take these circumstances into account. However, it is difficult to include these findings in techno-economically-optimized models, which is why researchers advise building connections between the models and political aspects at an early stage, e.g., to synchronize local decarbonization strategies and intentions in the context of export. The range spread of domestic production compared to the ranges of import prices is slightly higher due to differing RE FLH in the north and south Germany, as well as the North and Baltic seas, which leads to differing electricity costs and necessities of conversion.
The reference PC of fossil H2 based on natural gas, taking into account increasing rates of CO2 taxation, are 4.5 EURct/kWhH2,LHV for 2020, 5.5 EURct/kWhH2,LHV for 2030, and 7.5 EURct/kWhH2,LHV for 2050 [92]. For optimistic assumptions, the estimated PC of renewable H2 for import can be rated as competitive in comparison to its fossil alternatives in 2050. For domestic production, on the other hand, a stronger reallocation of CO2 source costs could ensure competitive price ranges for renewable H2 compared to fossil H2. The availability of data and results of H2 costs for the considered cost levels in the current literature was assessed to be sufficient for this work for a comparison of domestic and import costs. The determined current and future cost structures indicate that domestic H2 production should be regarded as a possible and competitive pathway, and therefore investigated with equal effort. Aside from end user prices, studies from the Wuppertal Institute [83], Jensterle et al. [104], and Michalski et al. [105] point out the beneficial macroeconomic effects of domestic production. Jensterle et al. [104] also indicate that green hydrogen export regions or countries must match an ideal of low import costs, high RE energy potential, and country-specific political and economic conditions. Furthermore, Terlouw et al. [111] identified favorable H2 production regions in Europe, which are located in the North and Baltic seas, the south of Spain, the south of France, and the south of Italy, as well as neighboring states. Moreover, it is stated that for production in the EU, a high share of excess energy used is a decisive factor in economic competitiveness.

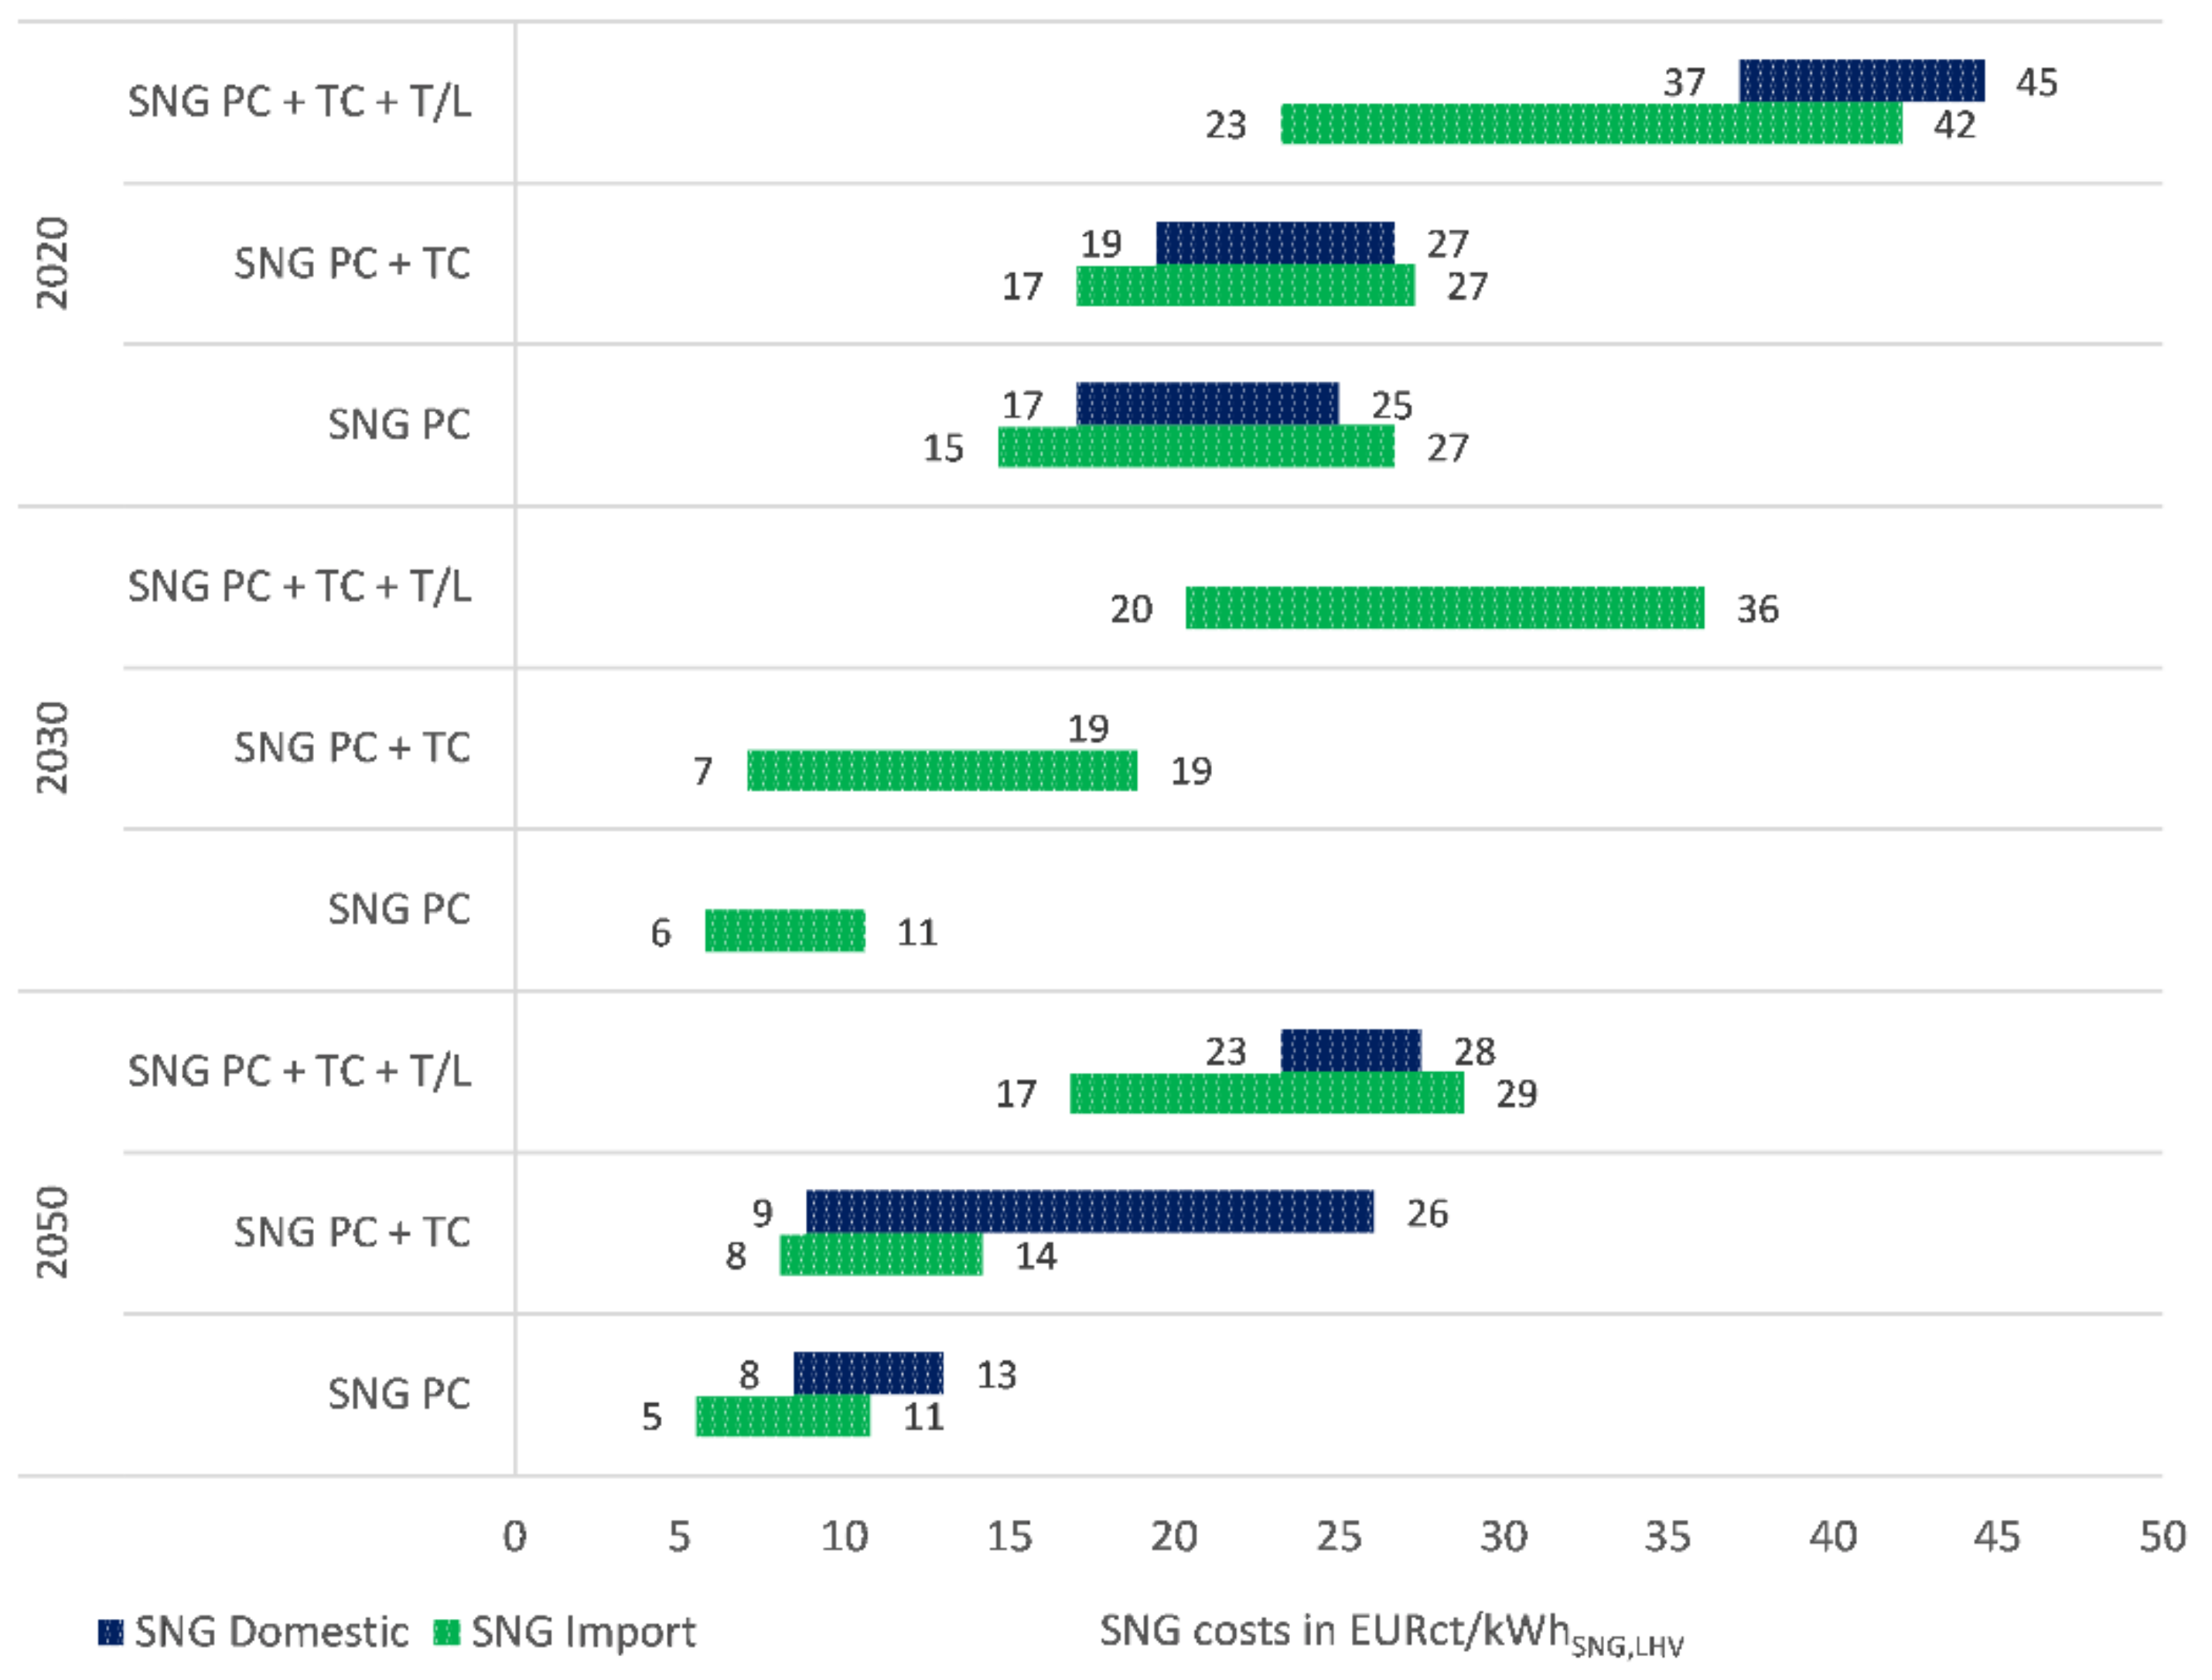
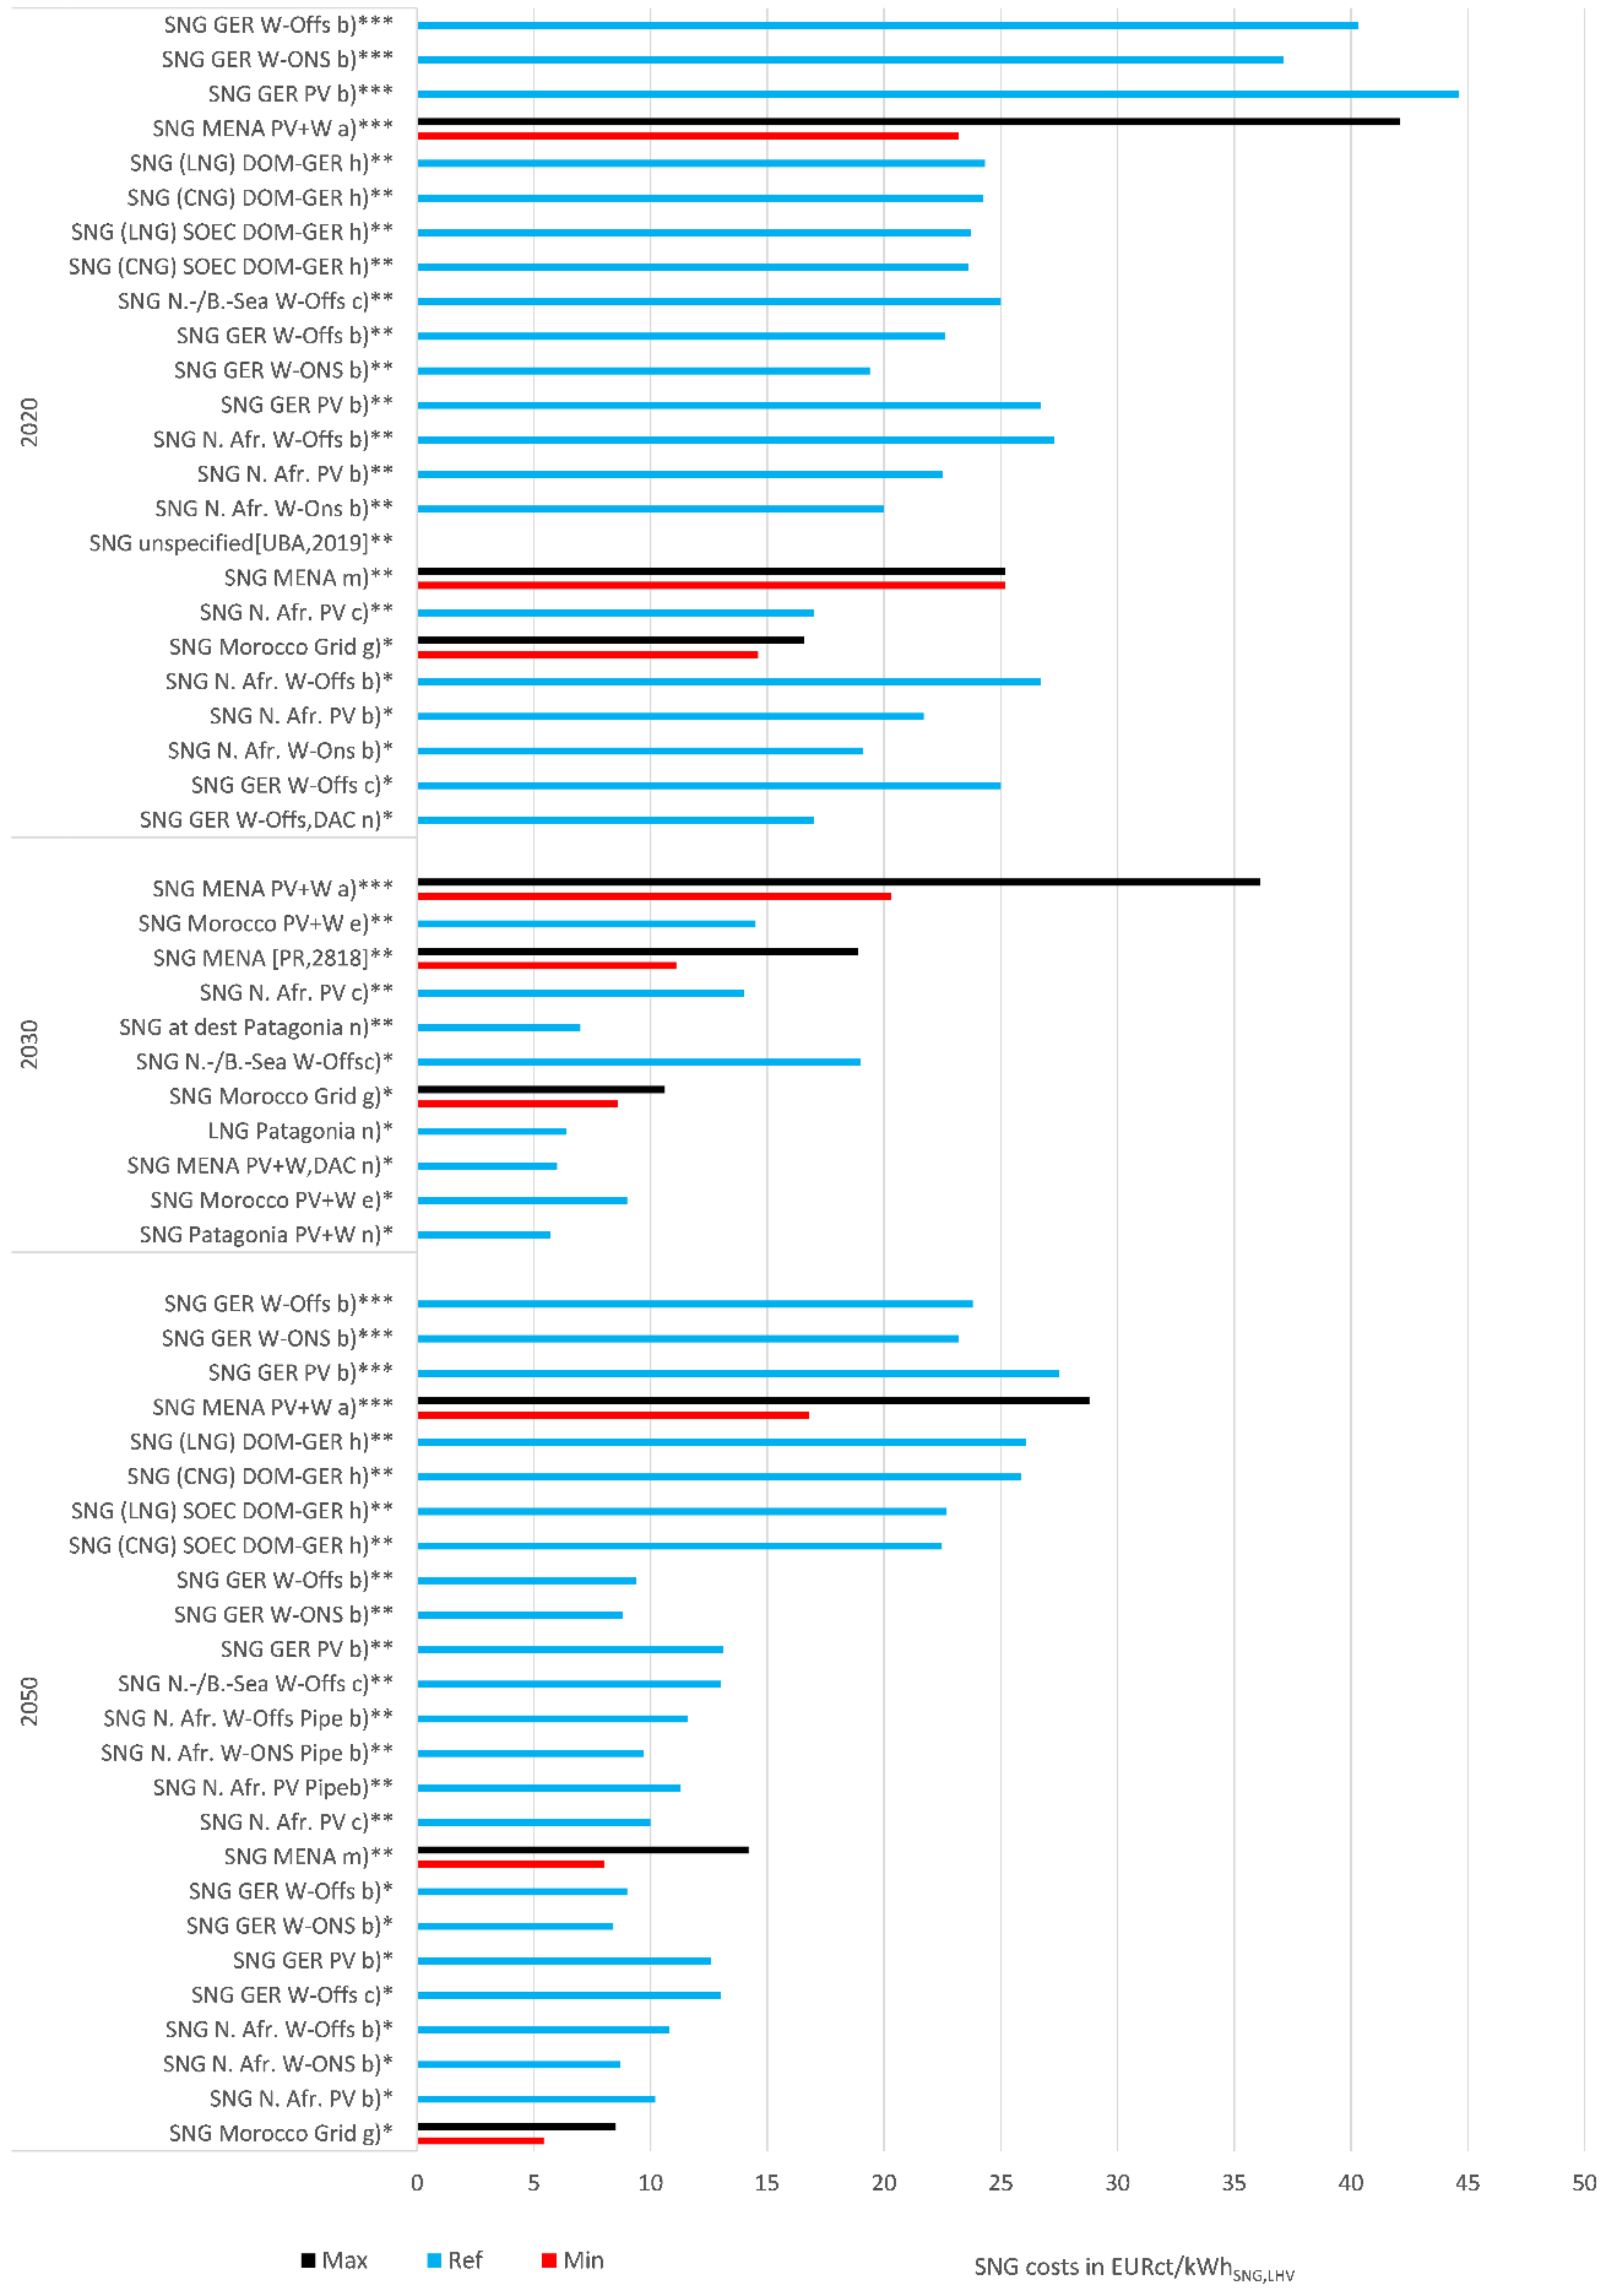
Future Cost Ranges of SNG from Renewable Sources

The second product investigated in the literature study of future RE carriers is SNG. The results were determined in a similar way to those of H2 and are shown in Figure 8. With respect to the cost development of end user prices, including taxes and levies (SNG PC + TC + T/L) for the import pathway, cost ranges drop from 23.2 to 42.1 EURct/kWhSNG,LHV in 2020 to 20.3 to 36.1 EURct/kWhSNG,LHV in 2030, and 16.8 to 28.8 EURct/kWhSNG,LHV in 2050. The ranges between the lowest and highest price of imported SNG are 12.0, 15.8, and 12.0 EURct/kWhSNG,LHV for 2020, 2030, and 2050, respectively, which is almost a doubling of the cost ranges compared to H2 for the same reference years. The larger spreads reveal higher cost insecurities due to longer production pathways, as well as strongly deviating assumptions for costs and the availability of CO2 sources. For 2050, the lower bound of the SNG PC + TC cost range is 8.8 EURct/kWhSNG,LHV for domestic (offshore wind in the Baltic sea) and 8.0 EURct/kWhSNG,LHV for import cases (the RE source is hybrid wind onshore and PV plus import via pipeline from the optimistic MENA scenario) [89,112]. The upper bound for domestic production and distribution in 2050 is 26.1 EURct/kWhSNG,LHV. To achieve this cost value, electrolysis is enabled by the German power grid. The upper bound of import costs is 14.2 EURct/kWhSNG,LHV [108], which indicates that, especially for energy carriers with low transportation costs, production in regions with high RE full load hours can have a positive impact.

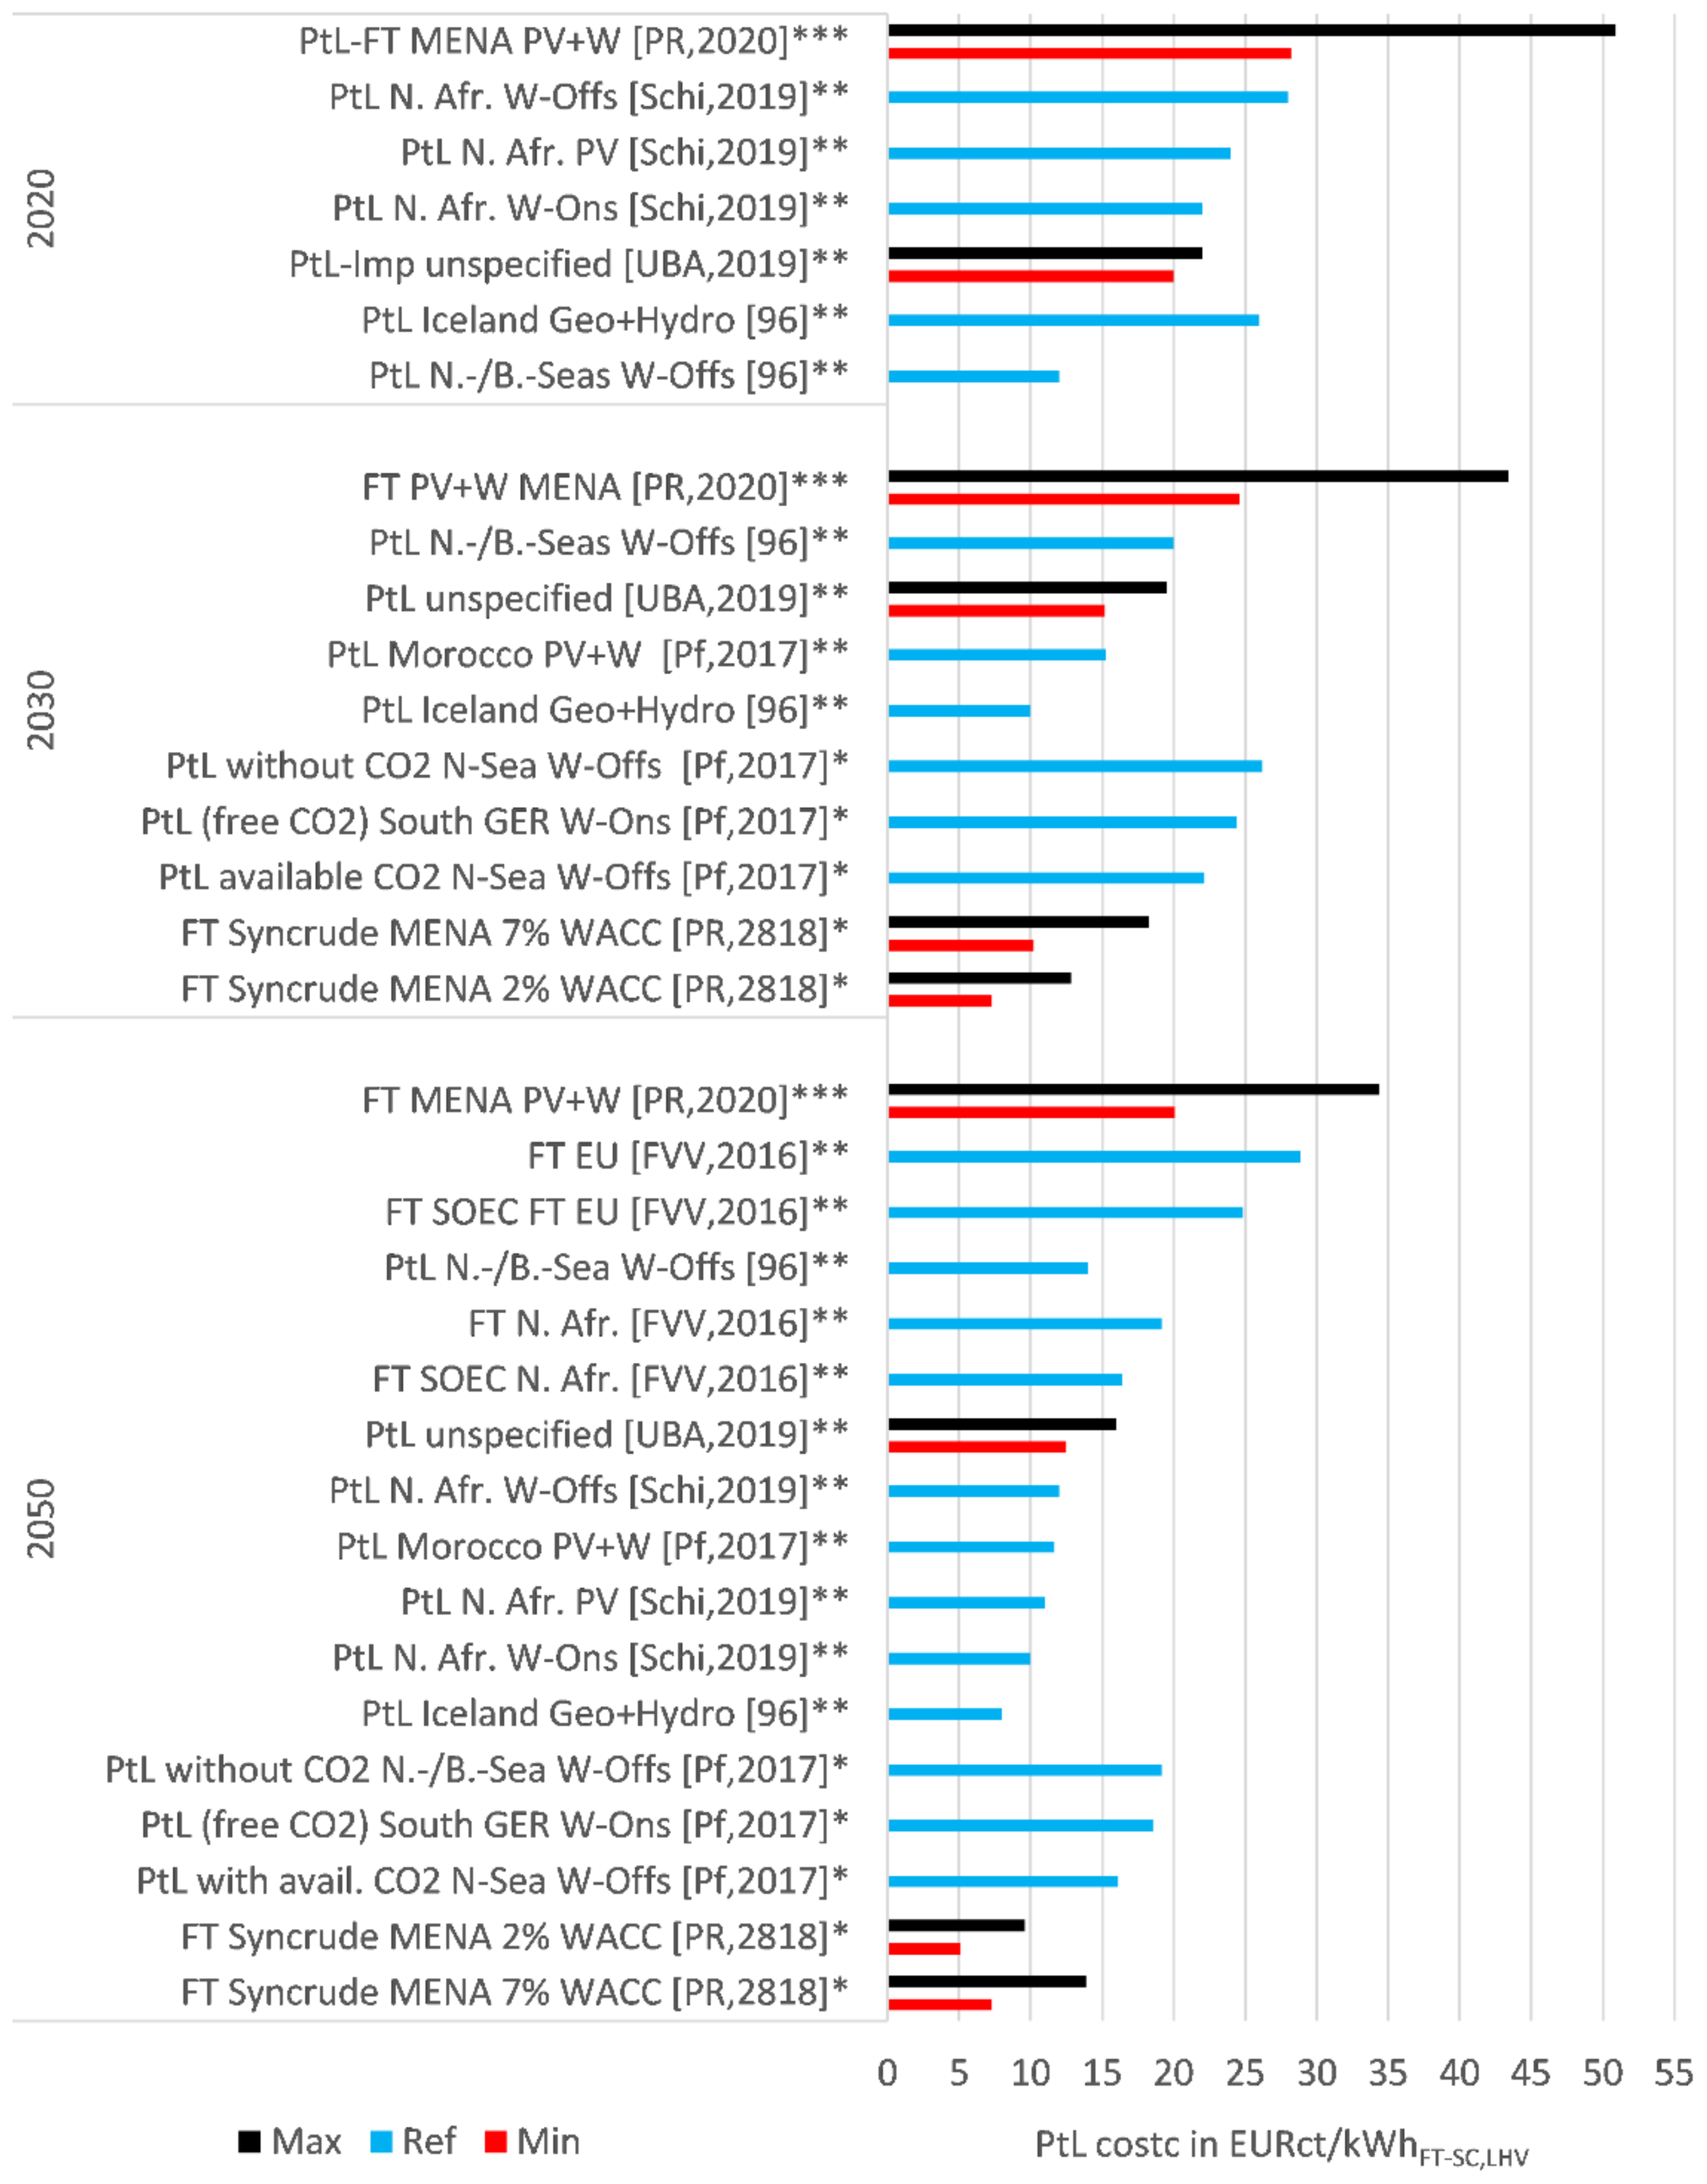
Future Cost Ranges of PtL-Fuels from Renewable Sources

The following, final section of the literature study analyses the production cost of PtL products. Eight studies investigate unspecified PtL fuel production, mostly located in North Africa and the MENA region. The results of these studies exhibit similar trends to those seen for SNG, as illustrated in Figure 9. Compared to SNG, PtL shows lower process efficiency in fuel production but also lower transport costs for the products, as they are liquid and chemically similar to currently utilized energy carriers. End user price ranges decrease from 28.2 to 50.9 EURct/kWhLHV in 2020, to 24.6 to 43.4 EURct/kWhLHV in 2030, and 20.1 to 34.4 EURct/kWhLHV in 2050 (see Figure 9). The ranges of PC + TC decrease from 20.0 EURct/kWhLHV to 28.0 EURct/kWhLHV in 2020, to 10.0–20.0 EURct/kWhLHV in 2030, and 8.0–19.1 EURct/kWhLHV in 2050. The PC range of PtL fuel costs in 2050 also decreases to 5.1–13.9 EURct/kWhLHV, which is a competitive cost value to energy carriers with significantly higher synthesis efficiencies like H2. For domestic production, three cost ranges were extracted that show a decreasing cost range for PC + TC from 22.1 to 26.2 EURct/kWhLHV in 2030 to 14.0 to 29.0 EURct/kWhLHV in 2050. Both cost ranges are significantly higher for domestic production compared to imported fuels due to a lower FLH of RES and more conversion losses in the supply chain. The PC cost range for 2050 of 16.1 EURct/kWhLHV to 19.2 EURct/kWhLHV indicates uncompetitive domestic production costs for PtL.
Finally, in order to analyze the observed cost ranges of H2, SNG, and unspecified PtL fuels, Figure 10 compares the import cost ranges of the different energy carriers. With respect to the PC for all three energy carrier types, strong cost reductions are expected. According to the analyzed studies, H2 is the cheapest energy carrier, with a cost range of 3.5–10.9 EURct/kWhH2,LHV, whereas SNG has a cost range of 5.3–11.8 EURct/kWhSNG,LHV, with the unspecified PtL fuels exhibiting a range of 5.1–13.8 EURct/kWhLHV. For PC + TC, these ranges increase to 5.3–11.8 EURct/kWhH2,LHV for H2, 8.0–14.2 EURct/kWhSNG,LHV for SNG, and 8.0–19.2 EURct/kWhLHV for unspecified PtL. The lower bounds of PC + TC converge with 5.1, 8.0, and 8.0 ct/kWhLHV, respectively. For PC + TC + T/L, the ranges further increase to 12.2–18.4 EURct/kWhH2,LHV for H2, to 16.8–28.8 EURct/kWhSNG,LHV for SNG, and to 20.1–4.4 EURct/kWhLHV for PtL fuels. In 2050, the PC range of SNG and PtL fuels is characterized by a larger spread in comparison to H2, due to longer process chains with CO2 input, which strongly differs for different CO2 sources. Multiple varying assumptions produce the spread of cost ranges. The CAPEX of electrolysis differ and have a strong influence on energy costs. Politically-insecure export regions also lead to higher capital costs and increasing interest rates, from 4% to 12% WACC, due to higher investment risks. This disadvantages SNG and PtL fuel production because of higher total investment costs compared to H2. The investment costs for DAC technology, if used, further increase the total investment. From an energetic perspective, the increased demand for RE of around 700 kWhel/tCO2 used for DAC is moderate [92]. However, the CAPEX for DAC technology is high, at 1.416 EUR/tCO2/a in 2020, and decreasing to 1.033 EUR/tCO2/a in 2050 [92], resulting in high capital costs for realizing carbon-neutral e-fuels. On the other hand, transportation expenditures, as well as the uncertainty of transport costs for H2 via pipeline or vessel as a result of the technical developments still required, constitute a weakness of the H2 value chain.

3.4. Interim Conclusion

This section showed, that, even if biomass-based fuels are beneficial from an economic view, caused by the limited potential of these, other alternatives are needed additionally. Additionally, the ILUC risk of biomass-based fuels should be considered. The alternative fuels H2, synthetic or biomass-based CNG/LNG, methanol, DME, MtG gasoline, FT diesel, and kerosene, as well as HVO have been identified in this sections as the best options analyzing the technological readiness of the production pathway as well as the production costs. FT products and synthetic natural gas have the disadvantage of, in comparison, higher production costs. Biomass-based ethanol is also beneficial from this section’s analyzed criteria.
Furthermore, the cost analysis showed the insecurities around the regarded cost level production costs, cross-border prices, and end user prices in the current research landscape. Cost insecurity increases with the predicted range and length of the value chains. At present, cost comparisons indicate that lower production costs of H2 are nearly compensated by higher transport costs in comparison to other fuels that offer existing infrastructural compatibility. Furthermore, the domestic production of H2 is considered cost-competitive to LH2 imports.

4. Assessment of Alternative Fuel Utilization

After investigating the production and costs of alternative fuels, the following sections focus on their utilization on the vehicle side. First, existing regulations are reviewed with consideration to maximum official and experimental blending rates. Second, the achievable range of the fuel–drivetrain combination will be reviewed considering lower heating values and TtW efficiencies.

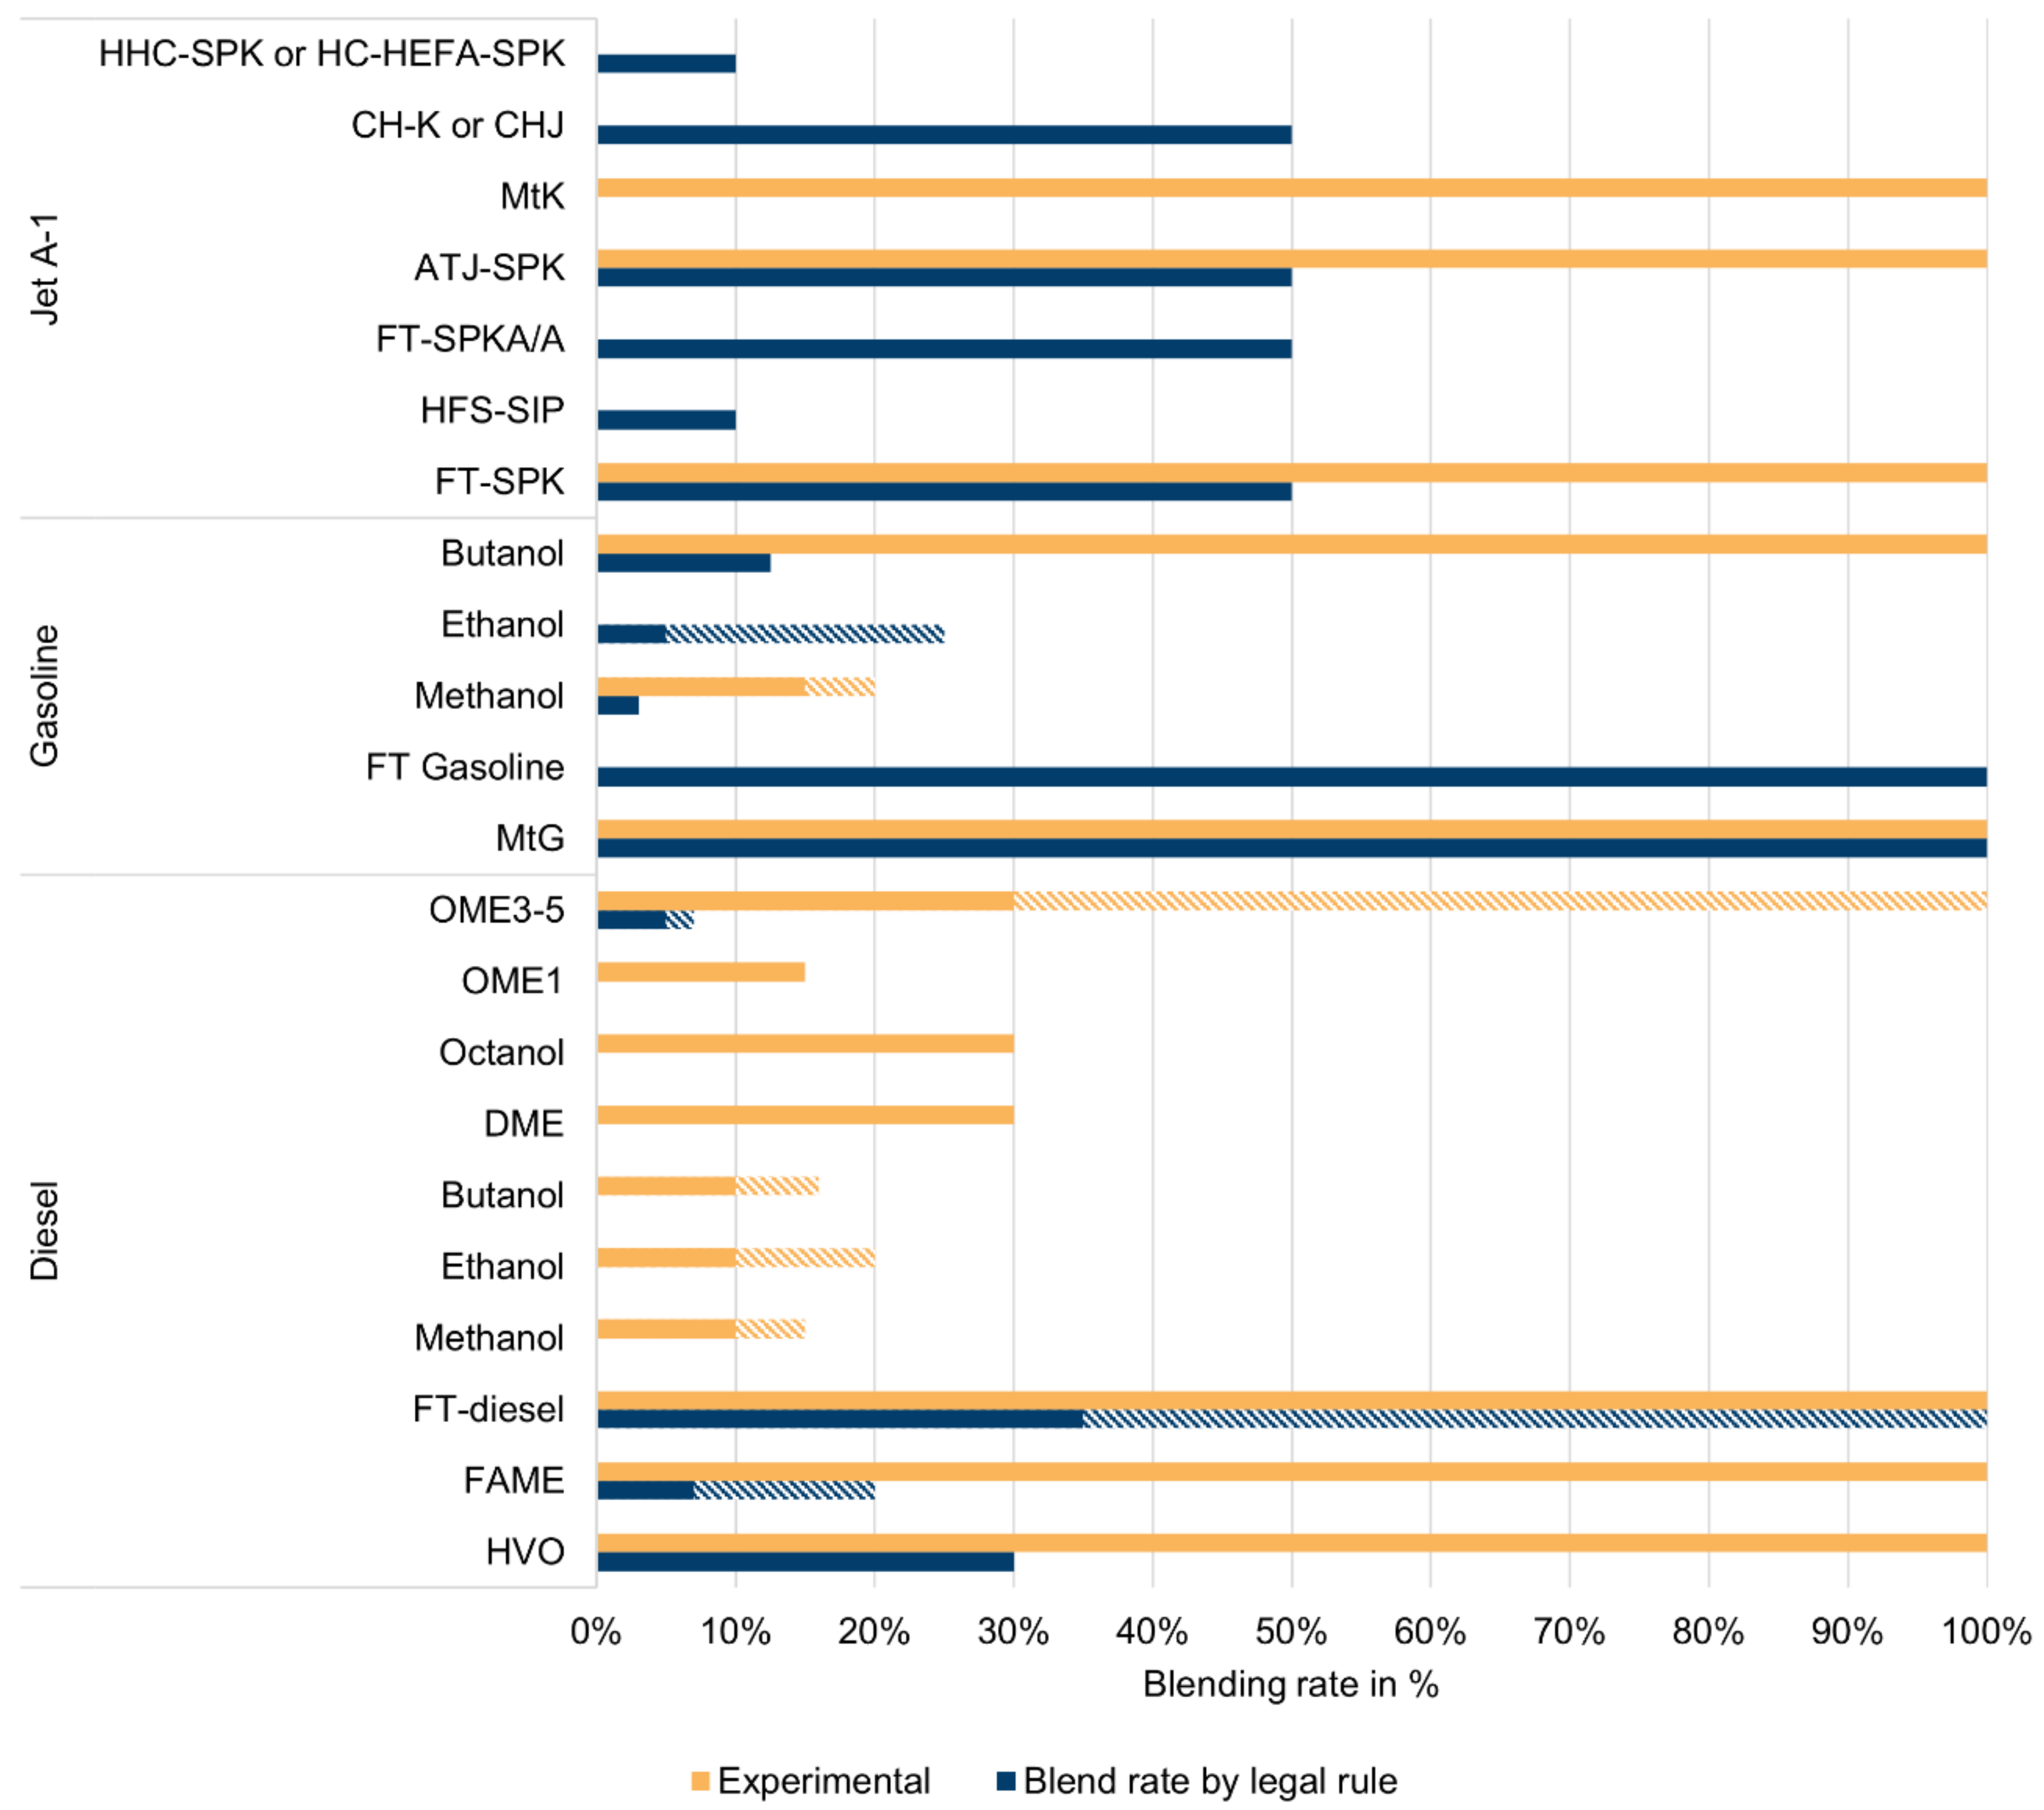
4.1. Drop-In Possibility of Alternative Fuels

Conventional diesel fuels in Europe are regulated by DIN EN 590 [114], whereas conventional gasoline fuels are certified with DIN EN 228 [115]. Sustainable aviation fuels are certified by legal rule ASTM D7566-20b [58]. The Drop-In possibility in the existing vehicle fleet in this study was assessed through blending percentages by legal rules or experiments. Fuel blends that fulfil special legal rules but require the approval of the manufacturer or are not classified in the literature for most vehicles in the fleet are also listed as experimental. The results are shown in Figure 11. The intervals are striped, similar to those for the TRL assessment. Flexfuel and Dual-Fuel concepts are not included in this chapter, as a new vehicle or retrofit of an existing vehicle is necessary.
As previously noted, the blending of sustainable aviation fuels with conventional kerosene is regulated by legal rule ASTM D7566-20b [58]. Sustainable fuels and their common abbreviations are listed in Table 3. Methanol-to-Kerosene processes are limited by the low share of aromatics. However, 100% ATJ-SPK was used in an engine by Schripp et al. [116] and they did not observe major problems during the operation. Meanwhile, fully synthetic Coal-to-Liquid kerosene manufactured by Sasol in South Africa has been certified by the UK Ministry of Defence, Defence Standard 91-91, and has also been recognized by the ASTM D1655 [117,118]. Coal-to-Liquid kerosene should be equal to FT-SPK because both fuels are produced via the FT process. Subsequently, neat synthetic kerosene is fully used in British military aircraft since 2008 [119]. According to Bauen et al. [120], synthetic FT kerosene can, in principle, be used in any blend ratio for jet fuel. Schmidt et al. [62] concluded in their review that 100% Methanol-to-Kerosene could theoretically replace Jet-A1 by 100%, but the process was not commercialized and the product fuel was never subject to the approval procedure of the American Society for Testing and Materials (ASTM).
The maximum blending shares are 50% for FT SPK, 50% for HEFA SPK, 10% for SIP, 50% for SPK/A, and 50% for ATJ-SPK [58]. Blending rates of synthetic kerosene obtained via the FT and MtK process are limited through its aromatic compounds. Besides aromatic compounds, the limitation of the oxygen content is another challenge of synthetic kerosene [137].
For gasoline fuel, the highest blends are possible with FT gasoline and synthetic gasoline through the MtG process (see Figure 11). Schemme et al. [4] state that 100% MtG gasoline fulfills EN 228, whereas Bauen et al. [120] state that MtG gasoline can, in principle, be used as a substitute, in any blend ratio, for gasoline. Blending conventional fuel with high shares (100% assumed in Figure 11) of FT-gasoline still fulfills EN 228 according to Kramer et al. [109]. In the case of alcohol-based alternative fuels as blends for conventional gasoline, methanol-based blends of up to 3% or ethanol blends of up to 5% and 10% are covered by DIN EN 228 [115]. Higher blends of up to 15% ethanol or 12.5% butanol are also possible in the United States under the legal rules ASTM D4806-13a [121] and ASTM D7862-13 [122]. The INWL [123] reports that gasoline–methanol blends of up to 15% are usable in conventional engines and up to 20% in modern engines. Wei et al. [124] have researched the impacts of pure butanol in an SI engine in a test rig.
For CI engines, the highest blending permitted by legal rule is possible for FT diesel. According to Kramer et al. [109], blending of up to 35% fulfills EN 590, whereas United States legal rule ASTM D975-20c [125] covers 100% FT diesel utilization. FT diesel is certified in Europe by legal rule DIN EN 15940 [126]. Bauen et al. [120] state that in theory, up to 100% FT diesel could be used as a substitute for conventional diesel. The biomass-based alternative diesel fuel FAME can be blended into diesel at 7% in Germany under DIN EN 590 [114]. FAME is classified in the United States by ASTM D7467-20a [138] and can be blended with conventional diesel in concentrations of 6–20%. In Europe, the blending of conventional diesel with FAME is possible with shares of 20, 30, and 100% under the legal rules DIN EN 16734 [139], DIN EN 16709 [127], and DIN EN 14214 [128], if the blends are approved by the vehicle manufacturer. HVO blending of up to 30% fulfills EN 590 according to Bohl et al. [129]. Meanwhile, Kuronen et al. [130] report usage of 100% HVO in city buses. Up to 10% methanol was also used as a diesel blend in a CI engine by Damyanov [133] and up to 15% by Sayin et al. [131]. Damyanov [133] reports the utilization of diesel–ethanol blends of 10% and 20%. Furthermore, Damyanov [133] describes usage of diesel–butanol blends of 10% and 20%, whereas Sayin [132] reports a 10% share of butanol in a diesel–butanol blend. Bauen et al. [120] state that in the United States, standard waterborne engines with diesel–butanol blends of up to 16% (iB16) have been tested. In the case of octanol, Rajesh Kumar et al. [134] report the use of a 30% octanol–diesel blend. The alternative fuel OME1 was tested in a vehicle with engine modifications on the road as a 15% OME1–diesel blend by Continental [135]. OME3–5 as a diesel blend fulfills EN 590 with a maximum OME3–5 share of 5–7% [136]. However, Beidl et al. [136] report OME3–5-diesel blends with OME3–5 shares from 30–100%.
Overall, blending rates of up to 100% are possible for synthetic aviation fuels, although these are limited to 50% by legal regulations. Based on the literature reviewed in these sections, blending of up to 100% synthetic gasoline from the MtG or FT processes in the existing vehicle fleet is possible (see Figure 11). High blending percentages in conventional diesel fuels can also be achieved with FT diesel, HVO, and FAME.

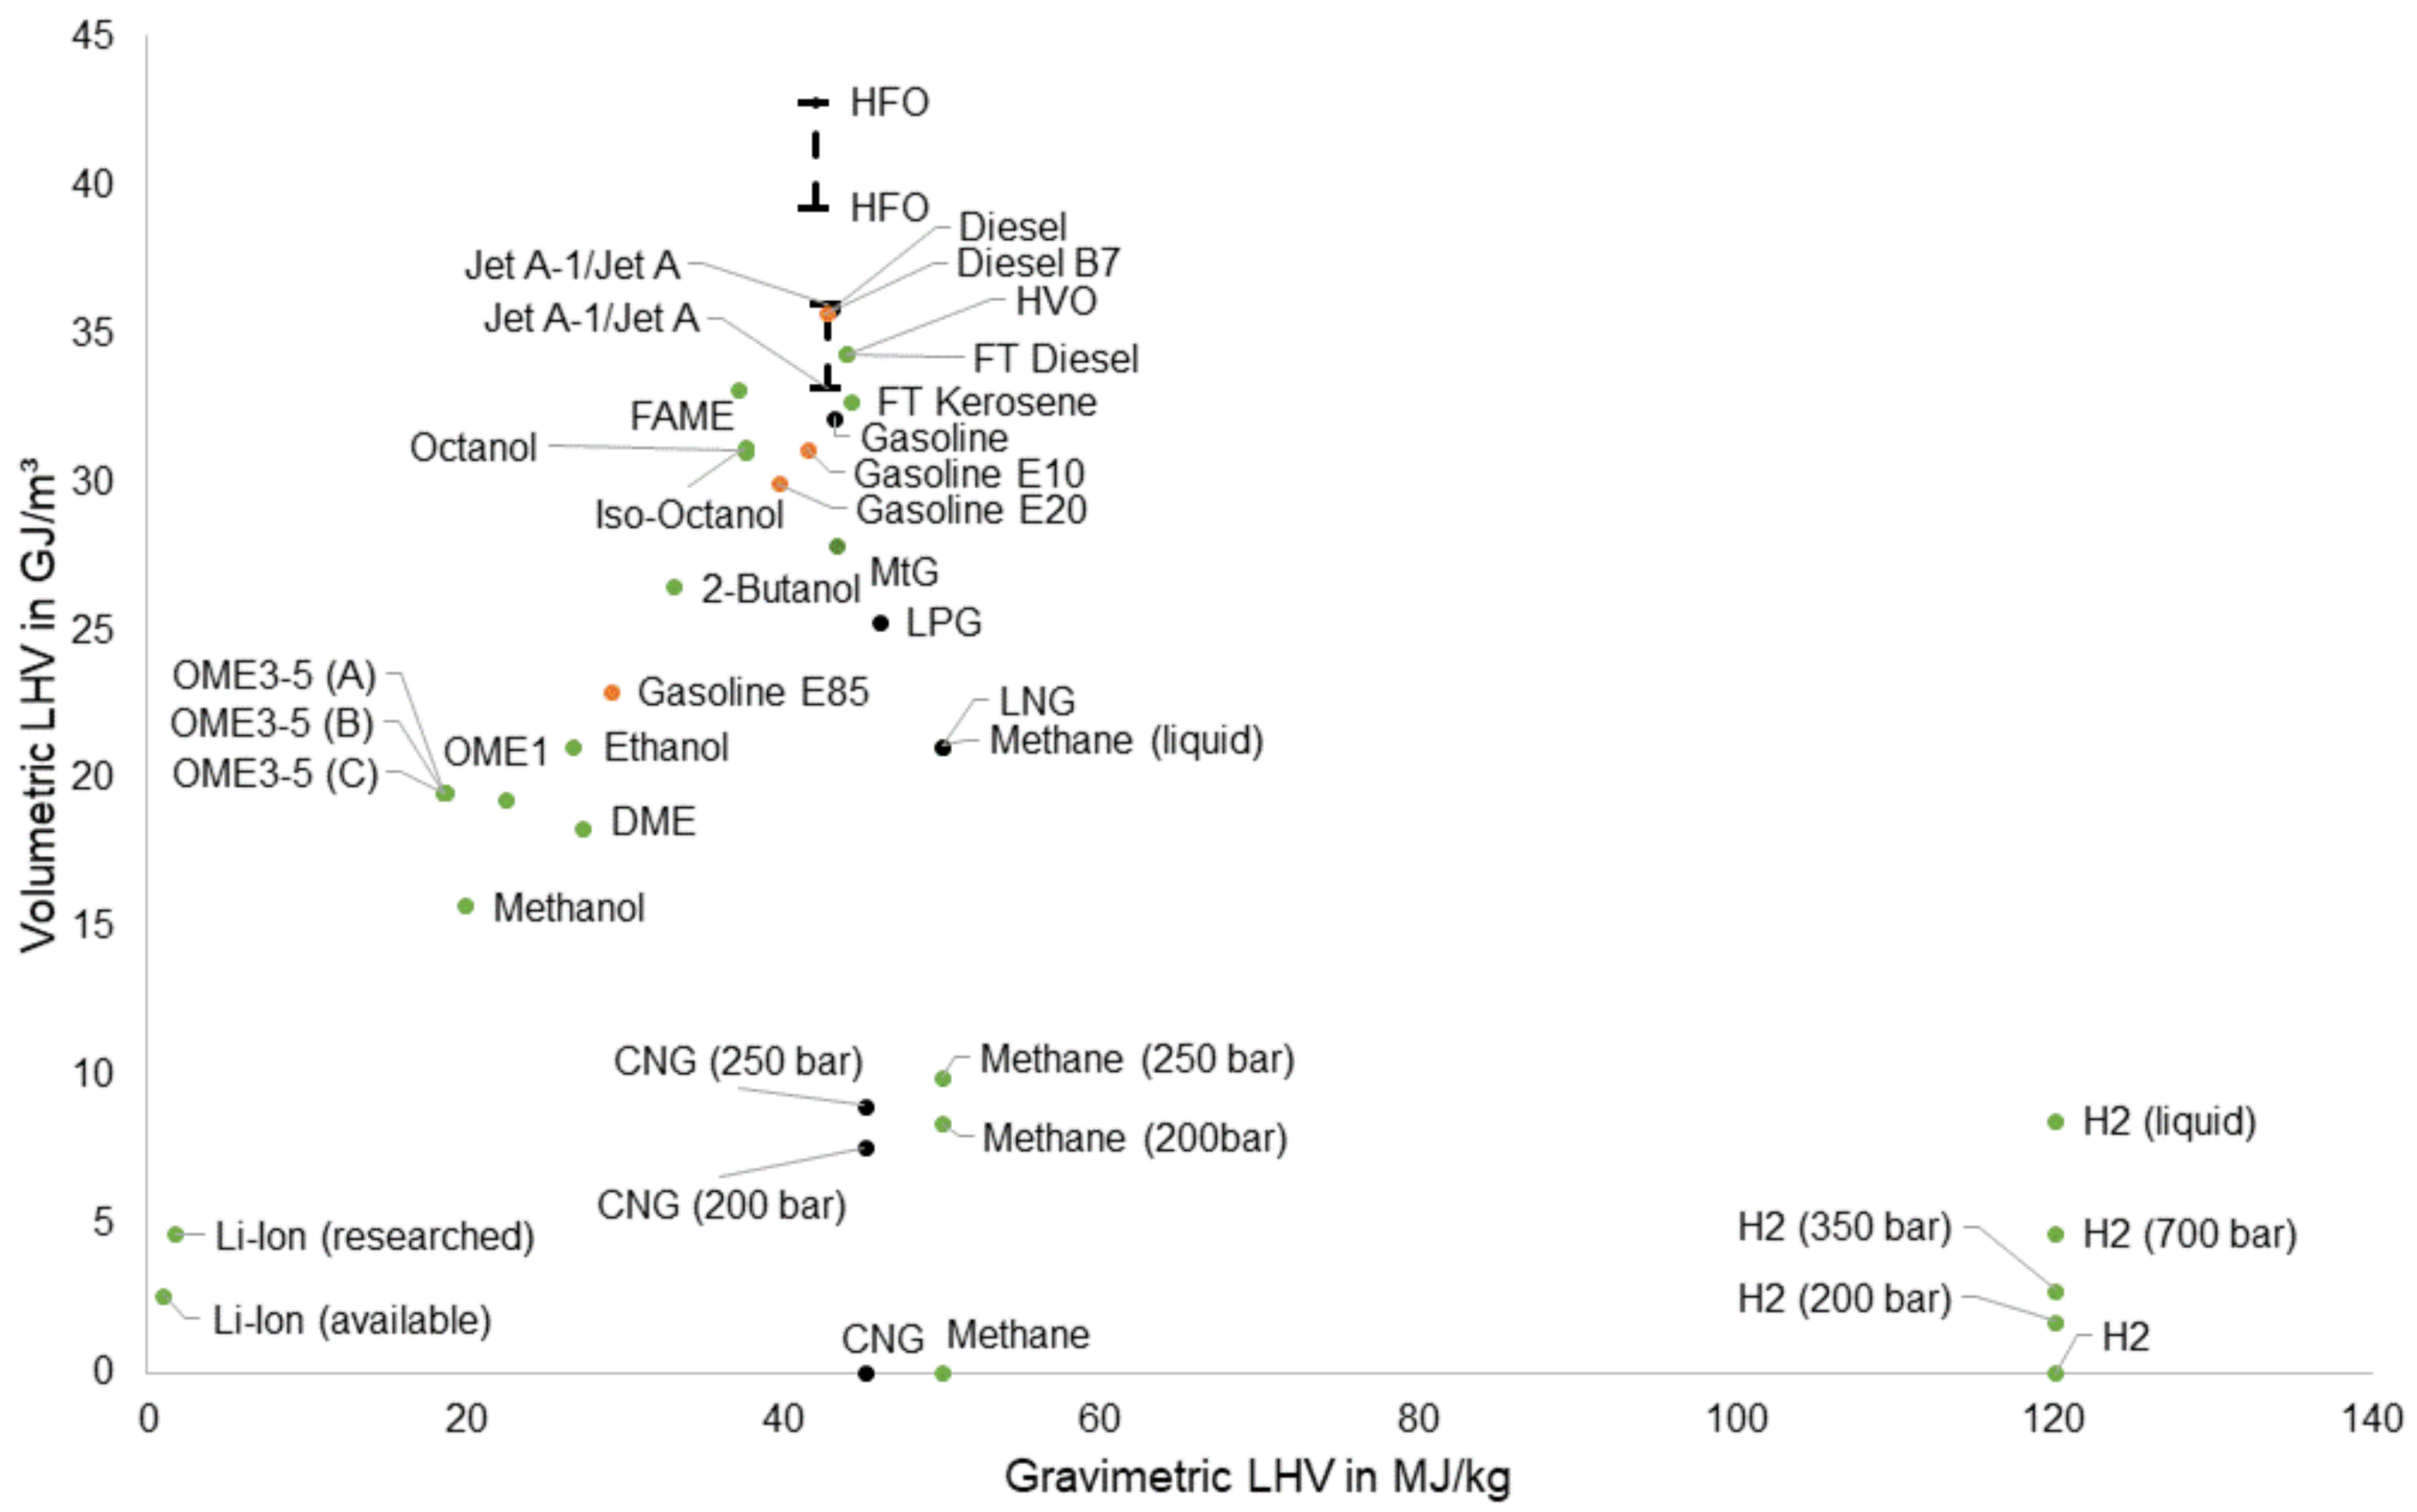
4.2. Heating Value of Alternative Fuels

The reachable mission range of a vehicle primarily depends on TtW or tank-to-propeller efficiency, as well as the gravimetric and volumetric energy density of the fuel and engine load behavior of the respective vehicle. Efficiency as a function of the engine load varies widely for the different drive systems. In this section, the heating value of the different alternative fuels will be discussed. The TtW efficiency of different vehicles in road, air, rail, and inland waterway transport will be discussed in dedicated sections for each mode of transport.
Figure 12 shows the gravimetric and volumetric energy densities of different conventional and alternative fuels. Aside from the energy density, the TtW efficiency is equally important for the possible mission range of vehicle applications. As the TtW efficiency strongly depends on the application and engine loads, it will be discussed separately for each vehicle class in the upcoming sections. Figure 12 depicts the superiority of liquid fuels with respect to volumetric energy density, whereas hydrogen has by far the highest gravimetric energy density, with 120 MJ/kg. The highest volumetric densities feature the heavy fuel oil, Jet A-1, and diesel with 39–43 GJ/m3, 33–36 GJ/m3, and 36 GJ/m3. Biodiesel, synthetic FT diesel, synthetic MtG gasoline, liquified petroleum gas (LPG), and the higher alcohols octanol and butanol are all in the range of 25–34 GJ/m3, whereas the volumetric energy density of the remaining liquid fuels LNG, OMEx, DME, gasoline E85, and the lower alcohols ethanol and methanol are within the range of 16–23 GJ/m3. Methanol has the lowest volumetric energy density of the liquid fuels at 16 GJ/m3 and the second lowest gravimetric energy density. Only OME3–5 has a lower gravimetric energy density in the field of liquid fuels, with about 19 MJ/kg. Liquid hydrogen, which is a gaseous fuel but stored in liquid form, has a volumetric energy density of 8 GJ/m3. For gaseous fuels, the gravimetric energy density strongly depends on the pressure. CNG has a volumetric energy density in the range of 36 MJ/m3–9 GJ/m3, whereas hydrogen has a volumetric energy density of 10 MJ/m3–5 GJ/m3. However, batteries have the lowest gravimetric and volumetric energy densities, with 0.94 MJ/kg and 3 GJ/m3, respectively. Even the batteries at the research level of development have, with 1.71 MJ/kg and 5 GJ/m3, low values. In particular, the high gravimetric energy density suitable for applications like air transport is strongly limiting, which will be discussed in detail in the air transport section.

4.3. Drivetrain Efficiencies

In this section, the maximum TtW efficiencies and, if possible, the TtW energy consumption of different applications, will be discussed. Table 4 provides a general overview of the TtW efficiencies of different powertrains. In general, BEVs have the highest efficiency, at 81–95% [109,151], followed by fuel cell–electric vehicles with 49–62%. Aircraft turbines have maximum efficiencies of about 50% [152], whereas ship engines can achieve around 44–56% [153]. Low efficiencies can be found in small two-stroke engines with about 24% [153]. Notable is also the increasing consumption with lower temperatures. The consumption of BEVs increases in winter by about 50%, whereas that of conventional engines only increases by about 10% [154]. However, the stated efficiencies are maximum efficiencies. Efficiencies during utilization of the powertrains will strongly depend on the field of application. The different propulsion systems have strongly differing part load behaviors. The fuel cell system has its maximum efficiency with 10–20% load, which slightly decreases after that point until 100% load [155]. Diesel engines have low efficiencies that increase with increasing loads and a maximum efficiency at approximately 100% load [97]. The efficiency–load curve of electric engines is similar to that of fuel cell systems, with the difference being that the efficiency of electric engines will not decrease with increasing load but remain constant [156].
The consumption values of the different vehicle classes, therefore, depend, on the one hand, on the operating behavior of the vehicle class and, on the other, on the load behavior of the vehicles. The following sections discuss the efficiencies of the different technology options when used in road, inland waterway, rail, and air transport.

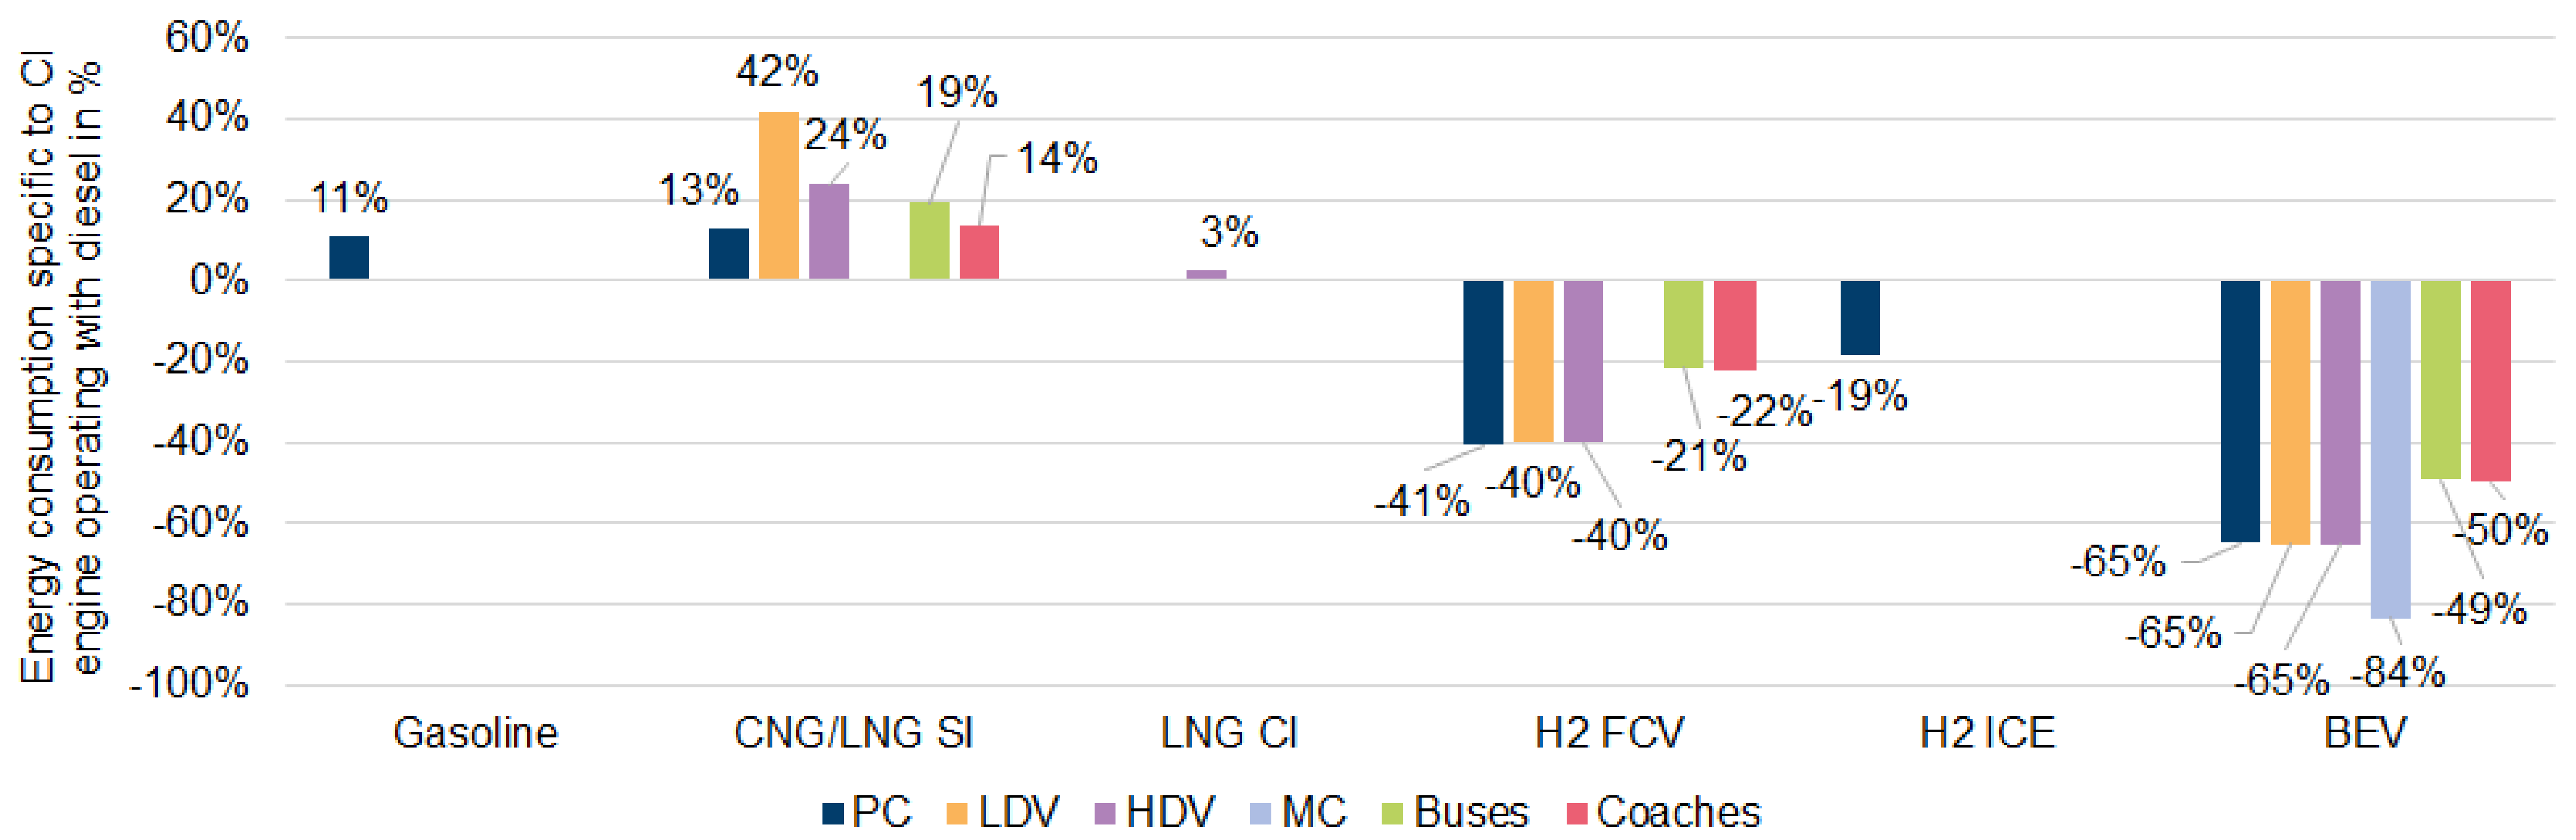
4.3.1. Road Transport

Figure 13 shows the energy consumption of different drivetrain–fuel combinations for passenger cars (PC), light duty vehicles (LDV), heavy-duty vehicles (HDV), buses and coaches based on Helgeson and Peter [32] and HBEFA 4.1 [159]. These consumption values are averages and include the average operating behavior of the different vehicle classes. The consumption values are always referenced to the diesel value of the respective class, with motorcycle values being the exception. These are referenced to the motorcycle gasoline value. Gasoline-powered light duty vehicles are excluded in Figure 13. As can be seen in Figure 13, the battery–electric drivetrain features the highest consumption reduction, at 50–65% compared to conventional diesel engines for coaches, buses, PC, LDV, and HDV, whereas electric motorcycles (MC) feature an 84% consumption reduction compared to conventional gasoline-powered MC. Fuel cell–electric vehicles offer a consumption reduction of about 40% for PC, LDV, and HDV, and about 22% for coaches and buses. This difference could also arise from the different literature sources. For coaches and buses, the reduction was calculated on the basis of EURO VI diesel vehicles in HBEFA 4.1 The utilization of CNG or LNG in a gas engine leads to a higher general energy consumption [160]. For LDV the energy consumption increases to about 42%, whereas for PC, coaches, buses, and HDV, the consumption increases by around 13–24%. The utilization of dual-fuel, high pressure direct injection diesel engines, using CNG or LNG and a small amount of diesel, leads to a 3% increase in energy consumption. Hybrid technologies have the potential to reduce energy consumption, but this reduction strongly depends on the electric mode driven range and also on the vehicle’s consumption profile. Drawing on values calculated for 2020 by Helgeson and Peter [32], plug-in hybrid drivetrains could reduce energy consumption by 20–43% for diesel-hybrid vehicles and by 31–50% for Otto-hybrid ones. For gas-engine hybrid vehicles, the reduction potential is between 28% and 72%. The operation of fuel cell electric vehicles as plug-in hybrid vehicles can reduce the energy consumption by about 15%. For BEVs, the energy consumption is primarily influenced by the maximum mission range and battery size, respectively. Weiss et al. [161] state that the energy consumption of BEVs is primarily influenced by vehicle mass. According to Weiss et al. [161], a 10 kWh increased battery capacity leads to an increase in PC mission range of 40–50 km, whereas energy consumption increases by 0.7–1 kWh/100 km. Helgeson and Peter [32] forecast the development of different drive systems for PC, LDV, and HDV. They forecast a strongly decreasing energy consumption for CNG, gasoline, and diesel, as well as CNG-hybrid-powered PC. For LDV, the energy consumption of diesel, diesel-hybrid, and fuel cell drivetrains decreases, whereas for HDV the energy consumption of the diesel engine and the CNG/LNG-powered dual-fuel engine is decreasing.

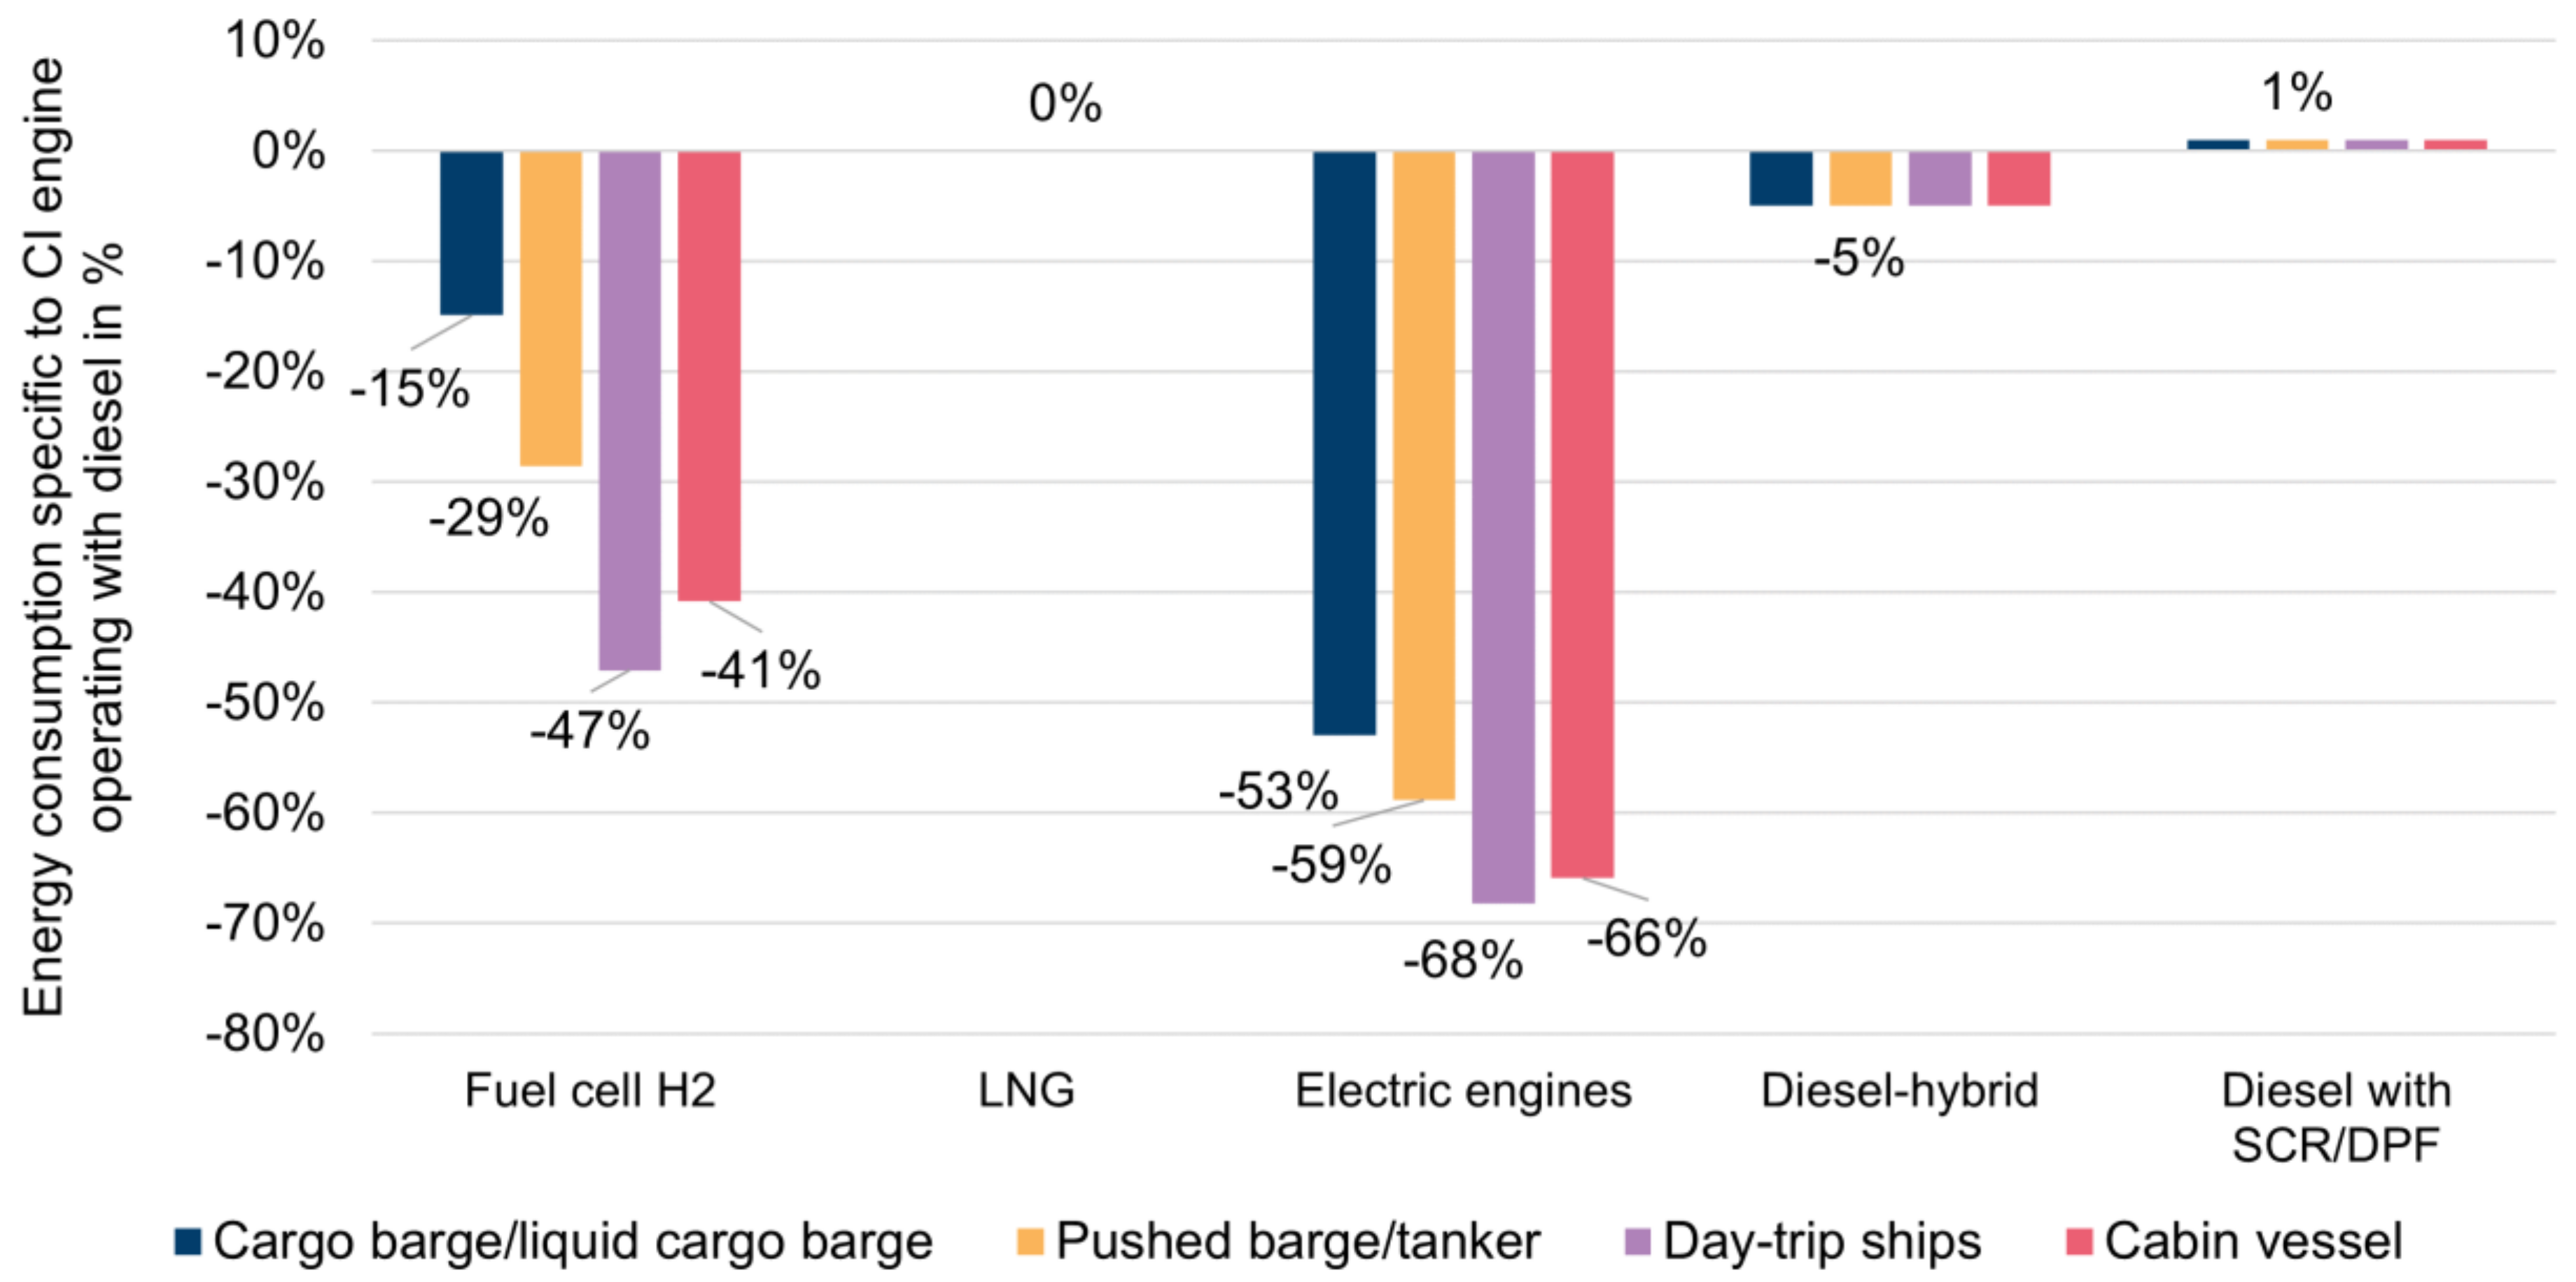
4.3.2. Inland Waterway Transport

In inland waterway transport, mostly diesel engines with higher RPMs are used. These engines have a maximum efficiency of 44% [153], whereas electric drivetrains have maximum efficiencies of 85% [109]. These values were used to estimate energy consumption. For LNG, diesel-hybrid and diesel with selective catalytic reaction (SCR) and diesel particulate filter (DPF) after treatment were also no class-specific values used. Otten et al. [162] state that diesel ships with SCR/DPF consume 1% more energy in comparison to conventional ships classified by the old emission regulation of the Commission for the Navigation of the Rhine (CCNR2), whereas diesel-hybrid ships consume 5% less. Efficiencies for inland waterway fuel cell ships were obtained from Zerta et al. [155].
The resulting energy consumption reductions are presented in Figure 14. The fuel cell drivetrain exhibits the largest energy consumption reduction for day-trip ships (47%) and cabin vessels (41%), and smaller reduction values for pushed barges/tankers (29%) and cargo barges/liquid cargo barges (15%). A possible explanation for this could be the load management of the different ship classes. The fuel cell drive has its peak efficiency at about 20% load and then slightly decreases linearly until 100% load is reached, whereas conventional diesel has low efficiencies with low loads and a peak efficiency of around 40%, with high loads close to the maximum [155].
Similar reduction values are shown in Figure 14 for the energy consumption of electric engines. Day trip ships and cabin vessels exhibit the largest reductions with 66% and 68%, respectively, followed by pushed barges/tankers and cargo barges/liquid cargo barges with 59% and 53%, respectively. The assumption of a constant efficiency of 85% for battery propulsion is likely appropriate, as the efficiency–load curve of electric motors >75 hp is already close to maximum efficiency at low loads [156]. According to Otten et al. [162], ships running on LNG will probably have roughly the same energy consumption as conventional CI engines running on marine gas oil. This assumption seems fairly optimistic, as according to the studies of Bünger et al. [160], modern internal SI combustion engines in gas operation can achieve maximum efficiencies of 90–95% relative to the efficiency of a comparable diesel engine.

4.3.3. Rail Transport

In rail transport, in addition to conventional operation with catenary lines or diesel-electric drivetrains, there are three alternative drive systems: (1) Diesel–electric hybrids; (2) battery–electric hybrids; and (3) fuel cell–electric. One alternative for rail transportation is the diesel–battery hybrid drivetrain mentioned above. Alstom developed the Alstom H3 shunting locomotive with a diesel engine and an additional battery. The battery is charged during low-load operation and provides energy during high-load operation, which reduces energy consumption by up to 50% [163]. A similar technology is utilized in electric trains with additional batteries. These additional batteries enable the trains to operate in battery–electric mode on rail sections without catenary lines. The batteries are loaded on sections equipped with catenary lines. Bombardier developed the prototype, BOMBARDIER TALENT 3, which is produced in low production volumes and has an electrical mission range of 40 km [164]. 21 trains of that type are, for instance, used on three train lines in Germany [165]. With the next generation, the mission range should increase by up to 100 km [164].
Another hybrid technology is the diesel–air pressure technology, where brake energy is saved in the form of compressed nitrogen. This technology offers a lower energy consumption and less additional weight compared to the other mentioned hybrid technologies. However, the maximum lifetime of the pressure tanks is 25 years [166]. This technology will not be investigated further in the following.
Hydrogen fuel cell trains are another promising technology for the rail transport sector. The fuel cell pilot train Alstom Coradia iLint is already operating in Lower Saxony, Germany [167]. It has a mission range of 1000 km and approximately the same weight as a conventional diesel train [167]. For comparison, the mission range of conventional diesel passenger trains, such as the Alstom Lint 54 and Alstom Lint 41, is about 1200 km [168]. Plank-Wiedenbeck et al. [168] reported that the Alstom Corodia iLint consumes about 0.18–0.25 kgH2/km and a conventional equal diesel train about 1–1.8 l/km. This results in 7173 Wh/km for the hydrogen train and 13,945 Wh/km for the diesel one. The Alstom Corodia iLint is mostly comparable to the train class S-Bahn. Deutsche Bahn AG [169] reported the energy consumption of an electric and diesel S-Bahn to be 22 Wh/Seat-km and 60 Wh/Seat-km, respectively. In total, this enables a 63% energy consumption reduction for electric trains and a 49% reduction for fuel cell ones. As already noted, diesel-electric hybrid trains have the potential to reduce fuel consumption by 50%, but this only applies when using them as shunting trains. The reduction in energy demand of the different alternatives is summarized in Table 5, below.

4.3.4. Air Transport

As a result of the low technical maturity of the alternative propulsion systems for air transport (see Roland Berger [170] and McKinsey & Company [28]), studies on energy consumption amongst aircraft are limited. Seeckt and Scholz [171] compared the combustion of conventional kerosene and hydrogen in the aircraft classes jets and turboprops. Using hydrogen in a turboprop aircraft reduced energy consumption by 5%, whereas it increased energy consumption in the jet by about 3%. According to Roland Berger [170], fuel cell propulsion systems have efficiencies about 45–50%, combined with a 55% fuel cell efficiency and 90% electric powertrain efficiency. In contrast, hydrogen combustion propulsion systems have a 40% efficiency [170]. However, other sources combine a 65% fuel cell efficiency with an 85% electric powertrain, leading to a 55% fuel cell system efficiency (see Table 4). Aircraft turbines have an efficiency of about 50% [152]. As a result of the lack of information regarding energy consumption, air transport TtW efficiency is assessed by the evaluated engine efficiencies, which are summarized in Table 6.

4.4. Interim Conclusion

This section shows the high compatibility of the alternative fuels FT diesel, FT kerosene, and MtG. The same accounts for FAME, HVO, and others via the FT process produced aviation fuels with already existing vehicles. It also highlights the necessity of the ASTM approval of higher blending rates for FT and MtK kerosene.
The analysis of the heating values highlights the superiority in the case of the volumetric energy density of the liquid fuels. Liquid fuels, which match with the first selection of fuels in Section 3 are FT diesel, MtG gasoline, HVO, FT kerosene, synthetic or biomass-based LNG, DME, and methanol. The volumetric energy density of the promising fuels synthetic or biomass-based SNG and H2 is lower, while the energy density of the batteries is by far the lowest.
Furthermore, it was shown, that the drivetrain efficiencies of the battery–electric drivetrains are always the highest in the considered four sectors, followed by the fuel cell–electric drivetrain. Natural gas-based internal combustion engines lead to higher energy demand in road transport. It was also shown, that the highest energy consumption reduction can be achieved using electric drivetrains in vehicle classes, which have a high share of dynamic operation. These are motorcycles, passenger cars, light duty vehicles and buses in road transport and the passenger transport in inland waterway transport.

5. Environmental Impacts of Promising Alternative Fuels

In addition to the techno-economic assessment, alternative fuels still require environmental assessments to realize their potential and identify sustainable pathways. In Germany, the transport sector accounted for around 150 million t CO2eq of emissions in 2020, despite less travel due to the COVID-19 pandemic [172]. This corresponds to a share of just under 20% of total greenhouse gas emissions in Germany. After the energy industry, the transport sector is, therefore, the largest emitter of greenhouse gases. Against the backdrop of climate change, the finite nature of fossil resources, and damaging local environmental impacts, the transport sector must therefore change significantly from its previous structure. For example, the tightening of carbon dioxide fleet limits by the EU at the beginning of 2019 has prompted numerous car manufacturers to focus more on alternative drivetrain concepts in their portfolios [173]. Not only new drive concepts but also alternative fuels are gaining importance in Germany, as well as globally, due to the outlined ecological imperatives. The global production of biofuels, therefore, reflects continuous growth since 2006 [174]. In addition to biofuels, electricity-based fuels and vehicle concepts offer the possibility of reducing the environmental impacts of the transport sector. In order to be able to make statements regarding the extent to which the substitution of fossil fuels with alternatives can reduce harmful environmental impacts, numerous analyses have been carried out in recent years. Some environmental assessments of fuel supply have been designed as so-called well-to-tank (WtT) studies. Another and very well-established method for the ecological analysis of fuels is the life cycle assessment (LCA), which is an environmental assessment procedure that is also standardized by DIN ISO 14040 [175] and 14044 [176].
A study by Moro and Helmers [177] clearly addresses the differences between WtT and well-to-wheel analyses, as well as LCAs. Therefore, WtT is understood as the energy input for the production, transportation, and distribution of fuels. Thus, these studies focus on the fuel supply pathway alone. However, emissions and the environmental impacts caused by them that relate to the construction and disposal of exploration, energy conversion, and vehicle technologies are left out of consideration. The WtT analysis is therefore characterized by the fact that it represents a relevant subset of the environmental impacts of fuels, as well as being easier to prepare and interpret. In an LCA, these other elements of the fuel supply can also be taken into account.
Literature reviews have been published focusing on both forms of environmental assessments of fuels, addressing results and trends from a wide range of earlier publications.
In the present study, the alternative fuels H2, CNG/LNG, methanol, DME, MtG gasoline, FT diesel, and kerosene, as well as HVO, have been considered promising from a multi-layered techno-economic perspective. Thus, the key and general findings on environmental performance described below refer to these fuels.
The literature overview presented herein includes the environmental impacts of promising alternative fuels considering LCA results, as well as the WtT results with regard to the impact category climate change and the indicator of global warming potential (GWP 100a) in kg CO2eq. For each result, it is clearly described what form of the two environmental assessment methods is being referred to. The focus is clearly on the consideration of LCA results. Nevertheless, some WtT studies provide interesting and valuable additional insights. For further environmental impact categories, only LCA results were taken into account. In addition to the results for climate change, the present overview of environmental impacts includes the following further impact categories and indicators: the category of acidification and the indicator of acidification potential (AP) in g SO2eq/MJ; the category of eutrophication and the indicator of eutrophication potential (EP) in g PO4eq/MJ; the impact category of summer smog and the indicator of photochemical ozone creation potential (POCP) in g C2H4eq/MJ; the category of ozone depletion and the indicator of ozone depletion potential (ODP) according to g CFC-11eq; and, finally, the impact category particulate matter in this case, with the corresponding indicator < 10 μm (PM10).
An overview of the WtT GWP results of different bio- and electricity-based fuels from 94 publications was presented in a study by Naumann et al. [174]. Drawing on the large number of results presented in the literature review, Figure 15 is limited to a subset of the fuels identified as promising in this study.
According to Naumann et al. [174], the wide range of environmental impacts shown in Figure 15 is due to data- and process-related factors, as well as methodological differences. However, clearly differentiated statements for the cause of the range of environmental impacts are lacking. Accordingly, on the basis of this literature analysis, it can be stated that large differences are possible depending on the design of the fuel supply and the assumptions made. However, trends regarding the possible advantages of fuels should not be directly derived from this. In order to obtain more differentiated findings in the manipulated variables of the environmental impacts of these fuels, the findings from the LCA literature reviews related to these alternative fuels were used in the next step, outlined below.
Koj et al. [178] identified 32 LCA concerning Power-to-X (PtX) fuels and pathways and evaluated them in a review study. In the study, a clear focus of earlier LCA studies of gaseous PtX fuels (i.e., H2 and SNG) was highlighted. The origin of the electricity used for the PtX pathways and the carbon dioxide source and capture processes were identified as crucial factors in mitigating environmental impacts. Amongst others, the literature results regarding electrolytic hydrogen production showed that there is an obvious impact of electricity supply on GWP. The use of electricity generated using from RE sources was shown to have significantly lower impacts than the use of conventional hydrogen production processes. The conventional hydrogen production technologies (steam reforming from natural gas or petroleum) led to GWP results of between 90 and 120 g CO2eq/MJ, whereas the results of electrolytic hydrogen production with wind energy could reach values of less than 20 g CO2eq/MJ. In studies where a region- or country-specific grid electricity mix was considered, large differences in environmental effects were shown depending on the geographical conditions and different associated shares of renewable and fossil-based electricity generation. Depending on the year under consideration and further assumptions, an analysis of hydrogen production based on the EU electricity mix revealed GWP results up to nearly 270 g CO2eq/MJ [179]. Therefore, from an environmental point of view, the use of electricity mixes with high specific emission factors for the production of hydrogen and fuels based on it should be avoided. In addition, the literature review includes evaluations not only for the provision of hydrogen fuel but also for the use of various fuels in passenger cars. This also includes the shares of fuel production of the electricity-based fuels SNG, hydrogen, and electricity for electric transportation in the context of total environmental impact. It also turns out that electricity inputs with the lowest possible GHG emissions should be used for fuel production. Otherwise, the contributions of fuel production to the total environmental impacts can be well over 80% and lead to no relief compared to the fossil reference [180]. For considerations up to the year 2050, it is shown that if a completely renewably-generated electricity supply is used, the contribution of fuel production to the environmental impacts per kilometer can be reduced to below 10% [181]. In addition, the literature review highlights the range and inconsistency of methodological assumptions amongst previous studies [178].
A similarly-designed review study of LCAs of PtX fuels was published by Kigle et al. [182]. The authors explicitly limited the PtX approach to consider those LCA publications that analyzed electricity-based fuels for application in the transportation sector. The literature review ultimately encompassed 23 publications. Hydrogen as a fuel was frequently analyzed in this literature review as well. The significance of the electricity input is also addressed herein. For all studies that distinguished between RE and the electricity mix as inputs in the production of electricity-based synthetic fuels, a consistent trend emerged. GHG emissions for fuels based on the electricity mix were several times higher than for fuel production based on RE. The example of methanation for SNG production was used to address the various options for accounting for the carbon dioxide required for the reaction. One of the publications considered in the review calculated a carbon dioxide credit for the carbon dioxide used in the methanation process [183]. In another study [179], the credit for carbon capture was given to the industrial plant upstream of the methanation process and operated with fossil fuels. In this instance, therefore, the environmental impact of the product of the industrial plant was reduced, but not that of the SNG. This methodological aspect is referred to as allocation and is understood as the assignment of the incoming and outgoing material and energy flows of a process or product system to the product system or technology under investigation in the case of multi-output processes [175,182].

5.1. Hydrogen

Of the promising alternative fuels considered, hydrogen production has been subject to the most environmental analysis. For example, a recent review study of the ecological effects of using hydrogen as a fuel for road transport was able to identify 72 relevant studies featuring WtT or LCA results [184]. In that literature review, a range of GWP values for WtT studies and the reference MJ could be identified. The GWP of WtT ranges from 1.6 gCO2eq/MJ to 218 g CO2eq/MJ, with a mean of 39.6 g CO2eq/MJ, were identified. The different environmental impacts of the production of hydrogen as a fuel can be caused in particular by the different pathways and technologies used for this purpose. For instance, Wulf et al. compared ten different hydrogen pathways and identified the advantageous environmental performance of electrolyzers based on proton exchange membrane electrolysis cells (PEMECs) and alkaline electrolysis cells (AECs) [185] if operated with renewable electricity in five of the six impact assessed categories. Due to these promising ecological results and the possibility of integrating renewable electricity, the technologies, and processes of water electrolysis, in particular, are considered as a form of hydrogen production in the context of future alternative fuels. The significance of the type of electricity supply for the environmental impacts of electrolysis technologies has already been highlighted by numerous individual publications and in the preceding sections based on the findings of the cited review studies. This also means that the different power consumption of the various electrolysis technologies leads to different environmental impacts. With respect to operation, water must also be noted as an important input. However, the provision of treated water only makes a negligible contribution to the environmental impacts of the GWP indicator. In addition, different material compositions are used and developed, especially for the electrolysis cells, which can result in different environmental impacts. Another factor that influences the GHG emissions caused by component manufacturing is also the lifetime of the components used. However, the contribution of component manufacturing and plant construction on the GWP indicator tends to be almost negligible. However, other environmental impacts, such as ozone depletion potential, can be very strongly influenced by component manufacturing if, for instance, polytetrafluoroethylene (PTFE) is used in the manufacturing of seals. For example, as a result of PTFE, the manufacturing phase was responsible for over 90% of the ozone depletion potential (ODP) environmental impacts for a 6 MW alkaline electrolyzer evaluated by Koj et al. [186].
Liebich et al. [9,10] discussed additional environmental impact categories for electrolytic hydrogen production in the year 2050. With respect to acidification, potential values of between 0.043 and 0.060 g SO2eq/MJ were obtained, which lie close to the value of the fossil reference 0.049 g SO2eq/MJ. The main contributions were given by upstream electricity generation, due to the steel, copper, and aluminum production necessary for power plant production. Additionally, for eutrophication, upstream electricity generation and especially the underlying use of steel, copper, and aluminum are responsible for most of the impacts. The eutrophication values significantly exceed those of the fossil reference with values of around 0.023 g PO4eq/MJ compared to 0.0090 g PO4eq/MJ. With respect to summer smog, the electrolytic hydrogen production revealed lower values (around 40% of the fossil reference). Furthermore, for particulate matter, electrolytic hydrogen production revealed lower values of around one-third compared to the fossil reference.
Hydrogen is characterized by its capability of being stored geologically prior to fuel use, if needed. This storage can be performed, for example, in salt caverns. Koj et al. [181] found that this type of storage is only responsible for minor contributions compared to other steps in the process chains.
Germany is considered a hub of electrolysis operation in numerous LCA studies (e.g., [186,187,188]). A clear environmental impact reduction is also shown in these publications for electrolysis operation with renewable energy compared to operation using the electricity mix. In addition, it was shown that Germany has a location disadvantage compared to other countries with respect to electrolysis operation when certain electricity inputs are employed. When operating electrolysis with the electricity mix, Austria and Spain perform significantly better by comparison [186]. When comparing the GWP when operating with PV electricity, the GWP for Portugal is over 40% lower than the impacts of electrolysis operation using PV electricity in Germany due to superior solar radiation conditions [188].

5.2. C-SNG/L-SNG

Methanation to produce SNG, often referred to as Power-to-Methane (PtM), from hydrogen and carbon dioxide is one of the most frequently analyzed PtX technologies from an environmental perspective. The PtX LCA review of Kigle et al. [182] identified six publications with LCA considerations of SNG [179,181,183,189,190,191]. In the LCA review by Koj et al. [178], as many as 26 publications were identified that address the environmental impacts of SNG production.
The environmental impact results of a study by Liebich et al. [9,10] have a high relevance due to the scope on Germany, assessed variants and impact categories, as well as its actuality. Furthermore, it is one of the few studies that consider SNG liquefaction (L-SNG). The study compared 12 SNG production pathways. Furthermore, different geographical scopes (Germany, Saudi Arabia, and Morocco), as well as different electricity and carbon dioxide sources and transport options, were considered. The study found for a retrospective consideration of the year 2015 typically highest contributions of electricity generation for hydrogen production on global warming potential results [9,10]. For the retrospective assessment of the year 2015, global warming potential results reach from around 10 g CO2eq/MJ to over 300 g CO2eq/MJ. The lowest value is achieved with German wind onshore as a power source, while the highest impacts are provoked by a pathway based on the German electricity mix. Compared to a fossil reference (natural gas incl. upstream) with a global warming potential of 63 g CO2eq/MJ, the results of the best pathway in 2015 corresponds to a reduction of almost 85%. Comparing C-SNG transported by pipeline with L-SNG and the transport by liquefied natural gas tanker revealed advantages for C-SNG. Taking methane emissions during the liquefaction and regasification into account, L-SNG transport provokes around 10 g of CO2eq/MJ for the L-SNG pathway. Liquefication and regasification do not necessarily have to be considered as a component of the L-SNG transport. In the JRC WtT study [192] these process steps are considered as a conditioning and distribution step of L-SNG provision. Additionally, the JRC WtT study [192] confirms a higher global warming potential for L-SNG compared to C-SNG. An assessment of the year 2050 by Liebich et al. [9,10] shows significantly lower impacts compared to the retrospective assessment of 2015. The calculated prospective global warming potential results reach from around 6 to 17 g CO2eq/MJ, with most pathways showing results in the range 7 to 15 g CO2eq/MJ. Thus, a reduction of 90% would be possible compared to the fossil reference.
The prospective global warming potential obtained by the LCA of Liebich et al. [9,10] (6 to 17 g CO2eq/MJ) is in the same range as the WtT values in the literature review of Naumann et al. [174] (see Figure 15).
With regard to different life cycle stages, the plant construction (electrolysis, carbon capture, and methanation plant) shows lower global warming potential contributions than the contributions related to plant operation [184,185].
Liebich et al. [9,10] assessed environmental impact categories beyond global warming potential for SNG production. Acidification potential values calculated for the year 2050 reach from 0. 075 to 0.26 g SO2eq/MJ. The reference value for fossil natural gas is 0.032 g SO2eq/MJ. Thus, the lowest acidification potential of the electricity-based SNG production is 130% higher than the fossil reference value. Main contributions to the acidification impacts were given by the electricity provided to electrolysis, especially steel, copper, and aluminum production for the power plants, and consumable production for electrolyzers. The eutrophication potential values vary between 0.016 and 0.073 g PO4eq/MJ. Compared to the fossil reference this is in minimum 900% higher than for natural gas as reference. Main contributions to eutrophication are given by the electricity for hydrogen production and for pathways with carbon capture from the lignite-fired power plant the required energy input. Again steel, copper, and aluminum production for the upstream power plants are primarily responsible for the eutrophication potential related to the electricity used for electrolysis. The summer smog values of SNG production, calculated for the year 2050, lie between 0.018 and 0.049 g C2H4eq/MJ, corresponding to 90 and 245% of the reference value. For many paths values between 0.025 and 0.030 g C2H4eq/MJ are given. These values are slightly larger than the reference value. Main contributions to these impacts are given by electricity generation for hydrogen production. Additionally, depending on the pathways construction of the DAC plants and LNG tanker transport show contributions of around 20% to the summer smog. Particulate matter for SNG production in the year 2050 was calculated in the range from 0.06 to 0.15 g/MJ. Compared to natural gas as a reference these particulate matter impacts are 170 to 580% higher. The highest contributions to the particulate matter impacts are given for electricity generation for electrolysis, construction of the plants, and transport by LNG tanker [9,10].
Besides C-SNG/L-SNG, fossil-based CNG/LNG is currently popular but is not covered in the overview of this work. However, an analysis of the environmental impacts of fossil-based CNG/LNG is attached in Appendix B.

5.3. HVO

Various vegetable oils can be used for the production of HVO. These oils are converted into hydrocarbons by means of a catalytic reaction with the addition of hydrogen [193].
The environmental impacts are not the same for all vegetable oils and differ significantly in some instances. An LCA study by Arvidson et al. [194] compared the HVO from rapeseed, palm oil, and jatropha. The GWP for the production of HVO from palm oil turned out to be the lowest. In addition, the GWP for HVO from all three feedstocks was found to be significantly lower than for fossil-based diesel fuel. It was also shown that the nitrous oxide emissions that entail the cultivation of the plants caused about half of the GHG emissions, and thus account for a large share of the environmental impacts. However, palm oil has been particularly criticized for a number of reasons, such as the land-use changes it causes and the associated GHG emissions, and it should therefore not be considered for the production of HVO [195]. This was also addressed in the discussion of biomass-based alternative fuels above.
The review study of Bierkandt et al. [195] notes a GHG emission reduction compared to fossil fuels for HVO and the German context based on the literature. In that publication, HVO is considered overall as an admixture available in moderate quantities in the short term, and well-suited for GHG reduction [195].
The ranges for the climate change indicator shown in Figure 15 include data for used cooking and vegetable oils. For used cooking oil, a range of 2.2–16 g CO2eq/MJ tends to show lower environmental impacts compared to the range for vegetable oil of 5–149 g CO2eq/MJ [174]. Moreover, depending on the feedstock used, the hydrogen input also varies between about 28 and 42 kg H2/t HVO, and thus so do the environmental impacts arising from the hydrogen supply [174].
The recent JRC WtT report compares the WtT GHG emissions of HVO pathways for rapeseed, sunflower, soy, palm oil, and waste cooking oil in the European context [192]. The range of WtT greenhouse gas emissions calculated in the report is extensive. The resulting emissions begin under 10 g and reach more than 80 g CO2eq/MJ if no credits are considered. The emissions of cooking oil lie at the lower end of the range, whereas soybeans tend to exhibit the highest impacts without consideration of credits. If credits are considered, most of the plant-based HVO pathways show results in a range between 40 and 60 g CO2eq/MJ. The first production step clearly dominates the impacts of plant-based HVO pathways.

5.4. Methanol

Of the promising PtL fuels considered, most environmental assessment studies focus on electricity-based methanol production (Power-to-Methanol). The PtX LCA review by Koj et al. [178] identified nine studies with LCA considerations of methanol [191,196,197,198,199,200,201,202,203]. In the LCA review by Kigle et al. [182], six LCA studies on methanol were identified [189,191,196,204,205,206]. A total of 13 studies with content on Power-to-Methanol were identified in both literature reviews.
With respect to electricity-based methanol production, a study by Liebich et al. [9,10] is especially noteworthy due to its geographical focus on Germany, the number of variants considered, and its actuality. In this recent study, a total of 20 methanol production pathways were compared. The study considered production in Germany and import from Saudi Arabia, Morocco, Iceland, and Sweden with a wide variety of electricity and carbon dioxide sources, as well as different transport options. Across the pathways considered, the study found that the provision of electricity for electrolysis upstream of methanol synthesis contributed the largest share of total GHG potential [9,10]. In addition, this also shows the decisive importance of the electricity source of hydrogen supply and a subordinate role for methanol transport [9,10]. For a retrospective consideration of the year 2015, a global warming potential of 20–25 g CO2eq/MJ was determined for some pathways. Compared to the selected reference relating to methanol from natural gas, including upstream chains with a global warming potential of 95 g CO2eq/MJ, this corresponds to a reduction of about 75%. A prospective consideration of the pathways for the year 2050 yields global warming potential results of between 8.7 and 25 g CO2eq/MJ methanol, with most pathways exhibiting results in the range 10 and 15 g CO2eq/MJ. Thus, a reduction of about 85–90% compared to conventional fuel would be possible. These values obtained by means of LCA are also in the range of the WtT GWP values for methanol, reaching from 1 to 50 g CO2eq/MJ in the literature review of Naumann et al. [174] (see Figure 15). Plant construction contributes to the environmental impacts to a lesser extent than the use of the main inputs (hydrogen and carbon dioxide) [9,10]. From another perspective, however, the relative importance of plant construction increases due to decreasing environmental impacts from its operations. The construction of carbon capture plants mostly has higher environmental impacts than the construction of the PtX plant [9,10].
Aside from GWP, Liebich et al. [9,10] assessed further environmental impact categories for electricity-based methanol synthesis. With respect to the acidification potential, values of between 0.082 and 4.9 g SO2eq/MJ were obtained. The fossil reference value was 0.052 g SO2eq/MJ. As a result, the acidification potential of electricity-based methanol fuel is a minimum of 60% higher than the fossil reference. The main contributions to the acidification impacts were contributed by the electricity generation for electrolytic hydrogen production. The high contribution of the upstream electricity generation is primarily caused by steel, copper, and aluminum production for power plant construction. The eutrophication potential values vary between 0.015 and 0.097 g PO4eq/MJ methanol depending on the pathways. Thus, also for these impact categories, methanol fuel production is accompanied by significantly higher values than the fossil reference. The eutrophication potential is at minimum 90%, and at maximum twelve times, higher than the fossil reference. The main contributor to the impacts of most pathways is the electricity generation for electrolysis and for some pathways the energy required for carbon capture. Again steel, copper, and aluminum production for power plant construction is particularly responsible for the eutrophication potential of this fuel. The summer smog impacts of electricity-based methanol were calculated to lie between 0.018 and 0.073 g C2H4eq/MJ. The impacts of many paths are between 0.025 and 0.050 g C2H4eq/MJ. Compared to the fossil reference of 0.037 C2H4eq/MJ, the methanol pathways provoke between 50 and 200% of the impacts. Again, electricity generation for electrolytic hydrogen production is responsible for the majority of the summer smog provoked by methanol synthesis. However, the construction of the plants and partly the energy for carbon capture, or even methanol transport, exhibited noteworthy impacts. Particulate matter concentrations for methanol synthesis were calculated in the range from 0.057 to 0.20 g/MJ. These values are 20–320% higher than the fossil reference. The main contributions were shown for the electricity input required by the electrolysis, plant construction, and methanol transport. Depending on the accounting or allocation of credit for carbon capture and its utilization, total electricity-based methanol synthesis could in fact reach near net-zero GHG emission level [9,10].

5.5. DME

With respect to electricity-based pathways for the production of DME, there have been relatively few LCA studies published to date. The review by Kigle et al. identified three LCA publications on DME [204,205].
Fernández-Dacosta et al. [204] calculated 14 g CO2eq/MJ as the GWP of the fuel provision without its combustion. Bongartz et al. [189] performed an LCA on DME considering the conditions expected in 2035. The future electricity mix was calculated as the electricity source for DME production. Thereby, 18.2 g CO2eq/MJ was determined to be the GWP of the fuel supply for DME production. The largest contribution (57%) to environmental impacts was found for the carbon dioxide supply. Hydrogen supply accounts for 21% and DME synthesis for 15% of the total GWP value. Transportation and distribution, including compression at fueling stations, also accounts for the smallest share (7%) for this fuel. Additionally, the LCA study by Matzen et al. [205] also confirms the largest share of carbon dioxide supply in relation to the environmental impacts of DME production.
In contrast, a recent publication by Troy et al. [207] demonstrated much smaller contributions of carbon dioxide supply to overall environmental impacts. In addition, a credit for the captured carbon dioxide is taken into account. That publication, in which the circumstances of DME production in Germany were considered, again highlights the significance of the electricity input. The analysis revealed GHG reductions of at least 75% when using wind energy instead of German grid electricity, which was calculated retrospectively with values for the year 2016. Troy et al. assessed additional environmental impact categories. For particulate matter (PM) formation, they pointed out that German grid electricity inputs produce a higher PM in comparison to wind energy. Furthermore, the construction phase of the DME synthesis provokes PM due to the upstream impacts of the steel used as a construction material in DME plants. The steel utilization also showed noteworthy effects on terrestrial acidification.
In the latest JEC WtT report [192], nearly-zero GHG emissions were calculated for a DME pathway with the utilization of renewable electricity and carbon dioxide.
As in the case of electricity-based methanol, the total GHG emissions of electricity-based DME synthesis could even reach a near net-zero level depending on the accounting or allocation of credit for the capture of carbon and its utilization.

5.6. MtG

Few environmental assessments can be found that focus on MtG. Hurtig and Yearwood [208] analyzed several fuels suitable for the incorporation of carbon dioxide. Europe was chosen as the geographic setting for the analysis. For each of the fuels, different variants were calculated, ranging from operation with the EU electricity mix to various high shares of RE in the electricity input, to scenarios that made use of decarbonization. Scenarios featuring the EU electricity mix were consistently found to have higher environmental impacts compared to a fossil-based reference. This persisted in most scenarios for MtG, even at an RE share of 30%. For an 80% share of RE and higher, clear advantages compared to the fossil reference could be observed. For the mass-based functional unit employed in the study, a maximum savings potential of more than 6 kg of CO2eq/kgMtG product was found compared to the fossil reference. However, the study did not contain additional information on the contributions of individual process steps or components to the overall environmental performance. Furthermore, the assessments only present the GWP results and no further environmental indicators [208].

5.7. FT Diesel and Kerosene

An increasing number of LCA publications can be found in the literature on the electricity-based FT synthesis. In the PtX fuel LCA review by Kigle et al. [182], relevant studies by Hombach et al. [209] and Alhyari et al. [210] could be identified. For FT gasoline, Naumann et al. [174] noted a broad range of 2.8 to 145.8 g CO2eq/MJ as GWP. The LCA study by Liebich et al. [9,10] not only contains a broad range of assessed PtM pathways but also a variety of FT fuel supply paths. In the LCA study, 17 different fully electricity-based pathways were compared for the FT synthesis in Germany or imports to the country. However, some of these pathways are bio-based and not a form of PtL. Thus, only the results of 15 pathways that can be considered PtL options are taken into account in this study. For FT fuels, the study compared production in Germany and import from Saudi Arabia, Morocco, and Iceland, as well as different transport options in addition to a wide variety of electricity and carbon dioxide sources. Instead of pointing out results for FT diesel or gasoline, a production mix of the FT fuels was considered in the LCA study. The highest GWP results (over 350 g of CO2eq/MJ) were given for a pathway in which the German electricity mix for the year 2015 is considered as electricity input. For the assessed conditions of the year 2015 for several additional fuel pathways, a GWP of 20–25 g CO2eq/MJ and a reduction of around 75% compared to the conventional reference were calculated. It was also shown that FT production using offshore wind in Germany can be comparative or even advantageous to onshore wind in Morocco. Further impact reductions are expected for electricity-based FT synthesis until the year 2050. For most of the pathways, GWP values of between 10 and 15 g CO2eq/MJ were calculated for FT fuel. In comparison to the conventional reference, this means a reduction of approximately 85%. The study also presents the results of further environmental impact categories. Values for additional impacts are given and described in the following section and subchapter. For acidification and LCA results for the year 2050, a range of between 0.076 and 5.1 g SO2eq/MJ was calculated, whereas the impacts of the fossil reference (the average value of diesel/petrol) is lower (0.074 g SO2eq/MJ). The acidification potential of FT fuel is, as discussed before for other electricity-based fuels, especially provoked by emissions from upstream steel, copper and, aluminum production used for the plant construction for the required electricity. With respect to eutrophication, the lowest value of FT pathways (0.012 g PO4eq/MJ) is lower in comparison to the fossil reference (0.021 g PO4eq/MJ). However, there is an FT pathway that would cause multiple impacts (0.096 g PO4eq/MJ). The impacts of eutrophication are especially provoked by the upstream electricity generation of hydrogen production due to materials used for power plants. Summer smog potential can be significantly reduced for some pathways (min. 0.014 g C2H4eq/MJ) compared to 0.046 g C2H4eq/MJ. The FT pathway with the highest summer smog potential induces 0.065 g C2H4eq/MJ, which is higher than the value of the fossil reference. The main source of summer smog is also given by the electricity generation for hydrogen provision. Furthermore, the construction of the plants was revealed to have notable summer smog impacts. The particulate matter impacts of FT fuel provision in the year 2050 were analyzed to be more than 20% lower, or even three times higher than the reference value. Again, electricity generation and plant construction were shown to be primarily responsible for the environmental impacts [9,10].

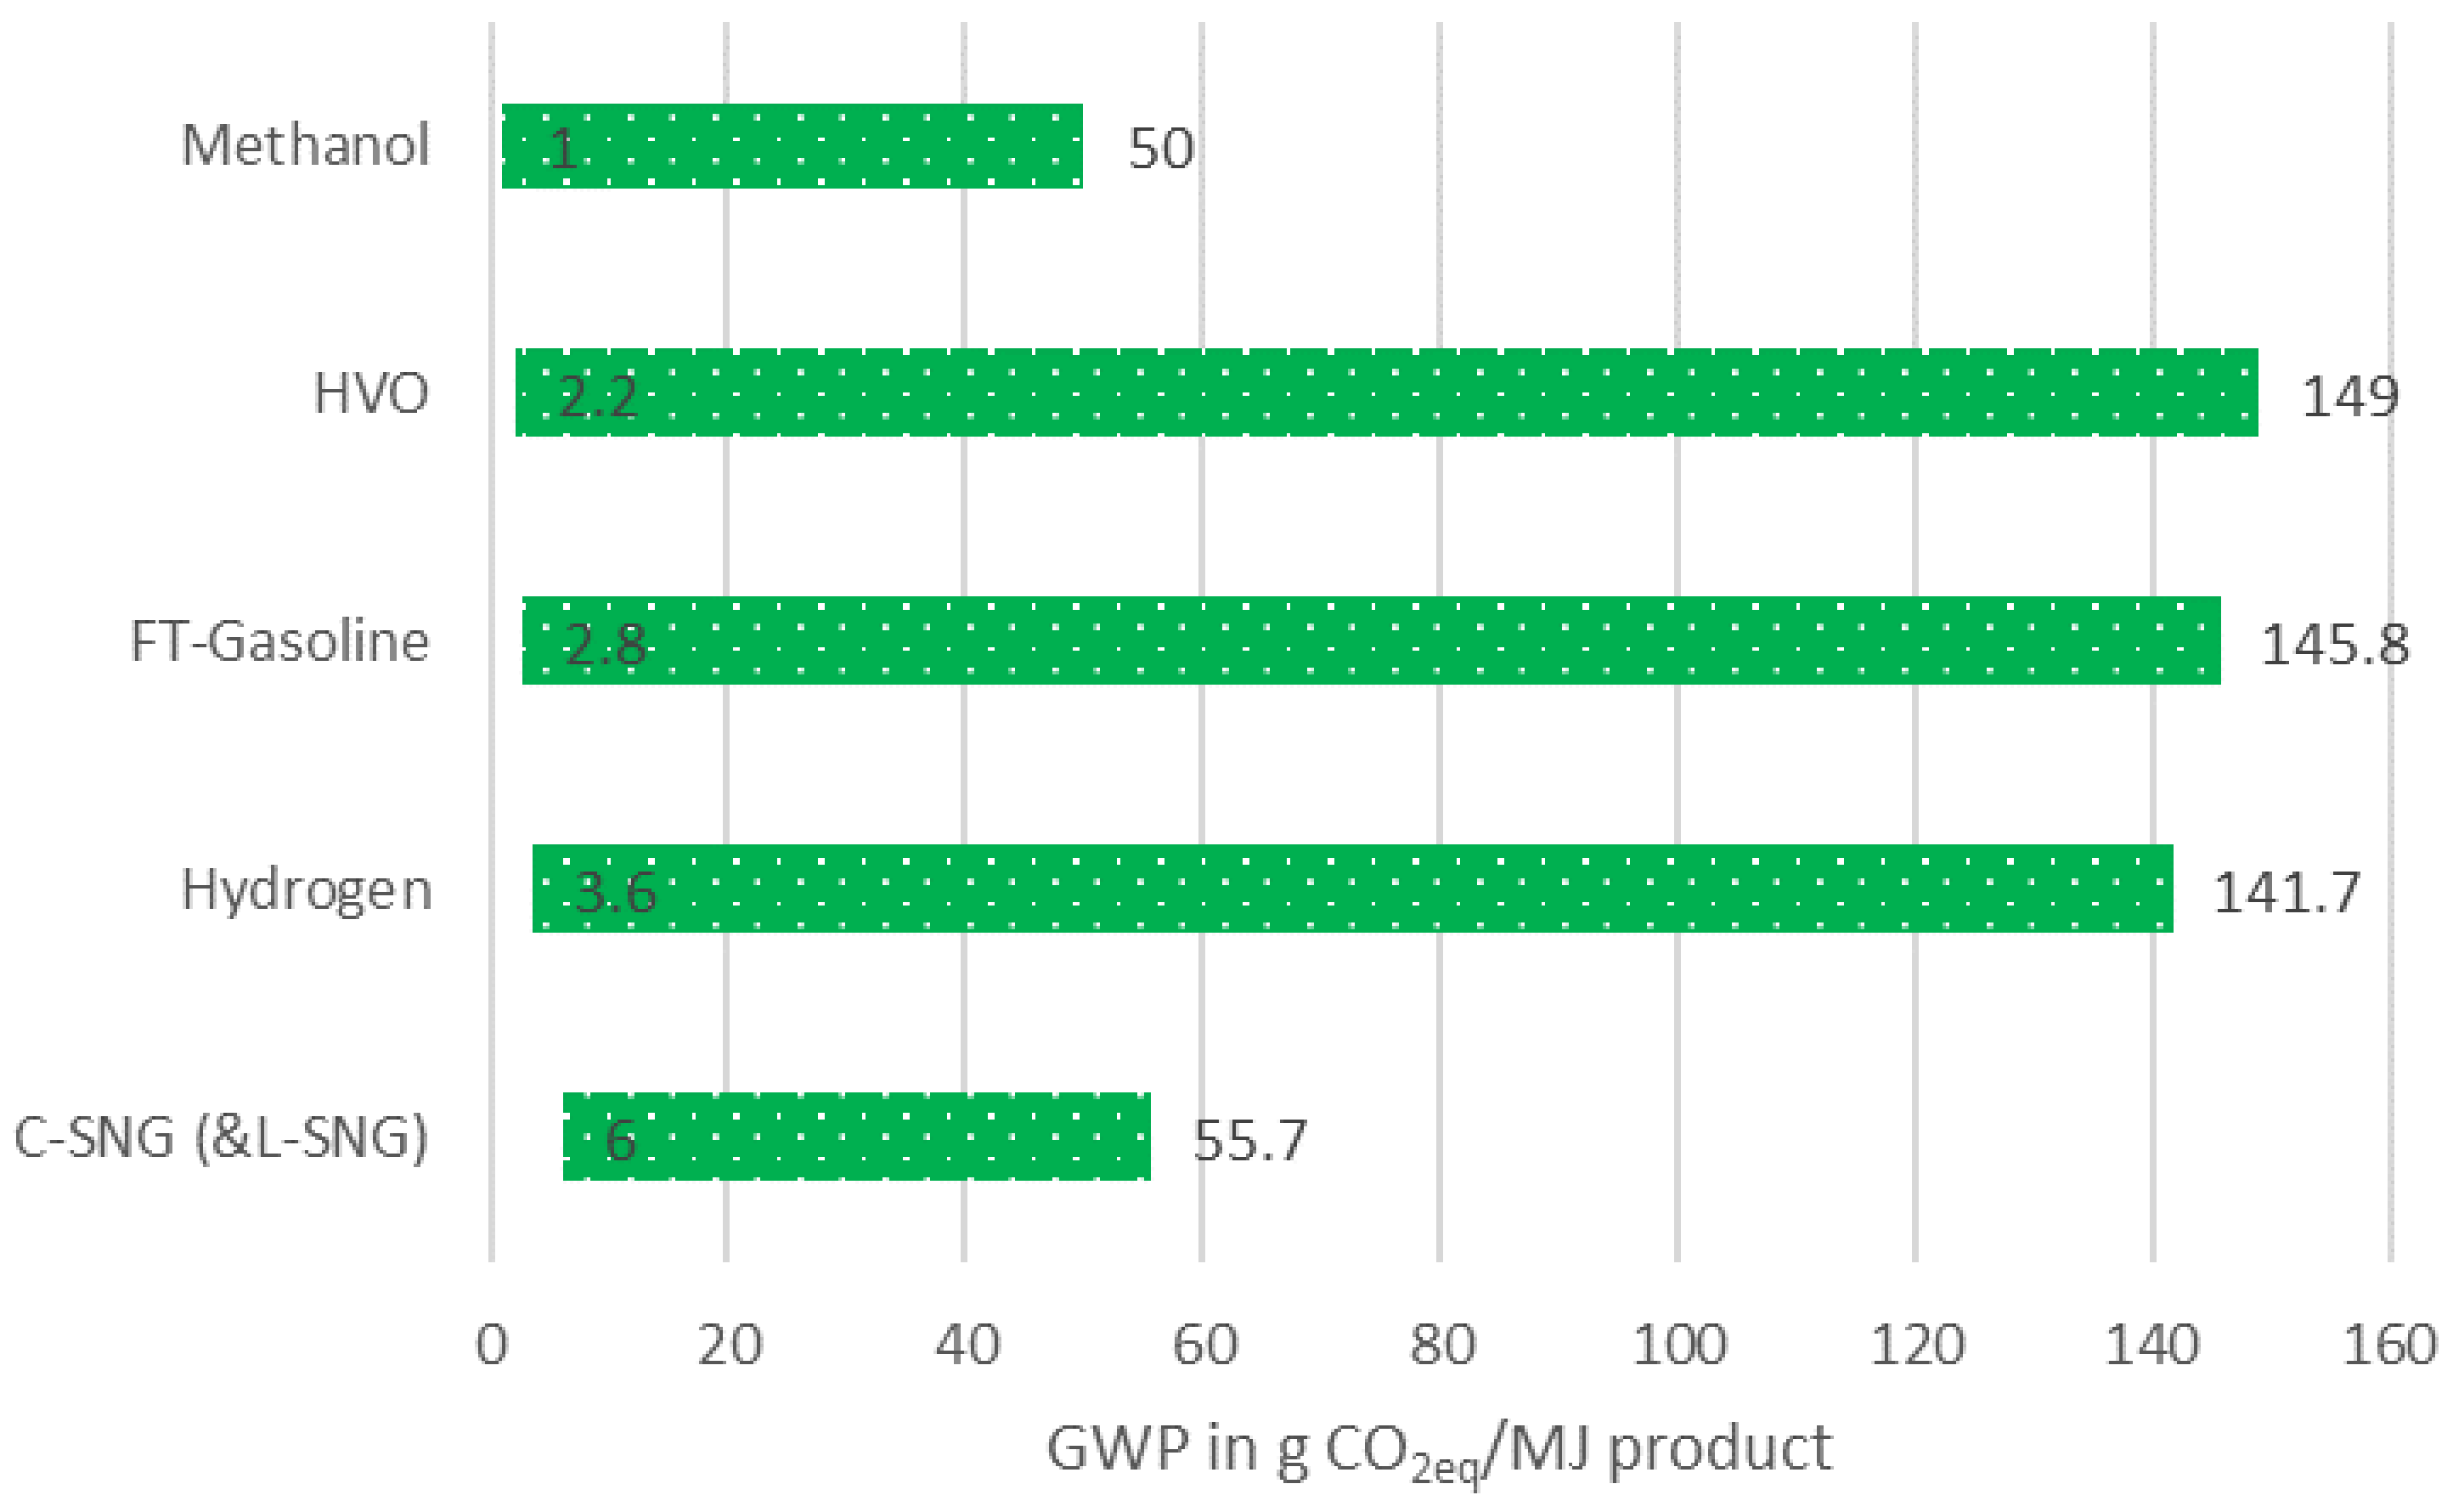
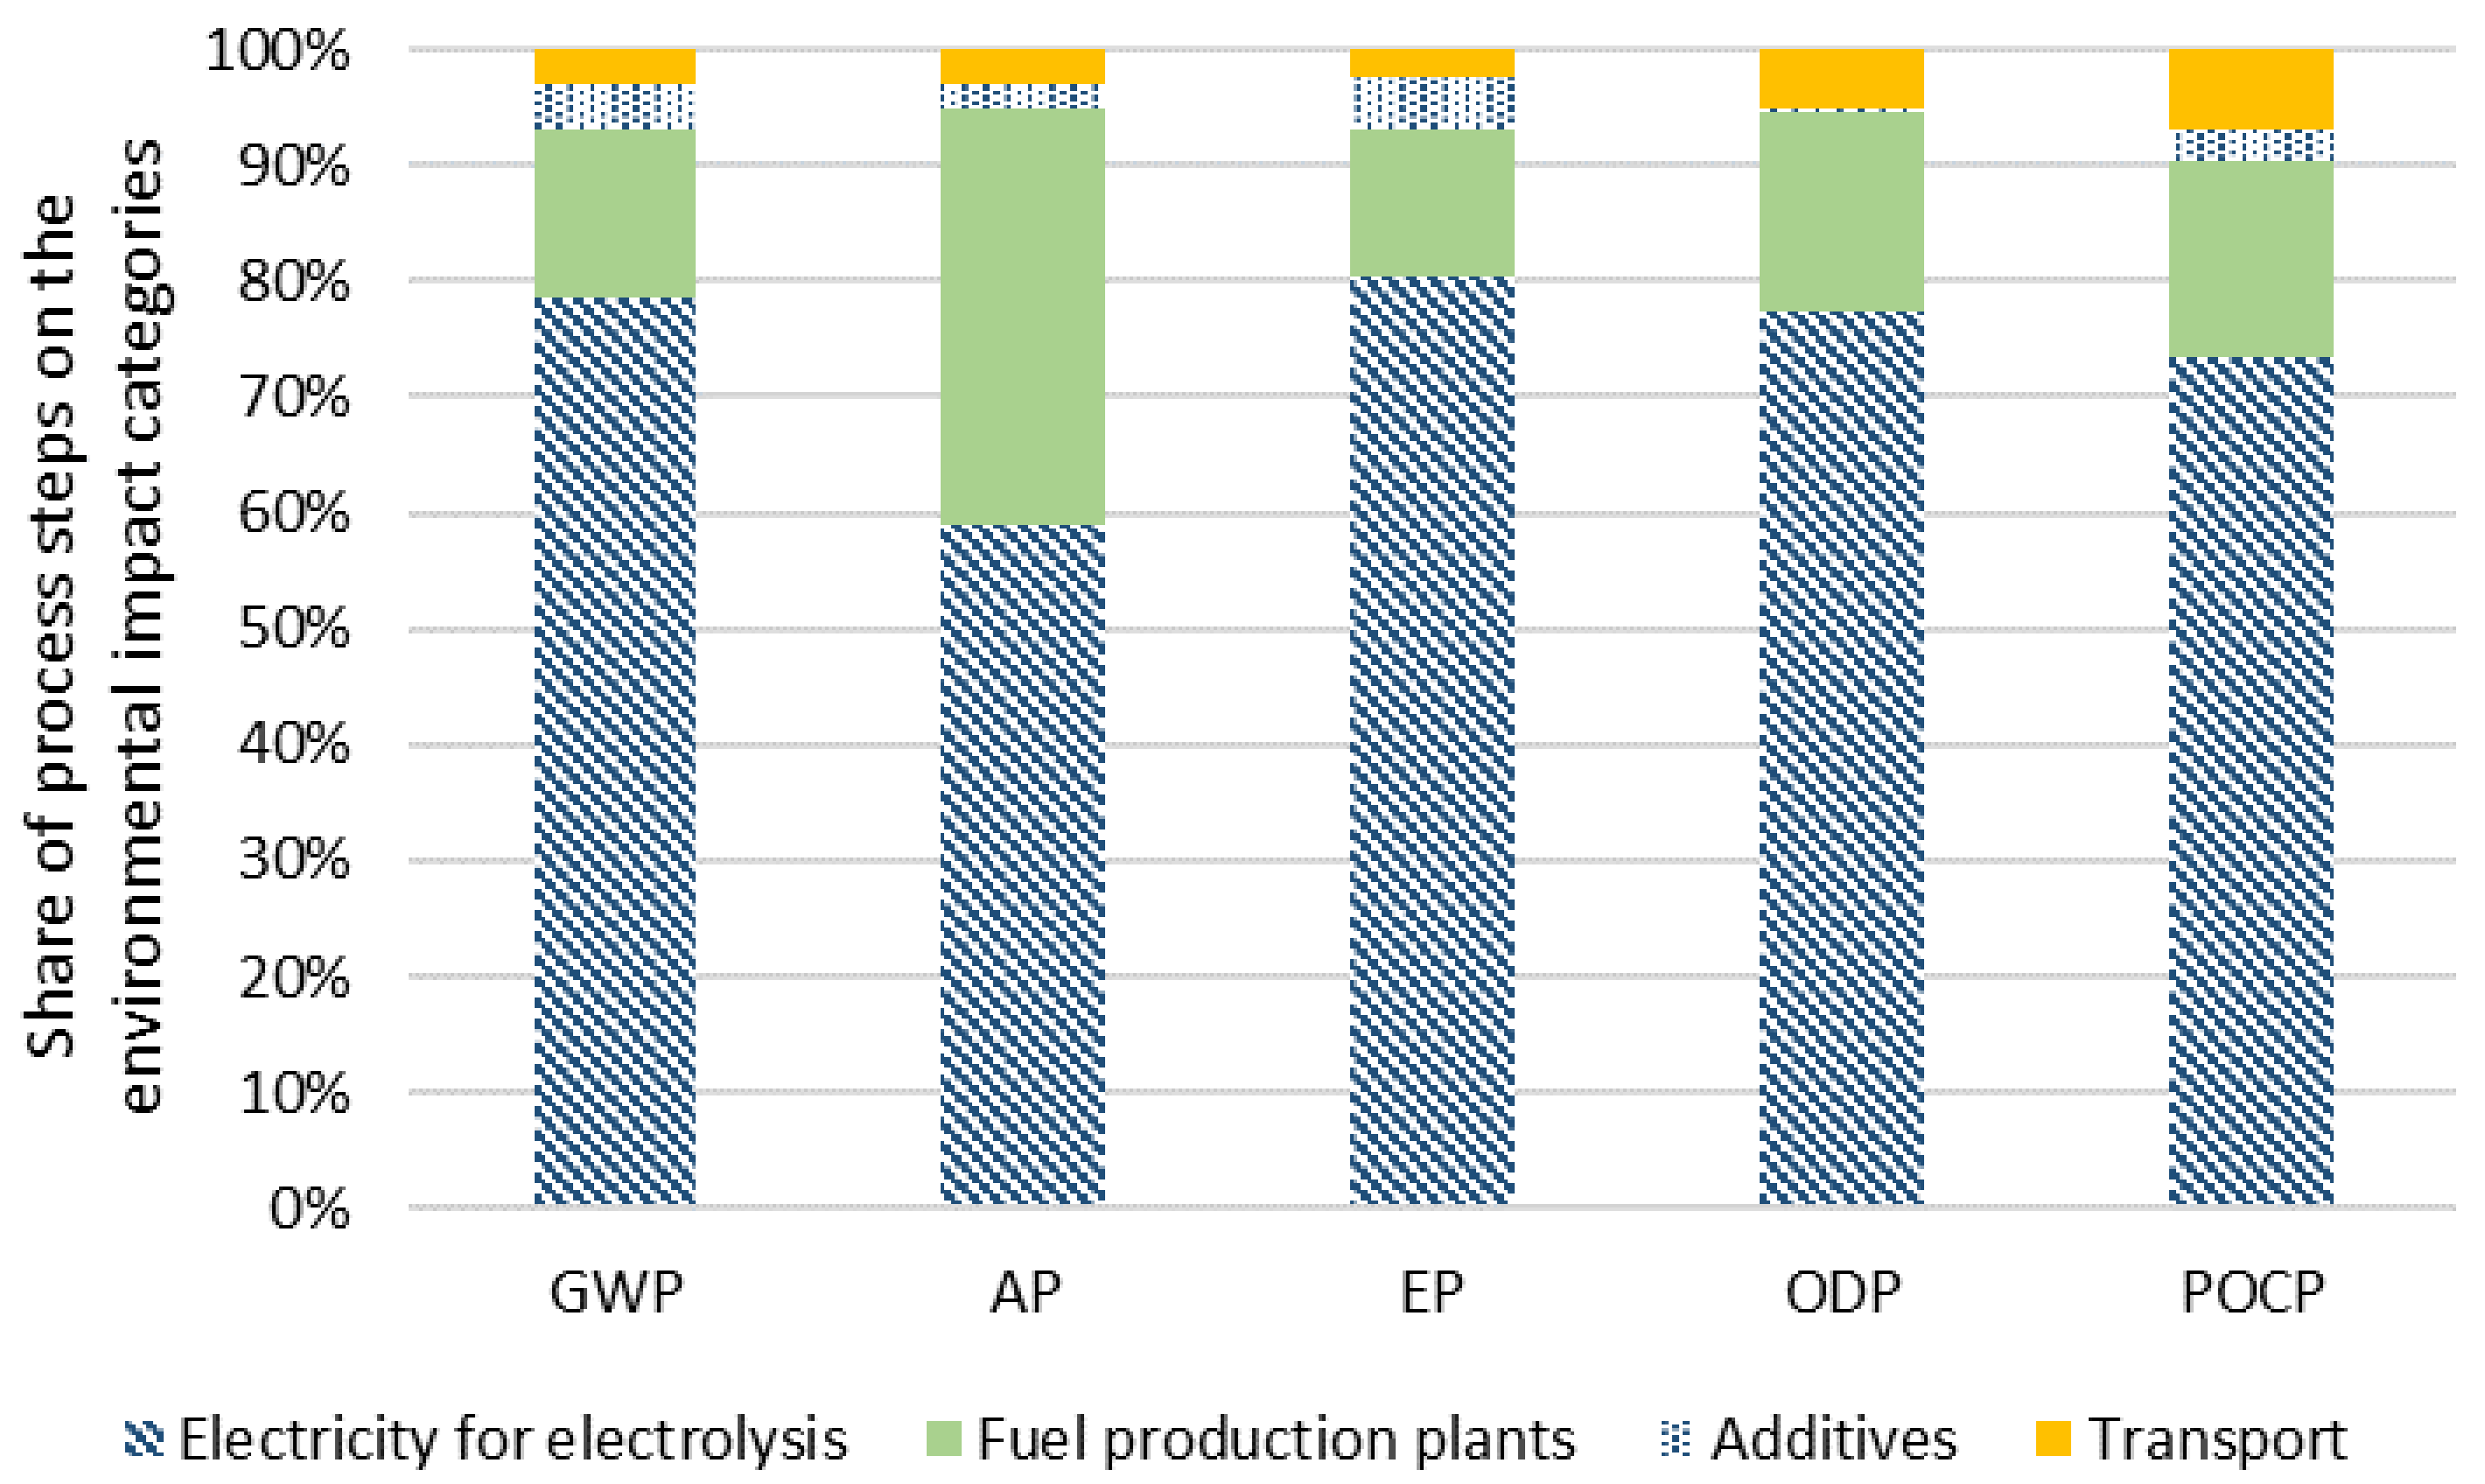
5.8. Contribution Analysis for Several Alternative Fuels

As pointed out before, especially the upstream electricity production and the underlying construction of power plants are mentioned to be of high relevance for many environmental impact categories. Quantification of the contribution of electricity for electrolysis as well as from further process stages is illustrated in Figure 16.
Figure 16 depicts the median contributions on environmental for 2050 for all fully electricity-based supply paths considered in the study of Liebich et al. [9,10]. Electricity for electrolysis exhibits the largest contributions, reaching from just under 60% to 80%. The contribution caused by the fuel production plants ranges from one eighth to one third, depending on the fuel. Some materials used for the construction of these plants, especially steel, followed by aluminum, copper, and cement, provoke most of these environmental impacts.
Transport, including its direct emissions and required infrastructure or means of transport (pipelines, ships, etc.) goes along with contributions of less than 10% to the different environmental impact categories. The materials steel, aluminum, and copper are again responsible for most of the impacts of the transport infrastructures. Contributions of additives to the environmental impacts are typically even lower and in a range between 1 and 5% of the impacts per category. These additives comprise auxiliary materials for use in synthesis and separation plants, such as catalysts, scrubbing liquids, and adsorber materials.

5.9. Interim Conclusion

Section 3 and Section 4 identified the promising fuels hydrogen, CNG/LNG, HVO, methanol, DME, MtG, and FT diesel as well as FT kerosene. These promising fuels were analyzed in this sections considering their environmental impact. It was shown, that production of all these promising fuels could reach near-zero or even negative GHG emissions, bounded to mandatory preconditions. Furthermore, it was found, that the impact of long-distance transport for imports of these fuels is rather low with less than 10% for the examined impact categories. The results also show, that the materials steel, aluminum, and copper should be reduced as much as possible in alternative fuel production chains to keep environmental impacts, such as acidification and eutrophication potential, below the results of the conventional pathways.

6. Discussion

In the following, the findings of the previous sections are discussed and evaluated. First, the reviewed literature pertaining to fuel costs is discussed. Second, the application of fuels and drivetrains in road, inland waterway, rail, and air transport is discussed and compared with currently available vehicle technologies. Third, the outcome of the economic impact analysis is summarized and discussed.

6.1. Cost

Hydrogen can be transported as a gas via pipeline, liquefied, or as an LOHC by ship. The most common derivatives of hydrogen are SNG, ammonia, methanol, DME, MtG gasoline, and FT diesel [34]. At this stage, no clearly superior electricity-based fuel has been identified due to the different pros and cons of each fuel. Therefore, a clear and balanced trade-off decision between hydrogen and its derivatives has not yet been taken. The drawbacks of derivatives include lower production efficiencies and the need for a CO2 source. The benefits include lower transportation costs compared to hydrogen due to the compatibility of the existing infrastructure [83]. H2 transportation costs reveal insecurities due to the low TRL of LH2 and LOHC vessels, which result in a higher spread of costs. Furthermore, the low utilization of pipelines during the ramp-up time of H2 production is weighted differently in techno-economic analyses. In terms of capacity scaling, marine vessel transport carries advantages. However, possible unloaded return journeys of LOHC/LH2-carrying vessels negatively impact their economic competitiveness [83,91]. Another factor that causes cost insecurity is the estimation of the demanded import quantities that influence the occurrence and expression of scaling effects [104]. The assumed economies of scale regarding electrolysis investment costs for the short-term time scope of 2030 should be treated with caution and take into account the current size of the H2 market [83]. The extracted lower bounded cost values for cross-border prices for 2050 are 5.3 EURct/kWhLHV for H2 transported via pipeline from Morocco, 8.0 EURct/kWhLHV for SNG imported from the MENA region via pipeline and PtL, and Syncrude at 8.0 EURct/kWhLHV for imports from Iceland [106,110,112]. The respective upper boundaries of cross-border prices for 2050 are 11.8 EURct/kWhLHV for LH2 vessels importing from Norway or the UK [34] and 14.2 EURct/kWhLHV for SNG imported from the MENA region via pipeline [112]. The upper bound value for PtL is the highest, at 19.2, for import from North Africa as determined by Schmidt et al. [108]. These snapshot values reveal optimistic and pessimistic assumptions regarding all three energy carriers and are not suitable for a conclusive assessment. Furthermore, the pessimistic cost values indicate that adequate CO2 cost reallocations are necessary in order to ensure the market penetration of CO2-neutral fuels, which cannot ensure cost-competitiveness in all cost calculations against their fossil equivalents [87,110].
The first studies focused on the import regions in North Africa and the Middle East due to the relatively low transportation distance and high RE FLH [89,90,110,112]. More recent studies aim to find the optimal points of high RE potential in terms of FLH and the general potential of available land, usable for RE scale up, low import costs, and politically—as well as economically—beneficial conditions [34,86,104]. This leads to a shift in the determined import regions and clearer recommendations. Suitable identified countries for production scale-up through 2030 are Iceland, Canada, Morocco, Norway, Tunisia, and Turkey. Furthermore, long-term perspectives through 2050 ascribe the highest RE potential to Egypt, Algeria, Argentina, Australia, Kazakhstan, Russia, and Saudi Arabia as favorable production countries [104]. In comparison to electricity-based fuels, biomass-based ones such as HVO and biomethane exhibit generally lower price levels and high TRLs, and should therefore be utilized in the highest quantities to ensure low ILUC risks [100].

6.2. Road Transport

C-SNG and L-SNG are promising due to the low-to-medium production costs and the market share already possessed by fossil natural gas. LNG trucks are utilized, for instance, by Volvo with HPDI diesel engines in dual-fuel operation with 5–10% diesel, or by Scania with gas engines [211,212]. The advantage of dual-fuel operation is a higher efficiency that approximately corresponds to that of conventional operation with diesel. In contrast, the gas engine offers efficiencies in the range of 75–85% and a maximum efficiency of 90–95% in relation to the conventionally-operated diesel engines [160]. A disadvantage of the diesel engine in gas operation is higher emissions, as shown by the emission factors in HBEFA 4.1 [159] or Otten et al. [162]. Methanol is used in pure form (M100) in racing [123]. Additionally, Kramer et al. [109] assessed M100 as being a possible future fuel for SI engines. Similar to natural gas, methanol is also used in diesel engines in dual-fuel operation. Dual-fuel systems for diesel engines have already been used in the automotive and marine domains. An example is the use in the ferry Stena Germanica [213], which operates between Kiel and Gothenburg. Zhai [214] reported that the utilization of methanol in heavy duty vehicles has been part of the 2012-started methanol pilot program in China. Additionally, there are the two heavy duty vehicle series Sinotruk Howo (ZZ3317N4667D1M and ZZ3257N3847D1M II) and Shacman (SX3317DR456HM and SX3317DR456HM II) that employ methanol–diesel dual-fuel engines of the manufacturers China National Heavy Duty Truck Group Corp., Ltd. and Shaanxi Heavy-duty Automobile Group Co., Ltd. [215].
However, the European Commission evaluates the use of methanol in dual-fuel operation in the diesel engines of heavy-duty vehicles as unexplored [120] despite the work of Zhai [214]. In dual-fuel operation in diesel engines, the nitrogen oxide (NOx), PM, and soot emissions decrease, whereas the hydrocarbon ones increase [123].
In this study, passenger cars, light duty vehicles, and motorcycles were identified as vehicle classes that tend to travel over shorter distances. Furthermore, large reductions in consumption are possible for these vehicle classes through the implementation of battery–electric drivetrains (see Figure 13). Buses and rigid trucks were identified as vehicle classes with medium mission range requirements, which is why the use of a battery–electric drive also seems to be viable for these vehicle classes. However, the higher vehicle mass of such vehicles and correspondingly higher energy demand militates against the use of battery–electric drives. In the case of heavy vehicles and longer distances, the use of a battery–electric drivetrain appears to be somewhat disadvantageous due to its much lower volumetric and gravimetric energy densities (see Figure 12). Another promising technology is the use of catenary trucks in freight transport. The costs of this technology depend heavily on the length of overhead line sections, the traffic volume, and the share of vehicles using this technology [216]. As a result of this, it is not possible to compare the costs, as was done for the other energy sources above. A spatial analysis to determine the costs of overhead lines is therefore necessary. The use of catenary trucks in heavy duty transport was investigated and published in another study [217]. It concluded that catenary trucks for heavy duty transport generally lead to more technical as well as economic uncertainties than other alternative propulsion systems. Therefore, this propulsion concept is not further discussed herein. Further details can be found in Breuer et al. [217].
The utilization of C-SNG- or L-SNG-fueled vehicles is generally promising. Gas engines can be used for the vehicle classes identified as having low- and medium mission range requirements: passenger cars, light duty vehicles, buses, and rigid trucks. Of the lighter vehicle classes passenger cars and light duty vehicles, the use of hybrid concepts is viable due to the higher consumption of gas engines. For vehicles with larger mission range requirements, the use of dual-fuel diesel engines with LNG is advantageous due to the low energy density of methane and the better efficiency of dual-fuel engines. This includes articulated and trailer trucks. The use of fuel cell–electric propulsion tends to be possible and advantageous in road traffic in all vehicle classes with the exception of motorcycles. For vehicles with higher mission range requirements, larger tanks are necessary due to the lower volumetric energy density. The high gravimetric energy density and efficiency are also advantageous.
Peters et al. [218] reviewed and assessed different alternative fuels for heavy-duty transport. The investigated fuels and propulsion systems, which include diesel-like liquid fuels, hydrogen, natural gas, DME, and catenary trucks, match the results presented above.

6.3. Inland Waterway Transport

Since January 2020, the new European regulation (EU) 2016/1628 EURO V for non-road mobile machinery applies to all new engines higher than 300 kW in inland waterway transport [219]. For instance, the limit for NOx emissions was reduced from 6 to 1.8 g/kWh. Options for attaining these new emission standards include efficiency improvements, exhaust gas after-treatment such as DPF or SCR, and alternative fuels [220]. Among the investigated Drop-In fuels, the use of synthetic diesel in inland navigation seems to be the most promising option, although this will not meet the mentioned EURO V emissions regulation without the additional use of exhaust gas after-treatment. The same applies to ships with dual-fuel LNG propulsion [162]. Only ships with LNG- or CNG-powered spark ignition engines are consistent with the new emissions regulation without exhaust gas after-treatment [162]. In addition to LNG operation, the alternative propulsion concepts of fuel cell– and battery–electric are promising due to their high efficiencies (see Figure 14). Limiting factors include the low volumetric energy densities of hydrogen and batteries, and the lower gravimetric energy density of the latter (see Figure 12). An analysis of the required mission ranges in passenger shipping was not performed. Assuming that cabin ships, ferries, day excursion vessels, and smaller boats tend to cover shorter distances, the use of battery–electric propulsion is possible and advantageous for these ship classes. The consumption reductions are also greatest for these classes (see Figure 14). The use of battery–electric drive in freight transport is not feasible due to the lower fuel consumption reductions, the lower energy densities of the batteries, and the high mission ranges required. The use of a fuel cell–electric powertrain in passenger and freight transport in inland navigation is promising and offers moderate advantages in terms of energy consumption and a high gravimetric energy density, and therefore the maximum payload is not restricted. One challenge could be the low volumetric energy density for ships with long mission ranges, such as cargo and liquid cargo barges. The literature confirms this assessment of the viability of alternative propulsion systems, and is outlined in the following.
Vessels with battery–electric propulsion are already operated in the inland navigation sector. The electric day cruiser St. Nicholas operates with a 50 kW electric drivetrain on the Rursee in Germany and the electric ferry Sankta Maria II with an 80 kW one on the Mosel in Germany [221]. Both can carry up to 250 passengers. Zero Emission Services B.V. [222] announced in a press release that it will equip a motorized cargo barge owned by the Heineken brewery with an electric drivetrain. The energy storage system used is the exchangeable battery container system developed by Zero Emission Services B.V. [222]. In the future, electric freight ships will operate on the approximately 60 km-long Zoeterwoude–Alpherium–Moerdijk route in the Netherlands. Based on the analyses of the mission range of inland freight traffic performed in this study, this technology only seems to be suitable for individual applications (see Figure 3). Moreover, according to Kasten et al. [223] battery–electric inland waterway barges are rarely considered options for inland navigation due to the low volumetric and gravimetric energy density and the resulting high weight of the batteries. LNG propulsion is already widespread in shipping, with the LNG carrier vessels the TMS Ecotank. III, ex-TMS Green Rhine, and Eiger already being in operation on the Rhine, Germany [221]. Bauen et al. [120] classify LNG technology for shipping as being at the commercial level. In Norway, five LNG ferries of the type Fjord1 have been in operation since 2007 [224].
For passenger transport, the high-speed ship Francisco was put into service in South America. Furthermore, the cruise ferries MS Stavangerfjord and MS Bergenfjord entered service in 2013 and 2014, respectively, and operate between Norway and Denmark. [224] Bauen et al. [120] report that 50 LNG-fueled ships (excluding LNG liquid cargo barges) are already in operation in the EU. At the time of the publication of the European Commission report [120], 45 more LNG-fueled ships were on order. For LNG pushers, at the time of this study, only a design study by Rolls-Royce and Canadian Robert Allan, a ship designer, is known [225]. Fossil LNG has been evaluated in numerous studies to be a good alternative for inland navigation [226], although the Federal Ministry of Transport and Digital Infrastructure in Germany [226] states that it is only a temporary solution, as fossil natural gas reserves will also run out. According to Kopyscinski et al. [227], fossil LNG could subsequently be replaced by SNG, for instance, from biomass or PtG methane.
Zerta et al. [155] provide an overview of existing fuel cell-driven vessels. Their work shows that commercial fuel cell vessels are mostly small in size, such as sport boats with engine power ranges of 4–50 kW. However, there is also a commercial ferry with 2 × 200 kW and pusher boat with an engine power of 2 × 200 kW in operation. Prototypes, pilot projects, and demonstration vessels exist with engine powers in the range of 1–2 × 1000 kW. These vessels are primarily inland passenger vessels, ferries, or small ships. [155] According to Zerta et al. [155], ships with fuel cell–electric propulsion systems of up to 10,000 kW are being investigated in theoretical studies. Amongst the German inland waterway fleet, pusher boats of up to 362 kW make up a share of 70% [228] and could presumably be covered by the already existing fuel cell-powered inland waterway vessel fleet with 2 × 200 kW. In a feasibility study by the MariGreen project [229], hydrogen is evaluated as a promising energy carrier for inland navigation and its use in combustion engines is advantageous for the ship classes cargo/liquid cargo barges and pushed barges/tankers, whereas, for ferries and cabin ships, fuel cell–electric propulsion is preferable.
More recent studies, such as that from Zerta et al. [155], focus on fuel cell–electric propulsion for all vessel classes. The Rhine Hydrogen lntegration Network of Excellence (RH2lNE) has set the goal of operating ten hydrogen-powered inland vessels between Rotterdam and Duisburg by 2024 [230].
Finally, the retrofit of the already mentioned Stena Germanica into methanol dual-fuel operation using marine gasoil as a pilot fuel should be mentioned [213]. As noted earlier, methanol also constitutes a promising alternative energy source and can be used in the dual-fuel operation of diesel engines.

6.4. Rail Transport

In principle, the conventional diesel fuel used in rail transport can be replaced by HVO or FT diesel. Alternatively, diesel–electric hybrids, battery–electric hybrids, or fuel cell–electric propulsion systems can be used. In contrast to other transport sectors, the choice of propulsion system for rail transport depends on the route of the respective train line. If only short, non-electrified sections of a track must be covered, the use of a battery–electric train with a catenary line connection and a battery for up to 100 km is beneficial. For longer, non-electrified distances for which electrification is not worthwhile due to low traffic volumes, hydrogen trains can be used instead.

6.5. Air Transport

As noted above, air transport requires propulsion systems with long mission ranges. Considering the low energy densities of batteries, battery–electric propulsion systems are unsuitable for commercial aviation, despite their high efficiency rates. Hydrogen as an energy carrier offers a higher gravimetric energy density. However, neither of these technologies will be operational in this context in the foreseeable future, which is why they are not further investigated herein. As will be discussed below, the literature supports this hypothesis. According to Thomson [231], the use of lithium-ion and nickel–cadmium battery systems in battery-powered aircraft is restricted by the weight and size of the battery system. Battery-powered aircraft could enter the market between 2030 and 2040, but their application is limited to small and medium-sized aircraft [232,233]. According to McKinsey & Company [28], battery–electric aircraft are applicable for commuter (<19 PAX), regional (20–80 PAX), and short-range aircraft (81–165 PAX) for mission ranges of up to 1000 km, whereas they are not suitable for larger aircraft due to their limited energy densities. A study by Roland Berger [234], however, concluded that the use of a battery-electric propulsion system in commuter aircraft would reduce mission range to 202 km. In Roland Berger [234], a battery energy density of 180 Wh/kg was assumed. Current densities for batteries in road vehicles are up to 260 Wh/kg [148]. Furthermore, according to Roland Berger [234], the efficiency would have to be increased by a reduced drag coefficient, an increased wingspan, and a reduced mass in order for battery–electric propulsion to be viable in commuter aircraft. Additionally, the battery density would need to be increased to 720 Wh/kg [234]. Eviation Aircraft has developed the nine-passenger Alice electric airplane, which has a stated mission range of 1000 km and is expected to become commercially available in 2021 [235]. The ICAO [236] has published an overview of existing electric aircraft prototypes and projects, most of them are below <19 PAX, i.e., in the commuter aircraft class, or are designed for even shorter distances, such as the Volocopter 2X with a 27 km mission range. However, only the aircraft project Airbus/Siemens/Rolls Royce E-Fan X (hybrid-electric), the Wright Electric/Easy Jet (electric), and the Boeing Sugar VOLT (hybrid-electric) are in the class of large commercial aircraft with 100 PAX, 120 PAX, and 135 PAX, respectively. Market entry is planned for 2027–2050 [236]. In another study by Roland Berger [170], existing hydrogen aircraft projects are examined and evaluated. Furthermore, fuel cell/hydrogen propulsion for aircraft is assessed. At present, the only fuel cell-driven aircraft is the DLR HY4, which has a mission range of 750–1500 km and offers space for four passengers [237]. Other prototypes under development feature up to 20 seats. Exclusively, NASA’s CHEETA project is focusing on large commercial aircraft. The feasibility studies Airbus Cryoplane and NASA Concept B also investigated large commercial hydrogen aircraft powered by either fuel cells or turbines [170].
McKinsey & Company [28] investigated the use of hydrogen as an energy source in the five different classes of commuter (<19 PAX), regional (20–80 PAX), short-range (81–165 PAX), medium-range (166–250 PAX), and long-range aircraft (>250 PAX). They concluded that fuel cell propulsion is best suited for commuter and regional aircraft, whereas H2 turbines are more suitable for medium- and long-range aircraft; hybrid engines should be used in short-range aircraft. However, costs will increase as aircraft size does. They also predict that commuter aircraft powered by hydrogen will be available in less than ten years and regional aircraft in the next 10–15 years, whereas the larger aircraft classes will not be available for more than 15 years. [28] According to McKinsey & Company [28], there is no mission range limit for hydrogen propulsion for commuter (<19 PAX), regional (20–80 PAX), and short-range aircraft (81–165 PAX), whereas for medium-range (166–250 PAX) and long-range aircraft (>250 PAX), new and more efficient aircraft concepts are needed for mission ranges above 10,000 km.
As a conclusion of the above discussion, the only short-time solution for aircraft, with small aircraft being the exception, is synthetic jet fuel. Different sustainable aviation fuels already went through the ASTM procedure and, as discussed earlier in this work, are certified with Drop-In rates up to 50% [58]. The analysis in this work showed, that higher Drop-In rates up to 100% are possible. Current demonstration projects are investigating the use of 100% unblended sustainable aviation fuels [238] and, therefore, are supporting the results of the analysis. The future should aim for certification of higher Drop-In rates of the already certified sustainable aviation fuels via the FT process and also the approval of synthetic jet fuel via the MtK pathway by the ASTM.

6.6. Environmental Impacts of Promising Alternative Fuels

Compared to conventional fuels, all promising alternative fuels showed potential for reducing GHG emissions. However, some preconditions must be specified in order to obtain superior environmental performance from these promising fuels. For the case of Germany, the use of the current, largely fossil-based electricity mix for the production of electricity-based fuels, should be avoided. In case the current electricity mix was to be used, environmental impacts would typically significantly exceed the impact of fossil fuel production. For domestic fuel production in Germany, the use of wind energy in particular for the production of the electricity-based fuels of hydrogen, SNG, DME, FT fuels, and MtG can facilitate near-zero GHG emissions. Besides the high importance of the type of electricity used for the production of these fuels, full load hours, the source of carbon, and the way in which carbon dioxide separation and utilization is implemented have a noteworthy influence on the results. In the case of full allocation of the required carbon dioxide for fuel production, the GHG emissions of SNG, DME, FT fuels, and MtG could reach a near net-zero GHG emission level. In addition to the domestic production of promising fuels, the import from countries with better production conditions can be considered from an environmental perspective. Environmental impact results show that long-distance transport goes along with contributions of typically less than 10% to the overall results of different environmental impact categories. However, the advantages of these fuels for GHG emissions in comparison to the fossil references do not necessarily show up for additional impact categories as well. Major contributions to several environmental impact categories are given by upstream impacts of the electricity used for hydrogen production. This is primarily caused by the upstream production of steel, aluminum, and copper for the power plants, e.g., the production of steel is very important for the construction of wind turbines as well as further materials like aluminum, copper and their environmental impact provoking production. To reduce the environmental impacts of many impact categories in the future, especially the upstream manufacturing of steel, aluminum, and copper must be environmentally optimized or these materials must be substituted.
The potential to reduce the GWP per MJ of fuel is also presented for biomass-based HVO fuel pathways. This is especially the case if used cooking oil is utilized. However, some plant-based pathways of HVO production do not enable environmental impact reductions compared to conventional fuels. Furthermore, the use of biomass for fuel production instead of the growing of food is discussed and is controversial, and conflicts and impacts can arise relating to land use for the production of HVO.
As previously noted with respect to biomass potential, the presented overview of the environmental impacts of fuel production indicates once again that electricity-based fuels are essential, in addition to biomass-based ones.
Taking all of the considered climate change values regarding the production of the promising identified fuels into account, hydrogen and methanol tend to exhibit the lowest impacts. Taking further impact categories into account, hydrogen reveals reductions compared to the fossil reference in further impact categories. From this perspective, electricity-based hydrogen produced by wind energy would exhibit the best environmental results of the promising fuels considered if a normalization step of different environmental impact categories were to be conducted, as stated by Koj et al. [186]. Nevertheless, as previously mentioned, the full allocation of carbon dioxide for fuel production, which depends on the conditions at the production sites, could also reduce the GHG emissions of FT fuel, SNG, methanol, DME, and MtG to a near net-zero GHG emission level.
Due to the focus area of this study and the need to set limits on the large number of publications relating to the environmental impacts of alternative fuels and vehicles, only literature results pertaining to fuel production were described and analyzed. If fuel use for transport is environmentally assessed, particularly highly efficient vehicles and fuels with low or no carbon content can lead to advantageous environmental performances.
The already-mentioned RED II also has high relevance for the present and future environmental impacts of alternative fuels in Germany. This European directive must be transposed into national legislation. In Germany, RED II is implemented by the GHG Quota (GHG Quota), an instrument that forces fuel distributors to gradually reduce and monitor the GHG emissions of their respective distributed fuels. Further information on the status and further development of the German GHG Quota is summarized in a study by Naumann et al. [239].

7. Conclusions

This study showed the importance of having a technological diversity of fuels and drivetrains available to satisfy the complex respective requirements of these. At present, the most promising are battery–and hydrogen fuel cell–electric drivetrains, DME, natural gas, methanol, and the Drop-In fuels FT-diesel, HVO, MtG, and FT-kerosene. However, this selection may change with upcoming research as well as political conditions.
It was shown that from today’s perspective, electrification with battery–electric drivetrains is highly unlikely for most use cases in long-distance heavy duty transport, shipping, and aircraft transport, although there are exceptions like small short-range aircraft. It is necessary to address these vehicle classes with other emission-reducing solutions such as, if possible, fuel cell–electric propulsion or electricity-based fuels. The latter is the only short-term solution for air transport currently apparent. Among electricity-based fuels, drop-in fuels have the advantage of their compatibility with existing vehicles, which is, in the case of FT-kerosene and -diesel, as well as MtG, already legally regulated.
The results of the cost value review highlight the insecurities around the regarded cost level production costs, cross-border prices, and end user prices in the current research landscape. The extracted interval sizes of cross-border prices for 2020 are 7 EURct/kWhLHV for H2, 10 EURct/kWhLHV for SNG, and 8 EURct/kWhLHV for PtL fuels. Cost insecurity increases with the predicted range and length of the value chains. At present, cost comparisons indicate that lower production costs of H2 are nearly compensated by higher transport costs in comparison to other fuels that offer existing infrastructural compatibility. Furthermore, the domestic production of H2 is considered cost-competitive to LH2 imports.
The overview of environmental impacts provoked by the production of the promising alternative fuels showed influencing factors, potential reductions, but also occasional disadvantages. Significant reductions of global warming potential of alternative fuel production compared to fossil references can be achieved. Production of all promising fuels could reach near-zero or even negative GHG emissions, bounded to mandatory preconditions like the accounting approach of credits for carbon capture. Domestic fuel production in Germany should avoid fossil-based electricity and prefer wind power. Additionally, the import of these fuels from countries with promising production conditions can be an interesting alternative to produce viable fuels. The impact of long-distance transport for imports is rather low, as environmental assessments show shares of less than 10% to results of different impact categories. Along the fuel production chains, care must be taken to use as few amounts as possible from materials, such as steel, aluminum, and copper to keep further environmental impacts (e.g., acidification and eutrophication potential) below the results of the conventional pathways.
Insecurities with regard to future electricity-based fuel demand, market development, and cost structures have led to the investigation of a variety of production locations in the literature. Furthermore, electricity-based fuels strongly depend on their eligibility for CO2 reduction targets. At present, there is no secure legal framework, which makes it difficult to determine import quantities and discourages investment, which results in increased cost insecurity in scaling effects.
Further research and demonstration of alternative fuel production plants, especially large-scale ones, and their interaction with RES, CO2-capturing, and seawater desalination processes must be carried out in order to achieve precise cost predictions. The same applies to long-distance hydrogen transportation.

Author Contributions

Conceptualization, J.L.B. and J.S.; methodology, J.L.B. and J.S.; formal analysis, J.L.B., J.S. and J.C.K.; investigation, J.L.B., J.S. and J.C.K.; writing—original draft preparation, J.L.B., J.S. and J.C.K.; writing—review and editing, F.S., R.P., R.C.S. and M.F., visualization, J.L.B., J.S. and J.C.K., supervision, R.P., R.C.S., R.A., K.G. and D.S.; project administration, R.P.; funding acquisition, R.P. and D.S. All authors have read and agreed to the published version of the manuscript.

Funding

Funding of the center of excellence “Virtual Institute—Power to Gas and Heat” (EFRE-0400111, EFRE-0400151) by the “Operational Program for the promotion of investments in growth and employment for North Rhine-Westphalia from the European fund for regional development” (OP EFRE NRW) through the Ministry of Economic Affairs, Innovation, Digitalization and Energy of the State of North Rhine-Westphalia is gratefully acknowledged. Funded by the Deutsche Forschungsgemeinschaft (DFG, German Research Foundation)—491111487.

Acknowledgments

The authors would also like to thank Bernd Emonts from the Institute of Energy and Climate Research—Electrochemical Process Engineering (IEK-14), Forschungszentrum Jülich GmbH who triggered this original research offspring study.

Conflicts of Interest

The authors declare no conflict of interest.

Appendix A

Table A1. Technology readiness level of alternative fuel production.
FuelProcessProduction TRL
HydrogenUpgraded biogas from municipal organic waste, wet manure, sewage sludge, maize, or double croppingTRL 9 [5]
Gasification of farmed woodTRL 8 [5]
Renewable electricity via alkaline electrolysisTRL 9 [5]
Renewable electricity via polymer electrolyte membrane electrolysisTRL 9 [57]
Renewable electricity via solid oxide electrolysis cell TRL 6–7 [57]
HVOConventional (biomass)TRL 9 [5,76]
FAMEConventional (biomass)TRL 9 [5,76]
SyndieselBtL, lignocellulose pyrolysis-basedTRL 6 [5,76]
lignocellulose gasificationTRL 8 [5]
lignocellulose hydrothermal liquefaction (HTL) and upgradingTRL 4 [5]
FT diesel from CO2 and H2TRL 6 [4]
Diesel via methanol from CO2 and H2TRL 9 [5]
Synthetic gasolinelignocellulose pyrolysis-basedTRL 6 [5]
MtGTRL 9 [4]
MethanolLignocelluloseTRL 8 [5]
From CO2 and H2TRL 9 [4,5]
EthanolConventional (biomass)TRL 9 [5,76]
LignocelluloseTRL 7 [76], TRL 8 [5]
From CO2 and H2TRL 4 [4]
Butanol(1/2)Conventional (biomass)TRL 7 [5]
From CO2 and H2TRL 4 [4]
DMELignocelluloseTRL 8 [5]
From CO2 and H2TRL 9 [4,5]
OME1LignocelluloseTRL 5 [5]
From CO2 and H2TRL 5 [4]
OME3-5LignocelluloseTRL 5 [5]
From CO2 and H2TRL 4–5 [4,79]
Iso-octanolFrom CO2 and H2TRL 4 [4]
Octanol TRL 1 [78]
From lignocelluloseTRL 3 based on Leitner et al. [77]
CNG/CBM/SNGBiomethane/biogas from residues (e.g., biowaste, manure, stillage)TRL 9 [5,76]
Biomethane/synthetic natural gas (SNG) from lignocelluloses (e.g., wood and straw)TRL 7 [76], TRL 8 [5]
From CO2 and H2TRL 9 based on [5], Deutsche Energie-Agentur [80]
SLNG/LBMUpgraded biogas to LBM from municipal waste, wet manure, sewage sludge, maize, double croppingTRL 9 [5]
SNLG from gasification of lignocelluloses (e.g., waste wood and wood chips)TRL 8 [5]
SLNG from CO2 and H2TRL 9 [5]
Synthetic jet fuelFT-SPK from CO2 and H2TRL 6 [4]
FT-SPK from biomass via gasificationTRL 9; Fulcrum [67] and Red Rock [68] have plants under construction with 30 kt/year and 45 kt/year
Jet fuel from MtK processTRL 4 based on based on Tabak et al. [63] and Tabak and Yurchak [64]
HEFA-SPK from bio-oils, animal fat, and recycled oilsTRL 9; commercial process by World Energy Paramount (former AltAir Paramounts LLC) [60] and Neste Oyj [69]
HFS-SIP from the microbial conversion of sugars into hydrocarbonsTRL 9, commercial process by Amyris in Brazil [60]
ATJ-SPK from agricultural waste products (stover, grasses, forestry slash, and crop straws)TRL 9; Pilot plant by LanzaTech [70]; commercial plant by Ekobenz with 22.5 kt/year [71]. Commercial-scale plants planned by LanzaTech [72] and SWEDISH BIOFUELS AB [73]
CHJ from triglyceride-based feedstocks (plant oils, waste oils, algal oils, soybean oil, jatropha oil, camelina oil, carinata oil, and tung oil)TRL 6–7; demonstration plant of ARA and euglena [74]
HHC-SPK from biologically-derived hydrocarbons such as algaeTRL 4; laboratory scale by IHI [75]
Table A2. Overview of literature studies investigating fuel production costs.
AuthorsYearContent/Investigated RegionsIdentified CostsMeta-Study
Merten et al. [83]2020Germany: imported vs. locally produced hydrogenGeneration Transportyes
Kreidelmeyer et al. [92]2020Fuel: H2, methane, methanol, FT-syncrudeGeneration Transport Taxes/Leviesno
Import region: MENA Assessed
Costs: production, transport, and distribution
Robinius et al. [34]2020Import costs of (synfuels, SNG, and H2) are determined through optimized technology decision-making, electricity imported from countries neighboring GermanyGeneration Transportno
Gerhardt et al. [106]2020Import costs from Morocco and Tunisia, energy costs, demineralization, liquefaction, and transportGeneration Transportno
Christoph Hank et al.2020Import costs from Morocco for LH2, LOHC, liquefied methane, methanol, and ammoniaGeneration Transport
Mottschall et al. [107]2019Difference between H2, CH4, and PtL import costsGeneration Transportyes
No own calculation
Schindler [89]2019Cost analyses of end user costs of in-Germany-produced and imported H2, SNG, and PtL Fuels for 2020 and 2050Generation Transport Taxes/Leviesno
Primary source is unknown
Eichhammer et al. [90]2019Generation costs of hydrogen and derived products from Morocco 2015, 2030, and 2050Generationno
Michalski et al. [105]2019H2 generation costs in Germany, with electricity imported from neighboring countries Generationno
Jensterle et al. [104]2019Country-specific suitability of energy carrier export due to various soft factorsGeneration Transportno
Schemme et al. [4]2019Techno-economic aspects of specific synfuels: H2, methanol, ethanol, DME, OME, MtG, FT, and butanolGenerationno
Terlouw et al. [111]2019Energy system modeling for 2050, determining favorable RE locations for energy carrier production, hydrogen transport technologies’ TRLs, and costsGeneration Transportno
Perner et al. [110]2018Future costs of fossil fuels
PtL from North and Baltic Sea/North Africa/Iceland and Germany
Level: Transport + conversion losses + electricity costs
without taxes and levies
Kramer et al. [109]2018Min/max scenario for 2030 differed for all common alternative fuelsGeneration Neglecting of transport costsno
Hobohm et al. [112]2018Calculation of energy carrier demand of different sectors and end user pricesGeneration transport taxes/leviesno
Pfennig et al. [6]20172030/2050 generation costs of generalized PtL fuels from the North Sea and MoroccoGeneration transportno
Figure A1. Cost intervals of H2 and LH2 production in Germany and abroad, transport costs, and taxes/levies. * production, ** +transport, *** +taxes/levies. Source: Own elaboration based on (a) [92], (b) [89], (c) [85], (d) [4], (e) [87], (f) [6], (g) [90], (h) [108], (i) [106], (j) [105], (k) [88], (l) [34].
Energies 15 01443 g0a1
Figure A2. Cost intervals of SNG production in Germany and abroad, transport costs, and taxes/levies. * production, ** +transport, *** +taxes/levies. Source: Own elaboration based on (a) [92], (b) [89], (c) [85], (e) [87], (h) [108], (m) [112], (n) [113], (g) [109].
Energies 15 01443 g0a2
Figure A3. Cost intervals of unspecified PtL fuel production in Germany and abroad, transport costs, and taxes/levies. * production, ** +transport, *** +taxes/levies. Source: Own elaboration based on [6,85,89,92,108,112].
Energies 15 01443 g0a3

Appendix B

Environmental Impacts of CNG/LNG

Compared to the extensive use of petroleum-based fuels in the German transport sector today, CNG and LNG can help reduce environmental impacts. If the combustion of these gaseous fuels is taken into account, climate change impacts may be reduced due to their chemical compositions. For this reason, CNG and LNG are often referred to as bridging technologies. Thus, from an environmental perspective, vehicles that utilize natural gas-based fuels can bridge the gap between low- and zero-GHG fuels.
Due to the different states of aggregation, CNG and LNG offer different transport options. For CNG transport to the EU and Germany, transport by pipeline can be assumed. For example, an LCA publication by Heidt et al. [240] regarding the environmental effects of CNG for road transport in Germany considered a transport distance of more than 4000 km on average to the EU for the year 2013 and assumed a transport distance of 7000 km for the year 2030. Heidt et al. [240] determined the value of 17.3 g CO2eq/MJ as the WtT emission factor for CNG in the case of 4000 km as the transport distance. For a transport distance of 7000 km, 20.9 g CO2eq/MJ was calculated [240].
An established and well-known series of WtT studies of fuels with Europe as the geographical scope is the JEC WtT reports. In the most recent version, six CNG pathways were analyzed that differed in their assumptions along the pathways (transport distances, production, conditioning assumptions, etc.) [192]. The WtT GHG emissions for CNG vary between 11 and around 17 g CO2eq depending on the respective pathway. Production and conditioning is considered to be the first step in the pathways. A fixed WtT GHG emission of 4 g CO2eq/MJ for production and conditioning was assumed for all pathways. With respect to the transportation to market, as a next step of the pathways, major differences can be noted. Pathways that consider a typical natural gas EU mix with transport distances of only 1900 km to the EU border and average distances of 500 km within it demonstrate the contributions of the transport step being below WtT GHG emissions of 4 g CO2eq/MJ. In a pathway with greater transport distances (4300 km to the EU border and 700 km within it), WtT GHG emissions of just under 10 g CO2eq/MJ were calculated. Another essential contribution to environmental impacts was given by the step of conditioning and distribution, which also includes the compression of gas at service stations. For these steps, values of around 4 g CO2eq/MJ were identified [192].
The LNG supply is also multi-stage. Gas production is followed by a processing step. This is usually then followed by gas transport (e.g., by pipeline) before gas liquefaction occurs. The LNG produced in this process is usually then transported over longer distances (especially by ship). At the end of the chain, depending on the application option, regasification may be conducted. In the most recent version of the JEC WtT report, one LNG pathway is compared to the CNG ones [192]. Around 18 g CO2eq/MJ was calculated for this pathway. Compared to the CNG pathways, this one accompanies an additional noteworthy contribution. The contribution of around 4 g CO2eq/MJ is given by liquefaction. For LNG, an LCA study by Wachsmuth et al. [241] offers more versatile insights in the environmental performance of LNG pathways for Germany. This study considered the environmental impacts for five different cases. A broad range of climate change impacts was featured, spanning from nearly 15 g CO2eq/MJ up to around 29 g CO2eq/MJ. This large range is especially due to deliveries to Germany from regions of the world whose distances vary. The supply of conventional LNG from Katar under the considered conditions carries the lowest impacts. In contrast, the supply of unconventional LNG from Australia (Queensland) exhibited the highest. In the case of unconventional LNG sources, gas production was revealed to be the main contributor to upstream GHG emissions. Furthermore, transport distances revealed a major influence on environmental impacts.

References

  1. Intergovernmental Panel on Climate Change. Climate Change 2013: The Physical Science Basis. Contribution of Working Group I to the Fifth Assessment Report of the Intergovernmental Panel on Climate Change; Stocker, T.F., Qin, D., Plattner, G.-K., Tignor, M., Allen, S.K., Boschung, J., Nauels, A., Xia, Y., Bex, V., Midgley, P.M., Eds.; Cambridge University Press: Cambridge, UK; New York, NY, USA, 2013; p. 1535. [Google Scholar]
  2. United Nations. Paris Agreement. In Proceedings of the UN Climate Change Conference (COP21), Paris, France, 30 November–12 December 2015. [Google Scholar]
  3. Welke, M.; Beck, M. Klimaschutz in Zahlen, Fakten, Trends und Impulse Deutscher Klimapolitik Ausgabe 2020; Bundesministerium für Umwelt, Naturschutz und nukleare Sicherheit: Berlin, Germany, 2020.
  4. Schemme, S.; Breuer, J.L.; Köller, M.; Meschede, S.; Walman, F.; Samsun, R.C.; Peters, R.; Stolten, D. H2-based synthetic fuels: A techno-economic comparison of alcohol, ether and hydrocarbon production. Int. J. Hydrog. Energy 2020, 45, 5395–5414. [Google Scholar] [CrossRef]
  5. Prussi, M.; Yugo, M.; Prada, L.D.; Padella, M.; Edwards, R. JEC Well-To-Wheels Report v5; Publications Office of the European Union: Luxembourg, 2020.
  6. Pfennig, M.; Gerhardt, N.; Pape, C.; Böttger, D. Mittel-und Langfristige Potenziale von PtL-und H2-Importen aus Internationalen EE-Vorzugsregionen; Fraunhofer-Institut für Windenergie und Energiesystemtechnik: Kassel, Germany, 2017. [Google Scholar]
  7. Schorn, F.; Breuer, J.L.; Samsun, R.C.; Schnorbus, T.; Heuser, B.; Peters, R.; Stolten, D. Methanol as a renewable energy carrier: An assessment of production and transportation costs for selected global locations. Adv. Appl. Energy 2021, 3, 100050. [Google Scholar] [CrossRef]
  8. Bracker, J.; Timpe, C. An Outline of Sustainability Criteria for Synthetic Fuels Used in Transport; Öko-Institut e.V.: Freiburg, Germany, 2017. [Google Scholar]
  9. Liebich, A.; Fröhlich, T.; Münter, D.; Fehrenbach, H.; Giegrich, J.; Köppen, S.; Dünnebeil, F.; Knörr, W.; Biemann, K.; Simon, S.; et al. Detailed Analyses of the System Comparison of Storable Energy Carriers from Renewable Energies—Final Report; Federal Environment Agency: Dessau-Roßlau, Germany, 2021. Available online: https://inis.iaea.org/search/search.aspx?orig_q=reportnumber:%22UBA-FB--000263/ANH%22 (accessed on 9 December 2021).
  10. Liebich, A.; Fröhlich, T.; Münter, D.; Fehrenbach, H.; Giegrich, J.; Köppen, S.; Dünnebeil, F.; Knörr, W.; Biemann, K.; Simon, S.; et al. Detailed Analyses of the System Comparison of Storable Energy Carriers from Renewable Energies—Annex; Federal Environment Agency: Dessau-Roßlau, Germany, 2021. Available online: https://www.researchgate.net/publication/350121764_Full_text_SYSEET_Detailed_analyses_of_the_system_comparison_of_storable_energy_carriers_from_renewable_energies_Annex (accessed on 9 December 2021).
  11. Ziolkowska, J.R. Chapter 1—Biofuels technologies: An overview of feedstocks, processes, and technologies. In Biofuels for a More Sustainable Future; Elsevier: Amsterdam, The Netherlands, 2020; pp. 1–19. [Google Scholar] [CrossRef]
  12. Peters, R.; Decker, M.; Eggemann, L.; Schemme, S.; Schorn, F.; Breuer, J.L.; Weiske, S.; Pasel, J.; Samsun, R.C.; Stolten, D. Thermodynamic and ecological preselection of synthetic fuel intermediates from biogas at farm sites. Energy Sustain. Soc. 2020, 10, 4. [Google Scholar] [CrossRef]
  13. Peters, R.; Baltruweit, M.; Grube, T.; Samsun, R.C.; Stolten, D. A techno economic analysis of the power to gas route. J. CO2 Util. 2019, 34, 616–634. [Google Scholar] [CrossRef]
  14. Bruchof, D. Energiewirtschaftliche Verkehrsstrategie—Möglichkeiten und Grenzen Alternativer Kraftstoffe und Antriebe in Deutschland und der EU-27. Ph.D. Thesis, Universität Stuttgart, Stuttgart, Germany, 2012. [Google Scholar]
  15. Mankins, J.C. Technology Readiness Levels: A White Paper; NASA, Office of Space Access and Technology, Advanced Concepts Office: Washington, DC, USA, 1995.
  16. Assistant Secretary of Defense for Research and Engineering. Technology Readiness Assessment (TRA) Guidance; Department of Defense: Washington, DC, USA, 2011.
  17. European Space Agency. Technology Readiness Level (TRL). Available online: http://sci.esa.int/sci-ft/50124-technology-readiness-level/ (accessed on 29 July 2019).
  18. European Commission. Horizon 2020—Work Programme 2016–2017. In 20. General Annexes; European Commission: Brussels, Belgium, 2017; p. 29. [Google Scholar]
  19. ISO 16290:2013; Space Systems—Definition of the Technology Readiness Levels (TRLs) and Their Criteria of Assessment. International Organization for Standardization: Geneva, Switzerland, 2013.
  20. Rose, A.D.; Buna, M.; Strazza, C.; Olivieri, N.; Stevens, T.; Peeters, L.; Tawil-Jamault, D. Technology Readiness Level Guidance Principles for Renewable Energy Technologies—Final Report; European Commission: Brussels, Belgium, 2017. [Google Scholar]
  21. Australian Renewable Energy Agency. Commercial Readiness Index for Renewable Energy Sector. Available online: https://arena.gov.au/assets/2014/02/Commercial-Readiness-Index.pdf (accessed on 18 March 2021).
  22. Wermuth, M.; Neef, C.; Wirth, R.; Hanitz, I.; Löhner, H.; Hautzinger, H.; Stock, W.; Pfeiffer, M.; Fuchs, M.; Lenz, B.; et al. Kraftfahrzeugverkehr in Deutschland 2010; Bundesministerium für Verkehr, Bau und Stadtentwicklung: Braunschweig, Germany, 2012.
  23. Nobis, C.; Kuhnimhof, T. Mobilität in Deutschland—MiD Ergebnisbericht, Studie von Infas, DLR, IVT und Infas 360 im Auftrag des Bundesministers für Verkehr und Digitale Infrastruktur; Infas Institut für Angewandte Sozialwissenschaft GmbH: Bonn/Berlin, Germany, 2018. [Google Scholar]
  24. Radke, S. Verkehr in Zahlen 2019/2020; Bundesministerium für Verkehr und digitale Infrastruktur: Flensburg, Germany, 2019.
  25. Tesla, Inc. WLTP Reichweite Tesla Model S. Available online: https://www.tesla.com/de_de/models (accessed on 14 May 2020).
  26. Breuer, J.L.; Can Samsun, R.; Peters, R.; Stolten, D. Road traffic volume map 2014 for North Rhine-Westphalia, Germany. Harv. Dataverse 2019. [Google Scholar] [CrossRef]
  27. Breuer, J.L.; Samsun, R.C.; Peters, R.; Stolten, D. The impact of diesel vehicles on NOx and PM10 emissions from road transport in urban morphological zones: A case study in North Rhine-Westphalia, Germany. Sci. Total Environ. 2020, 727, 138583. [Google Scholar] [CrossRef] [PubMed]
  28. McKinsey & Company. Hydrogen-Powered Aviation a Fact-Based Study of Hydrogen Technology, Economics, and Climate Impact by 2050; Publications Office of the European Union: Luxembourg, 2020.
  29. Bundesnetzagentur für Elektrizität, Gas, Telekommunikation, Post und Eisenbahnen; Marktuntersuchung Eisenbahnen: Bonn, Germany, 2019.
  30. Deutsche Bahn Netze. Infrastrukturregister: Grundsätze Stand Juni 2019, Version 4. Available online: https://fahrweg.dbnetze.com/fahrweg-de/kunden/nutzungsbedingungen/infrastrukturregister/grundsaetze-1369462 (accessed on 5 August 2019).
  31. Statistisches Bundesamt. Güterverkehrsstatistik der Binnenschifffahrt 2016; Statistisches Bundesamt: Wiesbaden, Germany, 2017.
  32. Helgeson, B.; Peter, J. The role of electricity in decarbonizing European road transport—Development and assessment of an integrated multi-sectoral model. Appl. Energy 2020, 262, 114365. [Google Scholar] [CrossRef] [Green Version]
  33. Köhler, J.; Kirsch, D.; Klukas, A.; Timmerberg, S.; Kaltschmitt, M. Teilstudie “Studie über die Marktreife von Erdgasmotoren in der Binnen-und Seeschifffahrt”; Wissenschaftliche Beratung des BMVI zur Mobilitäts-und Kraftstoffstrategie: Karlsruhe, Germany, 2018.
  34. Robinius, M.; Markewitz, P.; Lopion, P.; Kullmann, F.; Heuser, P.-M.; Syranidis, K.; Cerniauskas, S.; Schöb, T.; Reuß, M.; Ryberg, S.; et al. Wege Für Die Energiewende Kosteneffiziente und klimagerechte Transformationsstrategien für das deutsche Energiesystem bis zum Jahr 2050. Energy Environ. 2020, 499, 1–141. [Google Scholar]
  35. Van Wijk, A.; van der Roest, E.; Boere, J. Solar Power to the People; IOS Press BV: Amsterdam, The Netherlands, 2017. [Google Scholar]
  36. Hydrogen Council. Path to Hydrogen Competitiveness a Cost Perspective; Hydrogen Council: Brussels, Belgium, 2020.
  37. Hydrogen Council, McKinsey & Company. Hydrogen Insights a Perspective on Hydrogen Investment, Market Development and Cost Competitiveness; Hydrogen Council: Brussels, Belgium, 2021.
  38. Transport & Environment. RED II and Advanced Biofuels, Recommendations about Annex IX of the Renewable Energy Directive and Its Implementation at National Level; Transport & Environment: Brussels, Belgium, 2020.
  39. European Union. Directive (EU) 2018/2001 of the European Parliament and of the Council of 11 December 2018 on the Promotion of the Use of Energy from Renewable Sources (Recast); European Union: Brussels, Belgium, 2018. [Google Scholar]
  40. Gemeinsame Forschungsstelle, Institut für Energie und Verkehr; Hamje, H.; Hass, H.; Lonza, L.; Maas, H.; Reid, A.; Rose, K.D.; Venderbosch, T. EU Renewable Energy Targets in 2020: Revised Analysis of Scenarios for Transport Fuels; Publications Office: Brussels, Belgium, 2014.
  41. European Commission. Report from the Commission to the European Parliament, the Council, the European Economic and Social Committee and the Committee of the Regions on the Status of Production Expansion of Relevant Food and Feed Crops Worldwide; European Commission: Brussels, Belgium, 2019. [Google Scholar]
  42. European Commission. Commission Delegated Regulation (EU) 2019/807 of 13 March 2019 Supplementing Directive (EU) 2018/2001 of the European Parliament and of the Council as Regards the Determination of High Indirect Land-Use Change-Risk Feedstock for Which a Significant Expansion of the Production Area into Land with High Carbon Stock Is Observed and the Certification of Low Indirect Land-Use Change-Risk Biofuels, Bioliquids and Biomass Fuels; European Union: Brussels, Belgium, 2019. [Google Scholar]
  43. Mineralöl Wirtschafts Verband e.V. Jahresbericht 2018, Vision 2050, Flüssige Kraftstoffe bewegen Deutschland auch 2050. Available online: https://www.mwv.de/wp-content/uploads/2016/06/180830_MWV_Jahresbericht-2018_RZ_Web_es_small.pdf (accessed on 20 February 2020).
  44. Arbeitsgruppe Erneuerbare Energien-Statistik. Erneuerbare Energien in Deutschland Daten zur Entwicklung im Jahr 2019; Umweltbundesamt: Dessau-Roßlau, Germany, 2020.
  45. Referat 221—Grundsatzangelegenheiten der Gruppe 22, Anerkennungs- und Akkreditierungsfragen, nachhaltige Biomasse. Evaluations-und Erfahrungsbericht für das Jahr 2017—Biomassestrom-Nachhaltigkeitsverordnung—Biokraftstoff-Nachhaltigkeitsverordnung; Bundesanstalt für Landwirtschaft und Ernährung: Bonn, Germany, 2018.
  46. Fehrenbach, H. Einsatz von Biokraftstoffen im Verkehrssektor bis 2030; IFEU—Institut für Energie-und Umweltforschung GmbH: Heidelberg, Germany, 2019.
  47. Billig, E.; Decker, M.; Benzinger, W.; Ketelsen, F.; Pfeifer, P.; Peters, R.; Stolten, D.; Thrän, D. Non-fossil CO2 recycling—The technical potential for the present and future utilization for fuels in Germany. J. CO2 Util. 2019, 30, 130–141. [Google Scholar] [CrossRef]
  48. Brosowski, A.; Thrän, D.; Mantau, U.; Mahro, B.; Erdmann, G.; Adler, P.; Stinner, W.; Reinhold, G.; Hering, T.; Blanke, C. A review of biomass potential and current utilisation—Status quo for 93 biogenic wastes and residues in Germany. Biomass Bioenergy 2016, 95, 257–272. [Google Scholar] [CrossRef] [Green Version]
  49. DBFZ Deutsches Biomasseforschungszentrum gemeinnützige GmbH; Brosowski, A.; Adler, P.; Erdmann, G.; Stinner, W.; Thrän, D.; Mantau, U.; Blanke, C.; Mahro, B.; Hering, T.; et al. Biomassepotentiale von Rest-und Abfallstoffen; Fachagentur Nachwachsende Rohstoffe e. V. (FNR): Gülzow-Prüzen, Germany, 2015. [Google Scholar]
  50. Fehrenbach, H.; Giegrich, J.; Köppen, S. BioRest: Verfügbarkeit und Nutzungsoptionen Biogener Abfall-und Reststoffe im Energiesystem (Strom-, Wärme-und Verkehrssektor); Umweltbundesamt TEXTE: Berlin, Germany, 2019.
  51. Johansson, S. Limits to biofuels. EPJ Web Conf. 2013, 54, 01014. [Google Scholar] [CrossRef] [Green Version]
  52. De Castro, C.; Carpintero, Ó.; Frechoso, F.; Mediavilla, M.; de Miguel, L.J. A top-down approach to assess physical and ecological limits of biofuels. Energy 2014, 64, 506–512. [Google Scholar] [CrossRef]
  53. Soler, A.; Yugo, M. Role of E-Fuels in the European Transport System—Literature Review; No. 14/19; Concawe: Brussels, Belgium, 2020. [Google Scholar]
  54. Kasten, P.; Heinemann, C. Kein Selbstläufer: Klimaschutz und Nachhaltigkeit durch PtX.; Öko-Institut e.V.: Berlin, Germany, 2019. [Google Scholar]
  55. International Energy Agency. Technology Roadmap Biofuels for Transport. Available online: https://webstore.iea.org/download/direct/632?fileName=Biofuels_Roadmap_WEB.pdf (accessed on 18 March 2021).
  56. Eurostat Statistics Explained. Land Cover Statistics. Available online: https://ec.europa.eu/eurostat/statistics-explained/index.php?title=Land_cover_statistics#Land_cover_in_the_EU (accessed on 25 November 2020).
  57. Zelt, O.; Kobiela, G.; Ortiz, W.; Scholz, A.; Monnerie, N.; Rosenstiel, A.; Viebahn, P. Multikriterielle Bewertung von Bereitstellungstechnologien Synthetischer Kraftstoffe; Wuppertal Institut für Klima, Umwelt, Energie gGmbH: Wuppertal, Germany, 2021. [Google Scholar]
  58. ASTM D7566-20b; Standard Specification for Aviation Turbine Fuel Containing Synthesized Hydrocarbons. ASTM International: West Conshohocken, PA, USA, 2020.
  59. Wormslev, E.C.; Broberg, M.K. Nordic Perspectives on the Use of Advanced Sustainable Jet Fuel for Aviation—Update 2019; Nordic Energy Research: Kopenhagen, Denmark, 2020. [Google Scholar]
  60. ICAO Secretariat. Estimated Prices of Aviation Alternative Fuels. In Proceedings of the Conference on Aviation and Alternative Fuels, Mexico City, Mexico, 11 October 2017. [Google Scholar]
  61. Sustainable Aviation. Sustainable Aviation Fuels Road-Map. Available online: https://www.sustainableaviation.co.uk/wp-content/uploads/2020/02/SustainableAviation_FuelReport_20200231.pdf (accessed on 26 March 2020).
  62. Schmidt, P.; Batteiger, V.; Roth, A.; Weindorf, W.; Raksha, T. Power-to-Liquids as Renewable Fuel Option for Aviation: A Review. Chem. Ing. Tech. 2018, 90, 127–140. [Google Scholar] [CrossRef]
  63. Tabak, S.A.; Avidan, A.A.; Krambeck, F.J. Production of Synthetic Gasoline and Diesel Fuel from Non-Petroleum Resources; Mobil Research and Development Corp., Research Dept., Paulsboro Lab.: Paulsboro, NJ, USA, 1986; pp. 293–299. [Google Scholar]
  64. Tabak, S.A.; Yurchak, S. Conversion of methanol over ZSM-5 to fuels and chemicals. Catal. Today 1990, 6, 307–327. [Google Scholar] [CrossRef]
  65. Ruokonen, J.; Nieminen, H.; Dahiru, A.R.; Laari, A.; Koiranen, T.; Laaksonen, P.; Vuokila, A.; Huuhtanen, M. Modelling and Cost Estimation for Conversion of Green Methanol to Renewable Liquid Transport Fuels via Olefin Oligomerisation. Processes 2021, 9, 1046. [Google Scholar] [CrossRef]
  66. Zech, K.; Naumann, K.; Müller-Langer, F.; Schmidt, P.; Weindorf, W.; Altmann, M.; Michalski, J.; Niklaß, M.; Meyer, H.; Lischke, A.; et al. Biokerosin und EE-Kerosin für Die Luftfahrt der Zukunft—von der Theorie zu Pilotvorhaben; Federal Ministry for Digital and Transport: Leipzig, Germany; Munich, Germany; Berlin/Heidelberg, Germany, 2011.
  67. Fulcrum. Sierra BioFuels Plant. Available online: http://fulcrum-bioenergy.com/facilities/ (accessed on 3 December 2020).
  68. Red Rock Biofuels. Red Rock Biofuels—Lakeview Plant. Available online: https://www.redrockbio.com/lakeview-site/ (accessed on 3 December 2020).
  69. Neste Oyj. What Is Neste MY Sustainable Aviation Fuel? Available online: https://www.neste.com/products/all-products/aviation/key-benefits (accessed on 3 December 2020).
  70. BETO-Funded Technology Produces Jet Fuel for Virgin Atlantic. Available online: https://www.energy.gov/eere/bioenergy/articles/beto-funded-technology-produces-jet-fuel-virgin-atlantic (accessed on 3 December 2020).
  71. Ekobenz. Innovative Production of Synthetic Fuels. Available online: http://ekobenz.com/production-plant (accessed on 3 December 2020).
  72. Stark, A. Lanzatech Wins Bid for World’s First Large Scale ATJ Facility. Available online: www.process-worldwide.com (accessed on 21 December 2021).
  73. European Comission. Production of Fully Synthetic Paraffinic Jet Fuel from Wood and Other Biomass. Available online: https://cordis.europa.eu/project/id/612763 (accessed on 3 December 2020).
  74. Euglena Co. Ltd. ASTM D7566 Revised to Add a New Standard for Jet Fuel Produced through the BIC Process, the Technology Employed in Euglena Co’s Demo Plant. Available online: https://www.euglena.jp/pdf/n20200131.pdf (accessed on 21 December 2021).
  75. IHI. Bio-jet Fuel Manufactured from Microalgae Receives ASTM International Standard Certification-Contributing to the Reduction of CO2 Emissions from Aircraft. Available online: https://www.ihi.co.jp/en/all_news/2020/other/1196667_2042.html (accessed on 21 December 2021).
  76. Müller-Langer, F.; Majer, S.; O’Keeffe, S. Benchmarking biofuels—A comparison of technical, economic and environmental indicators. Energy Sustain. Soc. 2014, 4, 20. [Google Scholar] [CrossRef] [Green Version]
  77. Leitner, W.; Klankermayer, J.; Pischinger, S.; Pitsch, H.; Kohse-Hoinghaus, K. Advanced Biofuels and Beyond: Chemistry Solutions for Propulsion and Production. Angew. Chem. Int. Ed. 2017, 56, 5412–5452. [Google Scholar] [CrossRef] [PubMed]
  78. Schemme, S.; Breuer, J.L.; Samsun, R.C.; Peters, R.; Stolten, D. Promising catalytic synthesis pathways towards higher alcohols as suitable transport fuels based on H2 and CO2. J. CO2 Util. 2018, 27, 223–237. [Google Scholar] [CrossRef]
  79. Schemme, S.; Meschede, S.; Köller, M.; Samsun, R.C.; Peters, R.; Stolten, D. Property Data Estimation for Hemiformals, Methylene Glycols and Polyoxymethylene Dimethyl Ethers and Process Optimization in Formaldehyde Synthesis. Energies 2020, 13, 3401. [Google Scholar] [CrossRef]
  80. Deutsche Energie-Agentur. Audi E-Gas Projekt. Available online: https://www.powertogas.info/projektkarte/audi-e-gas-projekt/ (accessed on 10 January 2020).
  81. BMWi, Federal Ministry for Economic Affairs and Climate Action. The National Hydrogen Strategy; BMWi: Berlin, Germany, 2020.
  82. Bründlinger, T.; König, J.E.; Frank, O.; Gründig, D.; Jugel, C.; Kraft, P.; Krieger, O.; Mischinger, S.; Prein, D.P.; Seidl, H.; et al. Dena-Leitstudie Integrierte Energiewende; Deutsche Energie-Agentur: Berlin, Germany, 2018. [Google Scholar]
  83. Merten, F.; Scholz, A.; Krüger, C.; Heck, S.; Girard, Y.; Mecke, M.; Goerge, M. Bewertung der Vor-und Nachteile von Wasserstoffimporten im Vergleich zur Heimischen Erzeugung; Wuppertal Institut, DIW Econ: Wuppertal, Germany, 2020. [Google Scholar]
  84. Dena, German Energy Agency. Zwischenbericht, dena-Leitstudie Aufbruch Klimaneutralität, Ein Blick in die Werkstatt: Erste Erkenntnisse und Ableitungen Zentraler Handlungsfelder; Deutsche Energie-Agentur GmbH: Berlin, Germany, 2021. [Google Scholar]
  85. Perner, J.; Unteutsch, M.; Lövenich, A. The Future Cost of Electricity-Based Synthetic Fuels; Agora Energiewende, Frontier Economics: Berlin, Germany, 2018. [Google Scholar]
  86. Fasihi, M.; Breyer, C. Baseload electricity and hydrogen supply based on hybrid PV-wind power plants. J. Clean. Prod. 2020, 243, 118466. [Google Scholar] [CrossRef]
  87. Hank, C.; Sternberg, A.; Köppel, N.; Holst, M.; Smolinka, T.; Schaadt, A.; Hebling, C.; Henning, H.-M. Energy efficiency and economic assessment of imported energy carriers based on renewable electricity. Sustain. Energy Fuels 2020, 4, 2256–2273. [Google Scholar] [CrossRef]
  88. Ishmam, S.; Winkler, C.; Sanchez, P.-E.; Ojieabu, N.; Heinrichs, H.; Agbo, S.; Kuckertz, P.; Khuat, H.; Patil, S.; Kotzur, L.; et al. H2ATLAS-AFRICA. Available online: https://africa.h2atlas.de/ (accessed on 21 December 2021).
  89. Schindler, J. Gestehungskosten von PtX-Produkten im Vergleich Zwischen Deutschland und Nordafrika; EnergieAgentur.NRW: Wuppertal, Germany, 2019. [Google Scholar]
  90. Eichhammer, W.; Oberle, S.; Händel, M.; Boie, I.; Gnann, T.; Wietschel, M.; Lux, B. Study on the Opportunities of “Power-to-X” in Morocco; Fraunhofer Institute for Systems and Innovation Research: Karlsruhe, Germany, 2019. [Google Scholar]
  91. IEA, International Energy Agency. The Future of Hydrogen Seizing Today’s Opportunities. Available online: https://iea.blob.core.windows.net/assets/9e3a3493-b9a6-4b7d-b499-7ca48e357561/The_Future_of_Hydrogen.pdf (accessed on 9 November 2021).
  92. Kreidelmeyer, S.; Dambeck, H.; Kirchner, A.; Wünsch, M. Kosten und Transformationspfade für Strombasierte Energieträger; Prognos AG: Basel, Switzerland, 2020. [Google Scholar]
  93. IEA, International Energy Agency. IEA G20 Hydrogen Report: Assumptions. Available online: https://iea.blob.core.windows.net/assets/29b027e5-fefc-47df-aed0-456b1bb38844/IEA-The-Future-of-Hydrogen-Assumptions-Annex_CORR.pdf (accessed on 21 December 2021).
  94. Robinius, M. Strom- und Gasmarktdesign zur Versorgung des Deutschen Straßenverkehrs mit Wasserstoff; Forschungszentrum Jülich: Jülich, Germany, 2016; Volume 300. [Google Scholar]
  95. Kawasaki. Liquefied Hydrogen Carrier with World’s Highest Carrying Capacity—AiP Obtained from ClassNK. Available online: https://global.kawasaki.com/en/corp/newsroom/news/detail/?f=20210506_9983 (accessed on 15 December 2021).
  96. Fraunhofer IEE. PtX-Atlas. Available online: https://maps.iee.fraunhofer.de/ptx-atlas/ (accessed on 20 December 2021).
  97. Huss, A.; Maas, H.; Hass, H. Well-to-Wheels Analysis of Future Automotive Fuels and Powertrains in the European Context TANK-TO-WHEELS (TTW) Report Version 4; Publications Office of the European Union: Luxembourg, 2013.
  98. Robinius, M.; Linßen, J.; Grube, T.; Reuß, M.; Stenzel, P.; Syranidis, K.; Kuckertz, P.; Stolten, D. Comparative Analysis of Infrastructures: Hydrogen Fueling and Electric Charging of Vehicles. Schr. Des Forsch. Jülich Reihe Energ. Umw. Energy Environ. 2018, 408, 108. [Google Scholar]
  99. Union zur Förderung von Oel-und Proteinpflanzen e.V. UFOP Report on Global Market Supply 2020/2021. Available online: https://www.ufop.de/files/7216/1649/5848/UFOP_SupplyReport_2020-2021__120321.pdf (accessed on 2 December 2021).
  100. Völler, K.; Reinholz, T. Branchenbarometer Biomethan 2019; Deutsche Energie-Agentur GmbH: Berlin, Germany, 2019. [Google Scholar]
  101. Bundesministerium für Wirtschaft und Energie. Gesamtausgabe der Energiedaten—Datensammlung des BMWi. Available online: https://www.bmwi.de/Redaktion/DE/Binaer/Energiedaten/energiedaten-gesamt-xls.html (accessed on 18 February 2021).
  102. Detz, R.J.; Reek, J.N.H.; van der Zwaan, B.C.C. The future of solar fuels: When could they become competitive? Energy Environ. Sci. 2018, 11, 1653–1669. [Google Scholar] [CrossRef]
  103. Union zur Förderung von Oel-und Proteinpflanzen e.V. UFOP Report on Global Market Supply 2018/2019. Available online: https://www.ufop.de/files/4815/4695/8891/WEB_UFOP_Report_on_Global_Market_Supply_18-19.pdf (accessed on 18 February 2021).
  104. Jensterle, M.; Narita, J.; Piria, R.; Schröder, J.; Steinbacher, K.; Wahabzada, F.; Zeller, T.; Crone, K.; Löchle, S. Grüner Wasserstoff: Internationale Kooperations-Potenziale für Deutschland Kurzanalyse zu Ausgewählten Aspekten Potenzieller Nicht-EU-Partnerländer; Deutsche Energie-Agentur, Deutsche Gesellschaft für Internationale Zusammenarbeit, NAVIGANT, Adelphi: Berlin, Germany, 2019. [Google Scholar]
  105. Michalski, J.; Altmann, M.; Bünger, U.; Weindorf, W. Wasserstoffstudie Nordrhein-Westfalen; Ministerium für Wirtschaft, Innovation, Digitalisierung und Energie des Landes Nordrhein-Westfalen: Düsseldorf, Germany, 2019.
  106. Gerhardt, N.; Bard, J.; Schmitz, R.; Beil, M.; Pfennig, M.; Kneiske, T. Wasserstoff im Zukünftigen Energiesystem: Fokus Gebäudewärme; Fraunhofer-Institut für Energiewirtschaft und Energiesystemtechnik: Kassel, Germany, 2020. [Google Scholar]
  107. Mottschall, M.; Kasten, P.; Kühnel, S.; Minnich, L. Sensitivitäten zur Bewertung der Kosten verschiedener Energieversorgungs-Optionen des Verkehrs bis zum Jahr 2050; TEXTE 114/2019; Umweltbundesamt, Öko-Institut: Dessau-Roßlau, Germany, 2019.
  108. Schmidt, P.R.; Zittel, W.; Weindorf, W.; Raksha, T. Renewables in Transport 2050; Forschungsvereinigung Verbrennungskraftmaschinen e.V.: Frankfurt am Main, Germany, 2016. [Google Scholar]
  109. Kramer, U.; Ortloff, F.; Stollenwerk, S.; Thee, R. Defossilisierung des Transportsektors; Forschungsvereinigung Verbrennungskraftmaschinen e.V.: Frankfurt am Main, Germany, 2018. [Google Scholar]
  110. Perner, J.; Unteutsch, M.; Lövenich, A. Die Zukünftigen Kosten Strombasierter Synthetischer Brennstoffe; Agora Verkehrswende, Agora Energiewende, Frontier Economics: Berlin, Germany, 2018. [Google Scholar]
  111. Terlouw, W.; Peters, D.; Tilburg, J.v.; Schimmel, M.; Berg, T.; Cihlar, J.; Mir, G.U.R.; Spöttle, M.; Staats, M.; Lejaretta, A.V.; et al. Gas for Climate. The Optimal Role for Gas in a Net-Zero Emissions Energy System; Navigant Netherlands B.V.: Utrecht, The Netherlands, 2019. [Google Scholar]
  112. Hobohm, J.; der Maur, A.A.; Dambeck, H.; Kemmler, A.; Koziel, S.; Kreidelmeyer, S.; Piégsa, A.; Wendring, P.; Meyer, B.; Apfelbacher, A.; et al. Status und Perspektiven Flüssiger Energieträger in der Energiewende; Fraunhofer Institut für Umwelt-, Sicherheits-und Energietechnik: Oberhausen, Germany; Deutsches Biomasseforschungszentrum gemeinnützige GmbH: Leipzig, Germany, 2018. [Google Scholar]
  113. Fasihi, M.; Breyer, C. Synthetic Fuels and Chemicals: Options and Systemic Impact. In Proceedings of the Strommarkttreffen, Berlin, Germany, 29 June 2018. [Google Scholar]
  114. DIN EN 590; Automotive Fuels—Diesel—Requirements and Test Methods. Deutsches Institut für Normung e.V.: Berlin, Germany, 2014.
  115. DIN EN 228; Automotive Fuels—Unleaded Petrol—Requirements and Test Methods. Deutsches Institut für Normung e.V.: Berlin, Germany, 2017.
  116. Schripp, T.; Herrmann, F.; Oßwald, P.; Köhler, M.; Zschocke, A.; Weigelt, D.; Mroch, M.; Werner-Spatz, C. Particle emissions of two unblended alternative jet fuels in a full scale jet engine. Fuel 2019, 256, 115903. [Google Scholar] [CrossRef]
  117. Sasol AG. Sasol Takes to the Skies with the World’s First Fully Synthetic Jet Fuel. Available online: https://www.sasol.com/media-centre/media-releases/sasol-takes-skies-world-s-first-fully-synthetic-jet-fuel (accessed on 21 December 2021).
  118. International Air Transport Association. IATA Guidance Material for Sustainable Aviation Fuel Management; International Air Transport Association: Montreal, QC, Canada; Geneva, Switzerland, 2012. [Google Scholar]
  119. Zech, K.; Naumann, K.; Müller-Langer, F.; Schmidt, P.; Weindorf, W.; Mátra, Z. Drop-In-Kraftstoffe für die Luftfahrt. Studie im Rahmen des Auftrags» Wissenschaftliche Begleitung, Unterstützung und Beratung des BMVI in den Bereichen Verkehr und Mobilität mit besonderem Fokus auf Kraftstoffe und Antriebstechnologien sowie Energie und Klima für das Bundesministerium für Verkehr und digitale Infrastruktur (BMVI); Deutsches Zentrum Für Luft-Und Raumfahrt e. V.(DLR): Berlin, Germany, 2014. [Google Scholar]
  120. Bauen, A.; Gomez, I.; OudeNijeweme, D.; Paraschiv, M. Alternative Fuels—Expert Group Report; European Commission: Brussels, Belgium, 2017. [Google Scholar]
  121. ASTM D4806-13a; Standard Specification for Denatured Fuel Ethanol for Blending with Gasolines for Use as Automotive Spark-Ignition Engine Fuel. ASTM International: West Conshohocken, PA, USA, 2013. [CrossRef]
  122. ASTM D7862-13; Standard Specification for Butanol for Blending with Gasoline for Use as Automotive Spark-Ignition Engine Fuel. ASTM International: West Conshohocken, PA, USA, 2013.
  123. Institut für nachhaltige Wirtschaft und Logistik. Potenzialanalyse Methanol als Emissionsneutraler Energieträger für Schifffahrt und Energiewirtschaft; Maritimes Cluster Norddeutschland e. V.: Elsfleth, Germany, 2018. [Google Scholar]
  124. Wei, H.; Feng, D.; Pan, J.; Shao, A.; Pan, M. Knock characteristics of SI engine fueled with n-butanol in combination with different EGR rate. Energy 2017, 118, 190–196. [Google Scholar] [CrossRef]
  125. ASTM D975-20c; Standard Specification for Diesel Fuel. ASTM International: West Conshohocken, PA, USA, 2020. [CrossRef]
  126. DIN EN 15940; Automotive Fuels—Paraffinic Diesel Fuel from Synthesis or Hydrotreatment—Requirements and Test Methods. Deutsches Institut für Normung e.V.: Berlin, Germany, 2019. [CrossRef]
  127. DIN EN 16709; Automotive Fuels—High FAME Diesel Fuel (B20 and B30)—Requirements and Test Methods. Deutsches Institut für Normung e.V.: Berlin, Germany, 2019.
  128. DIN EN 14214; Liquid Petroleum Products—Fatty Acid Methyl Esters (Fame) for Use in Diesel Engines and Heating Applications—Requirements and Test Methods. Deutsches Institut für Normung e.V.: Berlin, Germany, 2019.
  129. Bohl, T.; Smallbone, A.; Tian, G.; Roskilly, A.P. Particulate number and NO trade-off comparisons between HVO and mineral diesel in HD applications. Fuel 2018, 215, 90–101. [Google Scholar] [CrossRef] [Green Version]
  130. Kuronen, M.; Mikkonen, S.; Aakko, P.; Murtonen, T. Hydrotreated Vegetable Oil as Fuel for Heavy Duty Diesel Engines. SAE Tech. Pap. 2007, 2007-01-4031. [Google Scholar] [CrossRef]
  131. Sayin, C.; Ozsezen, A.N.; Canakci, M. The influence of operating parameters on the performance and emissions of a DI diesel engine using methanol-blended-diesel fuel. Fuel 2010, 89, 1407–1414. [Google Scholar] [CrossRef]
  132. Sayin, C. Engine performance and exhaust gas emissions of methanol and ethanol–diesel blends. Fuel 2010, 89, 3410–3415. [Google Scholar] [CrossRef]
  133. Damyanov, A. Alcoholic Fuels in Diesel Engines. Methanol, Ethanol and Butanol. In Zukünftige Kraftstoffe. ATZ/MTZ-Fachbuch; Maus, W., Ed.; Springer: Berlin/Heidelberg, Germany, 2019. [Google Scholar] [CrossRef]
  134. Rajesh Kumar, B.; Saravanan, S.; Rana, D.; Anish, V.; Nagendran, A. Effect of a sustainable biofuel—n-octanol—On the combustion, performance and emissions of a DI diesel engine under naturally aspirated and exhaust gas recirculation (EGR) modes. Energy Convers. Manag. 2016, 118, 275–286. [Google Scholar] [CrossRef]
  135. Continental. Klimaneutral Fahren: Continental Testet Erfolgreich Synthetischen Diesel-Ersatzkraftstoff OME. Available online: https://www.continental.com/de/presse/pressemitteilungen/2017-08-01-klimaneutral-fahren-92062 (accessed on 21 December 2021).
  136. Beidl, C.; Münz, M.; Mokros, A. Synthetische Kraftstoffe. In Zukünftige Kraftstoffe. ATZ/MTZ-Fachbuch; Maus, W., Ed.; Springer Vieweg: Berlin/Heidelberg, Germany, 2019; pp. 814–849. [Google Scholar] [CrossRef]
  137. Hemighaus, R.; Boval, T.; Bacha, J.; Barnes, F.; Franklin, M.; Gibbs, L.; Hogue, N.; Jones, J.; Lesnini, D.; Lind, J.; et al. Aviation Fuels Technical Review. Available online: https://skybrary.aero/bookshelf/books/2478.pdf (accessed on 28 June 2021).
  138. ASTM D7467-20a; Standard Specification for Diesel Fuel Oil, Biodiesel Blend (B6 to B20). ASTM International: West Conshohocken, PA, USA, 2020. [CrossRef]
  139. DIN EN 16734; Automotive Fuels—Automotive B10 Diesel Fuel—Requirements and Test Methods. Deutsches Institut für Normung e.V.: Berlin, Germany, 2016.
  140. Mignard, D.; Pritchard, C. On the use of electrolytic hydrogen from variable renewable energies for the enhanced conversion of biomass to fuels. Chem. Eng. Res. Des. 2008, 86, 473–487. [Google Scholar] [CrossRef]
  141. Eichlseder, H.; Klell, M. Speicherung und Transport. In Wasserstoff in der Fahrzeugtechnik: Erzeugung, Speicherung, Anwendung; Vieweg+Teubner: Wiesbaden, Germany, 2010; pp. 95–150. [Google Scholar]
  142. Aspen Plus® V10 [Computer software]; Aspen Technology Inc.: Delaware, DE, USA, 2017.
  143. ExxonMobil. ExxonMobil Jet Fuel. Available online: https://www.exxonmobil.com/en-FI/Commercial-Fuel/pds/GL-XX-JetFuel-Series (accessed on 26 May 2020).
  144. Hahne, E. Technische Thermodynamik; Springer: Oldenbourg, Germany, 2011. [Google Scholar]
  145. National Institute of Standards and Technology. NIST Standard Reference Simulation Website; NIST Standard Reference Database Number: Gaithersburg, MD, USA, 2019; Volume 173. [Google Scholar]
  146. Kim, S.; Thiessen, P.A.; Bolton, E.E.; Chen, J.; Fu, G.; Gindulyte, A.; Han, L.; He, J.; He, S.; Shoemaker, B.A.; et al. PubChem Substance and Compound databases. Nucleic Acids Res. 2016, 44, D1202–D1213. [Google Scholar] [CrossRef] [PubMed]
  147. Liu, H.; Wang, Z.; Wang, J.; He, X.; Zheng, Y.; Tang, Q.; Wang, J. Performance, combustion and emission characteristics of a diesel engine fueled with polyoxymethylene dimethyl ethers (PODE3-4)/diesel blends. Energy 2015, 88, 793–800. [Google Scholar] [CrossRef]
  148. Ulvestad, A. A brief Review of Current Lithium Ion Battery Technology and Potential Solid State Battery Technologies. arXiv 2018, arXiv:1803.04317. [Google Scholar]
  149. Institut für Arbeitsschutz der Deutschen Gesetzlichen Unfallversicherung. GESTIS-Stoffdatenbank Methan. Available online: http://gestis.itrust.de/nxt/gateway.dll/gestis_de/000000.xml?f=templates$fn=default.htm$vid=gestisdeu:sdbdeu$3.0 (accessed on 26 May 2020).
  150. BP P.L.C. Safety data sheet Residual Fuel Oil (Flashpoint > 100 °C)—Blended. Available online: https://www.bp.com/content/dam/bp/business-sites/en/global/bp-global-energy-trading/documents/what-we-do/marine/ara/belguim-rma-rmk-terminal-high-flash.pdf (accessed on 18 February 2021).
  151. Ernst, C.-S. Energetische, Ökologische und Ökonomische Lebenszyklusanalyseelektrifizierter Antriebsstrangkonzepte. Ph.D. Thesis, RWTH Aachen University, Aachen, Germany, 2015. [Google Scholar]
  152. Bräunling, W.J.G. Reale Triebwerkskreisprozesse. In Flugzeugtriebwerke: Grundlagen, Aero-Thermodynamik, Ideale und Reale Kreisprozesse, Thermische Turbomaschinen, Komponenten, Emissionen und Systeme; Springer: Berlin/Heidelberg, Germany, 2009; pp. 1141–1251. [Google Scholar]
  153. Van Basshuysen, R.; Schäfer, F. (Eds.) Handbuch Verbrennungsmotor: Grundlagen, Komponenten, Systeme, Perspektiven. 8. Überarbeitete Auflage ed.; Springer Vieweg: Wiesbaden, Germany, 2017; p. 1841. [Google Scholar]
  154. Füßel, A. Vergleich der aktuellen BEV-und ICE-Technologie. In Technische Potenzialanalyse der Elektromobilität; Springer Vieweg: Wiesbaden, Germany, 2017; pp. 15–33. [Google Scholar]
  155. Zerta, M.; Schmidt, P.; Weindorf, W.; Bünger, U.; Langfeldt, L.; Scholz, B.; Giebel, L.-V.; Klemm, P.; Sattler, G. SHIPFUEL–Strombasierte Kraftstoffe für Brennstoffzellen in der Binnenschifffahrt–Hintergrundbericht; Studie im Auftrag der Nationalen Organisation Wasserstoff-und Brennstoffzellentechnologie (NOW) für das Bundesministerium für Verkehr und Digitale Infrastruktur (BMVI); Nationale Organisation Wasserstoff- und Brennstoffzellentechnologie: München, Germany; Berlin/Hamburg; Germany, 2019. [Google Scholar]
  156. United States Department of Energy. Determining Electric Motor Load and Efficiency; EERE Publication and Product Library: Washington, DC, USA, 1997.
  157. Breeze, P. The Proton Exchange Membrane Fuel Cell. In Fuel Cells; Elsevier: Amsterdam, The Netherlands, 2017; pp. 33–43. [Google Scholar]
  158. Ahluwalia, R.K.; Wang, X. Direct hydrogen fuel cell systems for hybrid vehicles. J. Power Sources 2005, 139, 152–164. [Google Scholar] [CrossRef]
  159. INFRAS. Handbuch für Emissionsfaktoren des Straßenverkehrs (HBEFA). Available online: https://www.hbefa.net/d/ (accessed on 25 January 2021).
  160. Bünger, U.; Landinger, H.; Weindorf, W.; Wurster, R.; Zerhusen, J.; Zittel, W. Vergleich von CNG und LNG zum Einsatz in LKW im Fernverkehr, Eine Expertise für die Open Grid Europe GmbH | Abschlussbericht; Ludwig-Bölkow-Systemtechnik GmbH: Ottobrunn, Germany, 2016. [Google Scholar]
  161. Weiss, M.; Cloos, K.C.; Helmers, E. Energy efficiency trade-offs in small to large electric vehicles. Environ. Sci. Eur. 2020, 32, 46. [Google Scholar] [CrossRef] [Green Version]
  162. Otten, M.; ’T Hoen, M.; den Boer, E. STREAM Freight Transport 2016: Emissions of Freight Transport Modes; CE Delft: Delft, The Netherlands, 2017. [Google Scholar]
  163. CE Cideon Engineering GmbH Co. KG. Produktblatt Hybrid Lokomotive. Available online: https://www.cideon-engineering.com/de/wp-content/uploads/sites/2/2019/02/CE_Produktblatt_HybidLokomotive.pdf (accessed on 18 February 2021).
  164. Bombardier. World Premiere: Bombardier Transportation Presents a New Battery-Operated Train and Sets Standards for Sustainable Mobility. Available online: https://rail.bombardier.com/en/about-us/worldwide-presence/germany/de.html/bombardier/news/2018/bt-20180912-world-premiere--bombardier-transportation-presents-a/de (accessed on 21 December 2021).
  165. Vlexx GmbH. Bombardier TALENT 3 Datenblatt. Available online: https://www.vlexx.de/media/vlexx/downloads/ens/Datenblatt_TALENT-3_lr.pdf (accessed on 15 October 2021).
  166. Betz, P. Neue Diesel-Hybrid-Technik von Voith Turbo für Schienenfahrzeuge. Available online: https://www.openpr.de/news/194991/Neue-Diesel-Hybrid-Technik-von-Voith-Turbo-fuer-Schienenfahrzeuge.html (accessed on 21 December 2021).
  167. Alstom. World Premiere: Alstom’s Hydrogen Trains Enter Passenger Service in Lower Saxony. Available online: https://www.alstom.com/press-releases-news/2018/9/world-premiere-alstoms-hydrogen-trains-enter-passenger-service-lower (accessed on 21 December 2021).
  168. Plank-Wiedenbeck, U.; Jentsch, M.; Lademann, F.; Büttner, S.; Meyer, N.; Ivanov, A. Schlussbericht Machbarkeitsstudie Pilotprojekt Einsatz von H2BZ-Triebwagen in Thüringen; Freistaat Thüringen Ministerium für Umwelt, Energie und Naturschutz: Weimar, Germany, 2019.
  169. Deutsche Bahn AG. Grundlagenbericht UmweltMobilCheck, Stand 01.04.2016. Available online: https://www.deutschebahn.com/resource/blob/265408/a54aed9e6a0513294c3b9607986fb38f/umc__grundlagenbericht__2016-data.pdf (accessed on 22 June 2019).
  170. Roland Berger. Hydrogen—A Future Fuel for Aviation? Available online: https://www.rolandberger.com/publications/publication_pdf/roland_berger_hydrogen_the_future_fuel_for_aviation.pdf (accessed on 21 December 2021).
  171. Seeckt, K.; Scholz, D. Jet versus Prop, Hyrogen versus Kerosene for a Regional Freighter Aircraft. In Proceedings of the Deutscher Luft- und Raumfahrtkongress. 2009. Available online: https://www.fzt.haw-hamburg.de/pers/Scholz/GF/GF_Paper_DLRK_09-09-08.pdf (accessed on 21 December 2021).
  172. Umweltbundesamt. Jährliche Treibhausgas-Emissionen in Deutschland/Annual Greenhouse Gas Emissions in Germany—Nationales Treibhausgasinventar 2021, 12/2020; Umweltbundesamt: Dessau-Roßlau, Germany, 2021.
  173. Meyer, K.; Helms, H.; Fehrenbach, H.; Biemann, K.; Kämper, C.; Lambrecht, U.; Jöhrens, J. Klimabilanz von Strombasierten Antrieben und Kraftstoffen; Agora Verkehrswende: Berlin, Germany, 2019; p. 56. [Google Scholar]
  174. Naumann, K.; Schröder, J.; Oehmichen, K.; Etzold, H.; Müller-Langer, F.; Remmele, E.; Thuneke, K.; Raksha, T.; Schmidt, P. Monitoring Biokraftstoffsektor; Deutsches Biomasseforschugnszentrum gemeinnützige GmbH: Leipzig, Germany, 2019. [Google Scholar]
  175. ISO 14040; Environmental Management—Life Cycle Assessment—Principles and Framework. International Organization for Standardization (ISO): Geneva, Switzerland, 2006.
  176. ISO 14044; Environmental Management—Life Cycle Assessment—Requirements and Guidelines. International Organization for Standardization (ISO): Geneva, Switzerland, 2006.
  177. Moro, A.; Helmers, E. A new hybrid method for reducing the gap between WTW and LCA in the carbon footprint assessment of electric vehicles. Int. J. Life Cycle Assess. 2017, 22, 4–14. [Google Scholar] [CrossRef] [Green Version]
  178. Koj, J.C.; Wulf, C.; Zapp, P. Environmental impacts of power-to-X systems—A review of technological and methodological choices in Life Cycle Assessments. Renew. Sustain. Energy Rev. 2019, 112, 865–879. [Google Scholar] [CrossRef]
  179. Zhang, X.; Bauer, C.; Mutel, C.L.; Volkart, K. Life Cycle Assessment of Power-to-Gas: Approaches, system variations and their environmental implications. Appl. Energy 2017, 190, 326–338. [Google Scholar] [CrossRef]
  180. Walker, S.B.; Fowler, M.; Ahmadi, L. Comparative life cycle assessment of power-to-gas generation of hydrogen with a dynamic emissions factor for fuel cell vehicles. J. Energy Storage 2015, 4, 62–73. [Google Scholar] [CrossRef]
  181. Koj, J.C.; Wulf, C.; Linssen, J.; Schreiber, A.; Zapp, P. Utilisation of excess electricity in different Power-to-Transport chains and their environmental assessment. Transp. Res. Part D Transp. Environ. 2018, 64, 23–35. [Google Scholar] [CrossRef]
  182. Kigle, S.; Pichlmaier, S.; Huber, J.; Regett, A. Ökobilanz strombasierter synthetischer Kraftstoffe: Worauf es ankommt. EW 2019, 2019, 18–23. [Google Scholar]
  183. Wettstein, S.; Itten, R.; Stucki, M. Life Cycle Assessment of Renewable Methane for Transport and Mobility; Swiss National Science Foundation: Zürich, Switzerland, 2018; pp. 1–35. [Google Scholar]
  184. Rinawati, D.I.; Keeley, A.R.; Takeda, S.; Managi, S. A systematic review of life cycle assessment of hydrogen for road transport use. Prog. Energy 2021, 4, 012001. [Google Scholar] [CrossRef]
  185. Wulf, C.; Kaltschmitt, M. Hydrogen Supply Chains for Mobility—Environmental and Economic Assessment. Sustainability 2018, 10, 1699. [Google Scholar] [CrossRef] [Green Version]
  186. Koj, J.C.; Wulf, C.; Schreiber, A.; Zapp, P. Site-dependent environmental impacts of industrial hydrogen production by alkalinewater electrolysis. Energies 2017, 10, 860. [Google Scholar] [CrossRef] [Green Version]
  187. Bareiß, K.; de la Rua, C.; Möckl, M.; Hamacher, T. Life cycle assessment of hydrogen from proton exchange membrane water electrolysis in future energy systems. Appl. Energy 2019, 237, 862–872. [Google Scholar] [CrossRef]
  188. Kanz, O.; Bittkau, K.; Ding, K.; Rau, U.; Reinders, A. Review and Harmonization of the Life-Cycle Global Warming Impact of PV-Powered Hydrogen Production by Electrolysis. Front. Electron. 2021, 2, 711103. [Google Scholar] [CrossRef]
  189. Bongartz, D.; Doré, L.; Eichler, K.; Grube, T.; Heuser, B.; Hombach, L.E.; Robinius, M.; Pischinger, S.; Stolten, D.; Walther, G.; et al. Comparison of light-duty transportation fuels produced from renewable hydrogen and green carbon dioxide. Appl. Energy 2018, 231, 757–767. [Google Scholar] [CrossRef]
  190. Reiter, G.; Lindorfer, J. Global warming potential of hydrogen and methane production from renewable electricity via power-to-gas technology. Int. J. Life Cycle Assess. 2015, 20, 477–489. [Google Scholar] [CrossRef]
  191. Uusitalo, V.; Väisänen, S.; Inkeri, E.; Soukka, R. Potential for greenhouse gas emission reductions using surplus electricity in hydrogen, methane and methanol production via electrolysis. Energy Convers. Manag. 2017, 134, 125–134. [Google Scholar] [CrossRef]
  192. Prussi, M.; Yugo, M.; De Prada, L.; Padella, M.; Edwards, R.; Lonza, L. JEC Well-to-Tank report v5—Well-to-Wheels Analysis of Future Automotive Fuels and Powertrains in the European Context; Publications Office of the European Union: Luxembourg, 2020.
  193. Fachagentur Nachwachsende Rohstoffe e.V. Biokraftstoffe; Biokraftstoffe: Gülzow-Prüzen, Germany, 2014. [Google Scholar]
  194. Arvidsson, R.; Persson, S.; Fröling, M.; Svanström, M. Life cycle assessment of hydrotreated vegetable oil from rape, oil palm and Jatropha. J. Clean. Prod. 2011, 19, 129–137. [Google Scholar] [CrossRef]
  195. Bierkandt, T.; Severin, M.; Ehrenberger, S.; Köhler, M. Klimaneutrale Synthetische Kraftstoffe im Verkehr—Potenziale und Handlungsempfehlungen; DLR: Stuttgart, Germany, 2018. [Google Scholar]
  196. Biernacki, P.; Röther, T.; Paul, W.; Werner, P.; Steinigeweg, S. Environmental impact of the excess electricity conversion into methanol. J. Clean. Prod. 2018, 191, 87–98. [Google Scholar] [CrossRef]
  197. Deutz, S.; Bongartz, D.; Heuser, B.; Kätelhön, A.; Schulze Langenhorst, L.; Omari, A.; Walters, M.; Klankermayer, J.; Leitner, W.; Mitsos, A.; et al. Cleaner production of cleaner fuels: Wind-to-wheel—environmental assessment of CO2-based oxymethylene ether as a drop-in fuel. Energy Environ. Sci. 2018, 11, 331–343. [Google Scholar] [CrossRef] [Green Version]
  198. Hoppe, W.; Bringezu, S. Vergleichende Ökobilanz der CO2-basierten und konventionellen Methan- und Methanolproduktion. Uwf Umw. 2016, 24, 43–47. [Google Scholar] [CrossRef]
  199. Hoppe, W.; Thonemann, N.; Bringezu, S. Life Cycle Assessment of Carbon Dioxide-Based Production of methane and Methanol and Derived Polymers. J. Ind. Ecol. 2017, 22, 327–340. [Google Scholar] [CrossRef]
  200. Schmidt, P.; Weindorf, W. Power-to-Liquids: Potentials and Perspectives for the Future Supply of Renewable Aviation Fuel; German Environment Agency: Dessau-Roßlau, Germany, 2016.
  201. Spielmann, M.; Ruiz, S.; Zah, R. Analyse der Umwelt-Hotspots von Strombasierten Treibstoffen; BAFU: Zürich, Switzerlands, 2015; pp. 1–68.
  202. Sternberg, A.; Bardow, A. Power-to-What?—Environmental assessment of energy storage systems. Energy Environ. Sci. 2015, 8, 389–400. [Google Scholar]
  203. Sternberg, A.; Teichgräber, H.; Voll, P.; Bardow, A. CO2 vs. Biomass: Identification of Environmentally Beneficial Processes for Platform Chemicals from Renewable Carbon Sources. Comput. Aided Chem. Eng. 2015, 37, 1361–1366. [Google Scholar]
  204. Fernández-Dacosta, C.; Shen, L.; Schakel, W.; Ramirez, A.; Kramer, G.J. Potential and challenges of low-carbon energy options: Comparative assessment of alternative fuels for the transport sector. Appl. Energy 2019, 236, 590–606. [Google Scholar] [CrossRef]
  205. Matzen, M.; Demirel, Y. Methanol and dimethyl ether from renewable hydrogen and carbon dioxide: Alternative fuels production and life-cycle assessment. J. Clean. Prod. 2016, 139, 1068–1077. [Google Scholar] [CrossRef] [Green Version]
  206. Wagner, U.; Eckl, R.; Tzscheutschler, P. Energetic life cycle assessment of fuel cell powertrain systems and alternative fuels in Germany. Energy 2006, 31, 3062–3075. [Google Scholar] [CrossRef]
  207. Troy, S.; Zapp, P.; Kuckshinrichs, W.; Weiske, S.; Peters, R.; Moser, P.; Stahl, K. Life Cycle Assessment for full chain CCU demonstration in the ALIGN-CCUS project—dimethyl ether and polyoxymethylen dimethyl ethers production from CO2 and its usages in the mobility and electricity sectors. In Proceedings of the 15th International Conference on Greenhouse Gas Control Technologies, GHGT-15, Abu Dhabi, United Arab Emirates, 15–18 March 2021. [Google Scholar]
  208. Hurtig, O.; Yearwood, J. Deliverable 4.3: Economic and Environmental Impacts of Most Promising CCU Pathways; Trinomics, Dechema: 2018. Available online: http://carbonnext.eu/Deliverables/_/D4.3%20Economic%20and%20environmental%20impacts%20of%20most%20promising%20CCU%20pathways.pdf (accessed on 21 December 2021).
  209. Hombach, L.E.; Doré, L.; Heidgen, K.; Maas, H.; Wallington, T.J.; Walther, G. Economic and environmental assessment of current (2015) and future (2030) use of E-fuels in light-duty vehicles in Germany. J. Clean. Prod. 2019, 207, 153–162. [Google Scholar] [CrossRef]
  210. Alhyari, M.M.; Al-Salaymeh, A.; Irshidat, M.; Kaltschmitt, M.; Neuling, U. The Impact of Energy Source on the Life-Cycle Assessment of Power-to-Liquid Fuels. J. Ecol. Eng. 2019, 20, 239–244. [Google Scholar] [CrossRef]
  211. Volvo. LKW MIT LNG-ANTRIEB. Available online: https://www.volvotrucks.de/de-de/trucks/alternative-antriebe/lng-lkw.html (accessed on 19 December 2020).
  212. Scania. Praxisinfos zu Gas-Lkw. Available online: https://www.scania.com/de/de/home/products-and-services/articles/vorteile-erdgas-lkw.html (accessed on 19 December 2020).
  213. Stojcevski, T. METHANOL—As Engine Fuel, Status Stena Germanica and Market Overview. Available online: https://www.zerovisiontool.com/sites/www.zerovisiontool.com/files/attachments/pilo (accessed on 19 August 2019).
  214. Zhai, K. A Brief Review of China’s Methnaol Vehicle Pilot and Policy; Methanol Institute: Beijing, China, 2019. [Google Scholar]
  215. AUTO-CHE.COM. Methanol/Diesel Dual Fuel Dump Truck. Available online: http://auto-che.com/t/methanol-diesel-dump-truck.html (accessed on 21 August 2019).
  216. Wietschel, M.; Gnann, T.; Kühn, A.; Plötz, P.; Moll, C.; Speth, D.; Buch, J.; Boßmann, T.; Stütz, S.; Schellert, M.; et al. Machbarkeitsstudie zur Ermittlung der Potentiale des Hybrid-Oberleitungs-Lkw; Fraunhofer Institut für System und Innovationsforschung (ISI): Karlsruhe, Germany, 2017. [Google Scholar]
  217. Breuer, J.L.; Samsun, R.C.; Stolten, D.; Peters, R. How to reduce the greenhouse gas emissions and air pollution caused by light and heavy duty vehicles with battery-electric, fuel cell-electric and catenary trucks. Environ. Int. 2021, 152, 106474. [Google Scholar] [CrossRef] [PubMed]
  218. Peters, R.; Breuer, J.L.; Decker, M.; Grube, T.; Robinius, M.; Samsun, R.C.; Stolten, D. Future Power Train Solutions for Long-Haul Trucks. Sustainability 2021, 13, 2225. [Google Scholar] [CrossRef]
  219. European Union. Regulation (EU) 2016/1628 of the European Parliament and of the Council of 14 September 2016 on Requirements Relating to Gaseous and Particulate Pollutant Emission Limits and Type-Approval for Internal Combustion Engines for Non-Road Mobile Machinery, Amending Regulations (EU) No 1024/2012 and (EU) No 167/2013, and Amending and Repealing Directive 97/68/EC; European Union: Brussels, Belgium, 2016. [Google Scholar]
  220. Quispel, M. Reducing Air Pollutant Emissions of Inland Waterway Transport in Europe. Available online: https://www.ccr-zkr.org/files/documents/workshops/wrshp081013/1_MQuispel_en.pdf (accessed on 16 February 2021).
  221. Dahlke, F. Binnenschifffahrt—Innovative Antriebskonzepte. In Proceedings of the Jahrestagung Mobilität 2019, Düsseldorf, Germany, 27 June 2019. [Google Scholar]
  222. Zero Emission Services B.V. Schlüsselakteure Entwickeln ein Emissionsloses Antriebssystem für die Binnenschifffahrt. Available online: https://zeroemissionservices.nl/de/schlusselakteure-entwickeln-ein-emissionsloses-antriebssystem-fur-die-binnenschifffahrt/ (accessed on 21 December 2021).
  223. Kasten, P.; Mottschall, M.; Köppel, W.; Degünther, C.; Schmied, M.; Wüthrich, P. Erarbeitung einer Fachlichen Strategie zur Energieversorgung des Verkehrs bis zum Jahr 2050. TEXTE 2016, 72/2016. Available online: https://www.umweltbundesamt.de/sites/default/files/medien/377/publikationen/2016-11-10_endbericht_energieversorgung_des_verkehrs_2050_final.pdf (accessed on 19 December 2020).
  224. DNV GL. Highlight Projects in the LNG as Fuel History. Available online: https://brandcentral.dnvgl.com/download/DownloadGateway.dll?h=BE1B38BB718539CC0AB58A5FF2EA7A8335EF9A5BC87A42E8FE938B52042522100D70F7679F884F56637AC7C6F561AD0F (accessed on 7 April 2021).
  225. Rolls-Royce. Rolls-Royce and Robert Allan Present the World’s First LNG-Powered Shallow-Water Push Boat. Available online: https://www.rolls-royce.com/media/press-releases/2019/06-12-2019-rr (accessed on 21 December 2021).
  226. Bundesministerium für Verkehr, Bau und Stadtentwicklung. Die Mobilitäts-und Kraftstoffstrategie der Bundesregierung (MKS); Bundesministerium für Verkehr, Bau und Stadtentwicklung: Berlin, Germany, 2013.
  227. Kopyscinski, J.; Schildhauer, T.; Biollaz, S. Production of synthetic natural gas (SNG) from coal and dry biomass–A technology review from 1950 to 2009. Fuel 2010, 89, 1763–1783. [Google Scholar] [CrossRef]
  228. Generaldirektion Wasserstraßen und Schifffahrt. Veränderungen des Schiffsbestandes der Deutschen Binnenflotte im Jahr 2017—Zentrale Binnenschiffsbestandsdatei. Available online: https://www.gdws.wsv.bund.de/SharedDocs/Downloads/DE/Binnenschiffsbestandsdatei/2017.pdf?__blob=publicationFile&v=3 (accessed on 20 February 2021).
  229. MariGreen project. Perspectives for the Use of Hydrogen as Fuelin Inland Shipping; Institute for Combustion Engines VKA: Leer, Germany; Mariko GmbH: Aachen, Germany; FME: Groningen, The Netherlands, 2018. [Google Scholar]
  230. RH2INE Awarded Co-Funding of the EU Connecting Europe Facility! Available online: https://www.rh2ine.eu/latest-news/253/ (accessed on 12 December 2020).
  231. Thomson, R. Hydrogen Has Emerged as a Key Contender in the Battle to Secure a Sustainable Future for Aviation. Available online: https://www.rolandberger.com/en/Publications/Hydrogen-A-future-fuel-of-aviation.html (accessed on 20 August 2020).
  232. Schmied, M.; Wüthrich, P.; Zah, R.; Friedl, C. Postfossile Energieversorgungsoptionen für einen Treibhausgasneutralen Verkehr im Jahr 2050: Eine Verkehrsträgerübergreifende Bewertung. TEXTE 2015, 30/2015. Available online: https://www.umweltbundesamt.de/publikationen/postfossile-energieversorgungsoptionen-fuer-einen (accessed on 6 July 2020).
  233. International Civil Aviation Organization. Electric and Hybrid Aircraft Platform for Innovation (E-HAPI). Available online: https://www.icao.int/environmental-protection/Pages/electric-aircraft.aspx (accessed on 6 July 2020).
  234. Roland Berger. Aircraft Electrical Propulsion—The Next Chapter of Aviation? 2017. Available online: http://docplayer.net/59715725-Aircraft-electrical-propulsion-the-next-chapter-of-aviation.html (accessed on 6 July 2020).
  235. Eviation Aircraft. ALICE Specification. Available online: https://www.eviation.co/aircraft/#4 (accessed on 22 September 2020).
  236. ICAO Secretariat. Electric, Hybrid, and Hydrogen Aircraft—State of Play. In ICAO Environmental Report 2019; ICAO: Montreal, QC, Canada, 2019; pp. 124–130. [Google Scholar]
  237. Deutsches Zentrum für Luft-und Raumfahrt. HY4 Emissionsfreie Passagierflugzeuge. Available online: https://www.dlr.de/content/de/downloads/2015/dlr-flyer-hy4_1892.pdf?__blob=publicationFile&v=16 (accessed on 18 February 2021).
  238. AIRBUS. This Chase Aircraft Is Tracking 100% SAF’s Emissions Performance. Available online: https://www.airbus.com/en/newsroom/stories/2021-11-this-chase-aircraft-is-tracking-100-safs-emissions-performance (accessed on 21 December 2021).
  239. Naumann, K.; Müller-Langer, F.; Meisel, K.; Majer, S.; Schröder, J.; Schmieder, U. Further Development of the German Greenhouse Gas Reduction Quota, Background Paper; Deutsches Biomasseforschungszentrum gemeinnützige GmbH: Leipzig, Germany, 2021. [Google Scholar]
  240. Heidt, C.; Lambrecht, U.; Hardinghaus, M.; Knitschky, G.; Schmidt, P.; Weindorf, W.; Naumann, K.; Majer, S.; Müller-Langer, F.; Seiffert, M. CNG und LPG—Potenziale dieser Energieträger auf dem Weg zu einer Nachhaltigeren Energiever-Sorgung des Straßenverkehrs; DLR: Ottobrunn, Germany; Leipzig, Germany; Berlin/Heidelberg, Germany, 2013. [Google Scholar]
  241. Wachsmuth, J.; Oberle, S.; Zubair, A.; Köppel, W. Wie klimafreundlich ist LNG?—Kurzstudie zur Bewertung der Vorkettenemissionen bei Nutzung von Verflüssigtem Erdgas (LNG); CLIMATE CHANGE 21/2019; Umweltbundesamt: Dessau-Roßlau, Germany, 2019.
Figure 1. Overview of alternative fuel pathways. Source: Own elaboration based on Bruchof [14]. LPG: Liquified petroleum gas, LNG: Liquefied natural gas, CNG: Compressed natural gas, SNG: Synthetic natural gas, BNG: Bio natural gas, FT: Fischer–Tropsch, FAME: Fatty acid methyl ester, HVO: Hydrotreated vegetable oils, OME: Oxymethylene ether, DME: Dimethyl ether, FCEV: Fuel cell–electric vehicle, BEV: Battery–electric vehicle, HEV: Hybrid-electric vehicle, PHEV: Plug-in hybrid-electric vehicle.
Energies 15 01443 g001
Figure 2. Range distribution of daily driven distances of the vehicle classes passenger cars, light duty vehicles, motorcycles, coaches, trucks, articulated trucks, other tractors, other motor vehicles, and agricultural tractors. Source: Own analysis based on [22].
Energies 15 01443 g002
Figure 3. Share of transport performance (tkm) and volume of transport (t), as well as the average trip distance of different distance classes for inland waterway freight transport in Germany in 2016. Source: Own elaboration based on [31,32].
Energies 15 01443 g003
Figure 4. TRL of alternative fuels from synthetic production from hydrogen and renewable electricity, conventional biofuel production, and advanced biofuel production. Source: Own elaboration based on literature. The literature sources are listed in Table A1. * Production from renewable electricity. ** If manure, sludge or waste is used for conventional biofuel production processes, the product will be classified as advanced biofuel. These pathways are not covered by advanced biofuel production in this diagram. SLNG: Synthetic liquefied natural gas, LBM: Liquefied biomethane, SNG: Synthetic natural gas, CBM: Compressed biomethane, OME: Oxymethylene ether, DME: Dimethyl ether, FAME: Fatty acid methyl ester, HVO: Hydrotreated vegetable oils.
Energies 15 01443 g004
Figure 5. Comparative specific transport cost intervals for (a) H2 and (b) H2, ammonia, and LOHC via pipeline and vessel. Source: Own elaboration based on [83,91,93].
Energies 15 01443 g005
Figure 6. Comparative specific transport cost for H2, SNG, and PtL fuels for the region of North Africa/Morocco under mention of used transportation technology, assumed distance, and referred year of cost value. All cost values refer to lower heating values. Source: Own elaboration based on (a) [96]; (b) [89]; (c) [83]; (d) [87]; (e) [92]; (f) [55]; (g) [85]; (h) [6]. PtL: Power-to-Liquid, SNG: Synthetic natural gas, LOHC: Liquid organic hydrogen carrier.
Energies 15 01443 g006
Figure 7. Result of the conducted literature review showing the cost ranges of H2 and LH2 production in Germany and abroad, the transport costs and taxes/levies. Source: Own elaboration based on [4,6,34,85,87,88,89,90,92,105,106,107,108,109]. All extracted cost values are provided in Figure A1 in Appendix A. H2 PC: Hydrogen production costs (domestic or import), H2 PC + TC: Hydrogen import costs, including transport, H2 PC + TC +T/L: End user prices of hydrogen (domestic and import), including tax and levies.
Energies 15 01443 g007
Figure 8. Cost ranges for domestic SNG production and abroad, transport costs, and taxes/levies. Source: Own elaboration based on [85,89,90,92,107,108,109,113]. All of the extracted cost values are provided in Appendix A in Figure A2. SNG PC: Synthetic natural gas production cost (domestic or import), SNG PC + TC: Synthetic natural gas import cost including transport, SNG PC + TC +T/L: End user prices of synthetic natural gas (domestic and import), including taxes and levies.
Energies 15 01443 g008
Figure 9. Cost ranges of unspecified PtL fuel production domestic and abroad, transport costs, and taxes/levies. Source: Own elaboration based on [6,85,89,92,105,107,108,112]. All extracted cost values are provided in Appendix A in Figure A3. PtL PC: Power-to-Liquid production cost (domestic or import); PtL PC + TC: Power-to-Liquid import cost including transport; and PtL PC + TC + T/L: End user prices of Power-to-Liquid product (domestic and import), including taxes and levies.
Energies 15 01443 g009
Figure 10. Cost intervals of H2, SNG, and PtL for the import case. Source: Own elaboration based on literature. Literature sources are listed in Figure 7, Figure 8 and Figure 9. PtL: Power-to-Liquid, SNG: Synthetic natural gas, PC: Production cost, TC: Transport cost, T/L: Taxes and levies.
Energies 15 01443 g010
Figure 11. Blending percentages of alternative fuels in diesel, gasoline, and jet A-1. Source: Own elaboration based on [4,58,62,109,114,115,116,117,118,119,120,121,122,123,124,125,126,127,128,129,130,131,132,133,134,135,136]. Sustainable aviation fuel abbreviations: see Table 3. MtK: Methanol-to-Kerosene, FT: Fischer–Tropsch, MtG: Methanol-to-Gasoline, OME: Oxymethylene ether, DME: Dimethyl ether, FAME: Fatty acid methyl ester, HVO: Hydrotreated vegetable oils.
Energies 15 01443 g011
Figure 12. Lower heating value of alternative fuels. Source: Own elaboration based on [97,140,141,142,143,144,145,146,147,148,149,150]. HFO: Heavy fuel oil, FAME: Fatty acid methyl ester, HVO: Hydrotreated vegetable oils, FT: Fischer–Tropsch, MtG: Methanol-to-Gasoline, LPG: Liquefied petroleum gas, LNG: Liquefied natural gas, OME: Oxymethylene ether, DME: Dimethyl ether, CNG: Compressed natural gas, LHV: Lower heating value.
Energies 15 01443 g012
Figure 13. Energy consumption of different powertrains for passenger cars (PC), light duty vehicles (LDV), heavy-duty vehicles (HDV), motorcycles (MC), buses, and coaches. Source: Own elaboration based on Helgeson and Peter [32] and HBEFA 4.1 [159]. The consumption values are relative to the diesel consumption of the respective vehicle class. The motorcycle values are not diesel- but gasoline-specific. CNG: Compressed natural gas, LNG: Liquefied natural gas, SI: Spark ignition, CI: Compression ignition, FCV: Fuel cell vehicle, ICE: Internal combustion engine, BEV: Battery–electric vehicle, PC: Passenger car, LDV: Light duty vehicle, HDV: Heavy duty vehicle, MC: Motorcycle.
Energies 15 01443 g013
Figure 14. Energy consumption specific to conventional CI engines running with marine gas oil. Source: Own elaboration based on [109,153,155]. LNG: Liquefied natural gas, CI: Compression ignition, SCR: Selective catalytic reaction, DPF: Diesel particulate filter.
Energies 15 01443 g014
Figure 15. Ranges of GWP results of WtT assessments and promising selected fuels. Source: Own elaboration based on [174]. HVO: Hydrotreated vegetable oils, FT: Fischer–Tropsch, C-SNG: Compressed synthetic natural gas, L-SNG: Liquefied synthetic natural gas, GWP: Global warming potential, WtT: Well-to-Tank.
Energies 15 01443 g015
Figure 16. Contribution analysis for selected environmental impact categories for medians across electricity-based fuel supply pathways 2050. Source: Own elaboration based on [9,10]. GWP: Global warming potential; AP: Acidification potential; EP: Eutrophication potential; ODP: Ozone depletion potential; POCP: Photochemical ozone creation potential.
Energies 15 01443 g016
Table 1. TRL definitions.
TRLDefinition
1Identification of new concept, applications, and barriers
2Definition of application, consideration of interfaces, and commercial offer
3Proof of concept prototype ready: concept is laboratory tested
4Integrated small-scale prototype with auxiliary systems laboratory validated
5Large-scale prototype completed with auxiliaries, refined commercial assessment
6Technology pilot demonstrated in relevant environment, manufacturing strategy defined
7Pilot demonstrated in operational environment, manufacturing approach demonstrated
8Technology in its final form, low-rate production
9System fully operational and ready for commercialization
Notes. Source: Rose et al. [20].
Table 2. Current costs of alternative fuel production.
SourceFuelCost in EUR/LDECost in EURct/kWhReference
Renewable electricityHydrogen1.3813.85[98]
Methanol1.89 a18.97 a[4]
Ethanol2.22 a22.29 a[4]
Butanol2.53–2.60 a25.40–26.10 a[4]
Octanol2.85 a28.61 a[4]
Dimethyl ether1.85 a18.57 a[4]
Oxymethylene ether12.64 a26.40 a[4]
Oxymethylene ether3–53.46–3.96 a34.74–39.76 a[4]
Methanol-to-Gasoline1.88 a18.87 a[4]
Fischer–Tropsch-Diesel/Gasolines/Kerosene2.30 a23.09 a[4]
SNG2.25 b22.59 b[13]
BiomassFAME0.888.85[99]
HVO0.737.34[99]
Bioethanol1.1211.28[99]
Biomethane0.69–0.726.90–7.20[100]
Electricity0.60 c–3.01 d60 c–30.19 d[98,101]
Notes. a 70 EUR/tCO2; b 35 EUR/tCO2; c Electricity price renewable 6 EURct/kWh [98]; d Electricity price 2018 Germany 30.19 EURct/kWh [101]. Source: Own elaboration based on [4,13,98,100,101,103]. SNG: Synthetic natural gas, FAME: Fatty acid methyl ester, HVO: Hydrotreated vegetable oils.
Table 3. Sustainable aviation fuels and their abbreviations.
AbbreviationSustainable Aviation Fuel
FT-SPKFischer–Tropsch hydroprocessed synthesized paraffinic kerosene
HEFA-SPKSynthesized paraffinic kerosene from hydroprocessed esters and fatty acids
HFS-SIPSynthesized iso-paraffins from hydroprocessed fermented sugars
FT-SPKA/ASynthesized kerosene with aromatics derived by the alkylation of light aromatics from non-petroleum sources
ATJ-SPKAlcohol-to-Jet synthetic paraffinic kerosene
CH-SK, or CHJCatalytic hydrothermolysis synthesized kerosene
HHC-SPK or HC-HEFA-SPKHydroprocessed hydrocarbons, esters, and fatty acid synthetic paraffinic kerosene
Table 4. Efficiencies of different drivetrains.
DrivetrainFuelField of ApplicationMax. Efficiency
Otto engineGasolineMotorcycle31% [153]
Passenger cars, commercial vehicles36% [109,153]
Gasoline 2 strokeSmall engines24% [153]
LPGCommercial vehicles36.5% [109]
CNGCommercial vehicles37% [109]
Diesel engineDieselPassenger cars43% [153]
DieselCommercial vehicles, trucks42–45% [109,153]
LNGCommercial vehicles42% [109]
FT diesel, HVO, OME3–5, DMECommercial vehicles42% [109]
Large diesel engine with high RPMDieselShipping44% [153]
Diesel engines with medium RPMDieselShipping45% [153]
Cross-head enginesHFO 2 strokeShipping54% [153]
TurbinesJet fuelAir transport50% [152]
Battery–electricElectric energy-81–95% [109,151]
Fuel cell–electricH2-49–62% a
Notes. a Polymer electrolyte fuel cell with 60–65% efficiency [155,157,158]; electric system with 81–95% efficiency [109,151]. Source: Own elaboration based on [109,151,153,155,157,158]. LPG: Liquefied petroleum gas, CNG: Compressed natural gas, LNG: Liquefied natural gas, FT: Fischer–Tropsch, HVO: Hydrotreated vegetable oils, OME: Oxymethylene ether, DME: Dimethyl ether, HFO: Heavy fuel oil, RPM: Rounds per minute.
Table 5. Reduction of energy demand in rail transport through alternative propulsion technologies.
Propulsion SystemEnergy Consumption Reduction
Diesel–electric hybrid50% [163]
Battery–electric hybrid63% based on [169]
Fuel cell–electric49% based on [168]
Notes. Source: Own elaboration based on [163,168,169].
Table 6. Efficiencies of different propulsion systems for air transport.
DriveEfficiency
Fuel cell–electric45–55% [170]
Electric82–90% [170]
Hydrogen combustion40% [170]
Kerosene combustion50% [152]
Notes. Source: Own elaboration based on Roland Berger [170] and Bräunling [152].
Publisher’s Note: MDPI stays neutral with regard to jurisdictional claims in published maps and institutional affiliations.

