Article

Investigating the Optimization Design of Internal Flow Fields Using a Selective Catalytic Reduction Device and Computational Fluid Dynamics

1
School of Mathematical and Physical, Xuzhou University of Technology, Xuzhou 221018, China
2
Key Laboratory of Energy Thermal Conversion and Control of Ministry of Education, School of Energy and Environment, Southeast University, Nanjing 210096, China
*
Authors to whom correspondence should be addressed.
These authors contributed equally to this work.
Submission received: 29 January 2022 / Revised: 13 February 2022 / Accepted: 14 February 2022 / Published: 16 February 2022
(This article belongs to the Topic Catalysis for Sustainable Chemistry and Energy)

Abstract

:
Selective catalytic reduction (SCR) and denitrification are the best technologies for nitrogen oxides (NOx) control in coal-fired power plants, and their denitration efficiency and ammonia escape rate are closely related to their internal flow characteristics. By adding a deflector to the SCR device, the flow field in the curve can be effectively improved, and the stable and efficient operation of the SCR device can be realized. Based on the numerical simulation method, the SCR system of a coking coal-fired boiler in a steel plant was simulated using k-ε (the turbulence model), and three design schemes of deflectors were proposed and numerically simulated simultaneously. After optimization, the ammonia injection grid’s downstream velocity variance coefficient CV was 6.69, the catalyst upper cross-section velocity variance coefficient was 11.84, the cross-sectional temperature average was 499 K, the maximum temperature deviation was 9 °C, the maximum-to-minimum temperature interval span was 15 °C, the cross-sectional NH3/NOx molar ratio average value was 0.8122, the coefficient of variance was 4.67, and the pressure loss was 1855 Pa. The findings of this work will help improve the denitration efficiency and provide an important reference for the actual transformation design.

1. Introduction

With the rapid development of China’s modern industry and economy, energy consumption has also increased rapidly [1,2]. Although the development of renewable energy has become an important national policy for China’s sustainable economic development, China’s fossil fuel-based energy structure will not undergo fundamental changes for a long time to come [3]. Compared with most countries in the world, the reality of “rich coal, poor oil, and little gas” will determine that China’s coal-dominated energy structure will not undergo fundamental changes in the next 30 to 50 years [4]. According to statistics, China’s coal consumption reached 4.49 billion tons in 2017, and it is estimated that by 2023, China’s standard coal consumption will reach 4.7 billion tons [5]. However, in the coal combustion process, in addition to the reaction of carbon and oxygen, toxic gases such as sulfur dioxide (SO2), nitrogen oxides (NOx), trace elements, and dust particles are generated [6,7,8]. In response to the above situation, since the “Twelfth Five-Year Plan”, the coal power industry has continuously strengthened the control of pollutant emissions; especially since 2014, ultra-low emission work has been rapidly promoted, and the level of the flue gas pollution control of coal-fired power plants in China has been significantly improved. The emission performance of the main air pollutants (smoke, SO2, and NOx) has reached international-leading levels, but they cannot meet the requirements of today’s society for environmental quality [9,10].
The main sources of NOx can be divided into two categories: natural sources and anthropogenic sources [11]. Anthropogenic sources are the main source of nitrogen oxide emissions, which are characterized by relatively concentrated emissions and high concentrations [11]. The combustion of coal and other fossil fuels is the main source of NOx emissions. Since the 1970s, many countries in the world, especially some developed countries, have formulated standards to limit NOx emissions from thermal power and other anthropogenic sources. With the development of the economy and society, these standards have become increasingly strict. Many new flue gas cleaning technologies have been developed to meet these increasingly stringent emission control standards. Selective catalytic reduction (SCR) is one of the most efficient flue gas cleaning technologies. The removal efficiency of SCR devices for NOx can reach 80–95%, which can meet the increasingly stringent emission control standards. Through investigation and research, it was found that most coal-fired units are now installed at the rear of the boiler, and SCR denitration devices are installed [12]. The principle is to use gaseous NH3 to convert NOx into N2 and H2O under the action of a high-temperature catalyst to achieve the standard emission of NOx [13,14,15]. However, in actual operation, it is found that the distribution of the flow field in the SCR device seriously affects the denitration effect, and the uneven distribution of the reducing agent concentration will also cause problems, such as the decline of denitration efficiency and excess ammonia escaping from the flue outlet.
At present, a large number of researchers use experiments and numerical simulation techniques to study the denitration performance and internal flow characteristics of SCR reactors. Previous research has found that the denitration efficiency of SCR reactors is related to many factors, including SCR reactor structure, catalyst type, reaction temperature, flue gas volume, and NH3/NO molar ratio, etc. A large number of studies have shown that the catalyst type, reaction temperature, and catalyst layer parameters, etc., have an important influence on denitration efficiency [16,17,18]. Owing to the difficulty in obtaining experimental data from actual tests, numerical simulations are more convenient and widely used than experimental research. Xu et al. [19] used a 350 MW coal-fired power plant as the research object, carried out three three-dimensional computational fluid dynamics (CFD) modellings and simulations of the SCR system, and analyzed the fracture situation of the catalyst in industrial applications. Xu et al. [19] believed that CFD simulations could analyze the actual operation phenomenon, which provides a basic understanding for researchers to analyze catalyst layer fractures. Habib et al. [20] used numerical simulation methods to analyze the effects of fuel ratio, inlet air temperature, and swirl angle on NOx formation and optimized the combustion parameters of the power plant. You et al. [21] developed a layer-by-layer SCR denitration catalytic model based on the assumption of a porous medium model and successfully applied it to the calculation. The numerical simulation results showed that computational fluid dynamics can predict the flow characteristics of a partially coated honeycomb regenerator and that this method is feasible and effective [21].
As shown above, the key to the optimal design and operation of the SCR denitration device is to ensure that the flow field, temperature field, and concentration field of the reactant (NH3/NOx) in the reactor are evenly distributed to ensure high denitration efficiency and reduce ammonia slip. Adding a deflector to the SCR device can effectively improve the flow field in the curve but the SCR device is large, and the system is complex. The layout and structure are neither economical nor realistic. Therefore, the CFD simulation method is generally used to design deflectors. In this study, based on the CFD simulation calculation of a coke oven flue gas denitrification device in Baosteel, the layout and structure of the deflector, which meets the design requirements at the designated position, were obtained. This work can also be used for other similar projects and provides valuable references.

2. Research Objects and Physical Models

2.1. Research Objects and Operating Conditions

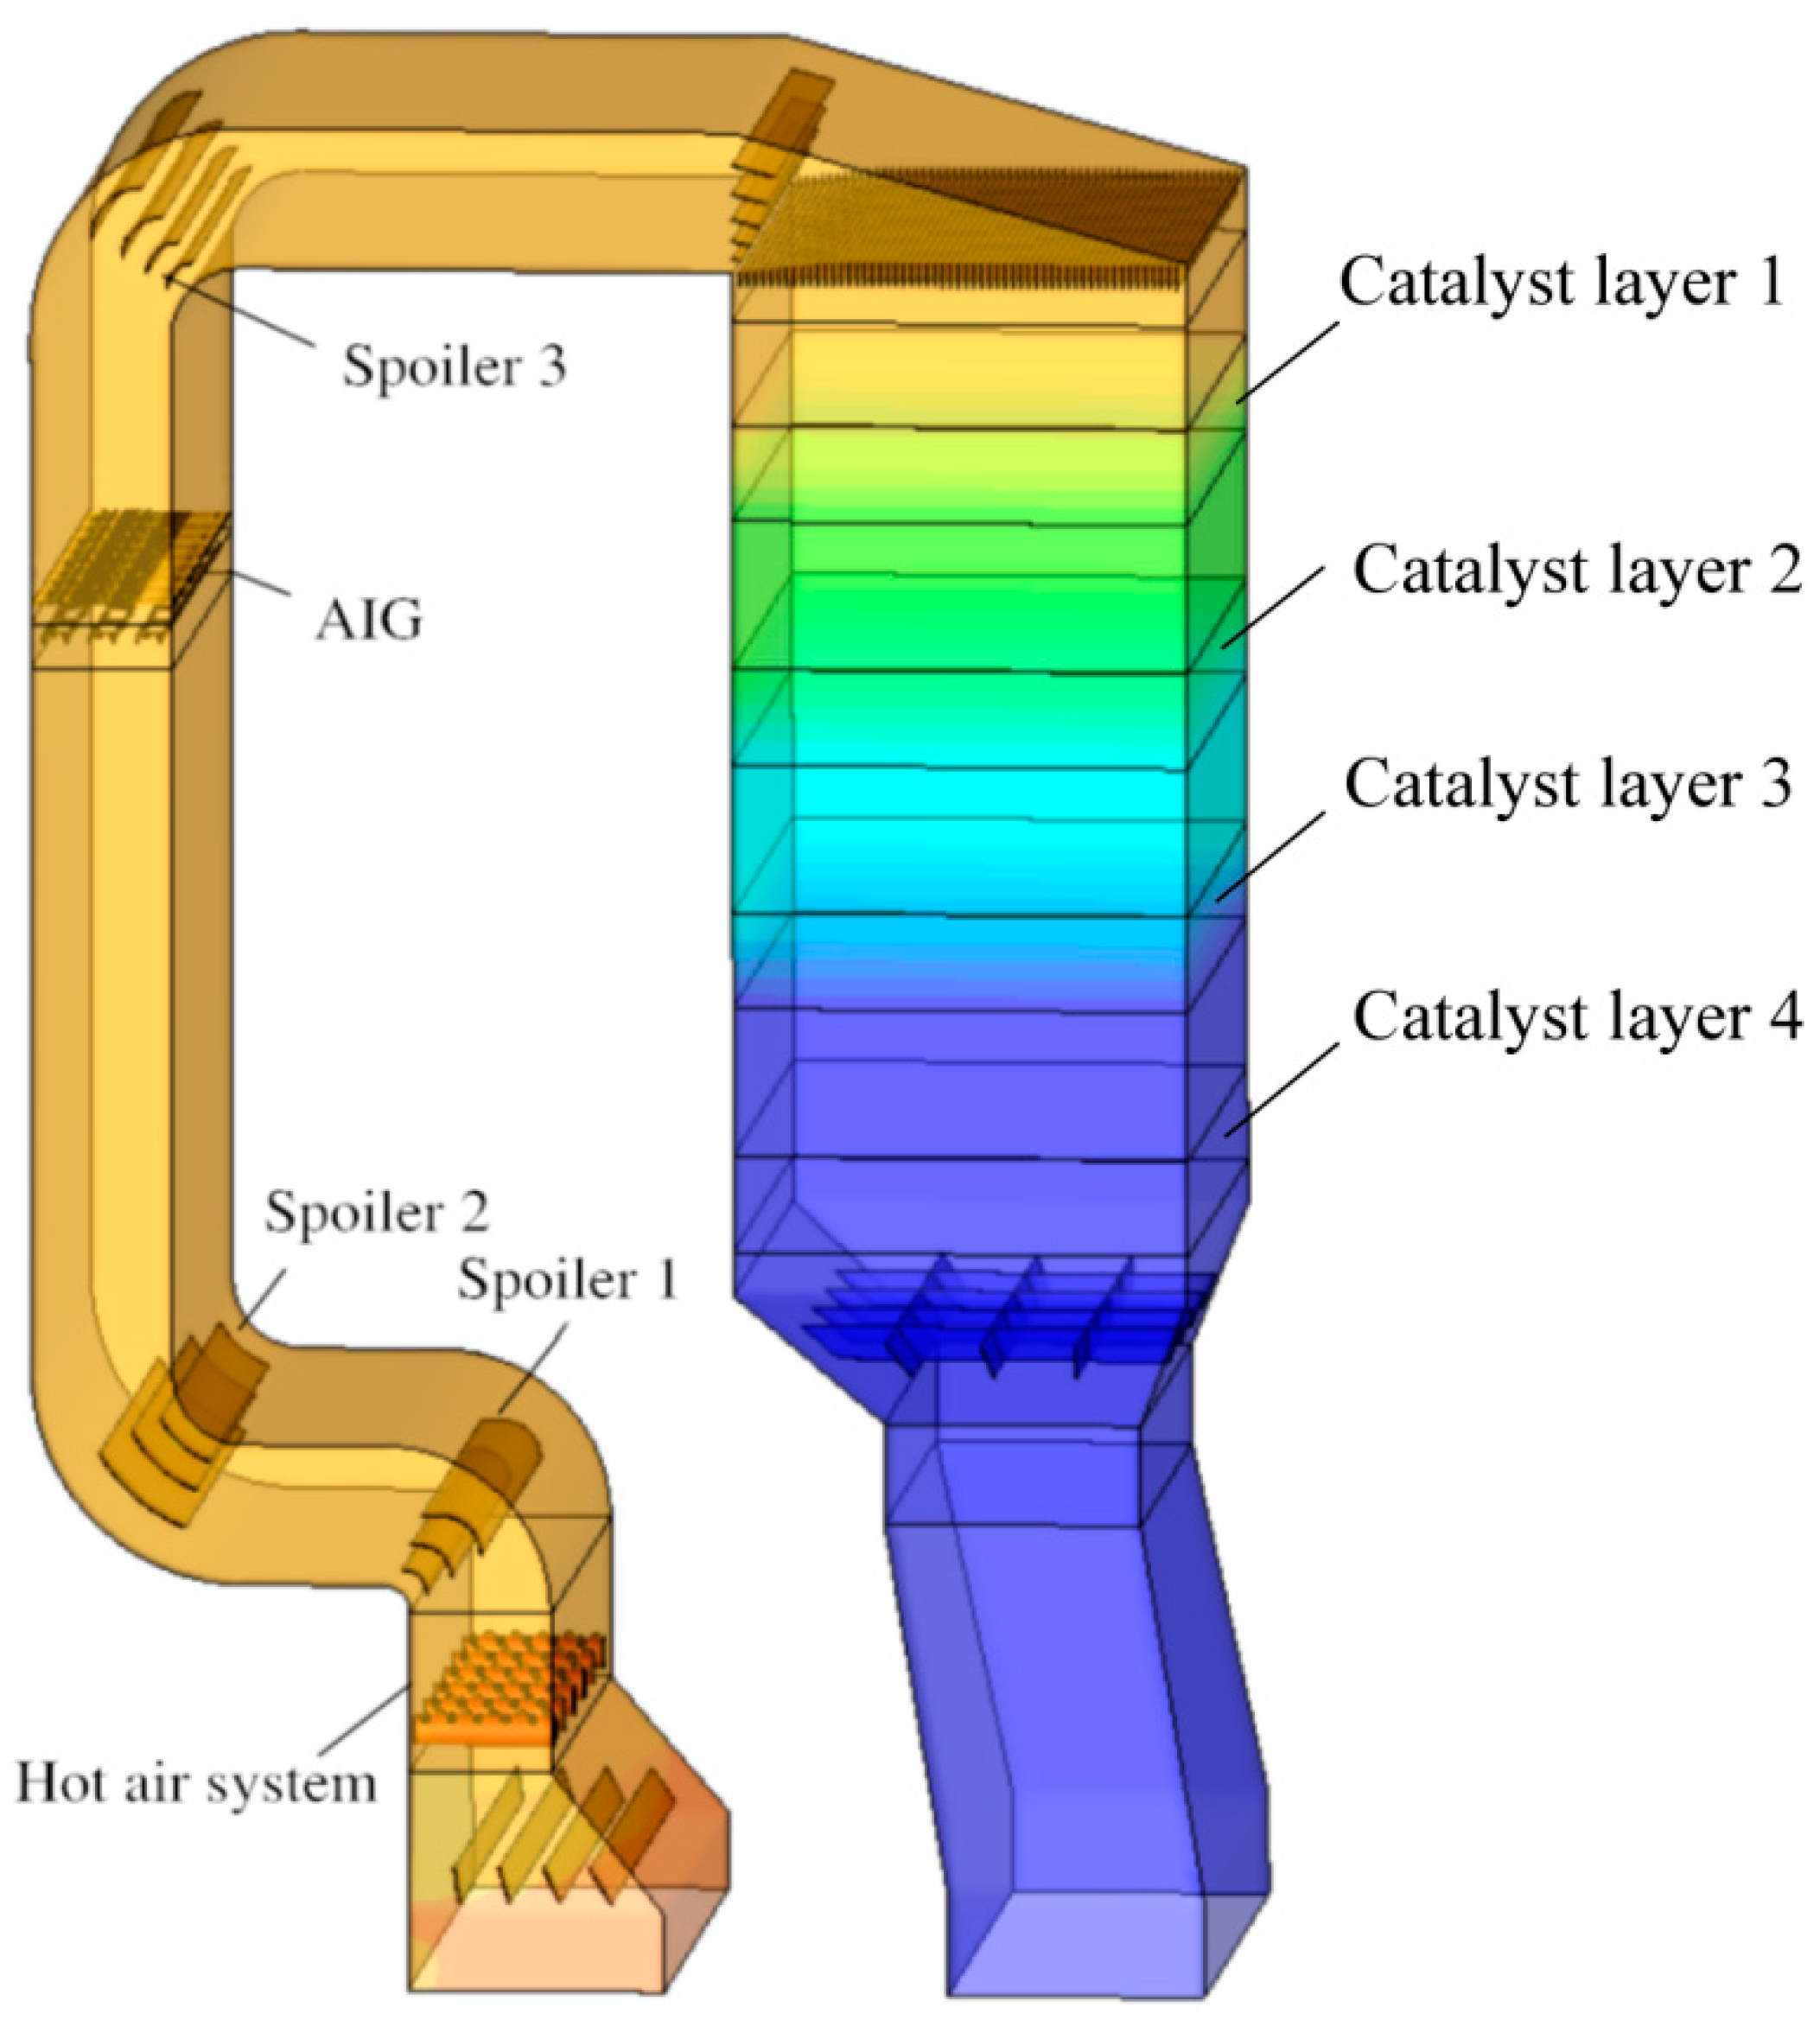
2.1.1. Research Object

The simulation object is the SCR system of a coking coal-fired boiler in Baosteel, and the flue arrangement is shown in Figure 1. As can be seen from Figure 1, the guide vanes were installed in a sequence from the left inlet, among which four straight guide vanes (all blades are 5 mm thick) were installed in the tapered section, and three arcs were installed at the first 90°; for the guide vanes, three arc-shaped guide vanes were also installed at the second 90° and four arc-shaped guide vanes were installed at the third 90° elbow. There were five inclined straight-plate guide vanes installed from the horizontal flue to the inlet of the rectification grille, which examined the influence of the spacing of the grilles on the uniformity of the flow field in the upper layer of the catalyst, and the lowermost catalyst layer downstream of the narrowing section adopted four horizontal and three vertical grids. The design and optimization of the entire flow field mainly focused on the structure, quantity, and size of the guide vanes mentioned above.

2.1.2. Operating Parameters and Working Conditions

The actual pressure of the flue gas-blending section was approximately 4000 Pa. During normal operation, the circulating mixed flue gas was arranged in a forward spray arrangement, and the circulating mixed flue gas volume of each parent pipe was 3800 Nm3/h. According to the parameters given by the coal-fired power plants, there were six main pipes, and the total circulating mixed flue gas volume was 22,800 Nm3/h, including the flue gas of 15,000 Nm3/h drawn by the flue gas-induced draft fan from the original flue gas in front of the heat exchanger. The circulating mixed flue gas volume was 3800 × 6 − 15,000 = 7800 Nm3/h. In addition, the amount of new flue gas produced by the coal-fired power plant was 41,000 Nm3/h, as shown in Table 1. Therefore, the amount of flue gas entering the denitration was 417,800 Nm3/h of dry flue gas.
The ammonia injection grille and the opening of the injection holes, according to the actual operation, and the inlet boundary parameters of ammonia injection, are shown in Table 2. The mass fractions of the inlet components are listed in Table 3.
According to the previous simulation results combined with the existing device structure, this simulation optimization mainly investigated the structure and size of the following key guide vanes, as shown in Figure 2, where the guide vanes were arranged at the third 90° elbow—the distance from the horizontal flue to the inclined deflector before the inlet of the rectifying grille and the rectifying grille. The working conditions are listed in Table 4.

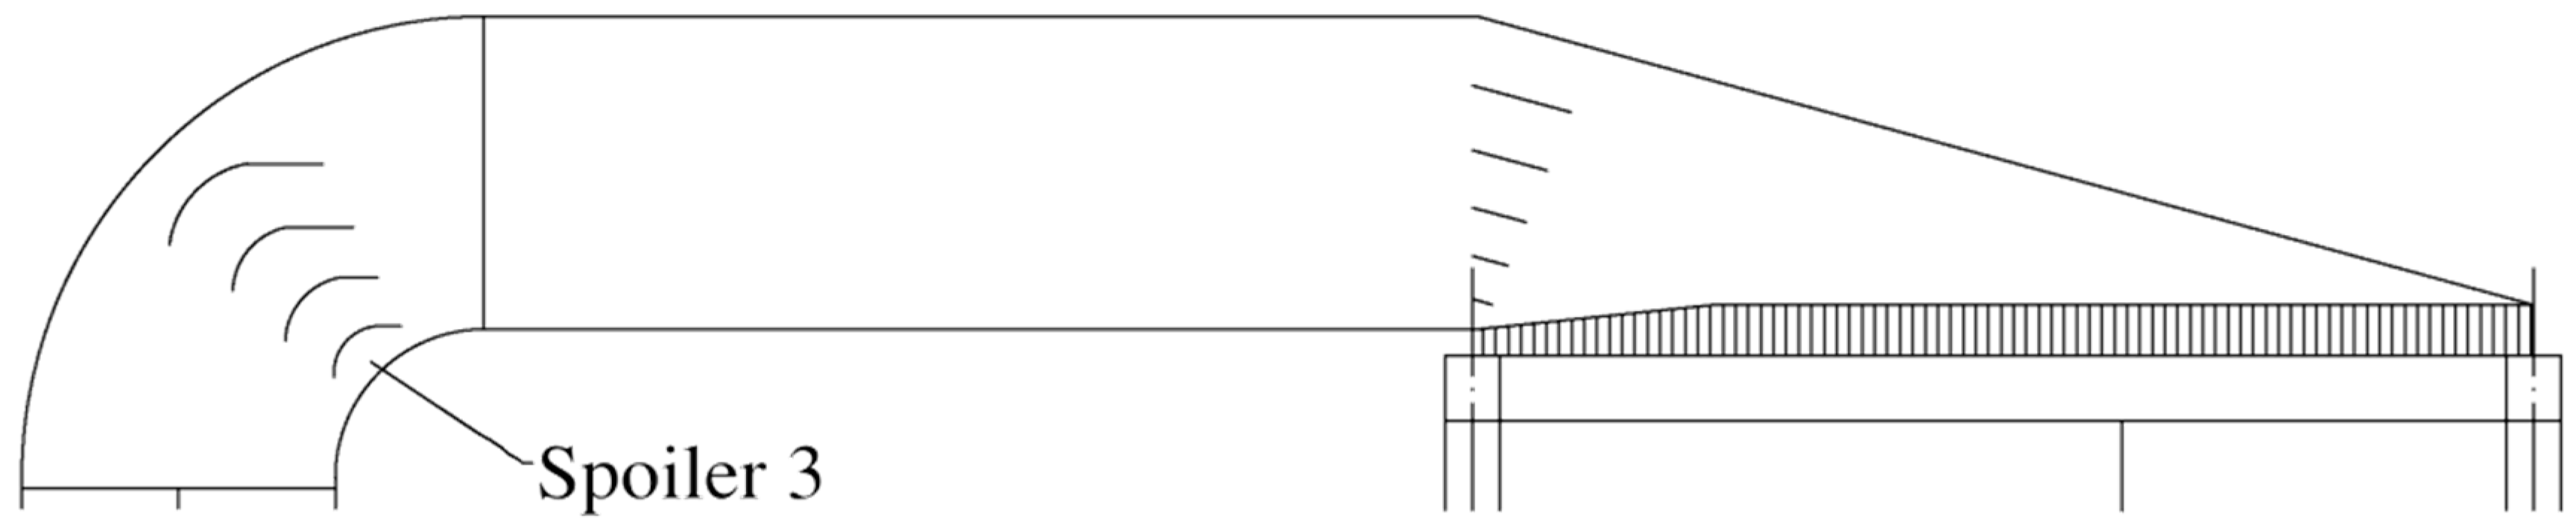
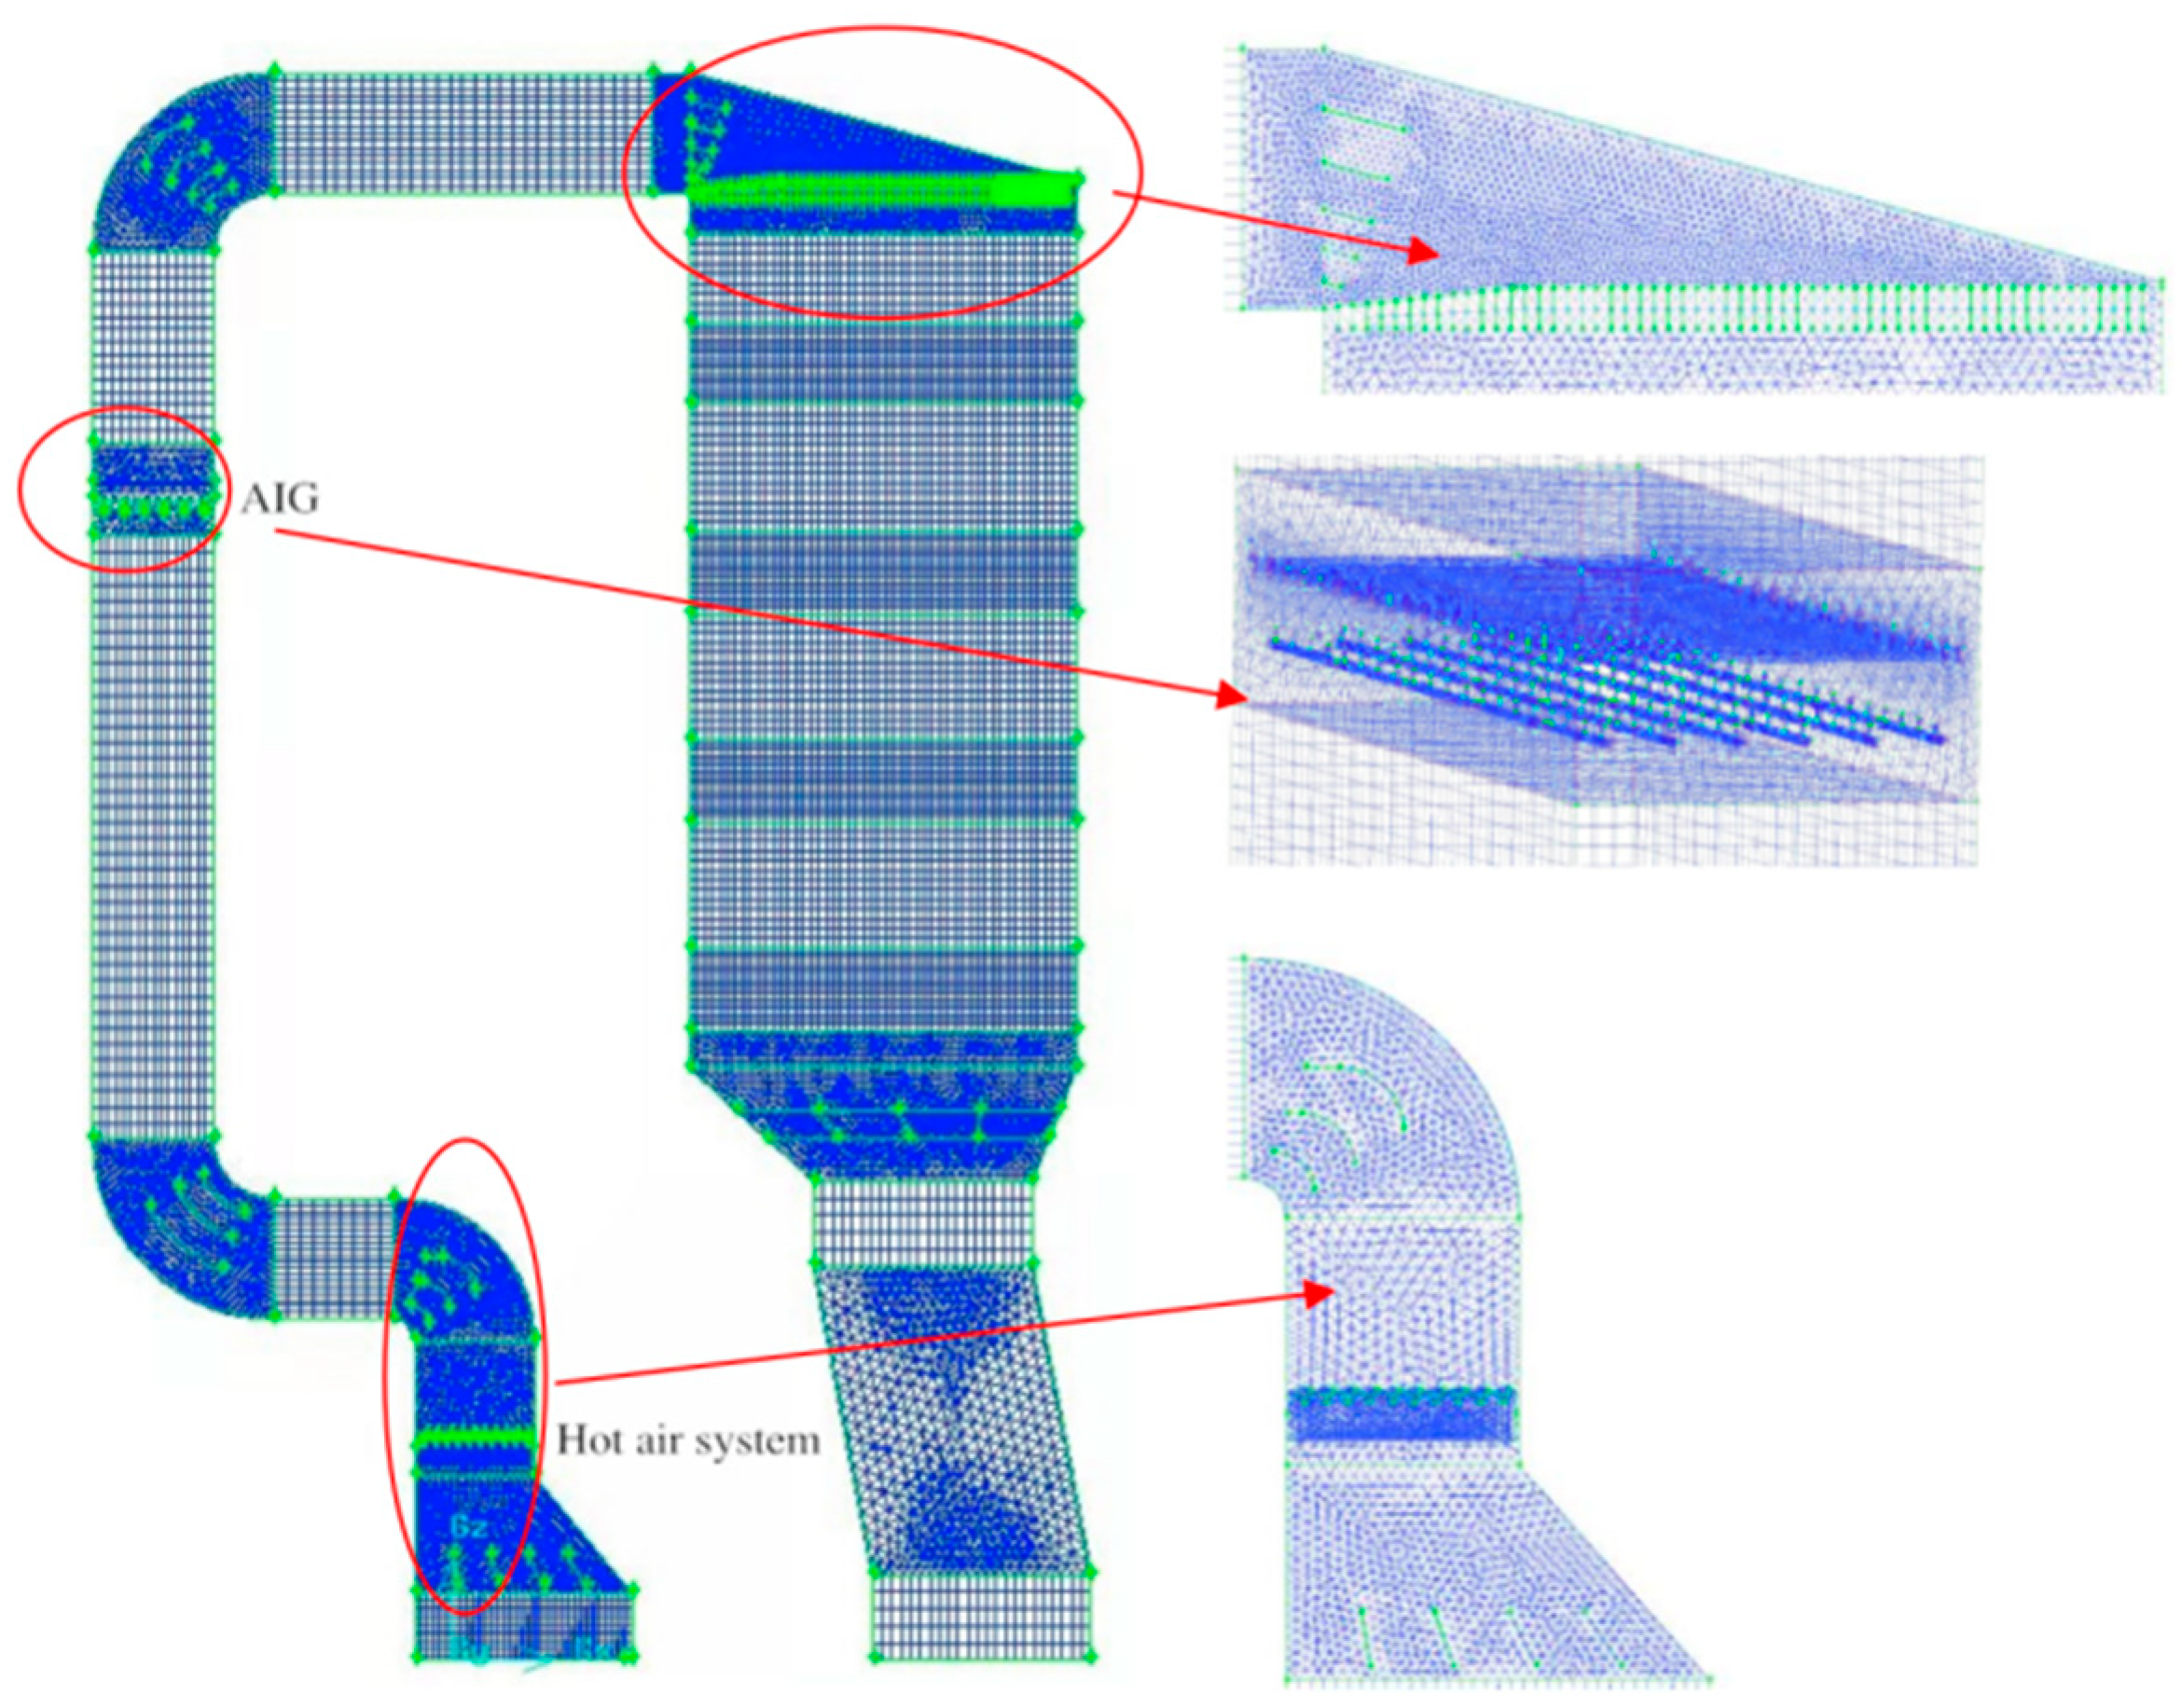
2.2. Geometric Model and Meshing

The structure of the SCR grid model is shown in Figure 3. Due to the complexity of the structure, the total number of meshes for the entire three three-dimensional SCR devices was 4.24 million, including 500,000 unstructured meshes in the hot blast stove, 900,000 unstructured meshes at the ammonia injection grille, and 900,000 unstructured meshes at the upper guide vanes and rectifier grilles. There were 600,000 unstructured meshes, and 300,000 unstructured meshes at the constriction section downstream of the lowermost catalyst layer.

3. Control Equation and Evaluation Method

3.1. Control Equation and Evaluation Method

3.1.1. Turbulence Model

The flue gas flow in the SCR denitration system was a three-dimensional turbulent flow. In practical engineering applications, the numerical simulation of the flow field in the SCR device is mainly based on the turbulence simulation method of solving the Reynolds homogenization equation and the transport equation of correlation quantity. In other words, the turbulence model is applied, and the standard should be selected based on the experience and practice of the k-ε turbulence model [21]:
t ( ρ ϕ ) + x ( ρ v x ϕ ) + y ( ρ v y ϕ ) + z ( ρ v z ϕ ) = x ( Γ ϕ ϕ x ) + y ( Γ ϕ ϕ y ) + z ( Γ ϕ ϕ z ) + S ϕ
where ρ is the fluid density; ϕ is the general variable; Γϕ is the diffusion coefficient; vi, vj, and vk are the velocity components in the three directions; and Sϕ is the generalized source term.
The general form was expressed using divergence:
t ( ρ ϕ ) + d i v ( μ ρ ϕ ) = d i v ( Γ g r a d ϕ ) + S ϕ
where μ is the dynamic viscosity coefficient; Sϕ and ϕ are generalized source terms and general variables, respectively; ρ is the density of the mixed gas; and u is the velocity vector.

3.1.2. Substance Transport Model

The flow medium in the SCR reactor contains different components, such as flue gas and ammonia gas. The flue gas is composed of various substances; therefore, the flow process involves the study of the mixing of substances. The material transport model of the mixture was used to simulate the process of calculating the chemical reaction of multiple gas components simultaneously, which is expressed as follows [22]:
t ( ρ Y i ) + ( ρ v Y i ) = J i + R i + S i t ( ρ Y i ) + ( ρ v Y i )
where Ri is the chemical reaction rate; J i is the diffusion flux of substance i; and Yi is the mass fraction of matter.
The calculation of the mass diffusion in a turbulent flow is as follows:
J i = ( ρ D t , m + μ t S c t ) Y i
where Sct is the turbulent Schmidt number, and the default setting is 0.7.

3.1.3. Porous Media Model

The catalyst layer was simulated using a porous medium model. The porous medium is a structure composed of a skeleton formed by a solid substance and a large number of dense clusters of tiny voids separated by the skeleton [23,24,25]. Considering the momentum loss of the porous structure, the additional momentum source term in the momentum equation of porous media was expressed as follow:
S i = j = 1 3 D i j μ v j + j = 1 3 1 2 C i j ρ | v j | v j
where Si is the momentum source term in the (x, y, z) direction of i, and Dij and Cij are the specified matrices.
The viscous drag coefficient is given as follows:
α = Δ P μ v t σ
The coefficient of inertial resistance is given as follows:
C = 2 Δ P ρ v t 2 σ
where ΔP is the pressure drop; vt is the velocity; σ is the thickness; μ is the dynamic viscosity coefficient, and ρ is the density.
Similar to the simulation of the conventional SCR denitration system, the simulation process also sets the catalyst layer as a porous medium. The parameters of the porous media model are listed in Table 5. The catalyst was divided into four layers, and the pressure loss of each layer was calculated according to the pressure drop of 450 Pa, and the viscous resistance coefficient and inertia resistance coefficient were calculated according to the calculation formula provided by the porous medium model.

3.2. Design Result Evaluation Index

The evaluation of the design results was mainly based on the coefficient of variation, that is, the ratio of the standard deviation to the mean called the coefficient of variation, which is recorded as the coefficient of variance (CV) [26,27]. The acceptance criteria for the final result of the CFD simulation optimization:
Ammonia injection grille (AIG) upstream velocity distribution: the maximum CV was 15%; (2) The upstream temperature field distribution of the first-layer catalyst: the maximum deviation of the flue gas temperature ratio from the average value was within the range of ±10°; (3) The upstream of the first-layer catalyst velocity distribution: the maximum CV in the cross section was 15%; (4) The upstream velocity angle of the first-layer catalyst: the maximum angle deviated from the vertical line was ±10°; and (5) The upstream ammonia distribution (NH3/NOx) of the first-layer catalyst: the maximum CV was 5%.

4. Results Analysis and Optimization

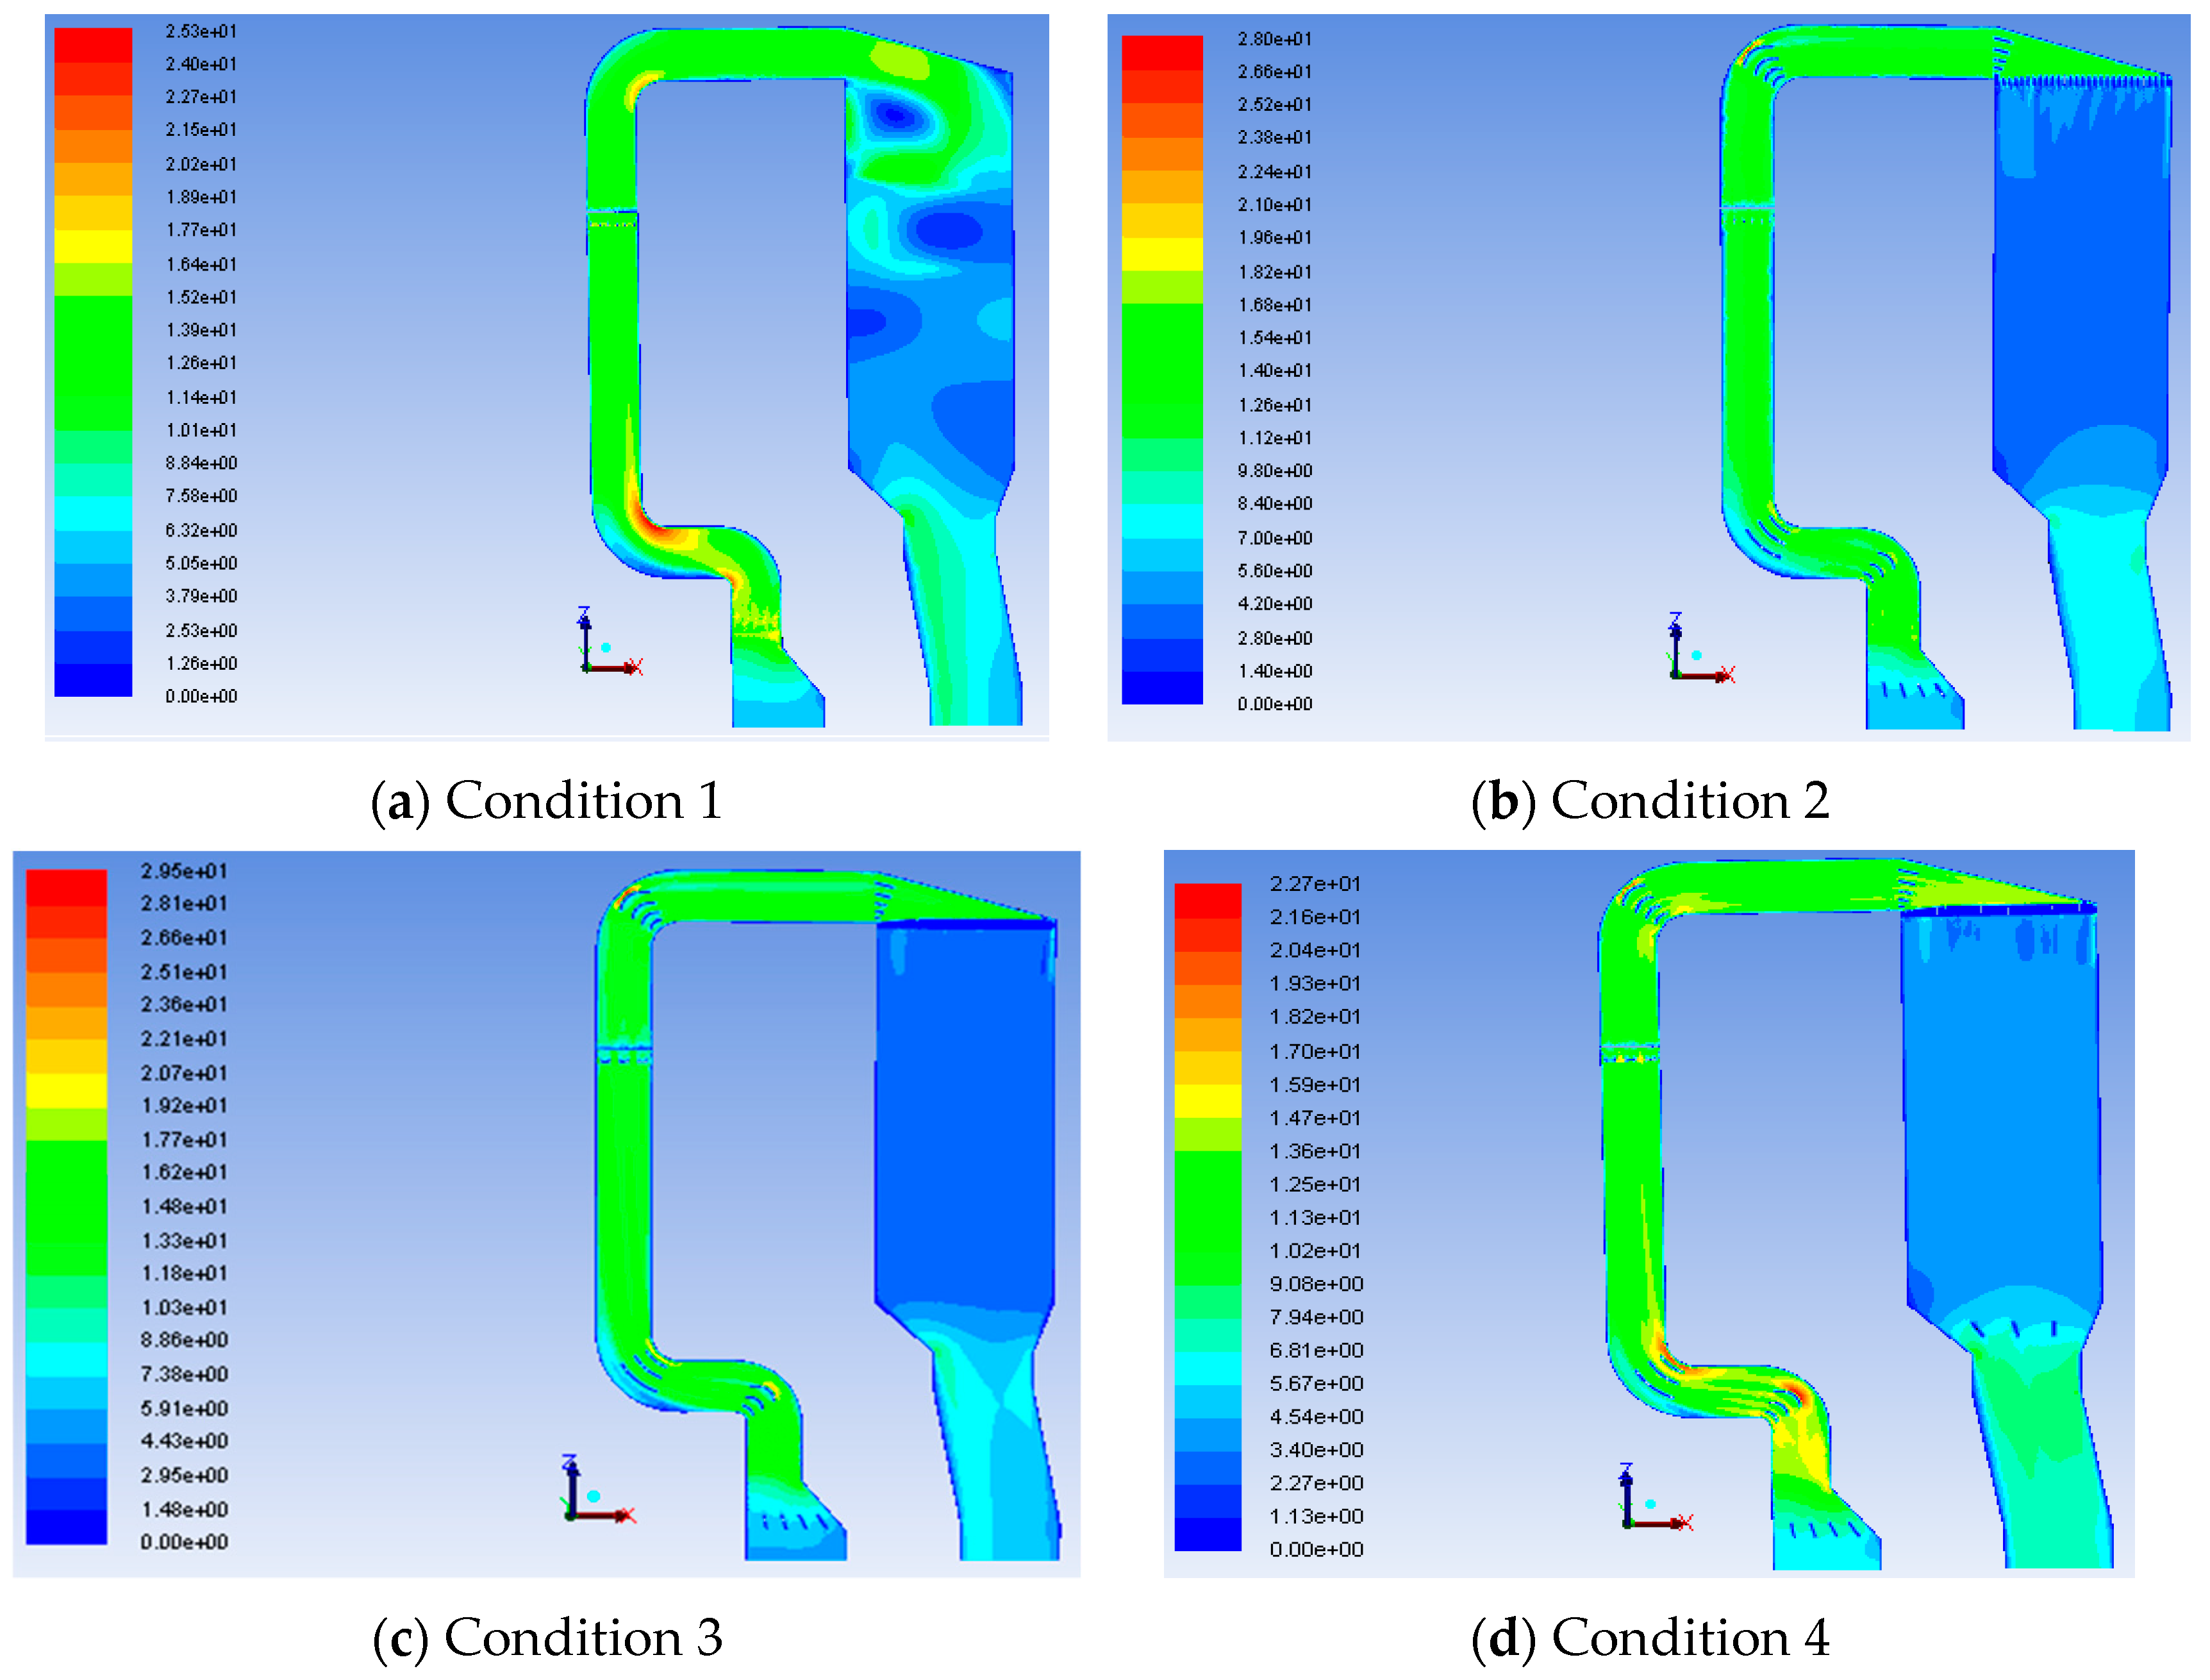
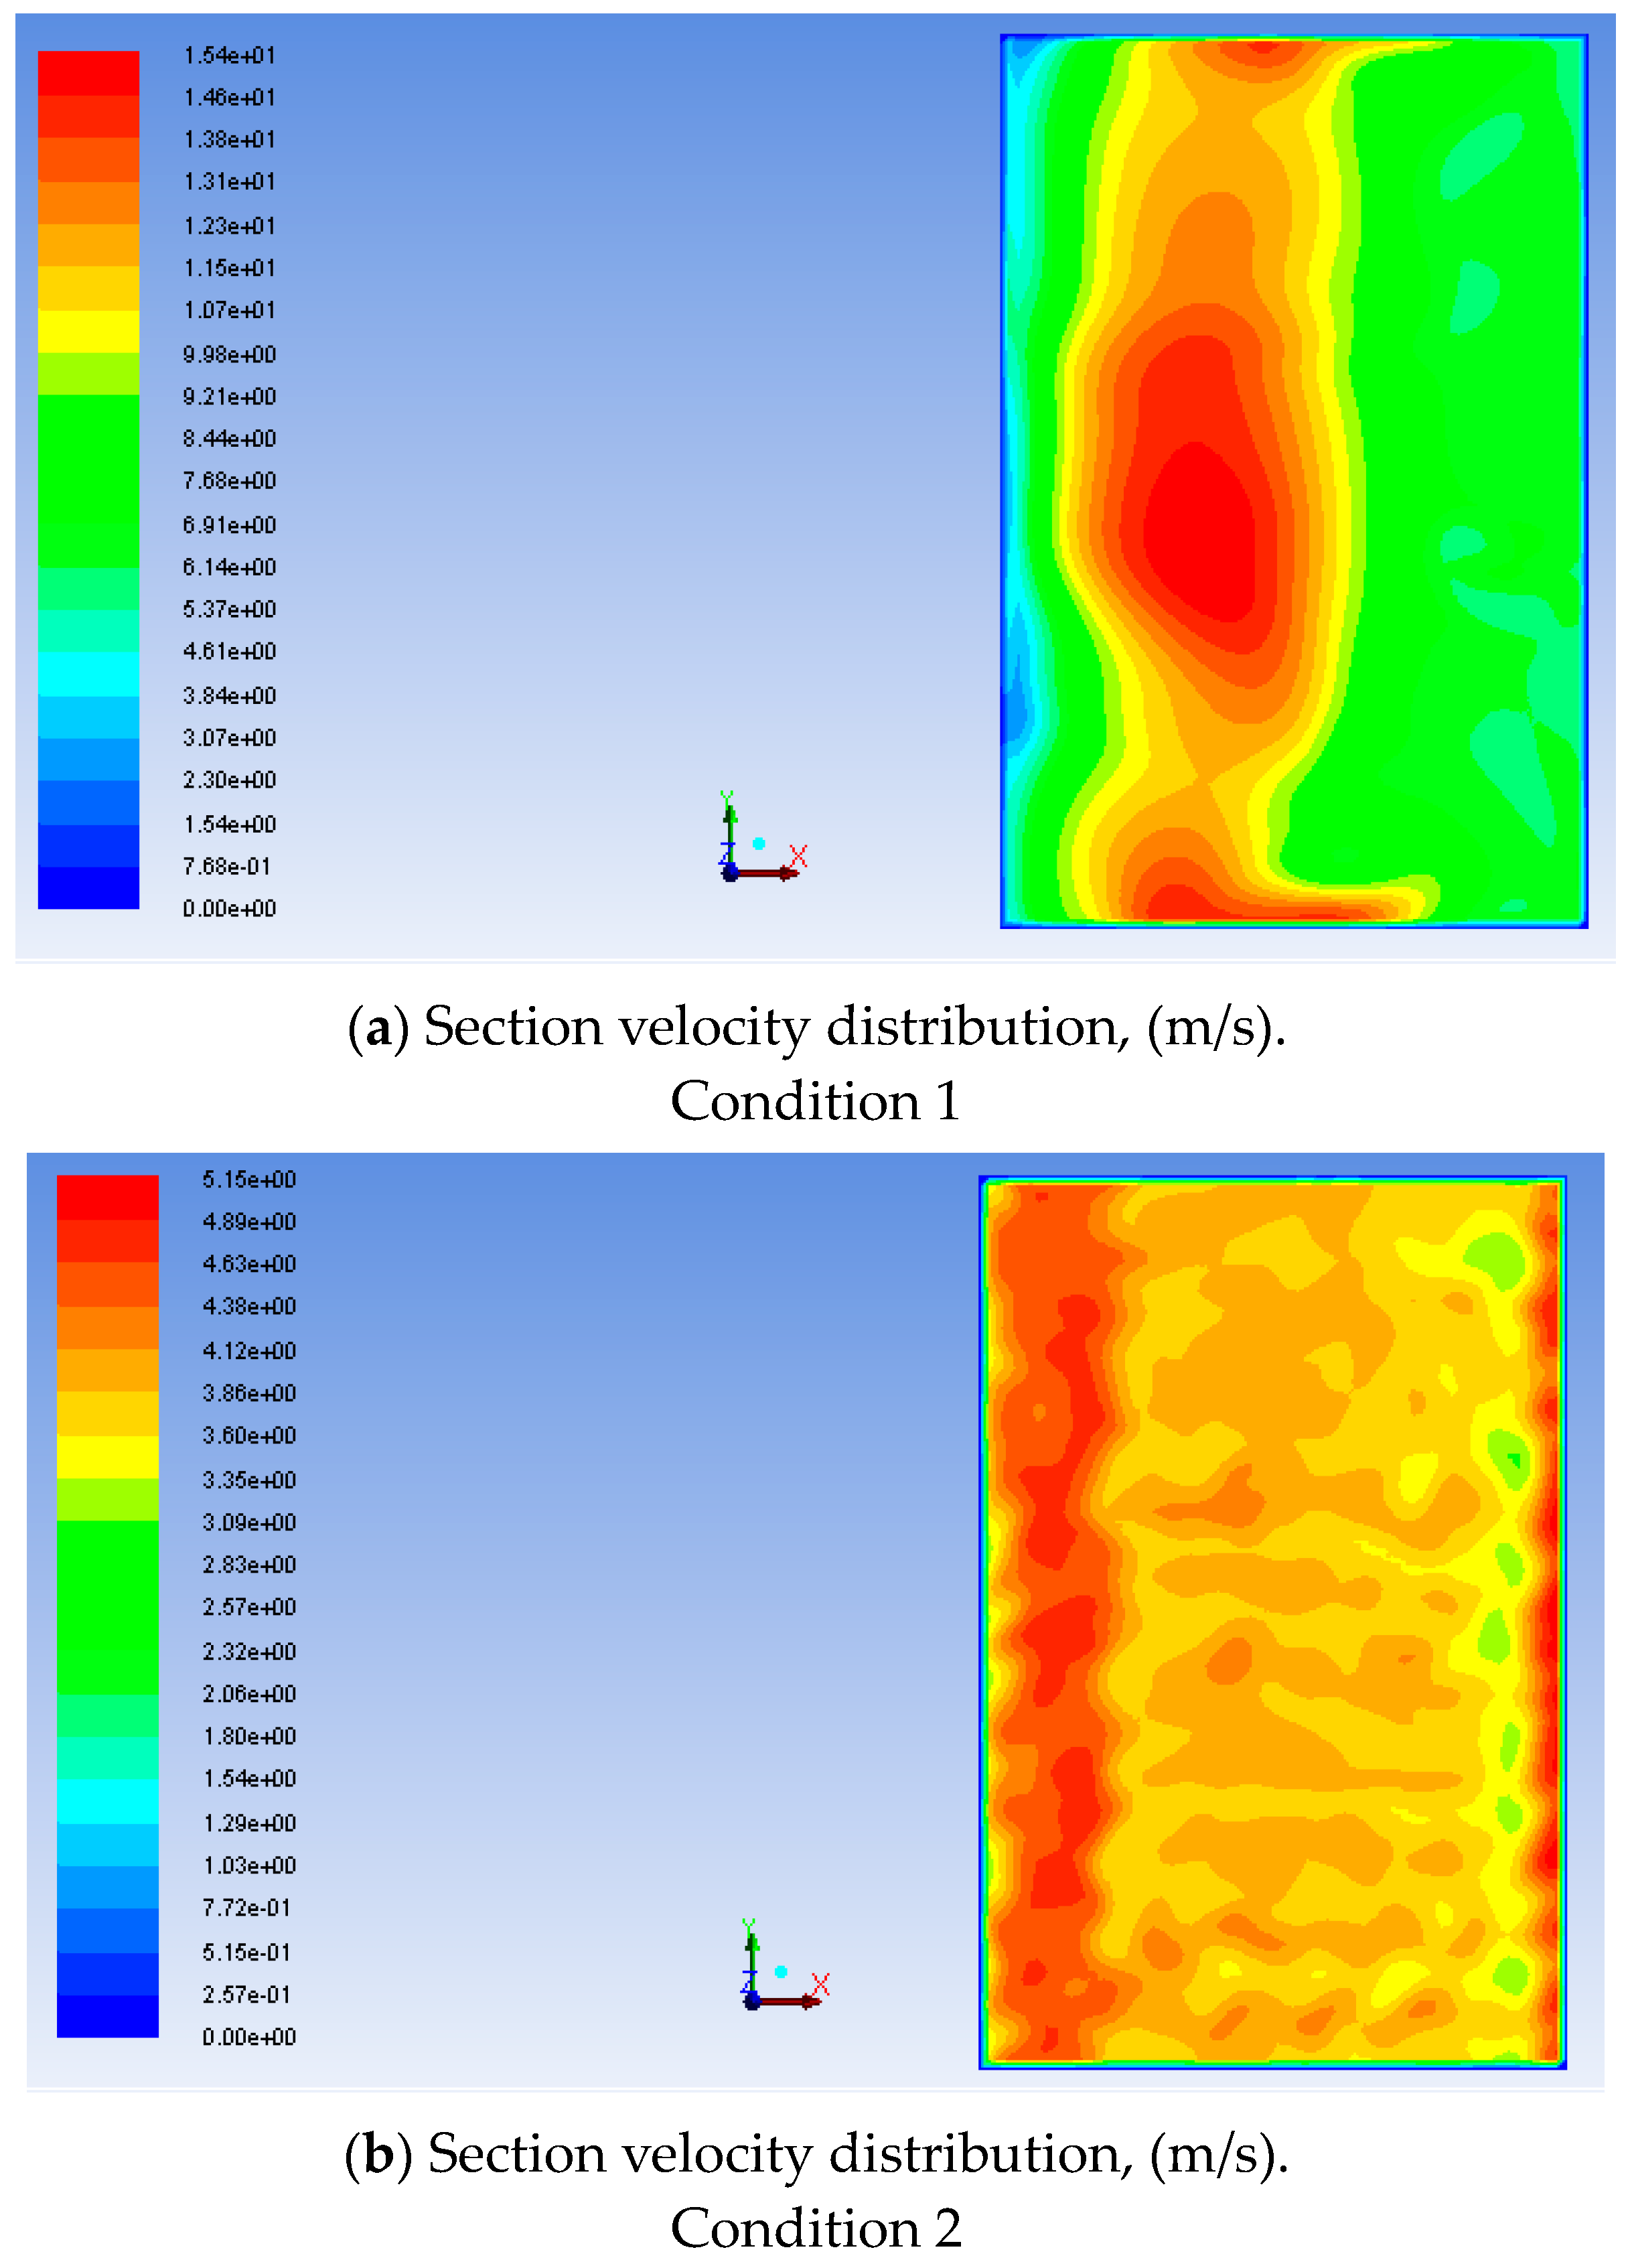
4.1. Analysis of the Results of the Velocity Field in the Centre Section

The velocity profile of the central section of the SCR reactor under each working condition is shown in Figure 4. As shown in Figure 4a, in Condition 1 the flow field in the tapered section had obvious inhomogeneity, so it was necessary to arrange the guide vanes in the tapered section. In addition, after the flue gas passed through the blending device of the hot blast stove, there were obvious reflux and acceleration phenomena at the first and second 90°, which caused large fluctuations in the velocity of the upstream section of the AIG. Therefore, the guide vanes should be installed at the first and second 90°. When the flue gas passed through the third 90°, backflow and acceleration also occurs, which was not conducive to the uniformity of the downstream horizontal flue and the upper flow field of the catalyst. When there were no inclined guide vanes and rectifying grids, it was found that the flue gas had an obvious backflow phenomenon in the upper layer of the catalyst, which leads to an uneven flow field in the upper layer of the catalyst. In addition, the flow field in the constriction section downstream of the lowermost catalyst layer had obvious inhomogeneity, and a flow guiding device needed to be installed in this constriction section.
As shown in Figure 4b, when the flue gas passed through the first and second 90° bends in working Condition 2, the flow field was obviously better than that of the device without guide vanes (working Condition 1). When there were three 90° bends, although the flue gas accelerated at the guide vanes of the outermost ring, after passing through the four arc-shaped guide vanes, the flue gas flow field was obviously more uniform than that of working Condition 1. In addition, in the horizontal flue gas at the top of the device, it was found that the flue gas exhibited an obvious layering phenomenon after passing through the four arc-shaped guide vanes. The flue gas was mainly concentrated in the middle and bottom of the horizontal flue, which led to the inhomogeneity of the flow field in the downstream catalyst layer. After the flue gas passed through the five inclined guide vanes and a rectifying grid with a spacing of 200 mm, the flow field in the upper layer of the catalyst was relatively uniform.
As shown in Figure 4c, when the guide vane spacing was set to 100 mm, the upstream flow field of the catalyst was more uniform. However, the flow field in the necking section downstream of the lowermost catalyst layer had an obvious inhomogeneity, so it needed to continue for optimization.
As shown in Figure 4d, after the straight-plate section was removed from the third 90° guide vane, the distribution of flue gas in the horizontal flue was more uniform; thus, the cross-sectional flow field in the upper layer of the catalyst should also be more uniform. In addition, compared with the above-mentioned working Conditions 1, 2, and 3, the rectifying grid was arranged downstream of the lowermost catalyst layer under working Condition 4. It can be clearly seen that the downstream flow field of the constriction section became more uniform after the rectifying grid was added.

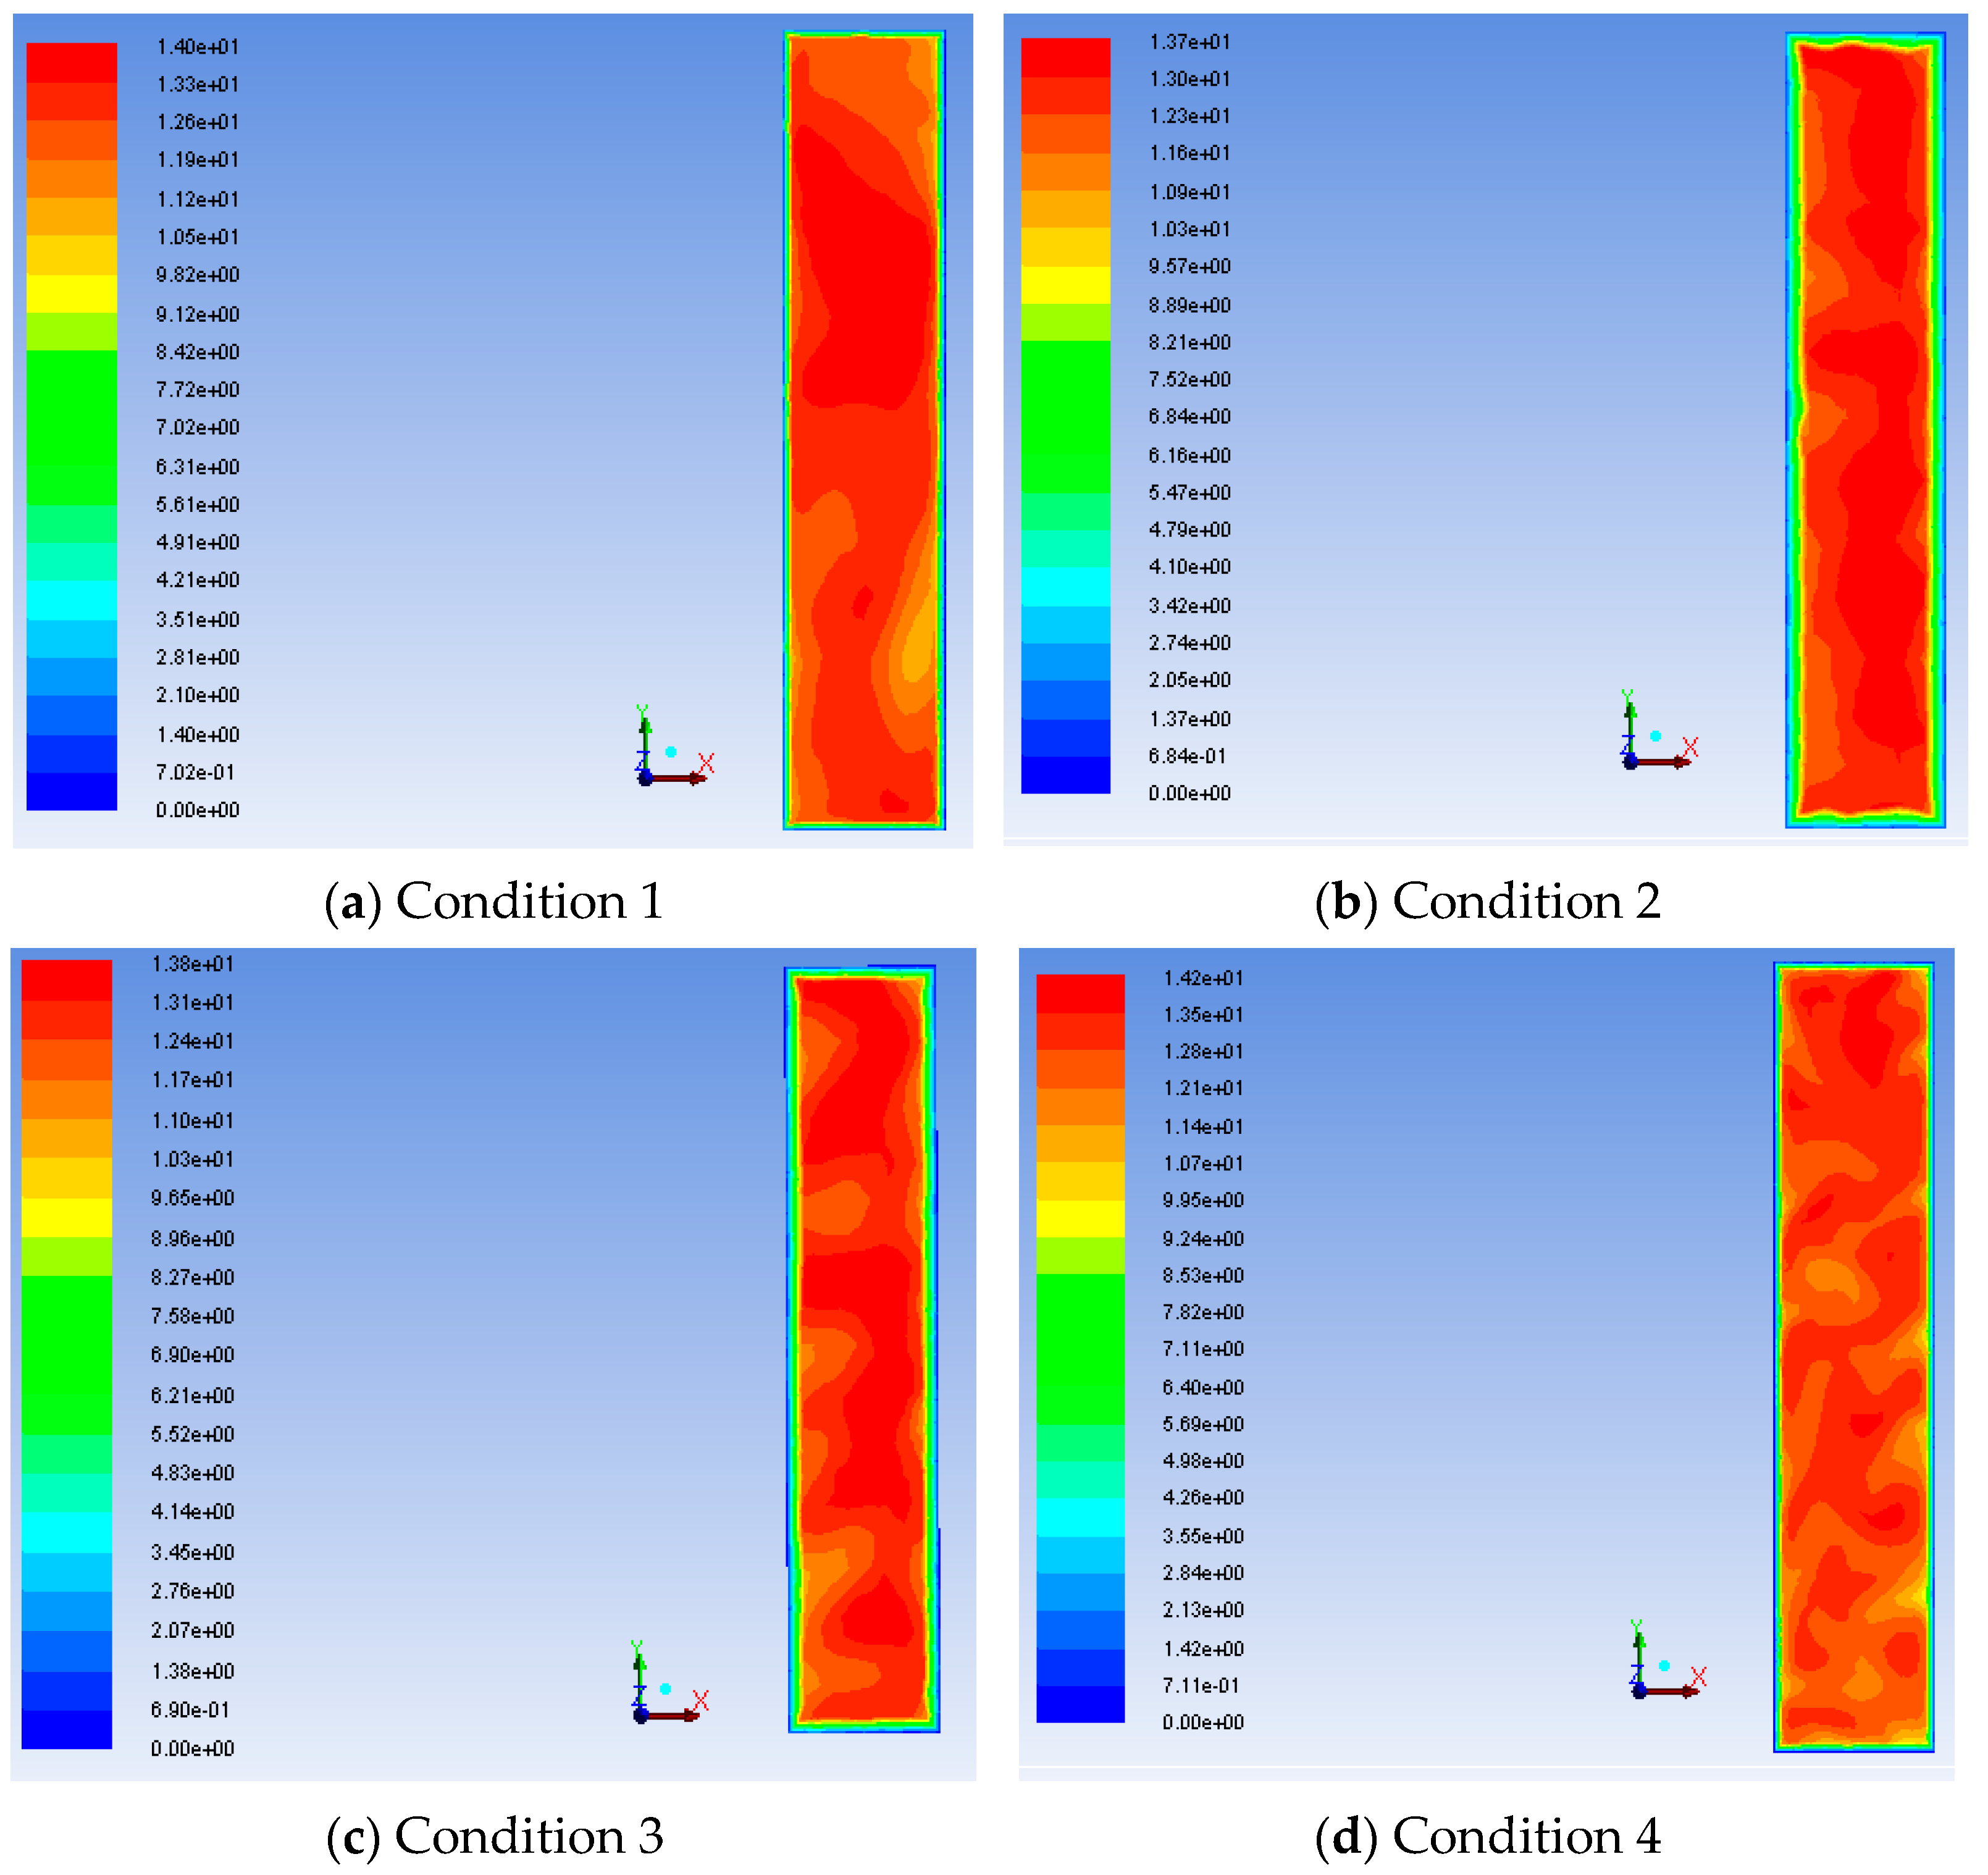
4.2. Analysis of Velocity Distribution of AIG Upstream Section

Figure 5 shows the velocity distribution of the section at 100 mm downstream of the AIG. As shown in Figure 5a, when there was no diversion device downstream of x, the velocity distribution of the cross section was relatively uniform. After calculation, it can be seen that the average velocity was 12.699 m/s, the velocity standard deviation was 0.828, and the velocity variance coefficient CV was 6.52%, meeting the requirements of AIG downstream velocity distribution uniformity. This was because the flue gas passed through two 90° bends, a long straight ascending section, and was mixed evenly before entering the AIG. Therefore, the requirement of speed uniformity could be achieved without adding guide vanes upstream of the AIG. From Figure 5b and the calculations, it can be seen that the average velocity of the AIG section in working Condition 2 was 12.644 m/s, the velocity standard deviation was 0.831 m/s, and the velocity variance coefficient CV was 6.57%, which also met the performance requirements. From Figure 5c and the calculations, it can be seen that the average velocity of the AIG section in working Condition 3 was 12.57 m/s, the standard deviation was 0.94 m/s, and the velocity variance coefficient was 7.48%, which met the technical requirements. Figure 5d showed the downstream velocity distribution characteristics of the AIG under working Condition 4. The calculation results showed that the average velocity of the section was 12.57 m/s, the standard deviation was 0.8416 m/s, and the variance coefficient was 6.69%, which met the requirements.

4.3. Analysis of Velocity, Temperature, and NH3/NOx of the Upper Layer of the Catalyst

4.3.1. Velocity Distribution of the Upper Layer of the Catalyst

Figure 6 shows the velocity distribution at the upper section of the first-layer catalyst at 500 mm. As shown in Figure 6a, the velocity distribution of the upper section of the catalyst under working Condition 1 was very uneven. The calculated velocity average was 9.43 m/s, the velocity standard deviation was 3.17, and the velocity variance coefficient CV was 33.6%. The section velocity did not meet the performance assessment requirements. As shown in Figure 6b, the velocity distribution on the cross section of the first layer of the catalyst under working Condition 2 was relatively uniform, with an average velocity of 3.989 m/s, a standard deviation of 0.3113 m/s, and a velocity variance coefficient CV of 7.8%. It can be seen from Figure 6c that the velocity distribution of the upper layer of the catalyst in working Condition 3 was relatively uniform, with an average velocity of 3.94 m/s, a velocity standard deviation of 0.24 m/s, and a velocity variance coefficient CV of 6.6%, which met the requirements. As shown in Figure 6d, the velocity distribution was very uniform, the average velocity was 3.91 m/s, the velocity standard deviation was 0.463 m/s, and the velocity variance coefficient CV was 11.84%, which met the requirements.

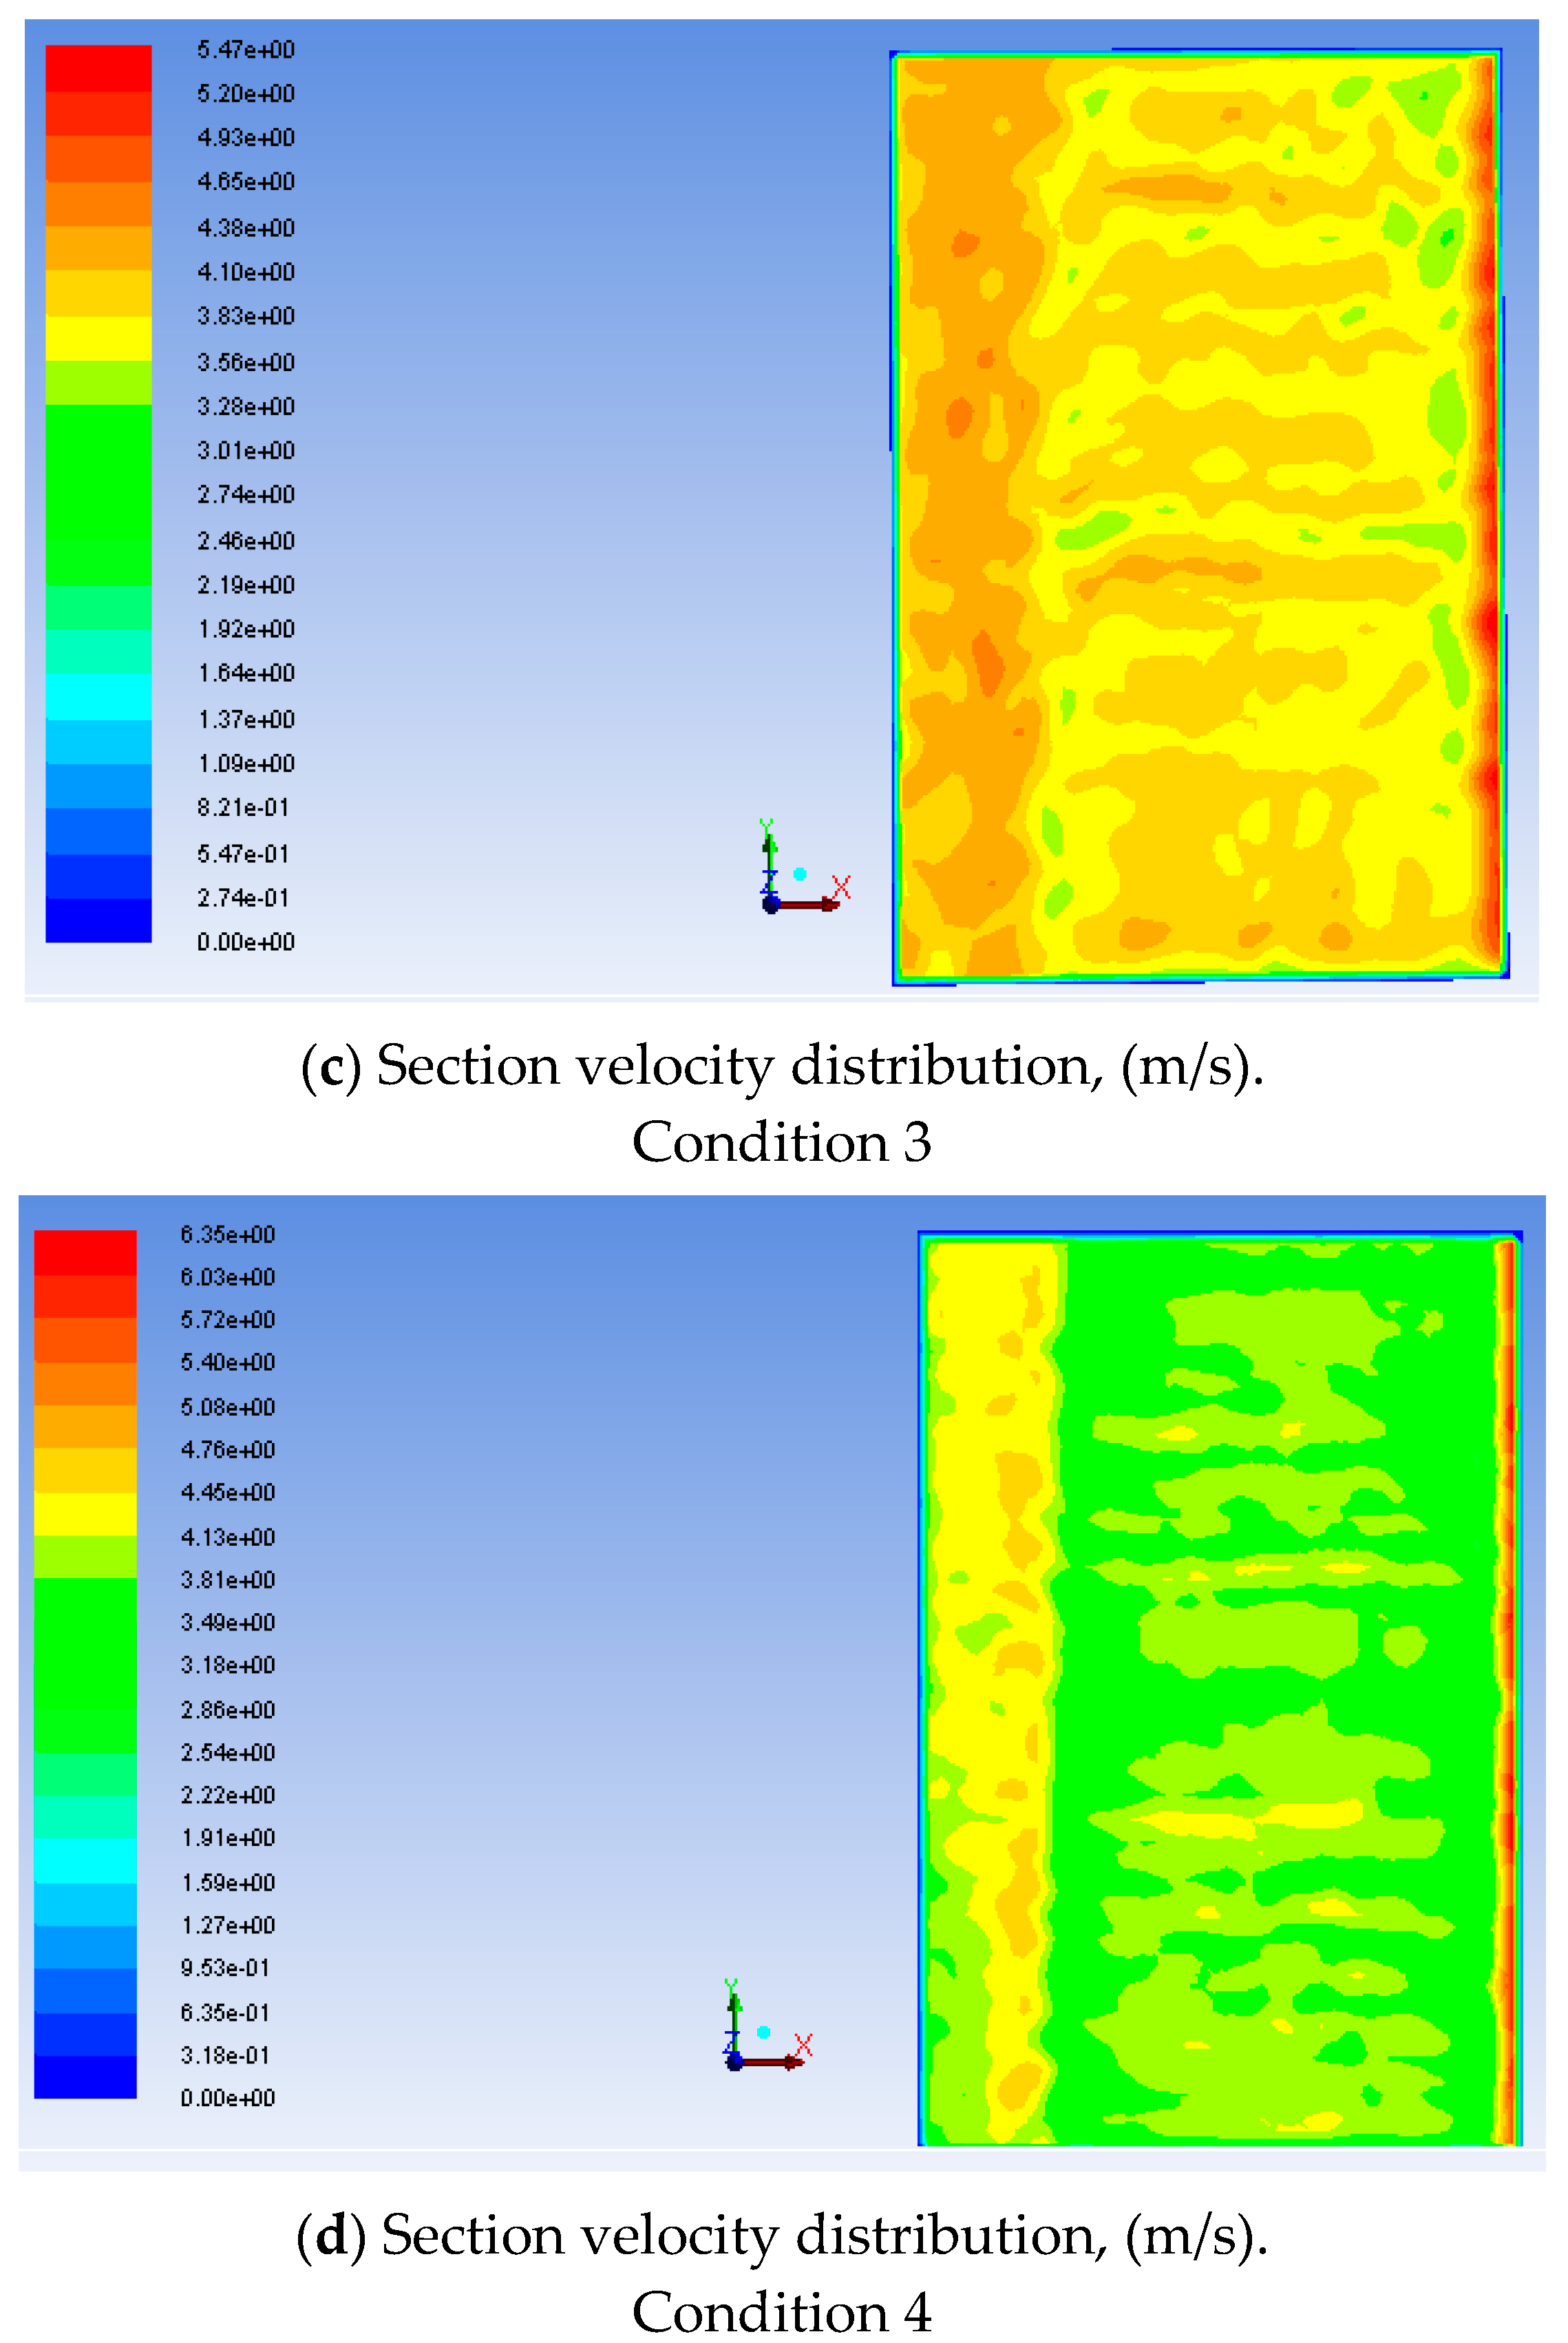
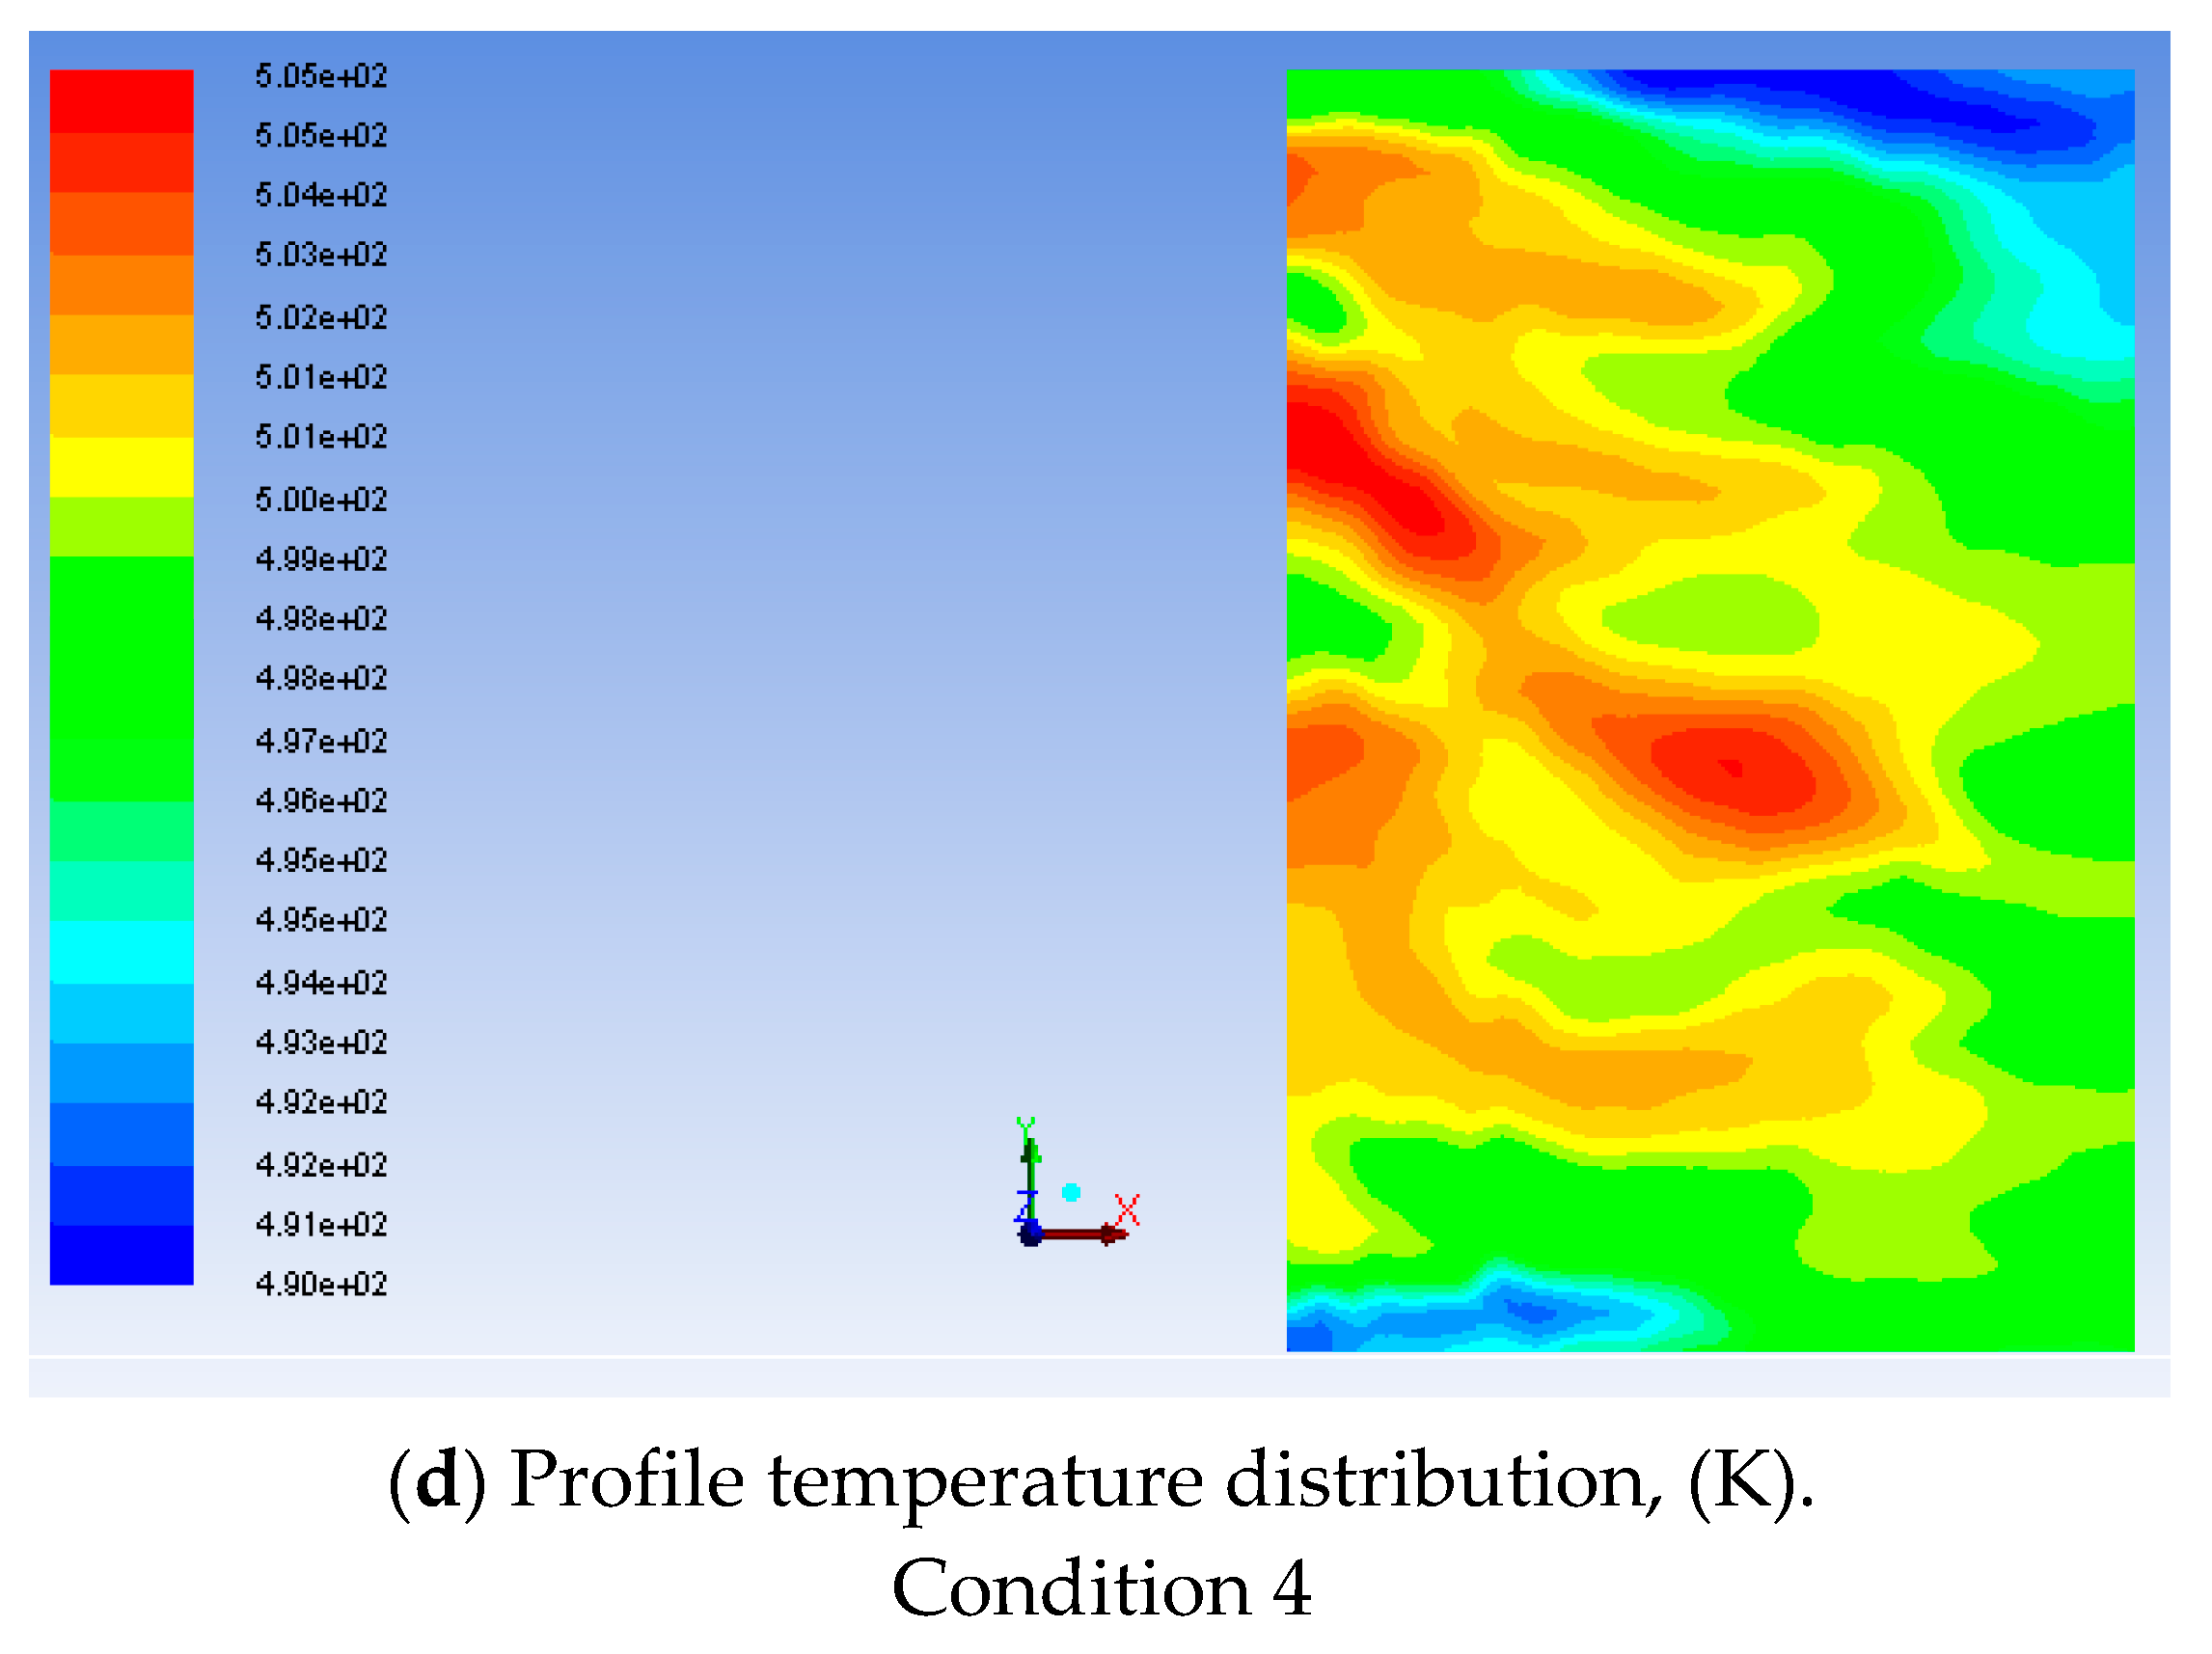
4.3.2. Temperature Distribution of the Upper Layer of the Catalyst

Figure 7 shows the temperature distribution at the upper section of the first-layer catalyst at 500 mm. Figure 7a shows that the temperature distribution of the upper section of the catalyst under working Condition 1 had an average temperature of 499 K, a maximum temperature of 503 K, a minimum temperature of 494 K, and a maximum temperature deviation of 5 °C, which met the performance requirements. As shown in Figure 7b, the average temperature of the section under working Condition 2 was 498 K, the maximum temperature was 504 K, the minimum temperature was 488 K, and the maximum temperature deviation was 10 °C, which met the performance assessment requirements. It can be seen from Figure 7c that the average temperature of the upper section of the catalyst in working Condition 3 was 498 K, the maximum temperature was 503 K, the minimum temperature was 489 K, and the maximum temperature deviation was 9 °C, which met the requirements. It can be seen from Figure 7d that the average temperature of the upper section of the catalyst in working Condition 4 was 499 K, the maximum temperature was 505 K, the minimum temperature was 490 K, and the maximum temperature deviation was 9 °C, which also met the requirements.

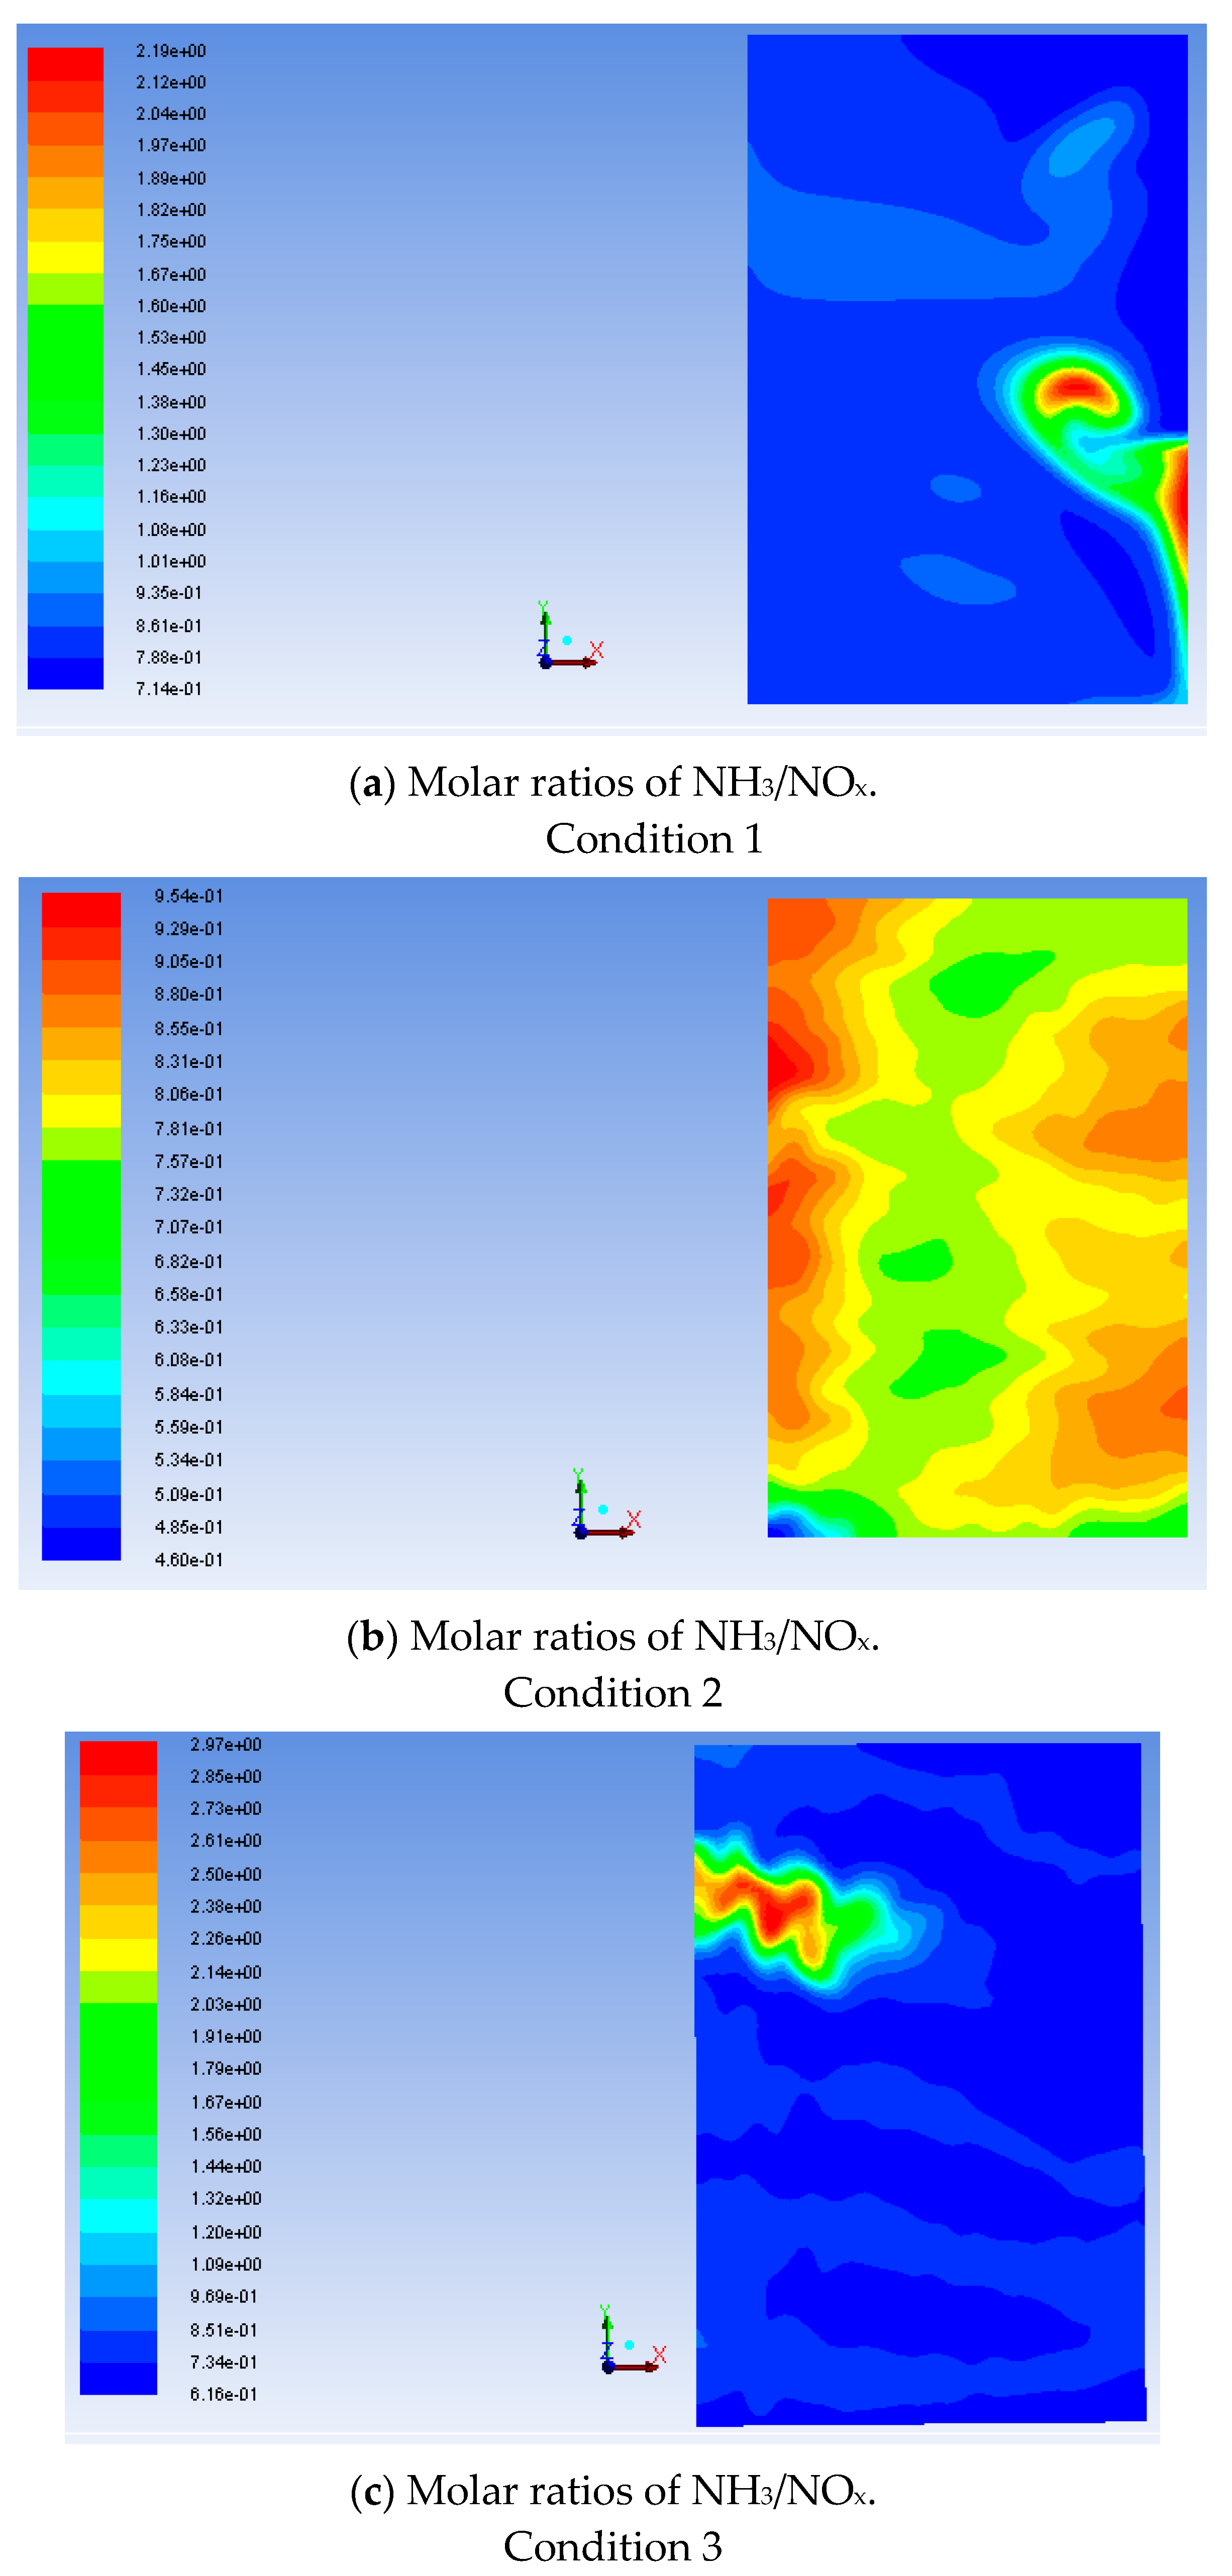
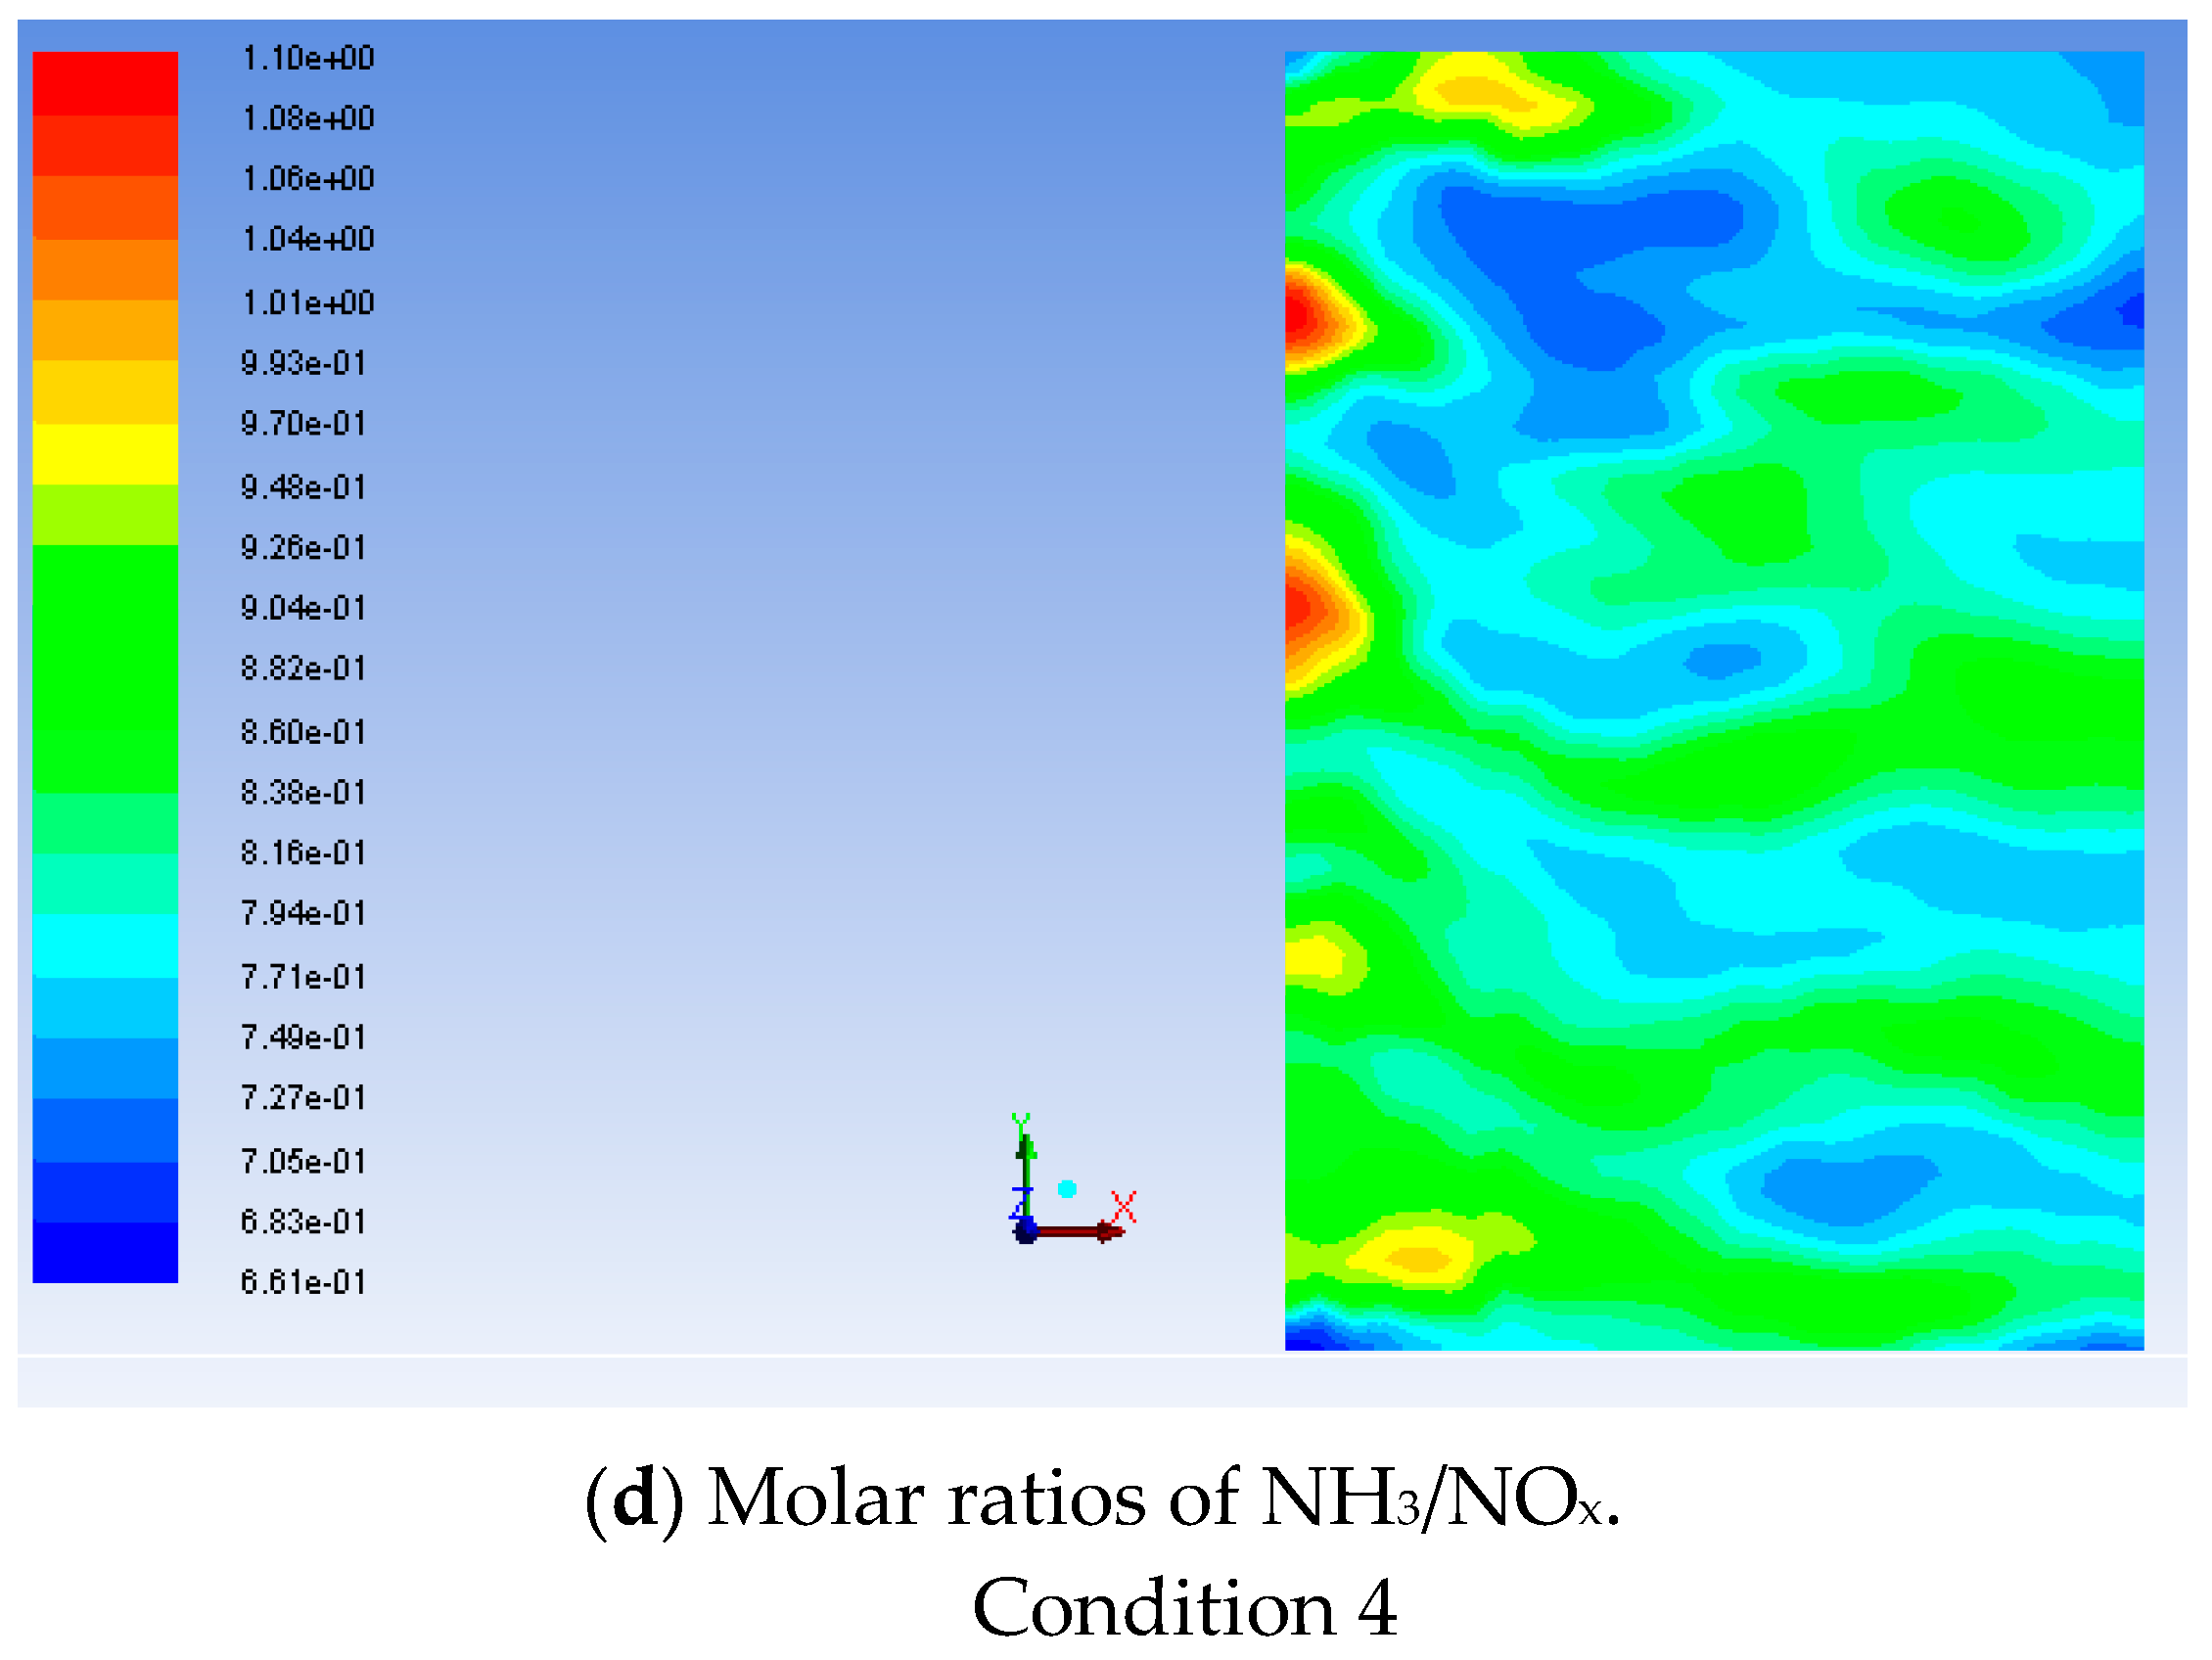
4.3.3. Ammonia–Nitrogen Ratio of the Upper Cross Section of the Catalyst

Figure 8 shows the ammonia–nitrogen ratio at the upper section of the first-layer catalyst at 500 mm. As shown in Figure 8a under working Condition 1, the average NH3/NOx molar ratio of the section was 0.878, the standard deviation was 0.1876, and the variance coefficient was 21.37%, which could not meet the assessment requirements. Only 0.8% of the airflow velocity declination angle on the section was less than ±10°, and the rest were all greater than ±10°. The pressure loss from the inlet to the outlet was 1644 Pa. It can be seen from Figure 8b that in working Condition 2, the average NH3/NOx molar ratio of the section was 0.804, the standard deviation was 0.0472, and the variance coefficient was 5.87%, which does not meet the performance assessment requirements. On the section, the air velocity declination angle was less than ±10°, accounting for 96.2%, and the rest were all greater than ±10°. The pressure loss from the inlet to outlet was 1814 Pa. As shown in Figure 8c, the average NH3/NOx molar ratio of Section 4 in working Condition 3 was 0.809, the standard deviation was 0.32, and the variance coefficient was 39.5%, which did not meet the requirements. The air velocity declination angle was less than ±10°, accounting for 75.9%, and the rest were all greater than ±10°. The pressure loss from the inlet to outlet was 1836 Pa. In Condition 3, it can be seen from the results that the NH3/NOx molar ratio fluctuated considerably when the rectifier grid spacing was 100 mm. In addition, as shown in Figure 8c, a region with a local high-NH3/NOx molar ratio appeared on the left side of the cross-sectional flow field. Therefore, in working Condition 4, as shown in Figure 8d, the straight section at the outlet end of the four guide vanes of the third 90° was removed to increase the uniformity of the flue gas in the horizontal straight section. The average NH3/NOx molar ratio of the cross section was 0.8122, the standard deviation was 0.038, and the variance coefficient was 4.67%, which met the requirements. Further analysis shows that the pressure loss from the inlet to the outlet was 1855 Pa.

4.4. Summary and Analysis of the Results of Each Condition

A summary of the calculation results for each working condition is presented in Table 6. As shown in Table 6, after continuous calculation and optimization, the optimization results of the guide vanes showed that working Condition 4 can fully meet the requirements of the performance assessment of the SCR guide device. The optimal structure and arrangement of the guide vanes are as follows: four straight guide vanes were arranged at the inlet-tapered section; three arc-shaped guide vanes were arranged at the first 90°, and a straight-plate section was installed at the outlet end; the second 90° was arranged with three arc-shaped guide vanes; the third 90° was arranged with four arc-shaped guide vanes; the inclined straight guide vanes were arranged with five; and the downstream constriction section of the lowermost catalyst layer adopted a rectifying grille composed of four horizontal and three vertical guide fins. The calculation results of the entire flow field showed that the velocity variance coefficient CV of the downstream AIG was 6.69, the velocity variance coefficient of the upper section of the catalyst was 11.84, the average temperature of the section was 499 K, the maximum temperature deviation was 9 °C, the maximum-to-minimum temperature interval span was 15 °C, and in the section NH3/NOx, the average molar ratio was 0.8122, the coefficient of variance was 4.67, and the pressure loss was 1855 Pa.

5. Results and Discussion

According to the comparison of the velocity, temperature, and gas component concentration distribution of the flow field before and after optimization, the diversion device and the mixing device were adjusted repeatedly to obtain a more reasonable flow field characteristic.
(1) Without installing the deflector, the flue gas flew through the SCR device, and the flow field in the tapered section exhibited an obvious unevenness. After the flue gas passed through the blending device of the hot blast stove, there were obvious reflux and acceleration phenomena at the first and second 90° elbows, which can easily cause large fluctuations in the velocity of the upstream section of the ammonia injection grille. When there were no inclined guide vanes or rectifying grilles, it was found that the flue gas had an obvious reflux phenomenon on the upper layer of the catalyst, which led to an uneven flow field in the upper layer of the catalyst. This serious flow unevenness will affect the performance and service life of the denitration equipment;
(2) According to the continuous calculation and optimization, for the optimization plan of the deflector of the denitration system, four pieces of straight guide vanes should be arranged in the inlet-tapered section, three pieces of arc-shaped guide vanes should be arranged at the first 90°, and the straight-plate section should be arranged at the outlet end. The second 90° was arranged with three arc-shaped guide vanes, the third 90° was arranged with four arc-shaped guide vanes, the inclined straight-plate guide vanes were arranged with five pieces (100 mm, there was a slope on the left), and the downstream constriction section of the lowermost catalyst layer adopted a rectifying grid composed of four horizontal and three vertical guide fins;
(3) The numerical simulation results showed that the optimized scheme for the AIG downstream velocity variance coefficient CV was 6.69, the catalyst upper section velocity variance coefficient was 11.84, the cross-sectional temperature average was 499 K, the maximum temperature deviation was 9 °C, and the maximum-to-minimum temperature interval span was 15 °C, the average cross-section NH3/NOx molar ratio was 0.8122, the variance coefficient was 4.67, and the pressure loss was 1855 Pa, which met the design requirements.

Author Contributions

B.H.: writing—original draft, methodology, investigation, and data curation; C.C.: writing—original draft, methodology, and investigation; S.J.: investigation and project administration; X.L.: writing—review and editing; Q.D.: funding acquisition. All authors have read and agreed to the published version of the manuscript.

Funding

This research was funded by the Xuzhou Key Research and Development Project grant number KC20192 and the Natural Science Fund for Colleges and Universities in Jiangsu Province grant number 19KJ470034.

Institutional Review Board Statement

Not applicable.

Informed Consent Statement

Not applicable.

Data Availability Statement

Not applicable.

Acknowledgments

This project is financially supported by the Xuzhou Key Research and Development Project (KC20192) and the Natural Science Fund for Colleges and Universities in Jiangsu Province (19KJ470034).

Conflicts of Interest

The authors declare that they have no known competing financial interests or personal relationships that appeared to influence the work reported in this paper.

References

  1. Mohsin, M.; Abbas, Q.; Zhang, J.; Ikram, M.; Iqbal, N. Integrated effect of energy consumption, economic development, and population growth on CO2 based environmental degradation: A case of transport sector. Environ. Sci. Pollut. R 2019, 26, 32824–32835. [Google Scholar] [CrossRef] [PubMed]
  2. Xin-Gang, Z.; Gui-Wu, J.; Ang, L.; Yun, L. Technology, cost, a performance of waste-to-energy incineration industry in China. Renew. Sustain. Energy Rev. 2016, 55, 115–130. [Google Scholar] [CrossRef]
  3. Mori, A. Socio-technical and political economy perspectives in the Chinese energy transition. Energy Res. Soc. Sci. 2018, 35, 28–36. [Google Scholar] [CrossRef]
  4. Chen, H.; Yang, L.; Zhang, P.; Harrison, A. The controversial fuel methanol strategy in China and its evaluation. Energy Strateg. Rev. 2014, 4, 28–33. [Google Scholar] [CrossRef]
  5. Wei, Y.; Gui, K.; Liu, X.; Liang, H.; Gu, S.; Ren, D. Performance of Mn-Ce co-doped siderite catalysts in the selective catalytic reduction of NOx by NH3. J. Fuel Chem. Technol. 2019, 47, 1495–1503. [Google Scholar] [CrossRef]
  6. Silas, K.; Ghani, W.A.W.A.; Choong, T.S.Y.; Rashid, U. Carbonaceous materials modified catalysts for simultaneous SO2/NOx removal from flue gas: A review. Catal. Rev. Sci. Eng. 2019, 61, 134–161. [Google Scholar] [CrossRef]
  7. Sharif, H.M.A.; Mahmood, N.; Wang, S.; Hussain, I.; Hou, Y.-N.; Yang, L.-H.; Zhao, X.; Yang, B. Recent advances in hybrid wet scrubbing techniques for NOx and SO2 removal: State of the art and future research. Chemosphere 2021, 273, 129695. [Google Scholar] [CrossRef]
  8. Gashaw, T.T.; Yitayal, A.A. Principal air pollutants and their effects on athletes health and performance: A critical review. Sci. Res. Essays 2019, 14, 44–52. [Google Scholar] [CrossRef]
  9. Tang, L.; Qu, J.; Mi, Z.; Bo, X.; Chang, X.; Anadon, L.D.; Wang, S.; Xue, X.; Li, S.; Wang, X.; et al. Substantial emission reductions from Chinese power plants after the introduction of ultra-low emissions standards. Nat. Energy 2019, 4, 929–938. [Google Scholar] [CrossRef]
  10. Han, D.; Xu, L.; Wu, Q.; Wang, S.; Duan, L.; Wen, M.; Li, Z.; Tang, Y.; Li, G.; Liu, K. Potential environmental risk of trace elements in fly ash and gypsum from ultra-low emission coal-fired power plants in China. Sci. Total Environ. 2021, 798, 149116. [Google Scholar] [CrossRef]
  11. Li, R.; Chen, W.; Xiu, A.; Zhao, H.; Zhang, X.; Zhang, S.; Tong, D.Q. A comprehensive inventory of agricultural atmospheric particulate matters (PM10 and PM2.5) and gaseous pollutants (VOCs, SO2, NH3, CO, NOx and HC) emissions in China. Ecol. Indic. 2019, 107, 105609. [Google Scholar] [CrossRef]
  12. Cui, L.; Li, Y.; Tang, Y.; Shi, Y.; Wang, Q.; Yuan, X.; Kellett, J. Integrated assessment of the environmental and economic effects of an ultra-clean flue gas treatment process in coal-fired power plant. J. Clean. Prod. 2018, 199, 359–368. [Google Scholar] [CrossRef]
  13. Zhang, N.; Li, L.; Guo, Y.; He, J.; Wu, R.; Song, L.; Zhang, G.; Zhao, J.; Wang, D.; He, H. A MnO2-based catalyst with H2O resistance for NH3-SCR: Study of catalytic activity and reactants-H2O competitive adsorption. Appl. Catal. B Environ. 2020, 270, 118860. [Google Scholar] [CrossRef]
  14. Damma, D.; Ettireddy, P.R.; Reddy, B.M.; Smirniotis, P.G. A Review of Low Temperature NH3-SCR for Removal of NOx. Catalysts 2019, 9, 349. [Google Scholar] [CrossRef] [Green Version]
  15. Ren, D.; Gui, K. Study of the adsorption of NH3 and NOx on the nano-γFe2O3 (001) surface with density functional theory. Appl. Surf. Sci. 2019, 487, 171–179. [Google Scholar] [CrossRef]
  16. Yang, J.; Zhou, J.; Tong, W.; Zhang, T.; Kong, M.; Ren, S. Low-temperature flue gas denitration with transition metal oxides supported on biomass char. J. Energy Inst. 2019, 92, 1158–1166. [Google Scholar] [CrossRef]
  17. Ye, M.; Qian, F.; Gao, Y.; Lu, J.; Han, Y.; Huang, N.; Xu, B.; Wu, H. CFD analysis of influencing factors on SCR denitration efficiency of sintering flue gas based on response surface methodology. Atmos. Pollut. Res. 2021, 12, 101107. [Google Scholar] [CrossRef]
  18. Wu, Y.-X.; Liang, H.-L.; Chen, X.; Chen, C.; Wang, X.-Z.; Dai, C.-Y.; Hu, L.-M.; Chen, Y.-F. Effect of preparation methods on denitration performance of V-Mo/TiO2 catalyst. J. Fuel Chem. Technol. 2020, 48, 189–196. [Google Scholar] [CrossRef]
  19. Xu, Y.; Zhang, Y.; Wang, J.; Yuan, J. Application of CFD in the optimal design of a SCR–DeNOx system for a 300 MW coal-fired power plant. Comput. Chem. Eng. 2013, 49, 50–60. [Google Scholar] [CrossRef]
  20. Habib, M.; Elshafei, M.; Dajani, M. Influence of combustion parameters on NOx production in an industrial boiler. Comput. Fluids 2008, 37, 12–23. [Google Scholar] [CrossRef]
  21. You, Y.; Wu, Z.; Zeng, W.; Zhang, Z.; Wang, S.; Dai, F.; Yi, Z. CFD modeling of unsteady SCR deNOx coupled with regenerative heat transfer in honeycomb regenerators partly coated by Vanadium catalysts. Chem. Eng. Res. Des. 2019, 150, 234–245. [Google Scholar] [CrossRef]
  22. Van Belleghem, M.; Steeman, M.; Janssen, H.; Janssens, A.; De Paepe, M. Validation of a coupled heat, vapour and liquid moisture transport model for porous materials implemented in CFD. Build. Environ. 2014, 81, 340–353. [Google Scholar] [CrossRef] [Green Version]
  23. Lu, X.; Xie, P.; Ingham, D.; Ma, L.; Pourkashanian, M. A porous media model for CFD simulations of gas-liquid two-phase flow in rotating packed beds. Chem. Eng. Sci. 2018, 189, 123–134. [Google Scholar] [CrossRef]
  24. Saneinejad, S.; Moonen, P.; Carmeliet, J. Coupled CFD, radiation and porous media model for evaluating the micro-climate in an urban environment. J. Wind Eng. Ind. Aerodyn. 2014, 128, 111. [Google Scholar] [CrossRef]
  25. Shi, X.; Xiang, Y.; Wen, L.-X.; Chen, J.-F. CFD analysis of liquid phase flow in a rotating packed bed reactor. Chem. Eng. J. 2013, 228, 1040–1049. [Google Scholar] [CrossRef]
  26. Kosmadakis, G.M.; Rakopoulos, C.D. A Fast CFD-Based Methodology for Determining the Cyclic Variability and Its Effects on Performance and Emissions of Spark-Ignition Engines. Energies 2019, 12, 4131. [Google Scholar] [CrossRef] [Green Version]
  27. Kee, S.P.; Gavriilidis, A. Design and characterisation of the staggered herringbone mixer. Chem. Eng. J. 2008, 142, 109–121. [Google Scholar] [CrossRef]
Figure 1. Three-dimensional simulation diagram of SCR reaction device (including guide vanes).
Energies 15 01451 g001
Figure 2. The structure diagram of guide vane arrangement.
Energies 15 01451 g002
Figure 3. SCR three-dimensional model meshing.
Energies 15 01451 g003
Figure 4. Velocity profile of the SCR reactor under various conditions. (a) Condition 1; (b) Condition 2; (c) Condition 3; (d) Condition 4.
Energies 15 01451 g004
Figure 5. AIG downstream cross-section velocity distribution, m/s. (a) Condition 1; (b) Condition 2; (c) Condition 3; (d) Condition 4.
Energies 15 01451 g005
Figure 6. Velocity distribution at the upper cross section of the catalyst. (a) Condition 1; (b) Condition 2; (c) Condition 3; (d) Condition 4.
Energies 15 01451 g006aEnergies 15 01451 g006b
Figure 7. Temperature distribution at the upper cross section of the catalyst. (a) Condition 1; (b) Condition 2; (c) Condition 3; (d) Condition 4.
Energies 15 01451 g007aEnergies 15 01451 g007b
Figure 8. Distribution characteristics of NH3/NOx on the 500 mm section upstream of the catalyst first layer. (a) Condition 1; (b) Condition 2; (c) Condition 3; (d) Condition 4.
Energies 15 01451 g008aEnergies 15 01451 g008b
Table 1. SCR system operating parameters.
ParametersUnit
Flue gas flowNm3/h410,000
Flue gas pressurekPa−3
COmg/Nm3500
CO2vol%25
H2Ovol%8.6
N2vol%62
O2vol%7.06
SO2mg/Nm330
NOxmg/Nm3520
Particulate mattermg/Nm315 mg/Nm3
Table 2. Inlet parameters of ammonia injection.
The Single-Hole Flow/(m3/h)Inlet Velocity/(m/s)Hydraulic Radius/(mm)Turbulence Intensity/
%
Temperature/(K)
17349.13105.46300
Table 3. Mass fraction of each component at the ammonia injection inlet.
O2NH3N2
0.2260.02858\
Table 4. Numerical simulation and optimization of SCR guide vane.
Condition 1Without Any Deflector Device
Condition 2The inlet-tapered section was arranged with four straight guide plates;
The first 90° was arranged with three arc-shaped guide vanes;
The second 90° was arranged with three arc-shaped guide vanes;
The third 90° was arranged with four arc-shaped guide vanes, and a straight plate section was set at the outlet section of the vane;
Five pieces of inclined straight guide vanes were arranged;
The rectifying grid was 300 mm high, 200 mm apart, and had a slope on the left.
Condition 3The inlet-tapered section was arranged with four straight guide plates;
The first 90° was arranged with three arc-shaped guide vanes, and the outlet end is provided with a straight section;
The second 90° was arranged with three arc-shaped guide vanes;
The third 90° was arranged with four arc-shaped guide vanes, and a straight-plate section was set at the outlet section of the vane;
Five pieces of inclined straight guide vanes were arranged;
The rectifying grids were 300 mm high, 100 mm apart, and had slopes on the left.
Condition 4The inlet-tapered section was arranged with four straight guide plates;
The first 90° was arranged with three arc-shaped guide vanes, and the outlet end was provided with a straight section;
The second 90° was arranged with three arc-shaped guide vanes;
The third 90° was arranged with four arc-shaped guide vanes;
Five pieces of inclined straight guide vanes were arranged;
The height of the rectifier grid were 300 mm, the spacing is 100 mm, and there was a slope on the left;
The downstream constriction section of the lowermost catalyst layer adopted a rectifying grille composed of four horizontal and vertical guide fins
Table 5. Parameters of catalyst layer.
Single-Layer Catalyst Pressure Drop (Pa)PorosityCoefficient of Viscous Drag (m−2)Coefficient of Inertial Drag
(m−1)
4500.6580120
Table 6. Summary of the results of the four conditions.
ConditionAIG Upstream Section VelocityCatalyst Upper Layer 500 mm VelocityProfile Temperature(K)Molar Ratio of NH3/NOxThe Proportion of Speed Declination
<±10°
Pressure Drop
(Pa)
Average Velocity (m/s)Coefficient of Variance (%)Average Velocity (m/s)Coefficient of Variance (%)Average ValueMaximum ValueMinimum ValueAverage ConcentrationCoefficient of Variance (%)
Condition 112.6996.529.4333.64995034940.87821.370.81644
Condition 212.6446.573.9897.84985044880.8045.8796.21814
Condition 312.577.483.946.64985034890.80939.575.91836
Condition 412.576.693.9111.844995054900.81224.6798.81855
Publisher’s Note: MDPI stays neutral with regard to jurisdictional claims in published maps and institutional affiliations.

