Article

Influence of the Contamination of Fuel with Fly Ash Originating from Biomass Gasification on the Performance of the Anode-Supported SOFC

by
Marek Skrzypkiewicz
1,2,*,
Michal Wierzbicki
1,2,3,
Stanislaw Jagielski
1,2,3,
Yevgeniy Naumovich
1,2,
Konrad Motylinski
1,2,3,
Jakub Kupecki
1,2,
Agnieszka Zurawska
1,2 and
Magdalena Kosiorek
1,2,3
1
Department of High Temperature Electrochemical Processes (HiTEP), Institute of Power Engineering, Mory 8, 01-330 Warsaw, Poland
2
CTH2—Center for Hydrogen Technologies, Institute of Power Engineering, Augustówka 36, 02-981 Warsaw, Poland
3
The Faculty of Power and Aeronautical Engineering, Institute of Heat Engineering, Warsaw University of Technology, Nowowiejska 21/25, 00-665 Warsaw, Poland
*
Author to whom correspondence should be addressed.
Submission received: 15 January 2022 / Revised: 2 February 2022 / Accepted: 15 February 2022 / Published: 17 February 2022
(This article belongs to the Special Issue Solid Oxide Cells: Technology, Design and Applications)

Abstract

:
The integration of solid oxide fuel cells (SOFCs) with biomass gasification reactors raises the possibility of solid particle contamination of the gaseous fuel entering the cell. Technical specifications from SOFC manufacturers, among other sources, claim that SOFCs do not tolerate the presence of solid particles in fuel. However, there is very limited literature on the experimental investigation of feeding SOFCs with particulate matter aerosols. In this study, a standard 5 × 5 cm anode-supported SOFC was fueled by two types of aerosols, namely, (1) inert powder of grain sizes and concentration equivalent to gasifier fly ash and (2) a real downdraft gasifier fly ash, both suspended in a gaseous fuel mixture. For reference, cells were also investigated with a dust-free fuel gas of the same composition. A straightforward negative influence of the inert powder aerosol could not be confirmed in experiments with a duration of 6 days. That said, the introduction of carbonaceous fly ash aerosol caused slow but irreversible damage to the SOFC. The degradation mechanisms were studied, and the presence of carbon-containing particles was found to clog the pores of the SOFC anode. The maximum measured power density of the SOFC equaled 855 mW/cm2 (850 °C, reference fuel). Feeding inert aerosol fuel caused no rapid changes in power density. A moderate drop in performance was observed throughout the experiment. The contamination of fuel with fly ash resulted in an initial performance gain and a ca. 25% performance drop longer term (43 h of contamination). Post-mortem analysis revealed contamination on the walls of the gas channels, with some visible alumina or fly ash spots in the anode area.

1. Introduction

The thermochemical conversion or, specifically, gasification of solid fuels, such as biomass, waste or coal, is a source of valuable gaseous fuel for further utilization, which, unfortunately, contains particulate matter in the form of fly ash, condensed tars and small char particles, among others. The morphology and chemical composition of the particles are related to the raw solid fuel material and the specific parameters of the process of thermochemical conversion. There is scarce available knowledge in the form of published results of experimental or theoretical works regarding the effect of particulates in gaseous fuels on processes occurring in the SOFC anodic part. Din and Zainal [1] state that the problem has not been addressed in the literature, whether systematically or, indeed, even superficially.
R. Bernat et al. investigated the influence of feeding dust (tale) into a molten carbonate fuel cell (MCFC) electrode. Their task was to feed dust into the cathode stream of an MCFC in a single-cell arrangement. In their short duration experiment, the fuel cell operated for 27 h in total with no visible voltage drop. The authors observed that the fine powder talc (5 µm) formed a porous structure on the surface of the cathode, which was easily penetrated by cathodic gas [2,3].
Numerous results regarding coupling biomass gasification reactors with SOFCs might be found in the literature, including the investigation of impurity tolerance and cleanup methods [4,5,6,7], the technical aspects of coupling itself [8,9,10,11,12,13,14] and review papers [1,15,16,17]. Various teams have made attempts to characterize the particulate matter present in the biomass gasification product gas, particularly in papers summarizing specific reactor prototypes [18,19,20]. The investigations address, among others, particulate size distribution and chemical composition [21]. These analyses indicate the ranges of size distributions (1 ÷ 10 µm) and concentrations (600 ÷ 1000 mg/Nm3) of particles present in the gaseous gasification product; values that were used as a starting point to design the experimental approach presented in this work.
The effects of supplying particulate matter-containing gaseous fuel to SOFCs vary in nature. Firstly, the fuel supply channels in SOFCs (in both research test systems and semi-technical scale ones) are usually rectangular or trapezoidal in shape with a cross-sectional area of 1–5 mm2. This corresponds to the flow velocity of the fuel gas through a channel in the range of 0.1 ÷ 0.4 m/s and a Reynolds number of about 1 (estimated for the temperature of 750 °C) [22]. At such low flow velocities and a fully laminar flow, dust particles are expected to precipitate from the suspension and to deposit inside the fuel supply ducts (channels). This would cause an increase in the pressure drop of the gas, leading to lower fuel cell system efficiency and, eventually, complete blockage of the particular channel, resulting in parts of the anode being deprived of fuel supply and, therefore, being excluded from the electrochemical process.
Secondly, a relatively wide range of grain sizes of the solid particles entrained by the gaseous fuel (0.01–100 µm) [23,24] could theoretically clog the pores in the porous cermet layers of the SOFC anode. In consequence, this would impede the mass transport of the gaseous fuel to the active site of the electrochemical reaction and the discharge of the reaction products. This phenomenon could possibly be detected by means of a detailed analysis of the electrochemical impedance spectra (EIS) and cell polarization measurements (I–V). In the case of the deposition of particulate matter in the anodic pores, both of these measuring techniques should detect an increase in cell concentration polarization. An observable deposition of particles should be expected in the pore volume of the anode.
Thirdly, if the particulate matter entrained by the gaseous fuel contained carbonaceous particles, for example, if the fuel gas came from the thermochemical conversion of solid matter (e.g., the gasification of biomass) and entered the anodic compartment of the SOFC, carbon could undergo processes similar to those occurring in direct carbon solid oxide fuel cells. These processes can be divided into three groups as proposed by [17], namely, (1) electrochemical oxidation at the SOFC surface of the free carbon particles [25,26,27,28] or (2) electrochemical oxidation of the carbon deposited in the anode [29,30,31,32], or (3) a Boudouard reaction (Equation (1) to generate CO in situ, which was studied by many [8,25,33,34]).
C + CO 2 2 CO
This phenomenon is likely to positively affect the process of electrochemical oxidation of the particulate-rich fuel, lowering the concentration of the carbon particles in the exhaust gas released from the SOFC. Furthermore, the solid carbonaceous fuel has a heating value of ca. 160 kJ/Nm3 at a particle concentration of 5000 mg/Nm3, which corresponds to a ca. 3% increase in the heating value of the fuel, generated through the air gasification of biomass.
Additionally, chemical degradation of the anode material by solid–solid interaction and the erosive wear of the anode layer could also occur, but both phenomena are long-term processes and were not expected to be measurable in the experiments conducted in this campaign, which did not exceed a couple of hundred hours.

2. Materials and Methods

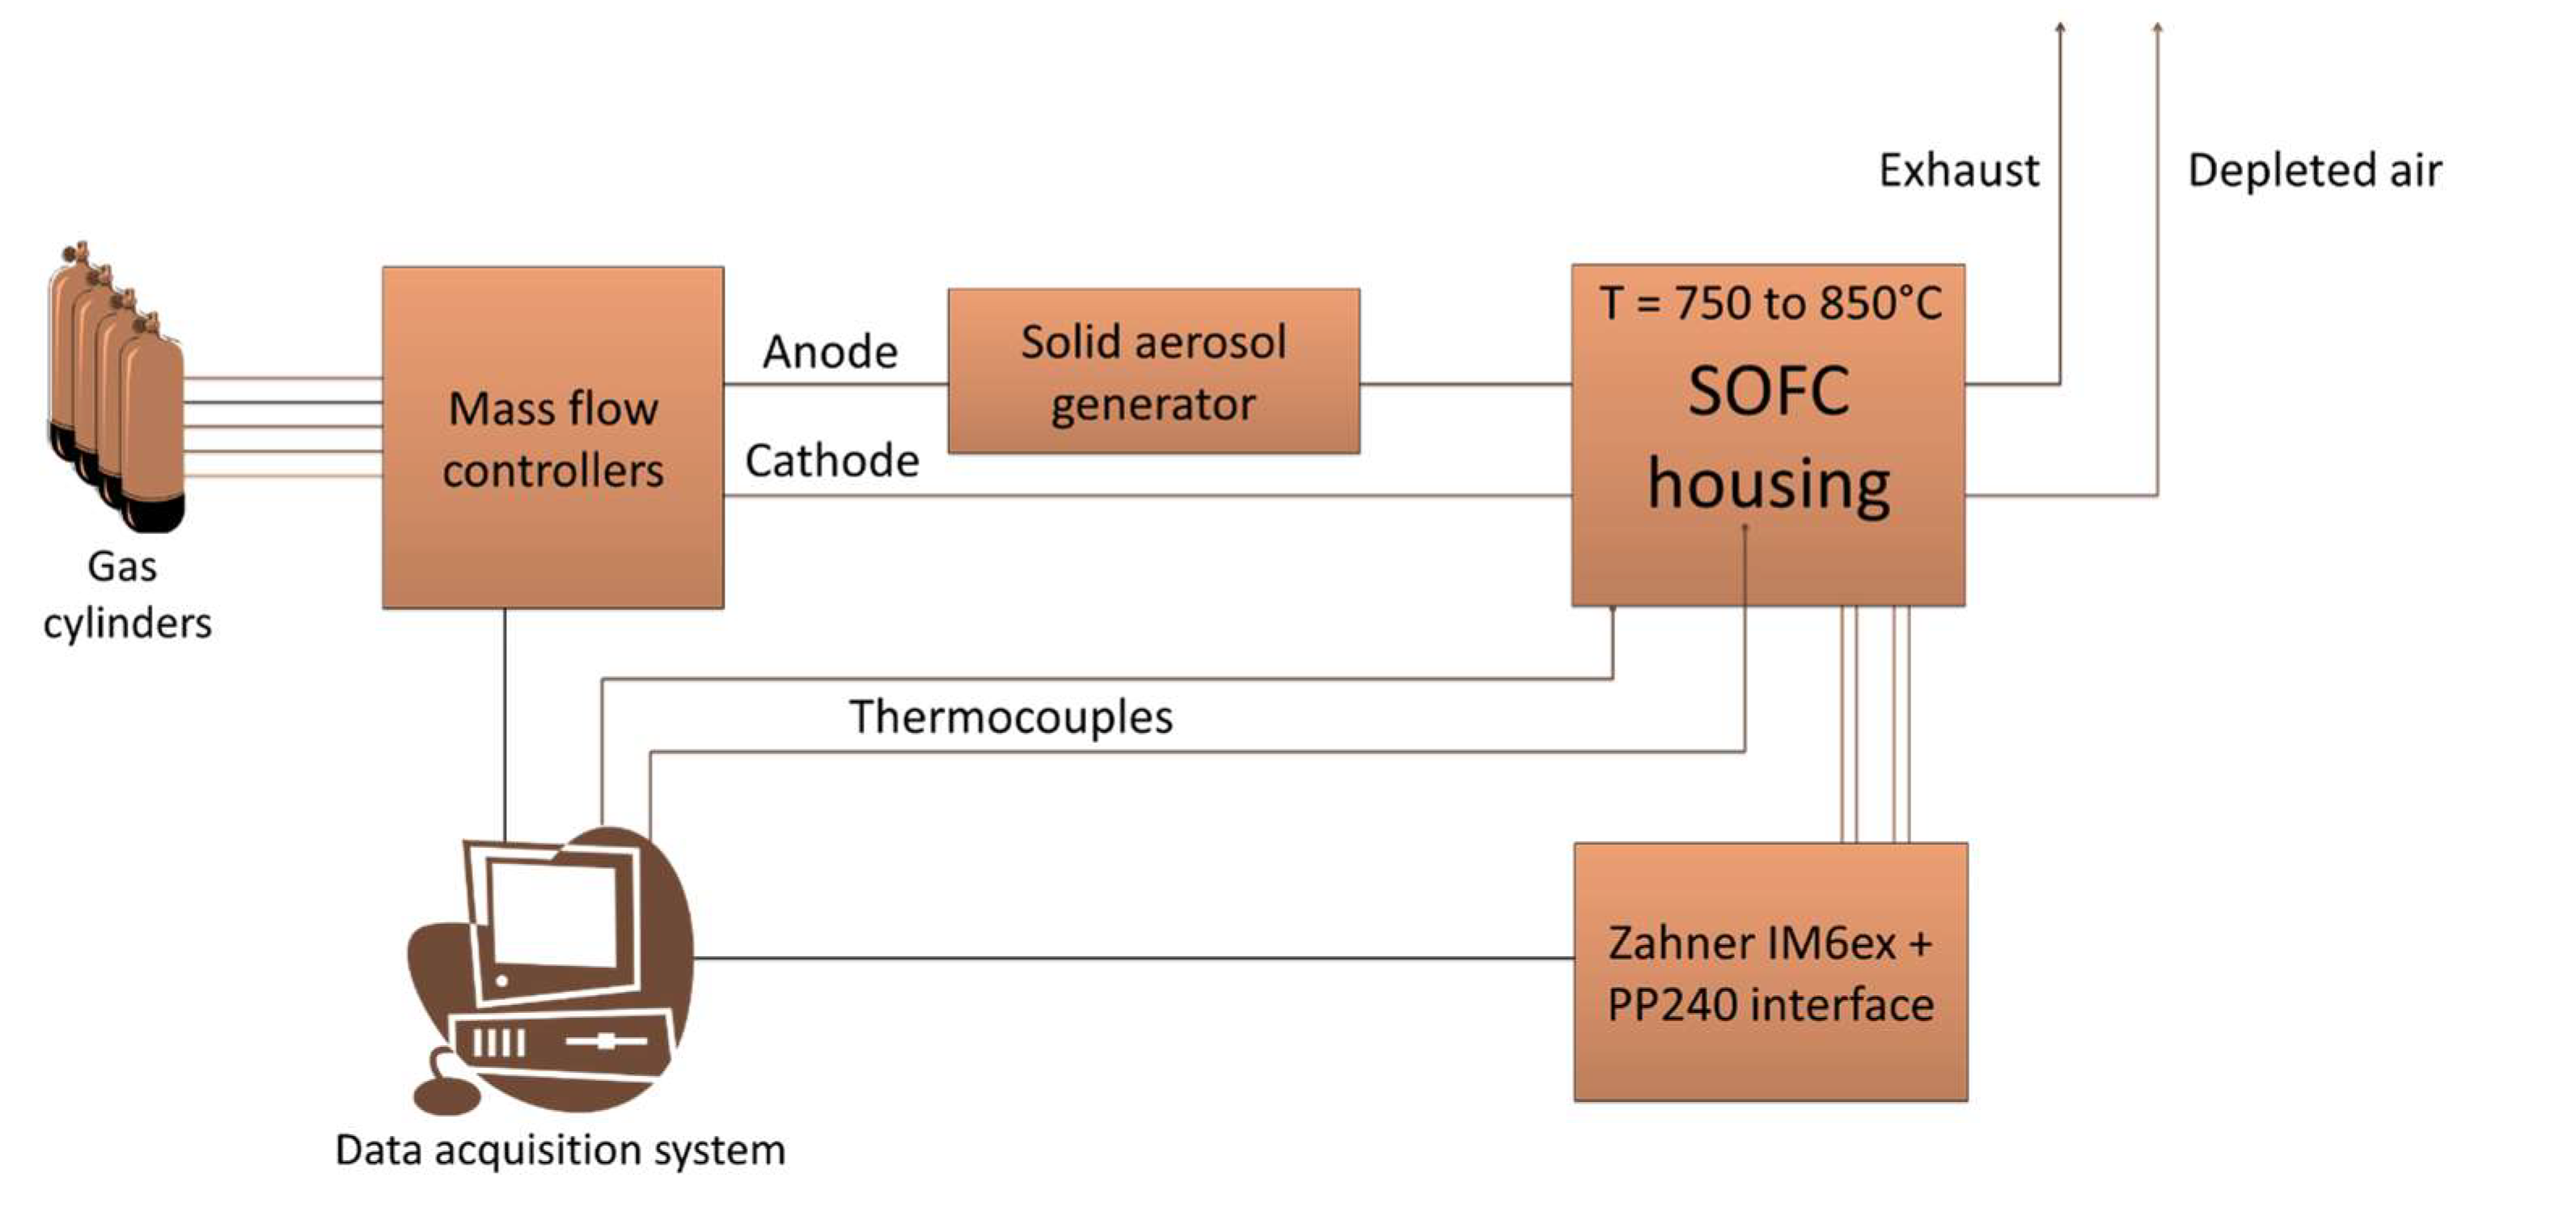
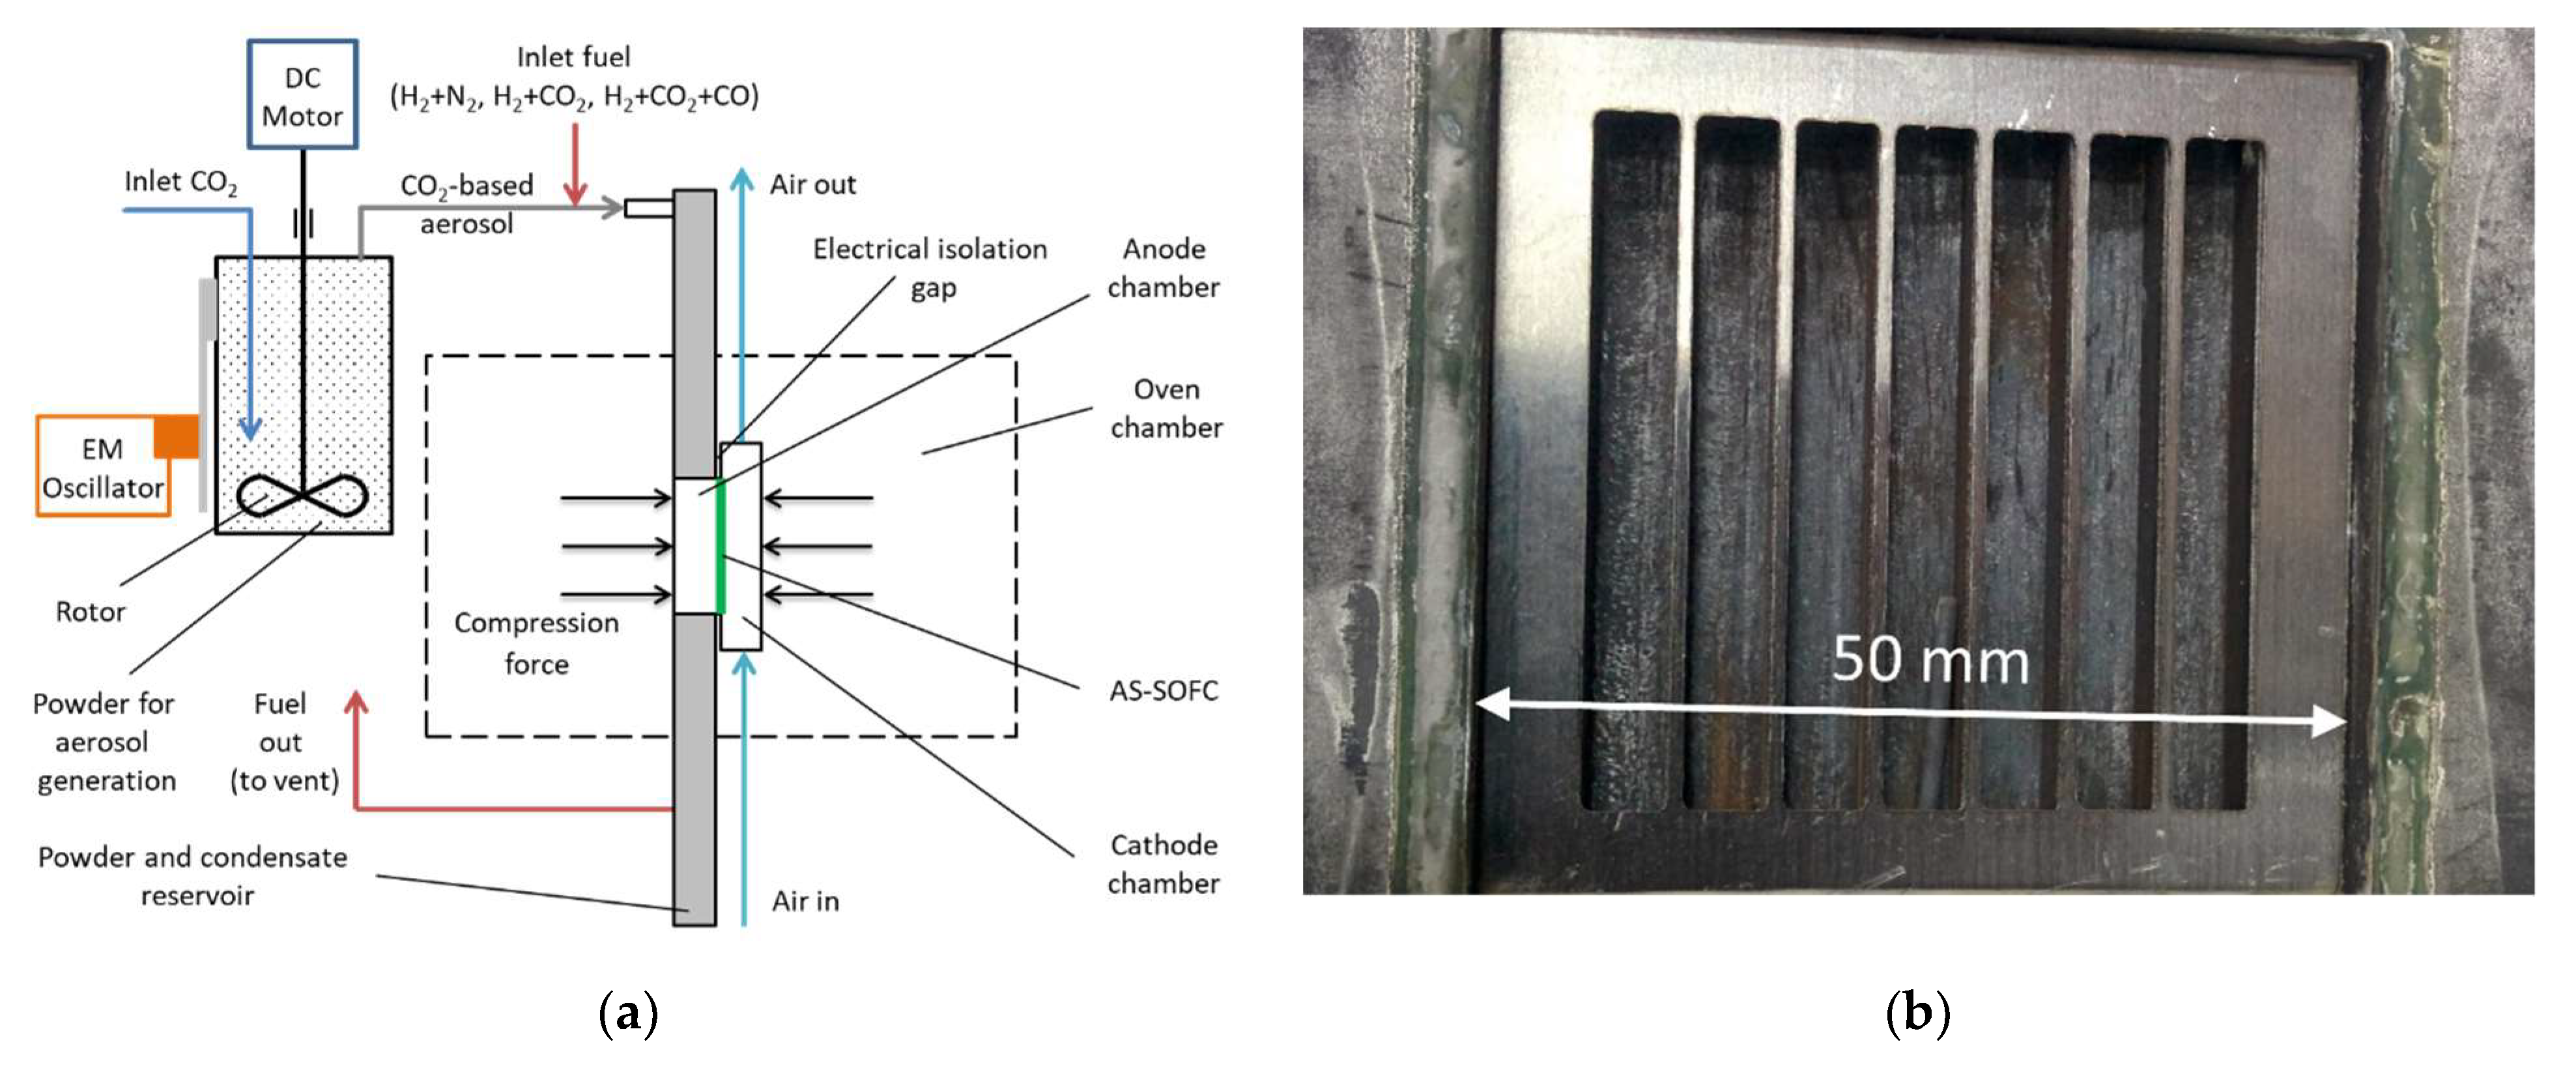
2.1. Experimental Setup and Cell

The experimental campaign was performed with the use of flat geometry square cells of 5 × 5 cm size and thickness of ca. 1 mm, manufactured in-house (Ceramic Department CEREL, Institute of Power Engineering). The cells consisted of the Ni|Ni-YSZ(support)|YSZ|GDC|LSCF (Figure 1) layers and are described elsewhere [35]. The active (cathode) area of the cell was 16 cm2.
A test bench dedicated to the investigation of SOFCs with aerosol-contaminated fuels was previously presented at a local conference [36], but some modifications were made as detailed below. The setup concept is based on state-of-art SOFC test benches, consisting of a high-temperature electric furnace (IZO), cell housing (developed in-house), mass flow controllers (Bronkhorst BV, AK Ruurlo, Nietherlands), electrochemical test station (Zahner IM6ex equipped with PP240 interface, Zahner-elektrik Gmbh, Kronach–Gundelsdorf, Germany) and voltage and temperature monitoring integrated with a Lab-View-based data acquisition system. A simplified chart of the test setup is presented in Figure 2.
The setup was equipped with a solid aerosol generator designed and built in-house as part of the project. It was installed on the anode gas supply line, directly before entering the SOFC housing. The device, shown schematically in Figure 3a, consisted of a container filled with dried powder up to 5–10% volume. Inside the container, a 3-blade rotor was installed on a shaft fixed by a sealed bearing in the top cover in such a way that the rotor was close to the container bottom, and the top end of the shaft was connected to a DC motor. The rotor diameter was ca. 96 mm, and the container diameter was ca. 115 mm. The rotor speed was kept at ca. 2500 rpm. The locations of the inlet and outlet of inert gases (CO2 and N2) in the generator are shown in Figure 3a. The container was attached to an electromagnetic vibration mount (50 Hz) to ensure that the dust did not stick to the walls but fell downwards to the rotor zone. The system produces aerosols with powder of 1000 ÷ 5500 mg/Nm3 concentration at the inlet to the SOFC housing.
The standard single SOFC test housing was replaced with housing developed for direct carbon operation, as described in [37]. The unique, vertical arrangement of the housing, together with its fuel channels (seven in total) with a cross-sectional area of 25 mm2 each (order of magnitude higher than for standard housing), is less prone to clogging of the gas channels and gravitational fall of solid matter on various cell holder elements. The fuel flows downwards, as do the solid particles and steam generated in the electrochemical reaction on the anode, eventually entering a tight reservoir, which has an outlet pipe directed upwards, allowing pre-dried exhaust gas to escape during operation. The condensate and powder remain at the bottom of the compartment until the end of the experiment. A conceptual sample holder chart and a picture of the anodic current collector installed in the anode chamber are presented in Figure 3.

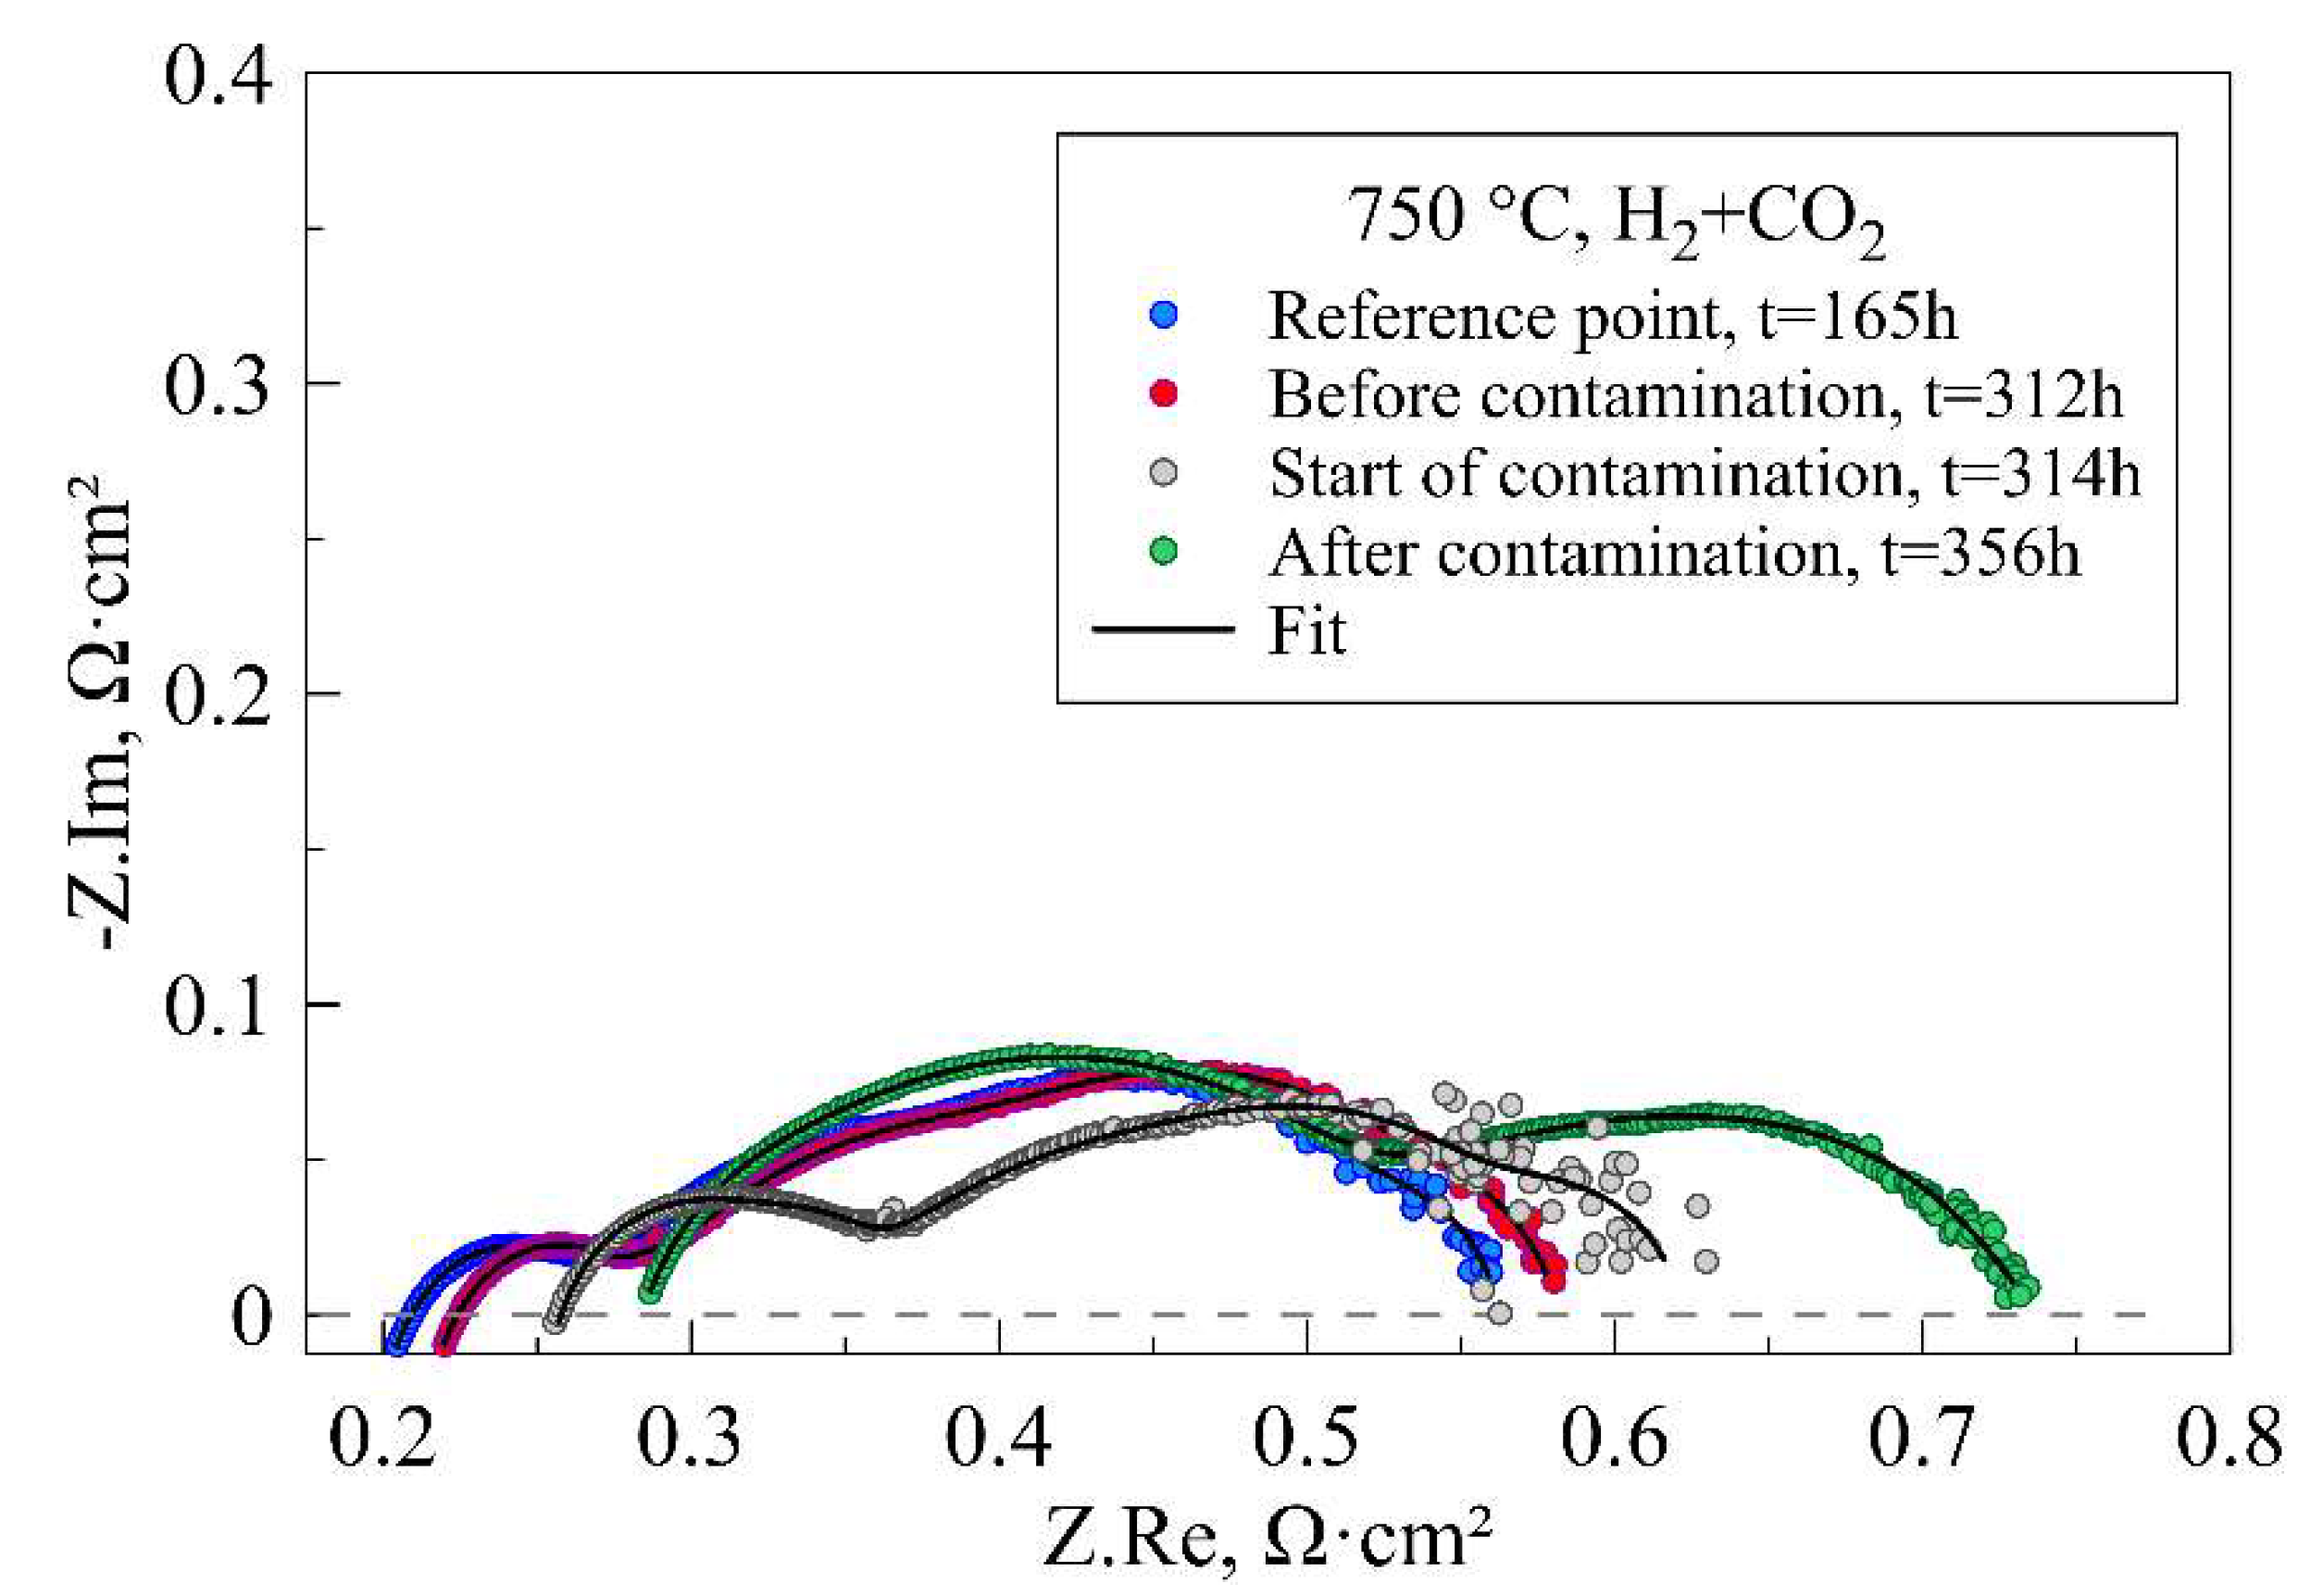
2.2. Impedance Spectra Analysis

EIS measurements were conducted at a constant current density of 0.375–0.5 A/cm2 in the frequency range 0.01…104 kHz. The data gathered were treated in a dedicated home-brew software toolbox, subjected to DRT treatment of the spectra according to the procedure proposed in [38] and fit to the equivalent circuit models. One special feature of this software toolbox is its ability to use equivalent circuits, whose impedances are formulated in a manner that maintains direct compatibility with the formalism used in the DRT approach. It is likely that, due to the special design of the cell housing, the low-frequency domain for all spectra had sufficient noise (see Results and Discussion Section), so the direct usage of DRT for the analysis results was impossible. As a result, a custom approach was applied to analyze impedance data. EIS spectra were treated using DRT to determine the characteristic relaxation times, and then an equivalent circuit model was fitted to these time constants, with respect to the possible appearance of the RC, RQ circuits and Gerischer elements.
Moreover, R and L 0 elements were added to compensate for the ohmic resistance of the cell parasitic inductance of the wires [39]. Preliminary results demonstrated that the presence of the Gerischer element could not be confirmed statistically.
In general, polarization of the cell can be described using four regular time constants, namely, (3…3.5) × 10−5 s, (5…7) × 10−4, 0.015…0.025 s, and 1.6…2.6 s, and few constants whose presence in the spectra correlated with the C/H ratio (Figure 4).
While distortion of the low-frequency region prevented clear separation of the anodic and cathodic processes, analysis of the spectra in conjunction with I–V curves made it possible to separate polarization ( R p ) and ohmic ( R ) resistances:
R p = A S R R ,
where A S R is the area-specific resistance, calculated by linear fit from the I–V curve in proximity to the current density, at which EIS was collected:
U ( I ) = U 0 A S R · I ,
where I is the current density, and U 0 is a constant, the result of the continuation of the linear zone of the I–V curve to zero current, which should not be associated with OCV due to the existence of a narrow nonlinear activation region while the cell is polarized with a small current [40]. The use of this procedure mitigated the impacts of parasitic inductance L 0 and the noise in the low-frequency zone for the calculated values of polarization resistance.

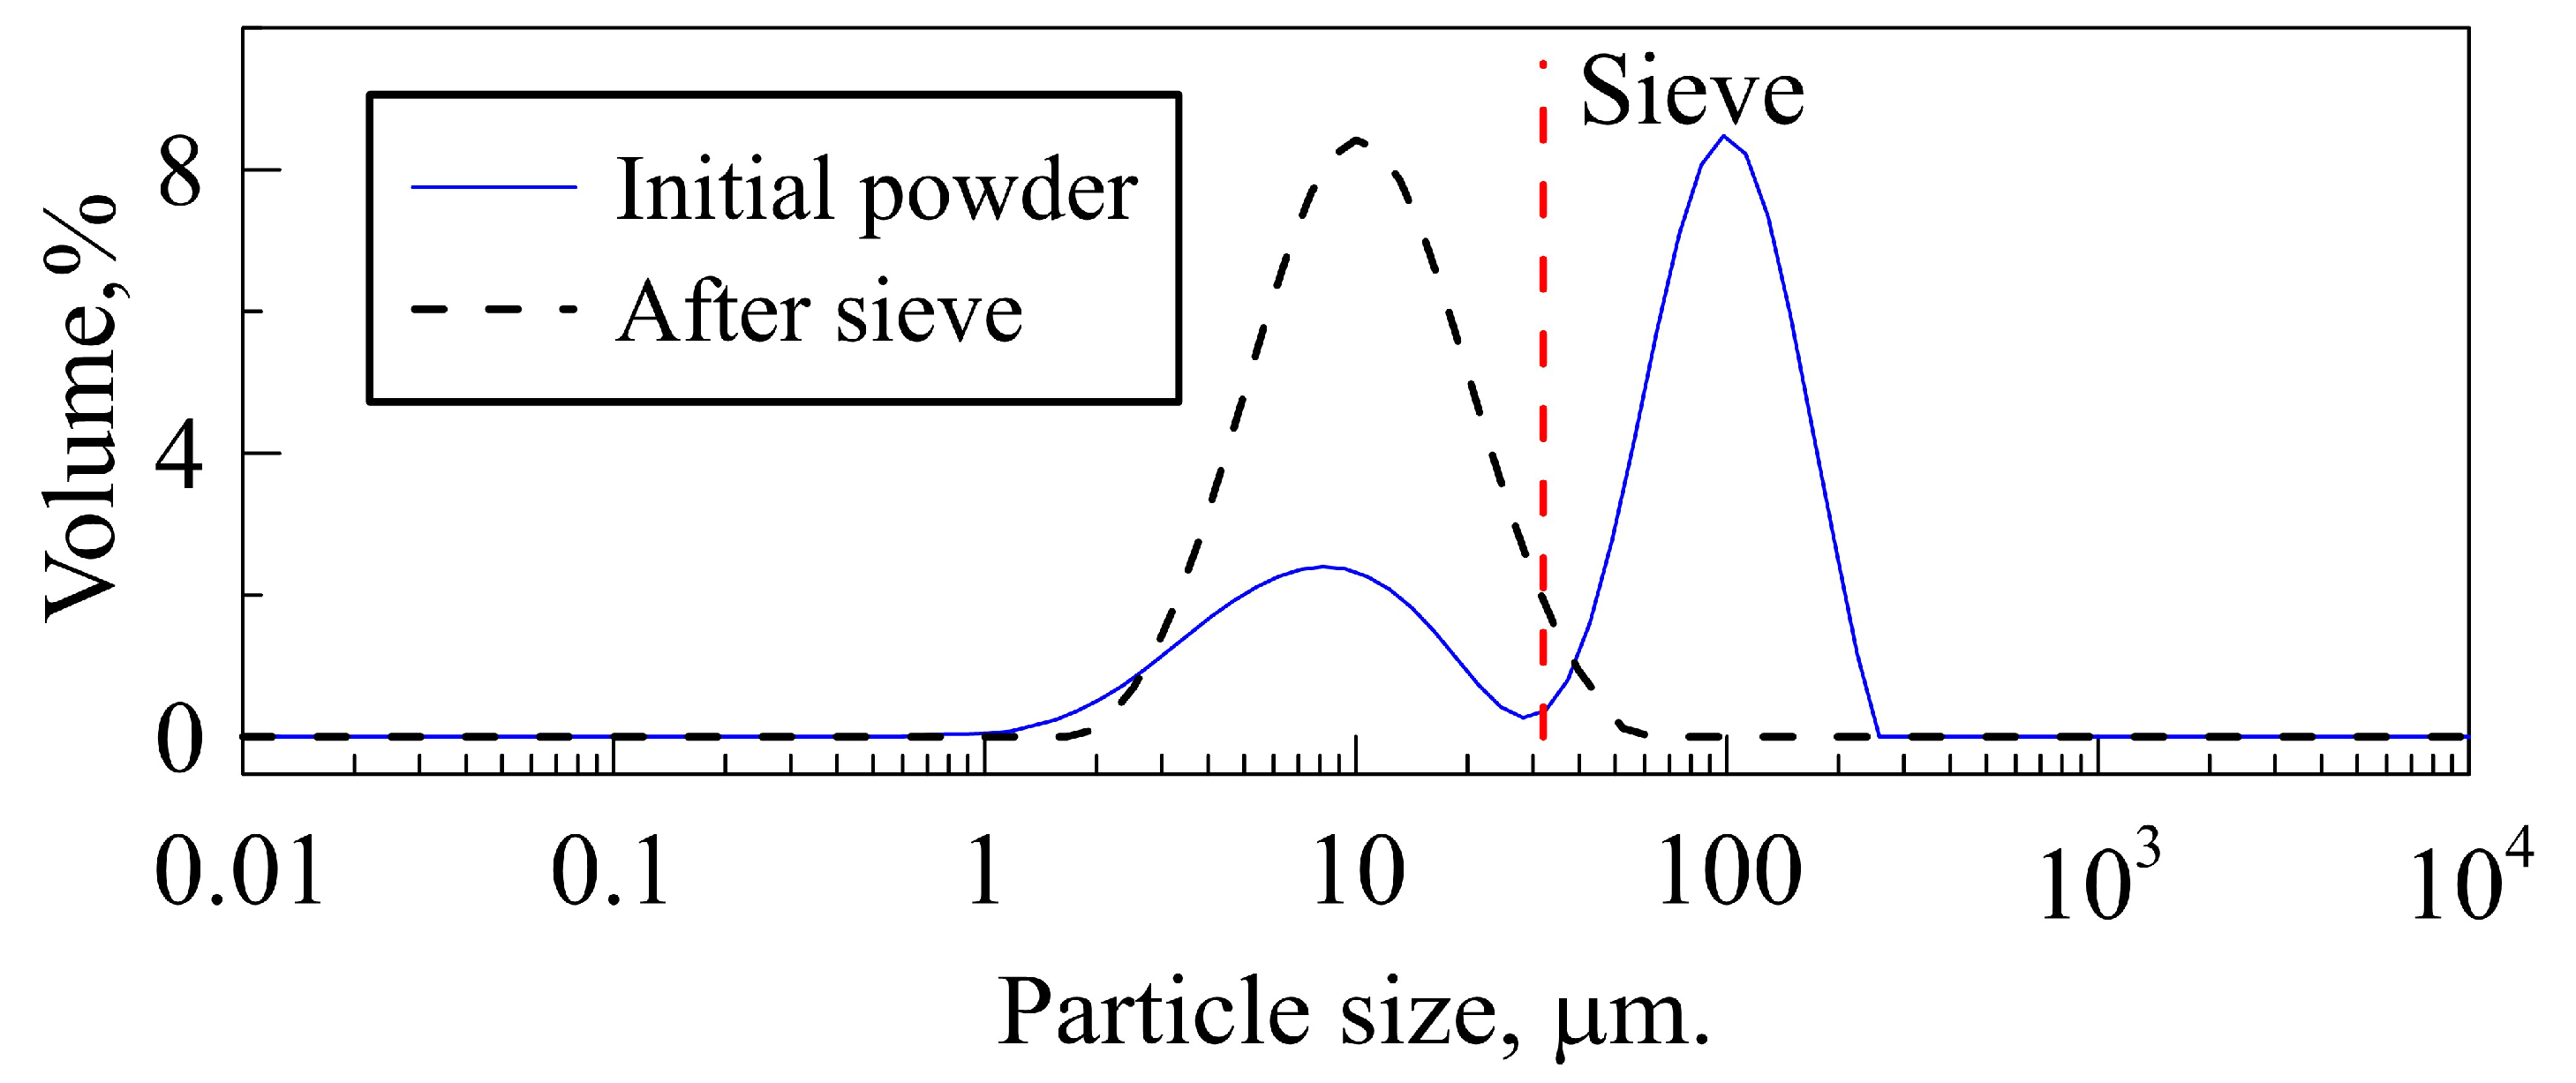
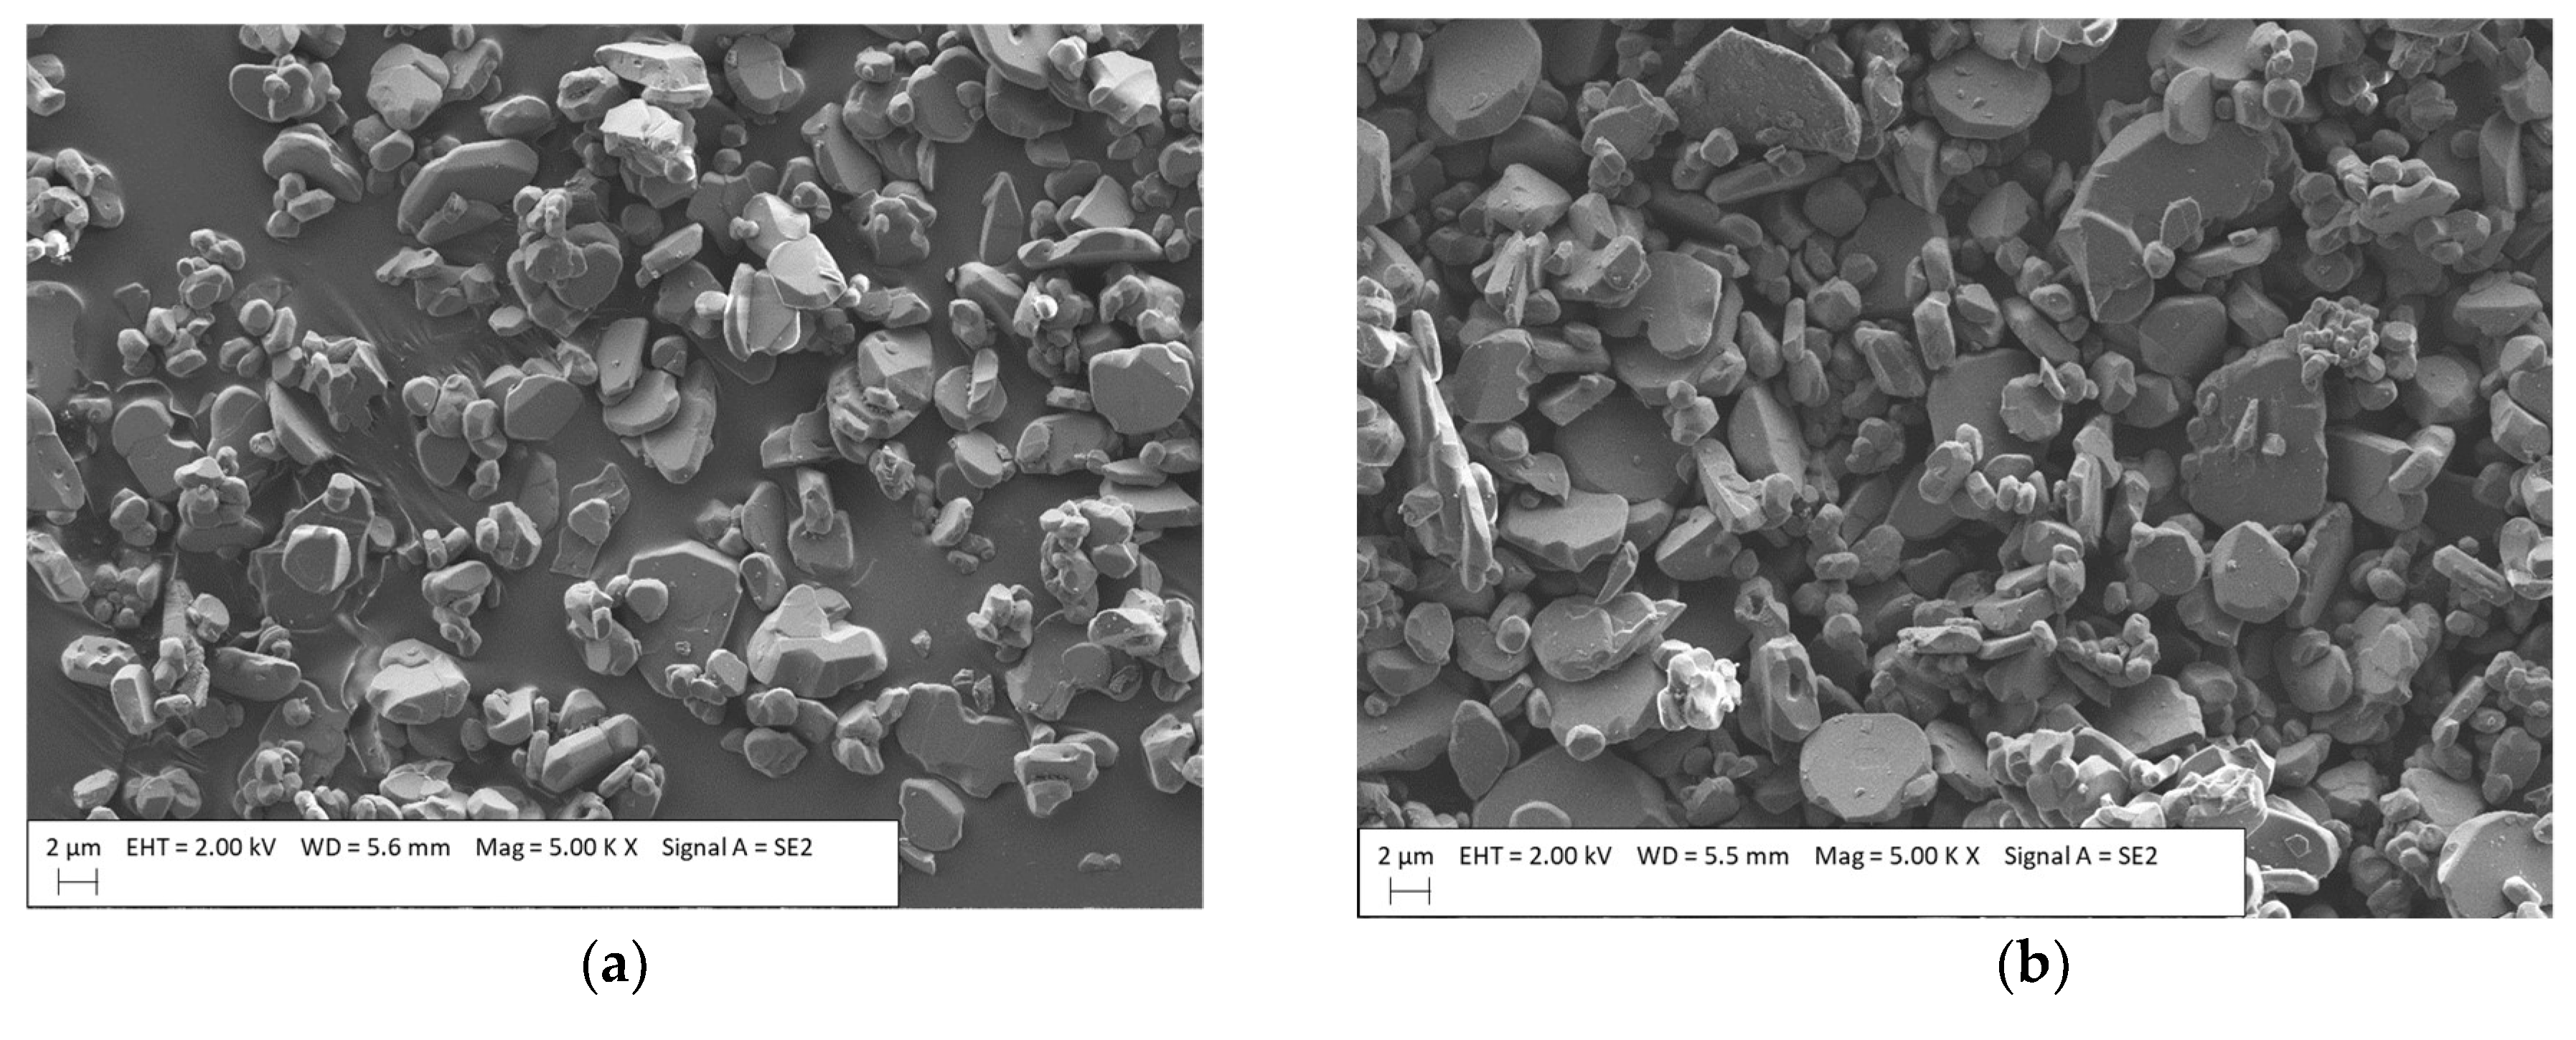
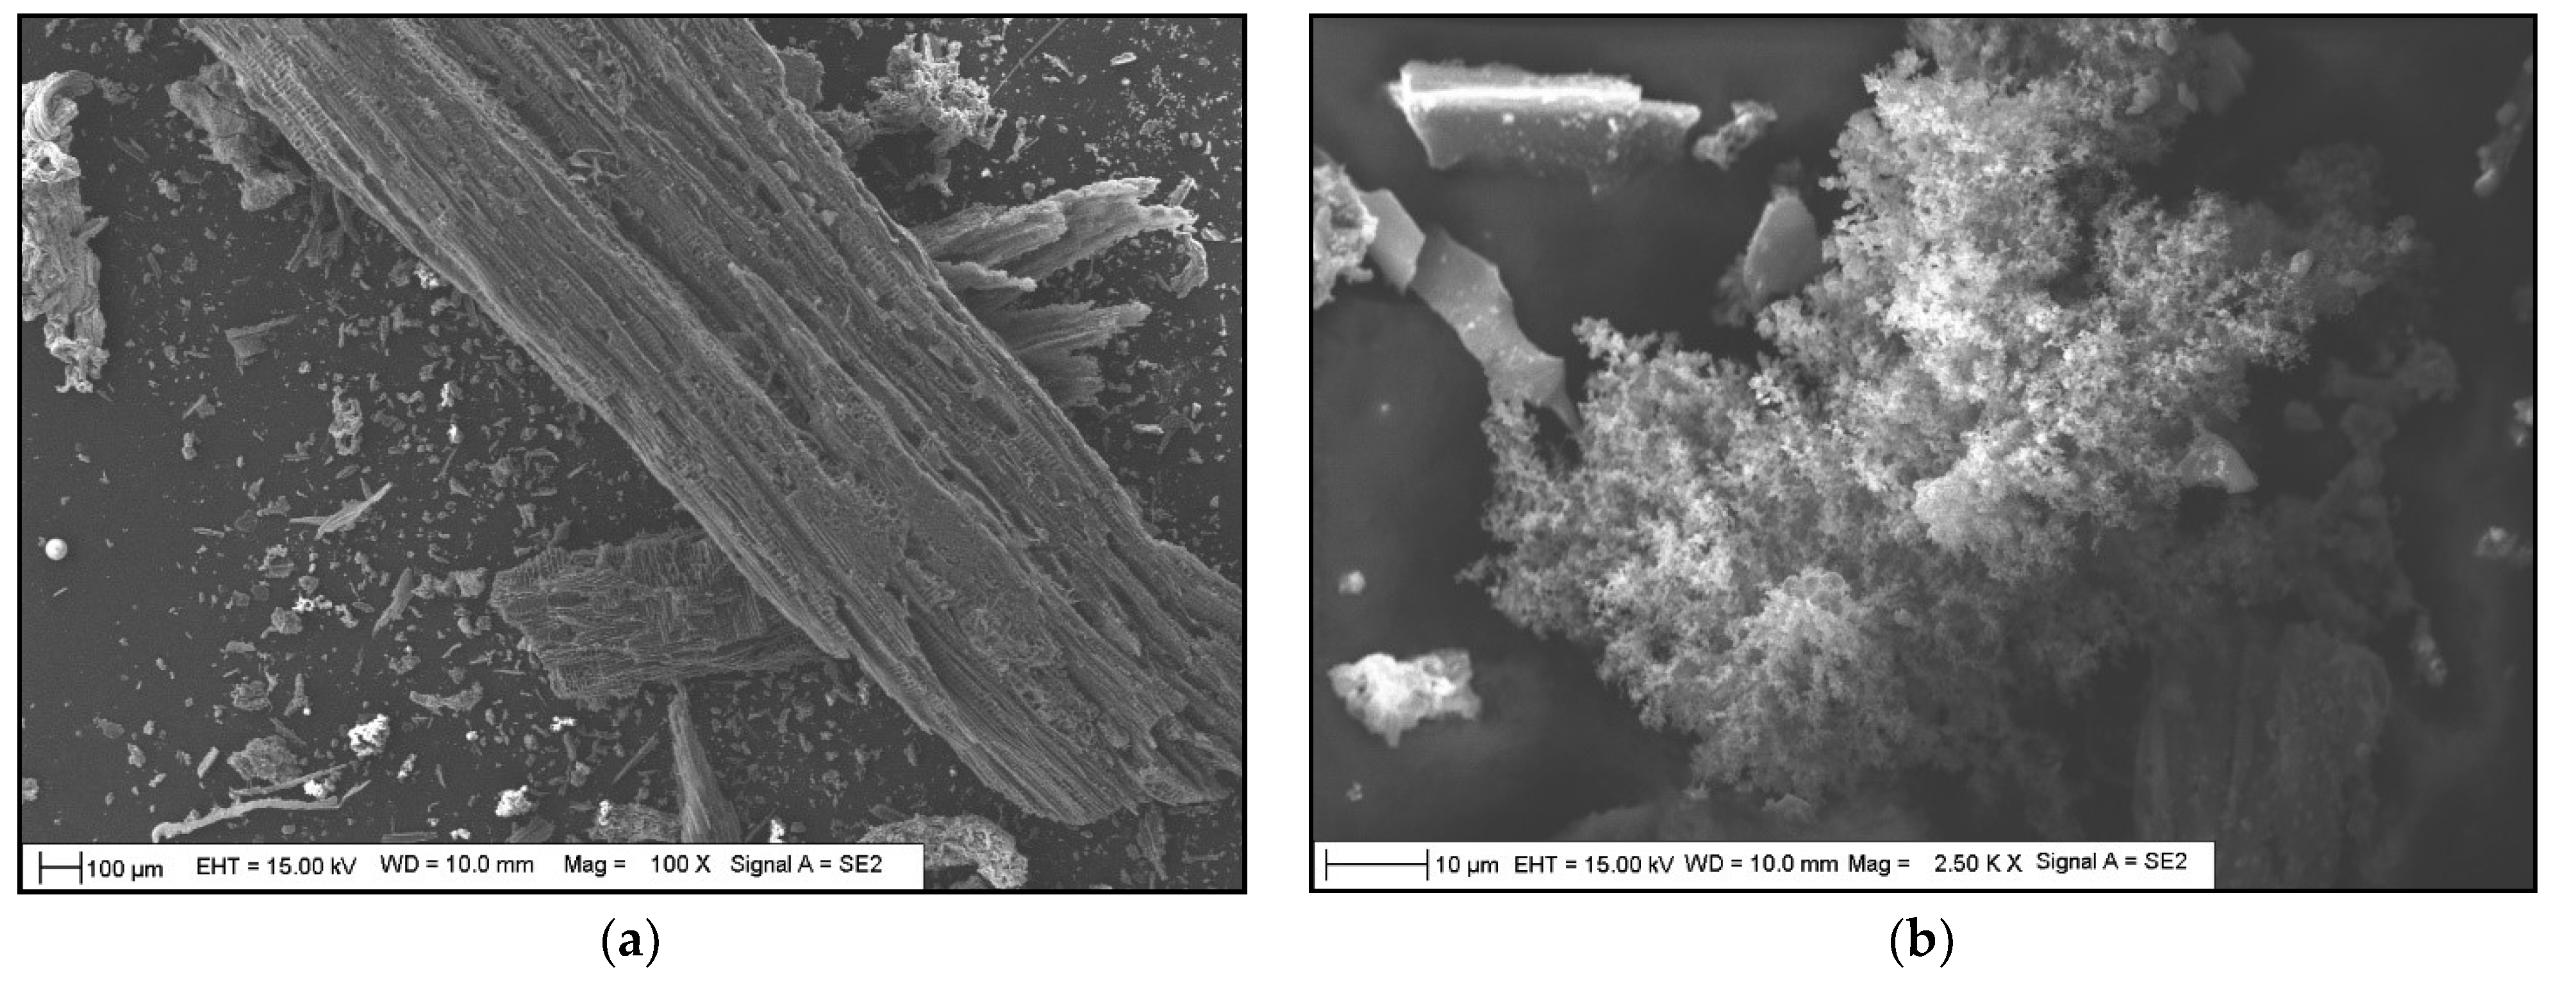
2.3. Preparation and Characterization of Powders

2.3.1. Powder A—Ceramic

An alumina powder HVA (Almatis Gmbh, Ludwigshafen, Germany) was ball milled for 3 h, and a bimodal distribution fine powder was obtained (Figure 5). Then, the powder was sieved on a 32 µm sieve to cut out the right peak in Figure 5. As a result, an inert ceramic powder was prepared with a grain size distribution lying almost completely between 1 and 20 µm.
The powder was dried in a laboratory drier followed by short final grinding in a mortar prior to testing with the aerosol generator.

2.3.2. Powder B—Real Fly Ash

Fly ash at the gasification product gas outlet of the KAJOT gasifier, described elsewhere [41], was collected with a cyclone during standard gasification reactor stable operation. The wood chip feedstock and experiment details are published in [42]. The black fly ash, indicating high carbon content, was analyzed using a LECO AC 500 automatic calorimeter, LECO TruSpec automatic elemental analyzer and a muffle furnace according to standards PN-81/G-04513, PN-80/G-04511 and PN-80/G-04512. The results of the ultimate and proximate analysis are presented in Table 1.
To eliminate agglomerates and increase its ability to form aerosols, the powder was ground for 2 h in a Pulverisette 6 planetary ball mill (Fritsch, Idar-Oberstein, Germany). A 30 mL sample was mixed with 40 mL of ethyl alcohol and 250 zirconium oxide milling balls (5 mm diameter). Later, the sample was separated from the grinding balls and dried in a laboratory drier for 2 h in air at 105 °C. Thereafter, the powder was further ground in a pestle and mortar until a fine powder was obtained with no visible agglomerates. This preparation procedure enabled problem-free aerosol generation.

2.4. Detailed Procedure of SOFC Experimental Campaign

The experimental campaign was divided into three experiments:
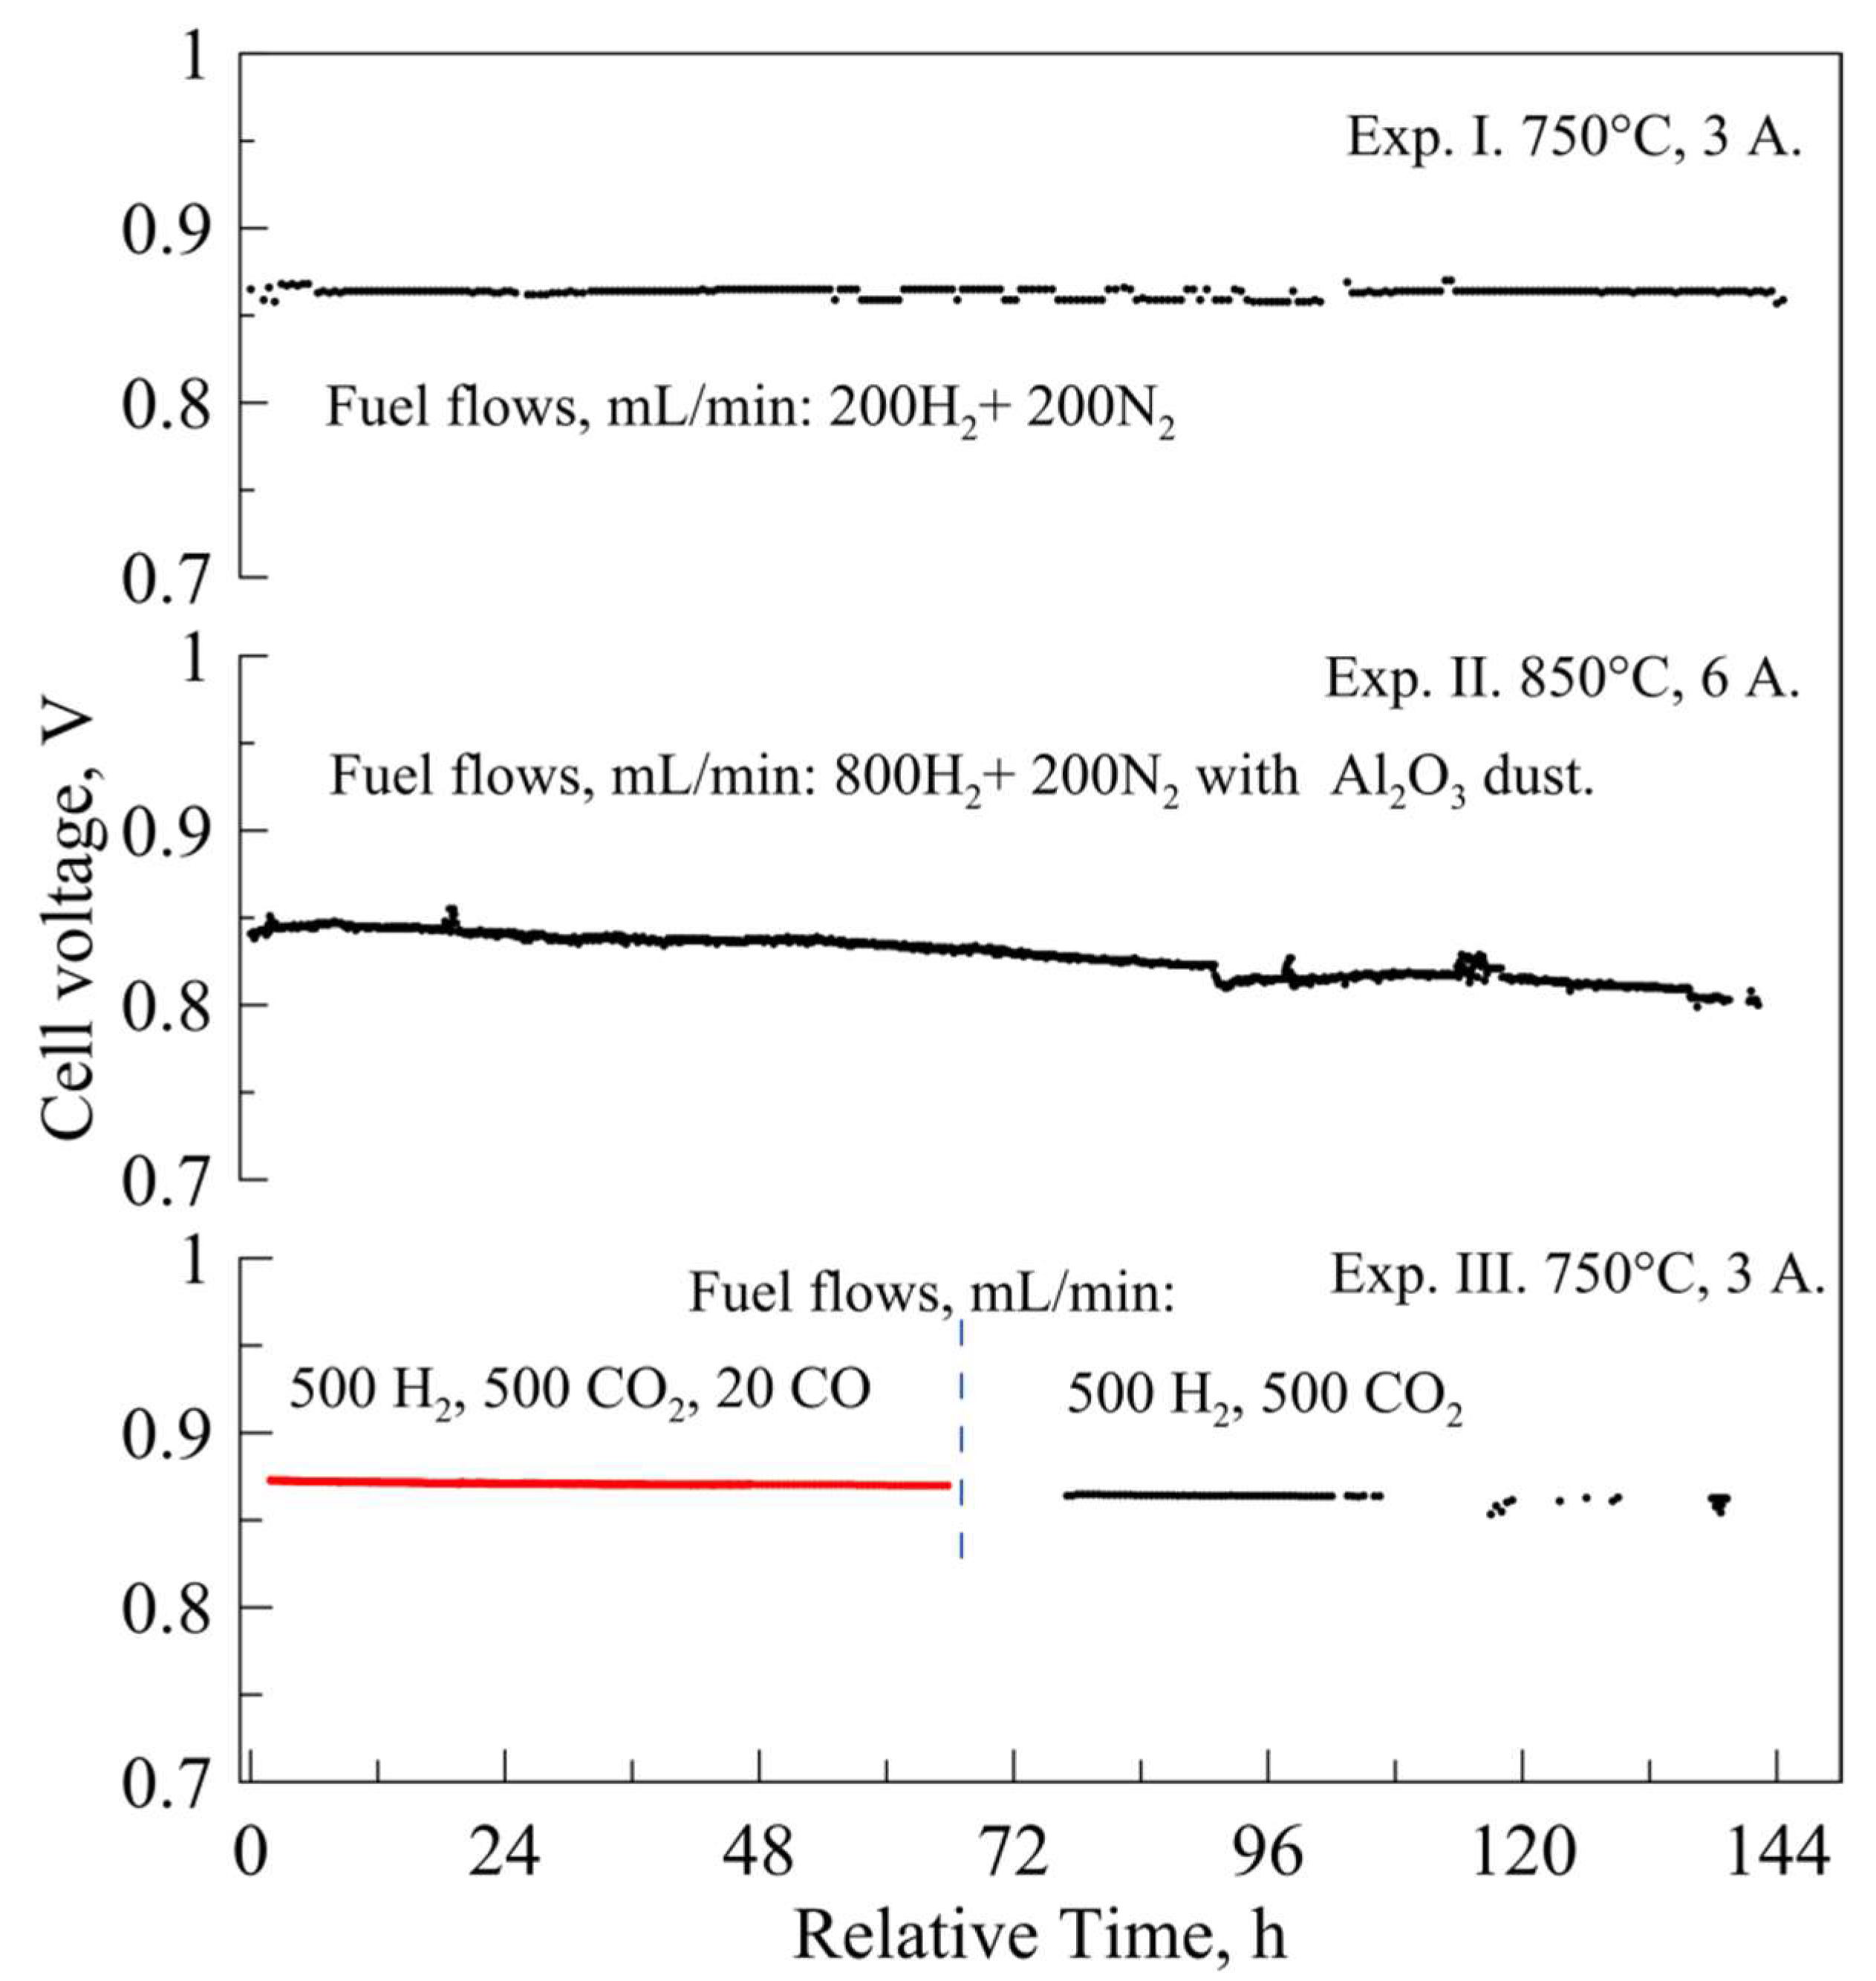
  • Experiment I: Verification of the test setup operability and stability with hydrogen fuel.
  • Experiment II: Investigation of aerosol generation with inert powder and impact of inert particles on the performance of the SOFC.
  • Experiment III: Studies with fly ash powder, originating from gasification of the wood chips, on the performance of the SOFC.
In every experiment, a new cell, as described in Section 2.1, was placed in an identical sample holder and heated up (heat-up ramp 50 °C/h, anode flow 200 Nml/min N2, cathode flow 500 Nml/min of air). For each test, a new anodic Crofer 22 APU current collector was used. The cathode contact surface (reusable cathode housing) was prepared identically each time, by applying gold ink (Fuelcellmaterials, USA) on a pre-oxidated housing surface. The cell was pneumatically compressed with about 25 kg of force during the whole test run. After reaching and holding the sealing temperature (885 °C) for 15 min, the system was cooled down to 850 °C, the anode reduction temperature. Next, cell reduction was realized by introducing hydrogen into the fuel mixture. The H2 flow was increased gradually to 800 Nml/min in four equal 15 min steps. The air flow was increased in parallel to 2000 Nml/min. In the next step, the cell was stabilized at 0.375 A/cm2. The steady-state process was kept untouched for ca. 24 h and followed by I–V measurement and EIS characterization.
Experiment I was devoted to confirming the operability of the setup in an intermediate-term experiment. After stabilization, a preliminary SOFC characterization was performed at temperatures of 850, 800 and 750 °C, after which, the cell was operated at constant current (3 A) for ca. 144 h followed by acquiring I–V curve and EIS spectrum at reference temperature 750 °C and at flows of 200 Nml/min of hydrogen (anodic), 200 Nml/min of nitrogen (anodic) and 2000 Nml/min of air (cathodic).
During Experiment II, after the preliminary characterization described in Section 2.3, the aerosol generator was turned on and stabilized for 2 h, emitting dry aerosol to a water bubbler (nitrogen flow 200 Nml/min through the aerosol generator), and then it was connected to the fuel supply line substituting a clean nitrogen flow. After that, the cell was operated in constant current mode (0.375 A/cm2), using 800 Nml/min H2 + 200 Nml/min N2 gas mixture as fuel, contaminated with 1000 mg/Nm3 alumina micro-powder for 144 h.
Experiment III was designed as a sequence of measurements, aimed at investigating the operability of the SOFC with a fly ash-contaminated fuel gas. Similar to Experiment II, preliminary characterization was carried out at various temperatures (850, 800, 750 and 700 °C). After that, the cell was subjected to constant current (3 A) for 120 h at 750 °C, followed by I–V and EIS scans to investigate setup stability during this crucial experiment. Next, the influence of fuel composition on SOFC electrochemical behavior was studied. Changes in fuel compositions sought to simulate the expected Boudouard reaction, which might occur at elevated temperatures according to Equation (1). Multiple gas compositions involving hydrogen, CO2 and CO were fed to the cell (see Table 2).
After the initial characterization described above, the cell was operated with fly ash-contaminated fuel. For the experiment, fuel gas flows were set to 200 Nml/min H2 + 800 Nml/min CO2. Part of the CO2 flow (100 Nml/min nominally, 200 and 300 Nml/min for short-term sensitivity tests) was fed through the aerosol generator, carrying the fly ash to the anode compartment of the cell. The rest of the CO2 gas was added to keep the total CO2 flow constant at 800 Nml/min. The flow of 100 Nml/min CO2 through the aerosol generator was sufficient to obtain a stable concentration of fly ash in the fuel entering the cell holder of 5500 mg/Nm3. The tuning of this parameter and the powder preparation path were robust tasks performed before the experimental campaign with the SOFC. The aerosol generator demonstrated good stability of dust concentration at the outlet during 72 h of validation carried out prior to the tests with the SOFC. During Experiment III, aerosol feeding was maintained for 43 h. At the end of the experiment, reference measurements (I–V, EIS) were repeated for selected gas compositions.

3. Results and Discussion

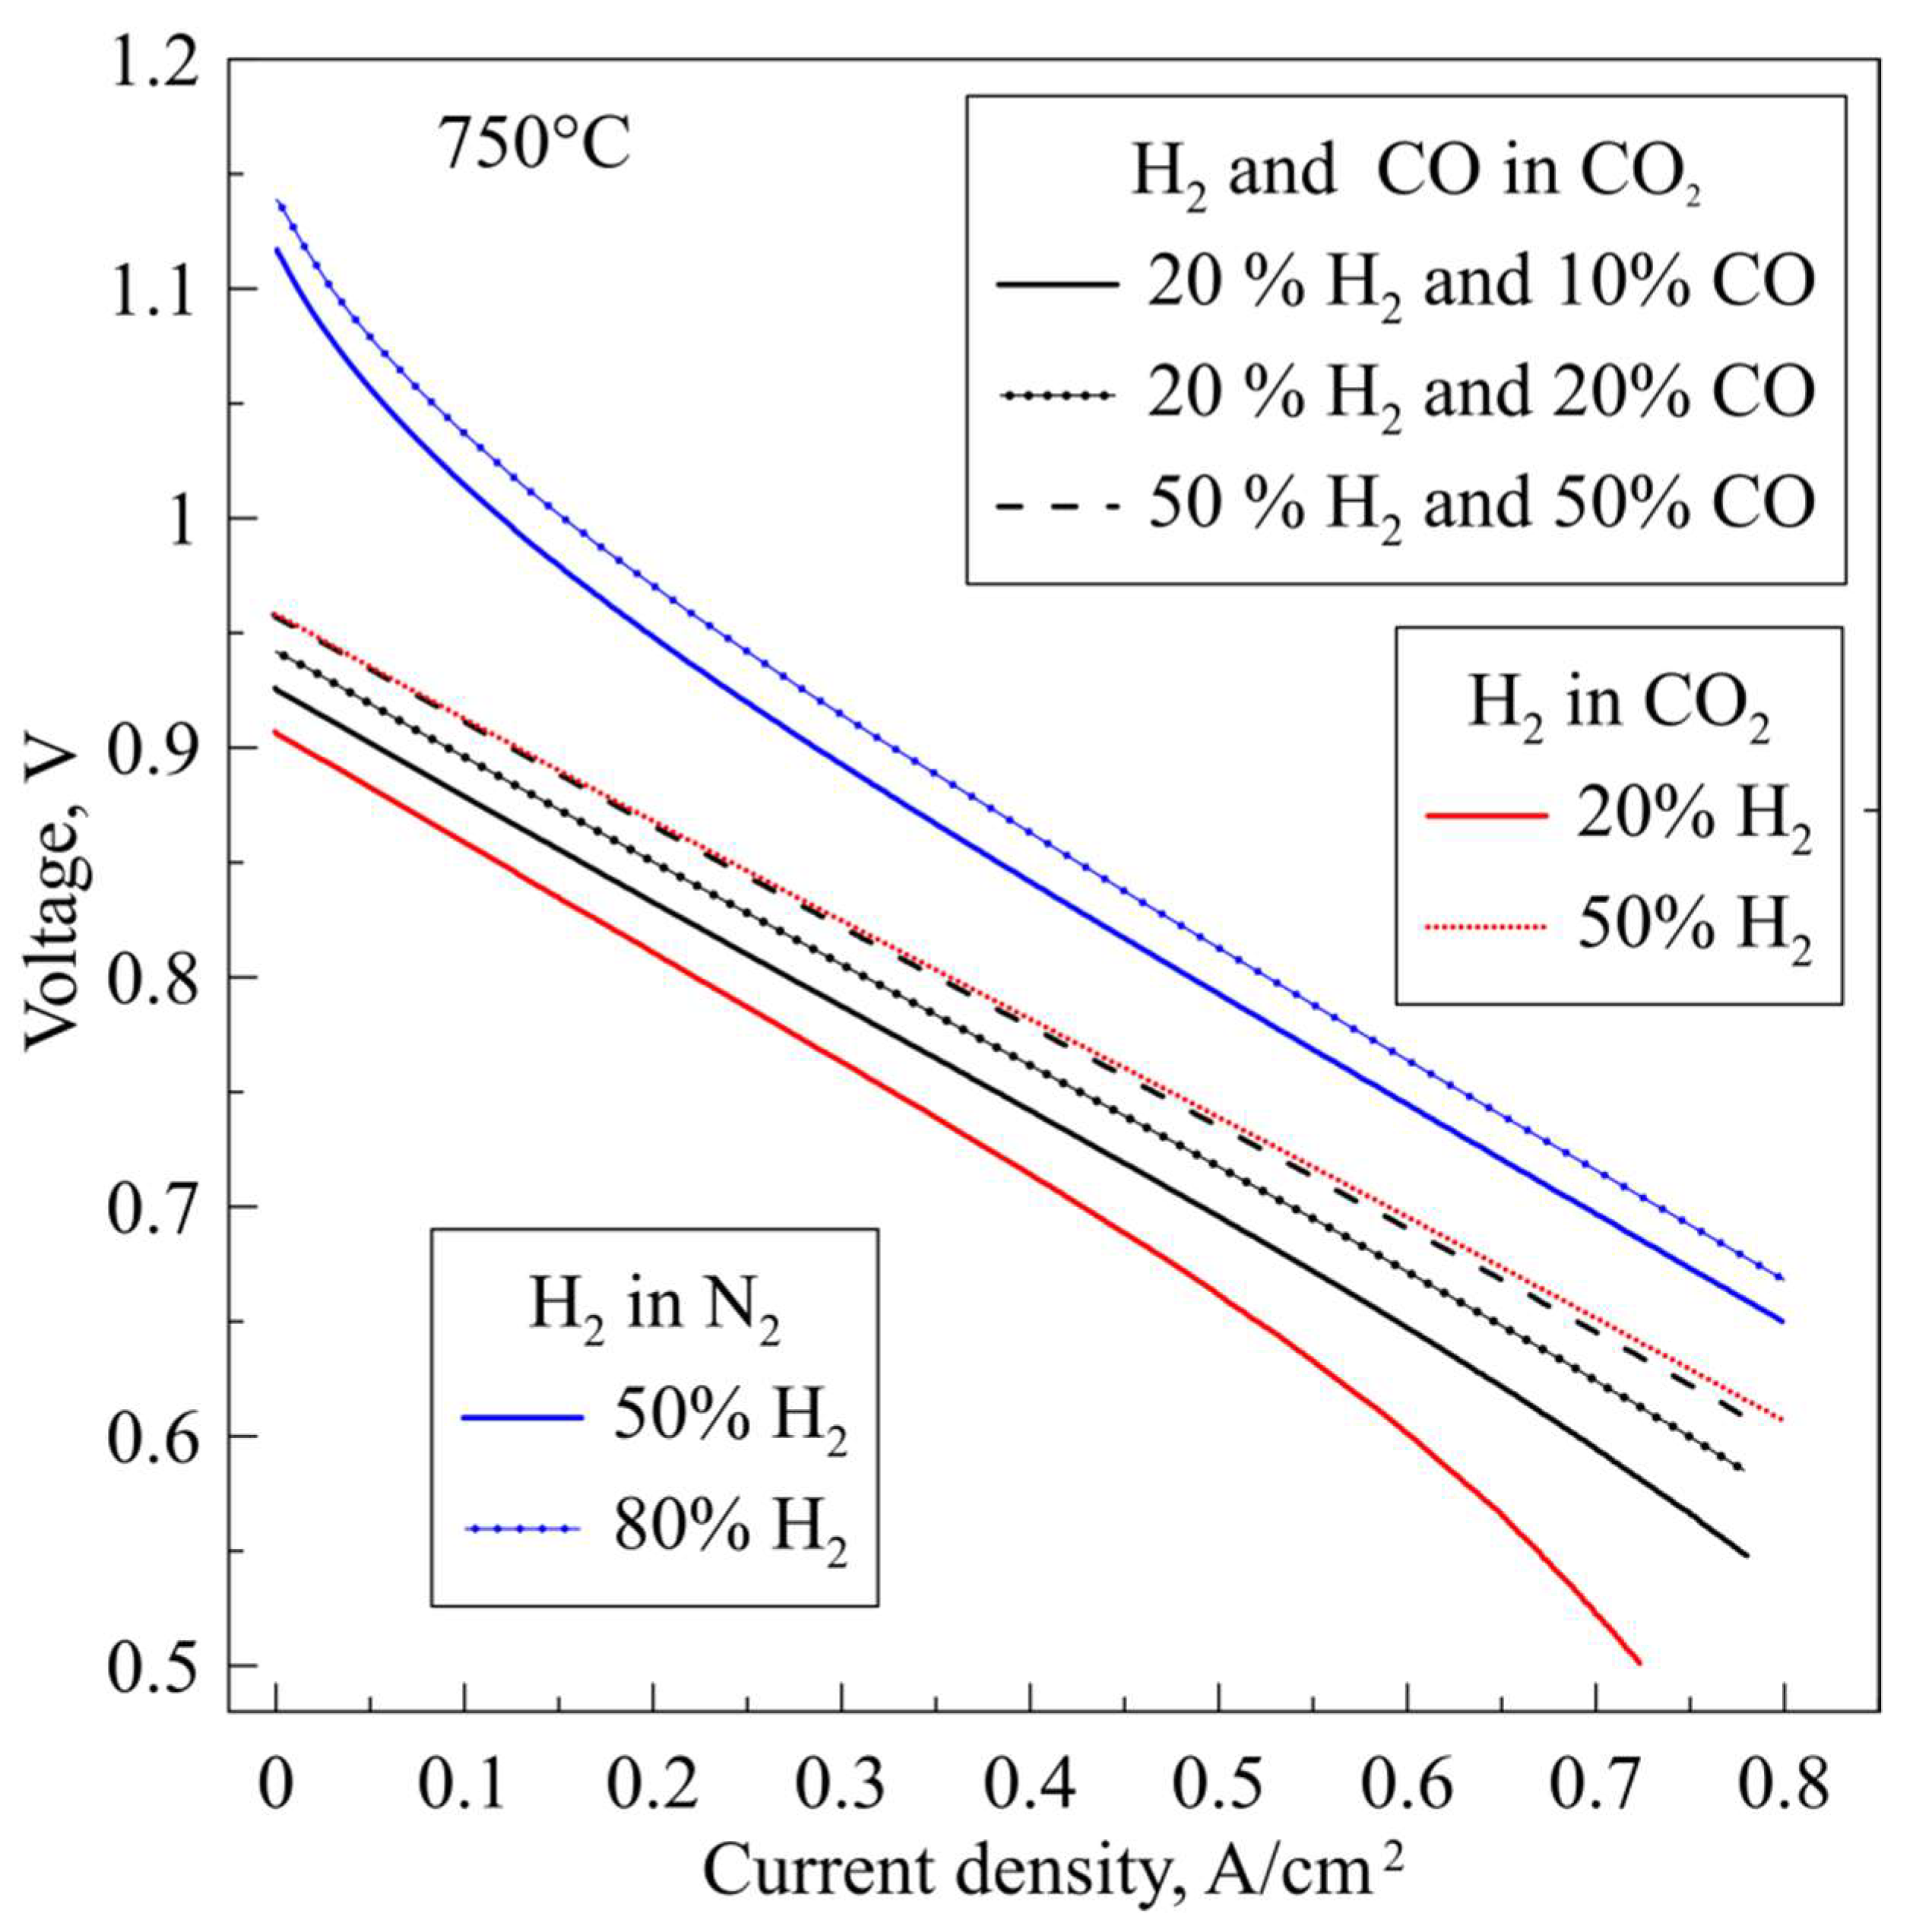
3.1. Reference Measurements (H2+N2) and Temperature Influence

The set of reference measurement parameters performed for all experiments is provided in Table 3.
The impact of fuel composition was studied in the course of Experiment III. As might be expected, H2-based fuels supported much higher cell voltages than H2-CO2 and H2-CO2-CO mixtures (Figure 5). Nevertheless, the slope (and therefore cell ASR) of the I–V curves for fuel mixtures containing carbon oxides was smaller than that for H2-N2 fuels. Moreover, a significant difference was observed after nitrogen was substituted by carbon dioxide in the fuel containing 50% H2. This can be assigned to achieving close to the chemical equilibrium of the (R)WGS reaction (Equation (4)) in the anodic compartment.
H 2 O + CO = CO 2 + H 2
Due to reaction (7), at a temperature of 750 °C and pressure of 1 atm, a chemical equilibrium state would produce a mixture of H2O (23.3 mol%), CO (23.3 mol%) and CO2 (26.7 mol%) + H2 (26.7 mol%), which is a close composition to the family of black lines presented in Figure 6.

3.2. Setup Stability

The stability of the measurement was considered a crucial parameter for correct realization of the mid-term testing campaign. The evolution of the voltage under load was studied under various conditions (Figure 7). In the first course, it was demonstrated that H2-based fuel did not cause apparent degradation during a one-week-long test (Figure 7, Experiment I). Contamination of the fuel with chemically neutral aerosol (Al2O3) resulted in an observable decrease in cell voltage with some minor irregularities, which might be attributed to the migration of the solid deposits in the housing (Figure 7, Experiment II). The presence of CO2 and CO in the fuel did not result in a noticeable degradation of performance (Figure 7, Experiment III).

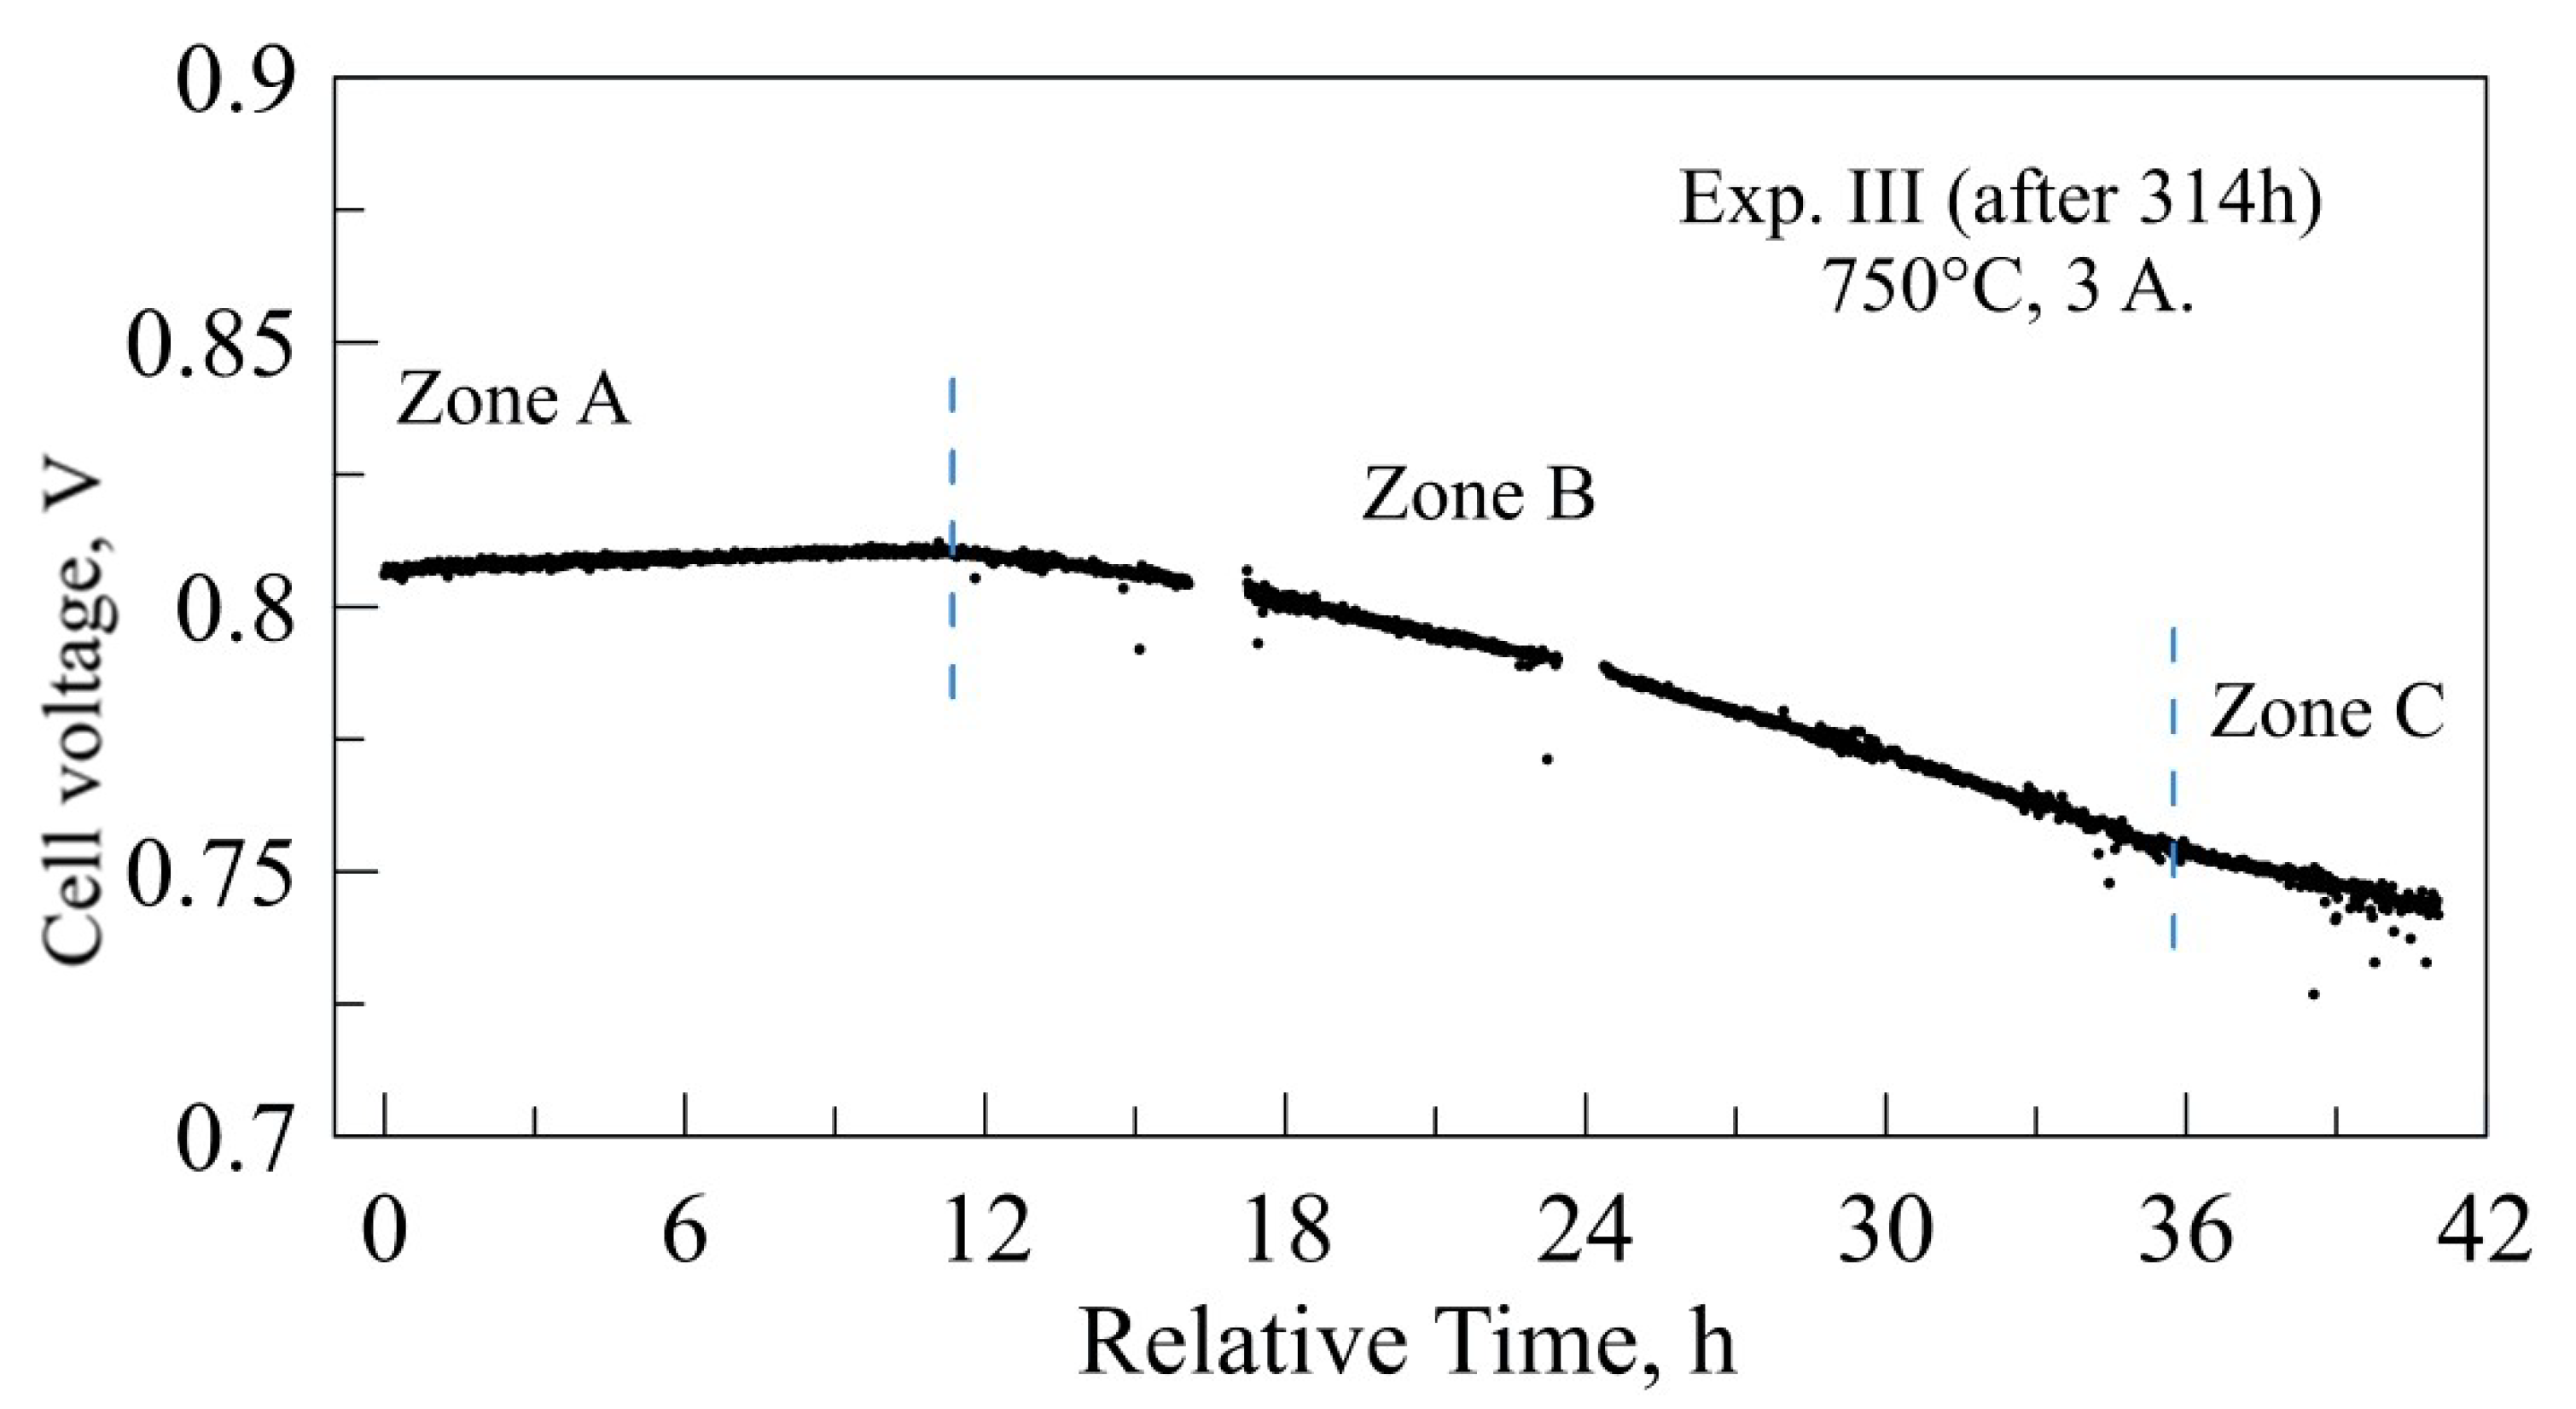
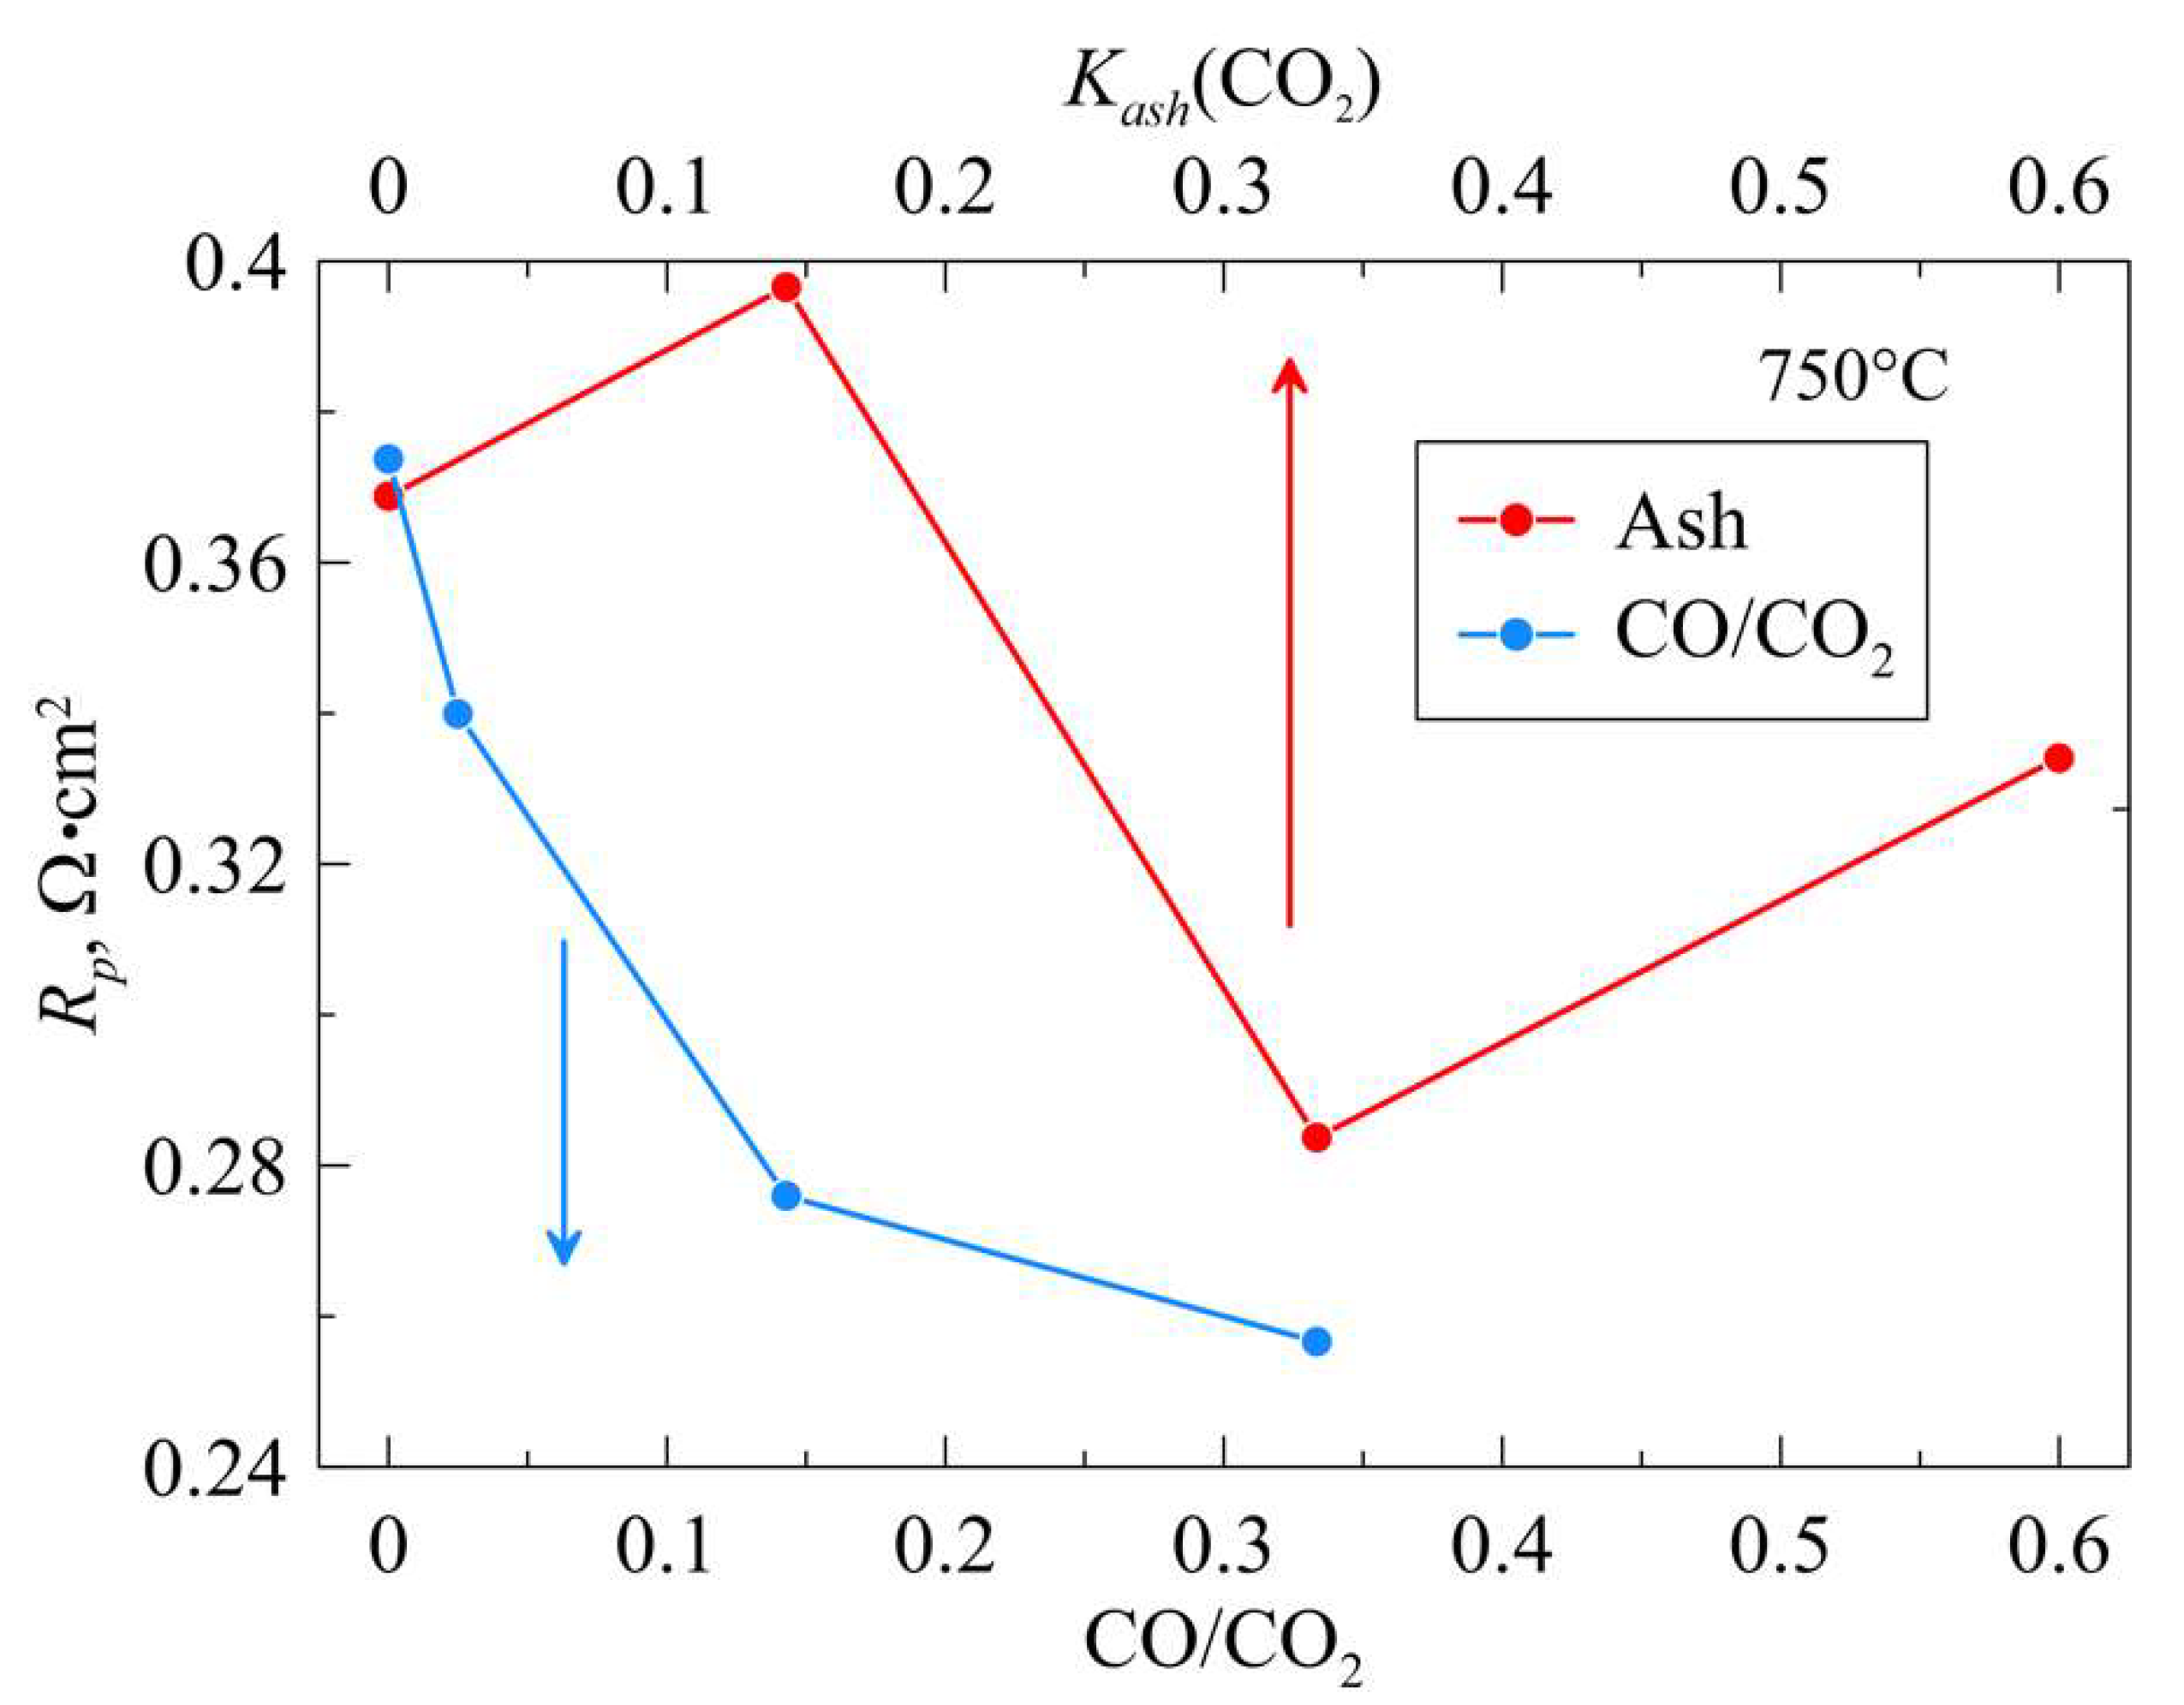
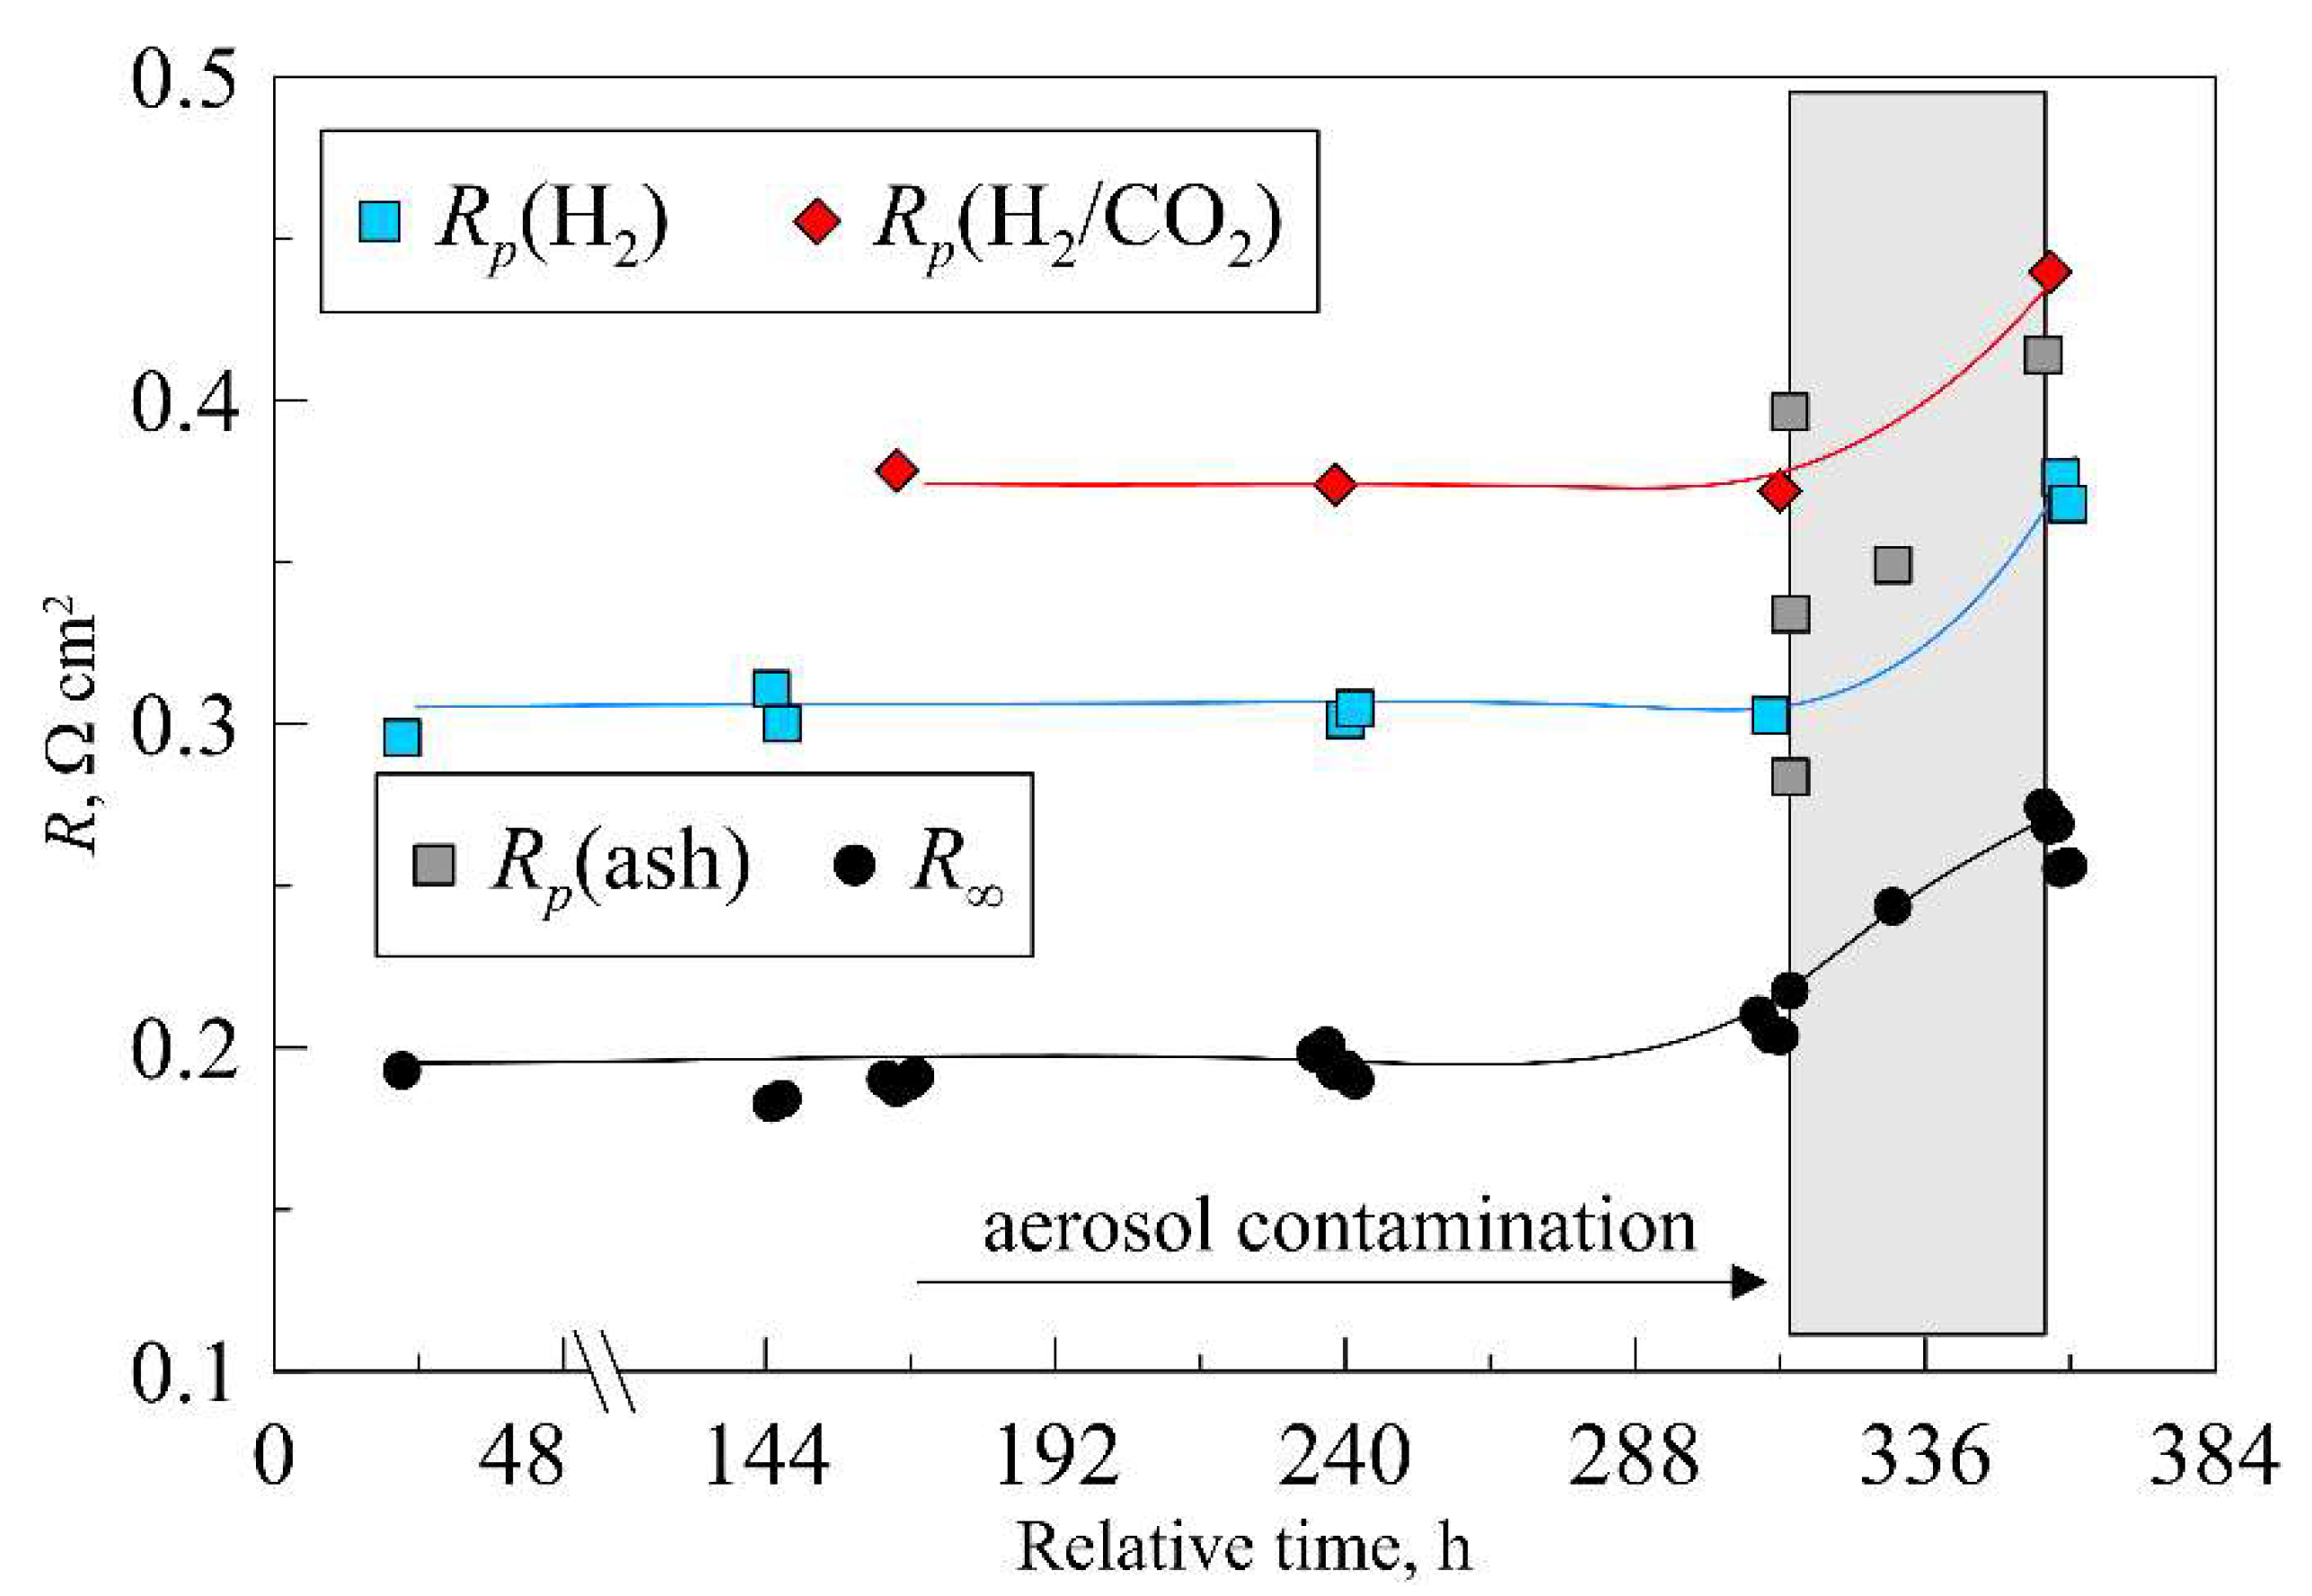
3.3. Operation with Carbon-Containing Powder B (Fly Ash)

The cell was fed with fly ash at 42:57 h after a long characterization course (approx. 300 h of stability and performance tests). The evolution of the voltage is presented in Figure 8. The curve can be clearly separated into three zones: initial increase in voltage (Zone A), intense degradation (Zone B) and damped degradation (Zone C).
The Zone A results might be attributed to the introduction of additional fuel due to the gasification of carbon via the Boudouard reaction (1). For the applied inlet conditions and fuel composition (including solid carbon content), the chemical equilibrium did not contain solid carbon, which means that the present molar flow of carbon of ca. 0.9% of the aerosol molar flow tended to gasify the carbonaceous fly ash. However, full gasification could not be achieved due to kinetics and short residence times: only ca. 150 ms in the cell anode chamber and ca. 2 s in the >700 °C zone of the cell setup. Zone B is likely a result of the blocking of the most sensitive channels for gas diffusion in anode support. Zone C is the result of the continuation, but less intense, of the diffusion blocking. There is no evidence of possible voltage stabilization.
The degradation of the SOFC performance by the contamination with carbon-containing fly ash has a complicated mechanism. A small exposition dose (Zone A in Figure 8 and corresponding points in Figure 9) did not lead to a decrease in cell voltage under current load. Initially, for the small concentration of the fly ash, polarization resistance slightly increased, likely due to the partial blocking of the pores of the anode support (AS). For higher concentrations, this effect was overrun, to some extent, by the Boudouard process, which allowed the support of the anode with additional fuel from carbon in in situ gasification. This additional fuel supply allowed the Rp value to remain relatively low (Figure 9), comparable with values that can be found for H2/CO/CO2 mixtures. However, further exposition to fly ash led to a steady development of the degradation, likely as a result of the depletion of the consumable carbon in the deposits and by further blocking of the AS pores. After depletion of the carbon in the fly ash deposits, such blocking might result in a partial reduction of nickel in the anode. Such a reduction can explain the rise of the R , observed in Figure 10 and Figure 11.
The EIS spectra demonstrate only a moderate change during the initial measurements, even in extended time operation (Figure 10, 165 h vs. 312 h), and rather drastic changes in the low-frequency domain after 43 h of exposure to ash (Figure 10, 314 h vs. 356 h). Moreover, there are evident fluctuations of the EIS measurement recorded during aerosol feeding (Figure 10, gray points), which are associated with the influence of chemically active solid particles on the anode process.
For segregation of the aerosol impact, two cases were selected, namely, H2 as fuel (80 and 50% H2 in N2) and a mixture of H2 and CO2 1:4, which was actually used as the dust carrier medium during application of the aerosol. The results are presented in Figure 11. As one can note, there is negligible degradation of the electrochemical activity during short-term operation, while R rises at a clearly observable but modest rate (approx. 0.04%/h). Exposure to the aerosol resulted in an approx. 25% increase for both polarization (Rp) and ohmic (R) resistances. The scatter of Rp(ash) data at the beginning of the contamination time (Figure 11) is related to the variation in the aerosol concentration in the fuel flow, as discussed earlier.

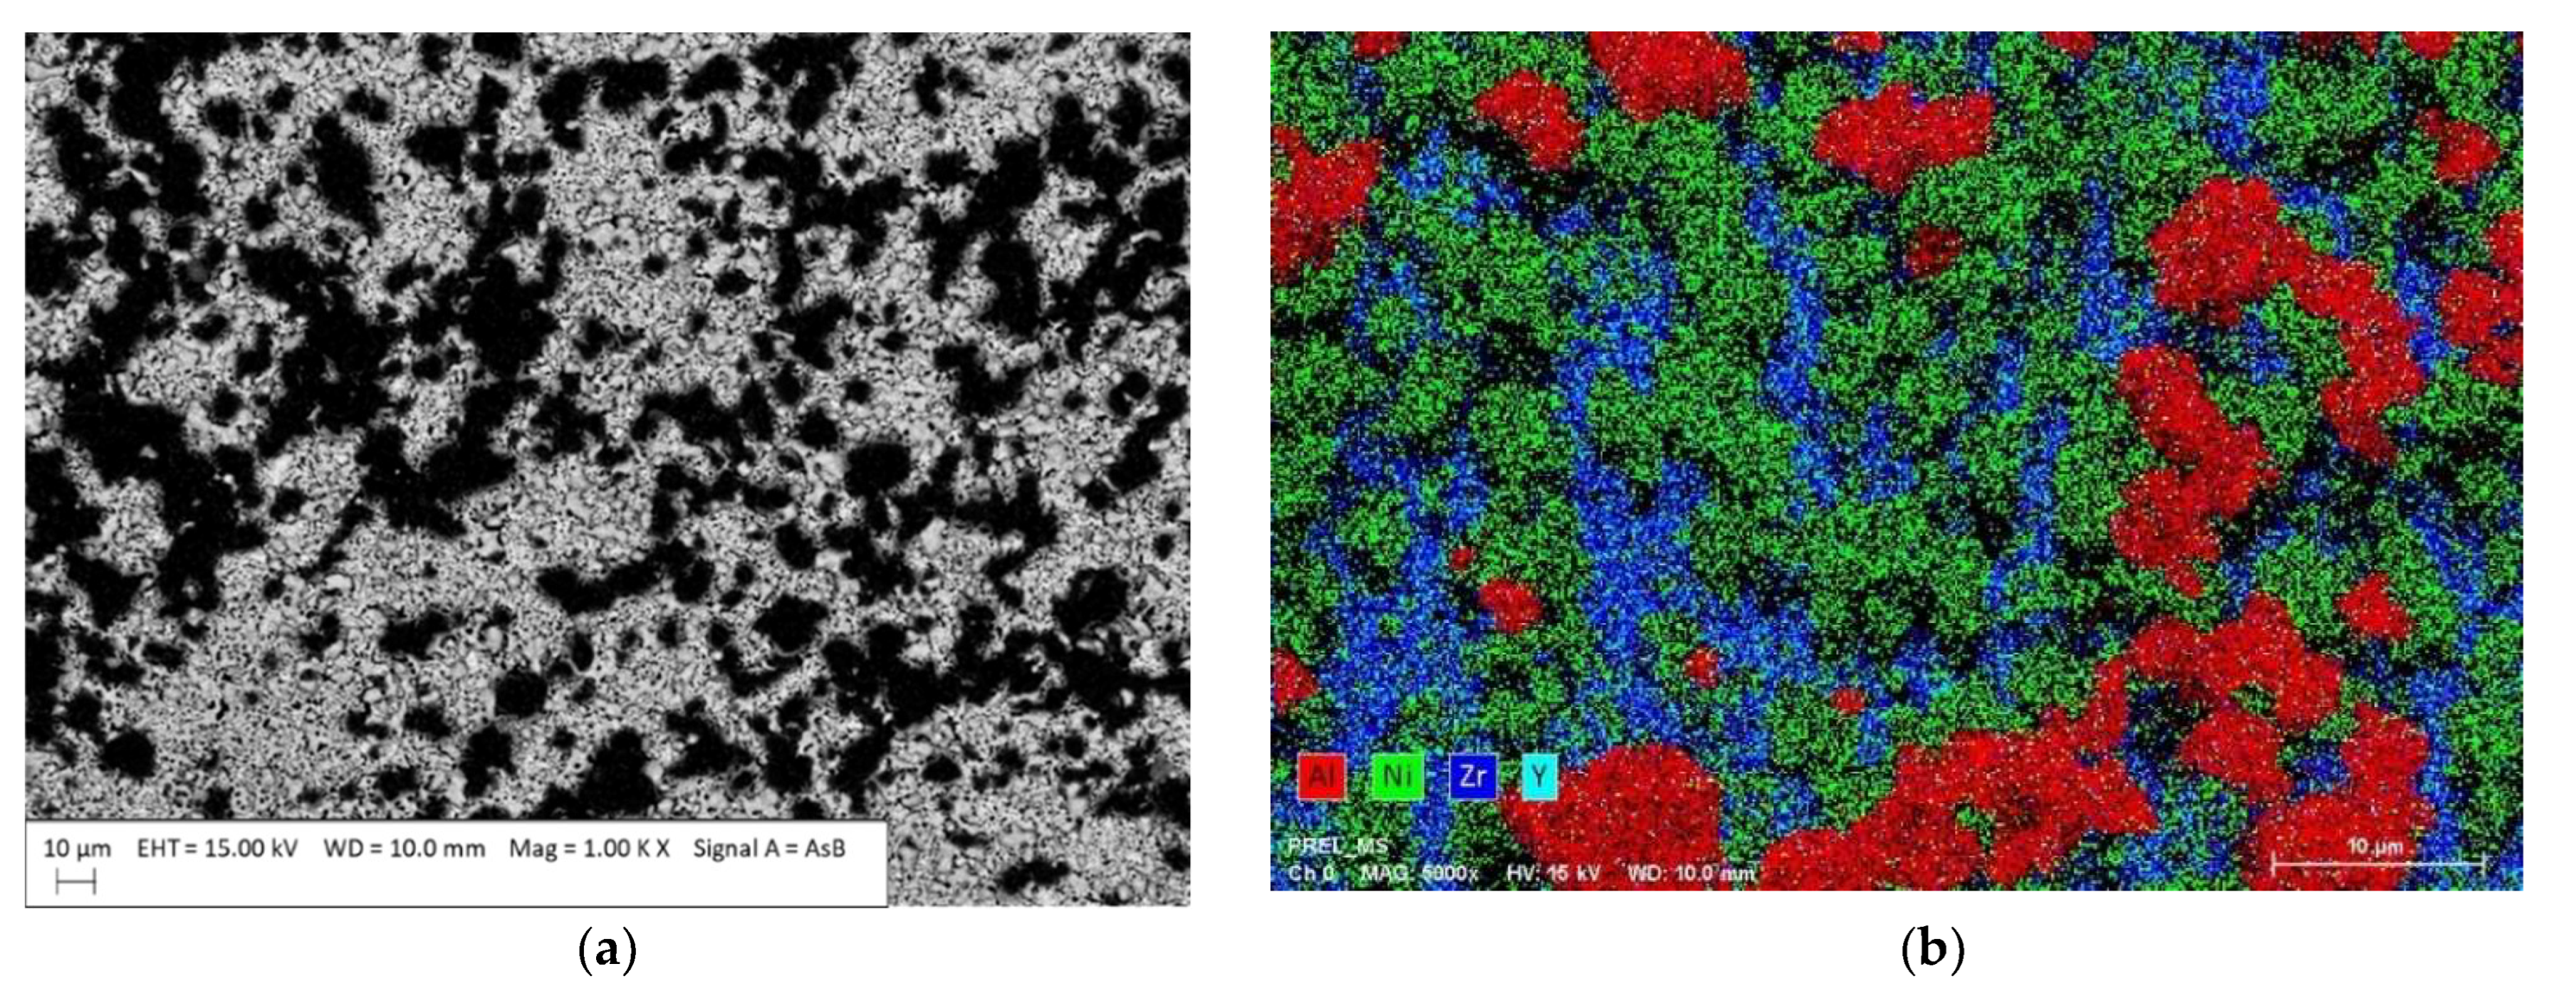
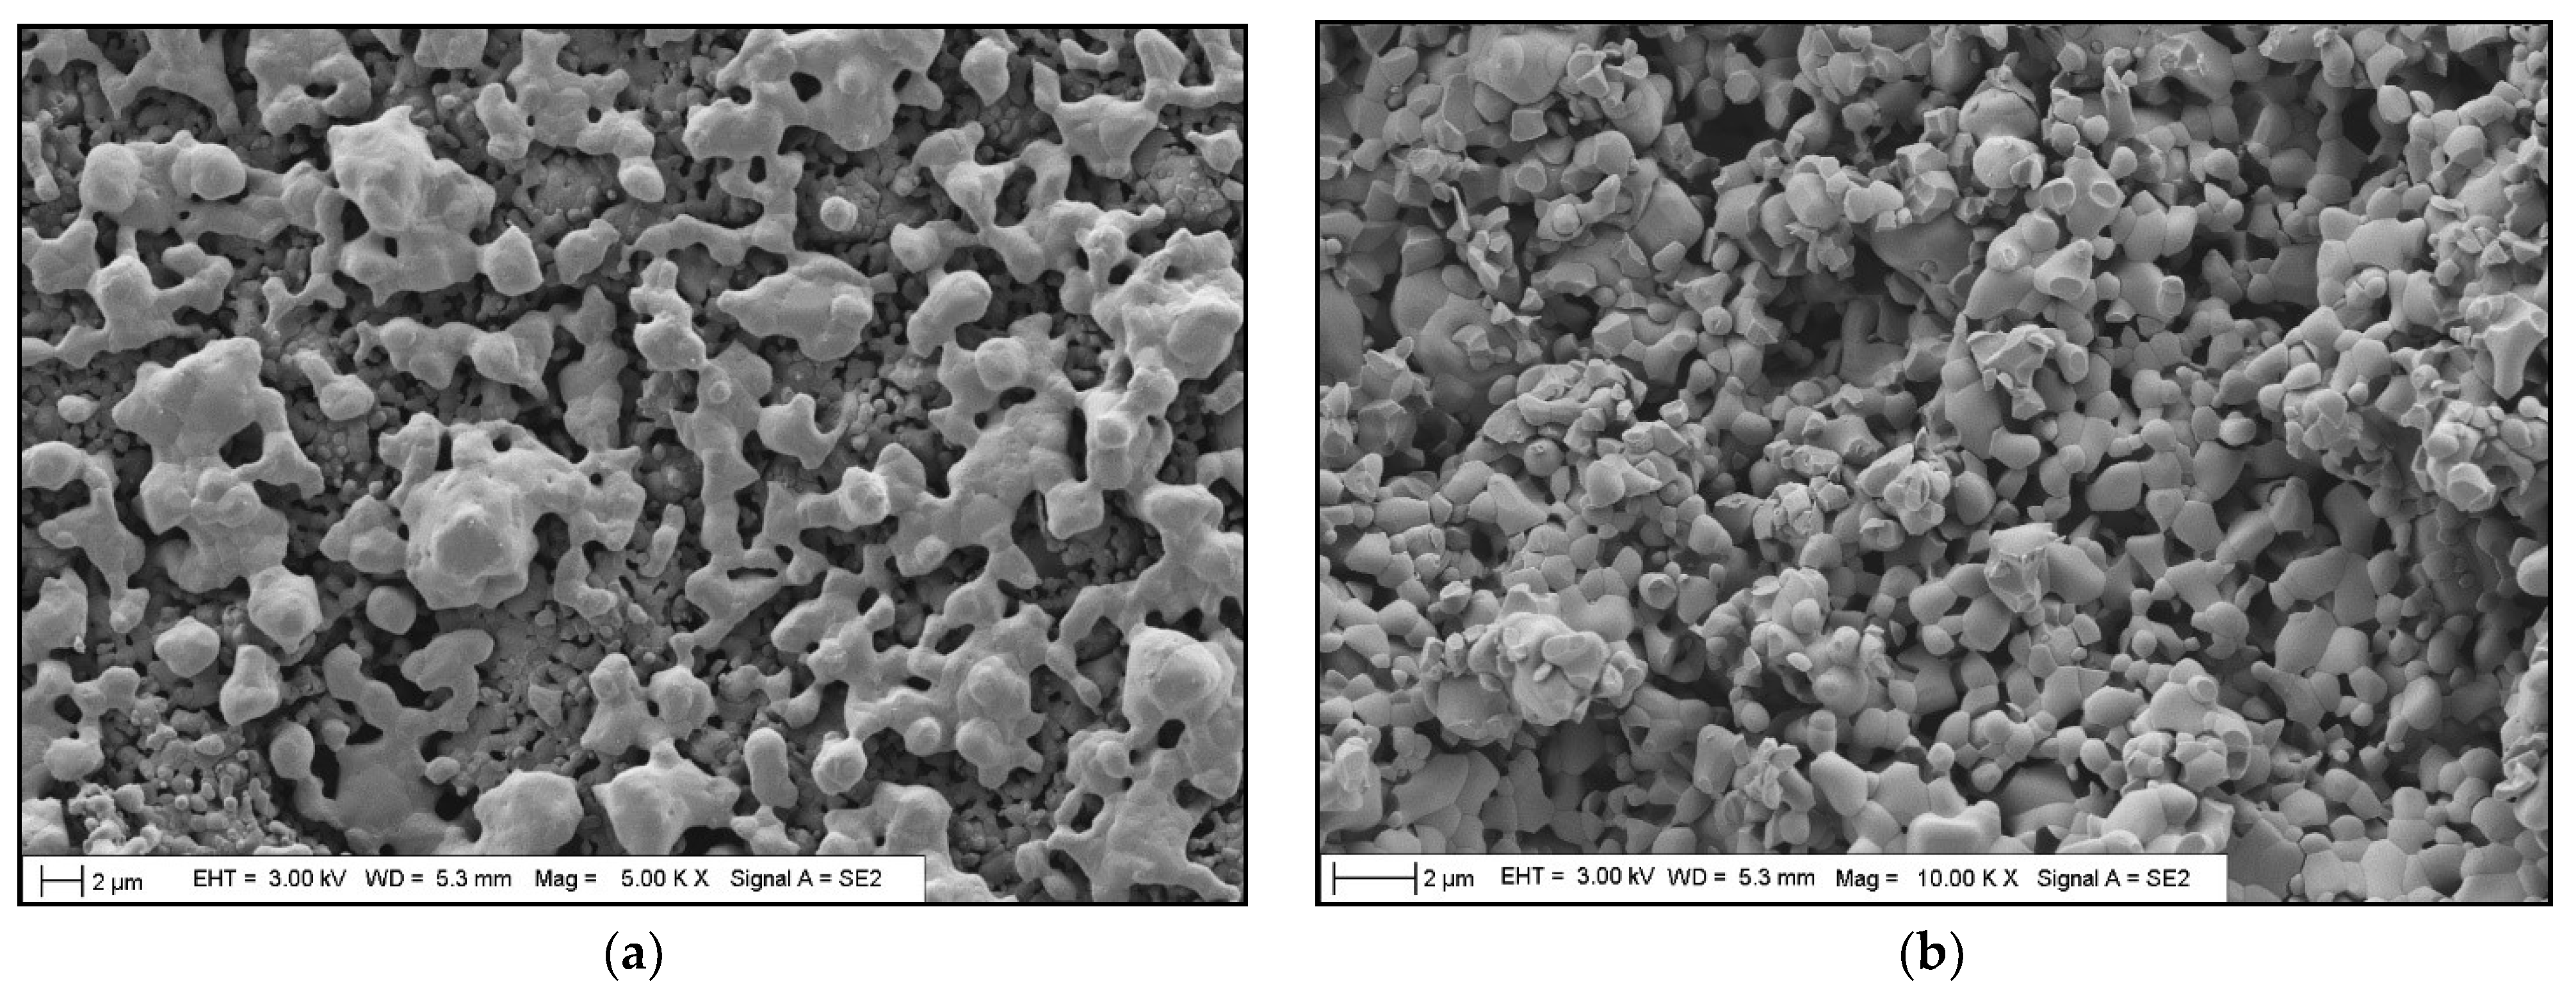
3.4. Post-Mortem Analysis

The post mortem analysis of each experiment was performed with SEM/EDX methods (Zeiss Ultra Pus equipment). Analysis of the cell after Experiment I did not reveal any unusual issues. The anode support was properly reduced and consisted of Ni and YSZ grains, and no deposits were detected on the surface. The only visual outcome of cell operation was dark stripes, originating from the contact layer detaching in the area, where the current collector was pressed against the cell.
After Experiment II, the cell was different from the one above. Firstly, during disassembly of the cell and the holder, the walls of the gas channels were found to be heavily contaminated with white dust, whereas the cross-section of the pipes and channels remained open. It is important to mention that most of the cell area was visibly not contaminated. Only several small white deposits were observed on the anode support surface near the gas outlet. SEM/EDS analysis of those spots confirmed that Al2O3 grains were present on the surface (Figure 12). In these places, a coverage of ca. 30% of the area was detected by graphical analysis of the SEM/EDS map image. A sample of the deposited powder was collected from the anode and analyzed separately (Figure 13a). The grain size of the alumina corresponded to the particle size distribution of the milled HVA powder, which was additionally studied with SEM (Figure 13b). Since the grain size of the alumina powder was within the range of 1–10 µm, their presence was detected only on the small surface area, not deep inside the pores of the anode support. Therefore, the expectation to perform as the inert media follows.
Finally, during the disassembly of the cell and the housing after Experiment III, the walls of the gas channels were found to be heavily contaminated with black dust, but the cross-section of the pipes and channels remained open. No clear black deposits were visible on the anode support surface, which looked quite typical. Precise detection of the presence of carbon on the surface using EDS methods proved problematic, since the cell sample was sputter coated with carbon for the purpose of performing the SEM analysis. In another study carried out by the authors, there was clear evidence of soot deposition, and an SE detector captured micro-deposits of amorphous carbon consisting of nanometric particles all over the anode support [42]. The similar procedure of analysis of the sample undertaken in the present work did not yield similar results. The microstructure of the anode support is shown in Figure 14, including the typical surface of the Ni contact layer over the Ni/YSZ support surface (Figure 14a), and the bare support surface on the spots of contact layer deficiency resulted from the disassembly procedure (Figure 14b). No grains other than Ni and YSZ are visible. However, SEM/EDS analysis of the fly ash used for the experiment revealed the presence of large blocks containing mostly carbon (Figure 15a), as well as amorphous carbon consisting of fine grains (Figure 15b), which is prone to deposit on porous matter. The SEM/EDS analyses also detected deposits of Al2O3 on the anode surface, and it is highly probable that a significant number of pores were clogged with fly ash dust during Experiment III.

4. Conclusions

Three independent experiments involving 5 × 5 cm anode-supported SOFCs were conducted during the experimental study. The cells were fueled with a hydrogen–nitrogen mixture (Experiment I), aerosols of inert power (Experiment II) and carbon-containing fly ash powder originating from the gasification of biomass (Experiment III). The experimental campaign was realized using a test setup equipped with a solid aerosol generator developed in-house. The system was calibrated and verified experimentally, enabling repeatable cell performances. Contamination of the fuel with inert powder resulted in stable cell operation with only a minor decrease in performance, which can be attributed to multiple causes. Contaminating the cell with a chemically active powder (fly ash) produced a clearly observable negative impact, which can be divided into three stages:
  • First 12 h—minor increase in performance, likely due to enrichment of the fuel by the Boudouard process;
  • Intense ~24 h degradation;
  • Visible decrease in the degradation rate without any observable stabilization of performance during further short-term observation.
The general impact of 43 h of exposure of the anode to fly ash can be viewed as a 25% irreversible rise in cell ASR, both in ohmic and polarization resistances. A post-mortem analysis revealed the presence of a small amount of both types of powder on the anodes’ surfaces. The decrease in performance can be assigned to the blocking of pores in the anode support and to a plausible but undetected reaction of ash components with the anode, resulting in its deactivation. The results confirm and underline the need to thoroughly remove solid aerosol impurities from SOFC fuels.

Author Contributions

Conceptualization, M.S., M.W. and S.J.; methodology, M.S.; software, Y.N.; validation, M.S.; formal analysis, Y.N. and M.S.; investigation, S.J., M.W. and M.S.; resources, M.K.; data curation, Y.N., M.S. and A.Z.; writing—original draft preparation, M.S., Y.N. and A.Z.; writing—review and editing, K.M.; visualization, Y.N. and M.S.; supervision, J.K.; project administration, M.S.; funding acquisition, M.S., Y.N. and J.K. All authors have read and agreed to the published version of the manuscript.

Funding

This research was funded by NCN (National Science Centre, Poland), grant number Preludium 2016/21/N/ST8/02349, and National Centre for Research and Development, Poland, under ERA-NET Bioenergy 11th program, grant number BIOENERGY-11/BIO-CCHP/2018. Publication was supported by the Ministry of Science and Higher Education, Poland through the statutory grant in the Institute of Power Engineering.

Institutional Review Board Statement

Not applicable.

Informed Consent Statement

Not applicable.

Data Availability Statement

Data are contained within the article.

Acknowledgments

The authors acknowledge the support of Ryszard Kluczowski and Marek Grabowy (CEREL department of Institute of Power Engineering) for providing SOFCs and alumina powder samples and Konrad Zurawski (KWZ Ink) for support in the design of the aerosol generator.

Conflicts of Interest

The authors declare no conflict of interest. The funders had no role in the design of the study; in the collection, analyses, or interpretation of data; in the writing of the manuscript; or in the decision to publish the results.

References

  1. Din, Z.U.; Zainal, Z.A. Biomass integrated gasification-SOFC systems: Technology overview. Renew. Sustain. Energy Rev. 2016, 53, 1356–1376. [Google Scholar] [CrossRef]
  2. Bernat, R.; Milewski, J.; Wejrzanowski, T. Experimental research on short-term feeding of dust contaminated gas to a molten carbonate fuel cell cathode. J. Power Sources 2017, 355, 181–190. [Google Scholar] [CrossRef]
  3. Bernat, R. Analysis of the Influence of the Presence of Solid Particles in Fuel and Oxidizer on the Operation of Carbonate Fuel Cells; Project Final Report. Project No. 2013/09/N/ST8/04284; National Science Center: Cracow, Poland, 2016. [Google Scholar]
  4. Marcantonio, V.; Zotto, L.D.; Ouweltjes, J.P.; Bocci, E. Main issues of the impact of tar, H2S, HCl and alkali metal from biomass-gasification derived syngas on the SOFC anode and the related gas cleaning technologies for feeding a SOFC system: A review. Int. J. Hydrogen Energy 2022, 47, 517–539. [Google Scholar] [CrossRef]
  5. Pongratz, G.; Subotic, V.; Schroettner, H.; Hochenauer, C.; Skrzypkiewicz, M.; Kupecki, J.; Anca-Couce, A.; Scharler, R. Analysis of H2S-related short-term degradation and regeneration of anode- and electrolyte supported solid oxide fuel cells fueled with biomass steam gasifier product gas. Energy 2021, 218, 119556. [Google Scholar] [CrossRef]
  6. Blesznowski, M.; Jewulski, J.; Zieleniak, A. Determination of H2S and HCl concentration limits in the fuel for anode supported SOFC operation. Cent. Eur. J. Chem. 2013, 11, 960–967. [Google Scholar] [CrossRef]
  7. Stanghelle, D.; Slungaard, T.; Sonju, O.K. Granular bed filtration of high temperature biomass gasification gas. J. Hazard. Mat. 2007, 144, 668–672. [Google Scholar] [CrossRef]
  8. Lim, T.H.; Kim, S.K.; Yun, U.J.; Lee, J.W.; Lee, S.B.; Park, S.J.; Song, R.H. Performance characteristic of a tubular carbon-based fuel cell short stack coupled with a dry carbon gasifier. Int. J. Hydrogen Energy 2014, 39, 12395–12401. [Google Scholar] [CrossRef]
  9. Aravind, P.V.; Liu, M.; Fan, L.; Promes, E.; Giraldo, S.Y.; Woudstra, T. Biomass Gasifier–SOFC Systems: From Electrode Studies to the Development of Integrated Systems and New Applications. ECS Trans. 2013, 57, 2893–2901. [Google Scholar] [CrossRef] [Green Version]
  10. Gadsboll, R.O.; Thomsen, J.; Bang-Moller, C.; Ahrenfeldt, J.; Henriksen, U.B. Solid oxide fuel cells powered by biomass gasification for high efficiency power generation. Energy 2017, 131, 198–206. [Google Scholar] [CrossRef] [Green Version]
  11. Hofmann, P.; Schweiger, A.; Fryda, L.; Panopoulos, K.D.; Hohenwarter, U.; Bentzen, J.D.; Ouweltjes, J.P.; Ahrenfeldt, J.; Henriksen, U.; Kakaras, E. High temperature electrolyte supported Ni-GDC/YSZ/LSM SOFC operation on two-stage Viking gasifier product gas. J. Power Sources 2007, 173, 357–366. [Google Scholar] [CrossRef]
  12. Subotic, V.; Baldinelli, A.; Barelli, L.; Scharler, R.; Pongratz, G.; Hochenauer, C.; Anca-Couce, A. Applicability of the SOFC technology for coupling with biomass-gasifier systems: Short- and long-term experimental study on SOFC performance and degradation behaviour. Appl. Energy 2019, 256, 113904. [Google Scholar] [CrossRef]
  13. Pongratz, G.; Subotic, V.; von Berg, L.; Schroettner, H.; Hochenauer, C.; Martini, S.; Hauck, M.; Steinruecken, B.; Skrzypkiewicz, M.; Kupecki, J.; et al. Real coupling of solid oxide fuel cells with a biomass steam gasifier: Operating boundaries considering performance, tar and carbon deposition analyses. Fuel 2022, 316, 123310. [Google Scholar] [CrossRef]
  14. Rabou, L.P.; Dekker, N.; Vreugdenhil, B. Fuel cell stack operation on clean fuel gas from rejects of paper recycling. In Proceedings of the 16th European Biomass Conference & Exhibition, Valencia, Spain, 2–6 June 2008. [Google Scholar]
  15. Ahrenfeldt, J.; Thomsen, T.P.; Henriksen, U.; Clausen, L.R. Biomass gasification cogeneration—A review state of the art technology and near future perspectives. Appl. Thermal Eng. 2013, 50, 1407–1417. [Google Scholar] [CrossRef] [Green Version]
  16. Manara, P.; Zabaniotou, Z. Towards sewage sludge based biofuels via thermochemical conversion—A review. Renew. Sustain. Energy Rev. 2012, 16, 2566–2582. [Google Scholar] [CrossRef]
  17. Skrzypkiewicz, M.; Obrebowski, S. Direct carbon, integrated gasification, and deposited carbon solid oxide fuel cells: A patent-based review of technological status. J. Power Technol. 2018, 198, 139–160. [Google Scholar]
  18. Eberhardt, T.L.; Pan, H. Analysis of the fly ash from the processing of wood chips in a pilot-scale downdraft gasifier: Comparison of inorganic constituents determined by PIXE and ICP-AES. Biomass Bioenergy 2013, 51, 163–168. [Google Scholar] [CrossRef]
  19. Yao, X.; Xu, K.; Li, Y. Physicochemical Properties and Possible Applications of Waste Corncob Fly Ash from Biomass Gasification Industries of China. BioResources 2016, 11, 3783–3798. [Google Scholar] [CrossRef] [Green Version]
  20. Agrela, F.; Cabrera, M.; Morales, M.M.; Zamorano, M.; Alshaaer, M. 2-Biomass fly ash and biomass bottom ash. In New Trends in Eco-Efficient and Recycled Concrete; de Brito, J., Agrela, F., Eds.; Elsevier Science & Technology: Cambridge, UK, 2019; pp. 23–58. [Google Scholar]
  21. Hofmann, P.; Panopoulos, K.D.; Fryda, L.E.; Schweiger, A.; Ouweltjes, J.P.; Karl, J. Integrating biomass gasification with solid oxide fuel cells: Effect of realproduct gas tars, fluctuations and particulates on Ni–GDC anode. Int. J. Hydrogen Energy 2008, 33, 2834–2844. [Google Scholar] [CrossRef]
  22. Motylinski, K.; Skrzypkiewicz, M.; Naumovich, Y.; Wierzbicki, M.; Kupecki, J. Effects of gas velocity on formation of carbon deposits on AS-SOFC fuel electrodes. J. Power Technol. 2018, 98, 322–328. [Google Scholar] [CrossRef]
  23. Yoshiie, R.; Taya, Y.; Ichiyanagi, T.; Ueki, Y.; Naruse, I. Emissions of particles and trace elements from coal gasification. Fuel 2013, 108, 67–72. [Google Scholar] [CrossRef]
  24. Hermansson, S.; Hjörnhede, A.; Seemann, M. Particulate Matter in the Product Gas from Indirect Biomass Gasification. Svenskt Gastekniskt Center AB Report. 2013. Available online: http://www.sgc.se/ckfinder/userfiles/files/SGC275.pdf (accessed on 15 January 2022).
  25. Skrzypkiewicz, M.; Jewulski, J.; Lubarska-Radziejewska, I. The effect of Fe2O3 catalyst on direct carbon fuel cell performance. Int. J. Hydrogen Energy 2015, 40, 13090–13098. [Google Scholar] [CrossRef]
  26. Dudek, M.; Tomczyk, P.; Socha, R.; Skrzypkiewicz, M.; Jewulski, J. Biomass Fuels for Direct Carbon Fuel Cell with Solid Oxide Electrolyte. Int. J. Electrochem. Sci. 2013, 8, 3229–3253. [Google Scholar]
  27. Jewulski, J.; Skrzypkiewicz, M. Direct carbon fuel cells based on solid oxide electrolyte technology. Przegląd Elektrotechniczny 2013, 89, 268–270. [Google Scholar]
  28. Antunes, R.; Skrzypkiewicz, M. Chronoamperometric investigations of electro-oxidation of lignite in direct carbon bed solid oxide fuel cell. Int. J. Hydrogen Energy 2015, 40, 4357–4369. [Google Scholar] [CrossRef]
  29. Zhao, X.Y.; Yao, Q.; Li, Q.; Cai, N.S. Studies on the carbon reactions in the anode of deposited carbon fuel cells. J. Power Sources 2008, 185, 104–111. [Google Scholar] [CrossRef]
  30. Li, C.; Shi, Y.; Cai, N. Effect of contact type between anode and carbonaceous fuels on direct carbon fuel cell reaction characteristics. J. Power Sources 2011, 196, 4588–4593. [Google Scholar] [CrossRef]
  31. Li, C.; Shi, Y.; Cai, N. Mechanism for carbon direct electrochemical reactions in a solid oxide electrolyte direct carbon fuel cell. J. Power Sources 2011, 196, 754–763. [Google Scholar] [CrossRef]
  32. Jiao, Y.; Zhang, L.; An, W.; Zhou, W.; Sha, Y.; Shao, Z.; Bai, J.; Li, S.D. Controlled deposition and utilization of carbon on Ni-YSZ anodes of SOFCs operating on dry methane. Energy 2016, 113, 432–443. [Google Scholar] [CrossRef] [Green Version]
  33. Bai, Y.; Liu, Y.; Tang, Y.; Xie, Y.; Liu, J. Direct carbon solid oxide Fuel Cell—A potential high performance battery. Int. J. Hydrogen Energy 2011, 36, 9189–9194. [Google Scholar] [CrossRef]
  34. Jiao, Y.; Tian, W.; Chen, H.; Shi, H.; Yang, B.; Li, C.; Shao, Z.; Zhu, Z.; Li, S.D. In situ catalyzed Boudouard reaction of coal char for solid oxide-based carbon fuel cells with improved performance. Appl. Energy 2015, 141, 200–208. [Google Scholar] [CrossRef]
  35. Kluczowski, R.; Krauz, M.; Kawalec, M.; Ouweltjes, J. Near net shape manufacturing of planar anode supported solid oxide fuel cells by using ceramic injection molding and screen printing. J. Power Sources 2014, 268, 752–757. [Google Scholar] [CrossRef]
  36. Skrzypkiewicz, M.; Wierzbicki, M.; Motylinski, K.; Jagielski, S.; Kozinski, G. A test-bench for investigation of SOFC fuelled with gases containing solid particles, Book of Abstracts. In Proceedings of the Konferencja Energetyka i Paliwa, Cracow, Poland, 19–21 September 2018; ISBN 978-83-948318-2-0. [Google Scholar]
  37. Skrzypkiewicz, M. Electricity Generator Based on the Direct Carbon Fuel Cell Technology. Ph.D. Thesis, Faculty of Energy and Fuels, AGH University of Science and Technology, Cracow, Poland, 8 November 2018. [Google Scholar]
  38. Saccoccio, M.; Wan, T.H.; Chen, C.; Ciucci, F. Optimal Regularization in Distribution of Relaxation Times applied to Electrochemical Impedance Spectroscopy: Ridge and Lasso Regression Methods—A Theoretical and Experimental Study. Electrochim. Acta 2014, 147, 470–482. [Google Scholar] [CrossRef]
  39. Klotz, D.; Weber, A.; Ivers-Tiffee, E. Practical Guidelines for Reliable Electrochemical Characterization of Solid Oxide Fuel Cells. Electrochim. Acta 2017, 227, 110–126. [Google Scholar] [CrossRef]
  40. Fuel Cell Handbook, 7th ed.; EG&G Technical Services: Morgantown, VA, USA; U.S. Department of Energy: Morgantown, VA, USA, 2004.
  41. Golec, T. Energetyczne Wykorzystanie Biomasy Poprzez Spalanie i Zgazowanie; Wydawnictwo Naukowe Instytutu Technologii Eksploatacji-PIB, Institute of Power Engineering—Research Institute: Warsaw, Poland, 2014. [Google Scholar]
  42. Motylinski, K.; Blesznowski, M.; Skrzypkiewicz, M.; Wierzbicki, M.; Zurawska, A.; Baran, A.; Bakala, M.; Kupecki, J. Analysis of Soot Deposition Mechanisms on Nickel-Based Anodes of SOFCs in Single-Cell and Stack Environment. Processes 2020, 8, 1370. [Google Scholar] [CrossRef]
Figure 1. The structure of the anode-supported SOFC used in the experimental campaign.
Energies 15 01469 g001
Figure 2. Chart of the test setup used to investigate SOFC with aerosol-contaminated fuel, based on [36].
Energies 15 01469 g002
Figure 3. Test setup: (a) schematic chart of the vertically arranged sample holder and aerosol generator; (b) photograph of the anodic current collector (visible 25 mm2 area fuel channels).
Energies 15 01469 g003
Figure 4. Chart of the equivalent circuit model.
Energies 15 01469 g004
Figure 5. Particle size distribution in HVA powder with sieve mesh marked.
Energies 15 01469 g005
Figure 6. The role of fuel composition on SOFC performance. Total flow of 1000 Nml/min was applied for both fuel and air side.
Energies 15 01469 g006
Figure 7. Evolution of voltage during intermediate-term experiments for various test conditions and inert powder aerosol contamination.
Energies 15 01469 g007
Figure 8. Voltage evolution during fly ash aerosol contamination.
Energies 15 01469 g008
Figure 9. Impact of the presence of the CO vs. solid carbon in fuel on polarization resistance of SOFC. Kash is a ratio of the CO2 flow through the aerosol generator to the direct CO2 flow, according to formula Kash = Flow(CO2,through generator)/Flow(CO2,direct).
Energies 15 01469 g009
Figure 10. Evolution of EIS spectra. Measurement at 314 h corresponds to fly ash aerosol contamination with 100 Nml/min CO2 flow through generator; other spectra were collected using 20% of H2 in CO2 1000 Nml/min fuel flow.
Energies 15 01469 g010
Figure 11. Impact of aerosol application on SOFC performance. Lines are for visual guidance only. Rp(H2): polarization resistance in fuels containing 80% and 50% H2 in N2; Rp(H2/CO2): polarization of the cell in 20% H2 in CO2 fuel; Rp(ash): polarization resistance for H2/CO2 fuel contaminated with fly ash (see text for details); R : ohmic resistance of the cell.
Energies 15 01469 g011
Figure 12. Analysis of the anode support surface near the gas outlet after Experiment II by (a) SEM image at 1000× magnification; (b) EDS map at 5000× magnification.
Energies 15 01469 g012
Figure 13. SEM images of the alumina powders: (a) collected from the anode support after Experiment II; (b) milled HVA powder used to conduct Experiment II.
Energies 15 01469 g013
Figure 14. SEM images of the anode support after Exp. III: (a) typical surface of the contact layer on the top of the support; (b) bare support in the spots of contact layer deficiency.
Energies 15 01469 g014
Figure 15. SEM images of fly ash from KAJOT gasifier: (a) large block containing mostly carbon; (b) amorphous carbon.
Energies 15 01469 g015
Table 1. Ultimate and proximate analysis for the applied fly ash.
ParameterUnitValue
Humidity (analytical)%2.7
Ash%9.8
Volatile matter%6.06
Heat of combustionkJ/kg30,783
LHVkJ/kg30,486
Carbon%85.1
Hydrogen%1.36
Nitrogen%0.3
Sulfur%0.11
Table 2. Summary of measurements performed for various fuel compositions for investigation of presence of CO on cell performance; CC3A 66 h means constant current load of 3 A for 66 h.
H2 Flow
(Nml/min)
CO2 Flow
(Nml/min)
CO Flow
(Nml/min)
Measurements
2008000I–V, EIS
20080020I–V
200700100I–V
200600200I–V
250500250I–V
50050020I–V, EIS, CC3A 66 h
5005000I–V, EIS, CC3A 66 h
Table 3. Fuel mixture flows, temperatures and basic results for reference measurements.
Experiment No.TemperatureH2 Flow (Nml/min)N2 Flow (Nml/min)OCV I @ 0.7 V
(A)
I850
800
750
100001.105
1.121
1.131
14.14
11.15
7.919
II8508002001.08110.87
III850
800
750
8002001.120
1.132
1.144
17.80
14.69
11.94
Publisher’s Note: MDPI stays neutral with regard to jurisdictional claims in published maps and institutional affiliations.

