
Levelized Cost of Electricity Generation by Small Hydropower Projects under Clean Development Mechanism in India


1
Water, Energy and Environmental Engineering, University of Oulu, 90014 Oulu, Finland
2
Electrical & Electronics Engineering, GMR Institute of Technology, Rajam 532127, India
*
Author to whom correspondence should be addressed.
Energies 2022, 15(4), 1473; https://0-doi-org.brum.beds.ac.uk/10.3390/en15041473
Submission received: 20 January 2022
/
Revised: 9 February 2022
/
Accepted: 14 February 2022
/
Published: 17 February 2022
(This article belongs to the Special Issue Role of Hydropower for Sustainable Future Energy System: Synergies, Challenges and Development)
Abstract
:Contrary to conventional fossil fuel-based electricity generation technologies, renewable energy centered technologies, specifically small hydropower, release a lesser amount of anthropogenic greenhouse gases but are normally more expensive. A major segment of the capital investment in the current small hydropower scenario accounts for equipment and construction process costs. The construction and cost administration process are generally limited to analysis of the capital cost of civil constructions, electro-mechanical equipment works, neglecting the costs related to operating and maintaining the plant, replacement or refurbishment, certified emission reductions, among others. Contemporary studies indicate that these costs form a substantial fraction of the total capital investment. Consequently, for cost management and investment decision making, small hydropower plant developers are drawing increased attention in recent years towards conducting life cycle costing studies that take into account the ignored costs. In addition, small hydropower plants in developing nations can become more competitive by trading the emission reductions achieved under the provision of the Clean Development Mechanism, an outcome of the Kyoto Protocol proposed at the United Nations Framework Convention on Climate Change. In this paper, a modest attempt has been made to determine the Levelized cost of electricity generation using life cycle costing methodology, which accounts for all the costs over operating lifetime on a range of small hydropower plants and the results are analyzed.
1. Introduction
Renewable energy-based electricity generation emits less anthropogenic greenhouse gases (GHG) than conventional fossil fuel-centered electricity generation technologies but is usually expensive. The Clean Development Mechanism (CDM) of the Kyoto Protocol to the United Nations Framework Convention on Climate Change (UNFCCC) offers a prospect for renewable energy-based electricity generation systems in emerging nations to become more competitive by leveraging monetary benefits extended by the reduction in emissions possible from a renewable energy project. The prime focus of CDM continues to be on the energy industry because of the huge amount of registered renewable energy projects and their probable effect on the electricity generating cost [1]. A project under CDM receives Certified Emission Reductions (CER), which is equal to abating one ton of CO2 equivalent and is even verifiable and measurable. The project titleholder can trade the CERs to developed countries, companies, or governments. The latter can use them to support their emission reduction goals committed under the Kyoto Protocol [2]. Consequently, CDM can be an additional revenue source for renewable energy projects. The net revenue from CER trades makes projects based on renewable energy sources more competitive until the average cost of issuing a CER (i.e., UNFCCC charges to monitor and verify emission reductions) is less than the CER tradable price.
This study’s main aim is to estimate the electricity generation costs by Small Hydropower (SHP) projects located in India. The Levelized cost of electricity (LCOE) is regularly used for assessing the cost-effectiveness of various electricity generation technologies on a dependable basis [3]. Cost appraisals of various alternate energy generation technologies regularly use LCOE and suggest the least cost investment alternative among available alternatives [4,5]. In general, LCOE computations involve the production cost estimations for each technology type related to project’s geography, capacity, operating mode, time and assumptions regarding economic parameters [6]. This study determines the LCOE generation for low and high head SHP plants by using cost correlations existing in the literature developed by considering various existing SHP projects in India. The process of developing correlations involves collecting data from existing power plants for performing cost analysis, i.e., feasibility studies regarding technical, economic and financial factors influencing the establishment and operation of the SHP plant [7]. Decisions related to investments in SHP projects are generally based on thorough and precise techno-economic and cost–benefit analysis with the prevailing market conditions [8]. Financial feasibility is concerned mostly with the profitability of the SHP projects, while economic analysis is concerned with both monetary and societal benefits [9]. The most straightforward approach to evaluate the economic feasibility of the SHP project is using the payback period and the net present value for the investments. For SHP projects, the payback period is highly dependent on the current financial markets [10,11,12]. The prevailing state of the market is determined by nation’s borrowed capital and its interest, tariffs, taxes, inflation, subsidies and other economic factors [13]. Most of the works in the literature focused on developing correlations for cost components influencing total cost of the project and establishing methodologies to determine financial feasibility of a project, but very few in the literature mentioned about environmental costs and how to include them [14,15,16].
Computation and comparison of LCOEs for different SHP plants classified based on head and capacity were done. The calculations consider the Net Present Value (NPV) of initial capital costs, operation and maintenance costs, replacement costs and the projected net revenue of the emission reductions (i.e., the difference of CER income and issuance costs). Using the data, the first Life Cycle Cost (LCC) for each SHP configuration considered was calculated. Further using annualized electricity production cost function, the LOCE of a particular SHP configuration has been calculated considering the returns associated without and with the expected returns from CERs. The proposed methodology helps in investment decision making for SHP developers and also aids as a significant tool to measure the deployment and progress of CDM for SHP projects.
1.1. Small Hydropower and Clean Development Mechanism Technology
SHP technologies are exceptionally robust with an average operating life spanning over 50 years and entail less maintenance, despite being the most environmentally benign clean energy alternatives available. SHP is characterized as a maximum density resource of all the existing clean energy generation sources. SHP is the leading renewable energy generating resource globally [17]. Major advantages exhibited by SHP plants are reduced gestation times, devoid of submergence, resettlement and other complications associated with the environment and ecosystem [9,18]. Hydraulic turbines convert water pressure into mechanical power of shaft, which is further used to run an alternator or other electricity-generating machines. The power thus obtained is proportional to the hydraulic pressure, volume flow rate and net water head. The universal formula for power generated by a hydro system is given by Equation (1).
where P is the electrical power generated (kW), η is the total efficiency, ρ is the water density (kg/m3), g is the acceleration due to gravity (m/s2), Q is the discharge passing through the turbine (m3/s), and H is the net head of water across the turbine (m). Table 1 gives information about the various components of low and high head SHP schemes [19]. Based on the head availability, SHP plants are broadly classified as high, medium and low head plants. Further, SHP plants can be dam toe, run-of-the-river, and canal-based plants.
P = ηρgQH
The Kyoto Protocol is a protocol to the United Nations Framework Convention on Climate Change (UNFCCC or FCCC) to fight global warming. Under this, developed nations (Annex-1 of Kyoto Protocol) and developing nations (Non-Annex-1 of Kyoto Protocol) will reduce combined Greenhouse gas (GHG) emissions by at least 5% below their 1990 levels by first commitment 2008 to 2012 [20]. Kyoto Protocol aims to bind constraints on GHG emissions, cut the costs of reducing emissions, and establish global markets for GHG emission permits. Kyoto Mechanisms involve emissions trading, which allows the country to sell its spare emission units to nations that have surpassed their targets, joint implementation which allows developed countries to get emission reduction units from projects developed in other developed countries for emission reduction. While Clean Development Mechanism (CDM) allows developed nations to earn emission reduction units from emission reduction projects in developing nations. CDM is one of the flexibility mechanisms defined in Article 12 of the Kyoto Protocol and is intended to meet two objectives viz. to assist parties not included in Annex I in achieving sustainable development and in contributing to the ultimate objective of the UNFCCC, which is to avert treacherous climate change and to support parties involved in Annex I in attaining compliance with their enumerated emission limitation and reduction obligations (GHG emission caps) [20].
The Indian market is extremely receptive to CDM. Up until December 2014, India had completed around 3000 projects, nearly 40% of which had been registered with the UNFCCC. The CDM and additional market instruments have reinforced the improvement and execution of these projects and created over 170 million Certified Emission Reductions (CERs), which industrialized countries utilized to meet their Kyoto Protocol compliance obligations [21]. Renewable energy projects have subjugated the number of registered CDM projects, while industrial gas projects have consistently made up the majority of CERs [21]. The volume of CO2 releases saved by a renewable power scheme would fundamentally be governed by the quantity of fuel avoided by its use, which, in sequence, depends upon the electricity generated from the renewable power scheme annually. Electricity produced annually depends on the plant capacity and plant load factor (PLF) of the renewable power scheme. Hence, the Gross Annual CO2 Emissions (GCE) reduced by a renewable power project, GCEProject, can be estimated as
where CEFe is the CO2 emission factor for electricity. The CO2 emissions alleviation through renewable power schemes in India is projected based on the provincial standard [22,23].
1.2. CDM Potential of SHP
The total SHP potential in the country is evaluated at about 21.13 GW from 7133 project sites corresponding to 12.68 GW at a 60% load factor. The total installed capacity of SHP projects (<25 MW) is 4.683 GW. The potential of SHP has been augmented from 20 GW in 2013 to 21.13 GW in 2019, while the installed capacity augmented from 3.4 GW in 2013 to 4.68 GW in 2019 [24]. This growth in SHP is accounted for by technical advancement and the constructive steps taken by the government. The gross annual CO2 releases reduced by an SHP scheme, GCESHP, can be determined using Equation (2). The amount of CER generated and available for sale corresponding to annual energy production (AEP) is presented in Table 2.
The above estimates are based on the assumption of 60% PLF. With 60% PLF the gross AEP potential has been estimated at 86.46 TWh. It can easily be understood that the AEP and corresponding CER and revenue generation are highly sensitive to PLF. The PLF is highly variable and can be impacted by various operating parameters such as instructions from operators in case of grid-connected projects, seasonal constraints, etc. A sensitivity analysis has been performed to study the effect of PLF on AEP and corresponding CER generation potential and the results of this sensitivity analysis are presented in Figure 1.
2. Methodology
At large, LCOE signifies the Net Present Value (NPV) of the per unit electricity generated cost over the SHP plant’s expected economic lifetime. It can be computed as the percentage of the aggregate of discounted electricity generated cost and the discounted sum of electricity output over the SHP’s operating life. The projected aggregate cost of delivering electricity at the point of interconnection to a load or grid usually comprises investment in terms of initial capital and a series of costs relating to fuel, operation and maintenance and others. Considering the plant’s useful life, these costs and electricity output for each year are discounted by the time value of money. Thus, the computed LCOE is considered the least average price at which electricity can be traded to obtain a break even over the operating life of SHP [25]. The majority of SHP developers follow a typical cost management practice. The technical and economic viability of the SHP plant for carrying out the construction and getting operations underway is considered. This practice only reflects the investments up to a particular point, i.e., the SHP’s design and construction. Although this period accounts for a significant portion of the total plant investments, other costs relating to SHP’s generation losses, outage, maintenance, replacement and CERs must be considered in evaluating the plant’s entire LCC, which is vital for evaluating the NPV [9].
SHP projects under CDM also produce a tradable derivative of electricity, CERs. However, CERs attract the costs of monitoring emission reductions, verified, and subsequent CER issuance. In this study, these extra incomes and expenditures were reflected while computing the LCOEs for SHP projects. The total value of an SHP project TVO is influenced by the discounted cost of the expected profit from electricity sale and revenue from CER sale [25], represented by
where X and Y represent the anticipated returns from electricity sales and CERs sales, and T is the project’s operating life. Equation (3) can be rewritten to differentiate income and expenditures,
where, and are the electricity and CER costs and is the project’s net present value. If both the cost of electricity and CER is combined to represent the total discounted cost, then
where IC0 is the initial capital, OMC represents the annually varying maintenance and operation cost, RC represents the replacement cost and c represents the cost of issuing one CER, which is highly variable and includes the cost of emission reductions monetization under the CDM, comprising the issuance fee outstanding to the UNFCCC and outlays for monitoring and authentication. If the anticipated return from electricity and CER sale exceeds investment capital, the total value function can be represented as
where the and the denote the weighted average price of electricity and CER sales at the period the investment choice was realized. The envelope theorem can be used to recover total output levels that are constant with solution values, as
where and represent the electricity and CER volumes that the SHP projects are expected to produce throughout the course of their life, weighted by the discount factors used to calculate the total value function. The accompanying combined cost functions can be articulated as , where is the vector of anticipated input price and is the set of state variables that form the constraints of the LCOE problem. The problem can be streamlined when costs are not combined, i.e., when allows Equation (4) to be rewritten as
Using the above equation, the non-combined cost related to electricity production alone can be estimated as . Hence, the NPV of the total cost of electricity generated by the SHP project can be computed as
The following equation can then estimate LCOE as
The above equation applies to all power projects producing electricity under CDM and is referred to as LCOE as per energy cost literature [3]. However, the above equation assumes that the SHP project operating life and CER issuance period is the same. Generally, SHP project life will be greater than the CER issuance period, and a much more generic way of representing Equation (10) to compute LCOE is as follows,
where is the CER issuance period in years.
2.1. Cost Correlations of SHP
Correlation is a division of statistical relationships concerning dependence, although it most commonly refers to the degree to which two or more variables have a linear relationship. Correlations are helpful as they can indicate an analytical relationship that can be exploited for use in practical purposes. A lot of the literature is available pertaining to correlations developed for various cost components with respect to power (P) in kilowatt and head (H) in meters for SHP plants. The development of correlations was a progression of research efforts based on SHP plant data available across India. In general, depending on the SHP scheme type, civil work components differ but the electro-mechanical components are the same for all schemes. Table 3 gives information about the various correlations developed for low head SHP plants which were developed for run-of-river, dam toe and canal based SHP schemes [26,27,28]. The correlations for high head SHP plants involve various components and their combinations as every plant is site specific [9]. In this regard, the correlations have been developed based upon the work to be done for each civil work component. The work to be done consist of four sub-components majorly viz. excavation, concreting, reinforcement and structural steel required. However, the correlations pertaining to electromechanical components are directly dependent on head and capacity [29].
The following equations can compute the total cost of various SHP schemes based on the data obtained by correlations available in literature [26,27,28,29]. For run-off-river SHP scheme, the total civil cost is given by
CCIV = CPHB + CDW&I + CPC + CDC + CF&S + CP + CTR,
For dam toe SHP scheme, the total civil cost is given by
CCIV = CPHB + CI + CP + CTR,
For canal-based SHP scheme, the total civil cost is given by
CCIV = CPHB + CS + CDW,
The components of electro-mechanical equipment cost are the same for all the SHP schemes, and hence, the total cost is given by
CEM = CTG + CGE + CAUX + CT&SY,
Based on the cost correlations of civil and electro-mechanical components, total SHP cost is given by
where CCIV is the cost of civil works, CPHB is cost of powerhouse building, CDW&I is cost of diversion weir and intake, CPC is cost of power channel, CDC is cost of desilting chamber, CF&S is cost of forebay and spillway, CPST is cost of the penstock, CTR is cost of tailrace, CI is cost of intake, CS is cost of spillway, CDW is cost of diversion weir, CTG is cost of turbine governor system, CGE is cost of generator exciter system, CAUX is cost of mechanical and electrical auxiliaries, CT&SY is cost of transformer and switchyard, CEM is cost of electromechanical works and CSHP is cost of SHP plant. The factor 1.13 corresponds to establishment related costs including survey and investigations, preliminary expenses on report preparation, design, audit and accounting, overheads, tools and facilities, communication costs and land costs have been included in indirect/ miscellaneous costs [6,19,20,30].
CSHP = 1.13 (CCIV + CEM),
2.2. LCOE Calculations
This section deals with the LCOE computations for SHP schemes under consideration. All of these employ different civil work components and the same electro-mechanical components. As the variation of the head has a major impact on the capacity of the plant and cost, for high head SHP schemes, the characterization of LCOE has been carried out for different heads and the same power capacity. On the other hand, in low head SHP schemes, the cost is directly proportional to electro-mechanical equipment, which is dependent on the type of plant viz. Run off-river, dam toe and canal-based SHP. Hence, the characterization of LCOE has been done considering various combinations of type, capacity and head for low head SHP schemes. The functional life of the SHP plant for computation is considered to be 50 years with major restoration works being taken up after 25 years of plant operations, as it is consistent with the practice by the hydropower industry. ICs for the construction of SHP plants can be attributed more than a year before the plant was commissioned. This paper assumes that all ICs will occur in year zero. Table 4 shows the key technological and economic assumptions made in the calculations that reproduce the current state of the country’s hydropower industry [31,32,33]. The reliability assessment in generation systems is very important [34,35], and since this study considers the overall life cycle cost of SHP, the reliability aspects are considered in the form of the annual plant load factor, rehabilitation times and replacement costs. Based on the correlations presented in Table 3, the civil works cost, and electro-mechanical components cost for different SHP schemes have been estimated using Equations (12)–(16). These estimates are then used for computing the LCOE using Equations (3)–(16) for SHP plants under consideration, and the data are presented in Table 5 and Table 6. All costs are represented in INR/kW and LCOE is expressed as cost per unit, i.e., INR/kWh.
3. Results and Discussion
From the calculations obtained in the previous section, it can be analysed that the LCOE reduces with an increase in capacity of the plant resulting in more significant savings which makes the projects profitable. This is further enhanced by taking into account the revenues generated by CDM in the form of tradable CERs. CDM enables SHP projects to be more economical even though the effectiveness remarkably depends on CER valuations in the international market and the duration of their earning period by the plant. SHP projects under CDM react to economies of scale in electrical energy production, i.e., the electricity produced by larger capacity plants will have lower per unit electricity costs and vice versa. The average per-unit cost of electrical energy produced is directly related to the project’s duration (i.e., plants with more technical life will have less per unit cost). However, variances in electricity-generated timing will be considered for discounting for LCOE calculation purposes. The civil works govern the capital investment of medium, and high head SHP schemes cost as these schemes are site-specific. The cost of civil works and electro-mechanical equipment governs the cost of low head SHP schemes. Because machine sizes are relatively large, the size of powerhouse buildings and other civil works components is directly affected by the type and size of machines. The cost contribution to electro-mechanical equipment is higher in low head SHP schemes than in civil works. The following key illustrations demonstrate the effectiveness of the proposed methodology in evaluating various alternatives available for generating electricity from SHP plants.
- (i)
- In all the three cases of low head SHP via dam toe, run-off-the-river, and canal-based schemes, the costs of electro-mechanical work were more than civil works, as illustrated in Figure 2. This is because, in low head SHP schemes, the machine sizes are relatively larger, the size of powerhouse building and other civil works components are directly affected by the type and size of machines and, hence, electro-mechanical equipment has a bigger cost contribution than civil works. However, for high head SHP plants, civil works costs are more than electro-mechanical components cost works as illustrated in Figure 3. This is because the capital investment of medium and high head SHP schemes are governed by the civil works cost as these schemes are site specific.
- (ii)
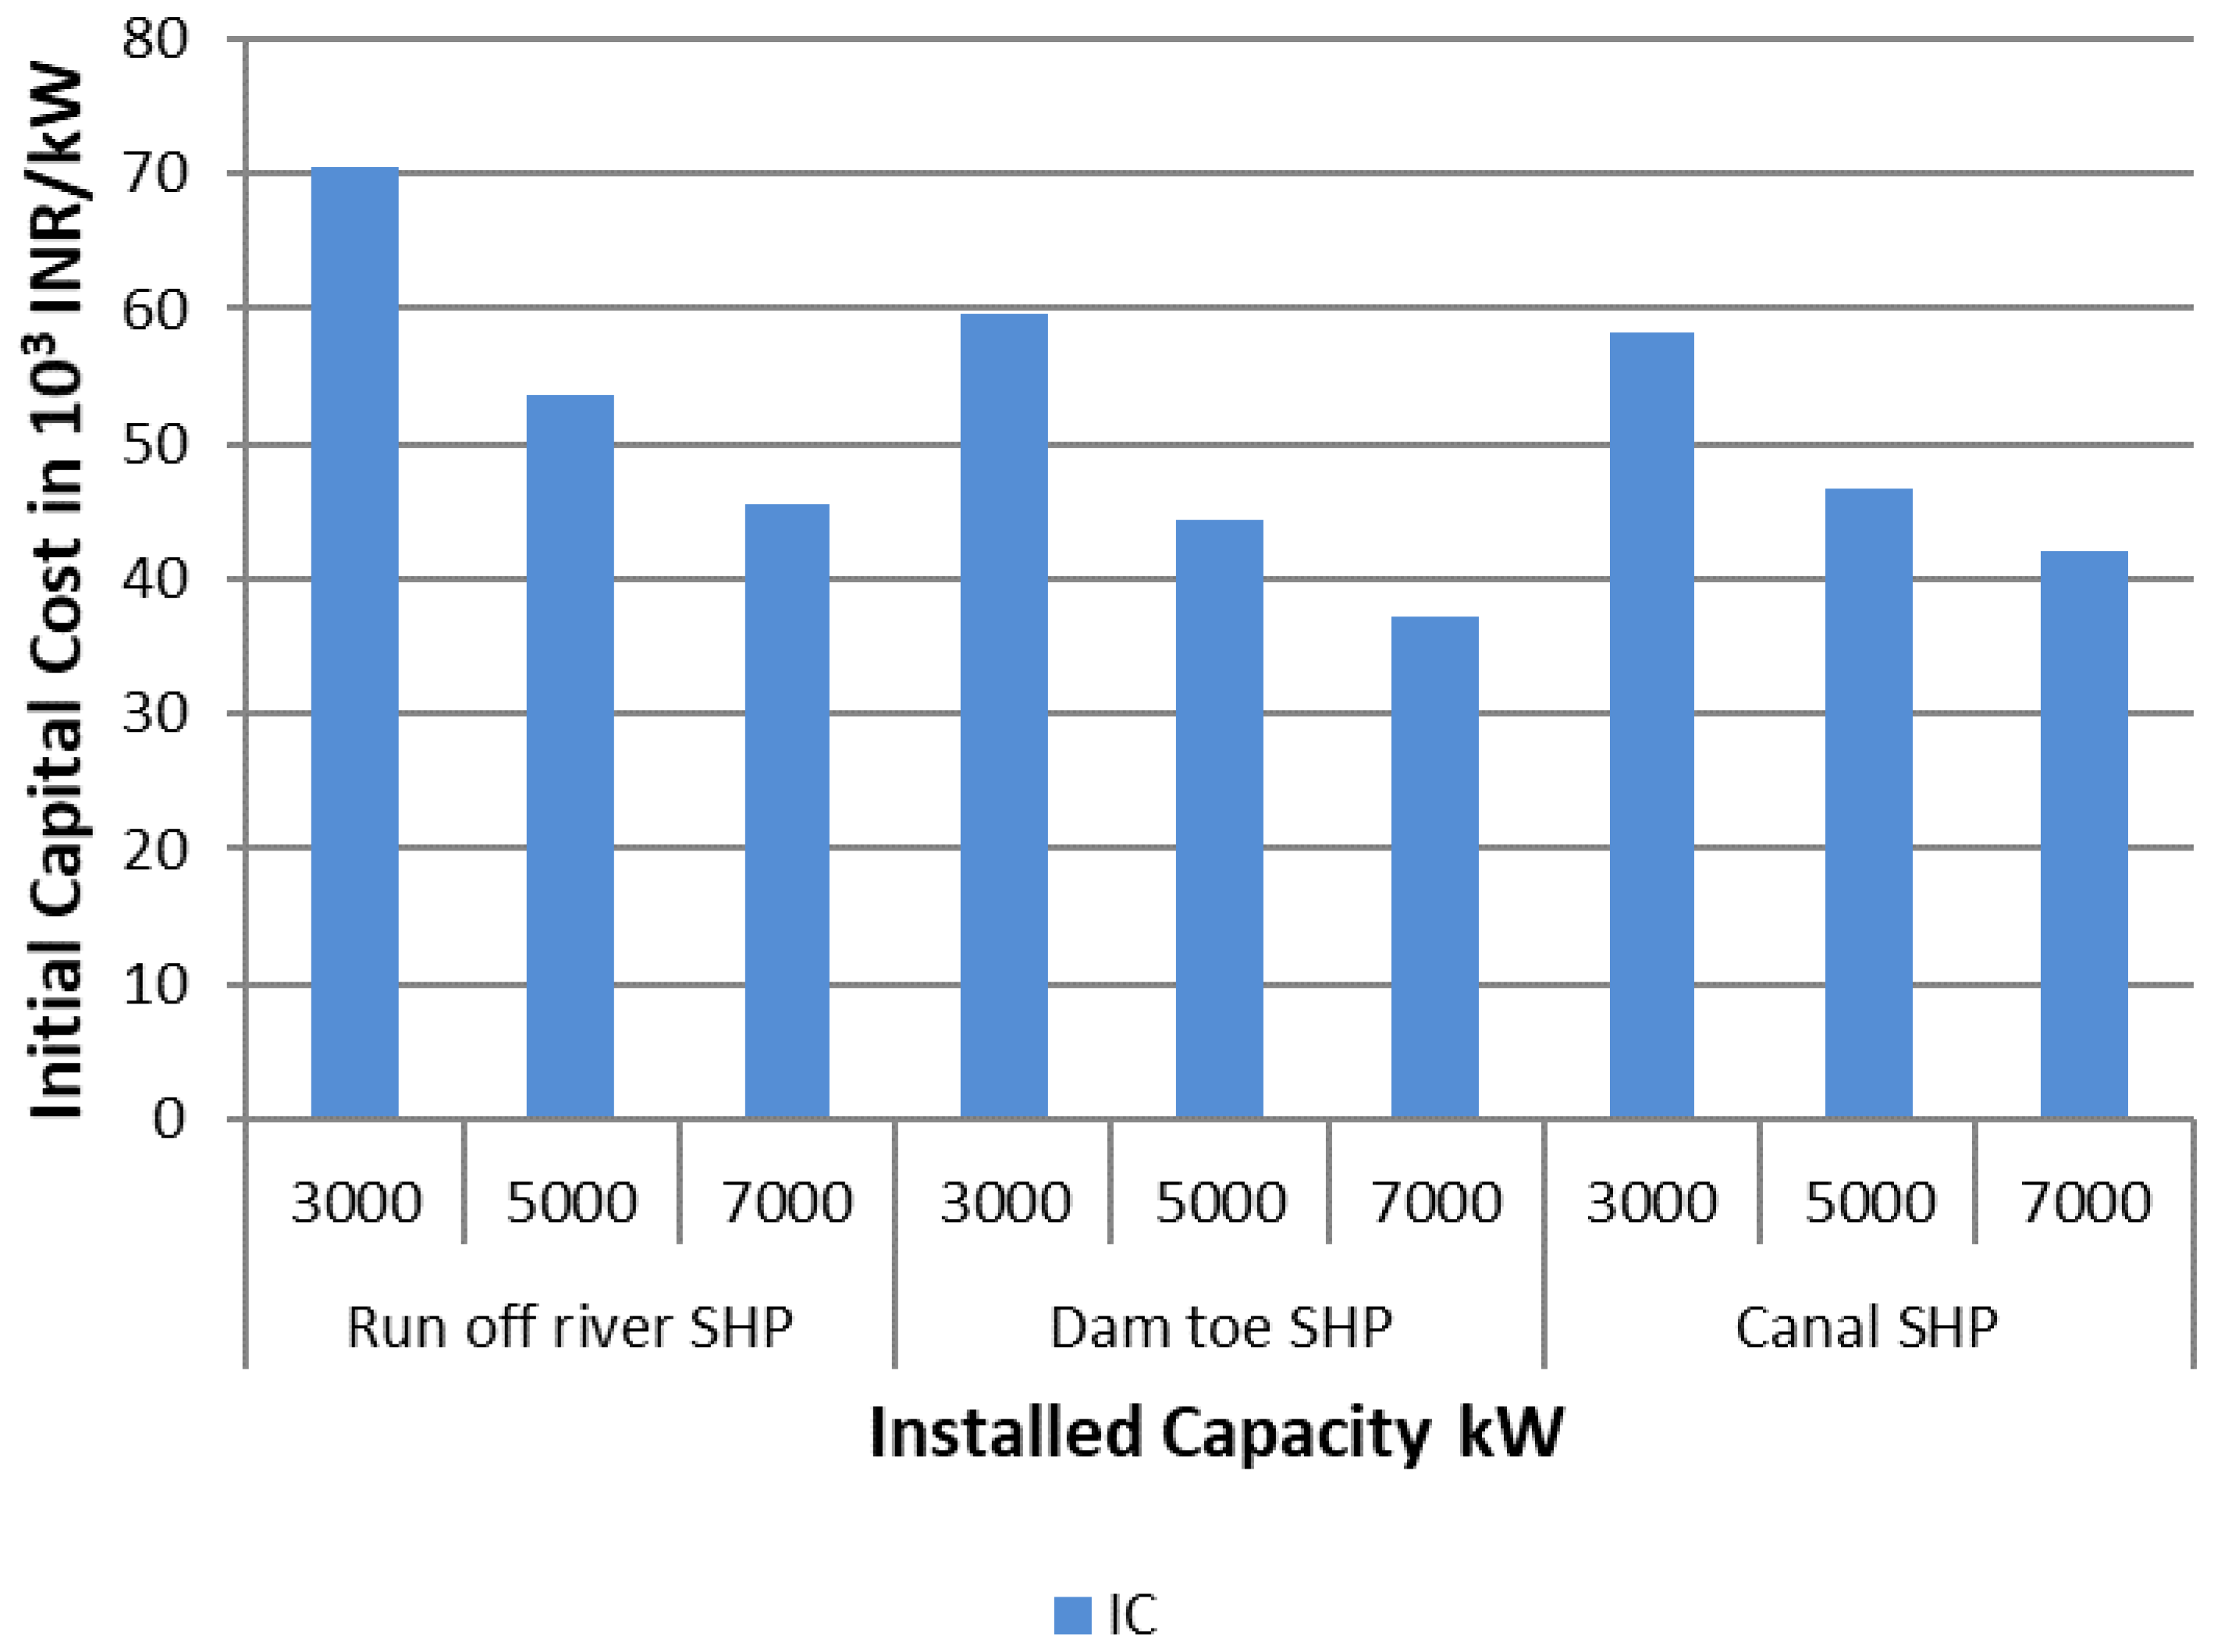
- IC, which is a combination of cost of civil works, electro-mechanical components and administrative, charges is more for SHP with low head and capacity. This decreases with an increase in head or capacity of the plant as illustrated in Figure 4 and Figure 5 for low and high head SHP plants, respectively.
- (iii)
- From Figure 4, it can be observed that for the same head and capacity, IC of run-off-river is highest followed by dam-toe, further followed by canal-based plants. An exception can be found in canal-based SHP plants where the cost is more as compared to dam-toe plants. This is due to the impractical techno-economic feasibility of having a canal-based SHP plant with high heads.
- (iv)
- LCC has been evaluated taking into account the present values of various cost components. Such as IC, OMC, RC and CER. The LCC of SHP plants for all cases has been calculated and is 85% or approximately seven times higher than the corresponding IC.
- (v)
- Compared to the benchmarked cost of SHP in India, i.e., INR 100 Million per MW, the analyzed costs are very close to benchmarked cost with a minor deviation of +0.42 to −0.16 for all the low head SHP plants under consideration.
- (vi)
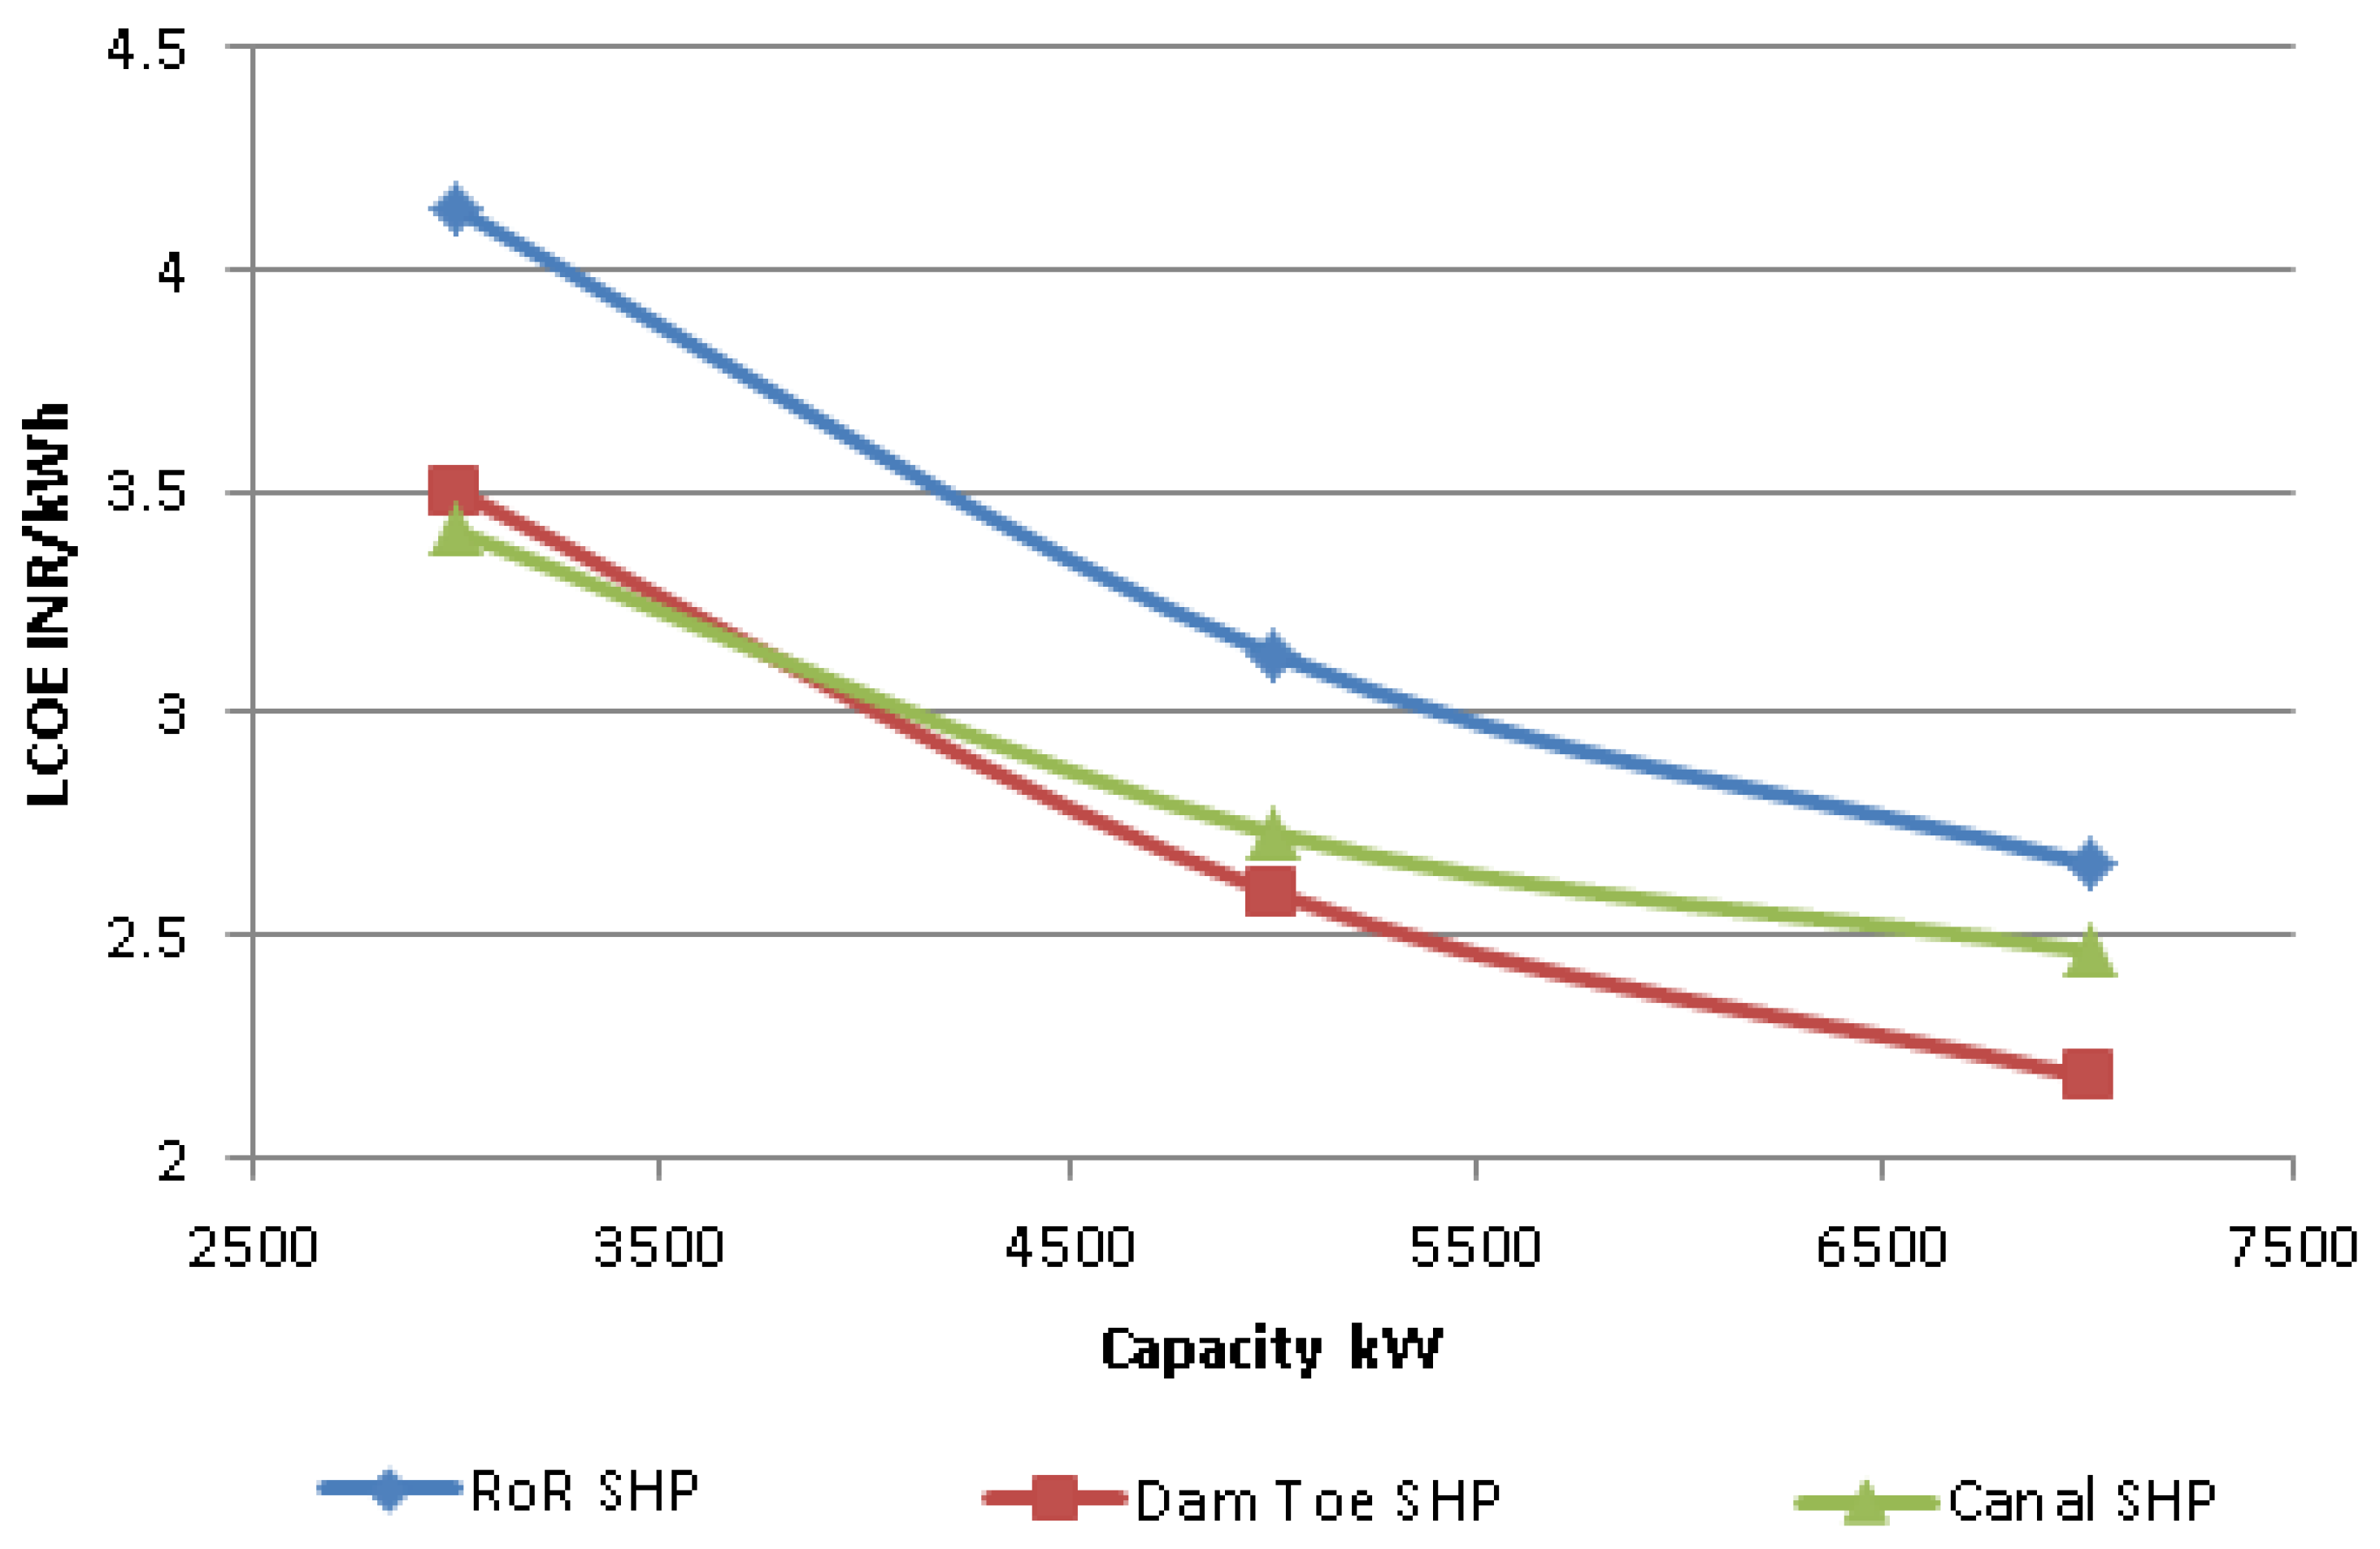
- Compared to the average benchmarked cost for sale of electricity generated from SHP in India, i.e., INR 5 per kW, the obtained LCOE with and without CER cost considerations is less, indicating scope for reasonable profits and sustainable operation SHP over its lifetime. In the case of low head SHP schemes, the LCOE reduces significantly with increased capacity as illustrated in Figure 6. A deviation in two combinations (2000 kW, 200 m and 300 m) for high head SHP projects can be observed, illustrated in Figure 7, which are accounted to the impractical techno-economic feasibility of constructing the plant with a combination of penstock material, i.e., HDPE (200 m and 300 m) and turgo impulse for 200 m and Pelton for 300 m, respectively.
Overall, the variation of LCOE depends on the cost components and economic factors considered in its computation as well as the technology adopted by the SHP plants. It is to be noted that the cost components, economic factors and technologies adopted will vary from plant to plant as well as regulations adopted by the nations in constructing and operating these plants also will be different, resulting in variations in LCOE. Despite these variations, LCOE proves to be a powerful tool in accommodating all these variations and effectively evaluating the available alternatives and providing significant results which can be used to evaluate designs, develop operation and maintenance strategies and refurbishment activities.
4. Conclusions
This paper has computed the levelized cost of electricity generation by small hydropower projects under the Clean Development Mechanism. Under this, the SHP project can generate both electricity and tradable CERs simultaneously. The implication and applicability procedures of life cycle costing methodology based on net present value analysis to determine the levelized cost of electricity to small hydropower projects have been demonstrated. Using the correlations available for SHP projects, various SHP schemes have been studied and initial capital cost has been estimated. Then, for each SHP scheme under consideration, a life cycle cost based on the net present value was calculated by subtracting the discounted CER revenues from the initial capital investments, as well as the discounted OMC and RC costs, to arrive at the net cost of electricity to be generated over the life of each scheme. LCOE for each scheme has been calculated by dividing the net present cost by discounted flow of electricity.
The methodology was implemented on a range of low and high head small hydropower plants and the results are analysed. The various cost components of small hydropower plants and the range of factors affecting these costs are discussed. It has been observed that civil work costs in case of high head plants and electro-mechanical components in case of low head plants, both sensitive to head and capacity, are crucial in arriving at the plant’s overall cost. Civil work costs account for significant costs, it is essential to look for improved and innovative designs in water conveyance systems, powerhouse buildings and other structures. Regarding electro-mechanical components, the turbine is the most important component and research has to be conceded in the areas of mini and micro technologies for cost reduction. In addition, it is evident that SHP schemes exhibit economies of scale in electricity generation under CDM, i.e., a plant with more capacity will have less per unit cost. Life cycle costing-based LCOE analysis demonstrated in this paper can be a useful tool for analysing changes in macroeconomic conditions that regulatory bodies and CDM authorities impose on SHP projects. The computation of LCOE based on LCC proves to be proficient in identifying the profit margins and chief cost determining parameters intended for initiating necessary cost reduction measures by SHP developers and operators.
Author Contributions
Conceptualization, E.R.P. and T.S.K.; methodology and formal analysis, E.R.P. and T.S.K.; writing—original draft preparation, E.R.P. and T.S.K.; writing—review and editing, T.S.K. and E.R.P.; visualization, T.S.K. and E.R.P.; A.T.H. provided supervision during the original draft preparation and helped during the project administration. All authors have read and agreed to the published version of the manuscript.
Funding
This research was funded by The University of Oulu and The Academy of Finland Profi4 318930.
Institutional Review Board Statement
Not applicable.
Informed Consent Statement
Not applicable.
Data Availability Statement
Not applicable.
Conflicts of Interest
The authors declare no conflict of interest.
Nomenclature
| AEP | Annual Energy Production | IC | Initial Capital |
| c | Cost of issuing 1 CER | INR | Indian Rupee |
| CAUX | Cost of auxiliaries | LCC | Life Cycle Cost |
| CCIV | Cost of civil works | LCOE | Levelized Cycle Cost of Electricity |
| CDC | Cost of desiltying chamber | NPV | Net Present Value |
| CDM | Clean Development Mechanism | OMC | Operation and Maintenance Cost |
| CDW | Cost of diversion weir | P | Plant Capacity |
| CDW&I | Cost of diversion weir and intake | PLF | Plant Load Factor |
| CEF | Carbon Emission Factor | Q | Discharge |
| CEM | Cost of electromechanical equipment | T | Project operating life |
| CER | Certified Emission Reductions | TVO | Total Value |
| CF&S | Cost of forebay and spillway | UNFCCC | United Nations Framework Convention on Climate Change |
| CGE | Cost of generator exciter system | X | Returns from electricity sale |
| CI | Cost of intake | Y | Returns from CER sale |
| CPC | Cost of power channel | η | Efficiency |
| CPHB | Cost of power house building | ρ | Water density |
| CPST | Cost of penstock | Electricity cost | |
| CS | Cost of spillway | CER cost | |
| CSHP | Cost of SHP plant | Weighted average price of electricity | |
| CT&SY | Cost of transformer and switchyard | Weighted average price of CER sale | |
| CTG | Cost of turbine governor system | XO | Electricity volume |
| CTR | Cost of tailrace | YO | CER volume |
| g | Acceleration due to gravity | Input Price Vector | |
| GCE | Gross Annual CO2 Emissions | State variables set | |
| GHG | Greenhouse Gases | τ | CER issuance period |
| H | Head |
References
- Zhao, Z.Y.; Li, Z.W.; Xia, B. The impact of the CDM (clean development mechanism) on the cost price of wind power electricity: A China study. Energy 2014, 69, 179–185. [Google Scholar] [CrossRef] [Green Version]
- Spalding-Fecher, R.; Joyce, B.; Winkler, H. Climate change and hydropower in the Southern African Power Pool and Zambezi River Basin: System-wide impacts and policy implications. Energy Policy 2017, 103, 84–97. [Google Scholar] [CrossRef]
- USEIA. Levelized Costs of New Generation Resources in the Annual Energy Outlook 2021; U.S. Energy Information Administration: Washington, DC, USA, 2021. Available online: https://www.eia.gov/outlooks/aeo/electricity_generation.php (accessed on 1 December 2021).
- Branker, K.; Pathak, M.J.M.; Pearce, J.M. A review of solar photovoltaic levelized cost of electricity. Renew. Sustain. Energy Rev. 2011, 15, 4470–4482. [Google Scholar] [CrossRef] [Green Version]
- Sims, R.E.H.; Rogner, H.H.; Gregory, K. Carbon emission and mitigation cost comparisons between fossil fuel, nuclear and renewable energy resources for electricity generation. Energy Policy 2003, 31, 1315–1326. [Google Scholar] [CrossRef]
- Larsson, S.; Fantazzini, D.; Davidsson, S.; Kullander, S.; Höök, M. Reviewing electricity production cost assessments. Renew. Sustain. Energy Rev. 2014, 30, 170–183. [Google Scholar] [CrossRef] [Green Version]
- Edomah, N.; Foulds, C.; Jones, A. Influences on energy supply infrastructure: A comparison of different theoretical perspectives. Renew. Sustain. Energy Rev. 2017, 79, 765–778. [Google Scholar] [CrossRef] [Green Version]
- Bhattacharyya, S.C. Economic Analysis of Energy Investments. In Energy Economics; Springer: London, UK, 2011; pp. 163–189. [Google Scholar] [CrossRef]
- Kishore, T.S.; Patro, E.R.; Harish, V.S.K.V.; Haghighi, A.T. A Comprehensive Study on the Recent Progress and Trends in Development of Small Hydropower Projects. Energies 2021, 14, 2882. [Google Scholar] [CrossRef]
- Cavazzini, G.; Santolin, A.; Pavesi, G.; Ardizzon, G. Accurate estimation model for small and micro hydropower plants costs in hybrid energy systems modelling. Energy 2016, 103, 746–757. [Google Scholar] [CrossRef]
- Carapellucci, R.; Giordano, L.; Pierguidi, F. Techno-economic evaluation of small-hydro power plants: Modelling and characterisation of the Abruzzo region in Italy. Renew. Energy 2015, 75, 395–406. [Google Scholar] [CrossRef]
- Zema, D.A.; Nicotra, A.; Tamburino, V.; Zimbone, S.M. A simple method to evaluate the technical and economic feasibility of micro hydro power plants in existing irrigation systems. Renew. Energy 2016, 85, 498–506. [Google Scholar] [CrossRef]
- Raimondi, A.; Bettoni, F.; Bianchi, A.; Becciu, G. Economic Sustainability of Small-Scale Hydroelectric Plants on a National Scale—The Italian Case Study. Water 2021, 13, 1170. [Google Scholar] [CrossRef]
- Balkhair, K.S.; Rahman, K.U. Sustainable and economical small-scale and low-head hydropower generation: A promising alternative potential solution for energy generation at local and regional scale. Appl. Energy 2017, 188, 378–391. [Google Scholar] [CrossRef]
- Filho, G.L.T.; dos Santos, I.F.S.; Barros, R.M. Cost estimate of small hydroelectric power plants based on the aspect factor. Renew. Sustain. Energy Rev. 2017, 77, 229–238. [Google Scholar] [CrossRef]
- Rahi, O.P.; Kumar, A. Economic analysis for refurbishment and uprating of hydro power plants. Renew. Energy 2016, 86, 1197–1204. [Google Scholar] [CrossRef]
- Quaranta, E.; Aggidis, G.; Boes, R.M.; Comoglio, C.; De Michele, C.; Patro, E.R.; Georgievskaia, E.; Harby, A.; Kougias, I.; Muntean, S.; et al. Assessing the energy potential of modernizing the European hydropower fleet. Energy Convers. Manag. 2021, 246, 114655. [Google Scholar] [CrossRef]
- Patro, E.R.; Voltz, T.J.; Kumar, A.; Grischek, T. Micro-hydropower in drinking water gravity pipelines: A case study in Uttarakhand, India. ISH J. Hydraul. Eng. 2018, 26, 332–342. [Google Scholar] [CrossRef]
- Mishra, S.; Singal, S.K.; Khatod, D.K. A review on electromechanical equipment applicable to small hydropower plants. Int. J. Energy Res. 2012, 36, 553–571. [Google Scholar] [CrossRef]
- Rahman, S.M.; Larson, D.F.; Dinar, A. Costs of greenhouse gas emissions abatement under the clean development mechanism. Clim. Chang. Econ. 2015, 6, 1550005. [Google Scholar] [CrossRef]
- GIZ. Carbon Market Roadmap for India Looking Back on CDM and Looking Ahead; German Development Cooperation: New Delhi, India, 2020; Available online: https://www.giz.de/en/worldwide/368.html (accessed on 1 December 2021).
- CEA. CDM—CO2 Baseline Database; Central Electricity Authority: New Delhi, India, 2019; Available online: https://cea.nic.in/cdm-co2-baseline-database/?lang=en (accessed on 1 December 2021).
- International Energy Agency India. 2020: Energy Policy Review; IEA: France, Paris, 2020; Available online: https://www.iea.org/events/india-energy-policy-review-2020 (accessed on 1 December 2021).
- Liu, D.; Liu, H.; Wang, X.; Kremere, E. World Small Hydropower Development Report 2019; United Nations Industrial Development Organization: Vienna, Austria, 2019; Available online: https://www.unido.org/our-focus-safeguarding-environment-clean-energy-access-productive-use-renewable-energy-focus-areas-small-hydro-power/world-small-hydropower-development-report (accessed on 1 December 2021).
- Rahman, S.M.; Spalding-Fecher, R.; Haites, E.; Kirkman, G.A. The levelized costs of electricity generation by the CDM power projects. Energy 2018, 148, 235–246. [Google Scholar] [CrossRef]
- Singal, S.K.; Saini, R.P.; Raghuvanshi, C.S. Analysis for cost estimation of low head run-of-river small hydropower schemes. Energy Sustain. Dev. 2010, 14, 117–126. [Google Scholar] [CrossRef]
- Singal, S.K.; Saini, R.P. Cost analysis of low-head dam-toe small hydropower plants based on number of generating units. Energy Sustain. Dev. 2008, 12, 55–60. [Google Scholar] [CrossRef]
- Singal, S.K.; Saini, R.P. Analytical approach for development of correlations for cost of canal-based SHP schemes. Renew. Energy 2008, 33, 2549–2558. [Google Scholar] [CrossRef]
- Mishra, S.; Singal, S.K.; Khatod, D.K. Cost Optimization of High Head Run of River Small Hydropower Projects. In Application of Geographical Information Systems and Soft Computation Techniques in Water and Water Based Renewable Energy Problems; Springer: Singapore, 2018; pp. 141–166. [Google Scholar] [CrossRef]
- Singh, V.K.; Singal, S.K. Operation of hydro power plants-a review. Renew. Sustain. Energy Rev. 2017, 69, 610–619. [Google Scholar] [CrossRef]
- Department of Hydro and Renewable Energy. Standards/Manuals/Guidelines for Small Hydro Development; Roorkee: Uttarakhand, India, 2014; Available online: https://www.iitr.ac.in/departments/HRE/pages/Publications+Standard_and_Guidelines.html (accessed on 1 December 2021).
- Lal, S.R.S.; Herbert, G.M.J.; Arjunan, P.; Suryan, A. Advancements in renewable energy transition in India: A review. In Energy Sources, Part A: Recovery, Utilization, and Environmental Effects; Taylor & Francis: Abingdon, UK, 2022; pp. 1–31. [Google Scholar] [CrossRef]
- Kumar, K.; Saini, R.P. A review on operation and maintenance of hydropower plants. Sustain. Energy Technol. Assess. 2022, 49, 101704. [Google Scholar] [CrossRef]
- Fonseca, M.; Bezerra, U.H.; Leite, J.C.; Rodríguez, J.L.M. Maintenance Tools applied to Electric Generators to Improve Energy Efficiency and Power Quality of Thermoelectric Power Plants. Energies 2017, 10, 1091. [Google Scholar] [CrossRef] [Green Version]
- Vera-García, F.; Rubio, J.A.P.; Grau, J.H.; Hernández, D.A. Improvements of a Failure Database for Marine Diesel Engines Using the RCM and Simulations. Energies 2019, 13, 104. [Google Scholar] [CrossRef] [Green Version]
Figure 1.
Variation of AEP and CER with PLF.

Figure 2.
Cost of civil works vs. electro-mechanical components for low head SHP.

Figure 3.
Cost of civil works vs. electro-mechanical components for 2000 kW plant.

Figure 4.
Variation of IC vs. LCC w.r.t head for 2000 kW plant.

Figure 5.
Variation of IC vs. LCC w.r.t head for 2000 kW plant.

Figure 6.
Variation of LCOE w.r.t capacity for low head SHP schemes.

Figure 7.
Variation of LCOE w.r.t head for 2000 kW high head SHP schemes.


Table 1.
Various components of SHP plants.
| SHP Type → Components ↓ | Run of River SHP | Dam Toe SHP | Canal-Based SHP |
|---|---|---|---|
| Civil Works Components | Powerhouse building, diversion weir, power channel, desilting chamber, intake channel, forebay, penstock, spillway, tail race | Power house building, intake, penstock, tail race | Power house building, spillway, diversion weir |
| Electro-mechanical Components | Turbine with governing system; switch gear, generator with excitation system, control and protection equipment; mechanical and electrical auxiliaries; switchyard and main transformer equipment. | ||
Table 2.
CDM potential of SHP projects in India.
| S.No. | States/UTs | Small Hydro Power | Installed (MW) | To Be Exploited (MW) | CEF | AEP (TWh) | Estimated CDM Potential (Million CER/Year) | Estimated Revenue (Million INR) |
|---|---|---|---|---|---|---|---|---|
| 1 | Andhra Pradesh | 409.32 | 162.11 | 247.21 | 0.86 | 1.30 | 1.12 | 81.57 |
| 2 | Arunachal Pradesh | 2064.92 | 131.11 | 1933.81 | 0.42 | 10.16 | 4.27 | 311.63 |
| 3 | Assam | 201.99 | 34.11 | 167.88 | 0.42 | 0.88 | 0.37 | 27.05 |
| 4 | Bihar | 526.98 | 70.70 | 456.28 | 1.05 | 2.40 | 2.52 | 183.82 |
| 5 | Chhattisgarh | 1098.20 | 76.00 | 1022.20 | 0.81 | 5.37 | 4.35 | 317.69 |
| 6 | Goa | 4.70 | 0.05 | 4.65 | 0.85 | 0.02 | 0.02 | 1.52 |
| 7 | Gujarat | 201.97 | 68.95 | 133.02 | 0.81 | 0.70 | 0.57 | 41.34 |
| 8 | Haryana | 107.40 | 73.50 | 33.90 | 0.80 | 0.18 | 0.14 | 10.41 |
| 9 | Himachal Pradesh | 3460.34 | 911.51 | 2548.83 | 0.80 | 13.40 | 10.72 | 782.36 |
| 10 | Jammu and Kashmir | 1707.45 | 180.48 | 1526.97 | 0.80 | 8.03 | 6.42 | 468.70 |
| 11 | Jharkhand | 227.96 | 4.05 | 223.91 | 1.05 | 1.18 | 1.24 | 90.21 |
| 12 | Karnataka | 3726.49 | 1280.73 | 2445.76 | 0.86 | 12.85 | 11.06 | 807.03 |
| 13 | Kerala | 647.15 | 222.02 | 425.13 | 0.86 | 2.23 | 1.92 | 140.28 |
| 14 | Madhya Pradesh | 820.44 | 95.91 | 724.53 | 0.81 | 3.81 | 3.08 | 225.17 |
| 15 | Maharashtra | 786.46 | 379.58 | 406.88 | 0.81 | 2.14 | 1.73 | 126.45 |
| 16 | Manipur | 99.95 | 5.45 | 94.50 | 0.42 | 0.50 | 0.21 | 15.23 |
| 17 | Meghalaya | 230.05 | 32.53 | 197.52 | 0.42 | 1.04 | 0.44 | 31.83 |
| 18 | Mizoram | 168.90 | 36.47 | 132.43 | 0.42 | 0.70 | 0.29 | 21.34 |
| 19 | Nagaland | 182.18 | 30.67 | 151.51 | 0.42 | 0.80 | 0.33 | 24.42 |
| 20 | Odisha | 286.22 | 64.63 | 221.59 | 1.05 | 1.16 | 1.22 | 89.27 |
| 21 | Punjab | 578.28 | 173.55 | 404.73 | 0.80 | 2.13 | 1.70 | 124.23 |
| 22 | Rajasthan | 51.67 | 23.85 | 27.82 | 0.80 | 0.15 | 0.12 | 8.54 |
| 23 | Sikkim | 266.64 | 52.11 | 214.53 | 0.42 | 1.13 | 0.47 | 34.57 |
| 24 | Tamil Nadu | 604.46 | 123.05 | 481.41 | 0.86 | 2.53 | 2.18 | 158.85 |
| 25 | Telangana | 102.25 | 90.87 | 11.38 | 0.86 | 0.06 | 0.05 | 3.76 |
| 26 | Tripura | 46.86 | 16.01 | 30.85 | 0.42 | 0.16 | 0.07 | 4.97 |
| 27 | Uttar Pradesh | 460.75 | 25.10 | 435.65 | 0.80 | 2.29 | 1.83 | 133.72 |
| 28 | Uttarakhand | 1664.31 | 214.32 | 1449.99 | 0.8. | 7.62 | 0.00 | 0.00 |
| 29 | West Bengal | 392.06 | 98.50 | 293.56 | 1.05 | 1.54 | 1.62 | 118.27 |
| 30 | Andaman and Nicobar | 7.27 | 5.25 | 2.02 | 0.85 | 0.01 | 0.01 | 0.66 |
| Total | 21,133.62 | 4683.17 | 16,450.45 | 21.60 | 86.46 | 60.07 | 4384.90 | |
Table 3.
Correlation for cost component of low-head SHPs.
| Components → SHP Type ↓ | Civil Works Components | Electromechanical Components |
|---|---|---|
| Run of River SHP | CPHB = 92,615 P−0.2351 H−0.0585 CDW&I = 12,415 P−0.2368 H−0.0597 CPC = 85,383 P−0.3811 H−0.0307 CDC = 20,700 P−0.2385 H−0.0611 CF&S = 25,402 P−0.2356 H−0.0589 CP = 7875 P−0.3806 H0.3804 CTR = 28,164 P−0.376 H−0.624 | CTG = 63,346 P−0.1913 H−0.2171 CGE = 78,661 P−0.1855 H−0.2083 CAUX = 40,860 P−0.1892 H−0.2118 CT&SY = 18,739 P−0.1803 H−0.2075 |
| Dam Toe SHP | CI = 17,940 P−0.2366 H−0.0596 CP = 7875 P−0.3806 H0.3804 CPHB = 85,717 P−0.2355 H−0.0588 CTR = 28,164 P−0.376 H−0.624 | CTG = 66,282 P−0.1866 H−0.2094 CGE = 79,927 P−0.1854 H−0.2097 CAUX = 39,372 P−0.1865 H−0.2107 CT&SY = 18,739 P−0.1803 H−0.2075 |
| Canal-based SHP | CPHB = 105,555 P−0.238 H−0.0602 CS = 36,778 P−0.2306 H−0.0644 CDW = 9909 P−0.2295 H−0.0623 | CTG = 63,346 P−0.1913 H−0.2171 CGE = 78,661 P−0.1855 H−0.2083 CAUX = 40,860 P−0.1892 H−0.2118 CT&SY = 18,739 P−0.1803 H−0.2075 |
Table 4.
Economic assumptions for LCC calculations.
| Real Discount Rate | 8% |
| Plant life | 50 years |
| Annual O&M cost | 1.5% |
| Turbine generator rehabilitation time | 25 years |
| Generator exciter rehabilitation time | 25 years |
| Auxiliary equipment rehabilitation time | 10 years |
| Transformer rehabilitation time | 30 years |
| Depreciation tax shield factor | 0.35 |
| Turbine efficiency | 85% |
| Generator efficiency | 90% |
| Annual plant load factor | 36% |
| Average CER cost | 2$ |
| 1 USD | 75 INR |
| The benchmarked sale price of electricity | 5 INR/kWh |
Table 5.
LCOE values for low head SHP plants with and without CER.
| Plant | Capacity (kW) | Head (m) | CCIV | CEM | CSHP | IC | OMC | RC | CER | LCC | LCOE | ||
|---|---|---|---|---|---|---|---|---|---|---|---|---|---|
| Without CER | With CER | Without CER | With CER | ||||||||||
| Run-off-River SHP | 3000 | 3 | 26,891 | 35,599 | 70,613 | 494,293 | 706 | 4265 | 9228 | 499,264 | 490,036 | 4.14 | 4.06 |
| 5000 | 10 | 22,288 | 25,074 | 53,519 | 374,631 | 535 | 3003 | 9228 | 378,170 | 368,942 | 3.14 | 3.06 | |
| 7000 | 20 | 19,911 | 20,330 | 45,472 | 318,306 | 455 | 2435 | 9228 | 321,195 | 311,968 | 2.66 | 2.59 | |
| Dam Toe SHP | 3000 | 3 | 15,989 | 36,812 | 59,665 | 417,656 | 597 | 4263 | 9228 | 422,516 | 413,288 | 3.50 | 3.43 |
| 5000 | 10 | 13,169 | 26,017 | 44,280 | 309,960 | 443 | 3011 | 9228 | 313,414 | 304,186 | 2.60 | 2.52 | |
| 7000 | 20 | 11,784 | 21,137 | 37,201 | 260,405 | 372 | 2446 | 9228 | 263,223 | 253,995 | 2.18 | 2.11 | |
| Canal-Based SHP | 3000 | 3 | 19,131 | 32,348 | 58,171 | 407,199 | 582 | 3777 | 9228 | 411,558 | 402,330 | 3.41 | 3.34 |
| 5000 | 10 | 17,021 | 24,231 | 46,615 | 326,305 | 466 | 2829 | 9228 | 329,600 | 320,372 | 2.73 | 2.66 | |
| 7000 | 20 | 16,312 | 20,926 | 42,079 | 294,553 | 421 | 2443 | 9228 | 297,417 | 288,189 | 2.47 | 2.39 | |
Table 6.
LCOE values of high head SHP Plants with and without CER.
| Capacity (kW) | Head (m) | CCIV | CEM | CSHP | IC | OMC | RC | CER | LCC | LCOE | ||
|---|---|---|---|---|---|---|---|---|---|---|---|---|
| Without CER | With CER | Without CER | With CER | |||||||||
| 2000 | 100 | 38,485 | 34,234 | 82,172 | 575,207 | 822 | 3115 | 10,253 | 579,144 | 568,891 | 4.8 | 4.72 |
| 2000 | 200 | 233,449 | 28,984 | 296,549 | 2,075,845 | 2965 | 2638 | 10,253 | 2,081,448 | 2,071,195 | 17.26 | 17.17 |
| 2000 | 300 | 119,545 | 22,205 | 160,178 | 1,121,243 | 1602 | 2021 | 10,253 | 1,124,865 | 1,114,612 | 9.33 | 9.24 |
| 2000 | 400 | 76,310 | 20,917 | 109,867 | 769,067 | 1099 | 1903 | 10,253 | 772,069 | 761,816 | 6.4 | 6.32 |
| 2000 | 500 | 54,774 | 20,107 | 84,616 | 592,313 | 846 | 1830 | 10,253 | 594,989 | 584,736 | 4.93 | 4.85 |
| 2000 | 600 | 42,283 | 19,576 | 69,902 | 489,311 | 699 | 1781 | 10,253 | 491,792 | 481,538 | 4.08 | 3.99 |
| 2000 | 700 | 34,291 | 19,225 | 60,474 | 423,319 | 605 | 1749 | 10,253 | 425,673 | 415,420 | 3.53 | 3.44 |
| 2000 | 800 | 28,816 | 19,001 | 54,033 | 378,234 | 540 | 1729 | 10,253 | 380,503 | 370,250 | 3.15 | 3.07 |
| 2000 | 900 | 24,868 | 18,866 | 49,419 | 345,936 | 494 | 1717 | 10,253 | 348,147 | 337,894 | 2.89 | 2.80 |
| 2000 | 1000 | 21,186 | 18,797 | 45,181 | 316,268 | 452 | 1711 | 10,253 | 318,430 | 308,177 | 2.64 | 2.55 |
Publisher’s Note: MDPI stays neutral with regard to jurisdictional claims in published maps and institutional affiliations. |
© 2022 by the authors. Licensee MDPI, Basel, Switzerland. This article is an open access article distributed under the terms and conditions of the Creative Commons Attribution (CC BY) license (https://creativecommons.org/licenses/by/4.0/).
Share and Cite
MDPI and ACS Style
Patro, E.R.; Kishore, T.S.; Haghighi, A.T. Levelized Cost of Electricity Generation by Small Hydropower Projects under Clean Development Mechanism in India. Energies 2022, 15, 1473. https://0-doi-org.brum.beds.ac.uk/10.3390/en15041473
AMA Style
Patro ER, Kishore TS, Haghighi AT. Levelized Cost of Electricity Generation by Small Hydropower Projects under Clean Development Mechanism in India. Energies. 2022; 15(4):1473. https://0-doi-org.brum.beds.ac.uk/10.3390/en15041473
Chicago/Turabian StylePatro, Epari Ritesh, Teegala Srinivasa Kishore, and Ali Torabi Haghighi. 2022. "Levelized Cost of Electricity Generation by Small Hydropower Projects under Clean Development Mechanism in India" Energies 15, no. 4: 1473. https://0-doi-org.brum.beds.ac.uk/10.3390/en15041473
Note that from the first issue of 2016, this journal uses article numbers instead of page numbers. See further details here.