
Premises for the Future Deployment of Automated and Connected Transport in Romania Considering Citizens’ Perceptions and Attitudes towards Automated Vehicles


Abstract
:
1. Introduction
Objectives of the Paper
2. Materials and Methods
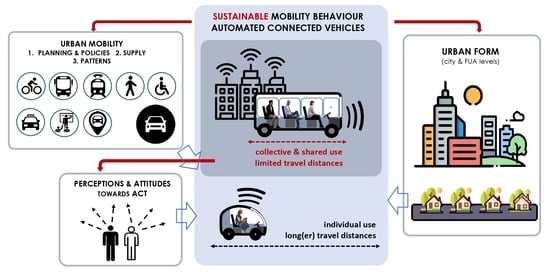
2.1. Conceptual Assumptions
2.2. Description of the Survey, Variables, Measurement Scale, and Data Processing Tool
3. Results
3.1. Results from Analysis of the Strategic Framework for Transport and Mobility Planning in Romania
3.2. Results from Analysis of Spatial Development and Urban Mobility Patterns of the Large Cities in Romania
3.3. Understanding Perceptions and Attitudes on AVs at South-Eastern European Level
3.4. Results from Analysis of the Survey Results
- -
- ρ = +1 indicates a perfect rank association;
- -
- ρ 0 indicates no association between ranks, and the closer ρ is to zero, the weaker the association between the ranks;
- -
- ρ = −1 indicates a perfect negative rank association.
4. Discussion, Conclusions, and Recommendations
4.1. Assumption Assessment and Discussion
4.2. Conclusions and Recommendations towards ACT Deployment in Romanian Cities
Author Contributions
Funding
Institutional Review Board Statement
Informed Consent Statement
Data Availability Statement
Acknowledgments
Conflicts of Interest
References
- Banister, D. The Sustainable Mobility Paradigm. Transp. Policy 2008, 15, 73–80. [Google Scholar] [CrossRef]
- Banister, D.; Pucher, J.; Lee-Gosselin, M. Making Sustainable Transport Politically and Publicly Acceptable: Lessons from the EU, USA and Canada; Edward Elgar Publishing: Cheltenham, UK, 2007; pp. 17–50. [Google Scholar]
- Negulescu, M.H. Mobilitate Și Formă Urbană—Aspecte Teoretice; Editura Universitară „Ion Mincu”: Bucharest, Romania, 2011; ISBN 978-606-638-004-1. [Google Scholar]
- Duany, A.; Plater-Zyberk, E.; Speck, J. Suburban Nation: The Rise of Sprawl and the Decline of the American Dream; North Point Press: Albany, CA, USA, 2000. [Google Scholar]
- Banister, D.; Hickman, R. How to Design a More Sustainable and Fairer Built Environment: Transport and Communications. IEE Proc. Intell. Transp. Syst. 2006, 153, 276–291. [Google Scholar] [CrossRef]
- Banister, D. The Sustainable Mobility Paradigm +10. In Transport Policy; Transport Studies Unit, School of Geography and the Environment, Oxford University: Oxford, UK, 2018; Volume 15, pp. 73–80. [Google Scholar]
- Jacobs, J. The Death and Life of Great American Cities; Reissue Edition; Vintage: New York, NY, USA, 1992; ISBN 978-0-679-74195-4. [Google Scholar]
- Gehl, J.; Rogers, L.R. Cities for People; Illustrated Edition.; Island Press: Washington, DC, USA, 2010; ISBN 978-1-59726-573-7. [Google Scholar]
- Duany, A.; Speck, J.; Lydon, M. The Smart Growth Manual, 1st ed.; McGraw Hill: New York, NY, USA, 2009; ISBN 978-0-07-137675-4. [Google Scholar]
- European Commission. Communication from the Commission to The European Parliament, The Council, The European Economic and Social Committee and The Committee of The Regions: Sustainable and Smart Mobility Strategy—Putting European Transport on Track for the Future {SWD(2020) 331 Final}. Available online: https://eur-lex.europa.eu/legal-content/EN/TXT/HTML/?uri=CELEX:52020DC0789&from=EN (accessed on 14 February 2022).
- Negulescu, M.H. RevistaInfrastructura de Transport şi Mobilitate în Bucureşti/Infrastructure of Transports and Mobility/Infrastructure de Transport et Mobilité; URBANISMUL: Bucharest, Romania, 2014; p. 169. [Google Scholar]
- Negulescu, M.H. Practica Urbanistică de Remodelare Sustenabilă a Mobilităţii; Editura Universitară” Ion Mincu”: Bucharest, Romania, 2011. [Google Scholar]
- Negulescu, M.H. Considerations on the Management of Accessibility Improvement Impact on Land Use. JULP 2018, 3, 37–50. [Google Scholar] [CrossRef]
- Polydoropoulou, A.; Tsouros, I.; Thomopoulos, N.; Pronello, C.; Elvarsson, A.; Sigþórsson, H.; Dadashzadeh, N.; Stojmenova, K.; Sodnik, J.; Neophytou, S.; et al. Who Is Willing to Share Their AV? Insights about Gender Differences among Seven Countries. Sustainability 2021, 13, 4769. [Google Scholar] [CrossRef]
- Create—Home. Available online: http://www.create-mobility.eu/ (accessed on 21 January 2022).
- LEGE 350 06/07/2001—Portal Legislativ. Available online: http://legislatie.just.ro/Public/DetaliiDocument/29453 (accessed on 29 November 2021).
- Ministerul Transporturilor Master Planul General de Transport. Available online: http://www.mt.gov.ro/web14/strategia-in-transporturi/master-plan-general-transport (accessed on 15 February 2022).
- Ministerul Transporturilor. Strategia Pentru Transport Durabil pe Perioada 2007–2013 şi 2020, 2030. Available online: http://www.mt.gov.ro/web14/documente/strategie/strategii_sectoriale/strategie_dezvoltare_durabila_noua_ultima_forma.pdf (accessed on 27 January 2022).
- Ministerul Transporturilor si Infrastructurii Strategia de Transport Intermodal in Romania. Available online: http://mt.gov.ro/web14/documente/strategie/strategii_sectoriale/strategie_de_transport_intermodal_text.pdf (accessed on 27 January 2022).
- Ministerul Transporturilor, Infrastructurii si COmunicatiilor Strategia de Dezvoltare a Infrastructurii Feroviare. Available online: http://www.cfr.ro/index.php/ct-menu-item-3/ct-menu-item-55/strategia-de-dezvoltare-a-infrastructurii-feroviare (accessed on 27 January 2022).
- Iași Smart City. Available online: https://iasismartcity.ro/ (accessed on 27 January 2022).
- Strategia Smart City a Municipiului Pitești—Primăria Municipiului Pitești. Available online: https://www.primariapitesti.ro/strategia-smart-city-a-municipiului-piteti-p177 (accessed on 27 January 2022).
- Strategie Smart City 2021–2027. Available online: https://primariacalarasi.ro/index.php/directiile-primariei/directia-programe-si-dezvoltare-locala/strategie-smart-city (accessed on 15 February 2022).
- Stanilov, K. The restructuring of non-residential uses in the post-socialist metropolis. In The Post-Socialist City: Urban Form and Space Transformations in Central and Eastern Europe after Socialism; Stanilov, K., Ed.; The GeoJournal Library; Springer: Dordrecht, The Netherlands, 2007; pp. 73–99. ISBN 978-1-4020-6053-3. [Google Scholar]
- Bouzarovski, S.; Stanilov, K.; Sýkora, L. (Eds.) Confronting Suburbanization: Urban Decentralization in Postsocialist Central and Eastern Europe. Chichester: Wiley Blackwell. Int. J. Urban Reg. Res. 2016, 40, 249–251. [Google Scholar] [CrossRef]
- Cavoli, C.; Phillips, B.; Cohen, T.; Jones, P. Social and Behavioural Questions Associated with Automated Vehicles: A Literature Review; UCL Transport Institute: London, UK, 2017. [Google Scholar]
- Taubenböck, H.; Gerten, C.; Rusche, K.; Siedentop, S.; Wurm, M. Patterns of Eastern European Urbanisation in the Mirror of Western Trends—Convergent, Unique or Hybrid? Environ. Plan. B: Urban Anal. City Sci. 2019, 46, 1206–1225. [Google Scholar] [CrossRef] [Green Version]
- Nikitas, A.; Thomopoulos, N.; Milakis, D. The Environmental and Resource Dimensions of Automated Transport: A Nexus for Enabling Vehicle Automation to Support Sustainable Urban Mobility. Annu. Rev. Environ. Resour. 2021, 46, 167–192. [Google Scholar] [CrossRef]
- Emberger, G.; Pfaffenbichler, P. A Quantitative Analysis of Potential Impacts of Automated Vehicles in Austria Using a Dynamic Integrated Land Use and Transport Interaction Model. Transp. Policy 2020, 98, 57–67. [Google Scholar] [CrossRef]
- Conlon, J.; Lin, J. Greenhouse Gas Emission Impact of Autonomous Vehicle Introduction in an Urban Network. Transp. Res. Rec. 2019, 2673, 142–152. [Google Scholar] [CrossRef]
- Luca, O.; Sercaianu, M. Mobility Management in European Projects. Lessons Learned for Romania. Theor. Empir. Res. Urban Manag. 2011, 6, 54–66. [Google Scholar]
- Pojani, E.; van Acker, V.; Pojani, D. Cars as a Status Symbol: Youth Attitudes toward Sustainable Transport in a Post-Socialist City. Transp. Res. Part F Traffic Psychol. Behav. 2018, 58, 210–227. [Google Scholar] [CrossRef]
- The Future of Mobility 3.0. Arthur D. Little. Available online: http://www.adlittle.com/en/insights/viewpoints/future-mobility-30 (accessed on 21 January 2022).
- González-González, E.; Nogués, S.; Stead, D. Automated Vehicles and the City of Tomorrow: A Backcasting Approach. Cities 2019, 94, 153–160. [Google Scholar] [CrossRef] [Green Version]
- Nikitas, A.; Michalakopoulou, K.; Njoya, E.T.; Karampatzakis, D. Artificial Intelligence, Transport and the Smart City: Definitions and Dimensions of a New Mobility Era. Sustainability 2020, 12, 2789. [Google Scholar] [CrossRef] [Green Version]
- Stoma, M.; Dudziak, A.; Caban, J.; Droździel, P. The Future of Autonomous Vehicles in the Opinion of Automotive Market Users. Energies 2021, 14, 4777. [Google Scholar] [CrossRef]
- Schoettle, B.; Sivak, M. Public Opinion about Self-Driving Vehicles in China, India, Japan, the U.S., the U.K., and Australia; University of Michigan: Ann Arbor, MI, USA, 2014. [Google Scholar]
- Kyriakidis, M.; Happee, R.; de Winter, J.C.F. Public Opinion on Automated Driving: Results of an International Questionnaire among 5000 Respondents. Transp. Res. Part F: Traffic Psychol. Behav. 2015, 32, 127–140. [Google Scholar] [CrossRef]
- Rezaei, A.; Caulfield, B. Examining Public Acceptance of Autonomous Mobility. Travel Behav. Soc. 2020, 21, 235–246. [Google Scholar] [CrossRef]
- Ahmed, S.S.; Pantangi, S.S.; Eker, U.; Fountas, G.; Still, S.E.; Anastasopoulos, P.C. Analysis of Safety Benefits and Security Concerns from the Use of Autonomous Vehicles: A Grouped Random Parameters Bivariate Probit Approach with Heterogeneity in Means. Anal. Methods Accid. Res. 2020, 28, 100134. [Google Scholar] [CrossRef]
- Butler, L.; Yigitcanlar, T.; Paz, A. Factors Influencing Public Awareness of Autonomous Vehicles: Empirical Evidence from Brisbane. Transp. Res. Part F: Traffic Psychol. Behav. 2021, 82, 256–267. [Google Scholar] [CrossRef]
- Kolarova, V.; Cherchi, E. Impact of Trust and Travel Experiences on the Value of Travel Time Savings for Autonomous Driving. Transp. Res. Part C: Emerg. Technol. 2021, 131, 103354. [Google Scholar] [CrossRef]
- Chng, S.; Anowar, S.; Cheah, L. To Embrace or Not to Embrace? Understanding Public’s Dilemma about Autonomous Mobility Services: A Case Study of Singapore. Case Stud. Transp. Policy 2021, 9, 1542–1552. [Google Scholar] [CrossRef]
- Etzioni, S.; Hamadneh, J.; Elvarsson, A.B.; Esztergár-Kiss, D.; Djukanovic, M.; Neophytou, S.N.; Sodnik, J.; Polydoropoulou, A.; Tsouros, I.; Pronello, C.; et al. Modeling Cross-National Differences in Automated Vehicle Acceptance. Sustainability 2020, 12, 9765. [Google Scholar] [CrossRef]
- Kyriakidis, M.; Sodnik, J.; Stojmenova, K.; Elvarsson, A.B.; Pronello, C.; Thomopoulos, N. The Role of Human Operators in Safety Perception of AV Deployment—Insights from a Large European Survey. Sustainability 2020, 12, 9166. [Google Scholar] [CrossRef]
- Dudziak, A.; Stoma, M.; Kuranc, A.; Caban, J. Assessment of Social Acceptance for Autonomous Vehicles in Southeastern Poland. Energies 2021, 14, 5778. [Google Scholar] [CrossRef]
- Cveticanin, L.; Ninkov, I. Pro and contra for self-driving car: Public opinion in Serbia. In Proceedings of the ICONST EST’21: International Conferences On Science And Technology, Budva, Montenegro, 8–10 September 2021; p. 378. [Google Scholar]
- Hamadneh, J.; Esztergár-Kiss, D. The Influence of Introducing Autonomous Vehicles on Conventional Transport Modes and Travel Time. Energies 2021, 14, 4163. [Google Scholar] [CrossRef]
- Bonnefon, J.-F.; Černy, D.; Danaher, J.; Devillier, N.; Johansson, V.; Kovacikova, T.; Martens, M.; Mladenovic, M.; Palade, P.; Reed, N.; et al. Ethics of Connected and Automated Vehicles: Recommendations on Road Safety, Privacy, Fairness, Explainability and Responsibility; Spatial Planning and Transportation Engineering Department of Built Environment: Espoo, Finland, 2020; ISBN 978-92-76-17868-2. [Google Scholar]
- Taiebat, M.; Brown, A.L.; Safford, H.R.; Qu, S.; Xu, M. A Review on Energy, Environmental, and Sustainability Implications of Connected and Automated Vehicles. Environ. Sci. Technol. 2018, 52, acs.est.8b00127. [Google Scholar] [CrossRef]
- Meyer-Waarden, L.; Cloarec, J. “Baby, You Can Drive My Car”: Psychological Antecedents That Drive Consumers’ Adoption of AI-Powered Autonomous Vehicles. Technovation 2021, 109, 102348. [Google Scholar] [CrossRef]
- Maddox, J. Intelligent vehicles + infrastructure to address transportation problems—A strategic approach. In Proceedings of the 24th International Technical Conference on the Enhanced Safety of Vehicles (ESV), Gothemburg, Sweden, 8–11 June 2015; p. 12. [Google Scholar]
- Berrada, J.; Mouhoubi, I.; Christoforou, Z. Factors of Successful Implementation and Diffusion of Services Based on Autonomous Vehicles: Users’ Acceptance and Operators’ Profitability. Res. Transp. Econ. 2020, 83, 100902. [Google Scholar] [CrossRef]
- Da Silva, D.C.; Astroza, S.; Batur, I.; Khoeini, S.; Magassy, T.B.; Pendyala, R.M.; Bhat, C.R. Are Millennials Really All That Different Than Generation X? An Analysis of Factors Contributing to Differences in Vehicle Miles of Travel; Department of Civil, Architectural and Environmental Engineering: Austin, TX, USA, 2019. [Google Scholar]
- Russo, F.; Rindone, C. Regional Transport Plans: From Direction Role Denied to Common Rules Identified. Sustainability 2021, 13, 9052. [Google Scholar] [CrossRef]


| Variable | Description | Scale of Measurement |
|---|---|---|
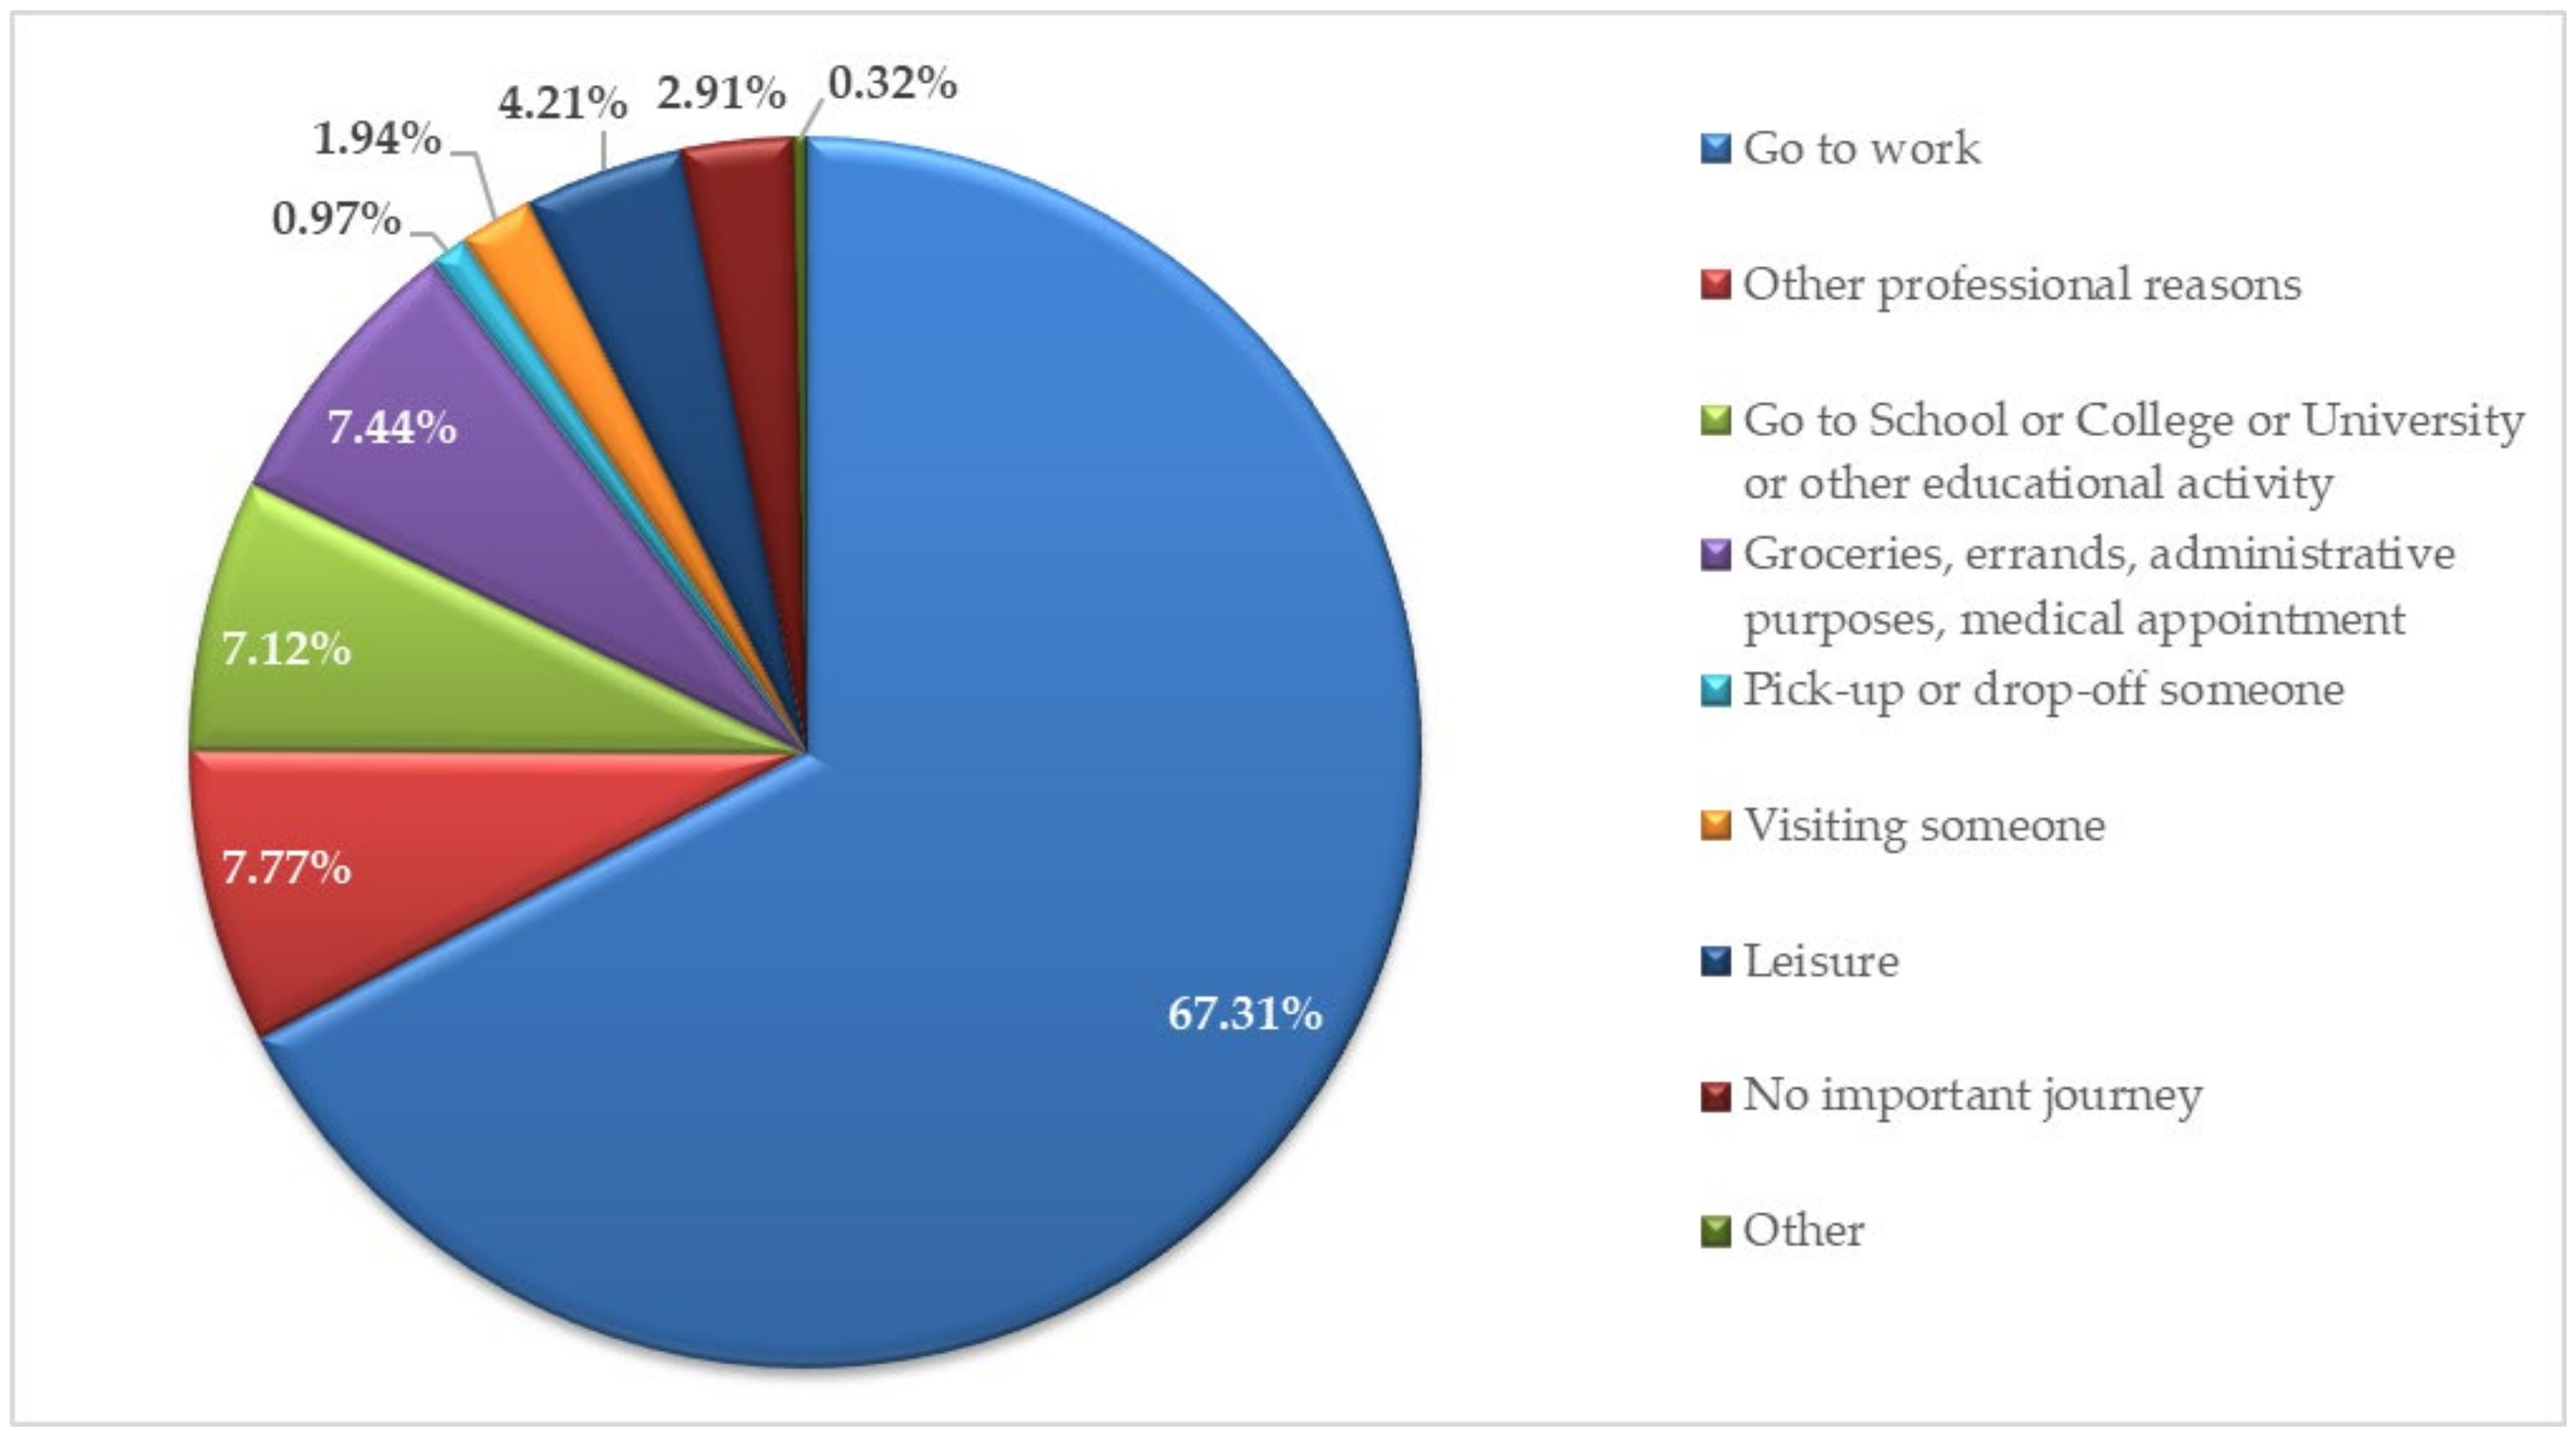
| Current travel behaviour and motivations | What is the purpose of the most important journey of yours? (Going to work or other professional reasons, go to school, college, or university, or to attend another educational activity; to complete groceries, errands, administrative tasks, medical appointments, etc., to pick-up or drop someone off, visiting someone, leisure, or I do not have any important journeys) | Categorical scale (ordinal) |
| What is the main mode of transportation that you use for this important journey? (private car, shared car, public transport, shuttle service to work, private bicycle, motorbike, walking) | Categorical scale (ordinal) | |
| I choose … {the choice of the above question} as my main transport mode because of the... (travel cost, reliability, environmental impacts of my travel, safety, time needed to reach my destination, service frequency, available facilities, available connections with other modes of transportation, travel information availability, personal security, lack of alternatives, privacy) | Continuous scale (Likert scale: 1-total disagreement to 6-total agreement) | |
| Safety-related experience | How many accidents have you been involved in while driving a car in the last 3 years? | Categorical scale (ordinal) |
| Knowledge and use of technology | How often have you used Adaptive Cruise Control when driving a car in the last 12 months? (every day; 4 to 6 days a week; 1 to 3 days a week; about once a fortnight; about once a month; less than once a month; never; I do not have ACC; I do not know what ACC is; I do not drive a car; I prefer not to respond) | Categorical scale (ordinal) |
| Perception and preferences for using (shared) AVs | I would travel in an Autonomous Vehicle (e.g., car, taxi, bus) with (without) the supervision of a human operator in the vehicle (remote) | Continuous scale (Likert scale: 1—total disagreement to 6—total agreement) |
| I would allow my children (under 16) to travel in an AV (e.g., car, taxi, bus) with (without) the supervision of a human operator in the vehicle (remote) | Continuous scale (Likert scale: 1—total disagreement to 6—total agreement) | |
| It is acceptable to travel with other unknown people in an Autonomous Vehicle for: … (myself; my children under 16) | Continuous scale (Likert scale: 1—total disagreement to 6—total agreement) | |
| Willingness to buy an AVs | I would consider purchasing an Autonomous Vehicle … (as soon as they become available; as soon as they become affordable; as soon as I am convinced about their usefulness; as soon as I am convinced about their safety; as soon as I am convinced about their reliability; only after I see them being used by others first) | Continuous scale (Likert scale: 1—total disagreement to 6—total agreement) |
| Perception of benefits/treats related to AVs | Autonomous vehicles will … (Benefits: reduce accidents, reduce traffic congestion, allow the use of travel time for non-driving activities, reduce travel stress, improve mobility options, decrease travel time, reduce greenhouse gas emissions, make travelling more comfortable) | Continuous scale (Likert scale: 1—total disagreement to 6—total agreement) |
| Autonomous vehicles will … (Threats: increase traffic congestion, increase the risk of personal assault or terrorist attacks, increase privacy risks, be a new target for cyber-attacks, reduce the pleasure of driving, reduce our freedom of travel, reduce the need for professional drivers) | Continuous scale (Likert scale: 1—total disagreement to 6—total agreement) |
| Source | Objective | Countries/Responses Analysed | Relevant Findings | Strengths | Limitations |
|---|---|---|---|---|---|
| [14] | Users’ stated choices and preferences regarding the use and the willingness-to-pay for private (PAV) and shared autonomous vehicles (SAV) using a stated preference experiment survey. | Total: 1962 Cyprus—171 Greece—130 Hungary—321 Israel—611 Iceland—535 Finland—100 UK—94 | Differences in behaviour between the southern and northern countries: travelling with women has a positive effect on male respondents in the southern cluster, while both women and men would prefer to avoid riding with one or two men in at least in some countries in the southern cluster. In the northern cluster, women would prefer to avoid riding with one man in an SAV, while men prefer to avoid riding with women or mixed-gendered passengers. Value of Time (VoT) for Shared Automated Vehicle (SAV) is higher than that of Private Automated Vehicles (PAV) for all countries. | Comparing responses in the Northern and Southern cluster (seven countries in Europe) | Heterogeneous samples, mostly attributed to different sampling strategies in the countries in the research |
| [44] | Modelled user acceptance in six different countries and discussing possible implications of AV acceptance as well as the possibility of technology assimilation versus technology rejection in different countries | Total: 1669 Cyprus—158 UK—79, Slovenia—274, Montenegro—321 Hungary—285, and Iceland—552. | Men favour AVs more than women do; men were more willing to purchase AVs and would pay more for them; older individuals may be more hesitant towards AVs and prefer private conventional cars. | Survey in six countries, allowing common conclusions | unavoidable inconsistencies in data collection in different countries. lack of standardization between countries in the collected data, with regard to the socio-demographics of the samples and the sample sizes, likely influencing the comparability of the samples |
| [45] | Users’ anticipation of AV safety and their overall perspective on AVs. | Total 1639: Cyprus—158 Greece—128 Finland—101 Iceland—561 Italy—78 Montenegro—309 Malta—26 Slovenia—278 | Importance of factors other than safety on public acceptance of AVs and potential uptake of the automated technology; factors such as reliability, affordability, cost, driving pleasure, and household size may affect AV uptake; thus, they should not be neglected when designing AV introduction and deployment policies. | Survey applied in eight countries | Most of the survey participants were male, which does not necessarily represent the national gender quota; no children participated in the survey due to the applicable research ethics framework |
| [36,46] | The concept of autonomous vehicles was presented, and the way it was perceived by users of traditional cars was reported. Surveys were carried out on the possibilities of developing AVs in Poland. | 579 people in Poland | AVs will improve road safety and create energy consumption savings. Obstacles to AV deployment include legal liability, ethical issues, privacy concerns, cybersecurity, high costs. Due to many different factors, including costs, legal regulations, and conviction, among others, AVs will not be a common fixture on Polish roads and will likely require a 20-year adaptation period. | Detailed description of automation level; evaluation of barriers to AV deployment | Most of the respondents were men, young people 18–25 years old, with secondary or higher education |
| The basic factors influencing the opinions of the respondents on their social acceptance of AVs, particularly in terms of the advantages and disadvantages of this solution, we identified. | |||||
| [47] | Presents the results of queries in Serbia among a wide portion of the population | Interview with 150 people in Serbia | Acceptance of self-driving vehicles will decrease pollution, reduce, or eliminate parking spaces, will create cybersecurity and privacy issues; and is good for disabled. Most people in Serbia were sceptical of self-driving cars; education and dissemination of knowledge on the topic is necessary. | Use of interviews to allow participants receiving more explanations and ensuring enriched discussions | Small number of people involved; not clear if they are representative for Serbia |
| [48] | Developed a base model to determine the required AV fleet size to fulfil the demands of the different groups of travellers and predicted the new modal shares of the transport modes when AVs appear on the market | 8500 travellers who recorded their daily activity plans in Budapest, Hungary. | Travellers will be exposed to a reduction in travel time once conventional transport modes are replaced by AVs; a decrease in the value of time (VOT) of AVs increases the usage of AVs, and it particularly decreases the usage of cars even more than other transport modes. AVs strongly affect public transport when the VOT of AVs becomes close to the VOT of public transport. One AV can replace 7.85 conventional vehicles with an acceptable waiting time. | Use of three scenarios to determine the impact of AVs on conventional modes of transportation; large group of respondents | Study does not focus on the impact of the AVs on traffic conditions, and it only concerned travel time. The increase in the demand for AVs from specific user groups was not considered, such as individuals with disabilities |
| Socio-Demographic Variables | Frequency | Percent | |
|---|---|---|---|
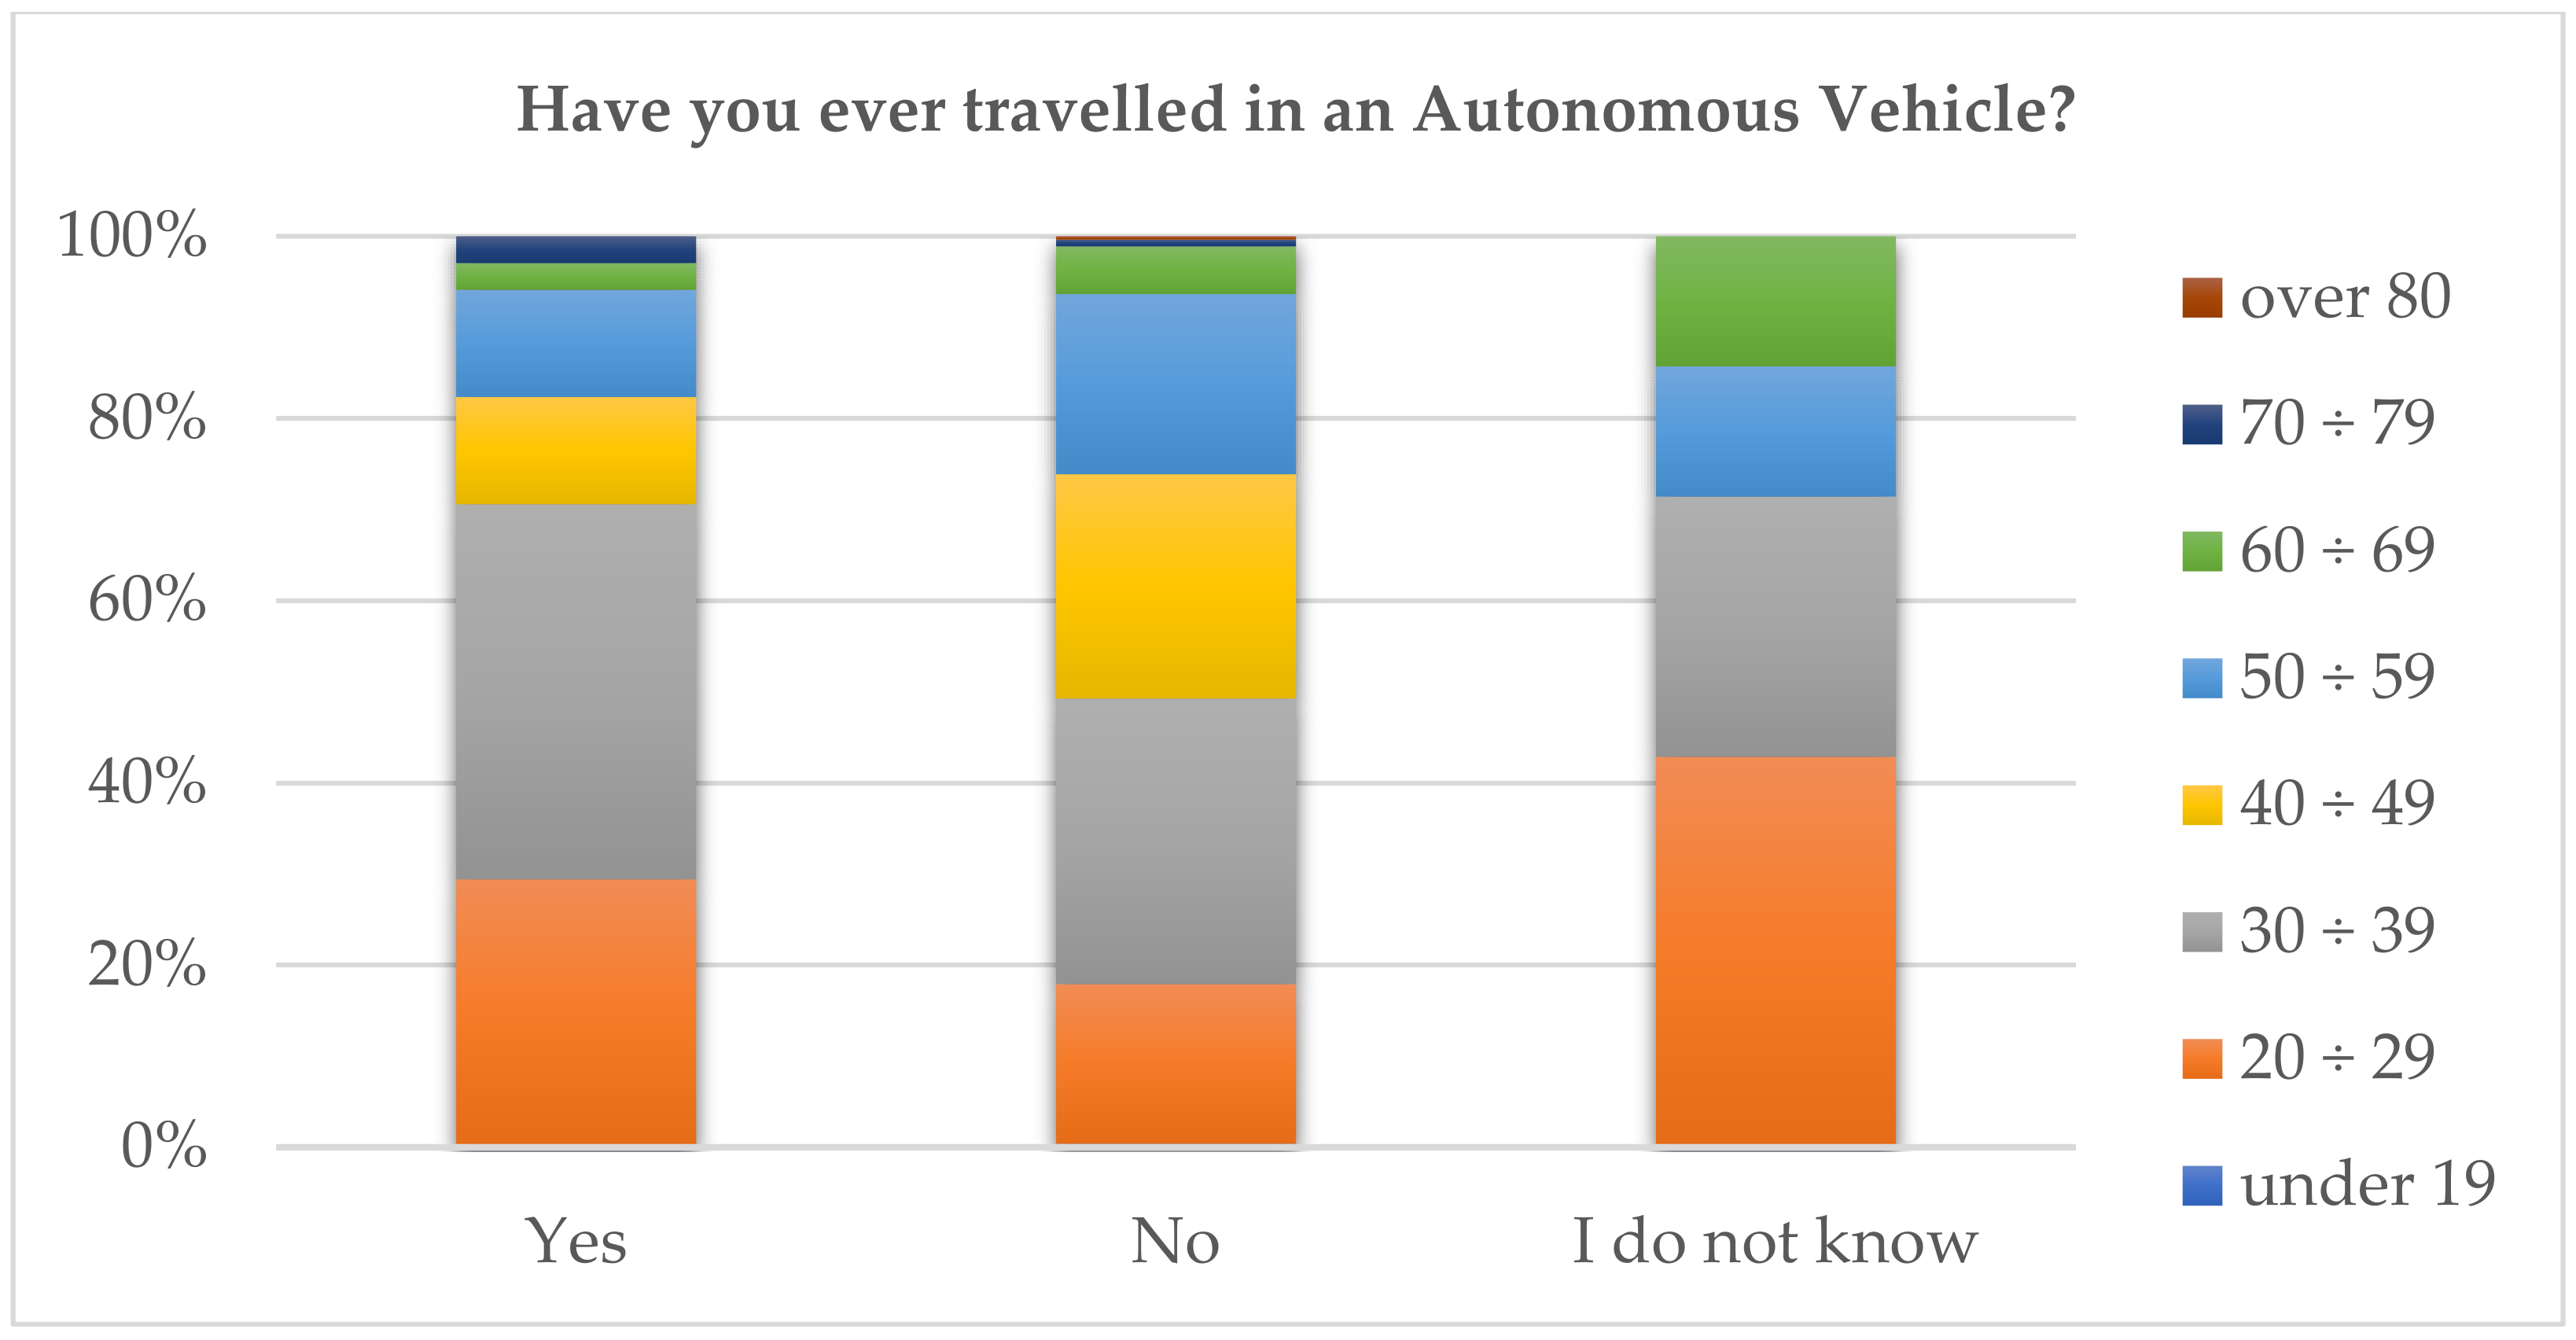
| Age | Under 19 | 1 | 0.3 |
| 20–29 | 60 | 19.4 | |
| 30–39 | 100 | 32.4 | |
| 40–49 | 70 | 22.7 | |
| 50–59 | 58 | 18.8 | |
| 60–69 | 16 | 5.2 | |
| 70–79 | 3 | 1.0 | |
| Over 80 | 1 | 0.3 | |
| Gender | Women | 155 | 50.2 |
| Men | 154 | 49.8 | |
| Highest educational degree | Primary school or equivalent | 1 | 0.3 |
| High school | 30 | 9.7 | |
| College / University | 138 | 44.7 | |
| Postgraduate | 126 | 40.8 | |
| Other | 14 | 4.5 | |
| Current employment status | Employee | 209 | 67.6 |
| Self-employed | 26 | 8.4 | |
| Company owner | 36 | 11.7 | |
| Unemployed | 1 | 0.3 | |
| Retired | 8 | 2.6 | |
| Full-time education | 23 | 7.4 | |
| Other | 6 | 1.9 | |
| Mobility-reducing disabilities | No known disability | 289 | 93.5 |
| Mobility issues | 3 | 1.0 | |
| Visual impairment | 3 | 1.0 | |
| I prefer not to respond | 13 | 4.2 | |
| Other | 1 | 0.3 | |
| Driving license | No | 53 | 17.2 |
| Yes | 256 | 82.8 | |
| No. of cars in the household | 0 | 46 | 14.9 |
| 1 | 141 | 45.6 | |
| 2 | 99 | 32.0 | |
| 3 | 18 | 5.8 | |
| 4 | 4 | 1.3 | |
| 5 | 1 | 0.3 | |
| What Is the Main Mode of Transport You Use for This Important Journey? | |||||||
|---|---|---|---|---|---|---|---|
| Private Car | Shared Car | Public Transport | Shuttle Service to Work | Private Bicycle | Motorbike | Walking | |
| No. of responses | 170 | 3 | 75 | 10 | 9 | 2 | 27 |
| I choose... as my main transport mode because of... | Mean (M) | ||||||
| Travel cost | 2.86 | 5.33 | 4.76 | 5.20 | 4.78 | 3.50 | 4.15 |
| Reliability (e.g., arriving at the expected time) | 5.02 | 4.67 | 3.75 | 4.20 | 5.44 | 6.00 | 5.22 |
| Environmental impacts of my travel (e.g., air pollution) | 2.21 | 2.33 | 4.24 | 4.10 | 5.22 | 5.50 | 5.11 |
| Safety (e.g., travel accidents) | 4.68 | 3.33 | 4.15 | 3.70 | 3.11 | 2.00 | 4.33 |
| Time needed to reach my destination | 5.19 | 4.00 | 4.29 | 4.30 | 5.33 | 6.00 | 4.93 |
| Service frequency | 5.06 | 4.67 | 4.19 | 4.80 | 5.00 | 6.00 | 4.70 |
| Available facilities (e.g., parking slots, seat, Wi-Fi) | 4.31 | 2.67 | 3.03 | 4.20 | 2.89 | 4.50 | 2.67 |
| Available connections with other transport modes | 2.88 | 1.33 | 4.32 | 4.30 | 1.89 | 2.00 | 3.52 |
| Travel information availability | 3.81 | 1.33 | 3.80 | 4.80 | 2.33 | 1.00 | 3.56 |
| My personal security (e.g., risk of assault, aggressive behaviour) | 4.81 | 3.33 | 3.52 | 4.50 | 3.00 | 3.50 | 3.33 |
| Lack of alternatives | 3.99 | 5.33 | 4.27 | 3.60 | 3.00 | 4.50 | 3.19 |
| Privacy options | 4.09 | 2.00 | 3.04 | 3.60 | 2.56 | 6.00 | 3.11 |
| Travel Cost | Reliability | Environmental Impacts of My Travel | Safety | Time Needed to Reach My Destination | Service Frequency | Available Facilities | Available Connections | Travel Information Availability | My Personal Security | Lack of Alternatives | Privacy Options | |
|---|---|---|---|---|---|---|---|---|---|---|---|---|
| Main mode of transport used for the most important journey | 0.422 ** | −0.143 * | 0.591 ** | −0.217 ** | −0.174 ** | −0.171 ** | −0.301 ** | 0.208 ** | −0.043 | −0.372 ** | −0.088 | −0.218 ** |
| Travel in an AV | Gender | Age | Members in the Household who Need Caring Responsibility | Operational Cars in the Household | Use of Adaptive Cruise Control | Transport Mode Used |
|---|---|---|---|---|---|---|
| WITH the supervision of a human operator IN THE VEHICLE | 0.024 | −0.116 * | −0.072 | −0.162 ** | 0.210 ** | 0.140 * |
| WITH the REMOTE supervision of a human operator at a distant location | 0.000 | −0.166 ** | −0.120* | −0.089 | 0.085 | 0.093 |
| WITHOUT the supervision of a human operator | 0.129 * | −0.088 | −0.109 | −0.035 | −0.089 | −0.011 |
| I Would Allow My Children under 16 to Travel in an AV | Age | Members in the Household | Operational Cars in the Household | Transport Mode Used |
|---|---|---|---|---|
| WITH the supervision of a human operator IN THE VEHICLE | −0.114 * | −0.037 | −0.119 * | 0.161 ** |
| WITH the REMOTE supervision of a human at a distant location | −0.184 ** | −0.005 | −0.001 | 0.131 * |
| WITHOUT the supervision of a human operator | −0.079 | −0.141 * | 0.012 | 0.053 |
| I Would Accept to Travel with Other Unknown People in an AV | Gender | Age | Education | Employment Status | Members in the Household | Members in the Household Who Need Caring Responsibility | Disability | Operational Cars in the Household | Use of Adaptive Cruise Control |
|---|---|---|---|---|---|---|---|---|---|
| MYSELF | 0.140 * | −0.190 ** | −0.121 * | 0.133 * | −0.127 * | 0.055 | 0.159 ** | −0.182 ** | 0.175 ** |
| For MY CHILDREN <16 | 0.076 | −0.138 * | −0.062 | 0.043 | −0.229 ** | −0.160 ** | 0.083 | −0.132 * | 0.081 |
| Willingness To Buy an AV | Gender | Age | Education | Members in the Household Who Need Caring Responsibility | Disability | Gross Annual Household Income | Car Accidents in the Last 3 Years | Use of Adaptive Cruise Control |
|---|---|---|---|---|---|---|---|---|
| As soon as they become available | −0.003 | −0.203 ** | −0.083 | −0.084 | −0.111 | −0.131 * | 0.132 * | −0.170 ** |
| As soon as they become affordable | 0.020 | −0.191 ** | 0.000 | −0.070 | −0.199 ** | −0.147 ** | 0.147 ** | −0.145 * |
| As soon as I am convinced about their usefulness | −0.075 | −0.185 ** | −0.015 | −0.072 | −0.182 ** | −0.151 ** | 0.139 * | −0.123 * |
| As soon as I am convinced about their safety | −0.087 | −0.181 ** | −0.027 | −0.096 | −0.202 ** | −0.126 * | 0.083 | −0.043 |
| As soon as I am convinced about their reliability | −0.027 | −0.192 ** | −0.078 | −0.172** | −0.147 ** | −0.133 * | 0.053 | −0.044 |
| Only after I see them being used by others first | −0.127 * | −0.147 ** | −0.172 ** | −0.090 | 0.041 | −0.071 | −0.079 | 0.107 |
| Reduce Accidents | Reduce Traffic Congestion | Allow the Use of Travel Time for Non-Driving Activities | Reduce Travel Stress | Improve Mobility Options | Decrease Travel Time | Reduce Greenhouse Gas Emissions | Make Travelling More Comfortable | |
|---|---|---|---|---|---|---|---|---|
| Gender | 0.083 | 0.168 ** | 0.153 ** | 0.049 | 0.155 ** | 0.045 | 0.120 * | 0.045 |
| Age | −0.240 ** | −0.148 ** | −0.175 ** | −0.260 ** | −0.221 ** | −0.136 * | −0.199 ** | −0.198 ** |
| Employment status | 0.05 | 0.065 | 0.105 | −0.004 | 0.112 | 0.102 | 0.114 * | −0.019 |
| Members in the household | −0.09 | −0.067 | 0.004 | −0.045 | −0.128 * | 0.03 | −0.029 | −0.064 |
| Members in the household who need caring responsibility | −0.120 * | −0.093 | −0.097 | −0.07 | −0.088 | −0.02 | −0.004 | −0.051 |
| Disability | −0.11 | −0.075 | 0.006 | −0.159 ** | −0.008 | −0.1 | 0.088 | −0.124 * |
| Gross annual household income | −0.114 * | −0.022 | −0.043 | −0.131 * | −0.069 | −0.093 | −0.009 | −0.114 * |
| Driving license | −0.054 | −0.047 | −0.04 | −0.157 ** | −0.018 | −0.042 | −0.04 | −0.109 |
| Operational cars in the household | −0.04 | 0.063 | −0.09 | 0.012 | −0.07 | 0.144 * | 0.03 | 0.068 |
| Increase Traffic Congestion | Increase the Risk of Personal Assault or Terrorist Attacks | Increase Privacy Risks | Be a New Target for Cyber-Attacks | Reduce the Pleasure of Driving | Reduce Our Freedom of Travel | Reduce the Need for Professional Drivers | |
|---|---|---|---|---|---|---|---|
| Gender | −0.121 * | 0.074 | 0.095 | 0.159 ** | 0.179 ** | 0.033 | 0.182 ** |
| Age | 0.064 | 0.078 | 0.028 | −0.01 | 0.099 | 0.039 | −0.043 |
| Employment status | −0.062 | 0.097 | 0.07 | 0.146 * | −0.058 | 0.006 | 0.029 |
| Members in the household | 0.06 | 0.104 | 0.115 * | 0.074 | 0.035 | 0.123 * | 0.032 |
| Members in the household who need caring responsibility | −0.006 | 0.049 | 0.094 | −0.038 | 0.008 | 0.119 * | −0.023 |
| Disability | 0.039 | 0.142 * | 0.129 * | 0.021 | 0.126 * | 0.102 | 0.038 |
| Gross annual household income | −0.03 | 0.129 * | 0.149 ** | 0.061 | 0.069 | 0.069 | −0.029 |
| Driving license | −0.005 | 0.126 * | 0.031 | 0.102 | −0.088 | −0.034 | 0.031 |
| Operational cars in the household | −0.054 | −0.084 | 0.01 | −0.061 | 0.051 | 0.111 | 0.006 |
| Car accidents in the last 3 years | −0.081 | −0.151 ** | −0.160 ** | −0.043 | −0.018 | 0.014 | −0.049 |
| Use of Adaptive Cruise Control | −0.001 | 0.147 ** | 0.108 | 0.140 * | −0.120 * | −0.06 | −0.03 |
| Transport mode used | −0.007 | 0.025 | −0.048 | 0.022 | −0.198 ** | −0.113 | 0.078 |
Publisher’s Note: MDPI stays neutral with regard to jurisdictional claims in published maps and institutional affiliations. |
© 2022 by the authors. Licensee MDPI, Basel, Switzerland. This article is an open access article distributed under the terms and conditions of the Creative Commons Attribution (CC BY) license (https://creativecommons.org/licenses/by/4.0/).
Share and Cite
Andrei, L.; Negulescu, M.H.; Luca, O. Premises for the Future Deployment of Automated and Connected Transport in Romania Considering Citizens’ Perceptions and Attitudes towards Automated Vehicles. Energies 2022, 15, 1698. https://0-doi-org.brum.beds.ac.uk/10.3390/en15051698
Andrei L, Negulescu MH, Luca O. Premises for the Future Deployment of Automated and Connected Transport in Romania Considering Citizens’ Perceptions and Attitudes towards Automated Vehicles. Energies. 2022; 15(5):1698. https://0-doi-org.brum.beds.ac.uk/10.3390/en15051698
Chicago/Turabian StyleAndrei, Liliana, Mihaela Hermina Negulescu, and Oana Luca. 2022. "Premises for the Future Deployment of Automated and Connected Transport in Romania Considering Citizens’ Perceptions and Attitudes towards Automated Vehicles" Energies 15, no. 5: 1698. https://0-doi-org.brum.beds.ac.uk/10.3390/en15051698