
The Role of Electrification in the Decarbonization of the Energy Sector in Portugal


Institute of Systems and Robotics, Department of Electrical and Computer Engineering, University of Coimbra, 3030-290 Coimbra, Portugal
*
Author to whom correspondence should be addressed.
Energies 2022, 15(5), 1759; https://0-doi-org.brum.beds.ac.uk/10.3390/en15051759
Submission received: 1 February 2022
/
Revised: 22 February 2022
/
Accepted: 24 February 2022
/
Published: 26 February 2022
(This article belongs to the Collection Feature Papers in Sustainable Energy)
Abstract
:Climate change already affects all inhabited regions of the world, with human influence contributing to many observed changes in climate extremes and to mitigate this trend, important decisions have been taken by different world organizations and countries to achieve global net-zero emissions. At the European Union level (EU27 countries), two of the main pillars for achieving carbon neutrality are: (1) The “Energy Efficiency First principle” in the formulation of energy policy and in taking relevant investment decisions and (2) the electrification of the energy sector, supported by generating electricity through endogenous renewable energy sources. In this context, a comprehensive review was carried out on what has been developed by the scientific community and main international energy organizations on the electrification of the energy sector. Additionally, with the purpose of better understanding the state of the art of a country regarding the decarbonization process, the Portuguese energy vectors were identified in terms of which ones can and should be electrified by 2050, based on the data available from Eurostat (2019). Portugal is a country highly dependent on imported energy (78%), where the largest energy vector is from oil and petroleum products (68%) mostly used in the transport sector, where the electrification of the sector will be increased gradually until 2050. However, other decarbonized solutions, such as biofuels and synthetic (green) fuels cannot be ruled out and should be the subject of future work and considered for the decarbonization goals to be achieved in 2050. The main conclusions reflect that there is still a long way to go, much like the rest of the world, as it is necessary to electrify the equivalent to almost all the energy presently imported by Portugal, a tough challenge considering the need for its generation to be decarbonized. In this context, energy efficiency must play an equivalently important role to significantly reduce current energy demand, leading to more cost-effective and resilient energy services.
1. Introduction
Climate change is the biggest challenge for humanity. It is no longer an exclusive problem of the scientific community, but rather a global problem, where a direct intervention of all world leaders is necessary and in the decision-making process for the implementation of cost-effective measures to reduce greenhouse gas (GHG) emissions. However, it should be noted that citizens, as final consumers, also have a fundamental role, therefore raising their awareness should be part of the final equation to overcome this challenge.
The impacts caused by climate change are already known and are worsening as time goes by, causing, for instance, destructive extreme weather events, food insecurity, water and other natural resources scarcity, biodiversity loss and environmental degradation, accentuating social and economic inequalities, extreme and severe poverty, and hunger, aggravated by deficiencies in health and educational assistance and care [1,2,3,4,5,6]. Despite the identified issues and the recognized effort already under implementation, GHG emissions caused by human action, have increased sharply in recent decades due to economic and population growth, leading to a fast increase in the consumption of fossil fuels. Carbon dioxide (CO2) is the main contributor to the so-called greenhouse effect, being a direct consequence of the use and burning of fossil fuels such as carbon, oil, and gas for energy production purposes, as well as deforestation and land use transformation [7].
In the European Union (EU), the energy sector was responsible for 77.63% of greenhouse gas emissions in 2019 [8], of which the transport sector accounts for a quarter. The emission of GHG within the agriculture sector contributes 10.30%, industrial processes and use of products contributes 8.80%, and waste management contributes 3.27%. Given the above situation, urgent, and effective measures must and will have to be taken, to decarbonize the current energy sector to mitigate climate change and limit warming to 1.5 °C [8,9,10,11,12,13].
It is important to look at the relationship between energy consumption and economic growth, as well as between economic growth and GHG emissions. Several studies have been conducted on these topics. However, empirical evidence remains controversial and ambiguous, although the “GDP growth–energy relationship” study [14] demonstrated a clear link between GDP (Gross Domestic Product) growth and energy consumption. In some developed regions of the world, such as Europe, as presented in Figure 1, in the last few decades, it was possible to observe a decoupling between economic growth and energy consumption, being also possible to observe at the same time, an increase in electrification of the economy.
A comprehensive study [16] that focused on the causal relationship between carbon dioxide emissions, energy consumption, and economic growth concluded that energy conservation policies, such as energy efficiency management and control of carbon dioxide emissions, are unlikely to harm actual production growth. Another study [17] was carried out with a focus on panel data from 68 countries over the period between 2001 and 2017 for developed, emerging, and the Middle East and North Africa (MENA) countries. Based on the estimated results, it is recommended that policymakers should adopt strategies focused to adopt environmentally friendly technologies to decrease CO2 emissions, given that in emerging countries (with a growing economy), the results show a decrease in CO2 emissions, despite the increase in energy consumption.
Although the existing literature reveals that empirical studies differ substantially and are not conclusive for presenting policy recommendations, the EU leads the world decarbonization process of the energy sector through a comprehensive legislative framework, which has been designed since 2015, providing strategic tools at the Member State level for the creation of the Energy Union.
The regulation (EU) 2018/1999 of the European Parliament and of the Council of 11 December 2018 [18], defines the legislative basis needed for reliable, inclusive, cost-efficient, transparent, and predictable governance of the Energy and Climate Action Union. This governance mechanism creates conditions to ensure that the Energy Union’s 2030 and long-term objectives and targets are met, in line with the 2015 Paris Agreement on climate change, following the 21st Conference of the Parties (COP) to the United Nations Framework Convention on Climate Change (the ‘Paris Agreement’) [19]. Thus, the Energy Union is established according to a five-dimensional plan: energy security; internal energy market; energy efficiency; decarbonization; and research, innovation, and competitiveness. This strategy promotes a sustainable, safe, competitive, and accessible Energy Union, as well as a leader in research and innovation through the attraction of investment in the energy sector.
With the focus on the energy sector, energy policies aimed at increasing energy efficiency and electrifying the economy have been defined. At the European level, it is mandatory to implement the “Energy Efficiency First” principle, and there is the objective of achieving the decarbonization of the energy sector by 2050. In short, the energy transition is already underway, all over the world, especially in Europe, due to the Paris Agreement fulfilment and the approach to the beginning of the implementation of the National Energy and Climate Plans (NECPs), as the main instrument of energy and climate policy for the period 2021–2030, for each member state. The “Energy Efficiency First” principle involves a transversal look at the entire energy sector, including its consecration in the narrative of economic decarbonization, implying the reinforcement of the implementation of renewable energies and consequently the electrification of all activity sectors. However, the regulation reveals a striking gap between assessment and enforcement [20].
Since the required technologies are in general mature enough, it is foreseeable that the first sector to achieve the goal of total electrification in the 2050 horizon, will be the buildings sector [21]. For this reason, the member states, as well as the cities, have been defining aggressive policies towards a carbon-free future, causing radical changes towards the electrification of the sector. In this context, local authorities also play a key role in this global challenge, given that it is in cities that half of the greenhouse gas emissions are created in and by cities, largely due to most of the population living and working in cities [22]. Furthermore, cities are the lungs of energy consumption in society’s economic activity, fed by complex energy networks, where it is imperative to implement radical changes to adapt to economic and energy digitization. Therefore, there is no doubt that the main actors in the implementation of local sustainable energy policies are fundamental, thus, the Pact of Mayors for Climate and Energy came to complement the NECPs. This initiative comes voluntarily, committing local authorities to implement sustainability policies in their geographic territories, built around three pillars:
- Mitigation (emissions reduction target of at least 40% by 2030 compared to baseline);
- Adaptation to climate change;
- Access to secure, sustainable, and affordable energy.
In this context, the voluntary local authorities assume the commitment to decarbonize cities, through the implementation of a Sustainable Energy Program and Climate Action Plan (SECAP). Additionally, the implementation of SECAP will allow the creation of clean, smart, and healthy cities, benefiting from European support and recognition of citizens, without forgetting to increase urban green spaces areas to promote healthy living [23].
The increase in electrical energy consumption, supported by the increase in penetration and diversification of electrical loads, will mitigate the objectives of final energy reduction. Therefore, the reality is that energy efficiency will be fundamental in the different electrification strategies, as well as the origin of the generation of this energy vector. In this context, the consumer should play an important role in the rationalization of final energy consumption, thus avoiding energy waste in final consumption. Moreover, the final energy consumer will have a much more active role, since the decentralized generation of renewable energy will become increasingly common, transforming consumers into “prosumers”, i.e., who consume and produce at the same time, not forgetting that they may play a significant role in local energy storage [24].
On the other hand, much is said about the process of “electrification of the economy”, however, there is considerable uncertainty surrounding how this process should take place [25,26,27,28,29,30]. Currently, the production of electricity is increasingly generated from renewable sources, thus switching from technologies that use fossil fuels to those that use electricity will generally reduce GHG emissions and the energy dependence of most member states. Additionally, due to a radical change in the technologies used, the main cost will be in local investments, which will result in a large increase in the creation of jobs [31,32,33] in the EU, as well as a reduction of the import of fossil fuels. Therefore, the gain will never be just environmental. On the other hand, with the increase in electrification, the load on the electric power grids also increases, becoming a potential gain, including the environment and financial results of the electric utilities.
With the energy transition on the doorstep to a decarbonized economy [34], the role of electrification is essential, however, it can never be fully implemented without energy efficiency being the priority. This results not only from the implementation of the principle of “Energy Efficiency First”, but because a set of opportunities for energy efficiency in buildings, transport, and industries [35] will allow energy savings by switching from inefficient fossil fuel technologies to more efficient electrical technologies, while at the same time, they also provide financial, environmental, health, and property benefits.
In the context of consumer benefit or the public interest, the Regulatory Assistance Project (RAP) [36] stated that one of the three conditions must be guaranteed, without prejudice to the others: (1) In the long term, consumers will save money; (2) benefits the management of the electrical network; and (3) decreases negative environmental impacts. However, not all electrification is beneficial or efficient. For example, everything that is equipped with electrical resistance for low-temperature heating is generally inefficient equipment.
Factors specific to each country, region, or city are important, namely political, regarding economic factors in the choice of fuel type, climate and grid capacity, or load profiles. To a large extent, each member state will inevitably have to outline its policies for electrification and its link to energy efficiency based on the assessment of market conditions, planning of available resources, and involvement of all interested parties. It will be a long process with unexpected difficulties, however, this process must be idealized as the best method to predict the future is to plan it, looking first at energy efficiency opportunities, which will make it possible to reduce energy consumption directly and indirectly. Therefore, it is imperative to ensure that with economic electrification, the energy consumption needed is reduced to a minimum of the real needs.
Several policies have been designed for this transition, and efforts to implement them are experienced over time. In 2018, the EU presented the 2050 long-term strategic vision for climate neutrality, where energy transformation is the guiding line for a decarbonized economy. On 14 January 2019, the Commission presented “The European Green Deal”, a roadmap to make a sustainable EU economy, which provides an action plan to:
- Boost the efficient use of resources through the transition to a clean and circular economy;
- Restore biodiversity and reduce pollution.
The plan also describes the necessary investments and the available financing instruments, in addition, it explains how to ensure a fair and inclusive transition so that in 2050 the impact of Europe on climate is neutral. Figure 2 illustrates the several elements of the Green Deal adopted by Europe.
To achieve these objectives, it is necessary to act in all sectors of the economy, including:
- Invest in technologies that are not harmful to the environment;
- Support industrial innovation;
- Implement cleaner, cheaper, and healthier forms of public and private transport;
- Decarbonize the energy sector;
- Ensure the improved energy efficiency of buildings;
- Cooperate with international partners to improve global environmental standards.
All European initiatives carried out in recent years have been taken towards the total decarbonization of the economy by the 2050 horizon, for which the roles of energy efficiency and electrification of energy are crucial. These two processes will be implemented separately, however, they will have to be carried out simultaneously so that the overall strategy results in the achievement of the proposed objectives. In this context, the deep decarbonization of the energy sector is viable, however, it requires a genuine transition with significant structural changes in the sector, through increased energy efficiency, electrification of consumption, and the total decarbonization of energy generation through renewable sources [38].
However, according to the International Energy Agency (IEA), much remains to be done to reverse humanity’s current path, reach the decarbonization goal in 2050, and not exceed the 1.5 °C mark in the next decade. Considering only the current policy configurations, excluding additional policy implementation, the Declared Policy Scenario (STEPS), carbon emissions will still be significant in 2050, not avoiding reaching the unwanted 2.6 °C in 2100, as it is essential to start the implementation of the Announced Pledges Scenario (APS), a scenario that considers all the global climate commitments made by governments until 2021, but which are still not enough without promoting additional, more ambitious and concrete joint efforts to achieve the decarbonization objective, characterized by the scenario of the Net Zero Emissions by 2050 Scenario (NZE).
Figure 3 shows that generating electricity and heat from renewable energy sources will play an important and heavy part in reducing carbon emissions. However, it will be more difficult to do the same for emissions in the industry and transport sector. The global joint effort will have to go through, over the next decade, the electrification of energy consumption, avoiding the consumption of fossil energy vectors. A global push will be necessary for the generation of clean electric energy, implementation of the full potential of energy efficiency, and innovation of new and disruptive clean and green technologies, to keep open the hypothesis for stabilization of 1.5 °C.
It is in this context that, in Section 4 of this manuscript, the main results of an analysis of the different energy vectors that comprise Portugal’s energy balance are presented, with the aim of better understanding the dimension and need for decarbonizing the energy sector through its electrification, as well as to support the correct decisions for the decarbonization of the energy sector in a country.
Given the above, the present manuscript makes a review of the role of electrification in the decarbonization of the energy sector, divided into four sections. Section 1, briefly, intends to contextualize the review theme broadly, highlighting its importance for the sustainable energy transition. Section 2 presents the materials and methods used for the literature review on the topic presented in Section 3, as well as the origin and analysis of the data used in Section 4. Section 3 addresses the literature review of the energy sector decarbonization process. Section 4 evaluates the Portuguese energy sector, considering the need for its electrification. Section 5 presents the main conclusions and future research directions.
2. Materials and Methods
Using the “Web of Science” search engine with the string: “decarbonization” AND electrification AND “energy efficiency” AND “energy systems”, to find and refine the search for articles related to the subject of this manuscript, a total of 861 publications were identified, between 1994 and 2022, in which “review articles” account for 149 (17%) and “research articles” account for 712 (83%). In the same period, 2021 was the year with the highest number of publications (with 261 articles) and in 2022 there are already 95 publications on the subject (the last search was carried out on 31 January 2022). Further, refining the search to include only “review articles” and “research articles” in the “energy subject area”, the total count reached 570, of which 170 (30%) were published in 2021. Additionally, a more refined search was made for the preliminary screening of the results, based on the reading of the abstract to recognize the most suitable publications within the scope of this manuscript. From 2016 to 2021, there was an average annual growth of 50% in article publications, and this growing number of published articles perfectly reflects the growing importance of the subject, data reinforced with the 71 articles already published in January 2022, compared to 170 published in 2021 in the “energy subject area”.
In addition to the review carried out on the current state of understanding of the subject of this manuscript, research and brief analysis were carried out on the energy matrix of a country, using the data available at Eurostat for the different member states over the last three decades. Therefore, with the purpose of better understanding the state of the art of a country regarding the decarbonization process, the Portuguese energy vectors were identified in terms of which ones can and should be electrified by 2050. To this end, it was important to identify the available data for the year that was not disruptive, and that, at the same time, reflected the country’s energy balance to be as current as possible.
In this context, the year 2020 was marked by the strong negative impact of the COVID-19 pandemic on economies around the world, and Portugal was no exception. The effects resulting from the mandatory confinement led to a strong contraction of most branches of economic activity, determining in some cases an almost total stoppage. As a result, routines change, and energy consumption in offices and commercial buildings was moved to residential buildings and consumption in transport had significant drops, especially in international aviation, with less than 64% of oil equivalent (ktoe) consumed, and road transport where the stoppage was a reality, with less than 16% consumed. In this context, the year 2020 is a very atypical year for the intended analysis to be carried out, so, the analysis carried out with Eurostat data, regarding the energy balance of Portugal, covered the period from 1990 to 2019, and the relationship between decarbonization and electrification of the energy sector was mainly focused on the year 2019. The analysis of all energy sources that make up the energy mix of Portugal was carried out, with their units being standardized to kilotonnes of oil equivalent (ktoe). The adopted analysis method included the analysis of four different phases of the energy balance, as presented in Figure 4.
The “energy available from all sources” phase, includes the energy vectors of generation, imports, stock draw, and inflow of statistical difference (represents the negative statistical difference, that is the negative difference between the energy available for final consumption and final consumption). Regarding the “energy transformation” phase, it includes the energy input to all transformation processes (for example, crude oil, natural gas) and energy obtained as a result of all transformation processes (for example, refined petroleum products, electricity, or heat). The third phase is the “total energy available after transformation” phase, which intends to represent the disaggregation of the different energy vectors after the energy transformation carried out in Portuguese territory and the amounts of energy that do not suffer any transformation process (i.e., primary energy used directly in final consumption). Therefore, this phase represents the amounts of energy that are available for use. The last phase represents the breakdown of “final energy consumption” of all fuels used for energy purposes in the sectors of industry, transport, residential, commercial/services, agriculture, fishing, and other sectors on the one hand, as well as certain fuels used for non-energy purposes.
In this context, using Eurostat data, it is possible to obtain the same information for other European countries, allowing the same analysis to be replicated, including for different years.
3. Energy Sector Decarbonization Process
3.1. Electrification of the Energy Sector
The decarbonization process of the energy sector is undoubtedly one of the largest and most complex challenges that humanity faces nowadays [40,41,42], however, it will ensure multiple benefits. A recent study estimates the impressive number of 41.2 million lives saved (avoid deaths), across China, the European Union, India, and the United States, for 2021 to 2040, due to the replacement of fossil fuels with renewable energy [43].
It is a difficult process, with a high initial investment, and it will require a long process to reach full decarbonization. It is difficult, given the complexity of the existing energy systems [44], caused by different factors, such as population, geographic area, and country development. Furthermore, it will be a process that will involve a high initial investment, as a transversal transformation of the market will be necessary, both in terms of supply and demand for energy [45]. Finally, it will be a long process, as energy dependence on fossil fuels is high throughout the world and a global population, which is estimated to be growing, of around 2 billion people by 2050 [39], has aspirations in improving livelihoods.
It should be noted that there are several reasons for high energy dependence on fossil fuels, one of the main reasons is related to the rapid increase in energy consumption and global economies, leading to the need to quickly increase the power generation capacity. Another important reason is the cheap price of fossil fuels, mainly natural gas and oil, in some countries, and particularly in producing countries or countries that play an important economic role in the transit of these fossil energy sources [46].
In 2020, even in a scenario where world economies retreated or stagnated due to COVID-19, the implementation of new infrastructure projects based on renewable energy sources, such as wind and solar photovoltaics, continued to grow at a good pace and electric vehicles reached new sales records [39]. The decentralized use of renewable energy sources, especially in the residential sector, is also growing in many developed countries [47]. Therefore, a new energy system (Figure 5) will be based on a more electrified, efficient, interconnected, and cleaner energy sector [39,41,42,48,49].
It should be clarified that when referring to the electrification of the energy sector, it refers to the process of replacing technologies that use fossil fuels (coal, oil, and natural gas) with technologies that use electricity generated by renewable energy sources (namely the sun, water, wind, and biomass). If, on the one hand, a diverse set of measures must be combined to achieve the decarbonization goal, on the other hand, each measure must be evaluated and coordinated in the design of new energy systems [40].
The reduction of greenhouse gas emissions at a global level will require a fully renewable electricity sector as the basis of an energy system. However, its penetration in all sectors of activity, namely in transport, will be difficult, especially regarding long-distance transport (or heavy transport), given the current need to develop this category of vehicles. On the other hand, electric city vehicles are a reality, where electrification should even be seen as part of balancing services in local electricity grids [50], however, biofuels and green synthetic fuels will be part of the solution [49]. In this context, several studies were developed for different regions and countries to design 100% renewable energy systems efficiently and successfully by the 2050 horizon [40,41,42,45,46,48,51,52,53,54,55]. Technologies for taking advantage of renewable energy sources are cost-competitive compared to conventional energy sources and in various applications [56].
3.2. Renewable Energy Power Generation
The global potential of renewable energy is huge [57], and the use of solar energy has been on growing since 1950, without comparison with other energy sources. The energy sector recognizes this source as the source with the greatest potential and the lowest cost of electricity generation and harnessing the solar energy can be the main primary energy source for humanity within just a few decades [58]. Regarding hydropower development, despite the relatively high use in some countries, much can still be developed in several countries, especially about transboundary hydroelectric projects, where rivers or hydrographic basins are shared and/or generate benefits and costs between two or more national borders [59]. The generation of electric energy through wind energy is another renewable source in constant growth in the last decade due to its reliability and costs [60], becoming today one of the indispensable infrastructures in the generation of electric energy in some countries [61]. However, there is still significant untapped potential, namely by repowering existing turbines, as well as the potential for high-altitude onshore and offshore wind power [61,62,63]. The generation of electric energy through residual forest biomass is an important resource to increase and bridge the intermittence of electric energy generation through other renewable sources. This energy source should be strategic for countries to achieve the goal of decarbonizing the energy sector [64]. Composed of leftovers from forestry activities, such as those resulting from thinning or exploration in the field (for example, bark, branches, and stumps), the residual forest biomass can include other components, such as organic matter from invasive species (the effect of trees and shrubs that are harmful to ecosystems), trees attacked by pests and diseases that cannot be used for other purposes, and materials that result from the opening of fire barriers (firebreaks, for example). Additionally, the removal of residual biomass from the forest helps to reduce the risk of rural fire. However, the sustainability in the use of this energy source may be compromised in the long term in most countries, due to the costs involved in the collection and transport of waste and in the capacity to renew this source, given the evolution of energy needs.
3.3. Transmission and Distribution Networks and Energy Storage
With the increase in intermittent energy generation, it will be necessary to create a flexible energy system, with more interconnections, and capable of responding to the need for final consumption. In this context, as an interconnection factor with demand, the development of transmission and distribution networks and energy storage systems will be essential to overcome the volatility in the availability of renewable resources. There are several solutions in the market, however, the potential for new development is very high. However, it is estimated that by 2050, investment in the electric battery capacity will increase from 80 GWh to 351 GWh per year [65]. On the other hand, it is necessary to assume that losses in the conversion of electrical energy into thermal energy are part of the cost-effective operation of a renewable energy system [51].
Following the above on the role of renewable energy in the decarbonization process of the energy sector through its electrification, it is important to know the role of the infrastructure of transmission and distribution networks of electricity in an energy system. In this context, the Energy Efficiency Directive (EED) [66] and the Internal Energy Market for Electricity [67] are complementary and mutually supportive, notably as regards the objective of promoting efficient electricity networks and contributing to improved security of supply, in particular by encouraging the modernization of distribution networks, such as through the introduction of smart grids, which should be built in a way that encourages the decentralized generation and energy efficiency promotion. The definition of energy efficiency provided for both above-mentioned directives is defined as the ratio of the output of performance, service, goods, or energy, to the input of energy. When energy is transformed from one to another form or moved from one place to another, or from one system to another, there are energy losses. This means that from the moment of electric power generation to the final consumption, there is a significant potential for energy efficiency improvement due to energy losses in transformation, transmission, and distribution.
An important part of energy transport infrastructures is the power transformers, which should not be forgotten in the decarbonization process. For such purpose, the European Commission promoted the implementation of energy efficiency classes and mandatory standards that remove the worst transformers from the market through the Ecodesign Requirements [68] for the performance/energy efficiency of medium power transformers and the energy efficiency of transformers of great potency. Such requirements would also contribute to the efficient operation of the internal market and to improving member states’ environmental performances, through the introduction of efficiency classes and Minimum Energy Performance Standards (MEPS). In 2015, the impact of such measures was evaluated [69], finding that the potential for savings for the 2050 horizon represents around 450 TWh and 35 TWh of electricity in the world and Europe, respectively, the equivalent to 180 and 4 million tons of avoided CO2 emissions into the atmosphere.
It is important to mention that the power transmission and distribution grids have been strengthened and modernized to meet new requirements, such as population growth and the consequent evolution of consumption, or decentralization of energy generation in power distribution systems to incorporate more small-scale renewable sources, consisting of overhead and underground cables of high, medium, and low voltage lines, always ensuring the necessary quality levels and minimizing losses to the networks. Substations, along with other equipment, such as sectioning and transformer stations and street lighting installations, are key network infrastructures too, so it is necessary not to neglect the decarbonization objectives of the energy sector, and to implement measures that promote the reduction of energy losses in this type of infrastructures. In this context, several studies have been developed to identify better methods and indicators to calculate losses in electric energy transport networks in random or specific distributed generators penetrations and configurations [70,71,72,73,74]. With the increasing penetration of decentralized generation, it leads to serious problems in the safe and reliable operation of the grid, due to its intermittent and non-dispatchable output [75], which is why it is essential to develop efficient management strategies and solutions to reduce losses in the system and allocate their costs fairly through a smart grid system to build energy systems that are more affordable, reliable, and robust [76,77].
Smart grid deployments have improved grid system intelligence by providing multi-directional information flow between the system to achieve a revolutionized energy industry by providing adequate energy metering data to substations, transmission, and distribution networks, and to the energy producer, for greater security, resilience, and efficient control and monitoring of assets and services. Conventional power systems offer these advantages, which include reliability, security, and flexibility in power distribution, power consumption monitoring, demand-side management, improved optimized network traffic, shorter downtimes, minimized failures, network losses reduced supply and demand, as well as generally improved network operations and services. With the increasing availability of sophisticated computing, communication, and measurement technologies, they will make a strong contribution to achieving the goals of decarbonization. However, there are issues of data security and theft of electrical energy that pose considerable challenges, which could compromise the energy sector decarbonization objectives if they are not recognized as such and identified solutions to mitigate them [78].
Concerning the energy losses due to theft of electrical energy and tampering with energy meters, also known as non-technical losses, they create real challenges for the profitable operation of the distribution sector, putting at risk its financial optimization and therefore the entire energy system of a country. Development of innovative algorithms and technologies to identify situations of energy theft, articulated with campaigns to raise awareness among end consumers of the negative impacts and quick administrative decisions against the culprits, should be adopted to ensure the control and reduction of actions of theft of energy [79,80].
3.4. Electrification of the Economy
Finally, it is important to have a view of the decarbonization process of the economy from the point of view of final energy consumption. As the carbon intensity decreases in electricity generation, due to the increase in the penetration of renewable sources [81], the electrification of final energy consumption becomes an increasingly announced decarbonization strategy. As an easier approach to the topic, the final energy consumption was divided into three different sectors of activity, typically those with the highest final consumption, buildings, industry, and transport.
Although electrification makes sense today, not all applications are good opportunities to electrify for technical and/or economic reasons, such as heating using natural gas in very cold regions, high-temperature industrial processes, and commercial road transport. Additionally, the electrification of final energy consumption has the challenge of consumer acceptance, given that a significant number of consumers are concerned about whether electric vehicles have sufficient autonomy to reach their destination or are concerned about the performance of heat pumps in regions where the temperature is traditionally low [82]. However, it is important to mention that electrification has already been happening in some sectors over the last 70 years [83]. Particularly in the buildings sector and due to the availability, ease of use, safety, and cleanliness of electricity compared to other energy vectors, such as oil that can easily dirty the user or natural gas, where there is an increased need for safety in its use. It is therefore predicted that the buildings sector will be the first sector to become 100% electric, with several examples already implemented around the world. The final energy consumptions to be electrified in buildings are appliances for cooking, space, and water heating. Kitchen appliances already are competitive, with available information and communication technologies, and efficient electrical solutions to replace, for example, natural gas, however, space and water heating may not be the same, depending on the climate and type of building [84].
There are various scenarios likely to adopt electrification in the short term, such as new construction, replacement of oil or propane equipment, or installation in well-insulated buildings, or in regions with mild climates where space heating and water needs are lower, thus promoting penetration of heat pumps. In a short period, with natural technological improvements of existing equipment, especially for heat pumps and heat storage, electrification in this sector will be even more competitive at an economic level, in the face of currently more challenging situations, such as very cold climates [85,86,87].
In addition to the energy and environmental benefits of buildings energy consumption electrification, the need to include health in the design of energy and climate policies [88] seems to make more sense in the decarbonization process, given the significant health benefits of promoting constant air conditioning throughout the year in buildings or choosing not to burn natural gas during food preparation. Given the above, the policymaker must promote policies aimed at the rapid electrification of the building sector [89], as there are viable and generally economic solutions available on the market to reduce costs to end consumers, increasing the flexibility of the electricity distribution network and drastically reducing risks to human health.
As far as the industrial sector is concerned, it will be a sector that will also benefit indirectly from the electrification of the energy sector, bringing more companies to the market (with the increase in demand for electricity, the market will get larger, giving rise to new companies, not only in the generation of electricity but also in its commercialization and companies for the maintenance and management of electricity) and thus bringing about a desirable increase in competition, which makes it difficult for companies with low productivity to survive [90]. However, the total electrification of the industrial sector will be a slower process than the buildings sector, given that there are basic materials industries that still require the development of disruptive technology, especially regarding the need to reach very high temperatures in some processes [90,91,92,93,94,95,96,97,98].
A transitional phase may be adopted, when environmentally and economically viable, in some industrial processes through indirect electrification [91], such as, for example, using CO2 hydrogenation, where energy consumption will be unavoidable and substantially higher compared to the traditional process, so it is only justified in scenarios of very high penetration of electricity generation through renewable sources at a low cost of MWh. If direct electrification is one of the solutions for the decarbonization process in the industrial sector, the opposite is also true in the chemical industry sector and may be part of the solution to the problem of integration and the progressive increase in the penetration of electricity generation through renewable sources. The ability to translate electrical energy into chemical bonds provides a method of electrical energy storage to fill in the intermittence of renewable sources and demand needs [92].
However, global climate policy has not yet achieved the desired results in the industrial sector as it has in other sectors of activity. The policies implemented mainly supported energy efficiency and marginal emission reductions, protecting energy-intensive consumers from rising energy and carbon costs through exemptions and offset schemes [95]. A sectoral approach will be necessary, given that the industry sector has many asymmetries and where the more developed and rich countries will have to set an example through more ambitious policies. There is an opportunity for fully integrated, decarbonized, local manufacturing that starts with renewable resources and ends with desired commercial products in the industry sector [97,98].
Finally, the decarbonization process of the transport sector is and should be carried out using biofuels, synthetic fuels, and electricity. However, it will be difficult to implement, by 2050, the total electrification of the transport sector, especially if the associated costs do not drop drastically, either in terms of vehicle acquisition or in terms of installation and access to electric vehicle charging, as well as the price of electricity [99,100]. The total replacement of a national fleet implies a high financial investment and political measures to scrap vehicles, with significant impacts on the environment. Therefore, the use of biofuels or green synthetic fuels (indirect electrification) will minimize and allow a possible smooth transition to the electric vehicle in the long term [101]. However, it is important to ensure that biofuels are produced sustainably and without entering into direct competition with human food, as well as ensuring that the production of synthetic fuels is produced by electricity generated by renewable sources. Examples of this are aviation, navigation, and long-distance road transport will have to overcome significant development processes before their full electrification will be sustainable [102]. The ambition of mass electrification in the long-haul road vehicle segment (heavy vehicles) will significantly increase the demand for lithium, creating increased pressure on its supply [103]. However, the electrification of the road sector is already something natural, largely due to the electrification of city vehicles, commercial transport, and public buses on a large scale. Today, all brands of vehicle manufacturers have the offer of different models of electric vehicles, even promising to abandon the production and sale of models of internal combustion cars for horizons below 2050.
It is not wrong to think that the energy consumption associated with the charging of vehicles will be part of a building’s consumption. In the total energy sector electrification scenario, this reality will be increasingly greater, not only in residential buildings but also in service and commercial buildings. Therefore, the combined electrification of the transport sector and buildings and the decarbonization of electricity generation offers one of the greatest opportunities for the energy sector, namely promoting users to play an important role in better managing the electricity grid, as well as reducing costs and transport-related GHG emissions [101,104,105].
The electrification of city and commercial transport vehicles is dependent on the availability of charging infrastructure, which could delay its penetration if it is not available [106]. On the other hand, the electrification of railways is an indispensable measure of developed and developing countries, for long-distance transport of goods and collective transport of people. However, in some countries, there is a lack of concerted strategies to promote this mode of freight transport [107,108]. To technically support decision-making in the development of public policies, it is important to develop transport sector modelling tools at the national level, giving priority to economic, environmental, and energy factors [103,104,109,110,111,112,113].
3.5. The Role of Energy Efficiency
As already mentioned, and a common denominator of the different cited, energy efficiency is one of the tools presented to directly support the decarbonization of the energy sector, and it is even seen as a fundamental pillar to successfully achieve the goals for 2050, streamlining the electrification of the energy sector. Several studies attest to the high potential for energy efficiency in the energy sector, globally, such as, for example, at the European level or by member state [114], in the buildings sector [115,116,117,118,119], in the industrial sector [120,121,122,123,124], or more specifically, in the application of fees or taxes [125] or energy management practices [126].
There are behavioural measures, some more complex than others, such as, for example, the sharing economy, where the synergy between information, technology, and marketing promotes a new business vision where customers give priority to access to the property, allowing them to use it efficiently [127] or replacement of inefficient equipment, where technological innovation has proven to be more efficient [128]. It is also important to highlight that, in addition to the intended positive impact on cost and energy savings, with its implementation, there are multiple associated benefits, especially at the economic, social, and environmental level [129,130] that should not be overlooked and should therefore be identified and presented for decision support, as represented in Figure 6. Additionally, it is important to evaluate the efforts made in the implementation of energy efficiency, at the national level, for example, concerning the implementation of articles 5 and 7 of the EED, the need for more efforts to comply with these articles was identified [131] or because of the implementation of management programs, where the complexity of the sector (for large manufacturing companies) and access to investment (for small and medium-sized companies) are the main barriers to the adoption of these same programs [132].
On the other hand, not everything is easy for the correct implementation of energy efficiency. There are barriers at the technical and non-technical level, from the engineer to the installer, through the legislator and the final energy consumer. However, it is essential to identify and classify the barriers in each of the projects or programs to be implemented, being a precondition for the successful diffusion of energy efficiency measures [133]. The rebound effect is highlighted as one of the barriers to energy efficiency, that is, it is a phenomenon in which the actual reduction in energy use is smaller than the reduction projected by an improvement in energy efficiency due to behaviour adjustment induced by relevant economic agents or by the final consumer [134,135,136]. However, this barrier can and should be seen with a significant energy efficiency potential, given that it is possible to mitigate it. Therefore, it is suggested that energy efficiency be interpreted as a source of energy.
3.6. Decarbonization Cost
The process of total decarbonization of any energy sector until 2050 will have a significant impact on financial cost and employment, so it is important to have a perspective of the economic and social implications, respectively, in the reorganization of costs and jobs associated with the energy sector. As mentioned, the decarbonization process will not be achieved only through electrification and replacing fossil fuel with renewable electricity, as there is also a need to simultaneously adopt other measures, such as energy efficiency, throughout the energy sector value chain, and the use of bioenergy and synthetic fuels in the transport sector.
In this context, there are different ways and scenarios to achieve the objective of decarbonizing the energy sector. Focusing only on the European case (EU-27) estimates made in 2020 [137] predict that the investment challenge to reach the net-zero goal by 2050 will be around €27.8 trillion over 30 years in six different sectors (Figure 7). The projections went even further, disaggregating the total value of CAPEX in Europe by a decade, given the proposed objectives for the 2030 and 2050 horizon, with investment between 2021 and 2030 amounting to around €8.4 trillion. However, to reach the net-zero goal in 2050, member states will have to make a joint effort in the amount of approximately €19.4 trillion, and between 2031 and 2040, the investment is expected to be slightly higher, making a total of €10 trillion, compared to €9.4 trillion of the total CAPEX in EU-27 between 2041 and 2050.
As would be expected, the sector with the highest CAPEX is the transport sector, with values per decade varying between €3.2 trillion, €4.5 trillion, and €4.1 trillion, respectively, up to 2050. The buildings sector is the second sector with the highest CAPEX, almost identical to the transport sector over the first decade to reach the goals for the 2030 horizon. However, it is estimated that the CAPEX value will decrease in the subsequent decades to reach the goal of total decarbonization by 2050, around €2.8 trillion and €2.5 trillion, respectively, each decade. With lower investment values, CAPEX values for energy infrastructure are presented, at around €1.26 trillion, €1.4 trillion, and €1 trillion, over the three decades, as well as the value for power generation, with initial values which almost double from the first to the third decade, i.e., €0.6 trillion, €0.8 trillion, and €1.1 trillion, per decade. It is estimated that CAPEX values for the decarbonization of agriculture in the next 30 years are worth €0.3 trillion, €0.4 trillion, and €0.3 trillion. To conclude, and with only 1% of the total amount of CAPEX needed to decarbonize the industry sector by 2050, the investments required for each of the decades are around €0.08 trillion to reach the proposed targets for 2030 and €0.1 trillion and less than €0.3 trillion over the last two decades, respectively.
In summary, Figure 8 presents the values and weight of CAPEX needed to achieve the decarbonization of the European economy (EU-27) until 2050, broken down by decade and sector. This global investment of €27.8 trillion (an average of around €927 billion a year) in clean and green techniques and technologies will enable the achievement of the goal of having 27 member states with net-zero carbon by 2050.
The investment, although large, is not an additional investment to what is already been carried out in any way to finance carbon-intensive technologies, valued at around €22.4 trillion (4% of the current EU GDP). Therefore, it is estimated that the additional effort to achieve decarbonization will be around €5.4 trillion (in the first decade around €1.6 trillion and the remaining amount is divided in the same proportion of €1.9 trillion in the next two decades), equivalent to increasing the total annual investments of EU currently at 7%, or 1% of the current EU GDP. It is important to mention that any CAPEX estimate will only be real if the investment made is oriented along with the decarbonization strategy planned for this purpose, that is, there will have to be an intervention with stakeholders, based on the decision to spend their capital and of the expected return periods.
However, total OPEX costs will be lower in a decarbonization scenario in the 2050 horizon. The estimate made is around €0.13 trillion in annual system operating costs, reaching twice the average value in 2050 of total system operating expenses (€0.26 trillion), with the implementation of a decarbonization strategy for Europe, i.e., around 1.5% of current EU GDP. However, it should be noted that operating expenses for fuel and feedstock in the industrial sector increased beyond the initial investments in the year 2050.
4. Results
Figure 9 presents the Portuguese energy balance flow according to the four previously mentioned phases and demonstrates that Portugal is heavily dependent on imported energy since, in 2019, energy imports accounted for 78% (24,074 ktoe) of the energy available from all sources. Additionally, 21% (6552 ktoe) of the available energy is extracted from Portugal’s natural sources. However, there are 10% (3220 ktoe) losses in the energy transformation, a significant value in the context of decarbonization. After transformation, from the total energy available, with Portugal using 63.24% (17,511 ktoe) for final energy consumption, exports 20.62% (5719 ktoe) and 14.58% (4045 ktoe) of the available energy is used in the stock build-up, in international aviation and navigation, to operate installations for energy production and transformation and some minor miscellaneous uses. In this phase, there are also energy losses related to electricity transmission and distribution with a weight of 1.56% (432 ktoe).
In this context, and within the scope of what was referred to in the introduction section, it is now important to understand the role of electrification to achieve the goal of decarbonizing the energy sector in Portugal for the horizon of 2050, since in 2019, only 21% (6552 ktoe) of the available energy comes from endogenous renewable sources and the current characteristics of final energy consumption do not allow for an immediate transition to decarbonized energy sources.
The following subsections present the main results characterizing the current situation and what measures or assessments should be considered for the decarbonization of the Portuguese energy sector.
4.1. Energy Available from All Sources
In the energy available from all sources phase, the objective was to assess which endogenous energy sources exist and which type of energy vectors are imported. In this context, the presented results are restricted to the analysis of energy vectors that can be decarbonized, not considering their final use. The Portuguese energy mix, despite being constant at the energy vectors level that composes it, has experienced important changes since 1990 (Figure 10), which can be grouped into seven different categories of energy vectors in the global amount of 30,927 ktoe, in 2019.
With a focus on 2019 (Figure 11), the endogenous energy sources used are practically 100% from renewables (including biofuels), representing around 21% of the global Portuguese energy mix.
The renewables and biofuels vector is essentially composed of primary solid biofuels (44%), which can be burnt to generate heat or electricity, wind power (18%), and hydropower (12%) to generate electricity. Of course, this vector can vary significantly from year to year, depending on the availability of natural resources, such as whether it is a dry year or not, a windy year, and a year with limited fuelwood or wood residues.
Imports and stock draw of oil and petroleum products and natural gas (54% and 17% of the total mix, respectively) are not analyzed in this subsection, given its purpose, respectively, 19% and 36% are destined directly for final consumption, and 83% and 64% as an input in electricity and heat generation and/or refineries and petrochemical industry input.
The energy vector oil and petroleum products (16,753 ktoe, 54%) can still be disaggregated as presented in Table 1, highlighting the weight of crude oil (68.5%), refined in other intermediary products into refined petroleum products (such as petrol, diesel oil, fuel oil, lubricants, etc.).
The natural gas import, with the construction of the main natural gas distribution infrastructure in 1998, has promoted this energy vector as the vector with the largest growth in the last years. With the import of natural gas, the solid fossil fuels energy vector (coal) has progressively lost space in the Portuguese energy mix, as coal-fired power plants were progressively converted to natural gas. Additionally, the coal import has varied inversely with the hydro generation capacity, which in rainy years ensures a higher electricity generation level, reducing the need for electricity generation from coal. It is important to highlight that in 2021, in January and November, the last two thermoelectric power plants that used coal closed, in the cities of Sines and Pego, respectively. Thus, since 20 November 2021, for the security of supply purposes and to respond to the variability of production from renewable sources, the Portuguese electricity system has been dependent on combined cycle power plants powered by natural gas (which emit less than half of the carbon dioxide per megawatt-hour of electricity, compared with the thermoelectric power plants that used coal [138]). However, despite the reduction of emissions, the reality is still far away from the net-carbon goal for the Portuguese energy sector.
Given the above, there is no need to analyze the energy vector related to coal imports for electricity generation (solid fossil fuels), as from 2022 onwards, it will no longer exist in the Portuguese energy mix, and in 2019, it represented about 5% of available energy. However, there is a small percentage of coke oven coke, used in the iron and steel industry and other solid fossil fuels used in the non-metallic minerals cement industry.
Regarding imported electricity (2% of the total mix), its origin can be 100% renewable, proven through the issuance of Guarantees of Origin (GOs), a mechanism created by the member states through the transposition and implementation of the RES Directive (2018/2001/EC and its predecessor 2009/28/EC). To this end, additional efforts are needed to amend the national regulations that require all imported electricity to be accompanied by the respective GOs. Aiming not only to guarantee the decarbonization of this imported energy vector but also energy independence, the solution should include the reinforcement of the effort to increase the generation of electricity through endogenous renewable sources or/and through energy efficiency measures, such as technologies to reduce and manage demand.
Non-renewable waste has an import component from import industrial waste and should be reduced through a circular economy strategy, with the remaining fraction replaced by a decarbonized vector. However, its amount is currently of reduced relevance. This vector also includes the non-renewable municipal waste produced by households and the tertiary sector, such as plastics, synthetic rubber, inorganic materials, etc. which is incinerated to produce electricity and/or heat but should be increasing recycling.
Lastly, the heat energy vector will be addressed in the transformation phase, as it is an energy vector from the combined production of electricity and heat. In this way, the energy balance flow of energy available from all sources can be represented as shown in Figure 12.
Based on the above results, Table 2 classifies the status of the energy vectors available from all sources identified in this phase of the energy balance.
4.2. Energy Transformation
In the energy transformation phase, the performed analysis was related to the electric energy generation process, since the remaining vectors were evaluated in other phases. The energy balance flow for energy transformation was created, as presented in Figure 13, to better understand the transformation processes of different energy vectors, especially those involved in the generation of electrical energy and heat, as presented in Figure 14.
As above mentioned, since November 2021, electricity generation in Portugal, has come mainly from renewable energies, with a significant portion of natural gas, which in 2019 corresponded to 39%. Therefore, additional efforts will be needed to decarbonize the electricity generation sector in Portugal, progressively abandoning the generation of electricity through natural gas, for example, resorting to increased endogenous renewable generation, far beyond the value currently available, including decentralized biomass or concentrated solar plants with storage.
It can be said that Portugal is on the right path towards the decarbonization of electric power. However, there is still a considerable way to go to decarbonize the remaining vectors of the energy mix in Portugal. There is a need to electrify a significant part of consumption, in particular, the transport sector, namely urban transport and cars for which cost-effective technologies are already available. For long-distance transportation (trucks, ships, aviation) this effort can be complemented with the penetration on a larger scale of biofuels or synthetic fuels. However, on the other hand, this increase in electricity demand for transport will have to be generated by renewable sources, to ensure the decarbonization of the energy sector, installed power that is not yet considered, given the goal horizons of 2030 and 2050. Based on the above results, Table 3 classifies the status of the energy vectors identified in this phase of the energy balance.
4.3. Energy Available after Transformation
In the phase related to the energy available after transformation, the assessment carried out was focused on evaluating and disaggregating the different energy vectors available for final consumption. These results were important to link the data from the previous phases as input data for the analysis of the final energy consumption phase. After the energy transformation, the mix of different energy vectors available is represented in Figure 15.
The non-renewable waste energy vector (with less than 1%) represents the recovery of waste from industry, hospitals, and household wastes, such as rubber, plastics, waste fossil oils, and other similar types of wastes, which can be either solid or liquid. Its decarbonization is not directly associated with the energy sector and was discussed earlier in Section 3.1.
After energy transformation, it is possible to desegregate the energy vectors from being directly available for final consumption (32%) and those that went through the transformation process (68%). The summary of these disaggregated energy vectors can be found in Table 4, and for easier visual interpretation the energy balance flow of energy available after transformation is represented in Figure 16.
It should be noted that the presence of solid fuels at this stage is related to the energy stored in storage facilities (stock build of coal), due to the generation of electricity. However, since November 2021 it no longer exists in Portugal. Additionally, it should be noted that the remaining energy vectors, except electricity and heat which were already evaluated in the preview subsection, will be evaluated concerning their final use in the next subsection.
4.4. Final Energy Consumption
Regarding final energy consumption, the disaggregation of the different energy vectors in each of the activities was analyzed to better understand the role of electrification in the decarbonization of the energy sector, as presented in Figure 17 and Figure 18.
Regarding energy exports, this should not be neglected, as the national objective contributes to a global cause, which is why it is important to decarbonize energy export activity. This activity is mostly broken down into the export of oil and petroleum products, 86% (4899 ktoe) and 14% into renewable energy (810 ktoe, divided into biofuels and electricity, resulting from the excess of renewable generation in periods of lower national consumption). Thus, it is critical to find decarbonized alternatives for the export of the energy vectors identified in Figure 19. As this is the export of fuels, it is indispensable to identify alternatives that support a sustainable refining sector in Portugal. Therefore, efforts must be aligned to replace this activity with other decarbonized activities, or in parallel, move to the production of synthetic fuels, using renewable energies to generate electricity used in the process.
The final consumption is divided into final energy consumption, 93.4% (16,355 ktoe), and final non-energy consumption, 6.6% (1155 ktoe of other petroleum products, used for non-energy purposes mainly in the industry sector). After processing the available data and for better analysis, Figure 20 was created, which represents the weight of each energy vector used in the final consumption, and Figure 21, which represents the energy balance flow of the different energy vectors used in different activities.
Regarding the vectors that do not need to be decarbonized, as mentioned above, 45% (about 1610 ktoe) of electricity originated from renewable sources (except for the imported part, since there is no information to prove its origin) and 18% (2904 ktoe) of energy originate from renewable sources. The vectors of heat, 2% (248 ktoe), and non-renewable waste, 1% (87 ktoe), originate from processes that were previously evaluated.
Thus, at this stage, it was important to analyze and assess the relevance of the electrification of the energy vectors of oil and petroleum products 44% (7173 ktoe) and natural gas 11% (1815 ktoe), considering the decarbonization of the energy sector. After analyzing the composition of the vector of oil and petroleum products (presented in Figure 22 and Figure 23), there is no doubt that the road transport sector needs a rapid transformation to reach total decarbonization in 2050. Given the sector’s dimension and consumption, its electrification can only take place simultaneously with the decarbonization of the power generation sector and its reinforcement. Additionally, car owners will have to progressively replace their current vehicles with electric vehicles. In this context, it seems that the best scenario should go through the phasing and combination of different measures to support renewable electricity generation, support for abate of existing internal combustion vehicles and the acquisition of new electric vehicles, installation of large-scale charging infrastructure, increased incorporation of biofuels, and progressive replacement of fossil fuels by decarbonized synthetic fuels.
Regarding the rail and domestic navigation sectors (e.g., ferries), the electrification of these transports should be mandatory, even for tourism purposes. However, in domestic aviation, it will always be dependent on a technological disruption occurring at a global level, whether through electrification or another decarbonized energy vector.
In terms of other sectors, the industry and households’ sectors stand out, with consumptions of 547 ktoe and 408 ktoe, which should be quickly replaced by electrical technologies or renewable energies.
Regarding the use of natural gas, through the creation of the energy balance flow (presented in Figure 24), it was possible to disaggregate its use according to each activity. The industry sector is the sector with the largest penetration of this vector, especially the non-metallic minerals industry, mainly due to the heat of limestone and clay in the ceramic and glass industry. The electrification of the industry sector is possible, considering the proposed horizon for the total decarbonization of the energy sector by 2050, however, measures will be needed to overcome the main barrier in this sector, the supply of electricity from renewable sources 24/7, throughout the year, due to its intermittency. For this need, the development of electrical energy storage applications should be a priority.
Electrification of cross-cutting applications in the industry sector provides opportunities for expanded use of more specific electrical technologies in industrial sub-sectors. There are several applications where electrical technologies have already established themselves. However, the most frequent reason is because of non-energy benefits, such as safety and issues related to automation. Another factor holding back electrification is the price of natural gas, thus raising awareness of environmental benefits can play a key role in accelerating the adoption of electrical technologies over natural gas. However, it is important to bear in mind that there is still a need for research and development of disruptive technologies for certain hard applications, especially for those that need to reach high temperatures. Considering the horizon of 2050, solutions are being developed to decarbonize difficult industries [139].
On the other hand, the buildings sector (services and households) is a sector where electrification can easily be fully ensured, as the technology already exists and is more efficient than using natural gas. To this end, effective measures must be taken towards a progressive, however quick, energy transition. Additionally, the electrification of kitchen equipment will also have an impact on health, since the combustion of natural gas for cooking may be related to respiratory diseases, especially in children [140].
Most end-uses in the agriculture and transport sectors can also progressively be electrified, given the category of activities, heating, and buses, respectively.
Considering the above results, Table 5 classifies the status of the final energy consumption vectors identified in this phase of the energy balance.
It was not possible to identify reliable investment values associated with the decarbonization of the Portuguese energy sector. However, the economic and social impact on the Portuguese energy sector to achieve decarbonization will have similar behaviour to the European one, in particular the Iberian one. There are favourable conditions for Portugal and Spain to follow a path together to achieve the proposed decarbonization goals by 2050, regardless of differences in the starting point and their decarbonization options [137]. Furthermore, in this context, the International Energy Agency (IEA) in the review of Portuguese energy policies, aiming to support the development of energy policies and encouraging the exchange of international best practices, recommended that the Portuguese government ensure that the Roadmap for Carbon Neutrality 2050 (RNC2050), the National Energy and Climate Plan (NECP), and the National Hydrogen Strategy (EN-H2) are aligned and implemented effectively according to a cost-benefit analysis [141].
5. Conclusions
In the context of the literature review carried out in this manuscript on the electrification of the energy sector to fulfil the decarbonization ambition in the horizon of 2050, it is possible to conclude that, at a global level, to reach the goals, the path forward will be long and difficult, and that despite the efforts made to date, more ambitious global efforts will have to be implemented. It will not be enough for world governments to move from words to deeds, new measures will have to be thought, planned, and implemented to avoid the increase in world temperature in the coming decades. Based on a simple analysis of Portugal’s energy matrix, the conclusion is the same, despite the various existing plans aimed at decarbonization, taking into account the horizons of 2030 and 2050.
As can be seen from Figure 25, all the EU-27 countries, such as Portugal, are heavily dependent on fossil fuels, such as solid fuels, oil, petroleum products, gas, and some imported electricity that may not come from a renewable generation. On the other hand, the energy vector of nuclear heat gives a significant boost to the decarbonization of the energy sector in France, Sweden, and Finland, despite all other associated problems that may arise from the use of this energy vector. As a common denominator for all EU-27 countries, the energy vector oil and petroleum products represent a significant percentage in the energy matrix of each country, promoting the need for a real Energy Union in Europe, capable of joining efforts to decarbonize a high penetration energy vector.
Despite the long and complex way to go, the electrification of the energy sector must be carried out in a consistent optimized relationship with energy efficiency and renewable energies in the power generation sector. This will be crucial to effectively achieve the proposed goals cost-effectively.
Portugal is heavily dependent on energy imports, mostly with oil and petroleum products and natural gas. As for oil and petroleum products, the electrification of this vector will hardly be achieved in full in the short–medium term. Electric mobility for light vehicles and urban transportation is progressing fast with increasingly cost-effective technologies. Other solutions should be adopted, particularly in the transport sector, through increased penetration of biofuels and support to produce synthetic fuels, for this reason, the long-distance heavy vehicle road transport sector, shipping, and aviation will be the last sectors to be electrified, a full transformation that could go well beyond 2050. The share of natural gas imported for electricity generation should be progressively replaced by endogenous renewable sources, as has already been done for coal. Regarding imported natural gas for final consumption, it must be electrified as soon as possible, especially in the building, transports, and agriculture sectors. The building sector is expected to be the first sector to become 100% electric, not only because there are already several examples around the world, where buildings are 100% electric, but also because the most efficient technologies are already electric. On the other hand, the electrification of natural gas in the industry will take longer, however, there is an expectation that new and disruptive technologies can speed up the process.
Huge additional benefits are available through electrification leading to better air quality in cities and homes, which are critical to improving population health. Large economic benefits can be expected through the replacement of imported fossil fuels for endogenous renewable resources.
However, it is important to consider the electrification process not only from the point of view of final consumption but also the availability of the power generation sector based on endogenous renewable energy sources. Therefore, energy efficiency should be the first fuel to be considered in this transition process to avoid unnecessary investments on the supply side, transmission, and distribution of electricity. Mainly, due to the high social and economic impact that this process will have on any country, it is important to identify and recurrently update until 2050, the most cost-effective measures, promoting and encouraging the requalification of lost jobs linked to fossil energy vectors, as well as the creation of new green jobs. Further investigations should be carried out to quantify and optimize the energy efficiency contribution as an energy vector in the energy balance flow.
Author Contributions
Conceptualization, F.M. and P.M.; methodology, F.M.; software, F.M.; validation, F.M., P.M. and A.T.d.A.; formal analysis, F.M.; resources, F.M.; data curation, F.M.; writing—original draft preparation, F.M.; writing—review and editing, F.M., P.M. and A.T.d.A.; supervision, P.M. and A.T.d.A.; project administration, A.T.d.A.; funding acquisition, A.T.d.A. All authors have read and agreed to the published version of the manuscript.
Funding
The authors acknowledge Fundação para a Ciência e a Tecnologia (FCT) for the financial support to the project UIDB/00048/2020.
Data Availability Statement
Publicly available datasets were analyzed in this study. This data can be found here: https://ec.europa.eu/eurostat, accessed on 31 January 2022.
Conflicts of Interest
The authors declare no conflict of interest. The funders had no role in the design of the study; in the collection, analyses, or interpretation of data; in the writing of the manuscript, or in the decision to publish the results.
References
- Diehl, P.F.; Gleditsch, N.P. (Eds.) Environmental Conflict: An Anthology; Routledge: New York, NY, USA, 2019; ISBN 978042950079-4. [Google Scholar]
- Brauch, H.G. Securitizing Global Environmental Change. In Facing Global Environmental Change: Environmental, Human, Energy, Food, Health and Water Security Concepts; Brauch, H.G., Spring, Ú.O., Grin, J., Mesjasz, C., Kameri-Mbote, P., Behera, N.C., Chourou, B., Krummenacher, H., Eds.; Hexagon Series on Human and Environmental Security and Peace; Springer: Berlin/Heidelberg, Germany, 2009; pp. 65–102. ISBN 9783540684886. [Google Scholar]
- Tol, R.S.J. The Economic Impacts of Climate Change. Rev. Environ. Econ. Policy 2018, 12, 4–25. [Google Scholar] [CrossRef] [Green Version]
- Arnell, N.W.; van Vuuren, D.P.; Isaac, M. The Implications of Climate Policy for the Impacts of Climate Change on Global Water Resources. Glob. Environ. Chang. 2011, 21, 592–603. [Google Scholar] [CrossRef] [Green Version]
- Bhuiyan, M.A.; Jabeen, M.; Zaman, K.; Khan, A.; Ahmad, J.; Hishan, S.S. The Impact of Climate Change and Energy Resources on Biodiversity Loss: Evidence from a Panel of Selected Asian Countries. Renew. Energy 2018, 117, 324–340. [Google Scholar] [CrossRef]
- Gasper, R.; Blohm, A.; Ruth, M. Social and Economic Impacts of Climate Change on the Urban Environment. Curr. Opin. Environ. Sustain. 2011, 3, 150–157. [Google Scholar] [CrossRef]
- DeAngelo, J.; Azevedo, I.; Bistline, J.; Clarke, L.; Luderer, G.; Byers, E.; Davis, S.J. Energy Systems in Scenarios at Net-Zero CO2 Emissions. Nat. Commun. 2021, 12, 6096. [Google Scholar] [CrossRef]
- United Nations Framework Convention on Climate Change (UNFCCC)—Summary of GHG Emissions for European Union. Available online: https://di.unfccc.int/ghg_profiles/annexOne/EUA/EUA_ghg_profile.pdf (accessed on 28 December 2021).
- Rogelj, J.; den Elzen, M.; Höhne, N.; Fransen, T.; Fekete, H.; Winkler, H.; Schaeffer, R.; Sha, F.; Riahi, K.; Meinshausen, M. Paris Agreement Climate Proposals Need a Boost to Keep Warming Well below 2 °C. Nature 2016, 534, 631–639. [Google Scholar] [CrossRef] [Green Version]
- Ranger, N.; Gohar, L.K.; Lowe, J.A.; Raper, S.C.B.; Bowen, A.; Ward, R.E. Is It Possible to Limit Global Warming to No More than 1.5 °C?: A Letter. Clim. Chang. 2012, 111, 973–981. [Google Scholar] [CrossRef]
- Dietz, S.; Bowen, A.; Doda, B.; Gambhir, A.; Warren, R. The Economics of 1.5 °C Climate Change. Annu. Rev. Environ. Resour. 2018, 43, 455–480. [Google Scholar] [CrossRef] [Green Version]
- United Nations Environment Programme Emissions Gap Report 2018; UNEP: Nairobi, Kenya, 2019; ISBN 9789280737264.
- Mundaca, L.; Ürge-Vorsatz, D.; Wilson, C. Demand-Side Approaches for Limiting Global Warming to 1.5 °C. Energy Effic. 2019, 12, 343–362. [Google Scholar] [CrossRef] [Green Version]
- Al-mulali, U.; Mohammed, A.H. The Relationship between Energy Consumption and GDP in Emerging Countries. Int. J. Energy Sect. Manag. 2015, 9, 77–93. [Google Scholar] [CrossRef]
- European Environment Agency. Energy Intensity in Europe. Available online: https://www.eea.europa.eu/data-and-maps/indicators/total-primary-energy-intensity-4/assessment-1 (accessed on 29 December 2021).
- Elsevier Enhanced Reader. On the Relationship between Energy Consumption, CO2 Emissions and Economic Growth in Europe. Available online: https://0-reader-elsevier-com.brum.beds.ac.uk/reader/sd/pii/S0360544210003737?token=7DD8C00CB08008E988DE1AB5F972348B13E0CC2C82960FB2F605108B6537880A085A89B801E24D2AB3E0FE224815505D&originRegion=eu-west-1&originCreation=20211229182431 (accessed on 29 December 2021).
- Energy Consumption, CO2 Emissions and Economic Growth in Developed, Emerging and Middle East and North Africa Countries. Elsevier Enhanced Reader. Available online: https://0-reader-elsevier-com.brum.beds.ac.uk/reader/sd/pii/S0360544219305420?token=93472FF0091D2E3F5FE2F3EA47748B08B14E63C198E5A947DB54893DC13C60B6691AC69C01F174AE758719B5B2F7893F&originRegion=eu-west-1&originCreation=20211229174610 (accessed on 29 December 2021).
- EUR-Lex-32018R1999—EN–EUR-Lex. Available online: https://eur-lex.europa.eu/eli/reg/2018/1999/oj (accessed on 3 January 2022).
- Paris Agreement 2015—United Nations. Available online: https://unfccc.int/sites/default/files/english_paris_agreement.pdf (accessed on 14 April 2021).
- Rosenow, J.; Cowart, R.; Bayer, E.; Fabbri, M. Assessing the European Union’s Energy Efficiency Policy: Will the Winter Package Deliver on ‘Efficiency First’? Energy Res. Soc. Sci. 2017, 26, 72–79. [Google Scholar] [CrossRef]
- Sugiyama, M. Climate Change Mitigation and Electrification. Energy Policy 2012, 44, 464–468. [Google Scholar] [CrossRef]
- Martins, F.; Patrão, C.; Moura, P.; de Almeida, A.T. A Review of Energy Modeling Tools for Energy Efficiency in Smart Cities. Smart Cities 2021, 4, 75. [Google Scholar] [CrossRef]
- Barboza, E.P.; Cirach, M.; Khomenko, S.; Iungman, T.; Mueller, N.; Barrera-Gómez, J.; Rojas-Rueda, D.; Kondo, M.; Nieuwenhuijsen, M. Green Space and Mortality in European Cities: A Health Impact Assessment Study. Lancet Planet. Health 2021, 5, e718–e730. [Google Scholar] [CrossRef]
- Parag, Y. Beyond Energy Efficiency: A “Prosumer Market” as an Integrated Platform for Consumer Engagement with the Energy System; ECEEE: Stockholm, Sweden, 2015. [Google Scholar]
- Spiecker, S.; Weber, C. The Future of the European Electricity System and the Impact of Fluctuating Renewable Energy—A Scenario Analysis. Energy Policy 2014, 65, 185–197. [Google Scholar] [CrossRef]
- Glasnovic, Z.; Margeta, J. Vision of Total Renewable Electricity Scenario. Renew. Sustain. Energy Rev. 2011, 15, 1873–1884. [Google Scholar] [CrossRef]
- Fürsch, M.; Hagspiel, S.; Jägemann, C.; Nagl, S.; Lindenberger, D.; Tröster, E. The Role of Grid Extensions in a Cost-Efficient Transformation of the European Electricity System until 2050. Appl. Energy 2013, 104, 642–652. [Google Scholar] [CrossRef] [Green Version]
- Steinke, F.; Wolfrum, P.; Hoffmann, C. Grid vs. Storage in a 100% Renewable Europe. Renew. Energy 2013, 50, 826–832. [Google Scholar] [CrossRef]
- Bertsch, J.; Growitsch, C.; Lorenczik, S.; Nagl, S. Flexibility in Europe’s Power Sector—An Additional Requirement or an Automatic Complement? Energy Econ. 2016, 53, 118–131. [Google Scholar] [CrossRef] [Green Version]
- Elliston, B.; MacGill, I.; Diesendorf, M. Comparing Least Cost Scenarios for 100% Renewable Electricity with Low Emission Fossil Fuel Scenarios in the Australian National Electricity Market. Renew. Energy 2014, 66, 196–204. [Google Scholar] [CrossRef]
- Elsevier Enhanced Reader. Contribution of Renewable Energy Potential to Sustainable Employment. Available online: https://0-reader-elsevier-com.brum.beds.ac.uk/reader/sd/pii/S1877042816310771?token=C5DC42F64FF9A15A2449FD433708F9547256B3FB70193E4BB7E0C3CA3787D370DEB25E2277177B4A53823BA69E0A8034&originRegion=eu-west-1&originCreation=20220103183907 (accessed on 3 January 2022).
- Elsevier Enhanced Reader. Employment from Renewable Energy and Energy Efficiency in Tunisia—New Insights, New Results. Available online: https://0-reader-elsevier-com.brum.beds.ac.uk/reader/sd/pii/S1876610216306014?token=20390D48A8751E81B707901FF8C79AE5EC0C77622E0729835B1BEED93E2259478AE61BA73E327015A169B3D55945743F&originRegion=eu-west-1&originCreation=20220103183941 (accessed on 3 January 2022).
- Elsevier Enhanced Reader. Smart Energy Europe. The Technical and Economic Impact of One Potential 100% Renewable Energy Scenario for the European Union. Available online: https://0-reader-elsevier-com.brum.beds.ac.uk/reader/sd/pii/S1364032116002331?token=EB5FD0151B1ADDFA3118593510AC9866830BE82271DCC3F658C2B875B3F39A3246C62CF4CEA3891A7907260474163ED9&originRegion=eu-west-1&originCreation=20220103184016 (accessed on 3 January 2022).
- De La Peña, L.; Guo, R.; Cao, X.; Ni, X.; Zhang, W. Accelerating the Energy Transition to Achieve Carbon Neutrality. Resour. Conserv. Recycl. 2022, 177, 105957. [Google Scholar] [CrossRef]
- Román-Collado, R.; Economidou, M. The Role of Energy Efficiency in Assessing the Progress towards the EU Energy Efficiency Targets of 2020: Evidence from the European Productive Sectors. Energy Policy 2021, 156, 112441. [Google Scholar] [CrossRef]
- Farnsworth, D.; Shipley, J.; Lazar, J.; Seidman, N. Beneficial Electrification: Ensuring Electrification in the Public Interest; RAP: Montpelier, VT, USA, 2018; 60p. [Google Scholar]
- Communication from the Commission—The European Green Deal COM (2019) 640 Final. Available online: https://eur-lex.europa.eu/legal-content/EN/TXT/HTML/?uri=CELEX:52019DC0640&from=ET (accessed on 28 December 2021).
- Le Treut, G.; Lefèvre, J.; Lallana, F.; Bravo, G. The Multi-Level Economic Impacts of Deep Decarbonization Strategies for the Energy System. Energy Policy 2021, 156, 112423. [Google Scholar] [CrossRef]
- World Energy Outlook 2021—Analysis. Available online: https://www.iea.org/reports/world-energy-outlook-2021 (accessed on 25 January 2022).
- Lund, H.; Mathiesen, B.V. Energy System Analysis of 100% Renewable Energy Systems—The Case of Denmark in Years 2030 and 2050. Energy 2009, 34, 524–531. [Google Scholar] [CrossRef]
- Bogdanov, D.; Gulagi, A.; Fasihi, M.; Breyer, C. Full Energy Sector Transition towards 100% Renewable Energy Supply: Integrating Power, Heat, Transport and Industry Sectors Including Desalination. Appl. Energy 2021, 283, 116273. [Google Scholar] [CrossRef]
- Bogdanov, D.; Ram, M.; Aghahosseini, A.; Gulagi, A.; Oyewo, A.S.; Child, M.; Caldera, U.; Sadovskaia, K.; Farfan, J.; De Souza Noel Simas Barbosa, L.; et al. Low-Cost Renewable Electricity as the Key Driver of the Global Energy Transition towards Sustainability. Energy 2021, 227, 120467. [Google Scholar] [CrossRef]
- Sovacool, B.K.; Monyei, C.G. Positive Externalities of Decarbonization: Quantifying the Full Potential of Avoided Deaths and Displaced Carbon Emissions from Renewable Energy and Nuclear Power. Environ. Sci. Technol. 2021, 55, 5258–5271. [Google Scholar] [CrossRef]
- Ridha, E.; Nolting, L.; Praktiknjo, A. Complexity Profiles: A Large-Scale Review of Energy System Models in Terms of Complexity. Energy Strategy Rev. 2020, 30, 100515. [Google Scholar] [CrossRef]
- Pursiheimo, E.; Holttinen, H.; Koljonen, T. Path toward 100% Renewable Energy Future and Feasibility of Power-to-Gas Technology in Nordic Countries. IET Renew. Power Gener. 2017, 11, 1695–1706. [Google Scholar] [CrossRef]
- Kilickaplan, A.; Bogdanov, D.; Peker, O.; Caldera, U.; Aghahosseini, A.; Breyer, C. An Energy Transition Pathway for Turkey to Achieve 100% Renewable Energy Powered Electricity, Desalination and Non-Energetic Industrial Gas Demand Sectors by 2050. Sol. Energy 2017, 158, 218–235. [Google Scholar] [CrossRef]
- Milan, C.; Bojesen, C.; Nielsen, M.P. A Cost Optimization Model for 100% Renewable Residential Energy Supply Systems. Energy 2012, 48, 118–127. [Google Scholar] [CrossRef]
- Azzuni, A.; Aghahosseini, A.; Ram, M.; Bogdanov, D.; Caldera, U.; Breyer, C. Energy Security Analysis for a 100% Renewable Energy Transition in Jordan by 2050. Sustainability 2020, 12, 4921. [Google Scholar] [CrossRef]
- Electrifying the Developing World Will Help Us All. Here’s How. Available online: https://www.weforum.org/agenda/2019/01/energizing-the-world-how-electrification-will-drive-inclusion/ (accessed on 9 January 2022).
- Boulaire, F.; Love, J.; Mackinnon, I. An Adaptive Renewable Energy Plant (AREP)—To Power Local Premises and Vehicles with 100% Renewables. Energy Strategy Rev. 2021, 38, 100703. [Google Scholar] [CrossRef]
- Pleßmann, G.; Erdmann, M.; Hlusiak, M.; Breyer, C. Global Energy Storage Demand for a 100% Renewable Electricity Supply. Energy Procedia 2014, 46, 22–31. [Google Scholar] [CrossRef] [Green Version]
- Hrnčić, B.; Pfeifer, A.; Jurić, F.; Duić, N.; Ivanović, V.; Vušanović, I. Different Investment Dynamics in Energy Transition towards a 100% Renewable Energy System. Energy 2021, 237, 121526. [Google Scholar] [CrossRef]
- Hansen, K.; Mathiesen, B.V.; Skov, I.R. Full Energy System Transition towards 100% Renewable Energy in Germany in 2050. Renew. Sustain. Energy Rev. 2019, 102, 1–13. [Google Scholar] [CrossRef]
- Icaza, D.; Borge-Diez, D.; Galindo, S.P. Proposal of 100% Renewable Energy Production for the City of Cuenca- Ecuador by 2050. Renew. Energy 2021, 170, 1324–1341. [Google Scholar] [CrossRef]
- Connolly, D.; Lund, H.; Mathiesen, B.V.; Leahy, M. The First Step towards a 100% Renewable Energy-System for Ireland. Appl. Energy 2011, 88, 502–507. [Google Scholar] [CrossRef]
- Painuly, J.P. Barriers to Renewable Energy Penetration; a Framework for Analysis. Renew. Energy 2001, 24, 73–89. [Google Scholar] [CrossRef]
- Arent, D.J.; Wise, A.; Gelman, R. The Status and Prospects of Renewable Energy for Combating Global Warming. Energy Econ. 2011, 33, 584–593. [Google Scholar] [CrossRef]
- Breyer, C.; Bogdanov, D.; Khalili, S.; Keiner, D. Solar Photovoltaics in 100% Renewable Energy Systems. In Encyclopedia of Sustainability Science and Technology; Meyers, R.A., Ed.; Springer: New York, NY, USA, 2021; pp. 1–30. ISBN 9781493924936. [Google Scholar]
- Llamosas, C.; Sovacool, B.K. The Future of Hydropower? A Systematic Review of the Drivers, Benefits and Governance Dynamics of Transboundary Dams. Renew. Sustain. Energy Rev. 2021, 137, 110495. [Google Scholar] [CrossRef]
- Dincer, F. The Analysis on Wind Energy Electricity Generation Status, Potential and Policies in the World. Renew. Sustain. Energy Rev. 2011, 15, 5135–5142. [Google Scholar] [CrossRef]
- Li, Q.; Wang, J.; Zhang, H. Comparison of the Goodness-of-Fit of Intelligent-Optimized Wind Speed Distributions and Calculation in High-Altitude Wind-Energy Potential Assessment. Energy Convers. Manag. 2021, 247, 114737. [Google Scholar] [CrossRef]
- Jung, C.; Schindler, D. On the Influence of Wind Speed Model Resolution on the Global Technical Wind Energy Potential. Renew. Sustain. Energy Rev. 2022, 156, 112001. [Google Scholar] [CrossRef]
- Diaconita, A.; Andrei, G.; Rusu, L. New Insights into the Wind Energy Potential of the West Black Sea Area Based on the North Sea Wind Farms Model. Energy Rep. 2021, 7, 112–118. [Google Scholar] [CrossRef]
- Di Fraia, S.; Fabozzi, S.; Macaluso, A.; Vanoli, L. Energy Potential of Residual Biomass from Agro-Industry in a Mediterranean Region of Southern Italy (Campania). J. Clean. Prod. 2020, 277, 124085. [Google Scholar] [CrossRef]
- Golombek, R.; Lind, A.; Ringkjøb, H.-K.; Seljom, P. The Role of Transmission and Energy Storage in European Decarbonization towards 2050. Energy 2022, 239, 122159. [Google Scholar] [CrossRef]
- Directive (EU) 2018/2002 of the European Parliament and of the Council of 11 December 2018 Amending Directive 2012/27/EU on Energy Efficiency (Text with EEA Relevance); European Parliament: Strasbourg, France, 2018; Volume 328.
- Directive (EU) 2019/944 of the European Parliament and of the Council of 5 June 2019 on Common Rules for the Internal Market for Electricity and Amending Directive 2012/27/EU (Text with EEA Relevance); European Parliament: Strasbourg, France, 2019; Volume 158.
- Commission Regulation (EU) No 548/2014 of 21 May 2014 on Implementing Directive 2009/125/EC of the European Parliament and of the Council with Regard to Small, Medium and Large Power Transformers; European Parliament: Strasbourg, France, 2014; Volume 152.
- Santos, B.; de Almeida, A.; Martins, F. Energy-Efficient Distribution Transformers in Europe: Impact of Ecodesign Regulation. Energy Effic. 2016, 9.2, 401–424. [Google Scholar] [CrossRef]
- Quezada, V.H.M.; Abbad, J.R.; Roman, T.G.S. Assessment of Energy Distribution Losses for Increasing Penetration of Distributed Generation. IEEE Trans. Power Syst. 2006, 21, 533–540. [Google Scholar] [CrossRef]
- González-Longatt, F.M. Impact of Distributed Generation over Power Losses on Distribution System. In Proceedings of the 9th International Conference on Electrical Power Quality and Utilization, Barcelona, Spain, 9–11 October 2007. [Google Scholar]
- Marinopoulos, A.G.; Alexiadis, M.C.; Dokopoulos, P.S. Energy Losses in a Distribution Line with Distributed Generation Based on Stochastic Power Flow. Electr. Power Syst. Res. 2011, 81, 1986–1994. [Google Scholar] [CrossRef]
- Delfanti, M.; Falabretti, D.; Merlo, M. Dispersed Generation Impact on Distribution Network Losses. Electr. Power Syst. Res. 2013, 97, 10–18. [Google Scholar] [CrossRef]
- Ma, C.; Dasenbrock, J.; Töbermann, J.-C.; Braun, M. A Novel Indicator for Evaluation of the Impact of Distributed Generations on the Energy Losses of Low Voltage Distribution Grids. Appl. Energy 2019, 242, 674–683. [Google Scholar] [CrossRef]
- Usman, M.; Coppo, M.; Bignucolo, F.; Turri, R. Losses Management Strategies in Active Distribution Networks: A Review. Electr. Power Syst. Res. 2018, 163, 116–132. [Google Scholar] [CrossRef]
- Kakran, S.; Chanana, S. Smart Operations of Smart Grids Integrated with Distributed Generation: A Review. Renew. Sustain. Energy Rev. 2018, 81, 524–535. [Google Scholar] [CrossRef]
- Jayachandran, M.; Rao, K.P.; Gatla, R.K.; Kalaivani, C.; Kalaiarasy, C.; Logasabarirajan, C. Operational Concerns and Solutions in Smart Electricity Distribution Systems. Util. Policy 2022, 74, 101329. [Google Scholar] [CrossRef]
- Otuoze, A.O.; Mustafa, M.W.; Larik, R.M. Smart Grids Security Challenges: Classification by Sources of Threats. J. Electr. Syst. Inf. Technol. 2018, 5, 468–483. [Google Scholar] [CrossRef]
- Chandel, P.; Thakur, T.; Sawle, B.A.; Sharma, R. Power Theft: Major Cause of Non Technical Losses in Indian Distribution Sector. In Proceedings of the 2016 IEEE 7th Power India International Conference (PIICON), Bikaner, India, 25–27 November 2016; pp. 1–6. [Google Scholar]
- Antmann, P. Reducing Technical and Non-Technical Losses in the Power Sector; World Bank: Washington, DC, USA, 2009. [Google Scholar]
- Gold, R. Status Report on Electrification Policy: Where to Next? Curr. Sustain. Renew. Energy Rep. 2021, 8, 114–122. [Google Scholar] [CrossRef]
- Nadel, S. Electrification in the Transportation, Buildings, and Industrial Sectors: A Review of Opportunities, Barriers, and Policies. Curr. Sustain. Renew. Energy Rep. 2019, 6, 158–168. [Google Scholar] [CrossRef]
- Davis, L.W. What Matters for Electrification? Evidence from 70 Years of U.S. Home Heating Choices; Working Paper Series; National Bureau of Economic Research: Cambridge, MA, USA, 2021. [Google Scholar]
- Røpke, I.; Haunstrup Christensen, T.; Ole Jensen, J. Information and Communication Technologies—A New Round of Household Electrification. Energy Policy 2010, 38, 1764–1773. [Google Scholar] [CrossRef] [Green Version]
- Shipley, J.; Lazar, J.; Farnsworth, D.; Kadoch, C. Beneficial Electrification of Space Heating; RAP: Montpelier, VT, USA, 2018; 52p. [Google Scholar]
- Farnsworth, D.; Lazar, J.; Shipley, J. Beneficial Electrification of Water Heating; RAP: Montpelier, VT, USA, 2019; 56p. [Google Scholar]
- Heinen, S.; Turner, W.; Cradden, L.; McDermott, F.; O’Malley, M. Electrification of Residential Space Heating Considering Coincidental Weather Events and Building Thermal Inertia: A System-Wide Planning Analysis. Energy 2017, 127, 136–154. [Google Scholar] [CrossRef]
- Salimifard, P.; Buonocore, J.J.; Konschnik, K.; Azimi, P.; VanRy, M.; Cedeno Laurent, J.G.; Hernández, D.; Allen, J.G. Climate Policy Impacts on Building Energy Use, Emissions, and Health: New York City Local Law 97. Energy 2022, 238, 121879. [Google Scholar] [CrossRef]
- Deason, J.; Borgeson, M. Electrification of Buildings: Potential, Challenges, and Outlook. Curr. Sustain. Renew. Energy Rep. 2019, 6, 131–139. [Google Scholar] [CrossRef]
- Lechtenböhmer, S.; Nilsson, L.J.; Åhman, M.; Schneider, C. Decarbonising the Energy Intensive Basic Materials Industry through Electrification—Implications for Future EU Electricity Demand. Energy 2016, 115, 1623–1631. [Google Scholar] [CrossRef] [Green Version]
- Chen, C.; Lu, Y.; Banares-Alcantara, R. Direct and Indirect Electrification of Chemical Industry Using Methanol Production as a Case Study. Appl. Energy 2019, 243, 71–90. [Google Scholar] [CrossRef]
- Schiffer, Z.J.; Manthiram, K. Electrification and Decarbonization of the Chemical Industry. Joule 2017, 1, 10–14. [Google Scholar] [CrossRef] [Green Version]
- Deason, J.; Wei, M.; Leventis, G.; Smith, S.; Schwartz, L.C. Electrification of Buildings and Industry in the United States: Drivers, Barriers, Prospects, and Policy Approaches; Lawrence Berkeley National Lab. (LBNL): Berkeley, CA, USA, 2018. [Google Scholar]
- Elmegaard, B.; Arjomand Kermani, N.; Bühler, F.; Nguyen, T.-V.; Bergamini, R.; Zühlsdorf, B.; Dupond Holdt, F.; Müller Holm, F.; Sandstrøm Petersen, M.; Helk, A.; et al. Electrification of Processes and Technologies for Danish Industry: Elforsk Project 350-038: Final Report; Technical University of Denmark: Lyngby, Denmark, 2021. [Google Scholar]
- Åhman, M.; Nilsson, L.J.; Johansson, B. Global Climate Policy and Deep Decarbonization of Energy-Intensive Industries. Clim. Policy 2017, 17, 634–649. [Google Scholar] [CrossRef] [Green Version]
- Luh, S.; Budinis, S.; Giarola, S.; Schmidt, T.J.; Hawkes, A. Long-Term Development of the Industrial Sector—Case Study about Electrification, Fuel Switching, and CCS in the USA. Comput. Chem. Eng. 2020, 133, 106602. [Google Scholar] [CrossRef]
- Roelofsen, O.; Somers, K.; Speelman, E.; Witteveen, M. Plugging in: What Electrification Can Do for Industry; McKinsey: New York, NY, USA, 2020. [Google Scholar]
- Lema, R.; Andersen, M.H.; Hanlin, R.; Nzila, C. Renewable Electrification Pathways and Sustainable Industrialisation: Lessons Learned and Their Implications. In Building Innovation Capabilities for Sustainable Industrialisation; Routledge: London, UK, 2021; ISBN 978-1-00-305466-5. [Google Scholar]
- Dydkowski, G.; Gnap, J.; Urbanek, A. Electrification of Public Transport Bus Fleet: Identification of Business and Financing Models. Commun. Sci. Lett. Univ. Zilina 2021, 23, A137–A149. [Google Scholar] [CrossRef]
- Edelenbosch, O.Y.; Hof, A.F.; Nykvist, B.; Girod, B.; van Vuuren, D.P. Transport Electrification: The Effect of Recent Battery Cost Reduction on Future Emission Scenarios. Clim. Chang. 2018, 151, 95–108. [Google Scholar] [CrossRef] [Green Version]
- Ruhnau, O.; Bannik, S.; Otten, S.; Praktiknjo, A.; Robinius, M. Direct or Indirect Electrification? A Review of Heat Generation and Road Transport Decarbonisation Scenarios for Germany 2050. Energy 2019, 166, 989–999. [Google Scholar] [CrossRef] [Green Version]
- Green Growth Knowledge Platform. Profitably Decarbonizing Heavy Transport and Industrial Heat. Available online: https://www.greengrowthknowledge.org/research/profitably-decarbonizing-heavy-transport-and-industrial-heat (accessed on 25 January 2022).
- Xylia, M.; Leduc, S.; Laurent, A.-B.; Patrizio, P.; van der Meer, Y.; Kraxner, F.; Silveira, S. Impact of Bus Electrification on Carbon Emissions: The Case of Stockholm. J. Clean. Prod. 2019, 209, 74–87. [Google Scholar] [CrossRef] [Green Version]
- Farnsworth, D.; Shipley, J.; Sliger, J.; Lazar, J. Beneficial Electrification of Transportation; RAP: Montpelier, VT, USA, 2019; 84p. [Google Scholar]
- Nadolny, A.; Cheng, C.; Lu, B.; Blakers, A.; Stocks, M. Fully Electrified Land Transport in 100% Renewable Electricity Networks Dominated by Variable Generation. Renew. Energy 2022, 182, 562–577. [Google Scholar] [CrossRef]
- Liu, W.; Lin, B. Electrification of Rails in China: Its Impact on Energy Conservation and Emission Reduction. Energy 2021, 226, 120363. [Google Scholar] [CrossRef]
- Aatif, S.; Hu, H.; Rafiq, F.; He, Z. Analysis of Rail Potential and Stray Current in MVDC Railway Electrification System. Rail. Eng. Sci. 2021, 29, 394–407. [Google Scholar] [CrossRef]
- Rosenberger, K.; Tapia, R.; Friedrich, H.; Flämig, H. Estimating the Potential of Electric Mobility in Commercial Transport Considering the Availability of Charging Infrastructure—A Behavioural Model Analysis for the City of Hamburg. Res. Transp. Bus. Manag. 2022, 100772, in press. [Google Scholar] [CrossRef]
- Lerede, D.; Pinto, G.; Saccone, M.; Bustreo, C.; Capozzoli, A.; Savoldi, L. Application of a Stochastic Multicriteria Acceptability Analysis to Support Decision-Making within a Macro-Scale Energy Model: Case Study of the Electrification of the Road European Transport Sector. Energy 2021, 236, 121444. [Google Scholar] [CrossRef]
- Camilleri, R.; Attard, M.; Hickman, R. Future Low-Carbon Transport Scenarios: Practice Theory-Based Visioning for Backcasting Studies. Sustainability 2022, 14, 74. [Google Scholar] [CrossRef]
- Fernández, R.Á. Method for Assessing the Environmental Benefit of Road Transport Electrification and Its Influence on Greenhouse Gas Inventories. J. Clean. Prod. 2019, 218, 476–485. [Google Scholar] [CrossRef]
- Guo, Y.; Kelly, J.A.; Clinch, J.P. Road Transport Electrification—Is Timing Everything? Implications of Emissions Analysis’ Outcomes for Climate and Air Policy. Transp. Res. Interdiscip. Perspect. 2021, 12, 100478. [Google Scholar] [CrossRef]
- Kouridis, C.; Vlachokostas, C. Towards Decarbonizing Road Transport: Environmental and Social Benefit of Vehicle Fleet Electrification in Urban Areas of Greece. Renew. Sustain. Energy Rev. 2022, 153, 111775. [Google Scholar] [CrossRef]
- Knoop, K.; Lechtenböhmer, S. The Potential for Energy Efficiency in the EU Member States—A Comparison of Studies. Renew. Sustain. Energy Rev. 2017, 68, 1097–1105. [Google Scholar] [CrossRef] [Green Version]
- Giraudet, L.-G. Energy Efficiency as a Credence Good: A Review of Informational Barriers to Energy Savings in the Building Sector. Energy Econ. 2020, 87, 104698. [Google Scholar] [CrossRef]
- Boza-Kiss, B.; Moles-Grueso, S.; Urge-Vorsatz, D. Evaluating Policy Instruments to Foster Energy Efficiency for the Sustainable Transformation of Buildings. Curr. Opin. Environ. Sustain. 2013, 5, 163–176. [Google Scholar] [CrossRef]
- Strielkowski, W.; Volkova, E.; Pushkareva, L.; Streimikiene, D. Innovative Policies for Energy Efficiency and the Use of Renewables in Households. Energies 2019, 12, 1392. [Google Scholar] [CrossRef] [Green Version]
- Economidou, M.; Todeschi, V.; Bertoldi, P.; D’Agostino, D.; Zangheri, P.; Castellazzi, L. Review of 50 years of EU Energy Efficiency Policies for Buildings. Energy Build. 2020, 225, 110322. [Google Scholar] [CrossRef]
- Menna, C.; Felicioni, L.; Negro, P.; Lupíšek, A.; Romano, E.; Prota, A.; Hájek, P. Review of Methods for the Combined Assessment of Seismic Resilience and Energy Efficiency towards Sustainable Retrofitting of Existing European Buildings. Sustain. Cities Soc. 2022, 77, 103556. [Google Scholar] [CrossRef]
- Cagno, E.; Worrell, E.; Trianni, A.; Pugliese, G. A Novel Approach for Barriers to Industrial Energy Efficiency. Renew. Sustain. Energy Rev. 2013, 19, 290–308. [Google Scholar] [CrossRef]
- Johansson, M.T.; Thollander, P. A Review of Barriers to and Driving Forces for Improved Energy Efficiency in Swedish Industry—Recommendations for Successful in-House Energy Management. Renew. Sustain. Energy Rev. 2018, 82, 618–628. [Google Scholar] [CrossRef]
- Brunke, J.-C.; Johansson, M.; Thollander, P. Empirical Investigation of Barriers and Drivers to the Adoption of Energy Conservation Measures, Energy Management Practices and Energy Services in the Swedish Iron and Steel Industry. J. Clean. Prod. 2014, 84, 509–525. [Google Scholar] [CrossRef] [Green Version]
- Cagno, E.; Trianni, A. Evaluating the Barriers to Specific Industrial Energy Efficiency Measures: An Exploratory Study in Small and Medium-Sized Enterprises. J. Clean. Prod. 2014, 82, 70–83. [Google Scholar] [CrossRef]
- Cagno, E.; Moschetta, D.; Trianni, A. Only Non-Energy Benefits from the Adoption of Energy Efficiency Measures? A Novel Framework. J. Clean. Prod. 2019, 212, 1319–1333. [Google Scholar] [CrossRef]
- Levinson, A. Energy Efficiency Standards Are More Regressive Than Energy Taxes: Theory and Evidence. J. Assoc. Environ. Resour. Econ. 2019, 6, S7–S36. [Google Scholar] [CrossRef] [Green Version]
- Backlund, S.; Thollander, P.; Palm, J.; Ottosson, M. Extending the Energy Efficiency Gap. Energy Policy 2012, 51, 392–396. [Google Scholar] [CrossRef] [Green Version]
- Dabbous, A.; Tarhini, A. Does Sharing Economy Promote Sustainable Economic Development and Energy Efficiency? Evidence from OECD Countries. J. Innov. Knowl. 2021, 6, 58–68. [Google Scholar] [CrossRef]
- Sun, H.; Edziah, B.K.; Kporsu, A.K.; Sarkodie, S.A.; Taghizadeh-Hesary, F. Energy Efficiency: The Role of Technological Innovation and Knowledge Spillover. Technol. Forecast. Soc. Chang. 2021, 167, 120659. [Google Scholar] [CrossRef]
- Fawcett, T.; Killip, G. Re-Thinking Energy Efficiency in European Policy: Practitioners’ Use of ‘Multiple Benefits’ Arguments. J. Clean. Prod. 2019, 210, 1171–1179. [Google Scholar] [CrossRef]
- Kamal, A.; Al-Ghamdi, S.G.; Koc, M. Revaluing the Costs and Benefits of Energy Efficiency: A Systematic Review. Energy Res. Soc. Sci. 2019, 54, 68–84. [Google Scholar] [CrossRef]
- Zangheri, P.; Economidou, M.; Labanca, N. Progress in the Implementation of the EU Energy Efficiency Directive through the Lens of the National Annual Reports. Energies 2019, 12, 1107. [Google Scholar] [CrossRef] [Green Version]
- Sa, A.; Thollander, P.; Cagno, E. Assessing the Driving Factors for Energy Management Program Adoption. Renew. Sustain. Energy Rev. 2017, 74, 538–547. [Google Scholar] [CrossRef]
- Sudhakara Reddy, B. Barriers and Drivers to Energy Efficiency—A New Taxonomical Approach. Energy Convers. Manag. 2013, 74, 403–416. [Google Scholar] [CrossRef] [Green Version]
- Brockway, P.E.; Sorrell, S.; Semieniuk, G.; Heun, M.K.; Court, V. Energy Efficiency and Economy-Wide Rebound Effects: A Review of the Evidence and Its Implications. Renew. Sustain. Energy Rev. 2021, 141, 110781. [Google Scholar] [CrossRef]
- Wei, T.; Liu, Y. Estimation of Global Rebound Effect Caused by Energy Efficiency Improvement. Energy Econ. 2017, 66, 27–34. [Google Scholar] [CrossRef]
- Saunders, H.D. Historical Evidence for Energy Efficiency Rebound in 30 US Sectors and a Toolkit for Rebound Analysts. Technol. Forecast. Soc. Chang. 2013, 80, 1317–1330. [Google Scholar] [CrossRef]
- D’Aprile, P.; Engel, H.; van Gendt, G.; Helmcke, S.; Hieronimus, S.; Nauclér, T.; Pinner, D.; Walter, D.; Witteveen, M. Net-Zero Europe—Decarbonization Pathways and Socioeconomic Implications; McKinsey: New York, NY, USA, 2020. [Google Scholar]
- U.S. Energy Information Administration (EIA). Electric Power Sector CO2 Emissions Drop as Generation Mix Shifts from Coal to Natural Gas—Today in Energy. Available online: https://www.eia.gov/todayinenergy/detail.php?id=48296 (accessed on 15 January 2022).
- McKinsey & Company. The Net-Zero Transition: Its Cost and Benefits. Sustainability. Available online: https://www.mckinsey.com/business-functions/sustainability/our-insights/the-net-zero-transition-what-it-would-cost-what-it-could-bring (accessed on 31 January 2022).
- Lebel, E.D.; Finnegan, C.J.; Ouyang, Z.; Jackson, R.B. Methane and NOx Emissions from Natural Gas Stoves, Cooktops, and Ovens in Residential Homes. Environ. Sci. Technol. 2022, 56, 2529–2539. [Google Scholar] [CrossRef] [PubMed]
- International Energy Agency. Portugal 2021 Energy Policy Review; IEA Energy Policy Reviews; OECD: Paris, France, 2021; ISBN 978-92-64-88413-7. [Google Scholar]
Figure 1.
Trends in energy intensity, gross domestic product, and gross inland energy consumption in the European Union (created using data from [15]).
Figure 1.
Trends in energy intensity, gross domestic product, and gross inland energy consumption in the European Union (created using data from [15]).

Figure 2.
The European Green Deal (created using data from [37]).
Figure 2.
The European Green Deal (created using data from [37]).

Figure 3.
International Energy Agency (IEA) estimate of the evolution of CO2 emissions between 2020 and 2050 considering three different scenarios. Adopted from [39].
Figure 3.
International Energy Agency (IEA) estimate of the evolution of CO2 emissions between 2020 and 2050 considering three different scenarios. Adopted from [39].

Figure 4.
Different energy phases of the energy balance.

Figure 5.
Characteristics of the energy system to achieve the decarbonization of the energy sector.

Figure 6.
Multiple Energy Efficiency associated benefits.

Figure 7.
Total CAPEX in EU-27, broken down by sector for the period 2021 to 2050 (created using data from [137]).
Figure 7.
Total CAPEX in EU-27, broken down by sector for the period 2021 to 2050 (created using data from [137]).

Figure 8.
Total CAPEX in EU-27, broken down by sector per decade, for the period 2021 to 2050 (created using data from [137]).
Figure 8.
Total CAPEX in EU-27, broken down by sector per decade, for the period 2021 to 2050 (created using data from [137]).

Figure 9.
Portuguese energy balance flow according to the four phases of the analysis–2019 data (adopted from Eurostat data).
Figure 9.
Portuguese energy balance flow according to the four phases of the analysis–2019 data (adopted from Eurostat data).

Figure 10.
Portuguese energy mix available from all sources in ktoe (adopted from Eurostat data).

Figure 11.
Portuguese energy mixes available in 2019 from all sources (adopted from Eurostat data).

Figure 12.
Portuguese energy balance flow for energy available from all sources–2019 data (adopted from Eurostat data).
Figure 12.
Portuguese energy balance flow for energy available from all sources–2019 data (adopted from Eurostat data).

Figure 13.
Portuguese energy balance flow for energy transformation–2019 data (adopted from Eurostat data).
Figure 13.
Portuguese energy balance flow for energy transformation–2019 data (adopted from Eurostat data).

Figure 14.
Fuels going into Portuguese electricity and heat generation–2019 data (adopted from Eurostat data).
Figure 14.
Fuels going into Portuguese electricity and heat generation–2019 data (adopted from Eurostat data).

Figure 15.
Portuguese energy mix available after transformation in 2019 (adopted from Eurostat data).
Figure 15.
Portuguese energy mix available after transformation in 2019 (adopted from Eurostat data).

Figure 16.
Portuguese energy balance flow for energy available after transformation–2019 data (adopted from Eurostat data).
Figure 16.
Portuguese energy balance flow for energy available after transformation–2019 data (adopted from Eurostat data).

Figure 17.
Weight of each destination of available energy after transformation in Portugal–2019 data (adopted from Eurostat data).
Figure 17.
Weight of each destination of available energy after transformation in Portugal–2019 data (adopted from Eurostat data).

Figure 18.
Portuguese energy balance flow concerning the destination of available energy after transformation–2019 data (adopted from Eurostat data).
Figure 18.
Portuguese energy balance flow concerning the destination of available energy after transformation–2019 data (adopted from Eurostat data).

Figure 19.
Fuels going into exports in Portuguese energy balance flow in 2019 (adopted from Eurostat data).
Figure 19.
Fuels going into exports in Portuguese energy balance flow in 2019 (adopted from Eurostat data).

Figure 20.
Fuels going through final energy consumption–2019 data (adopted from Eurostat data).

Figure 21.
Portuguese energy balance of final consumption–2019 data (adopted from Eurostat data).

Figure 22.
Oil and petroleum products going through final energy consumption–2019 data (adopted from Eurostat data).
Figure 22.
Oil and petroleum products going through final energy consumption–2019 data (adopted from Eurostat data).

Figure 23.
Portuguese energy balance flow for oil and petroleum products vector in final energy consumption–2019 data (adopted from Eurostat data).
Figure 23.
Portuguese energy balance flow for oil and petroleum products vector in final energy consumption–2019 data (adopted from Eurostat data).

Figure 24.
Portuguese energy balance flow for natural gas vector in final energy consumption–2019 data (adopted from Eurostat data).
Figure 24.
Portuguese energy balance flow for natural gas vector in final energy consumption–2019 data (adopted from Eurostat data).

Figure 25.
Fuels available from all sources in the EU-27 in 2019 (adopted from Eurostat data).


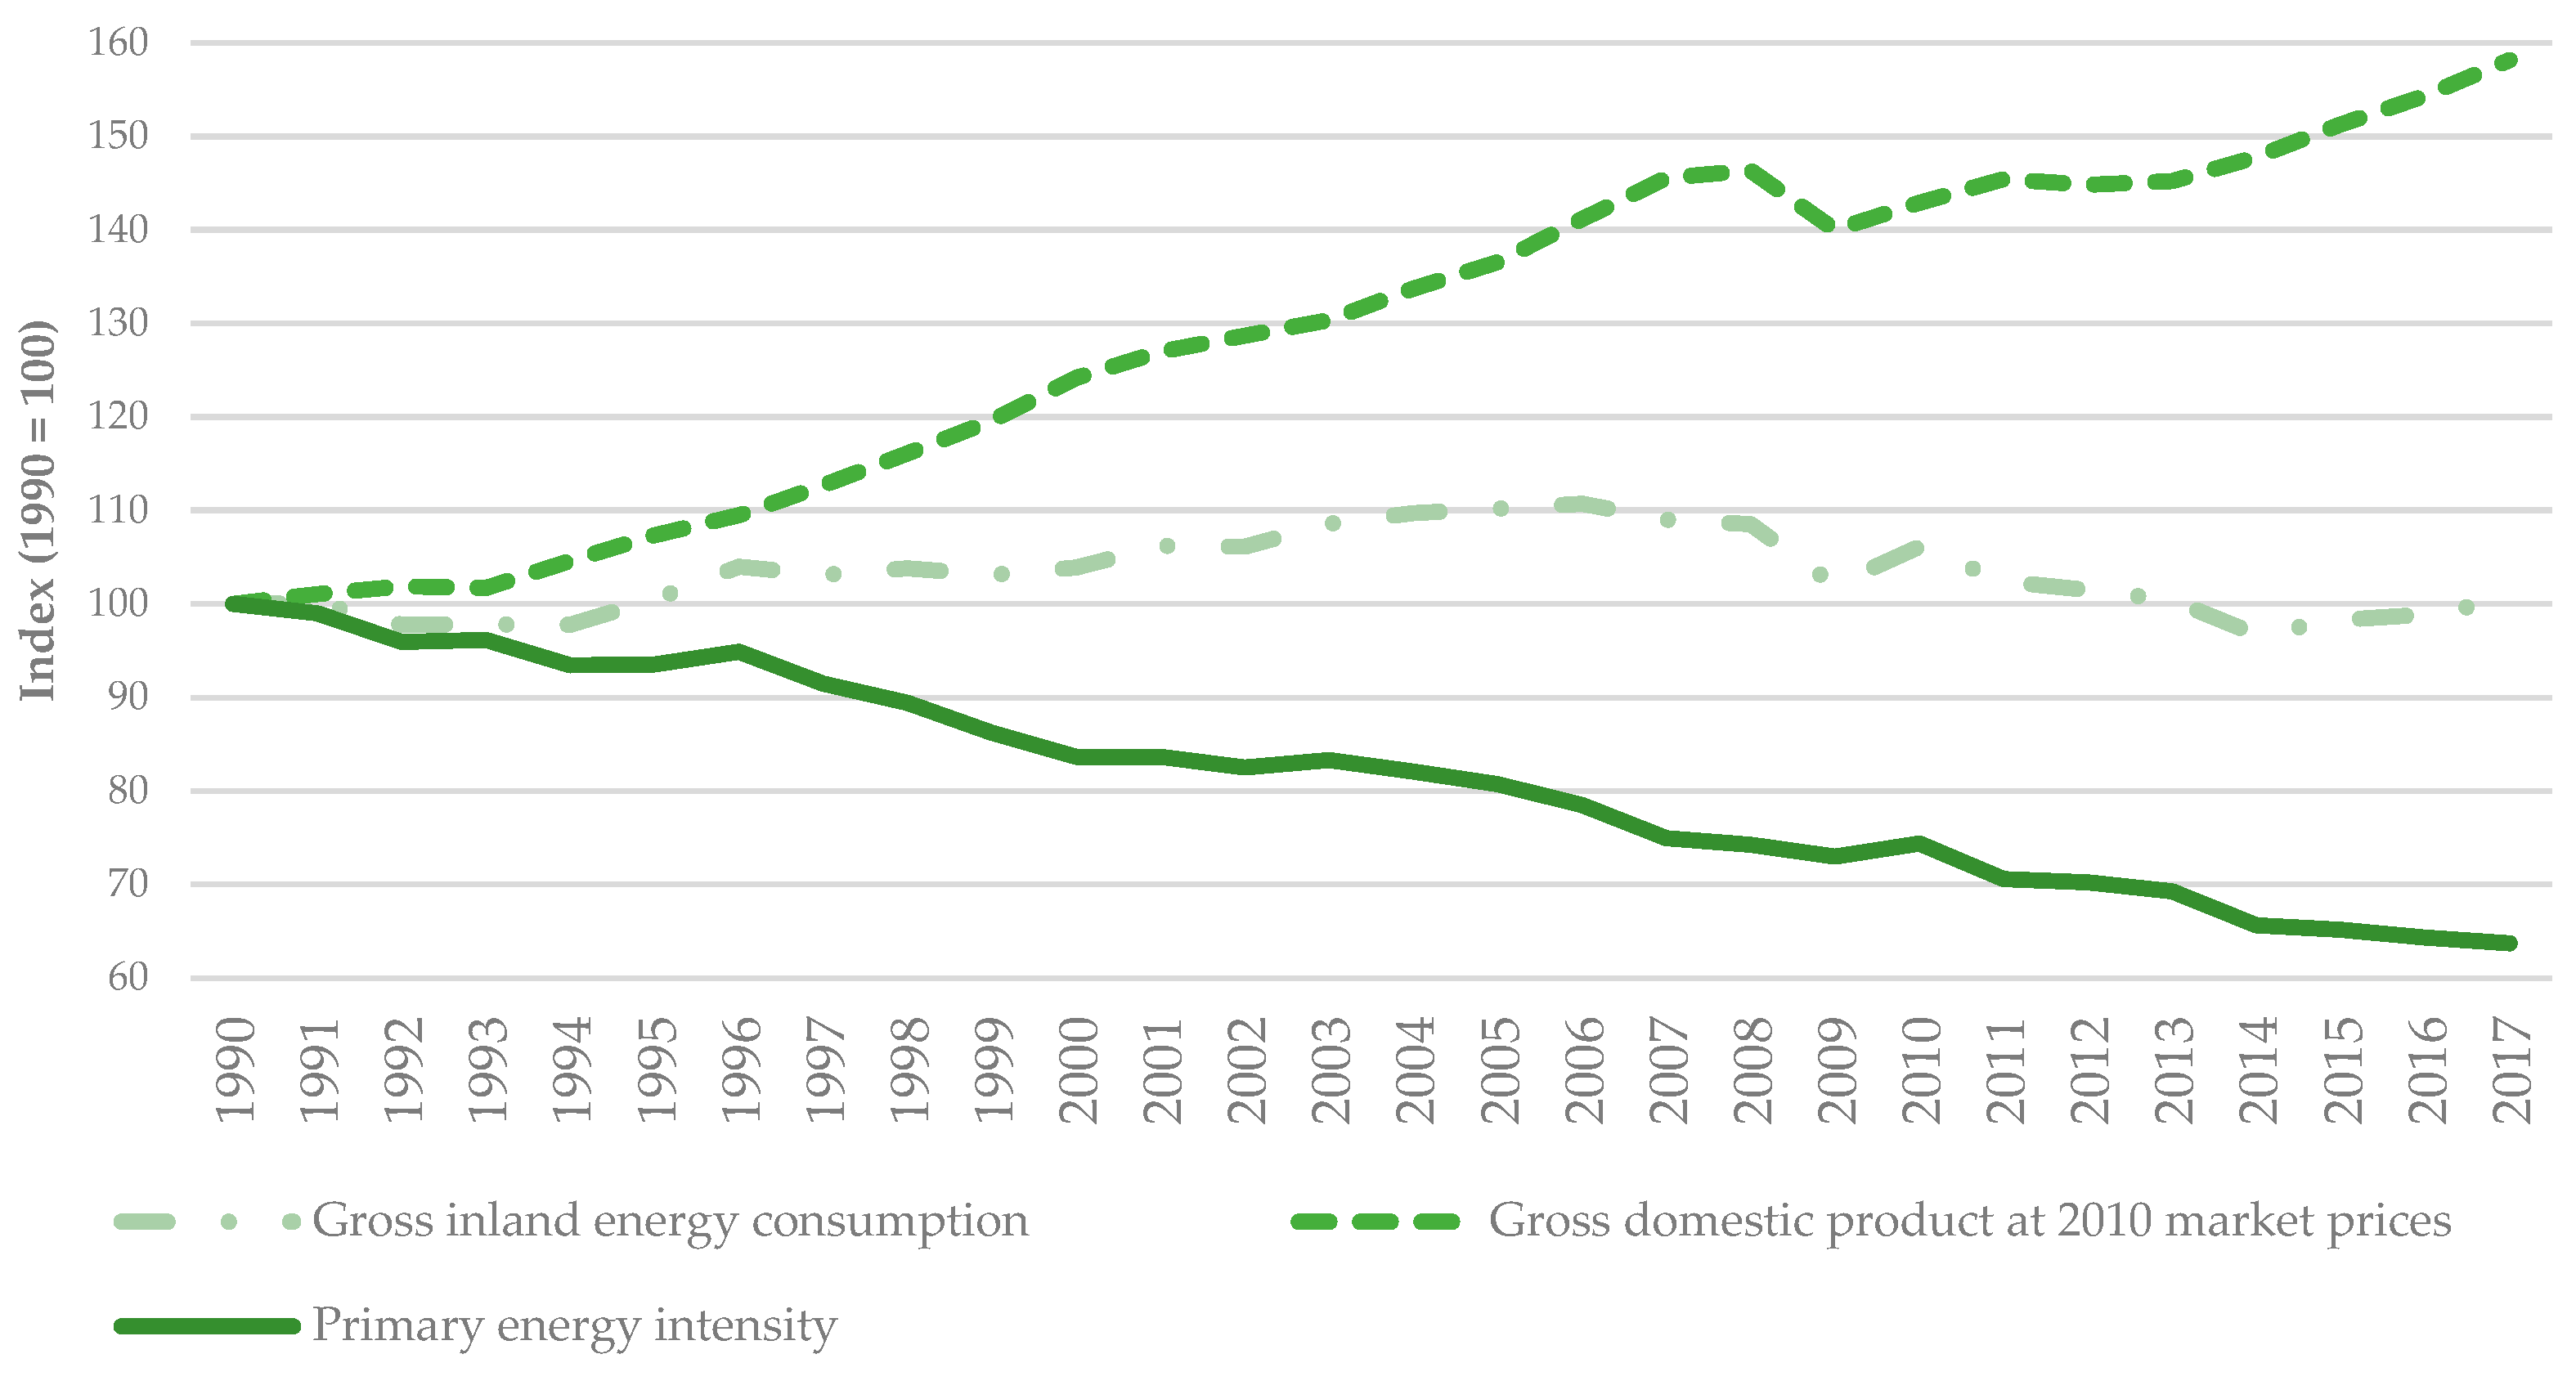
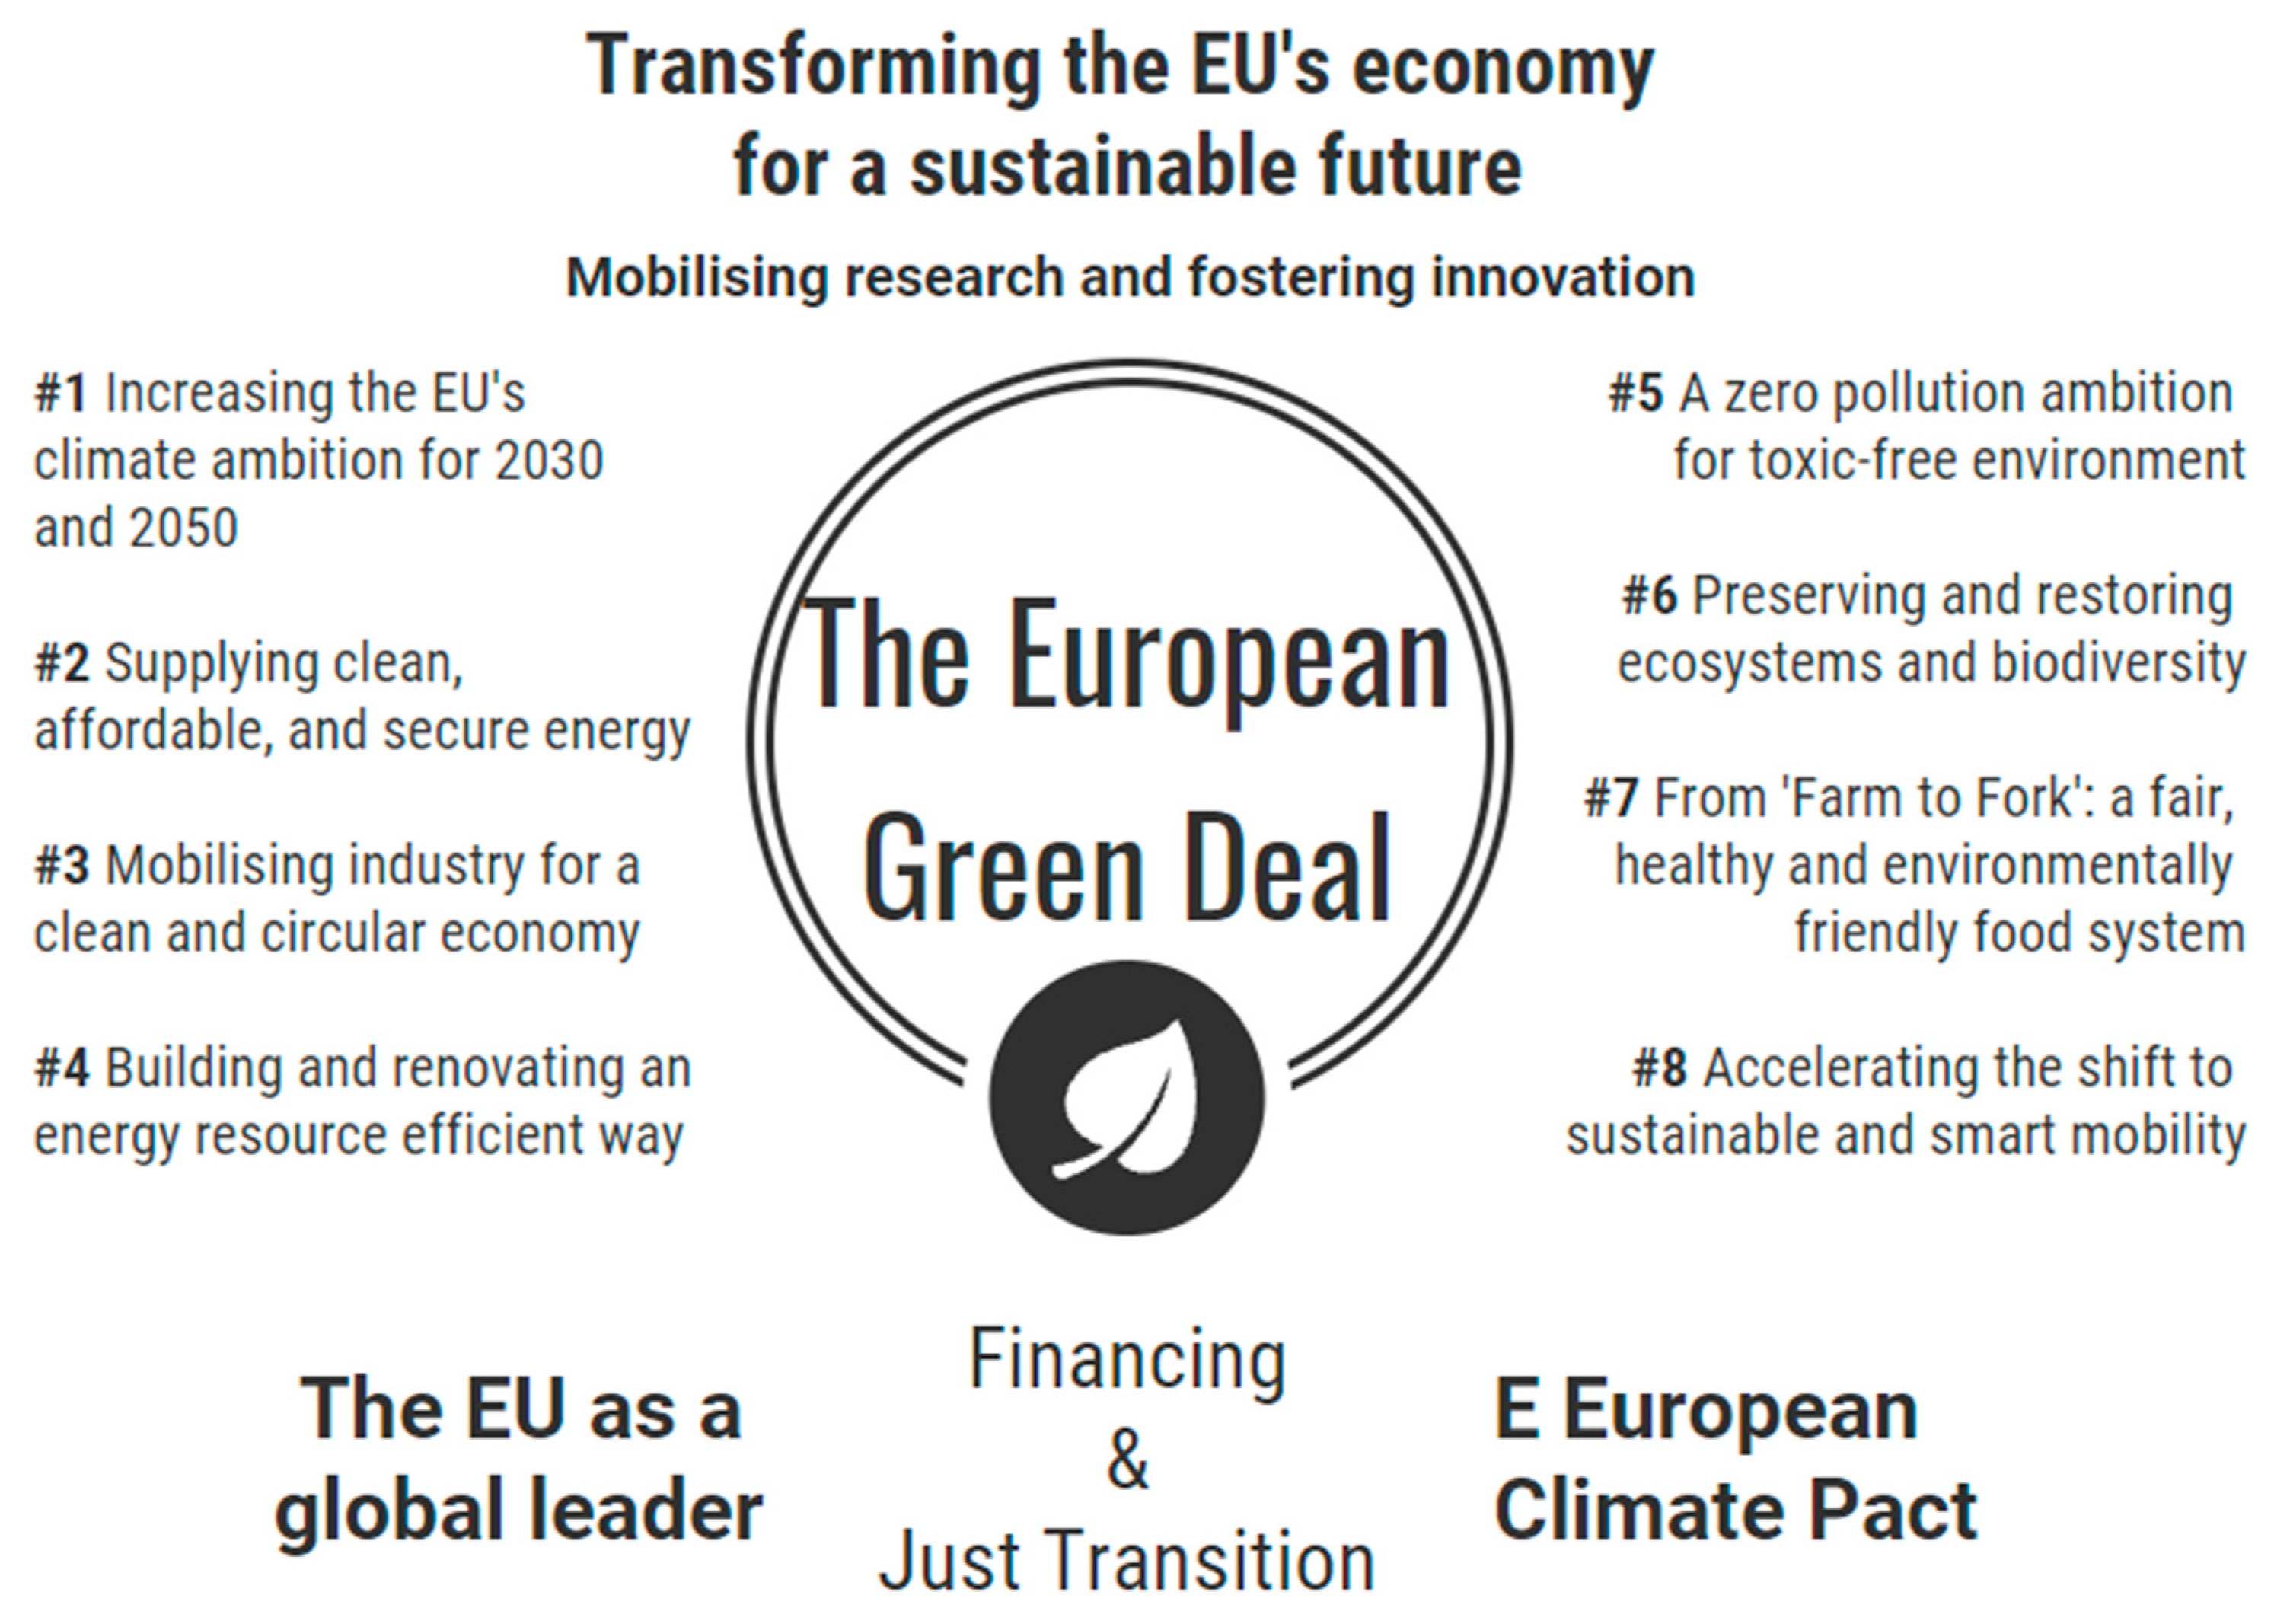
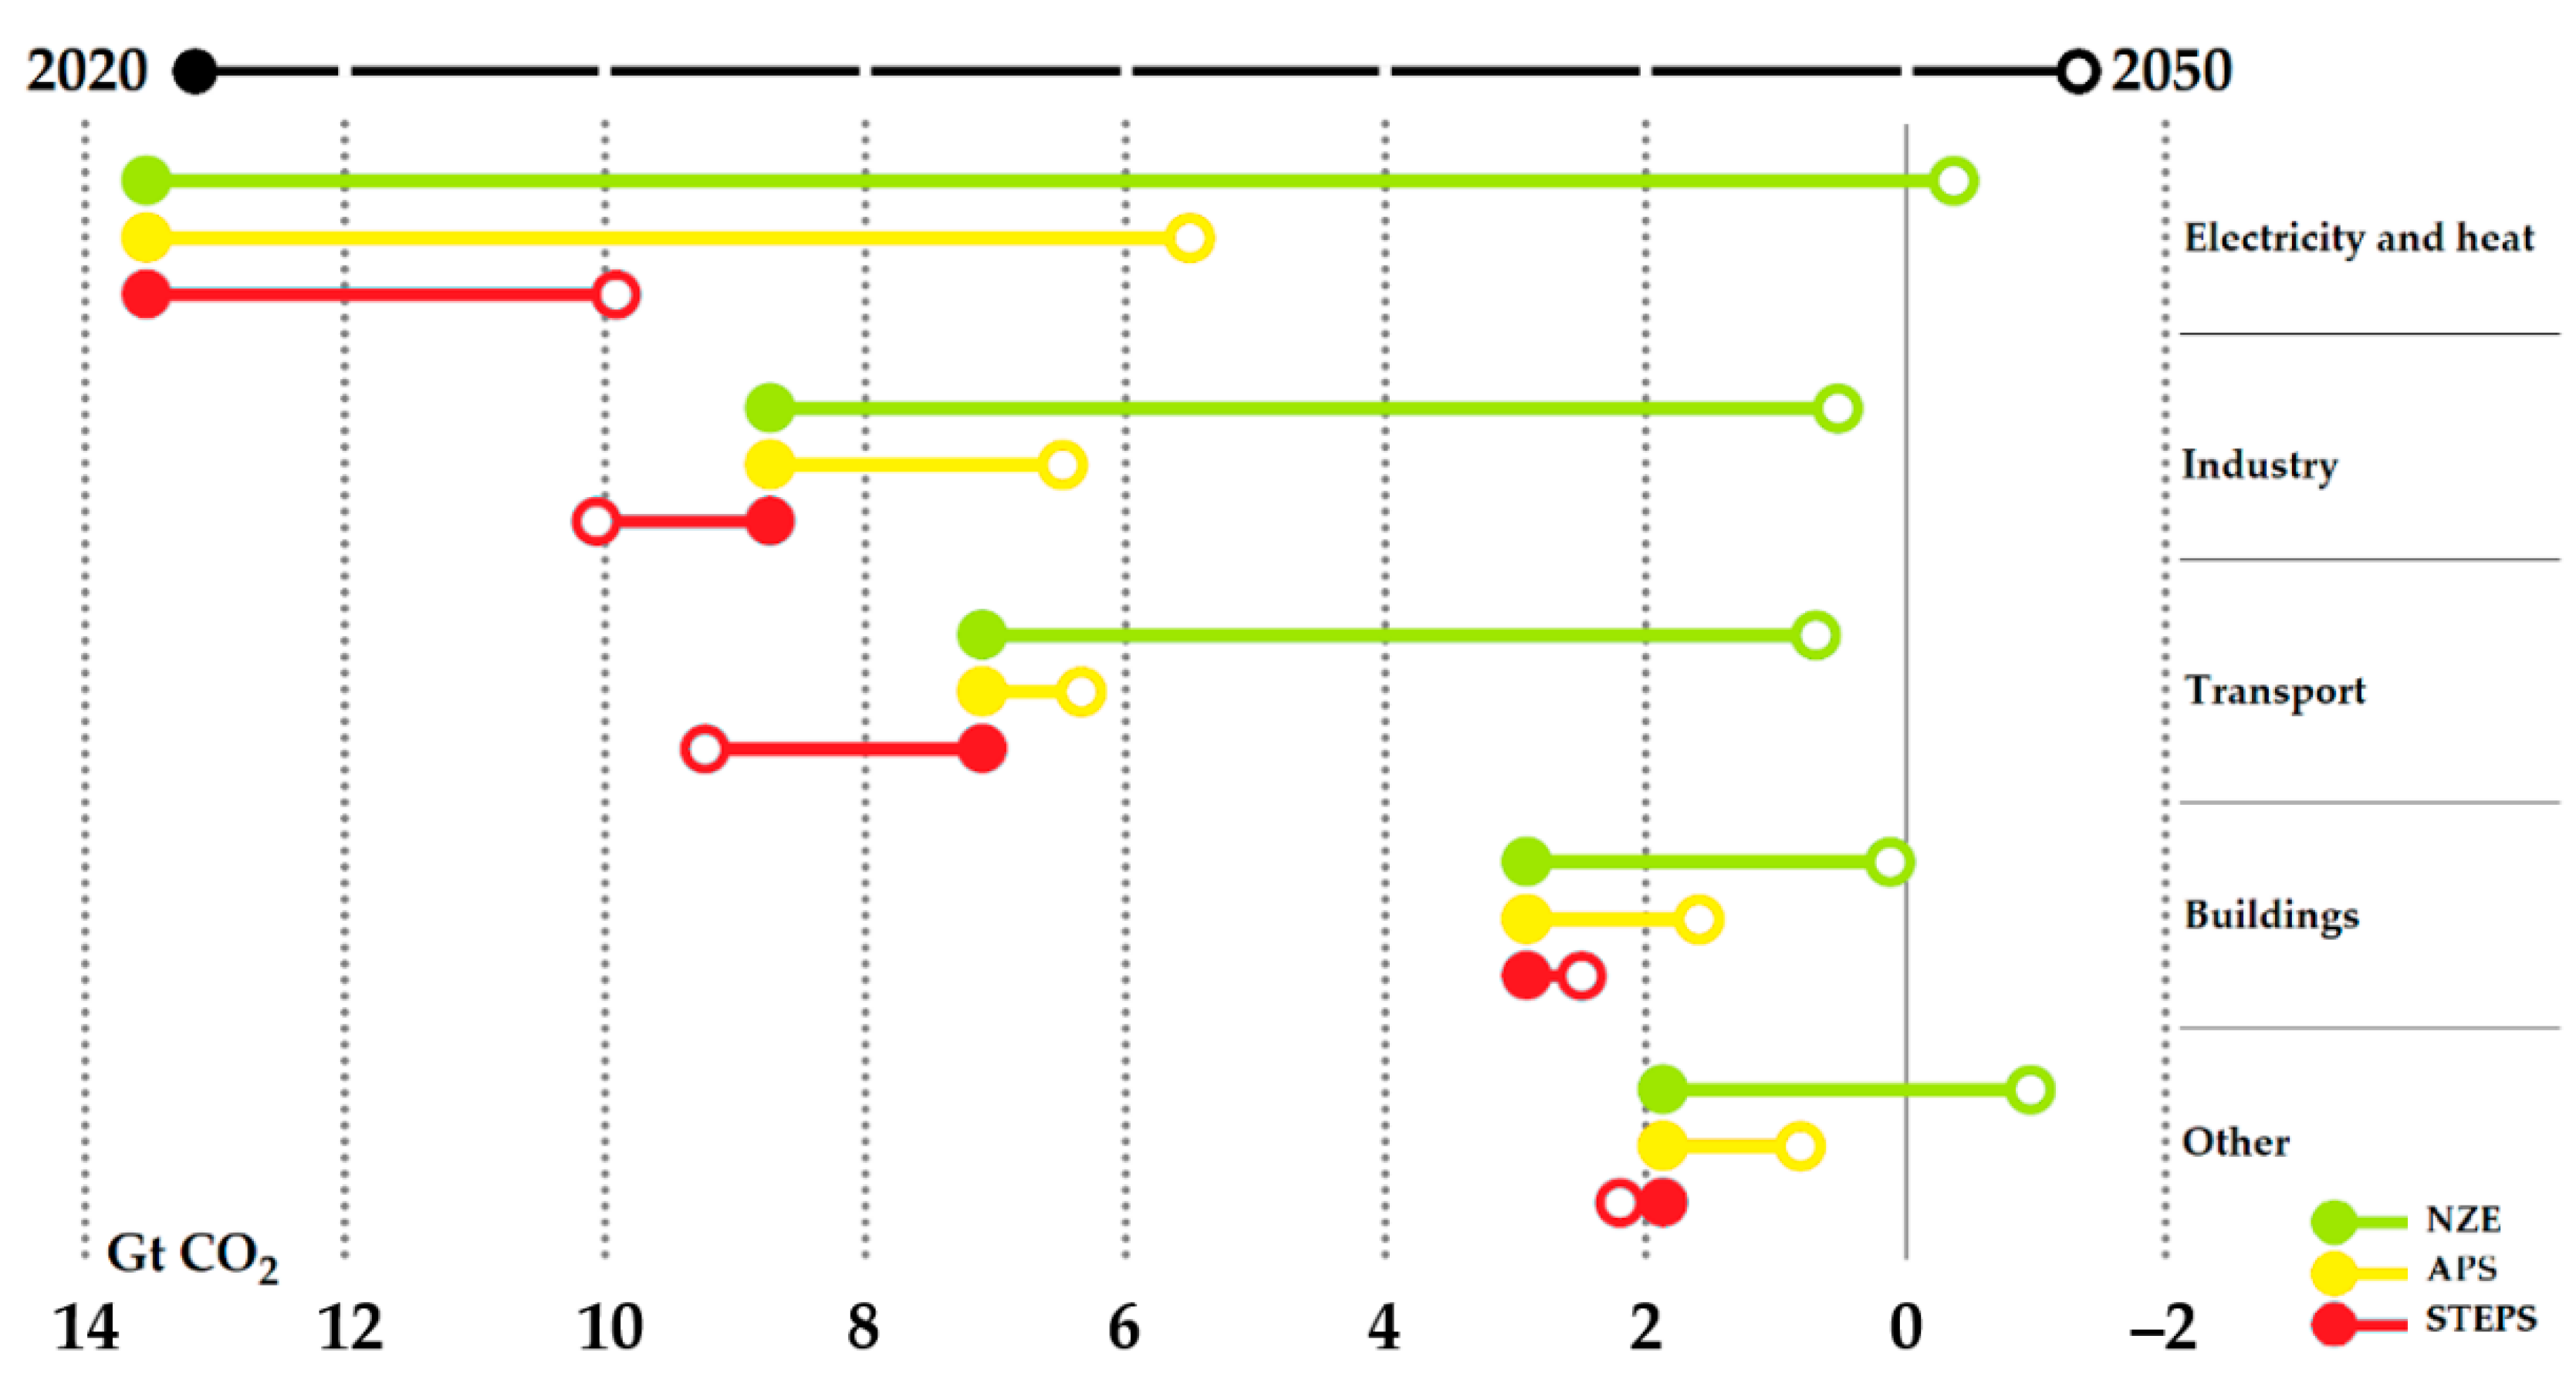
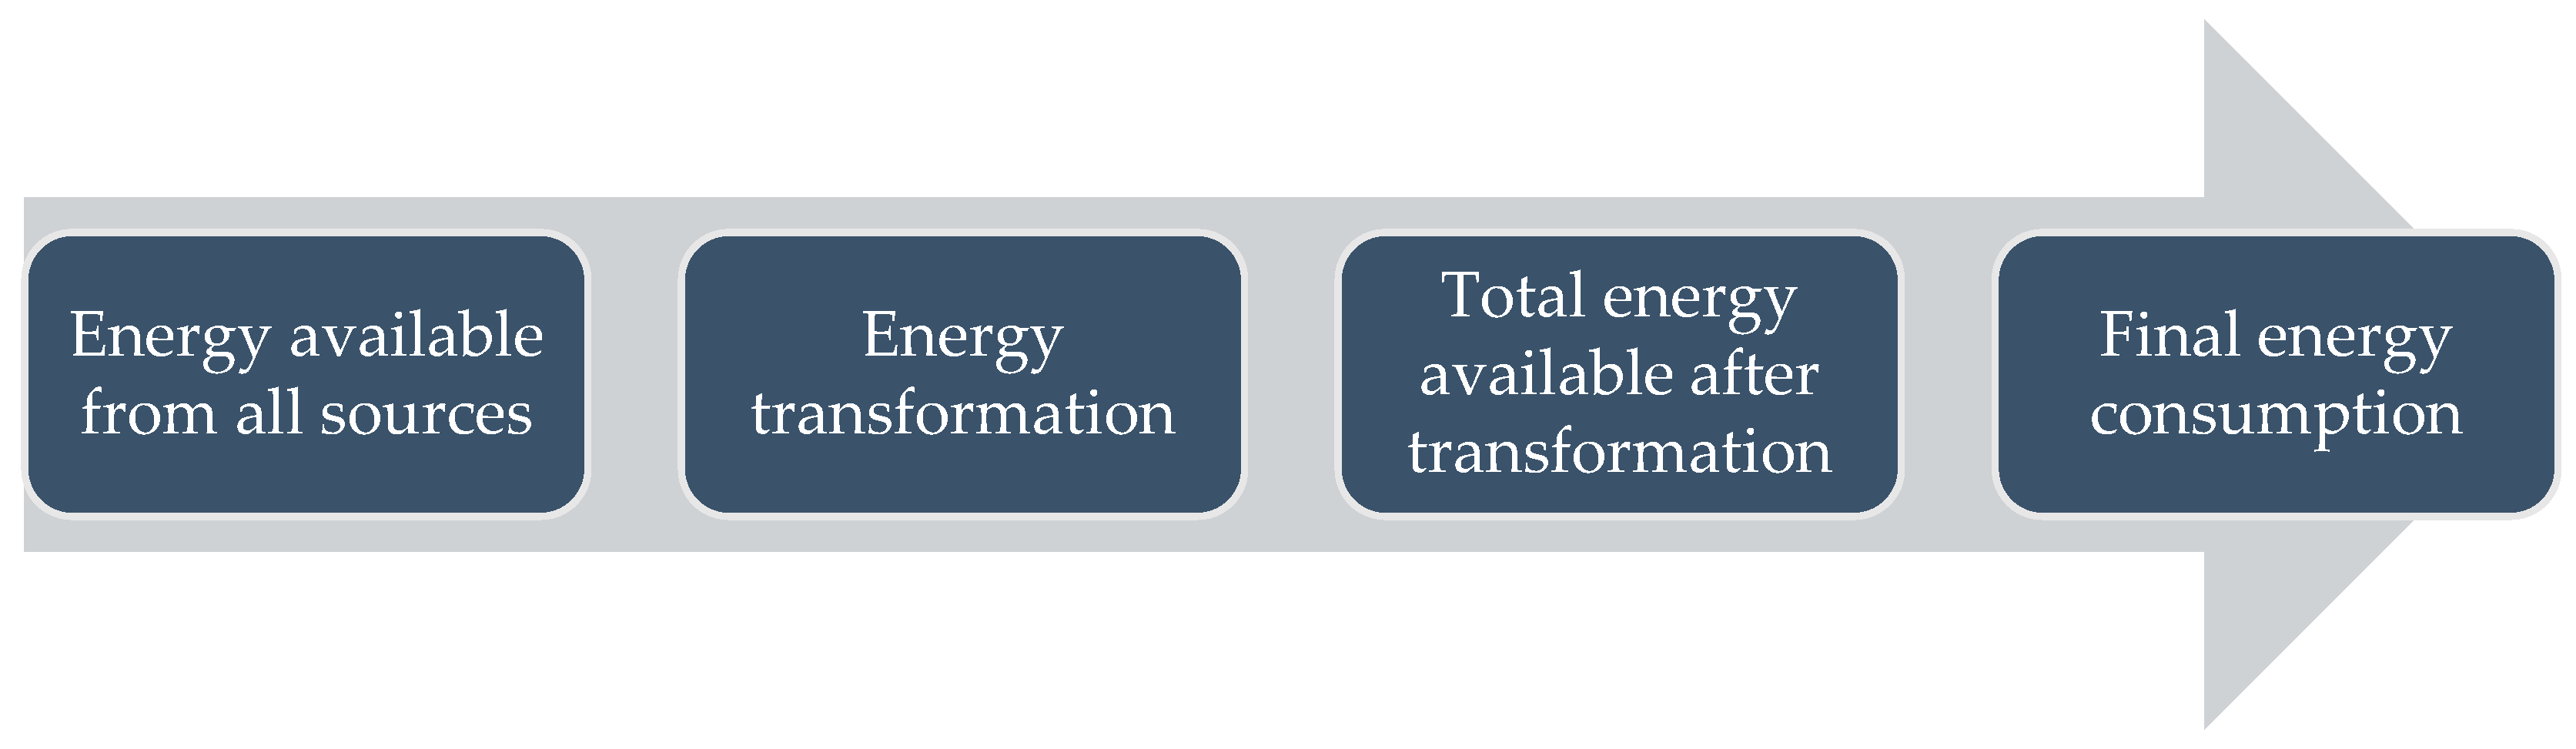
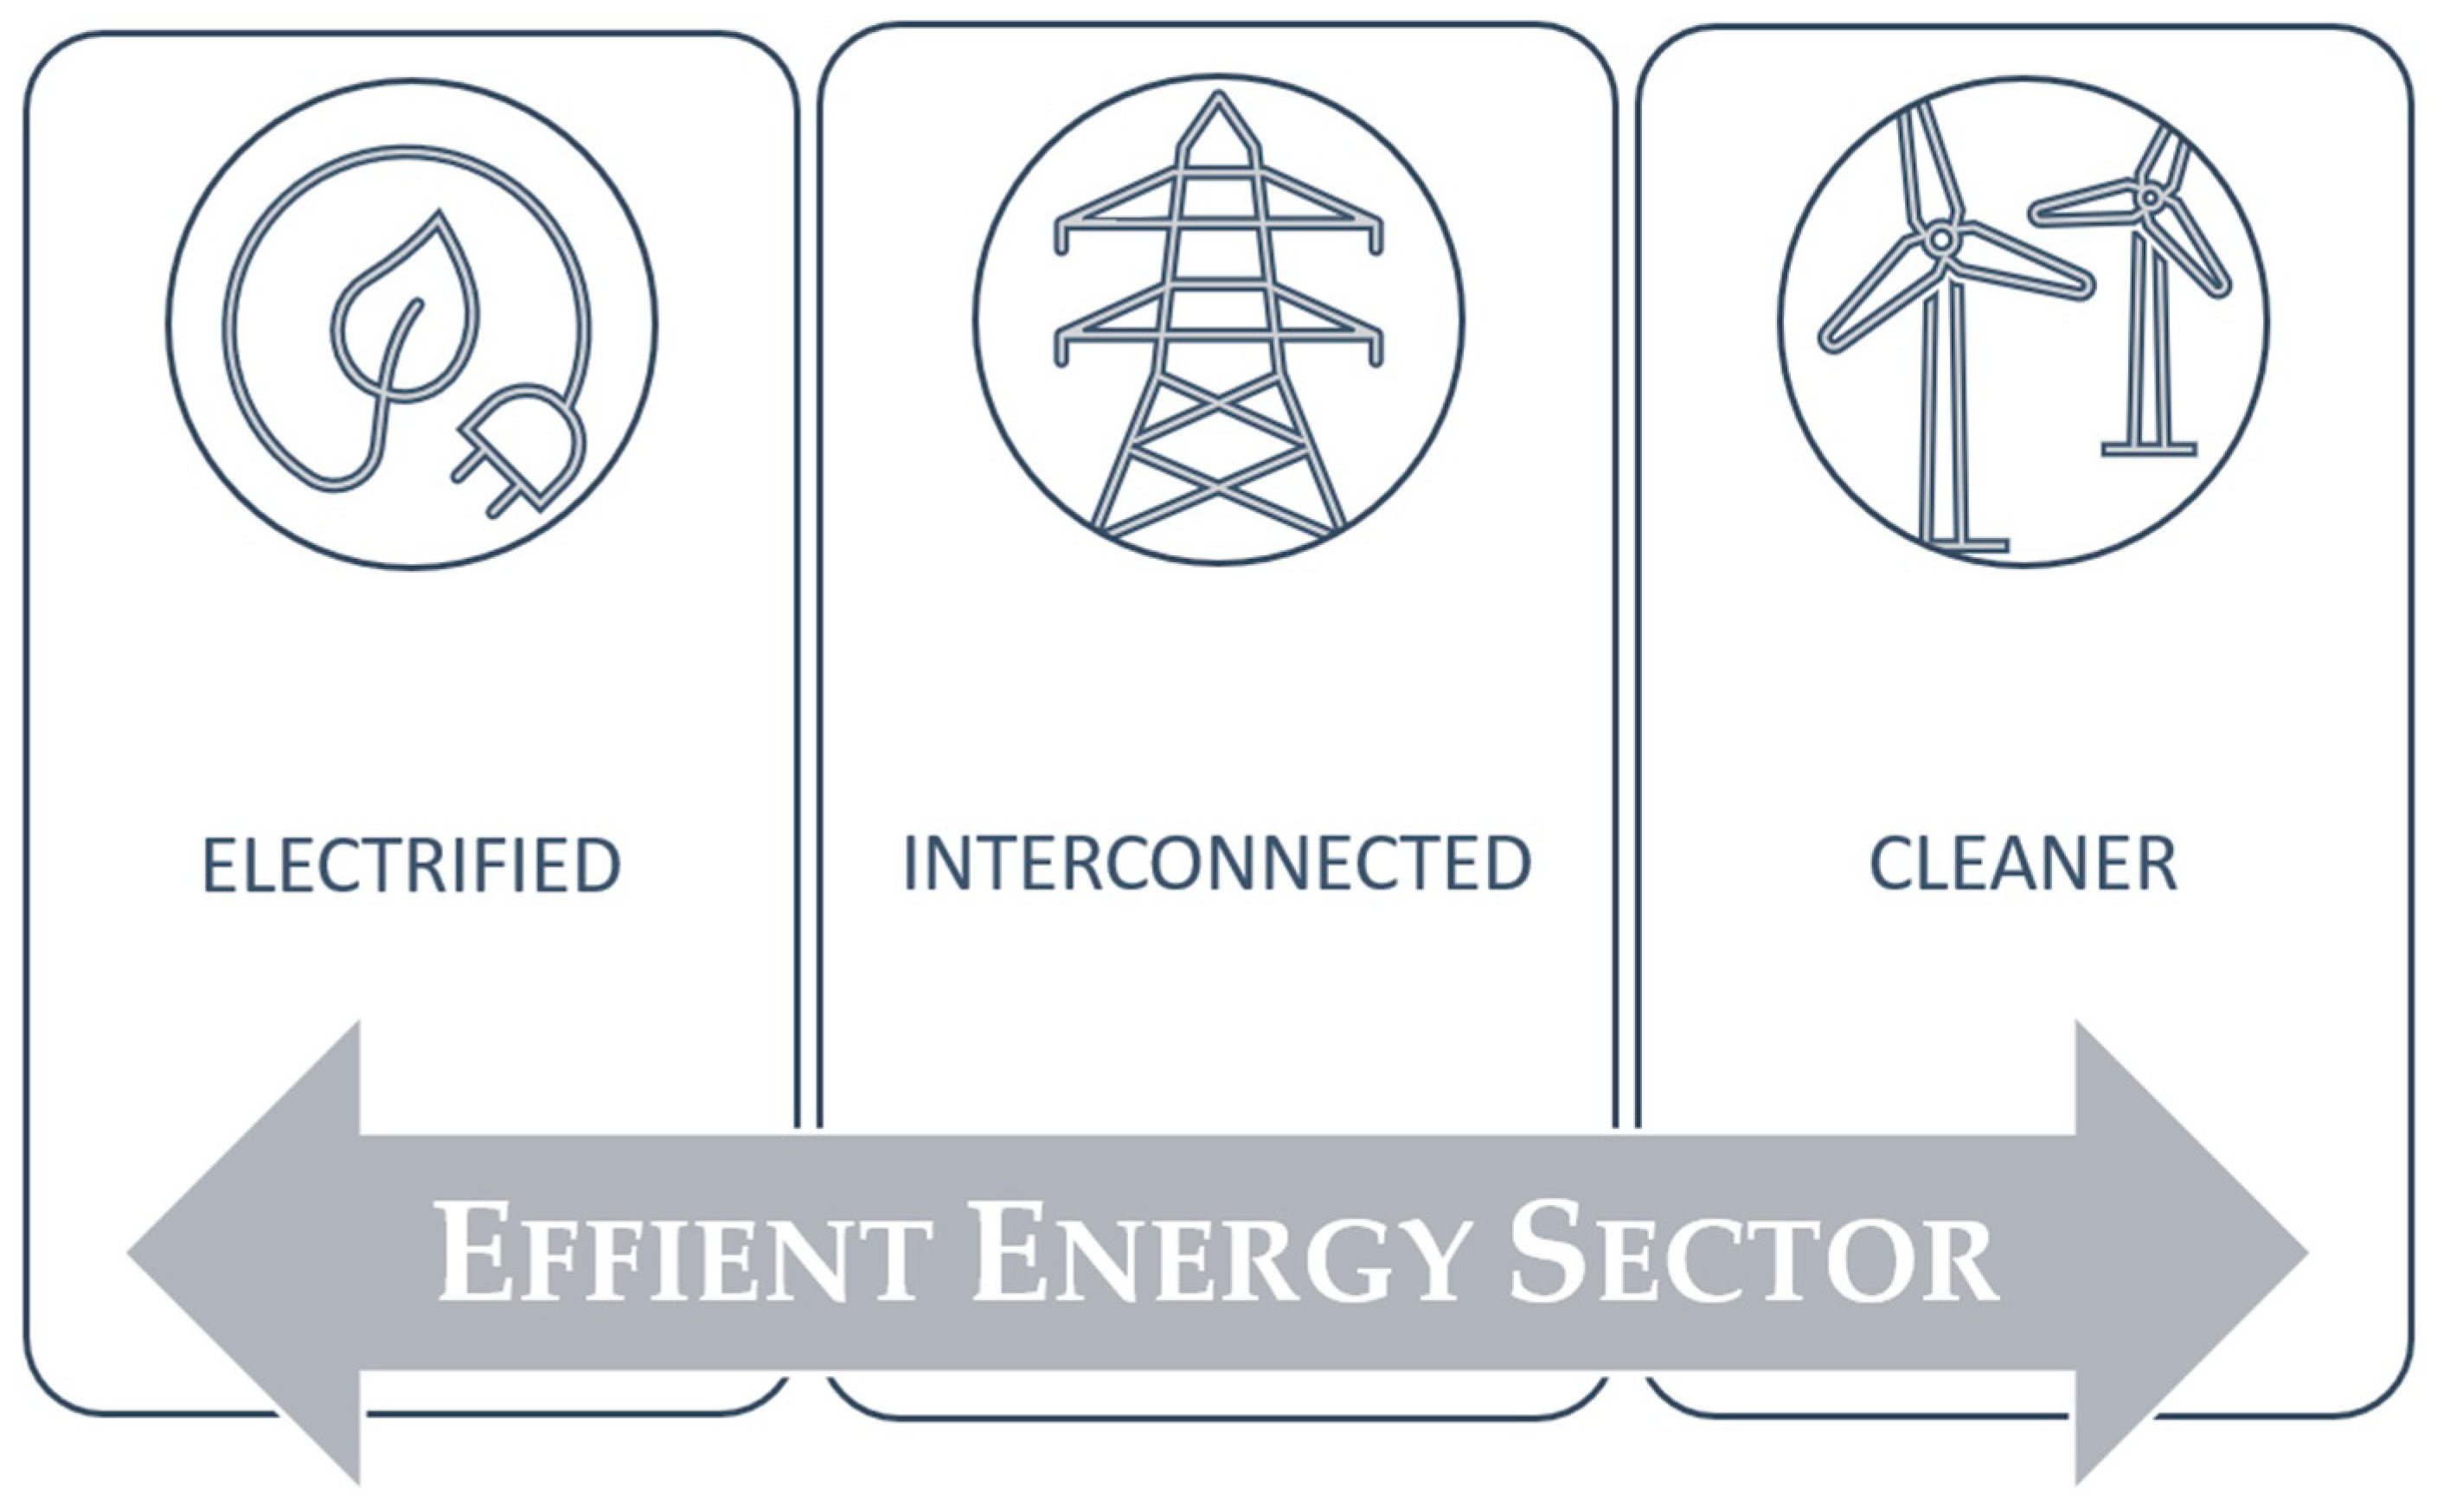
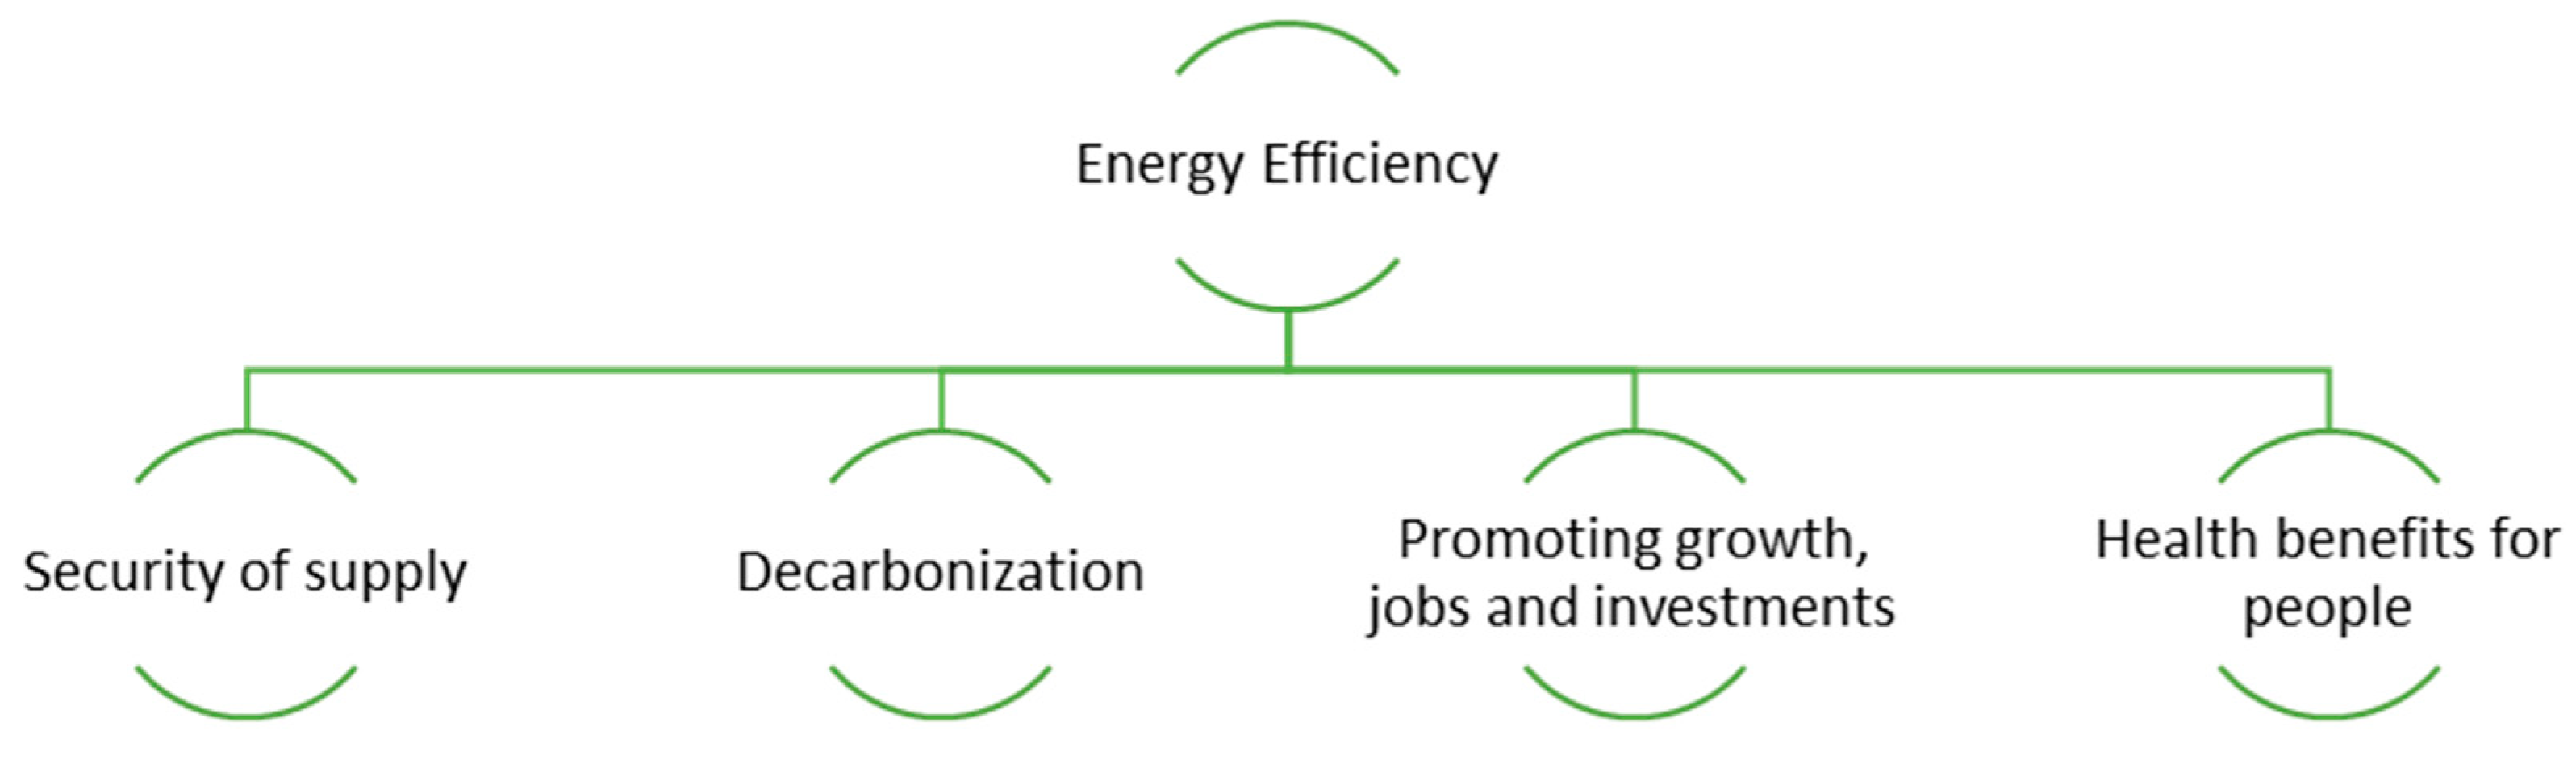
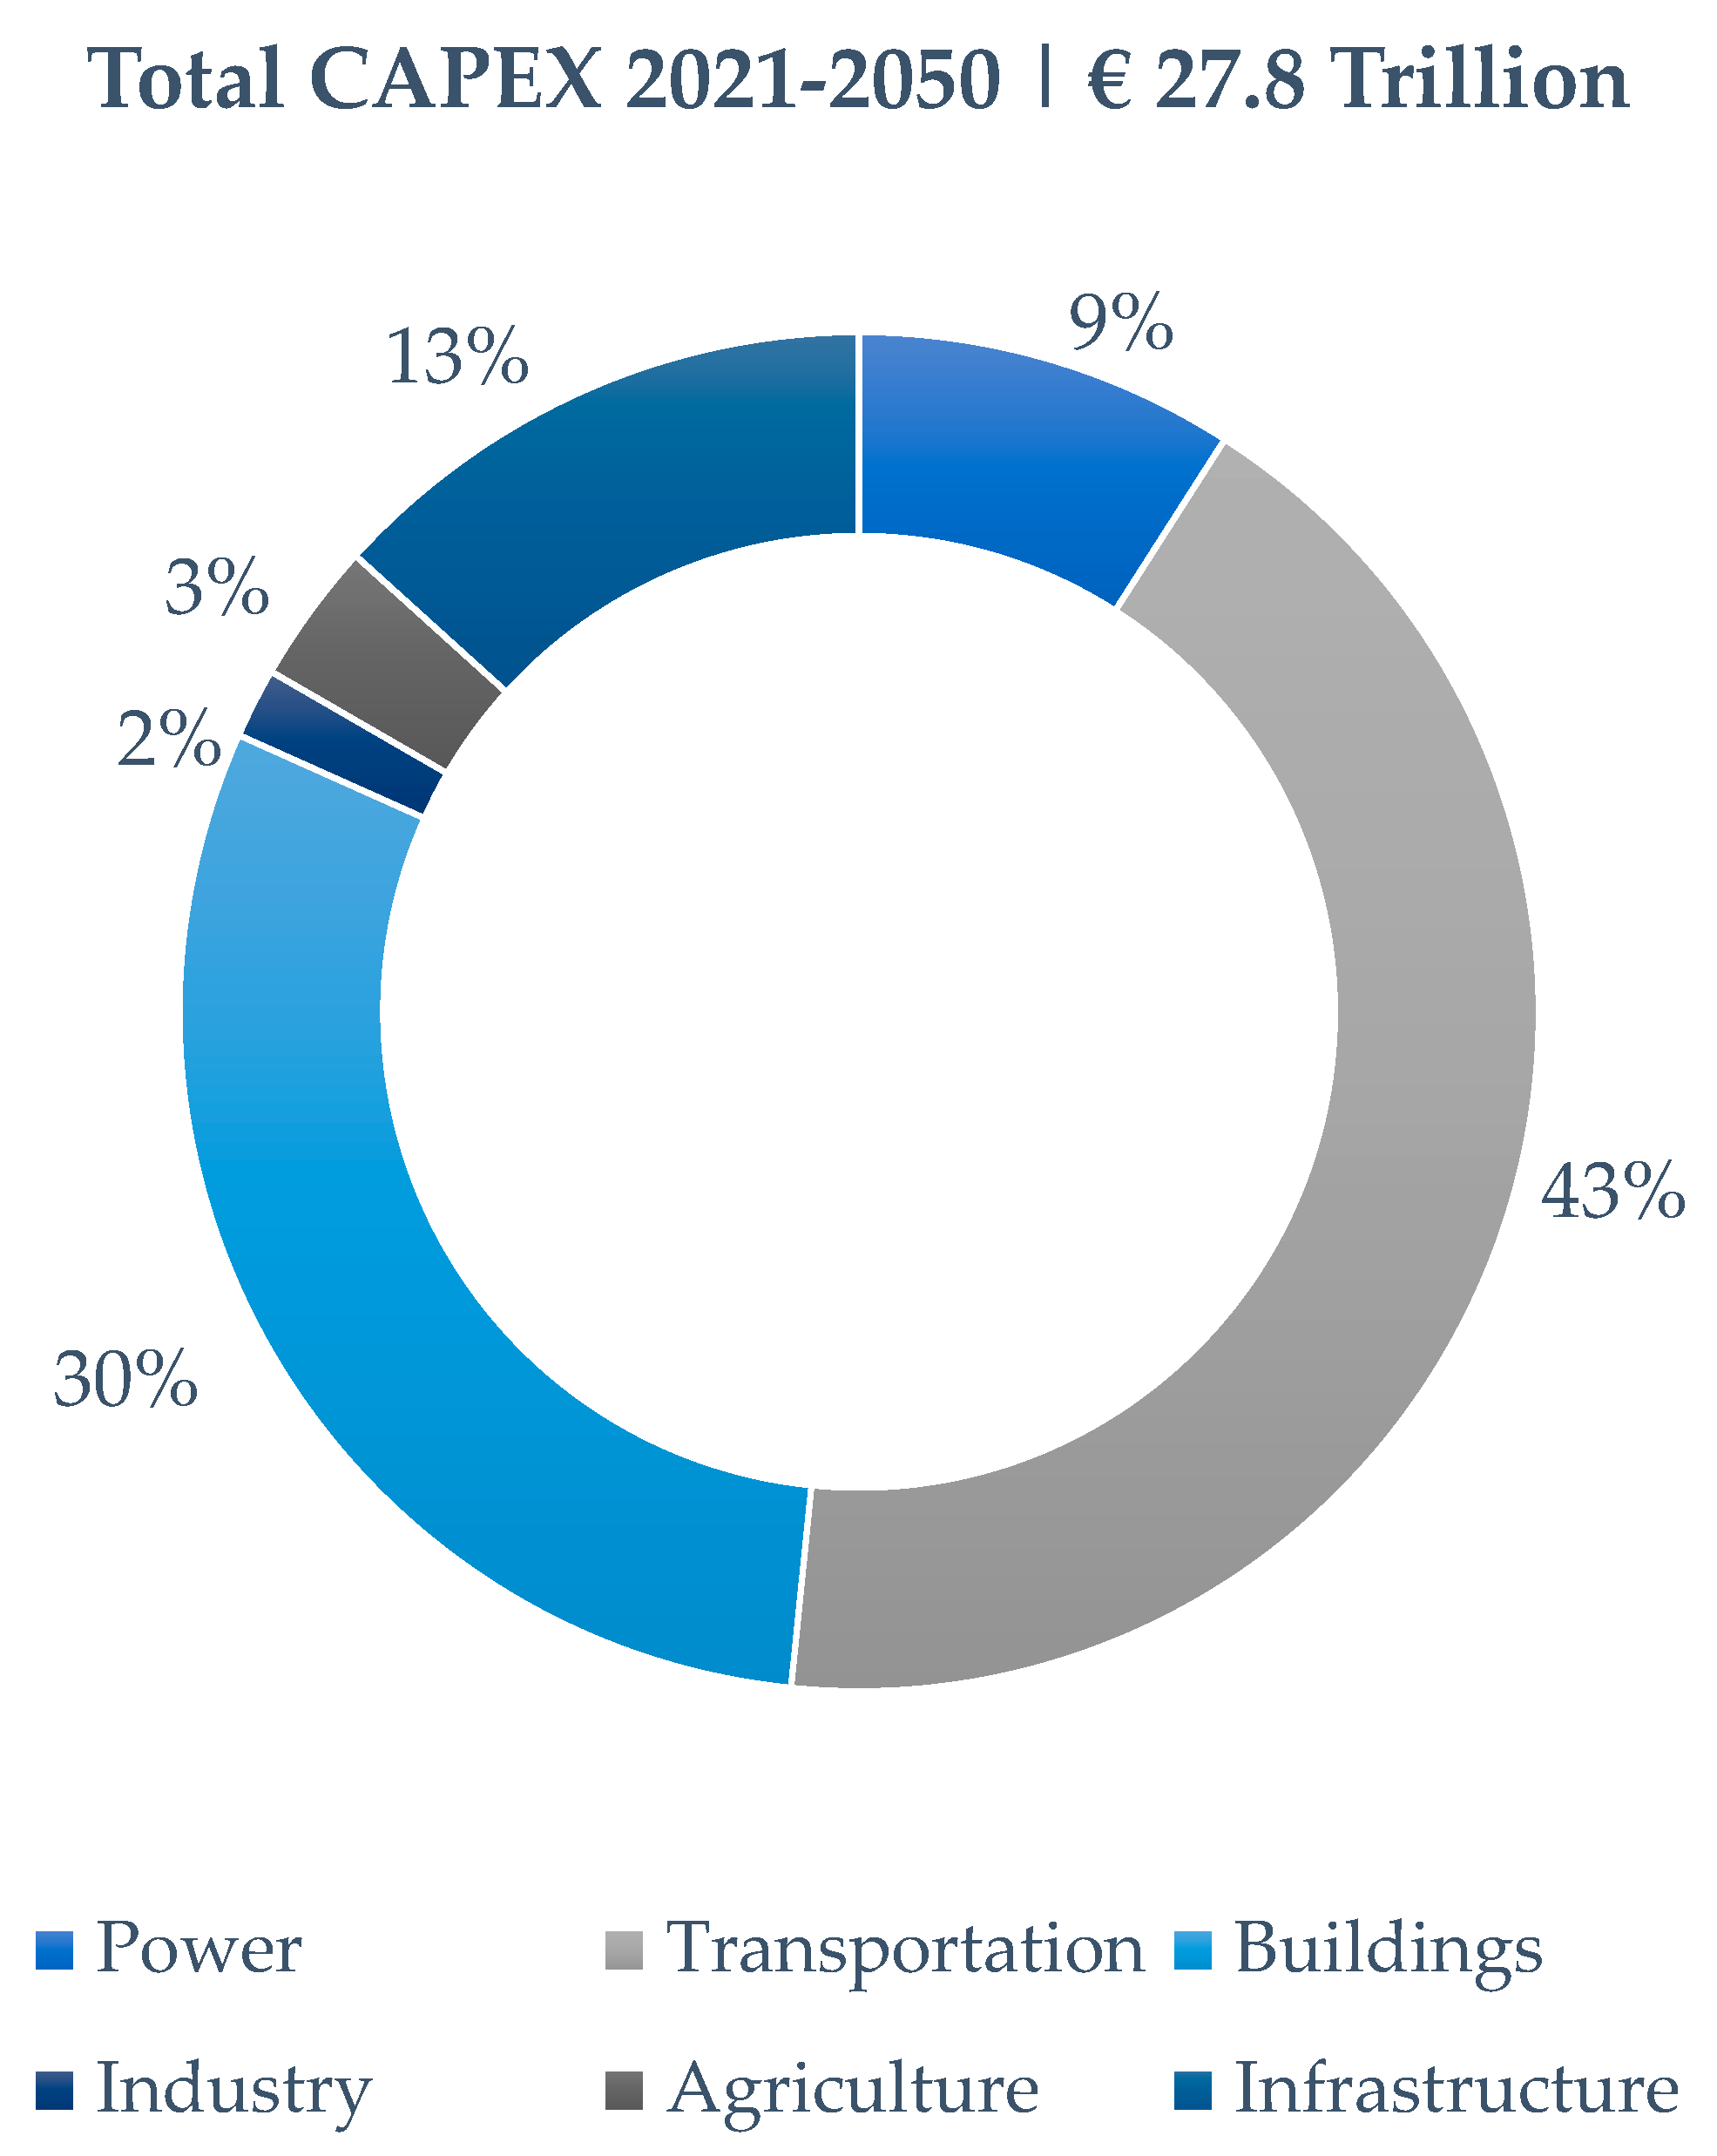
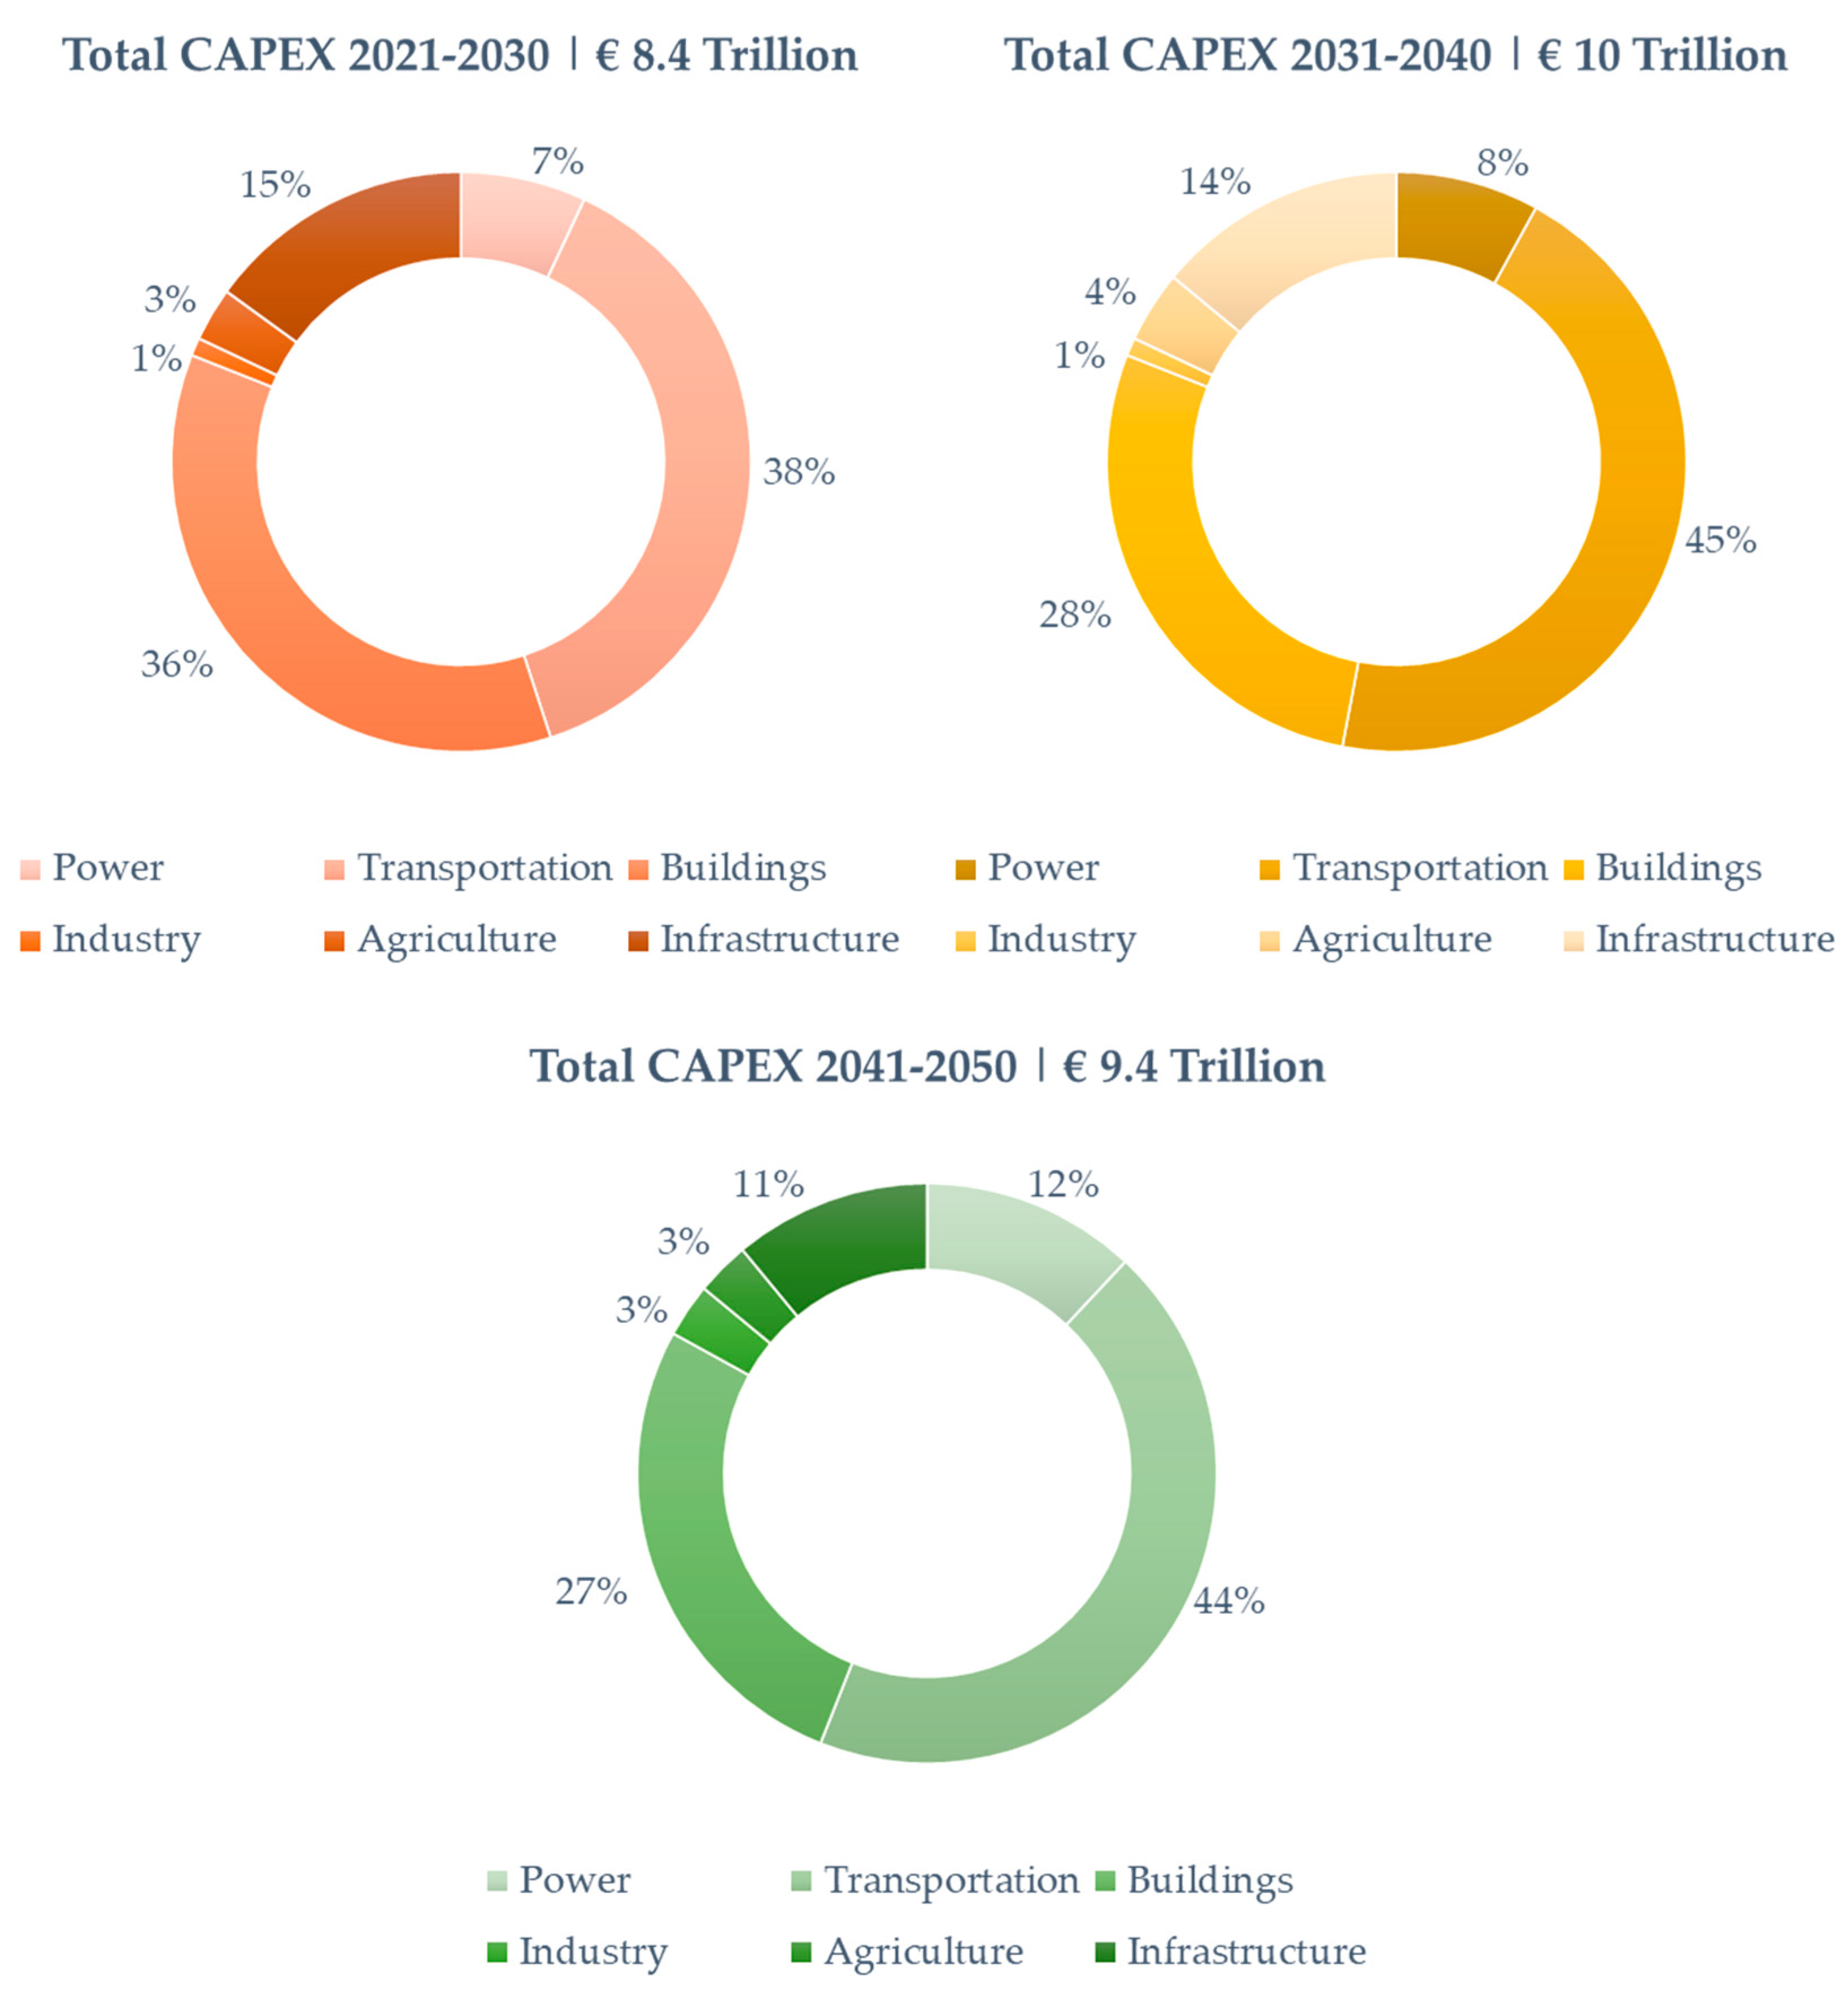
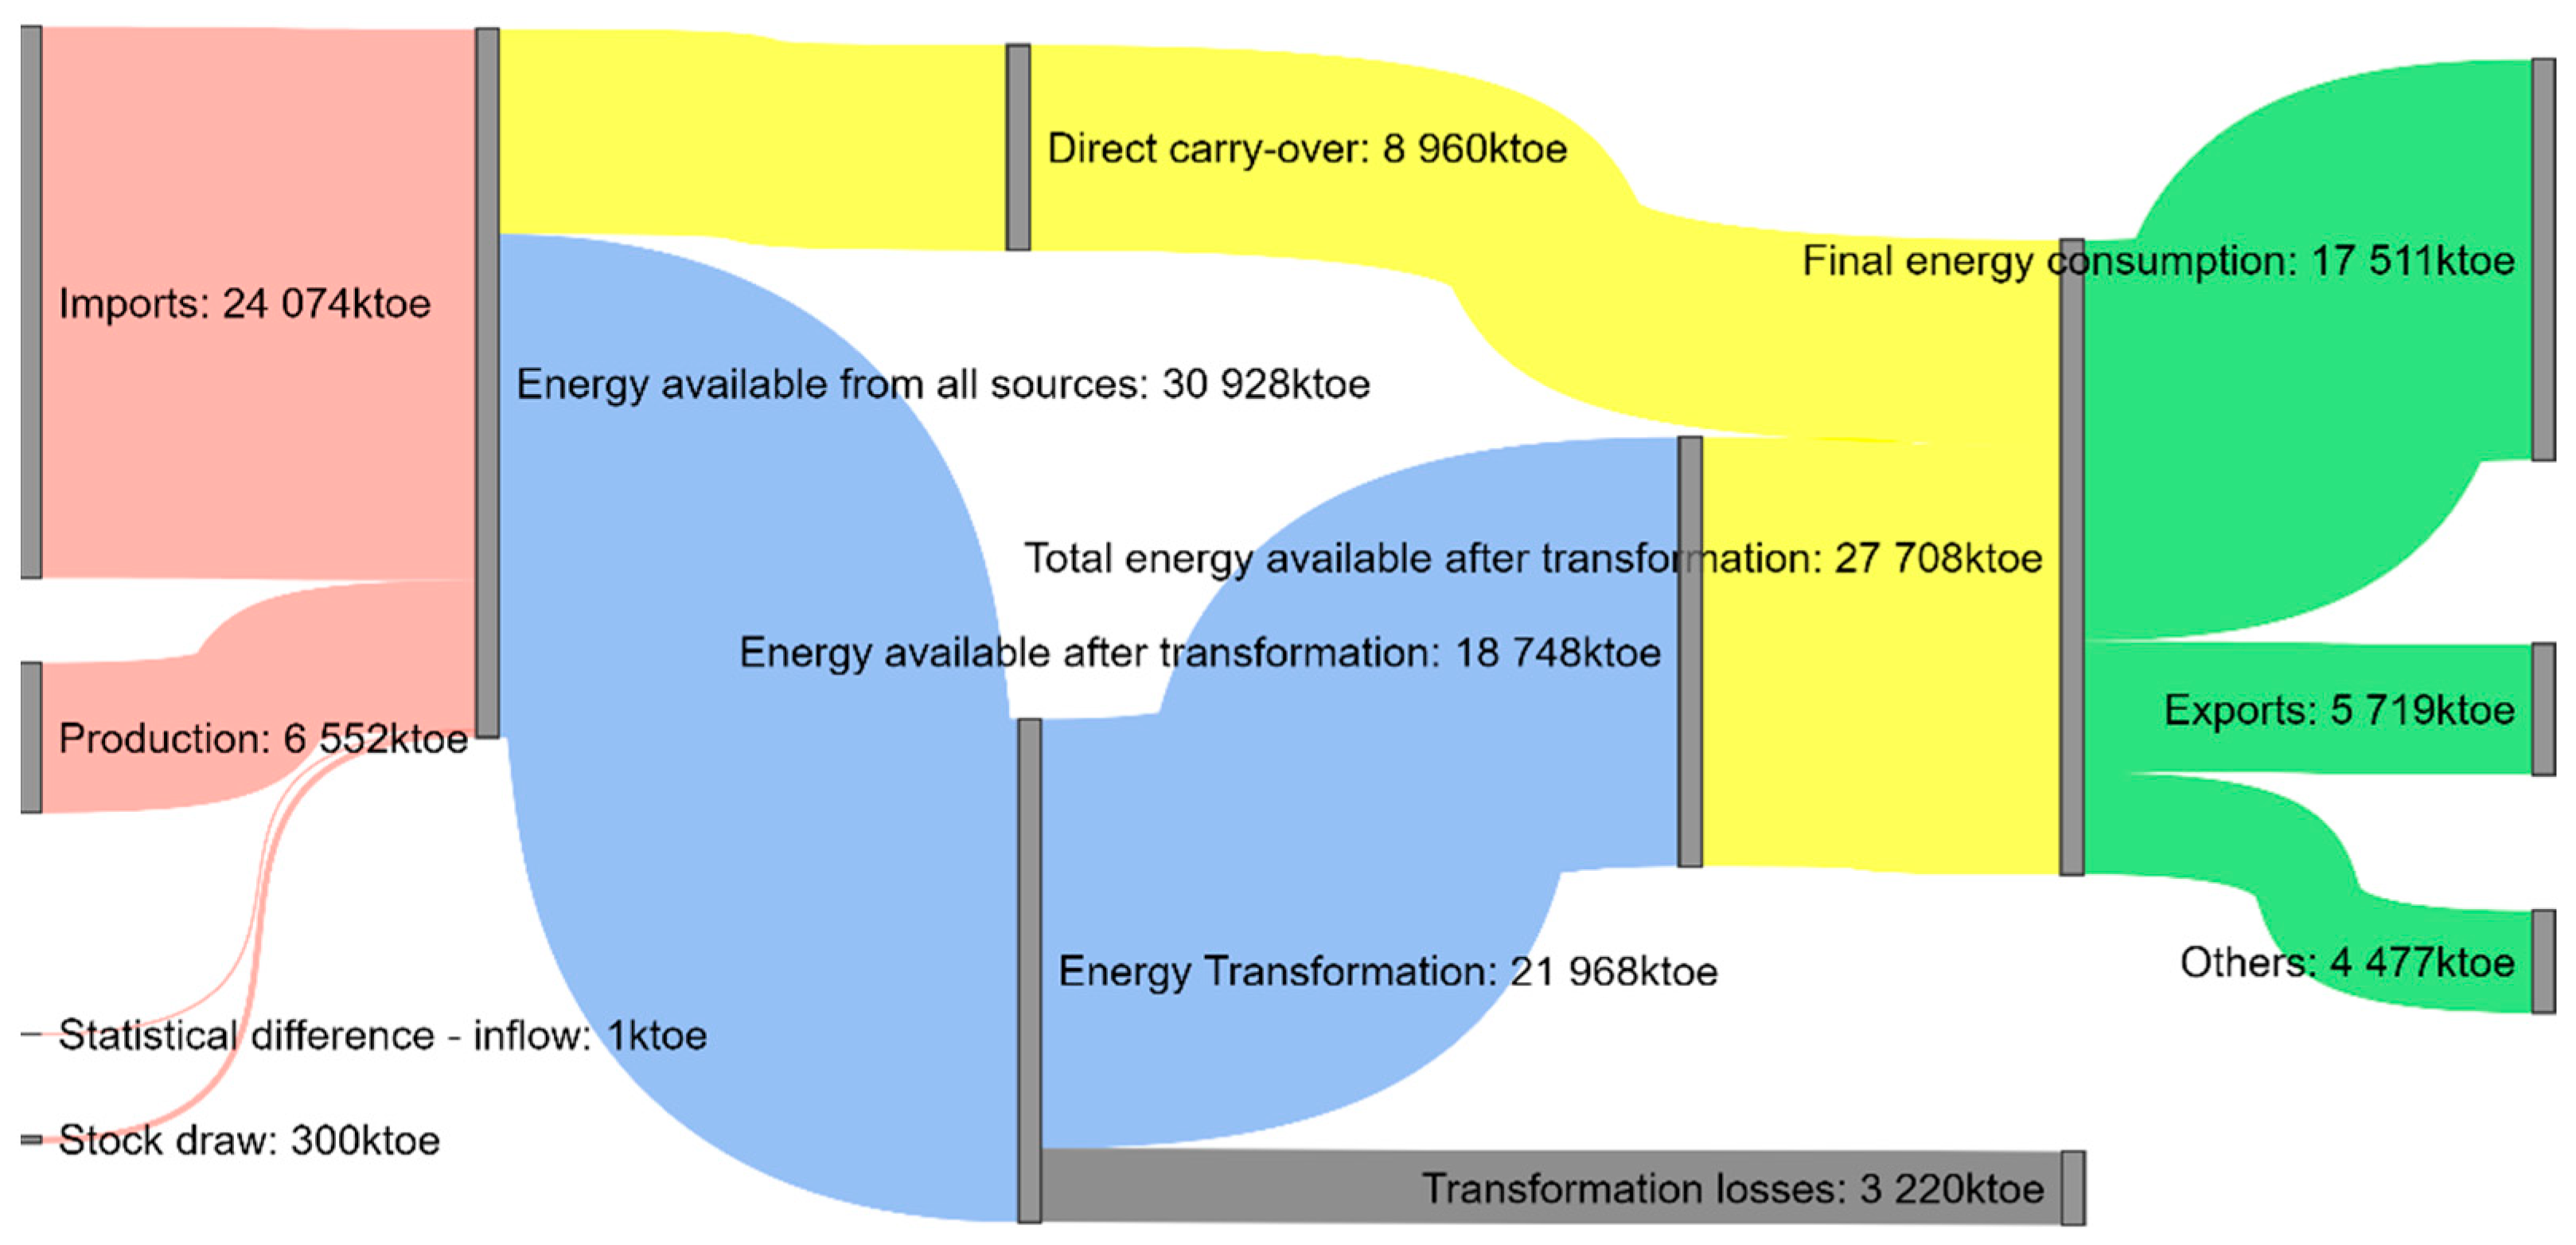
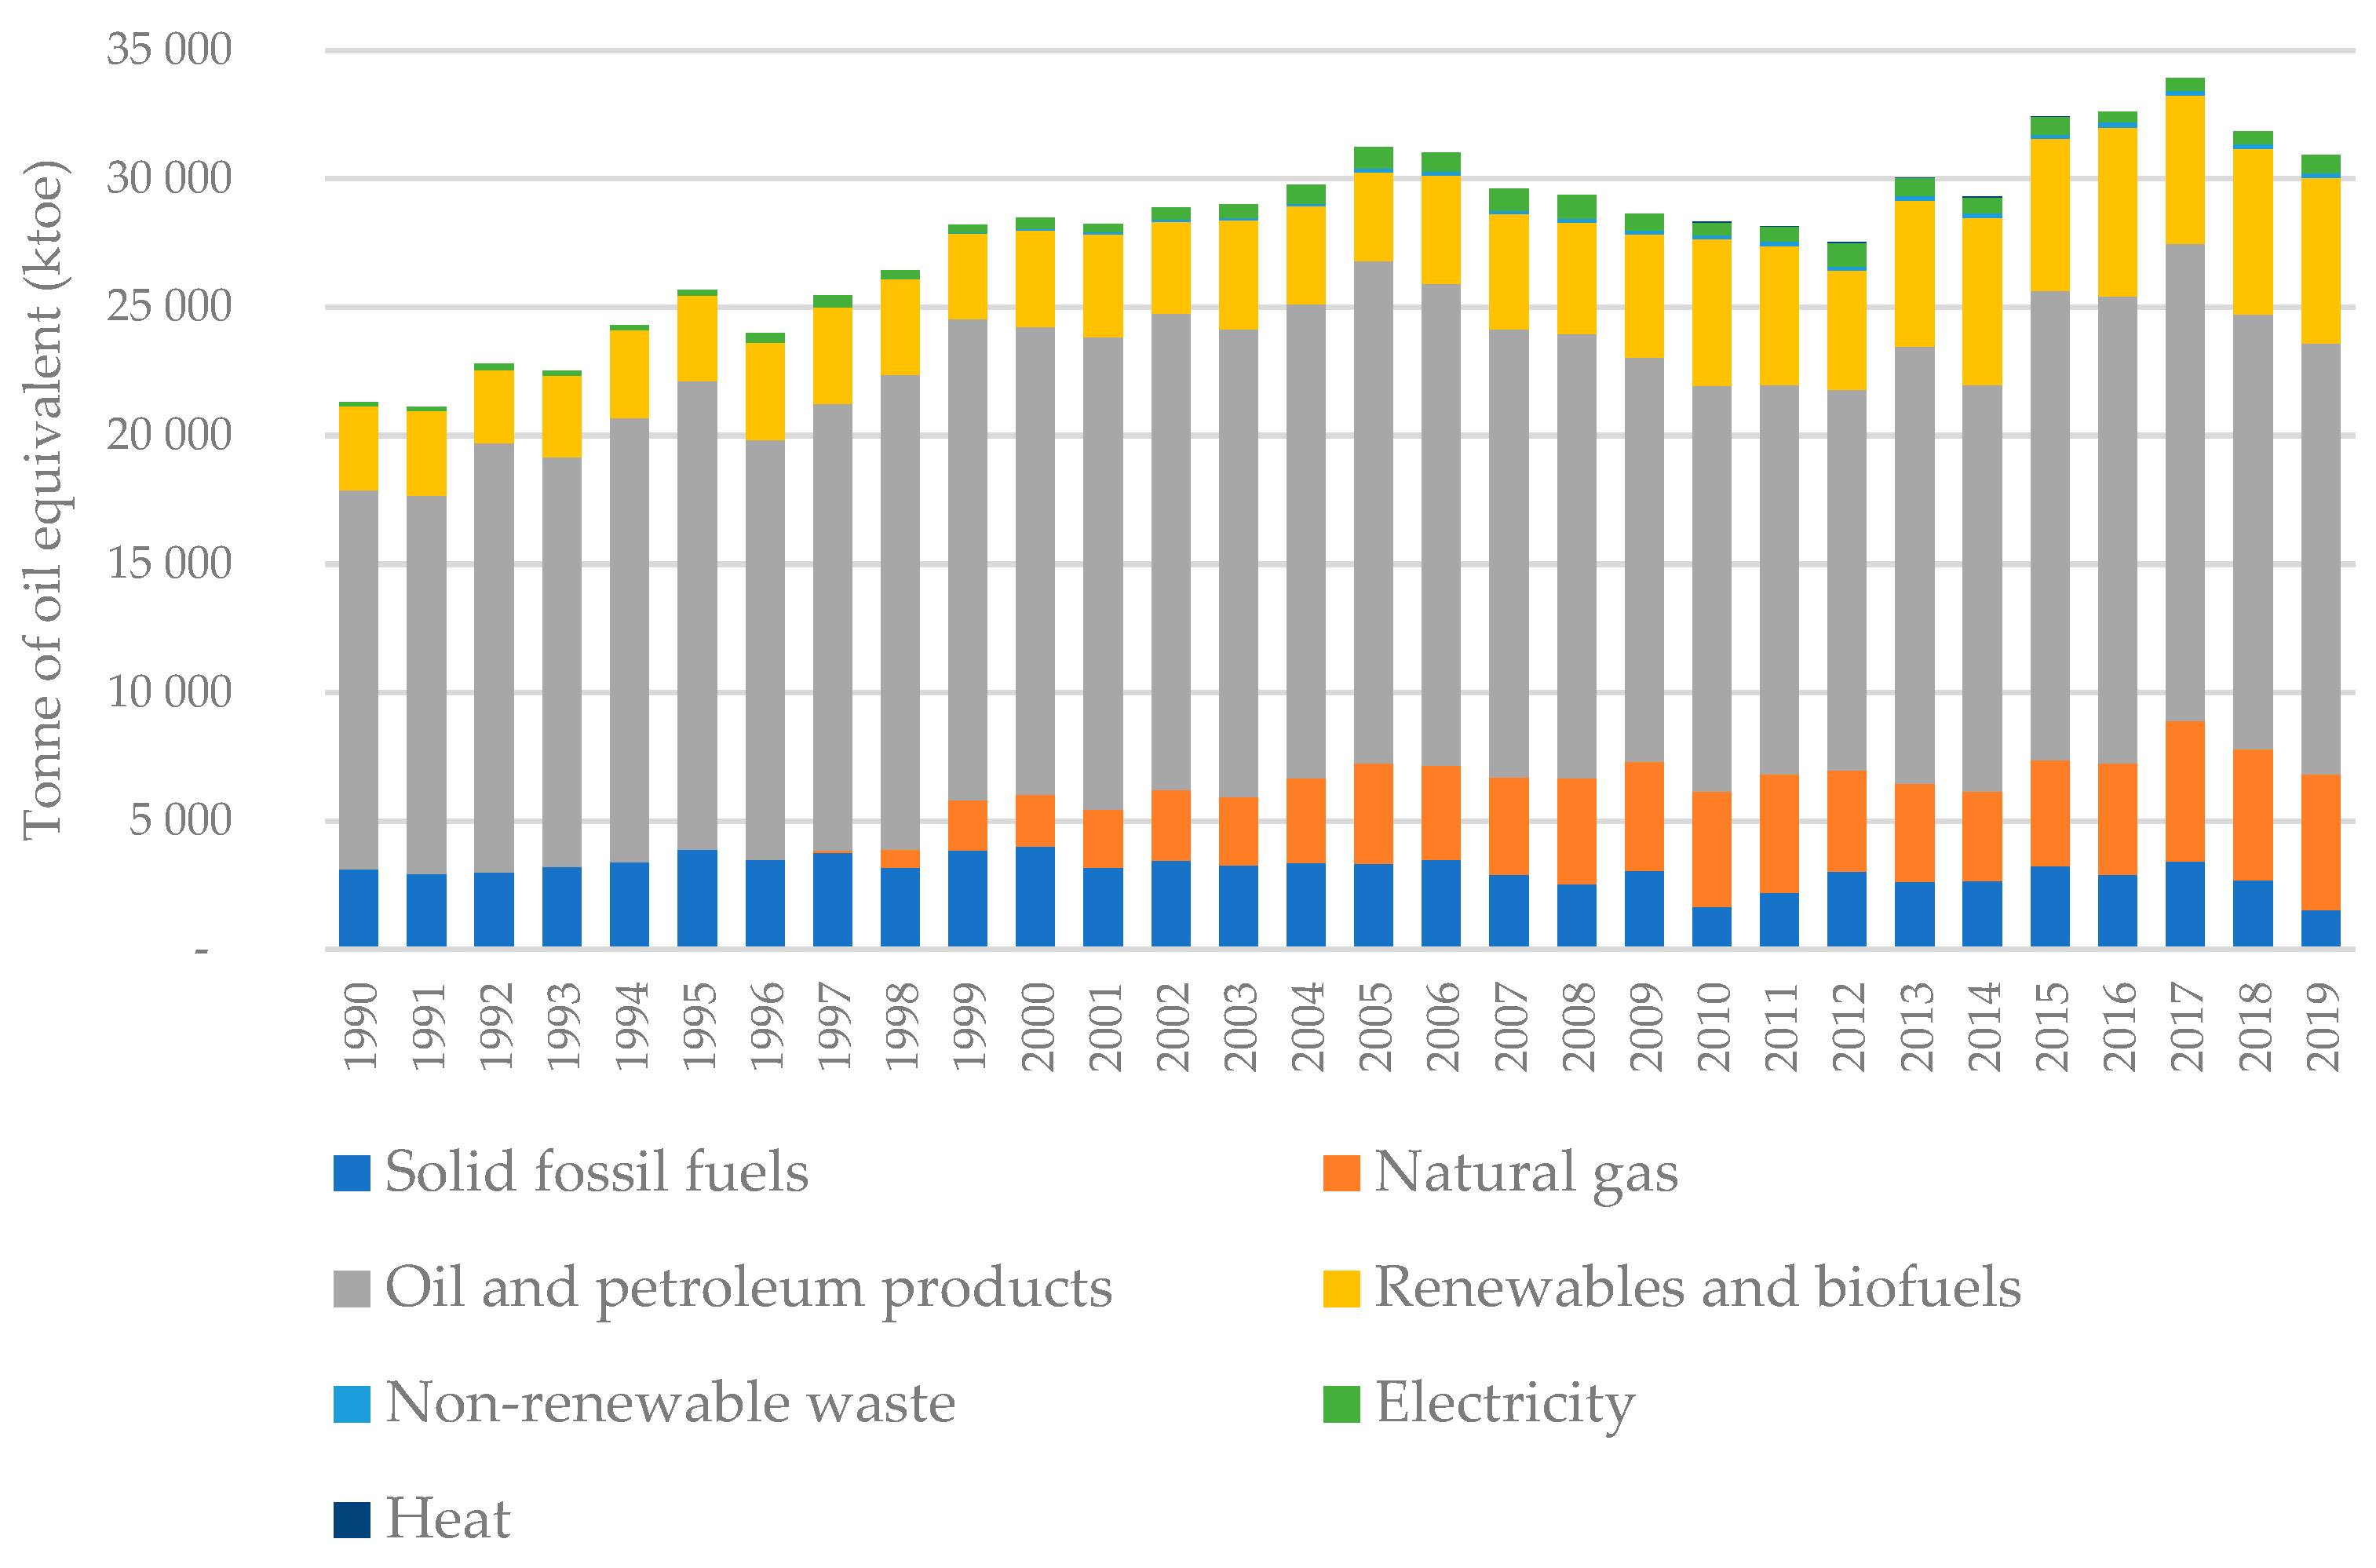
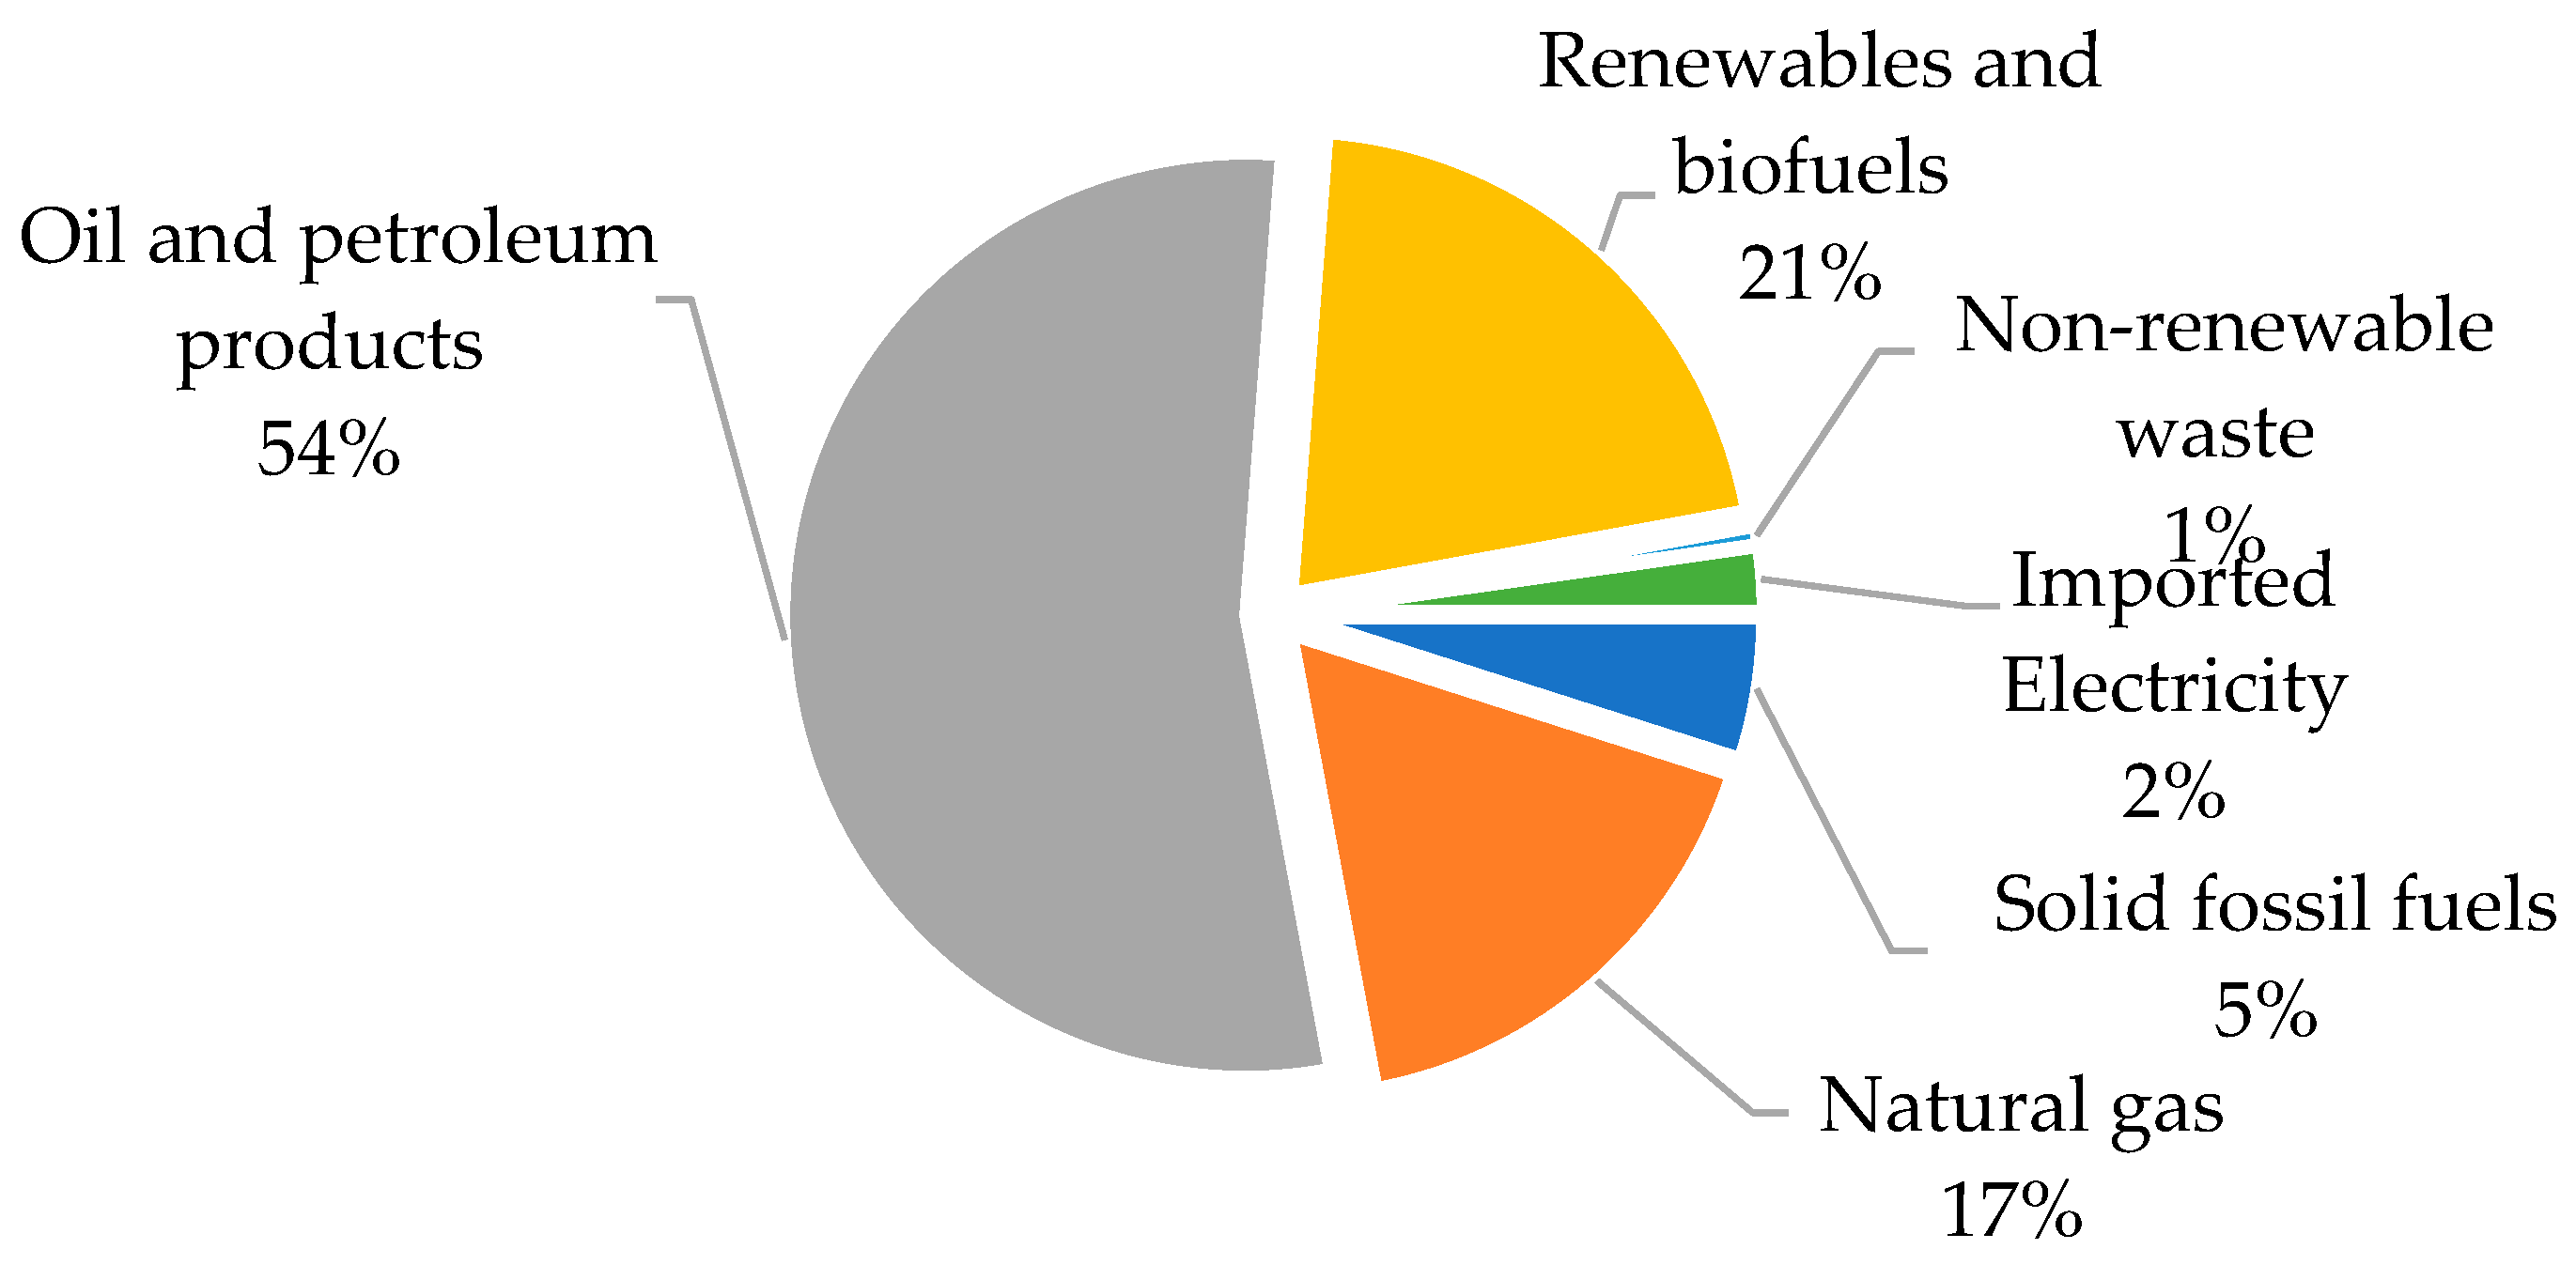
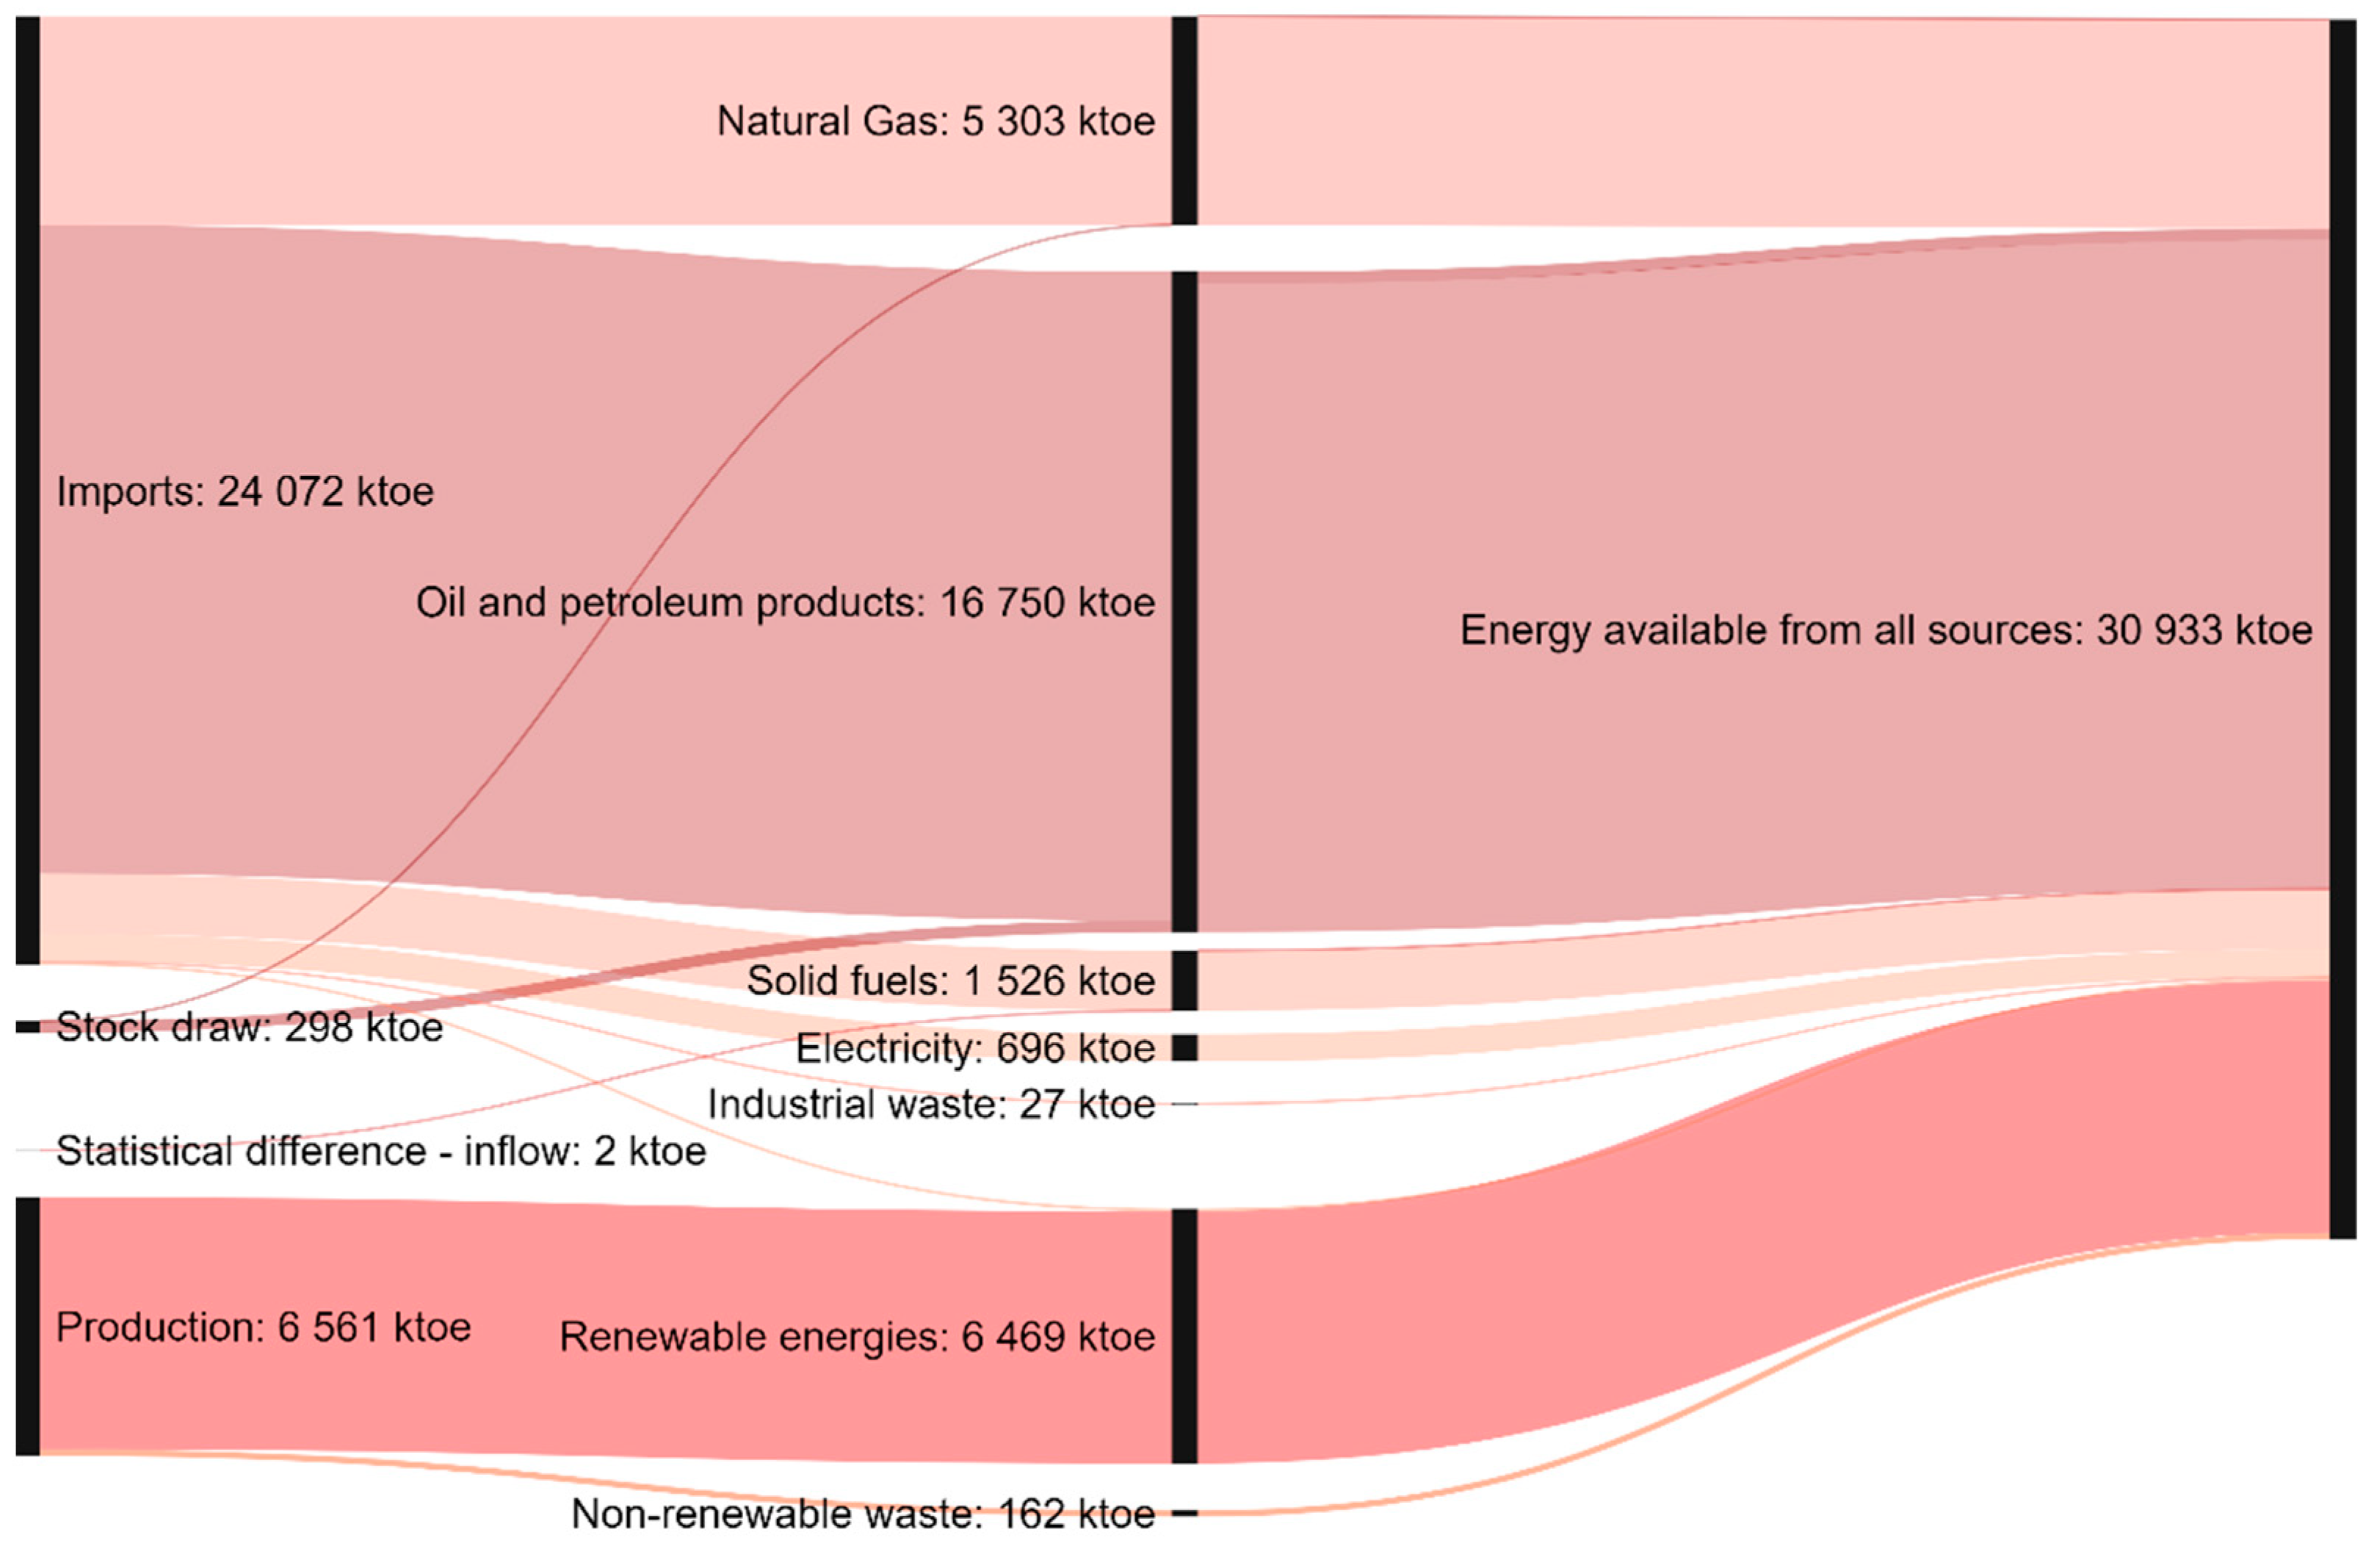
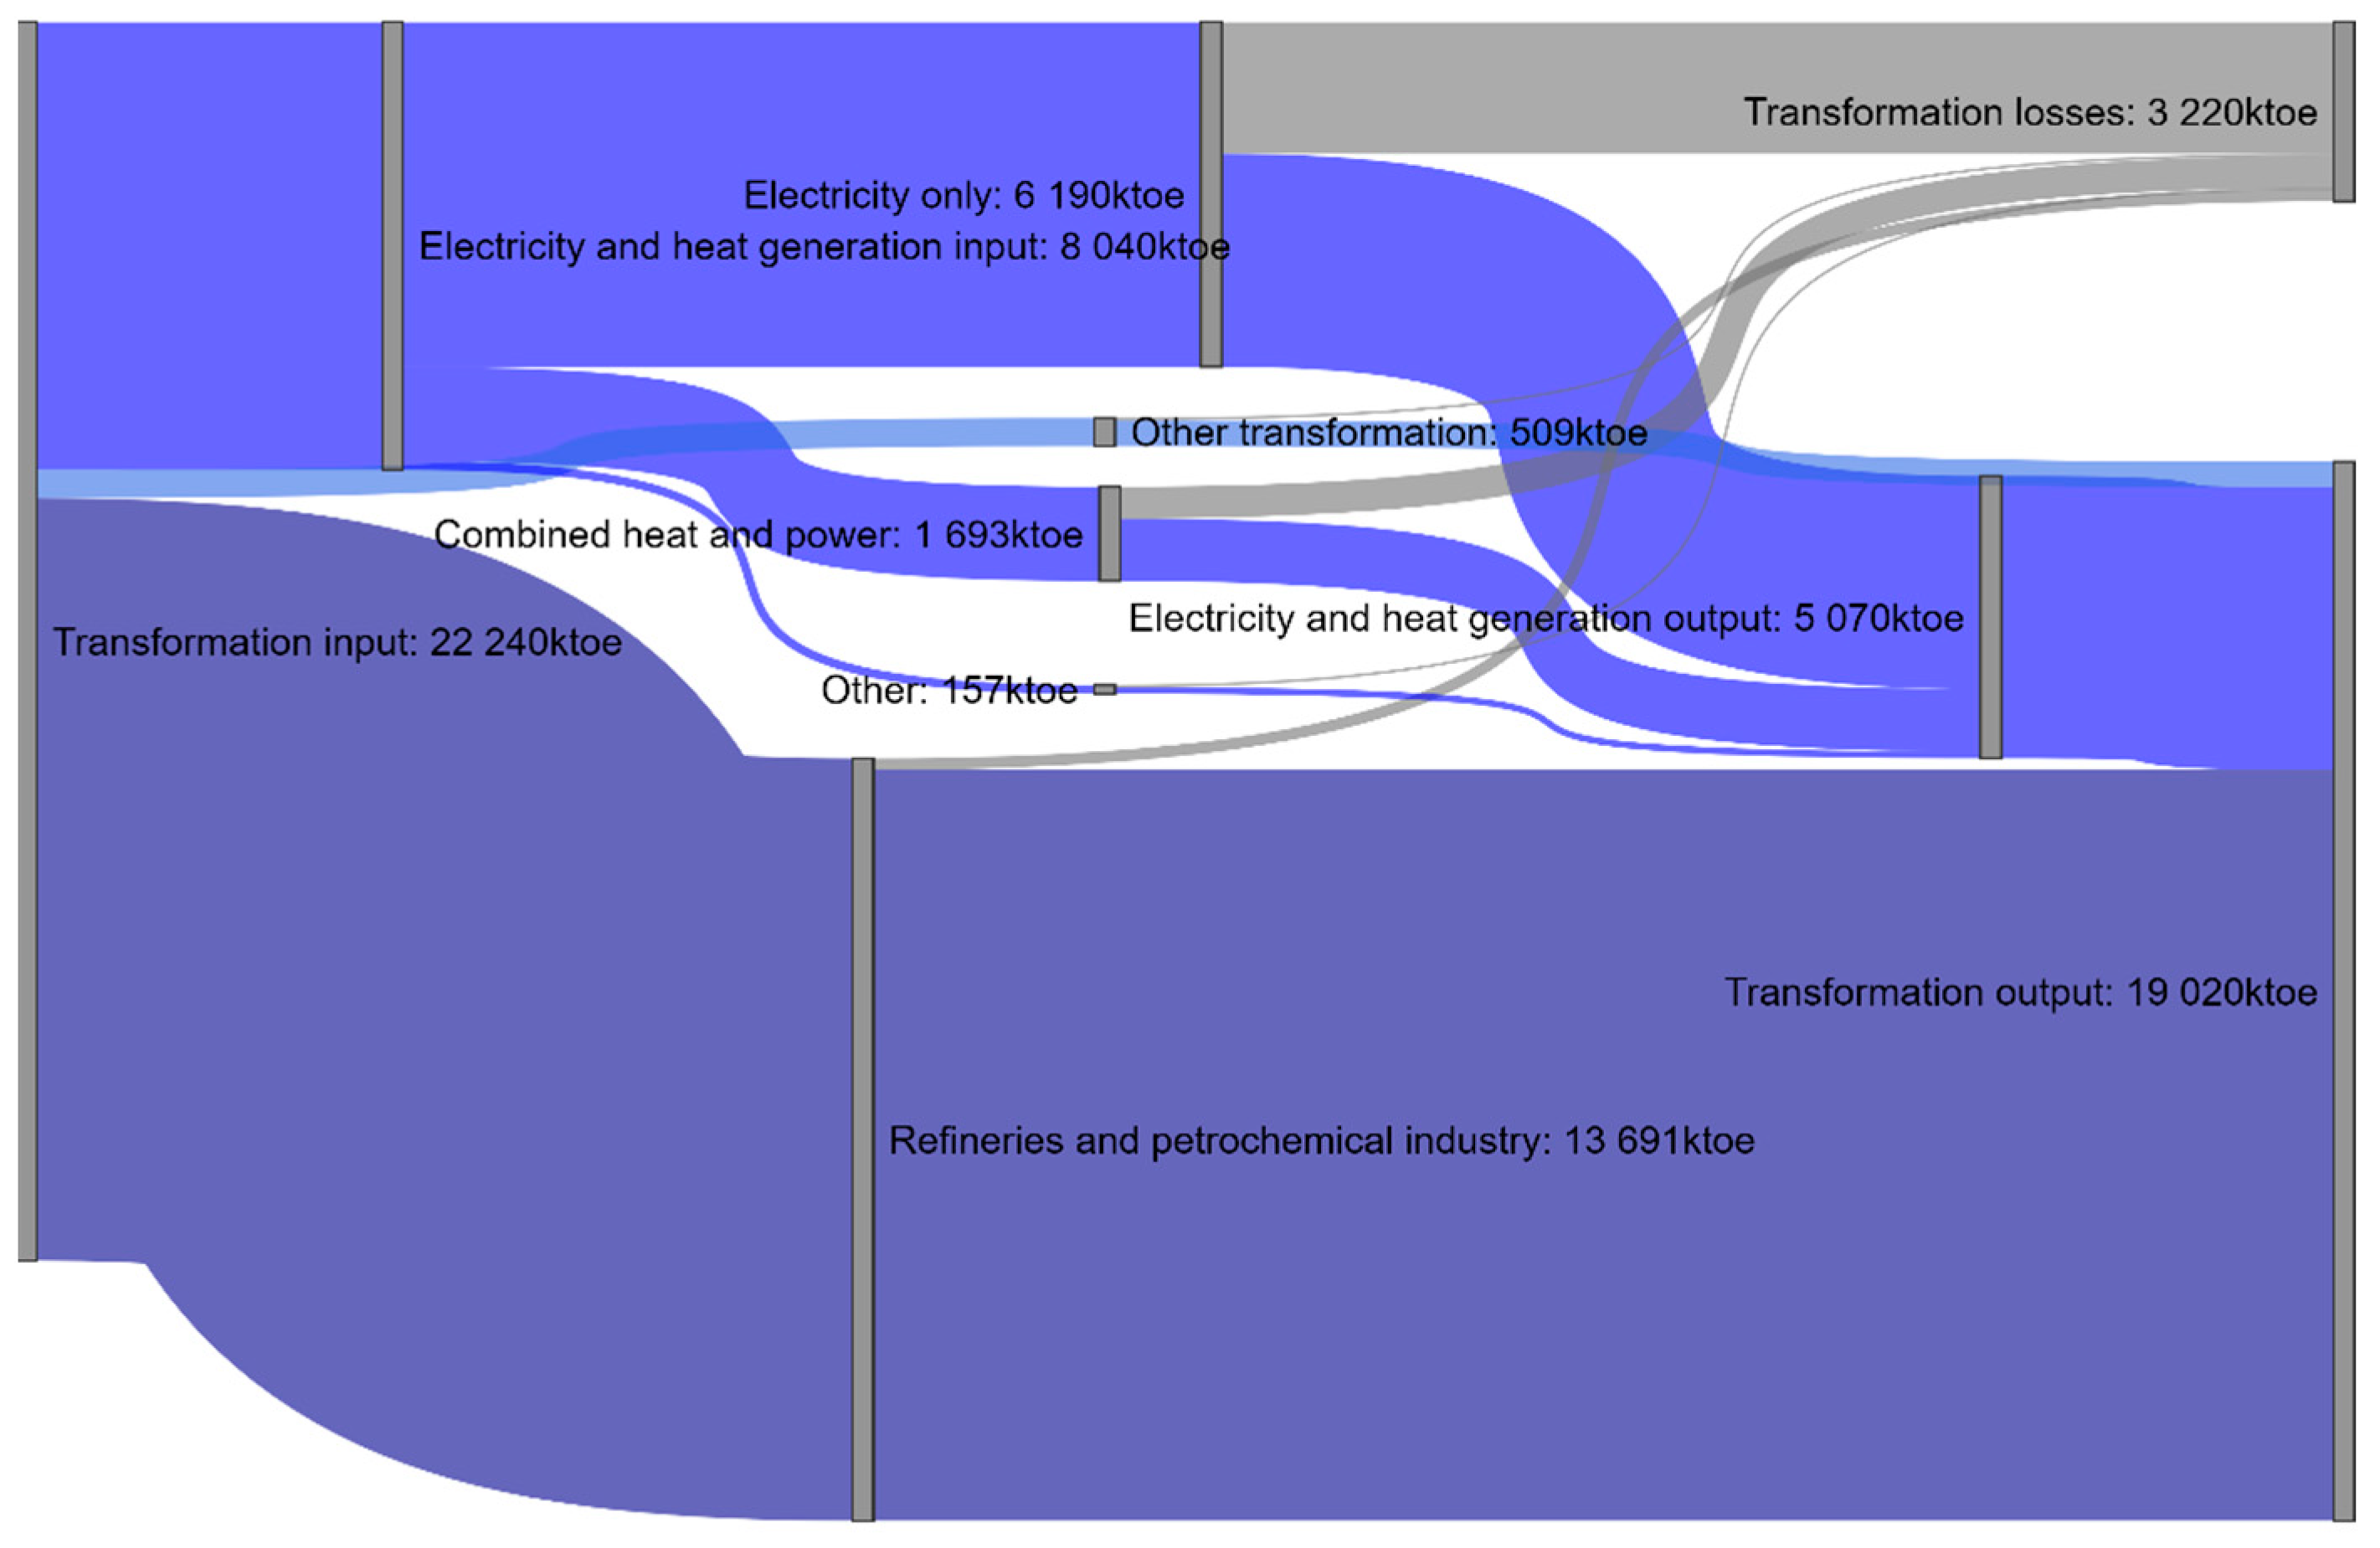
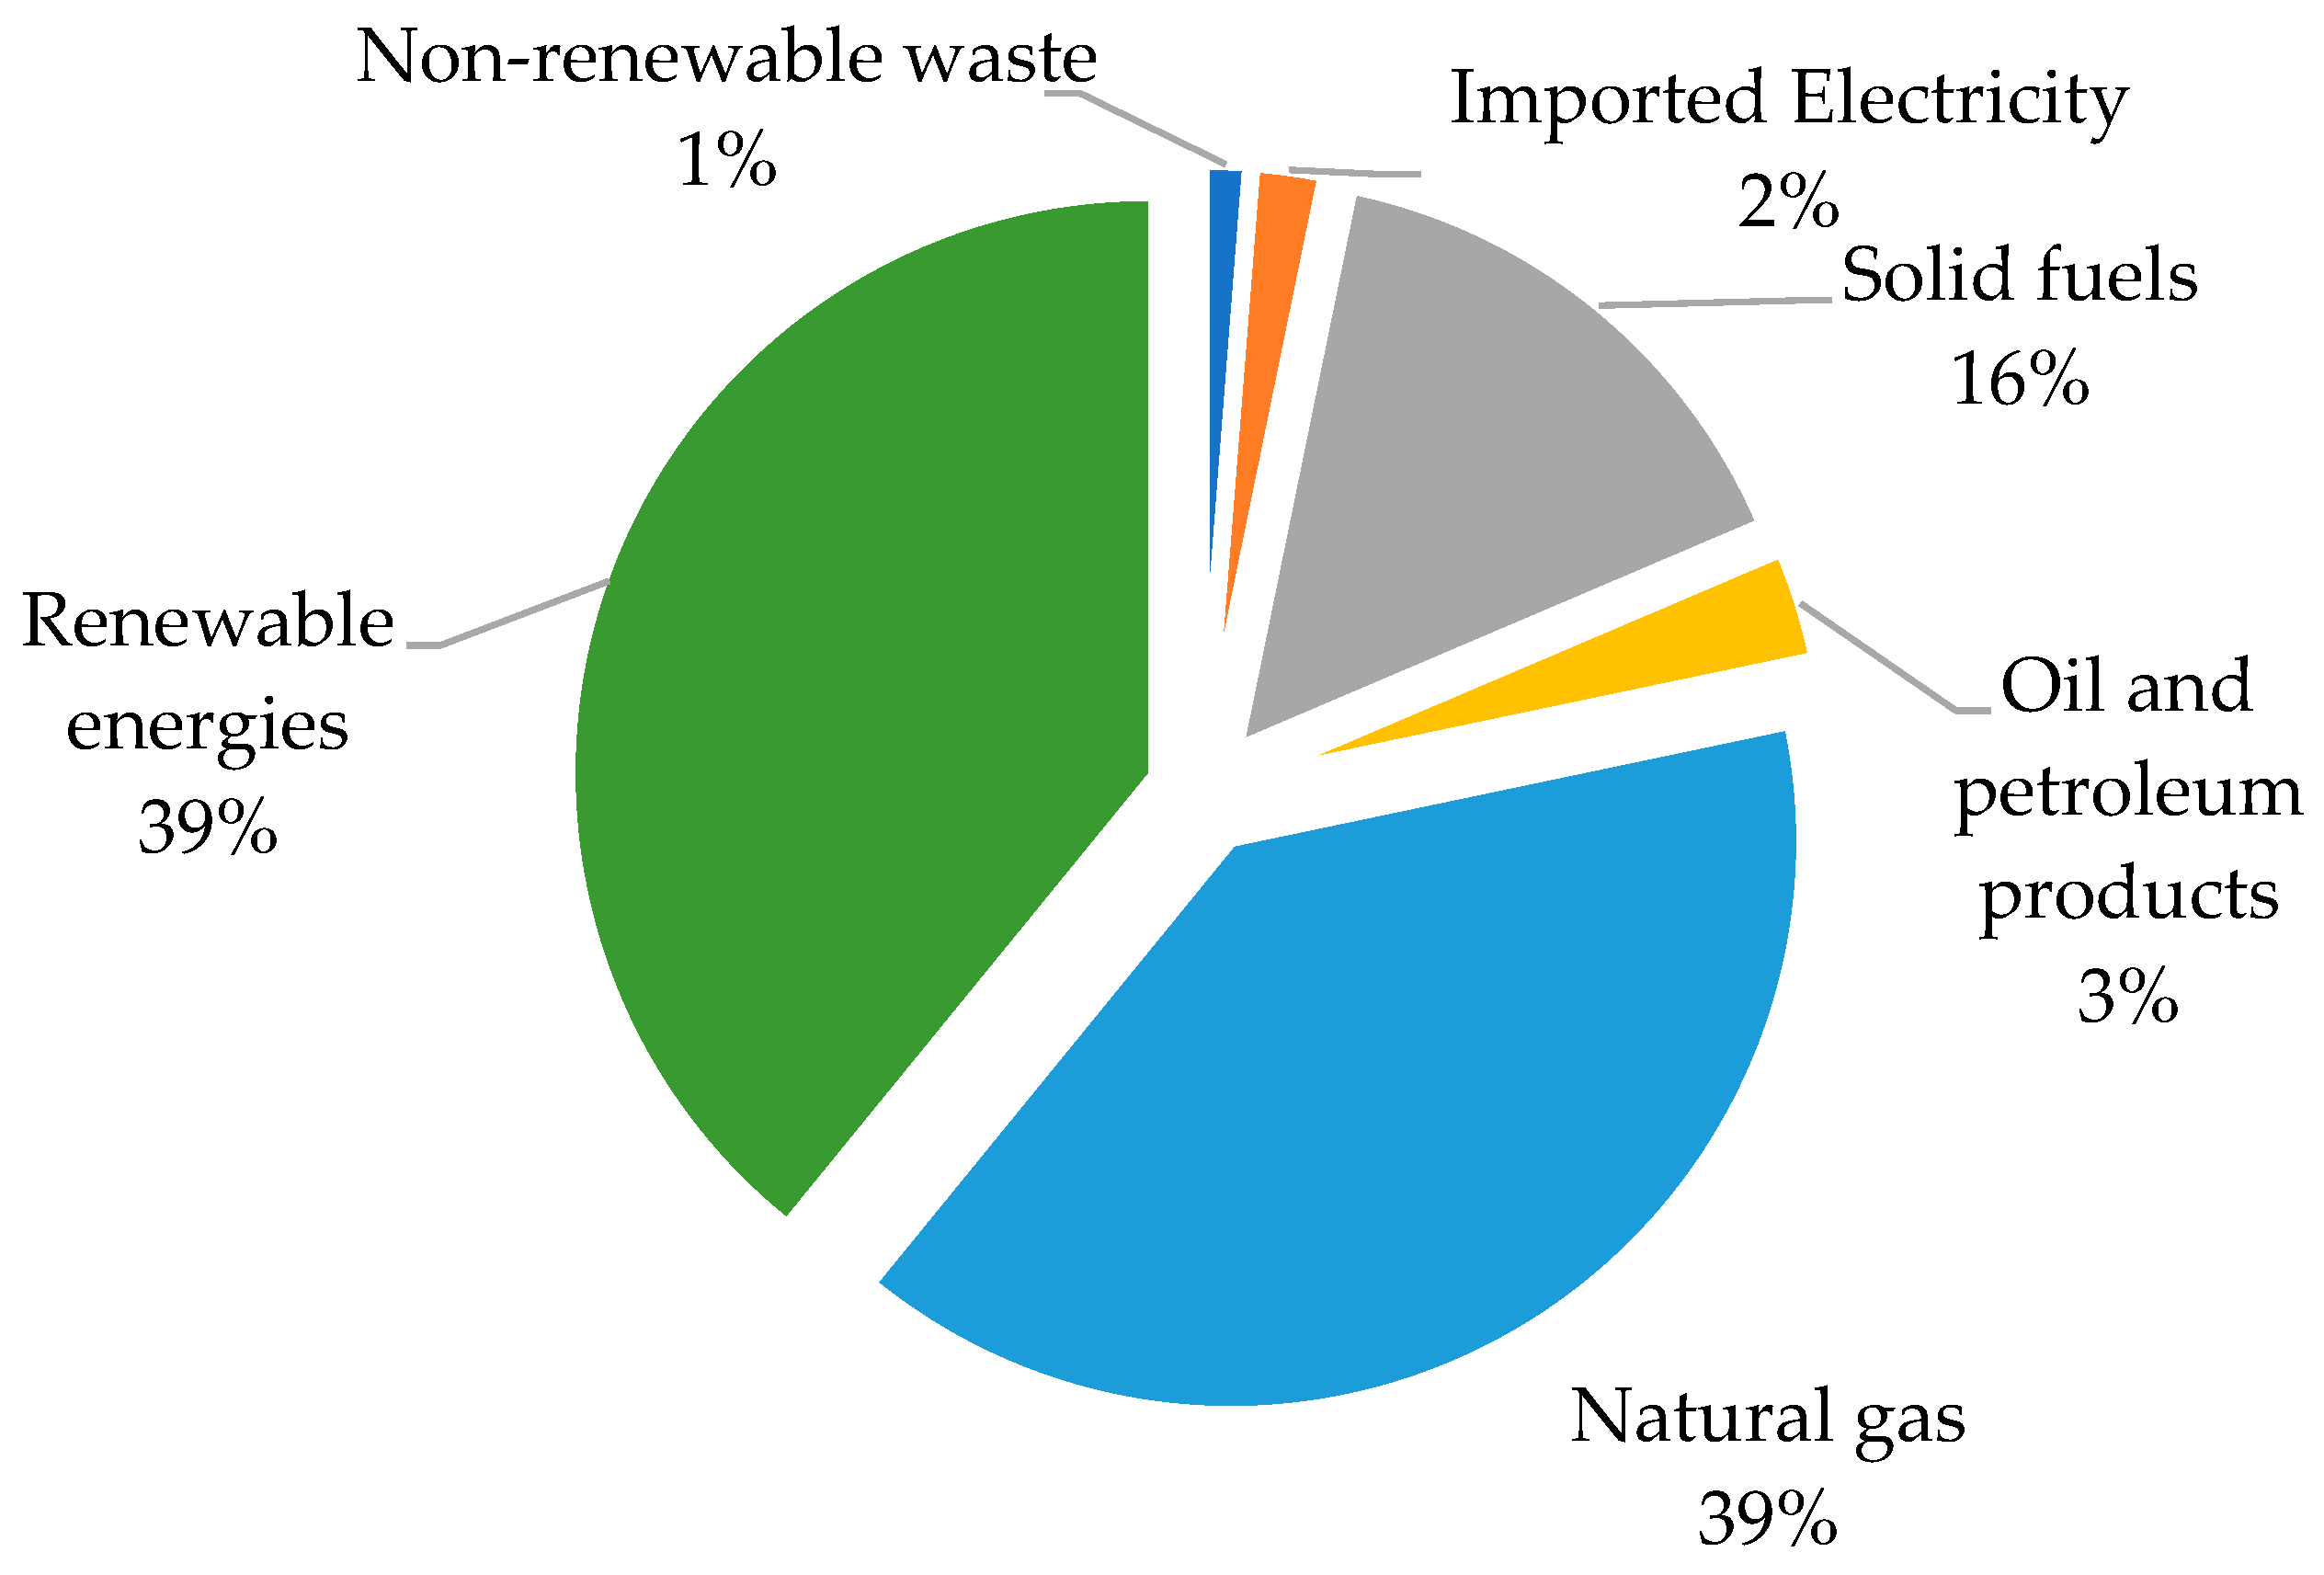
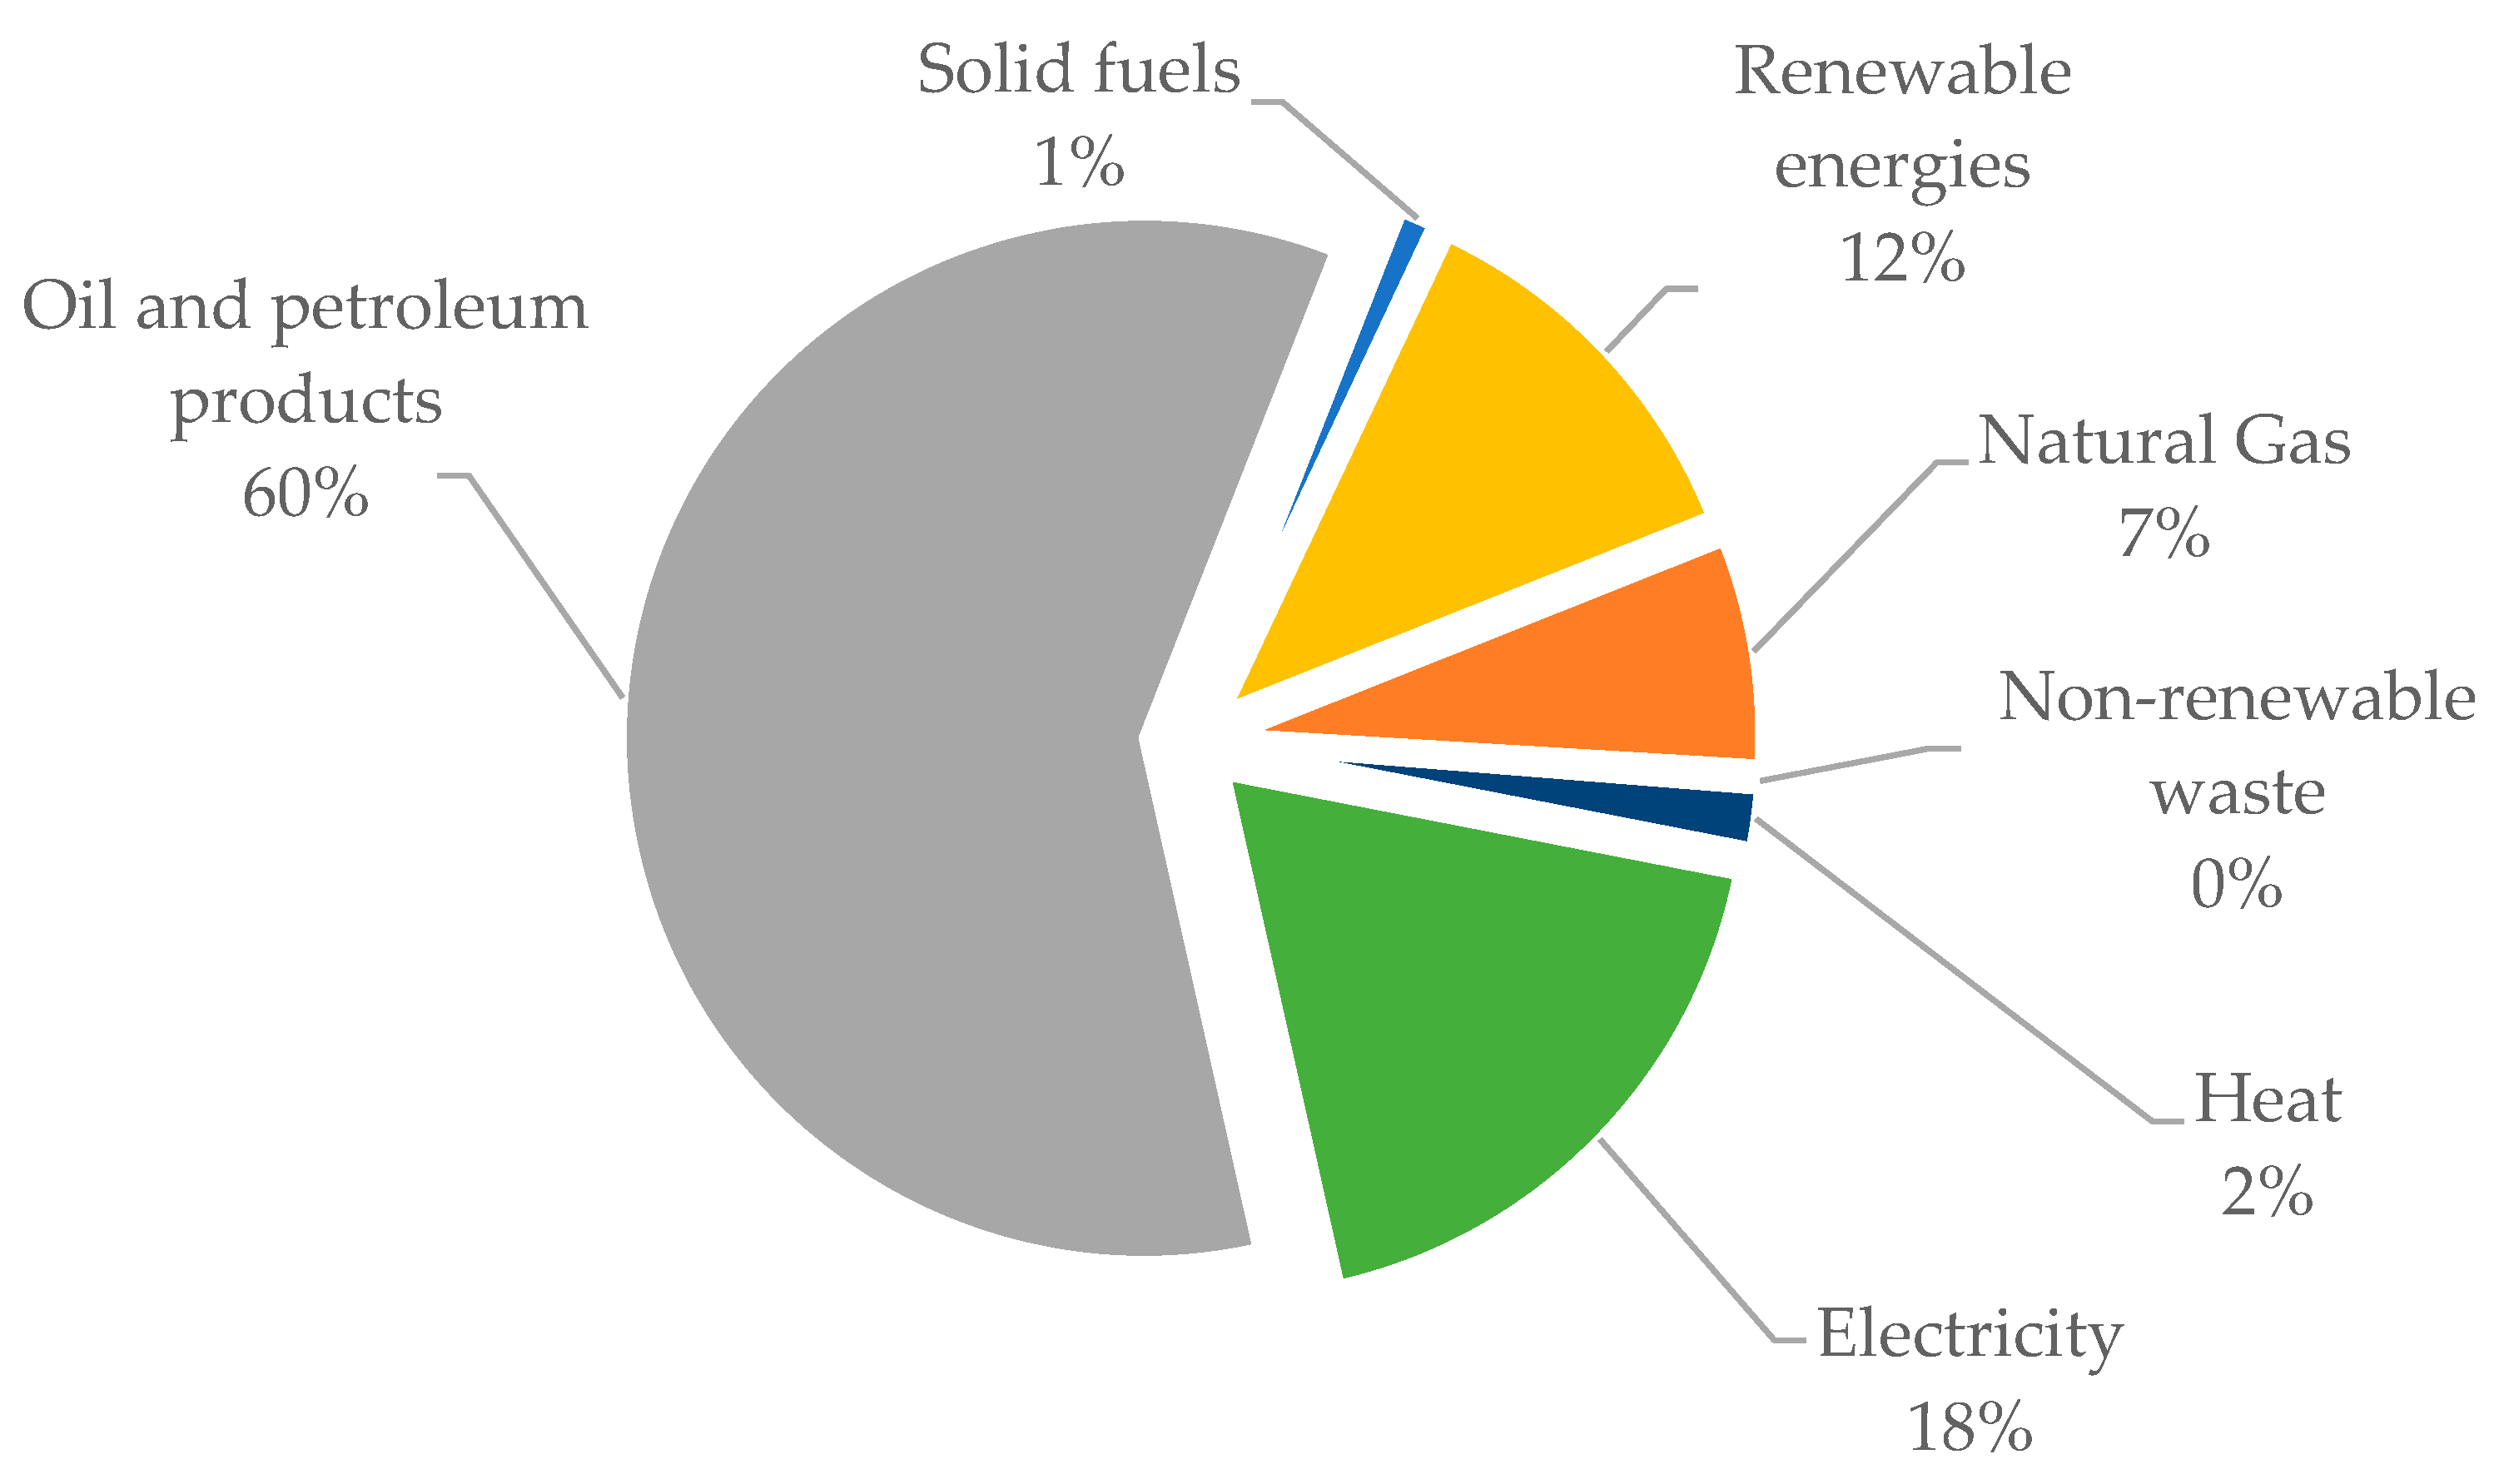
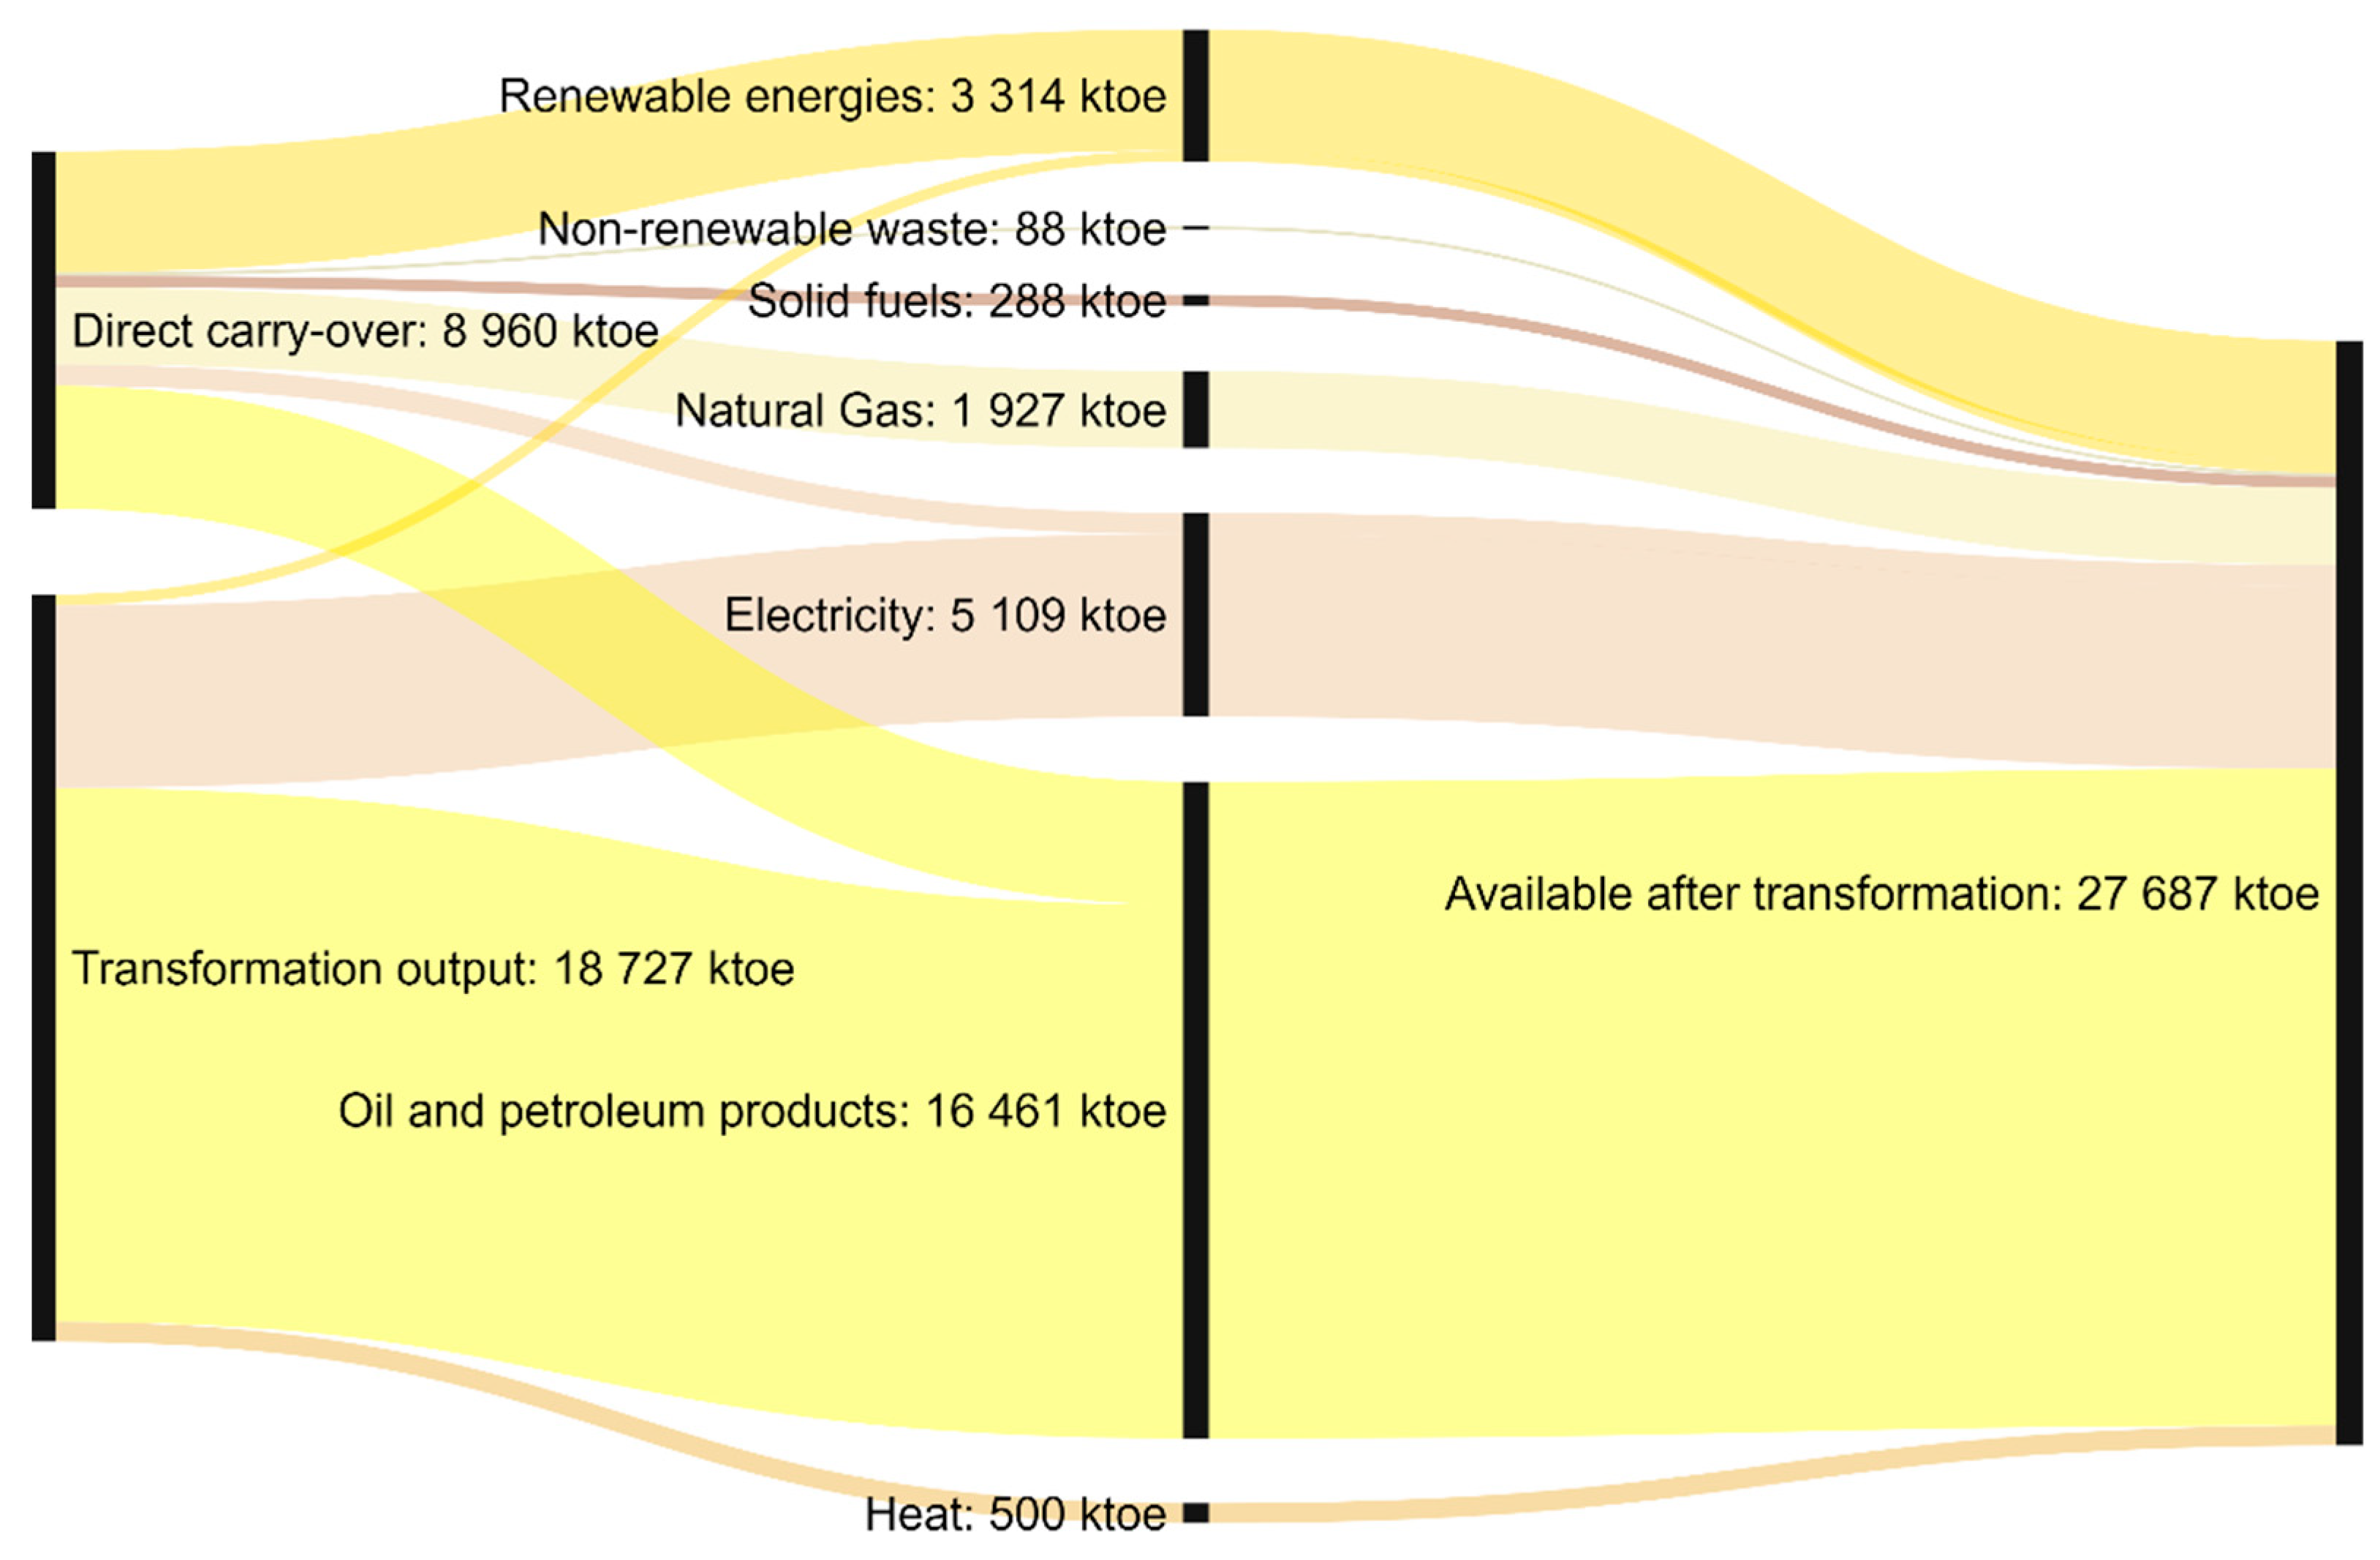
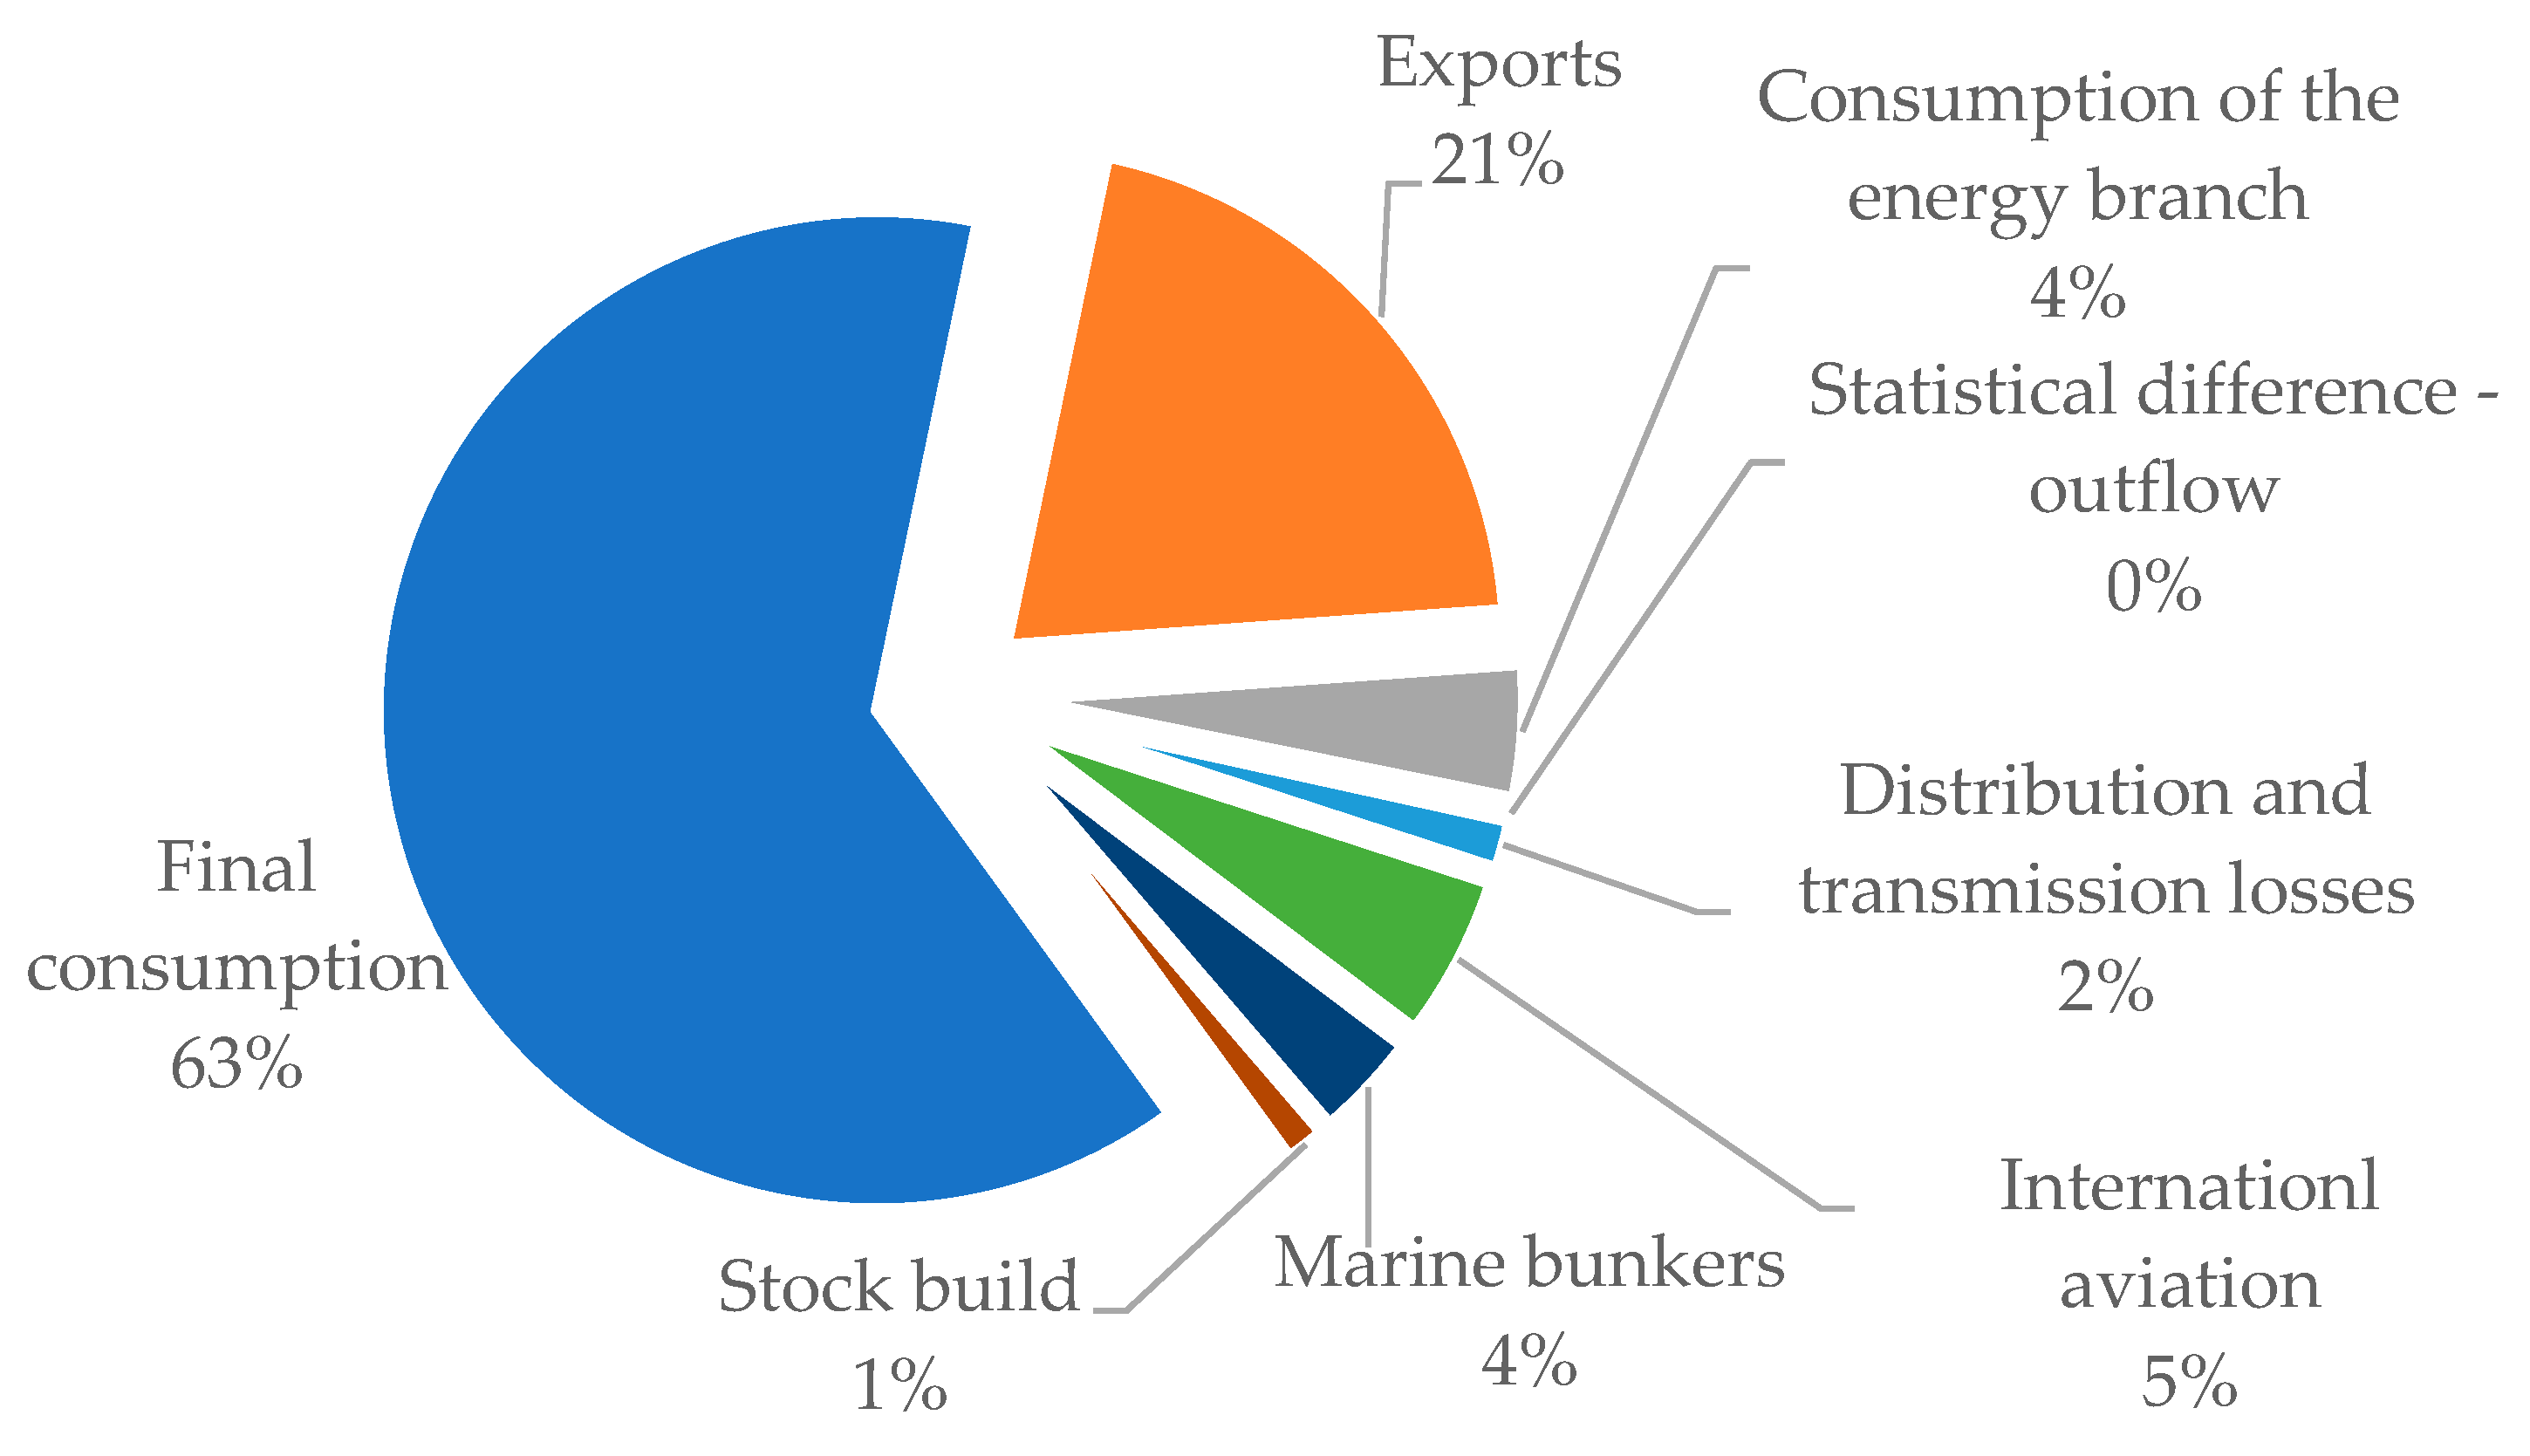
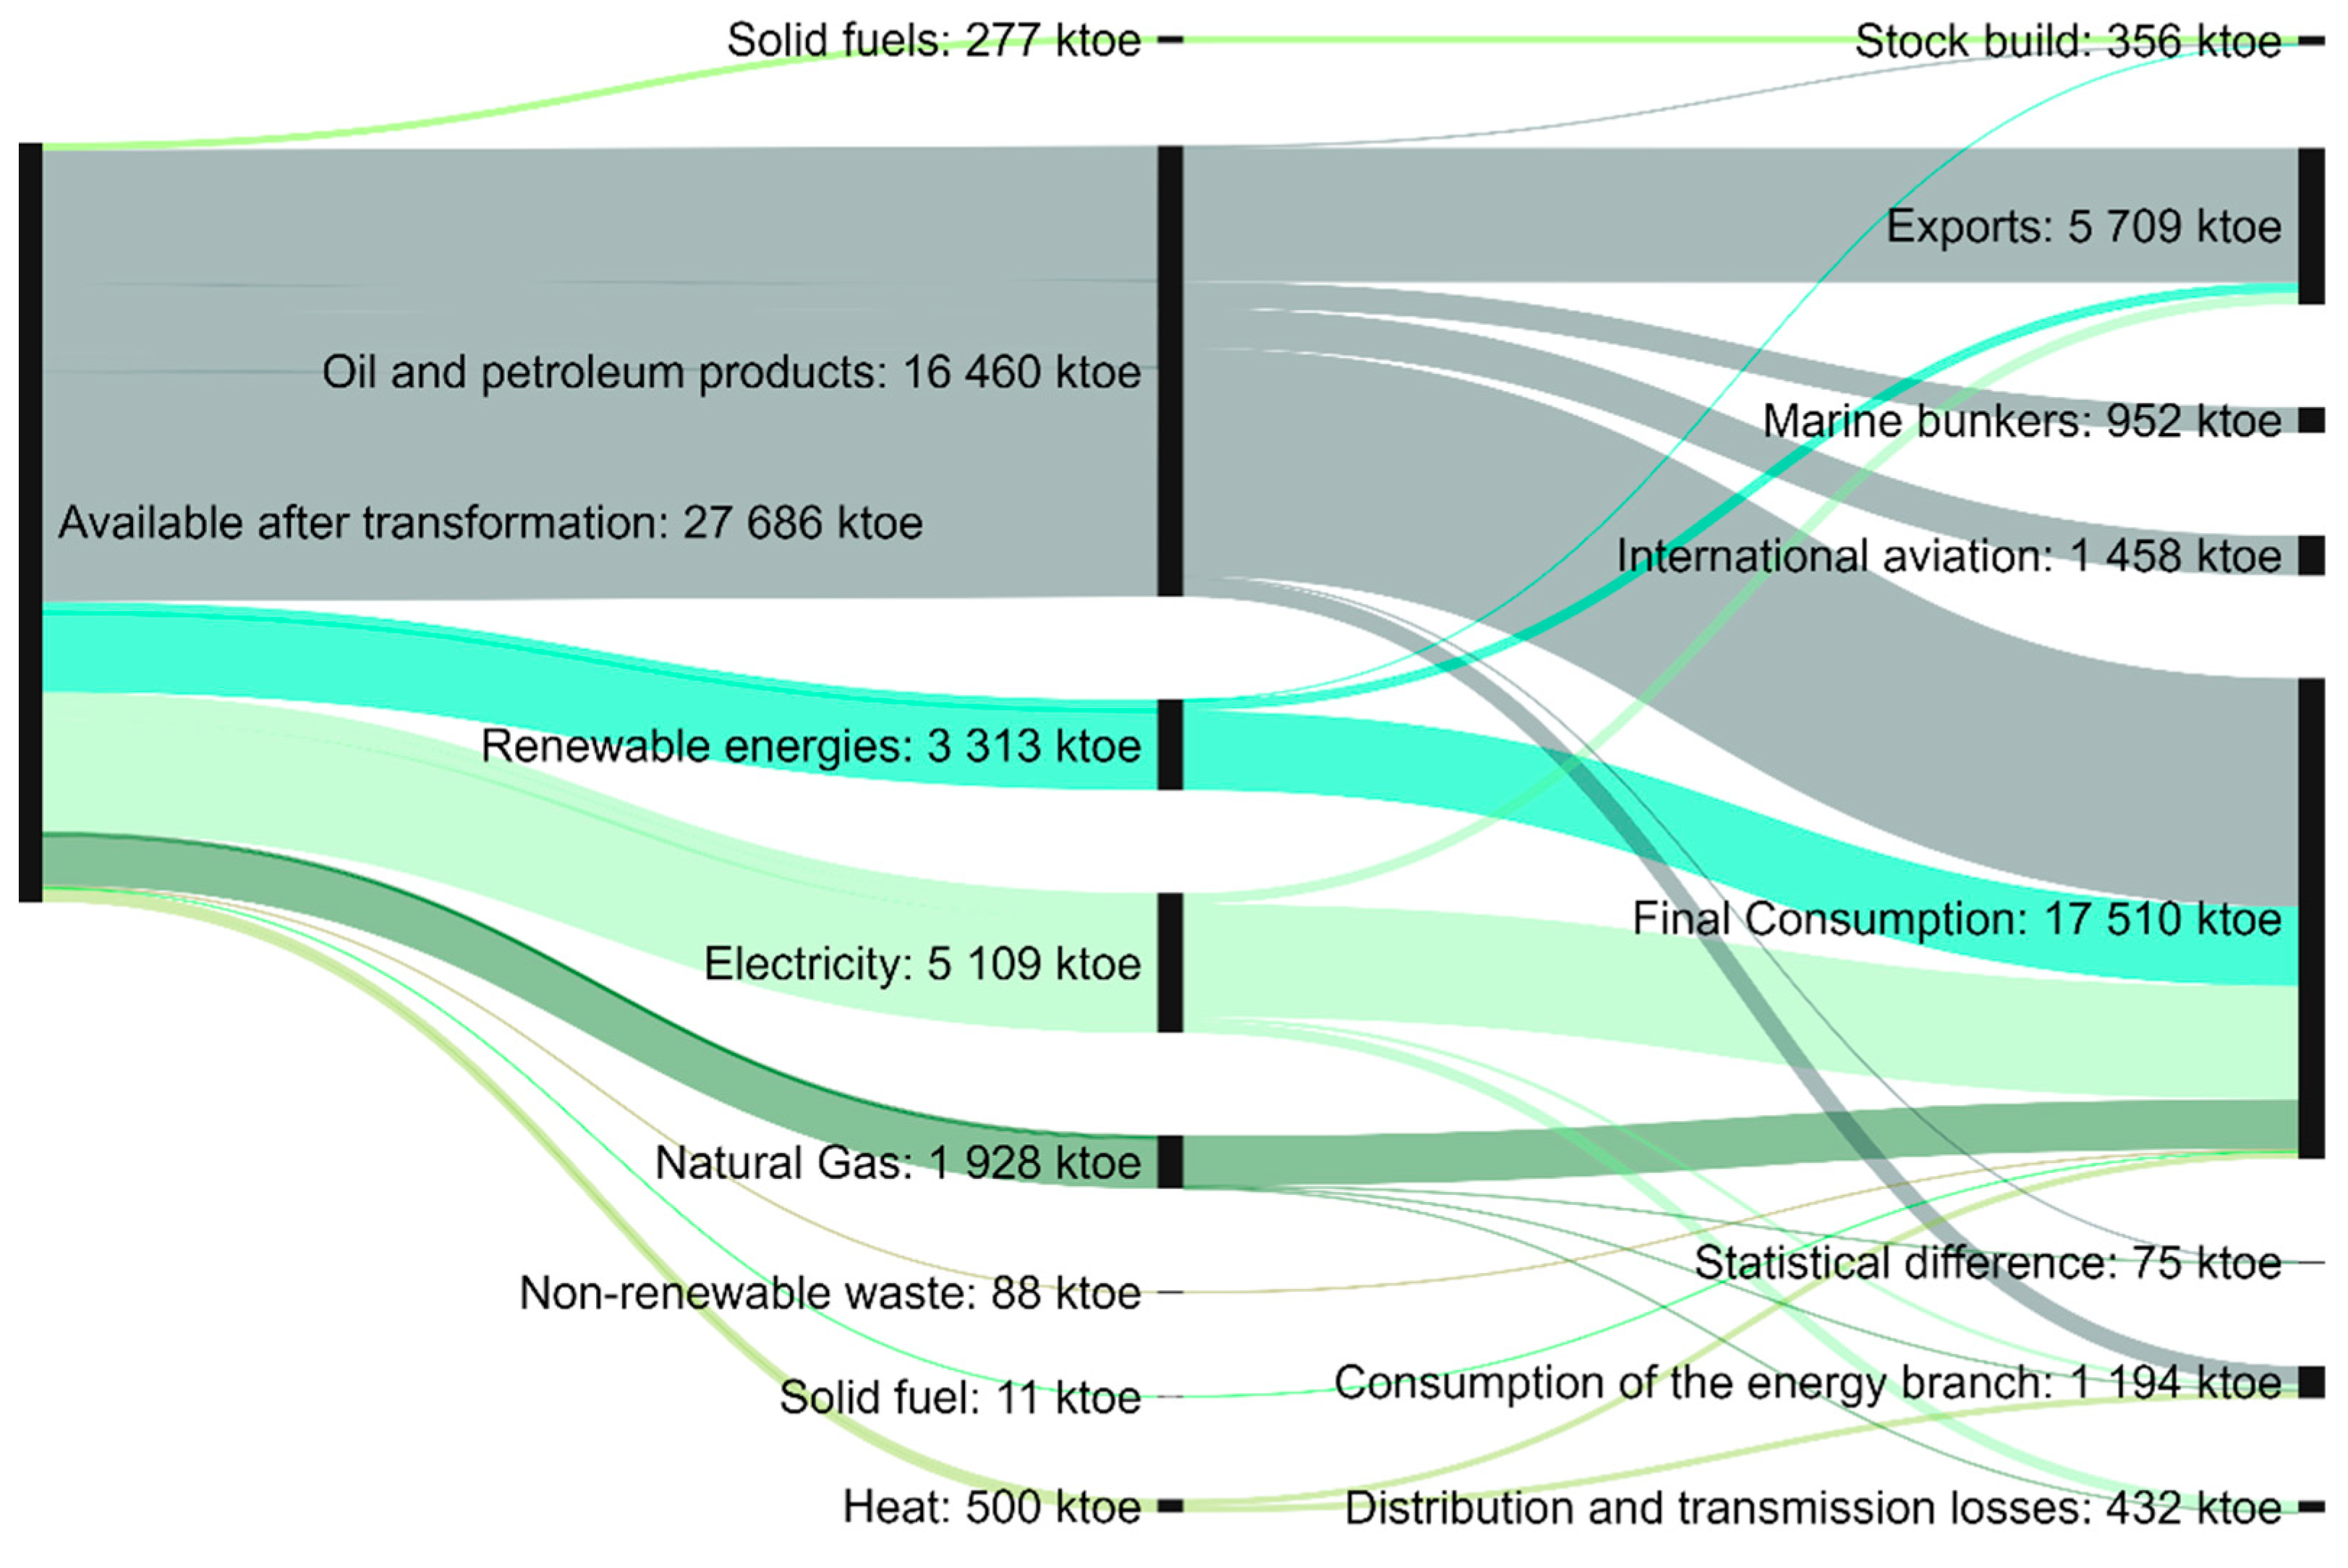
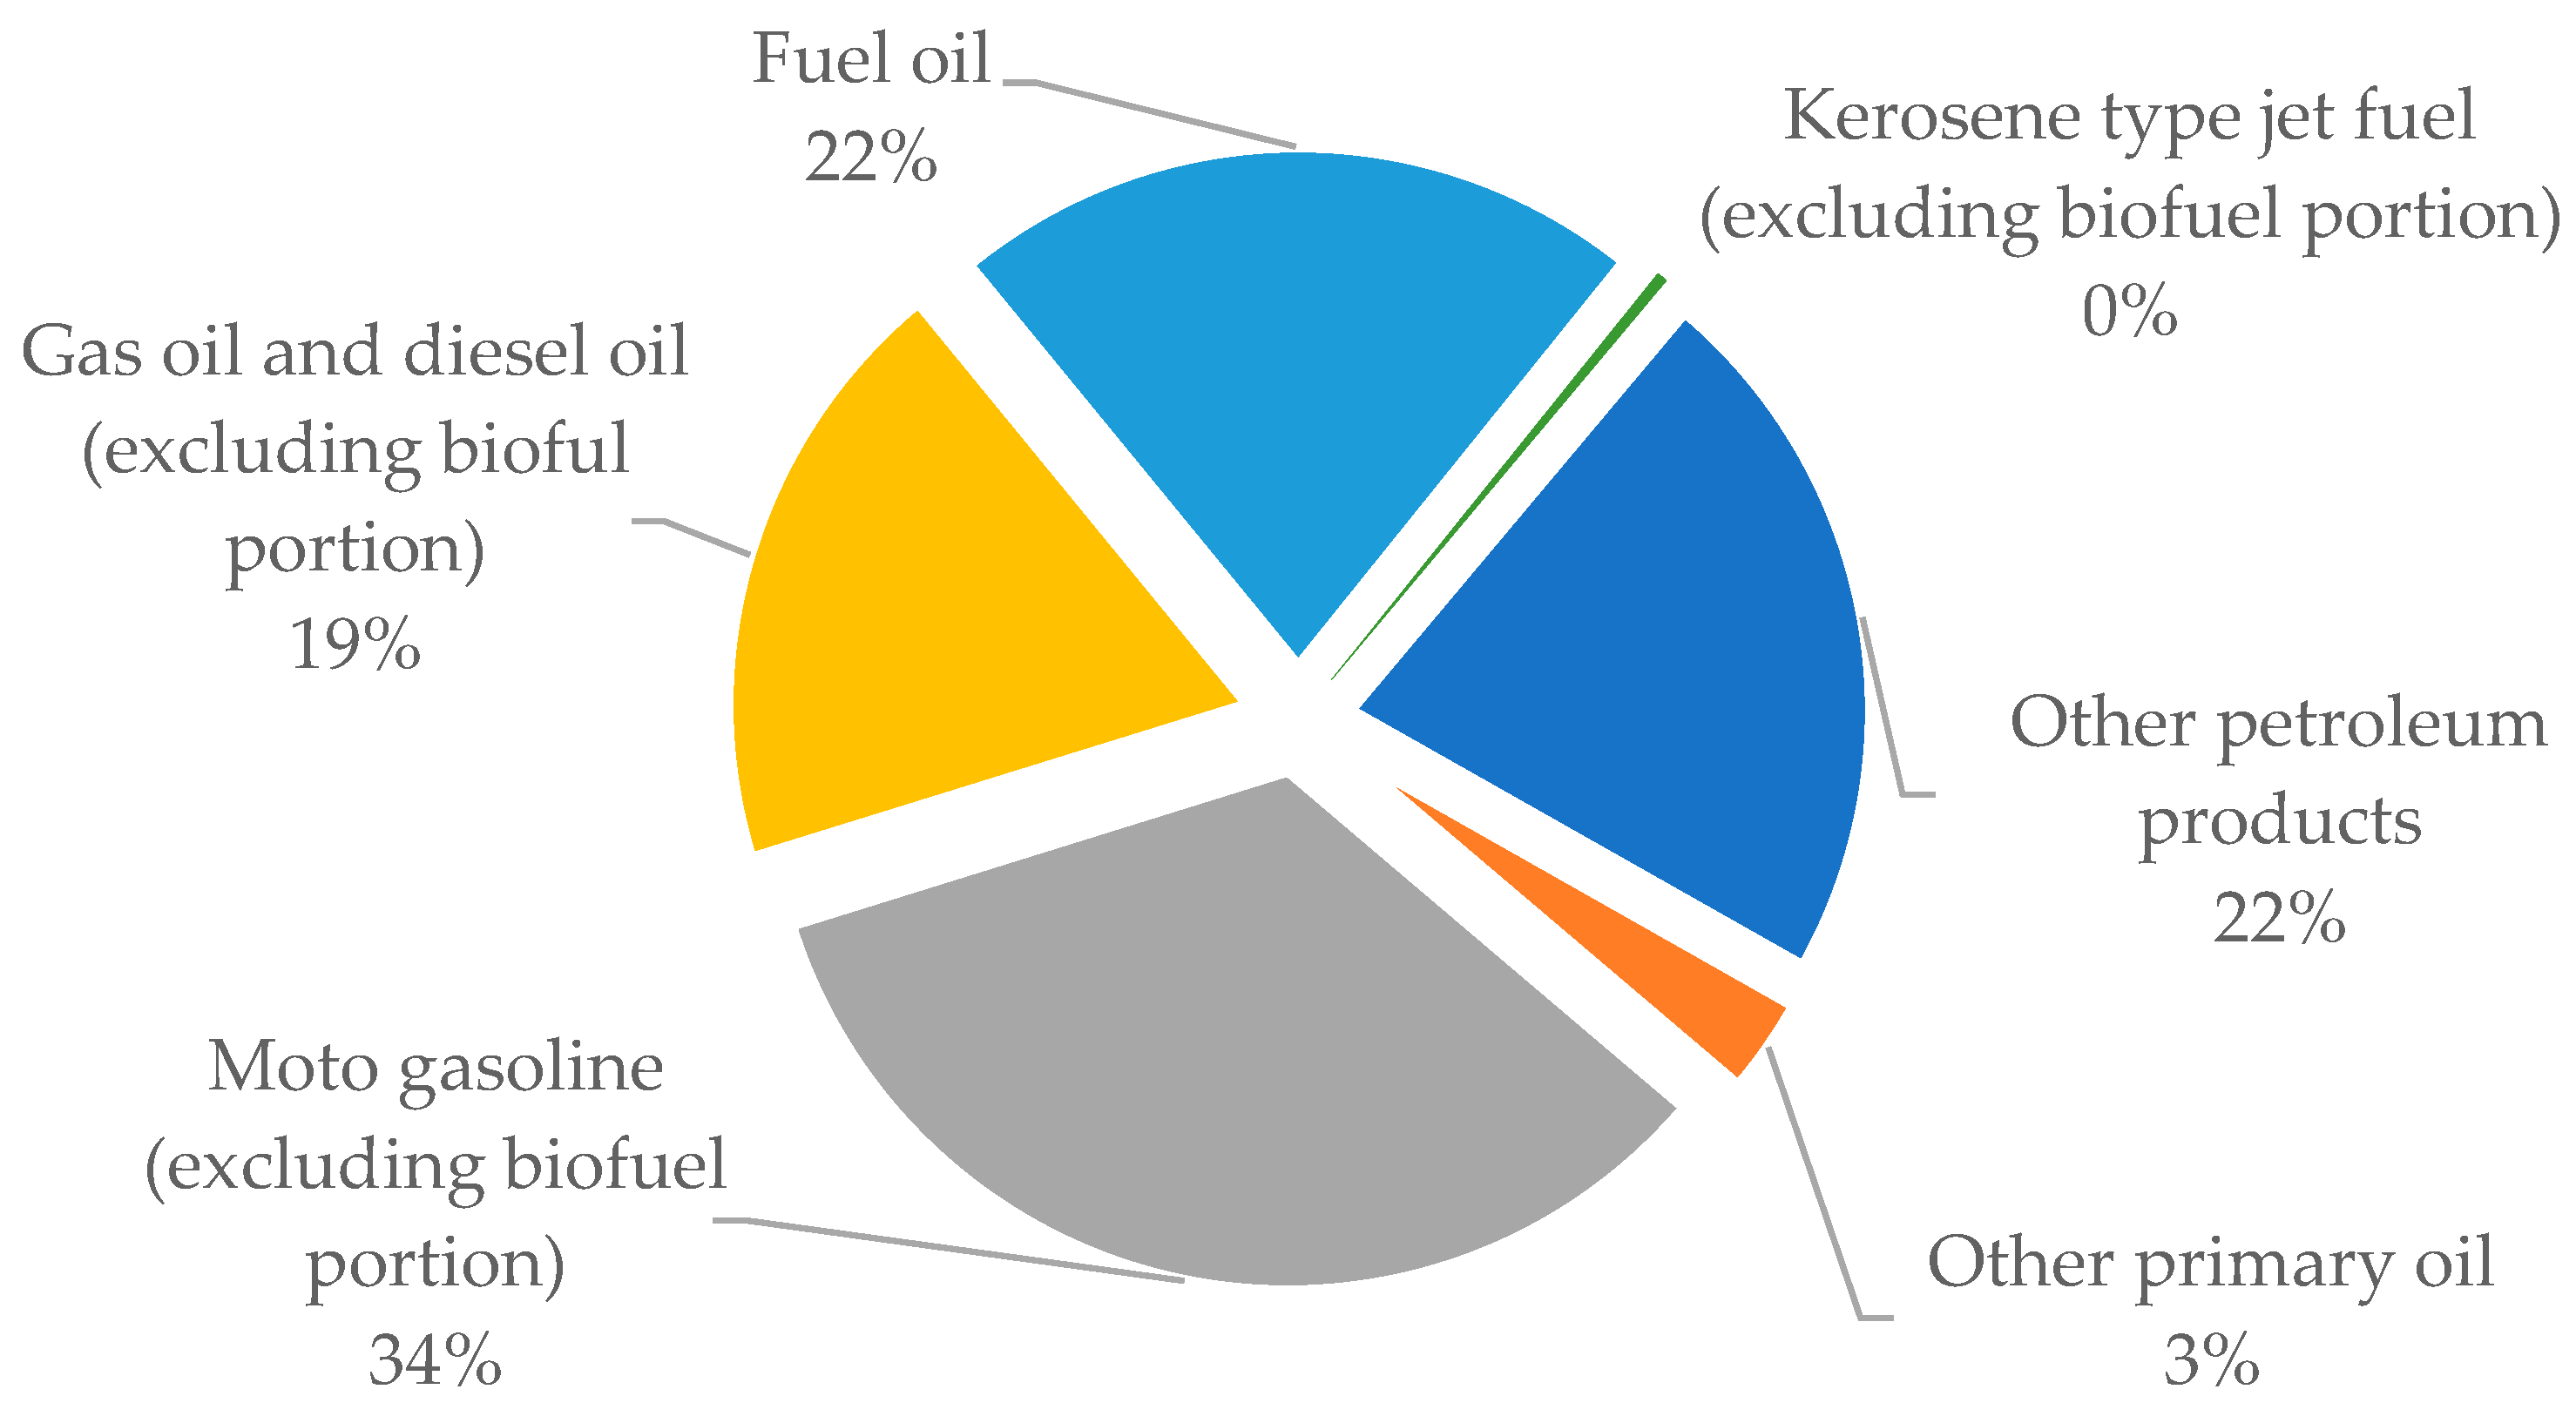
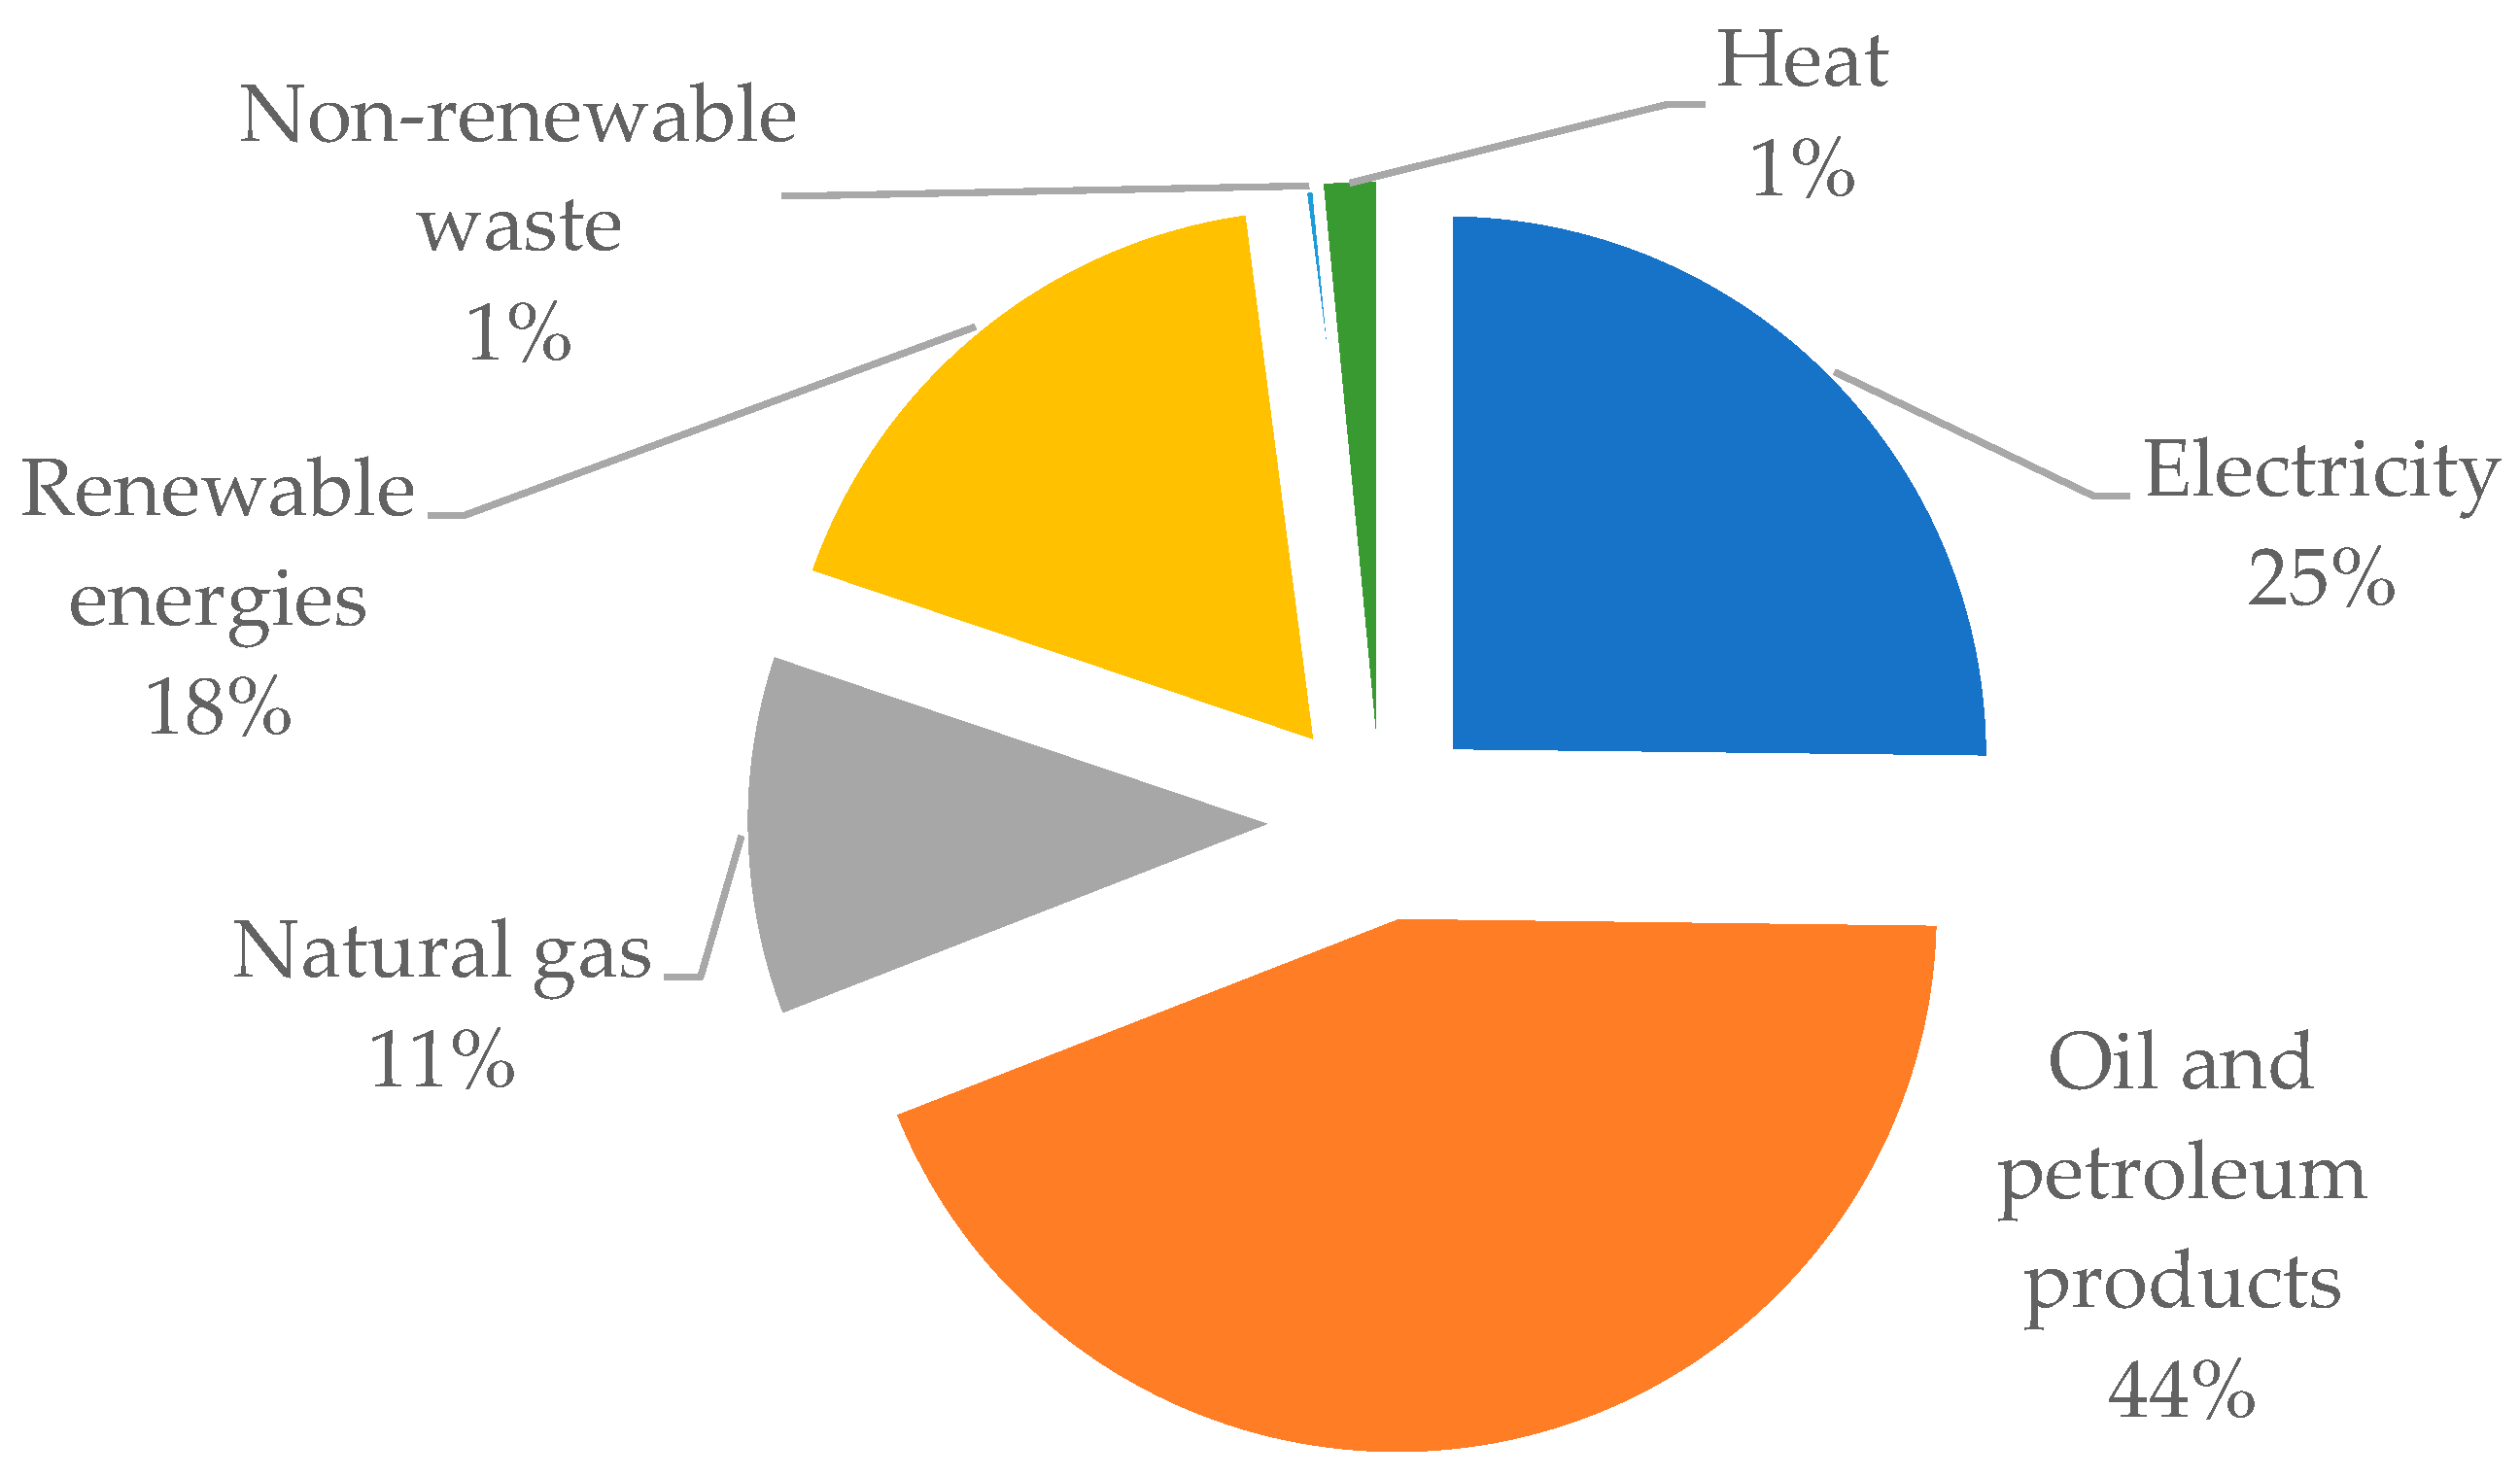
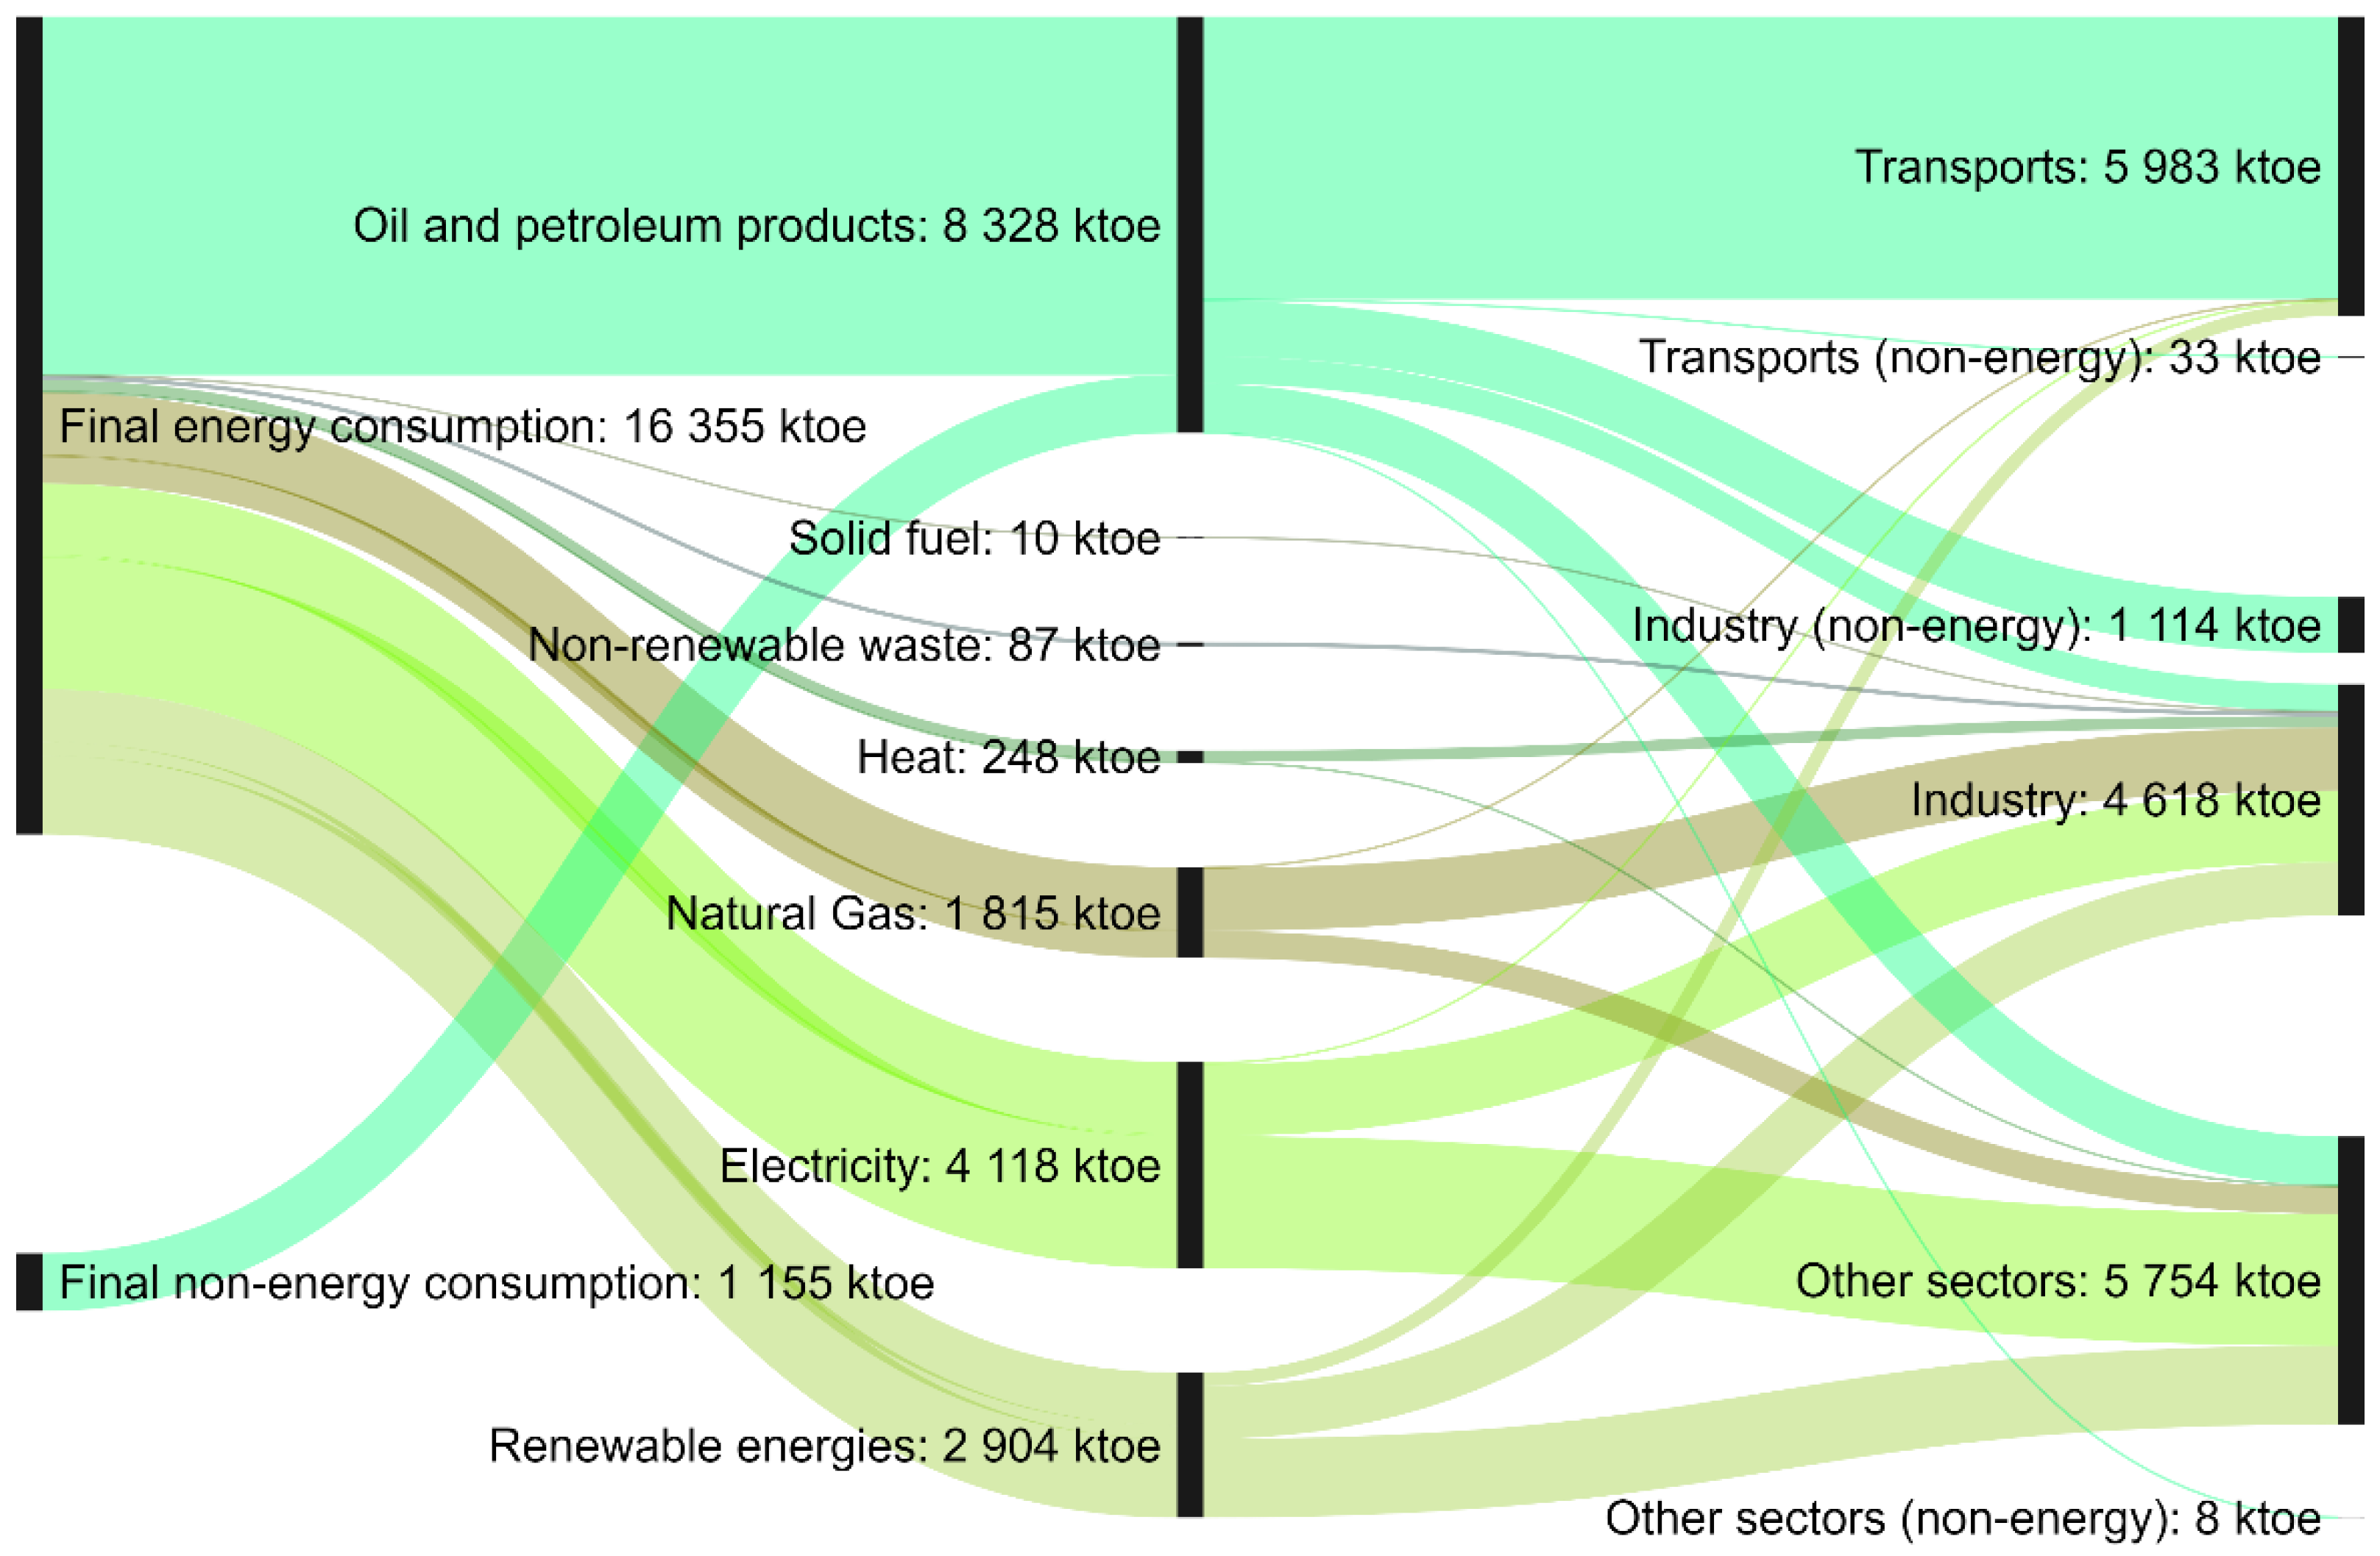
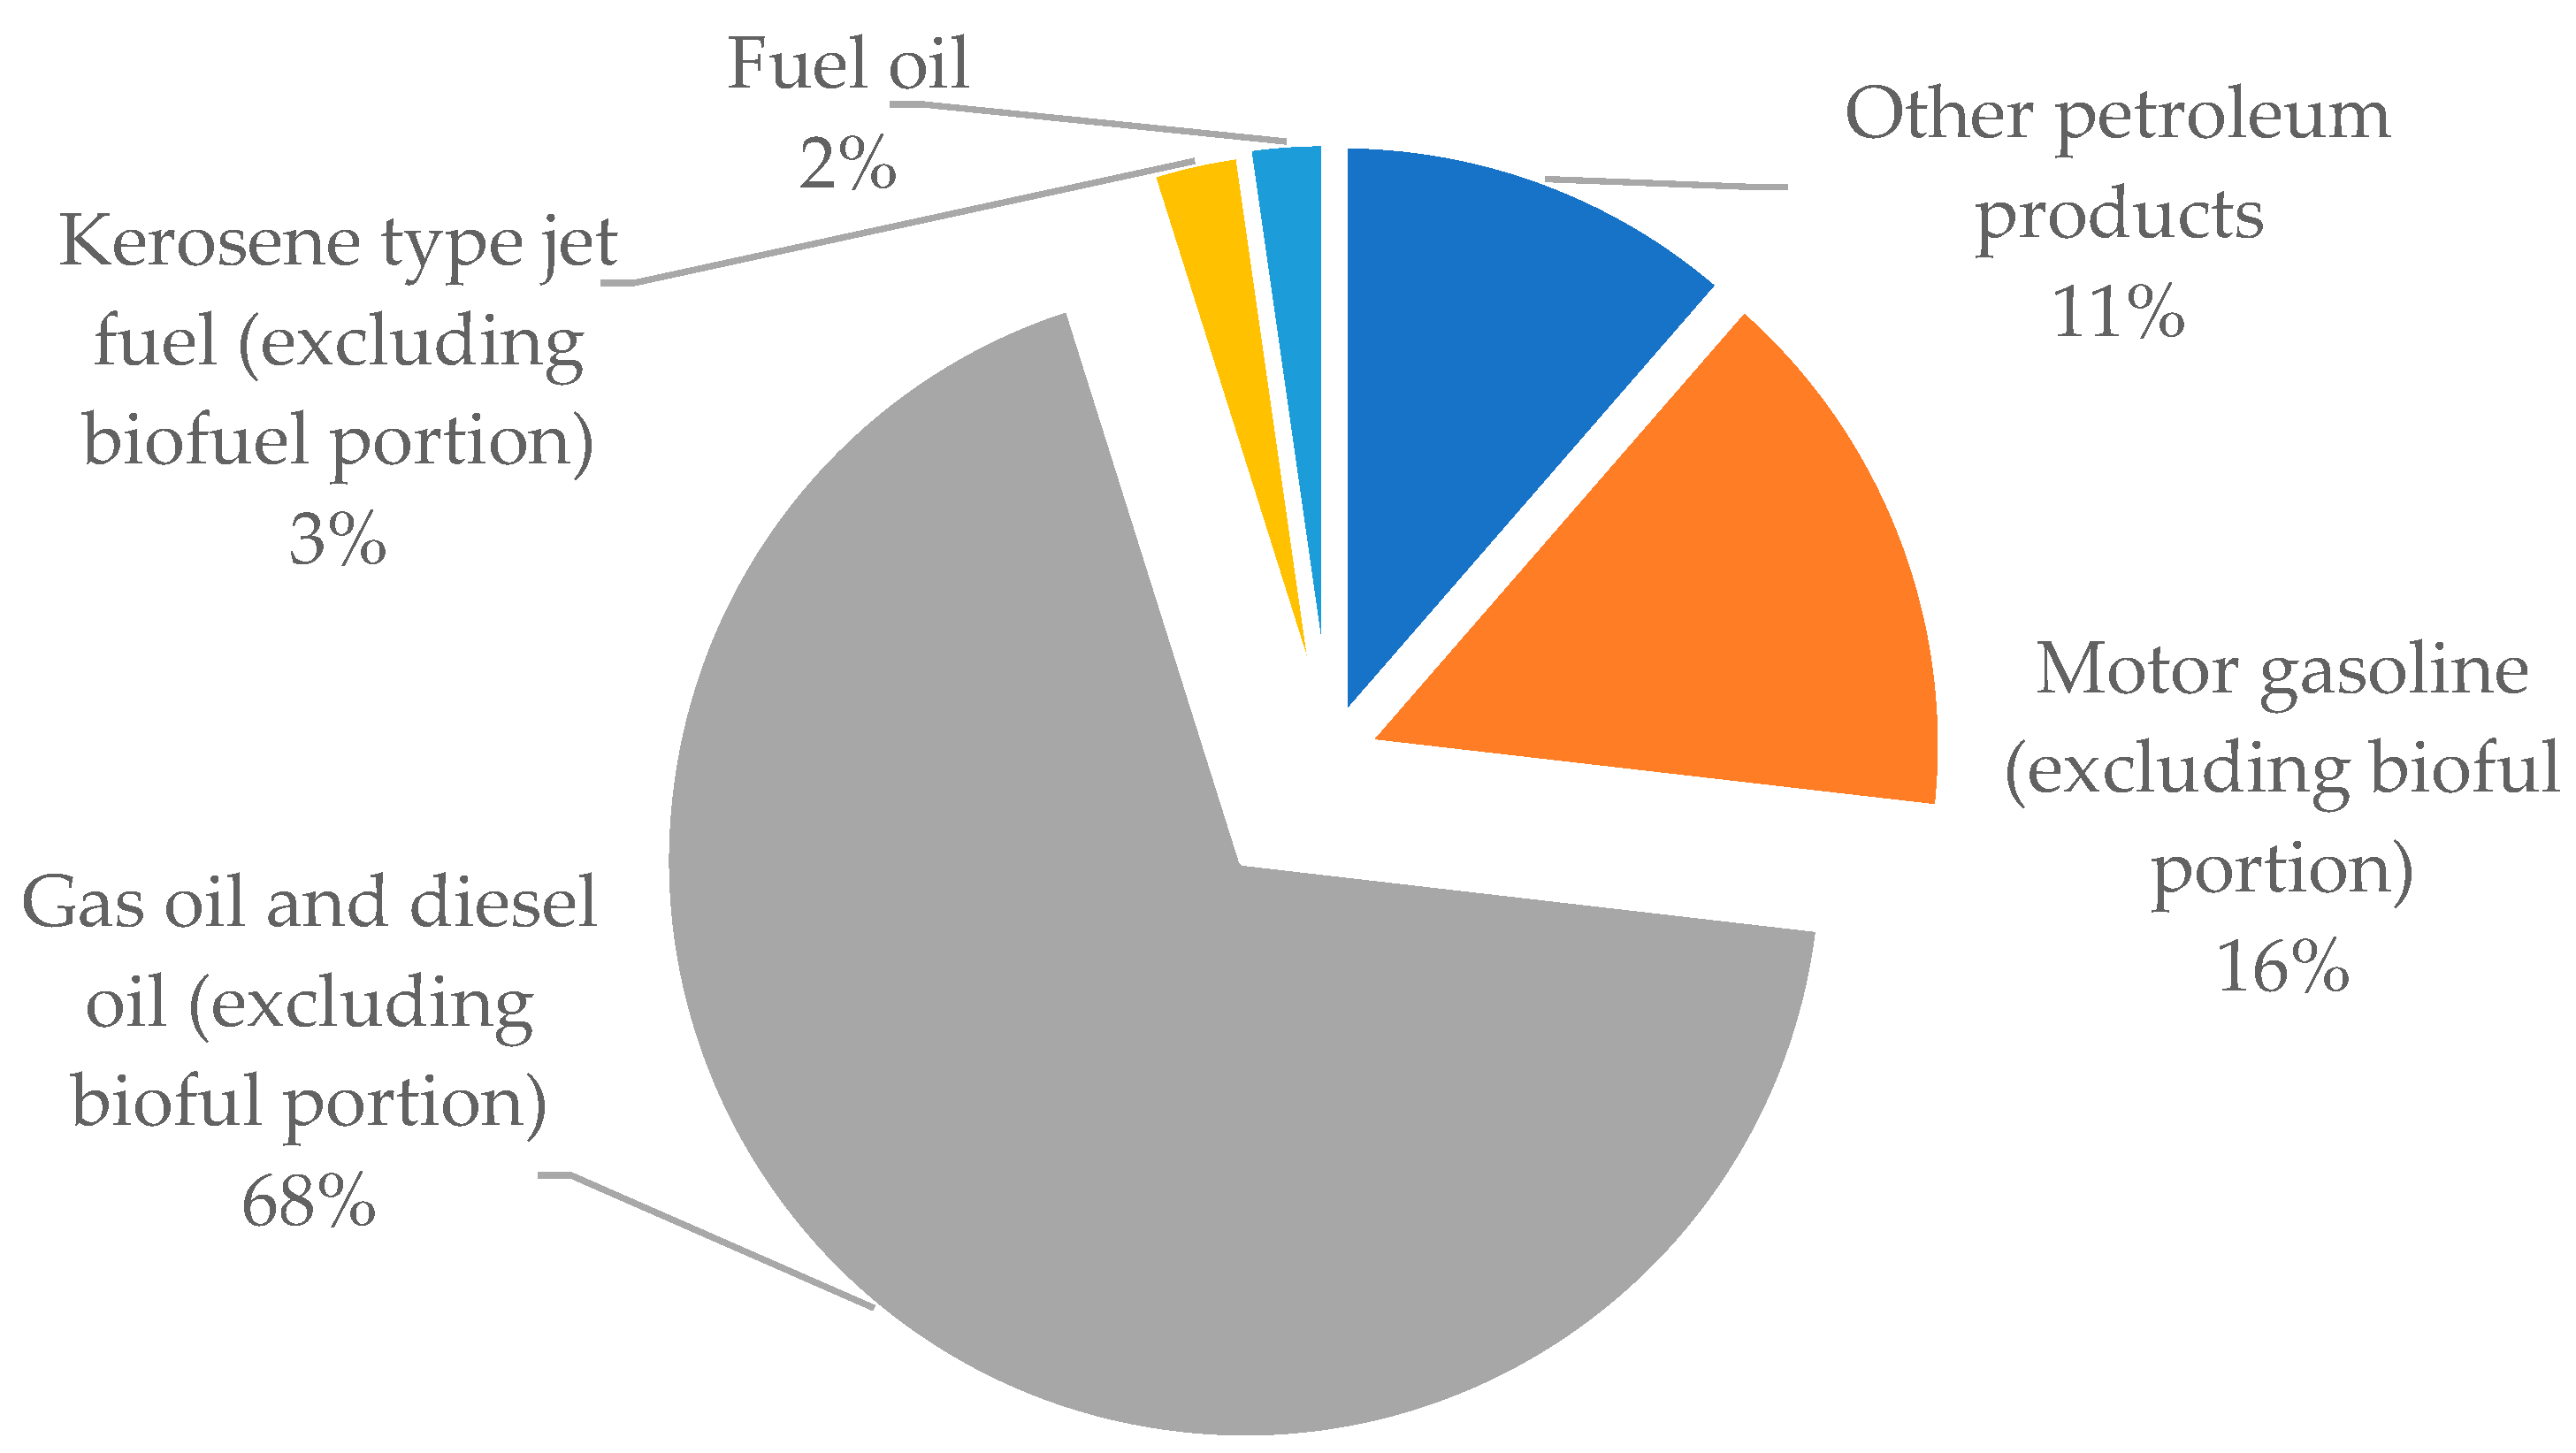
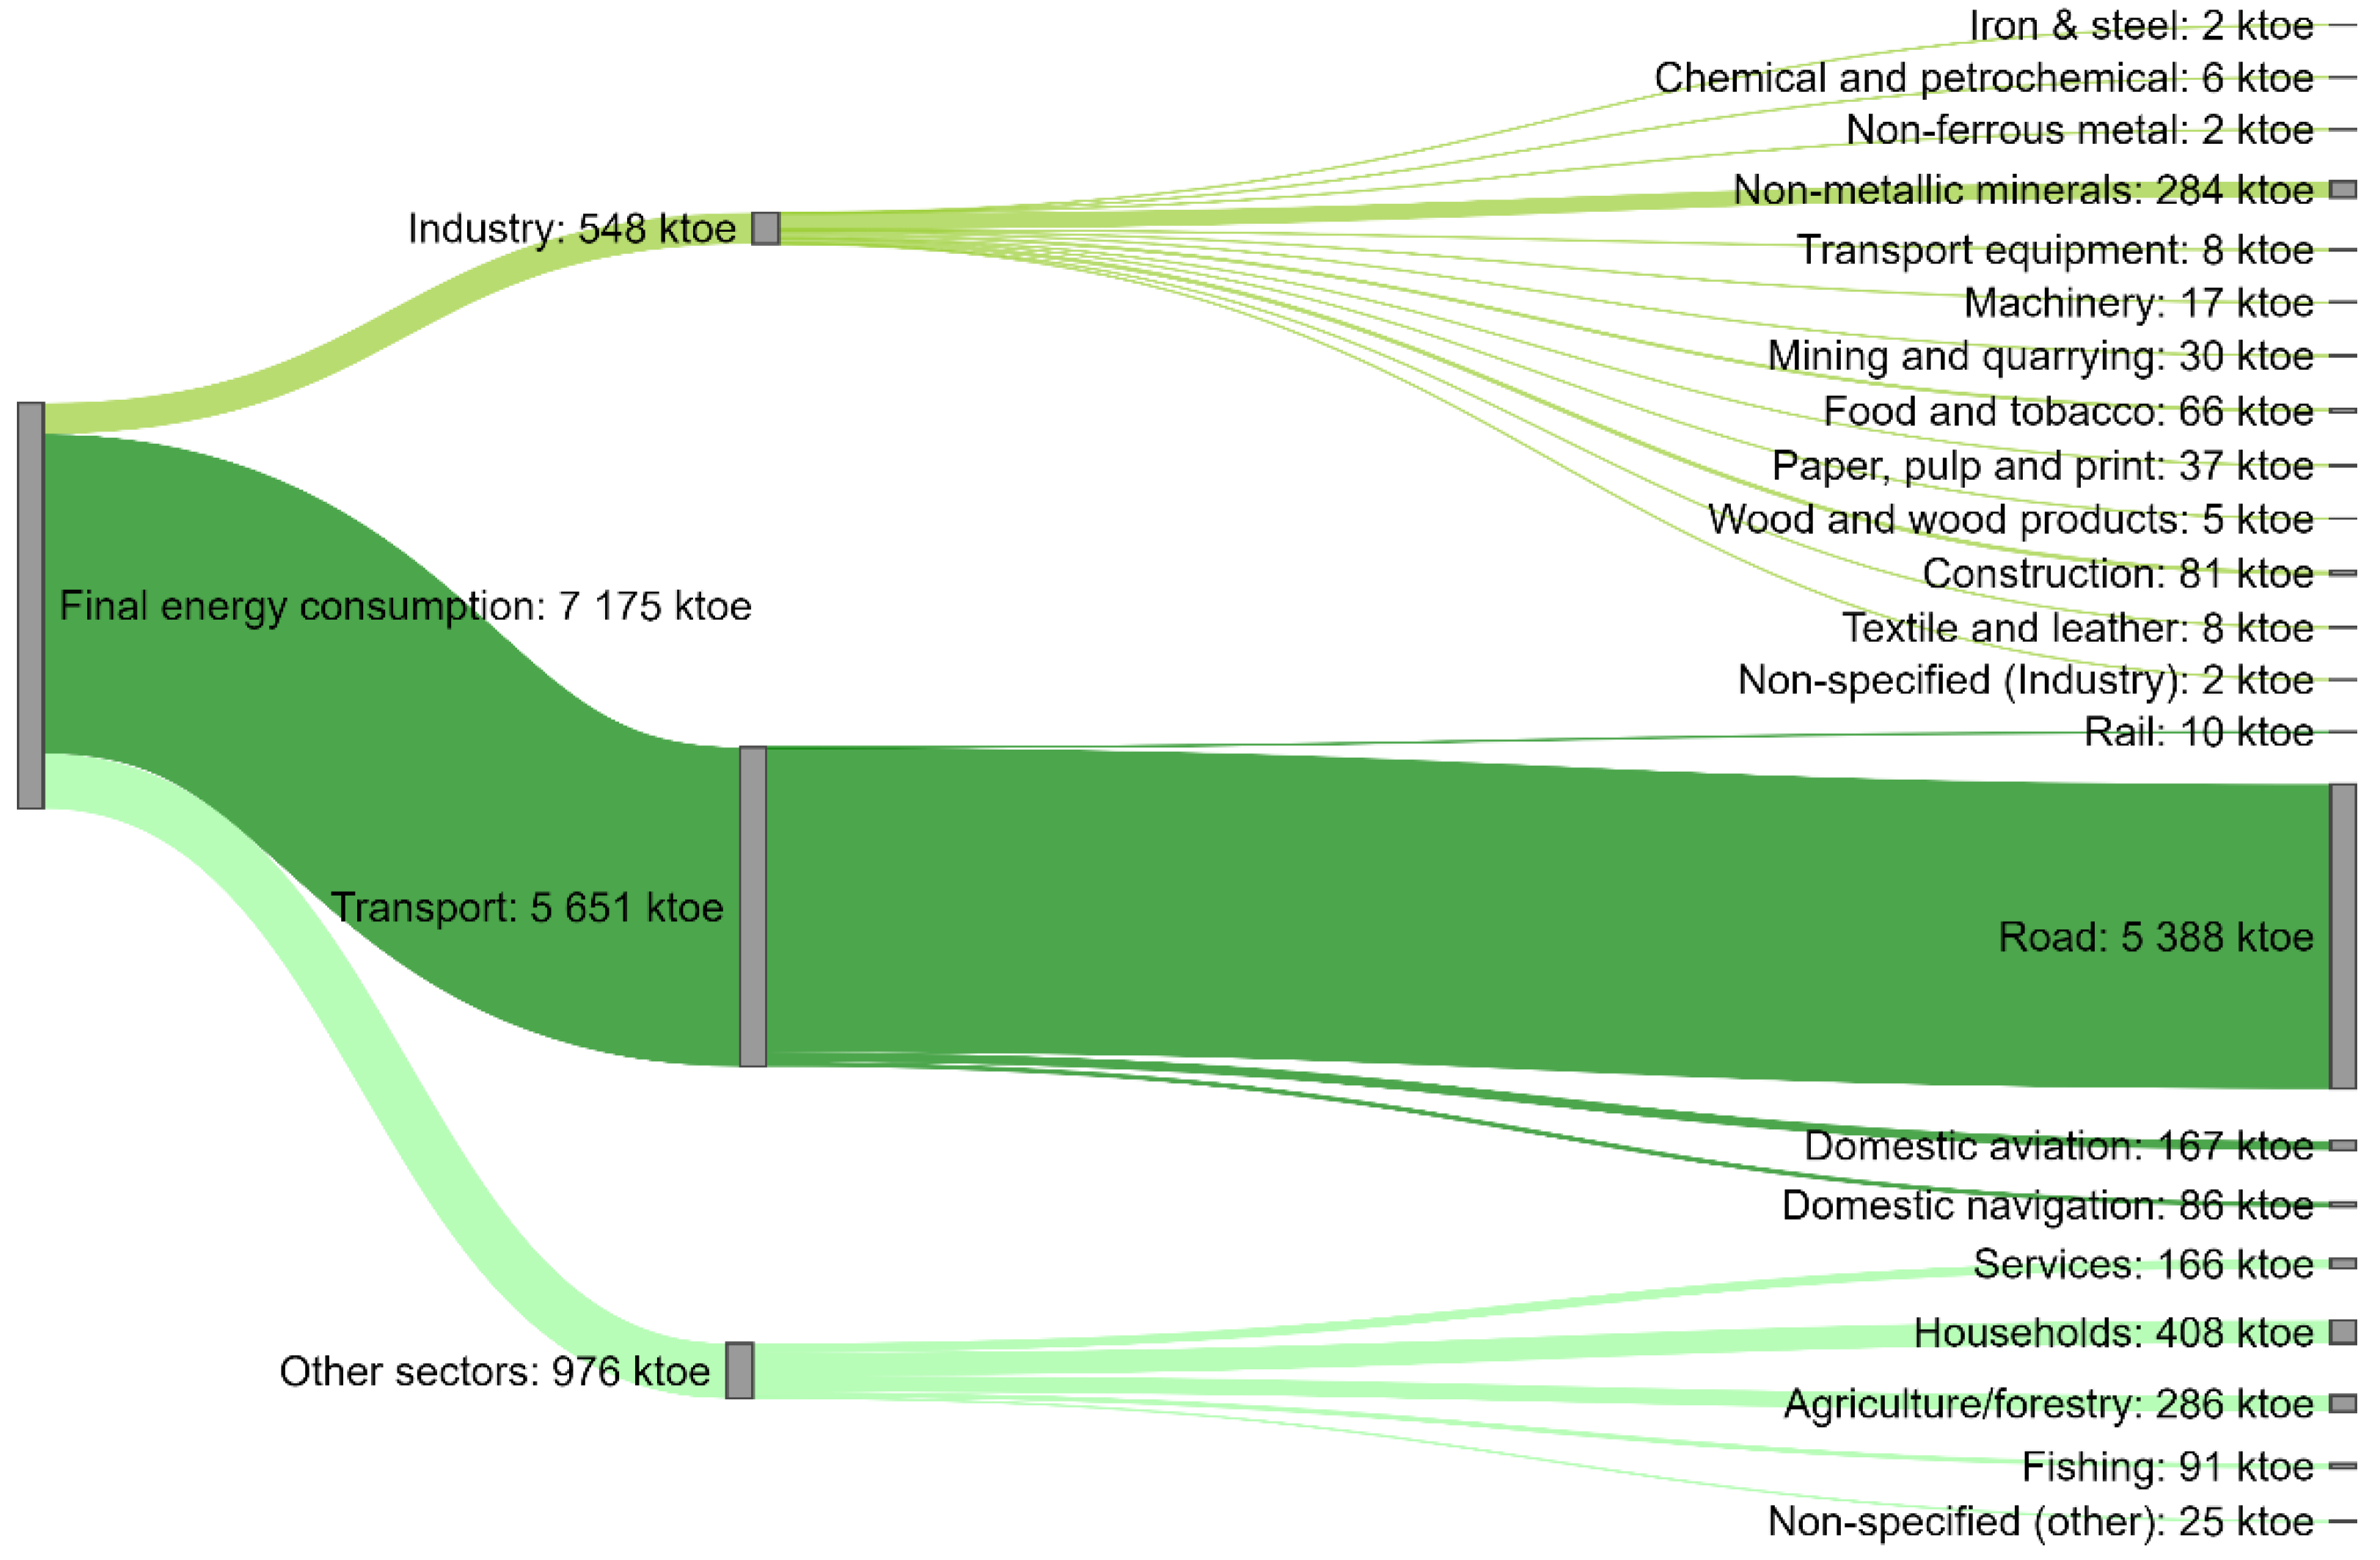
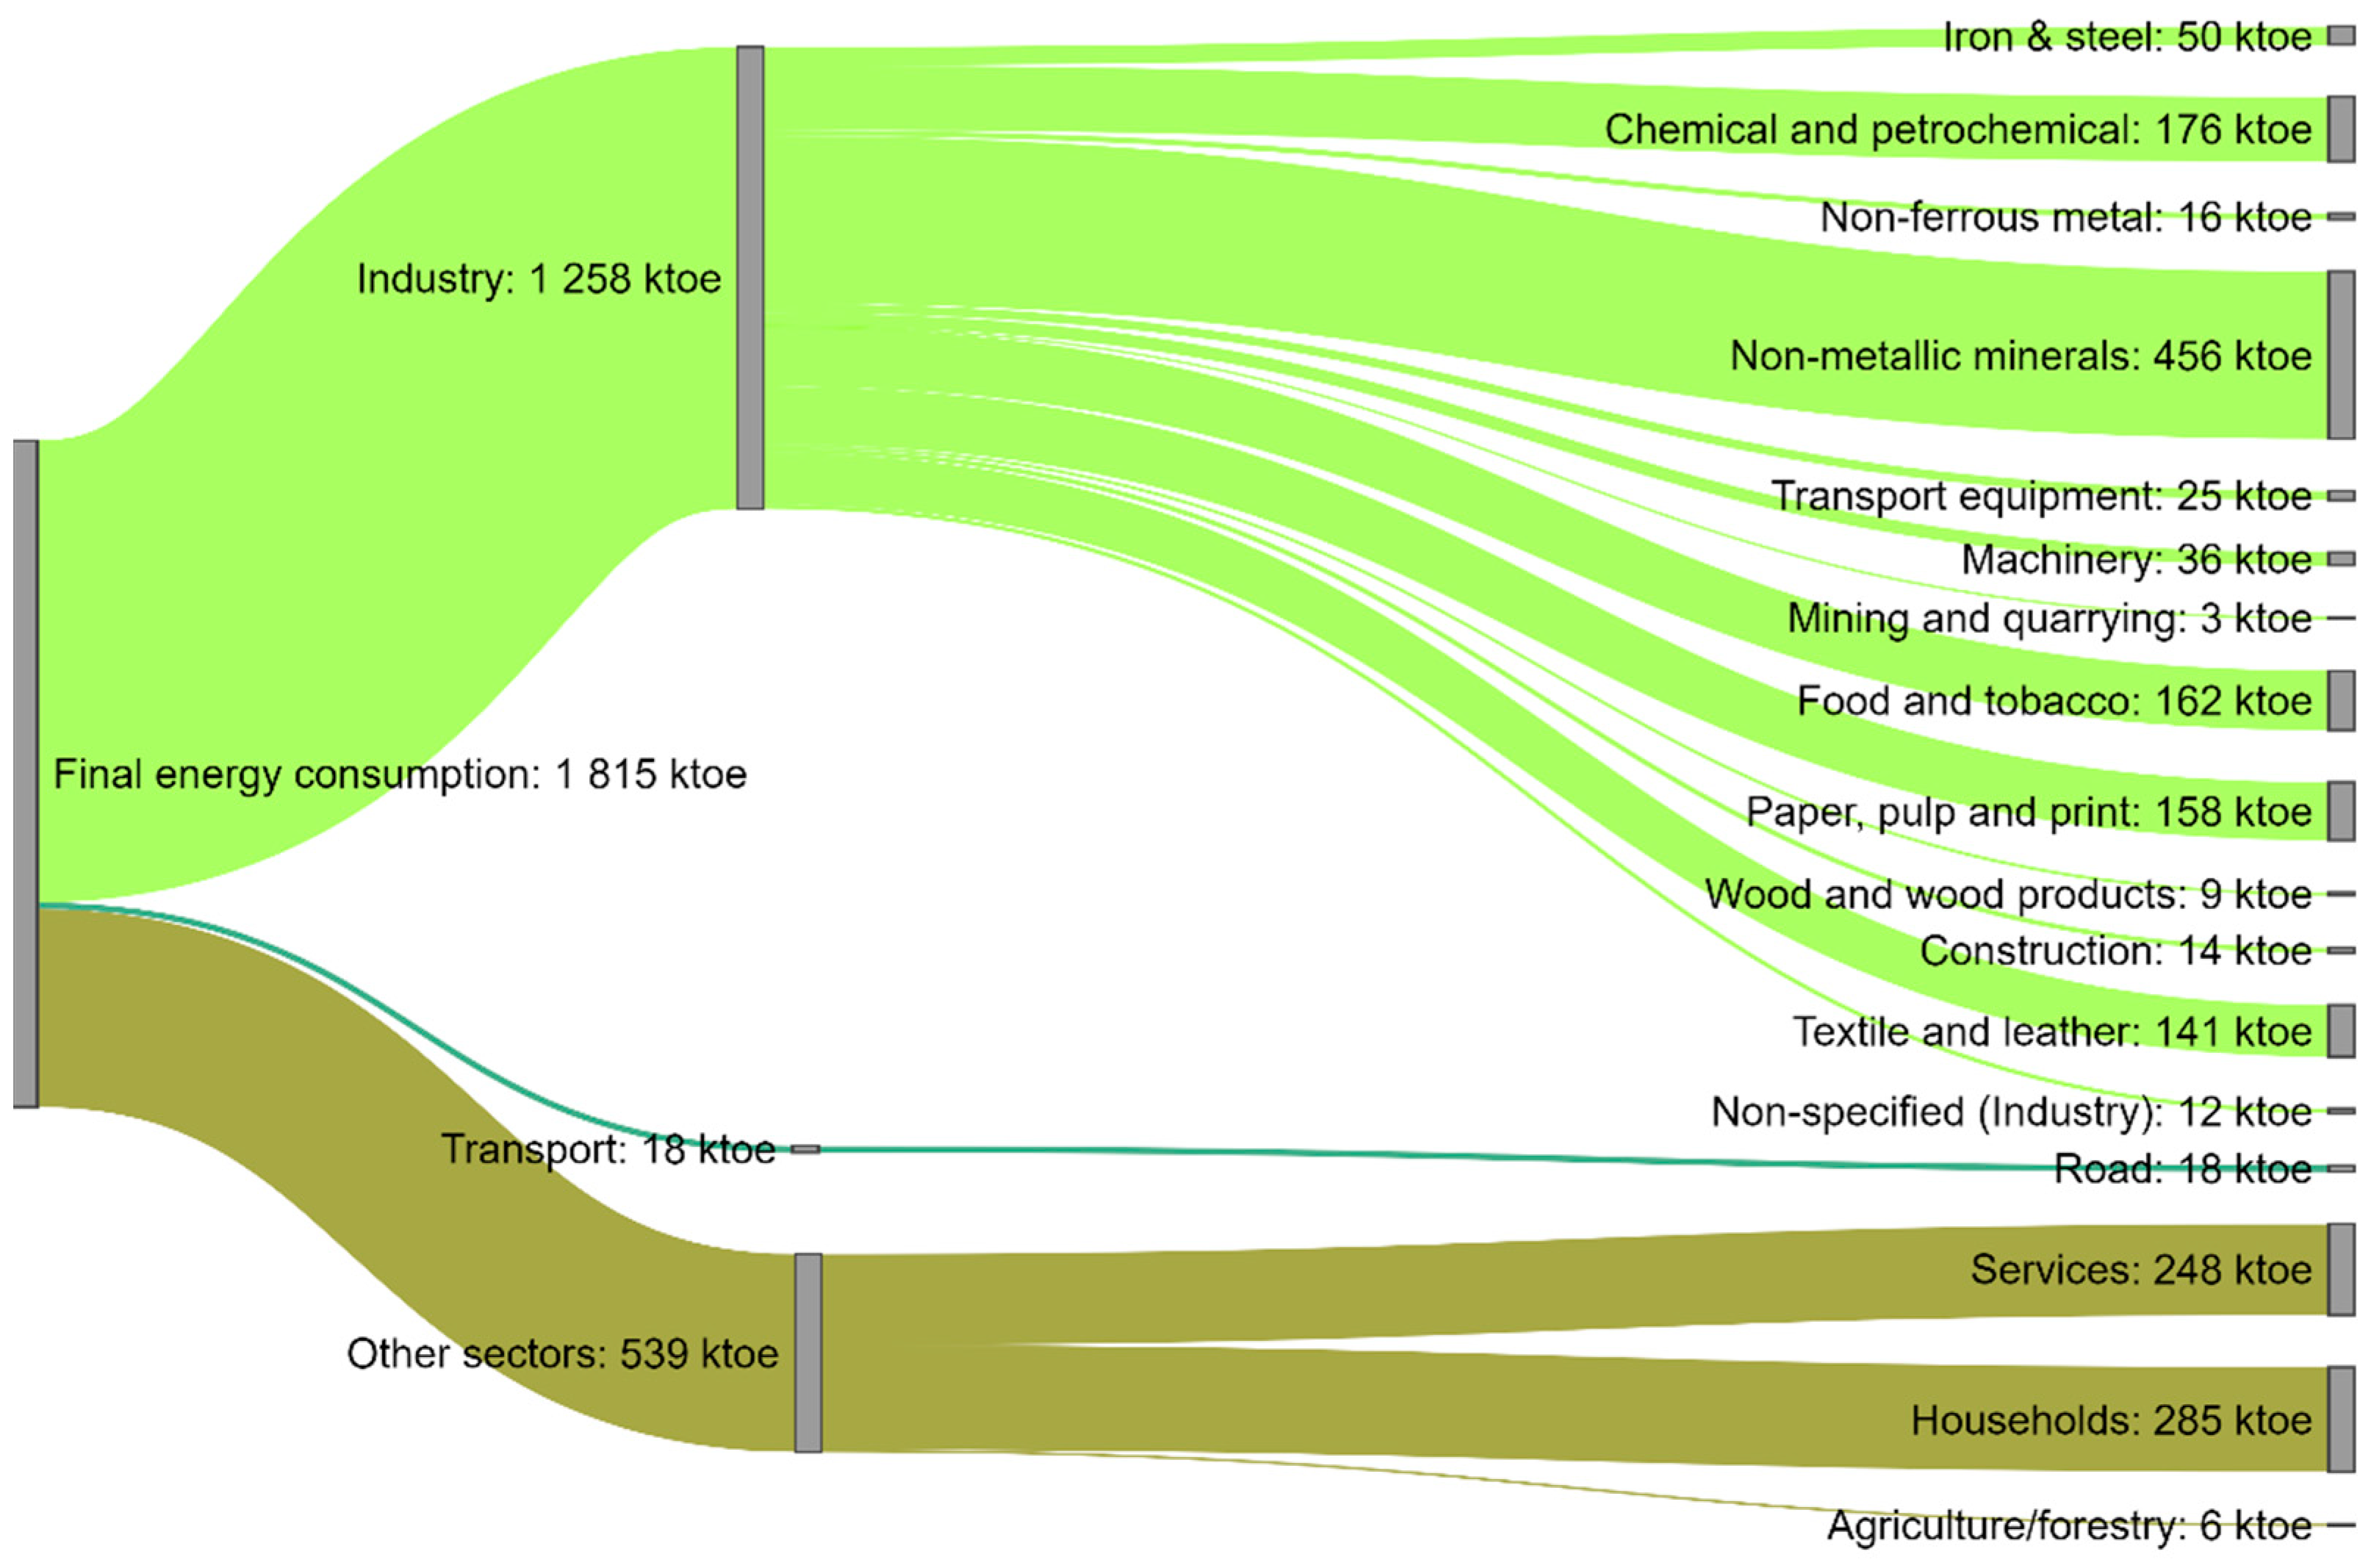
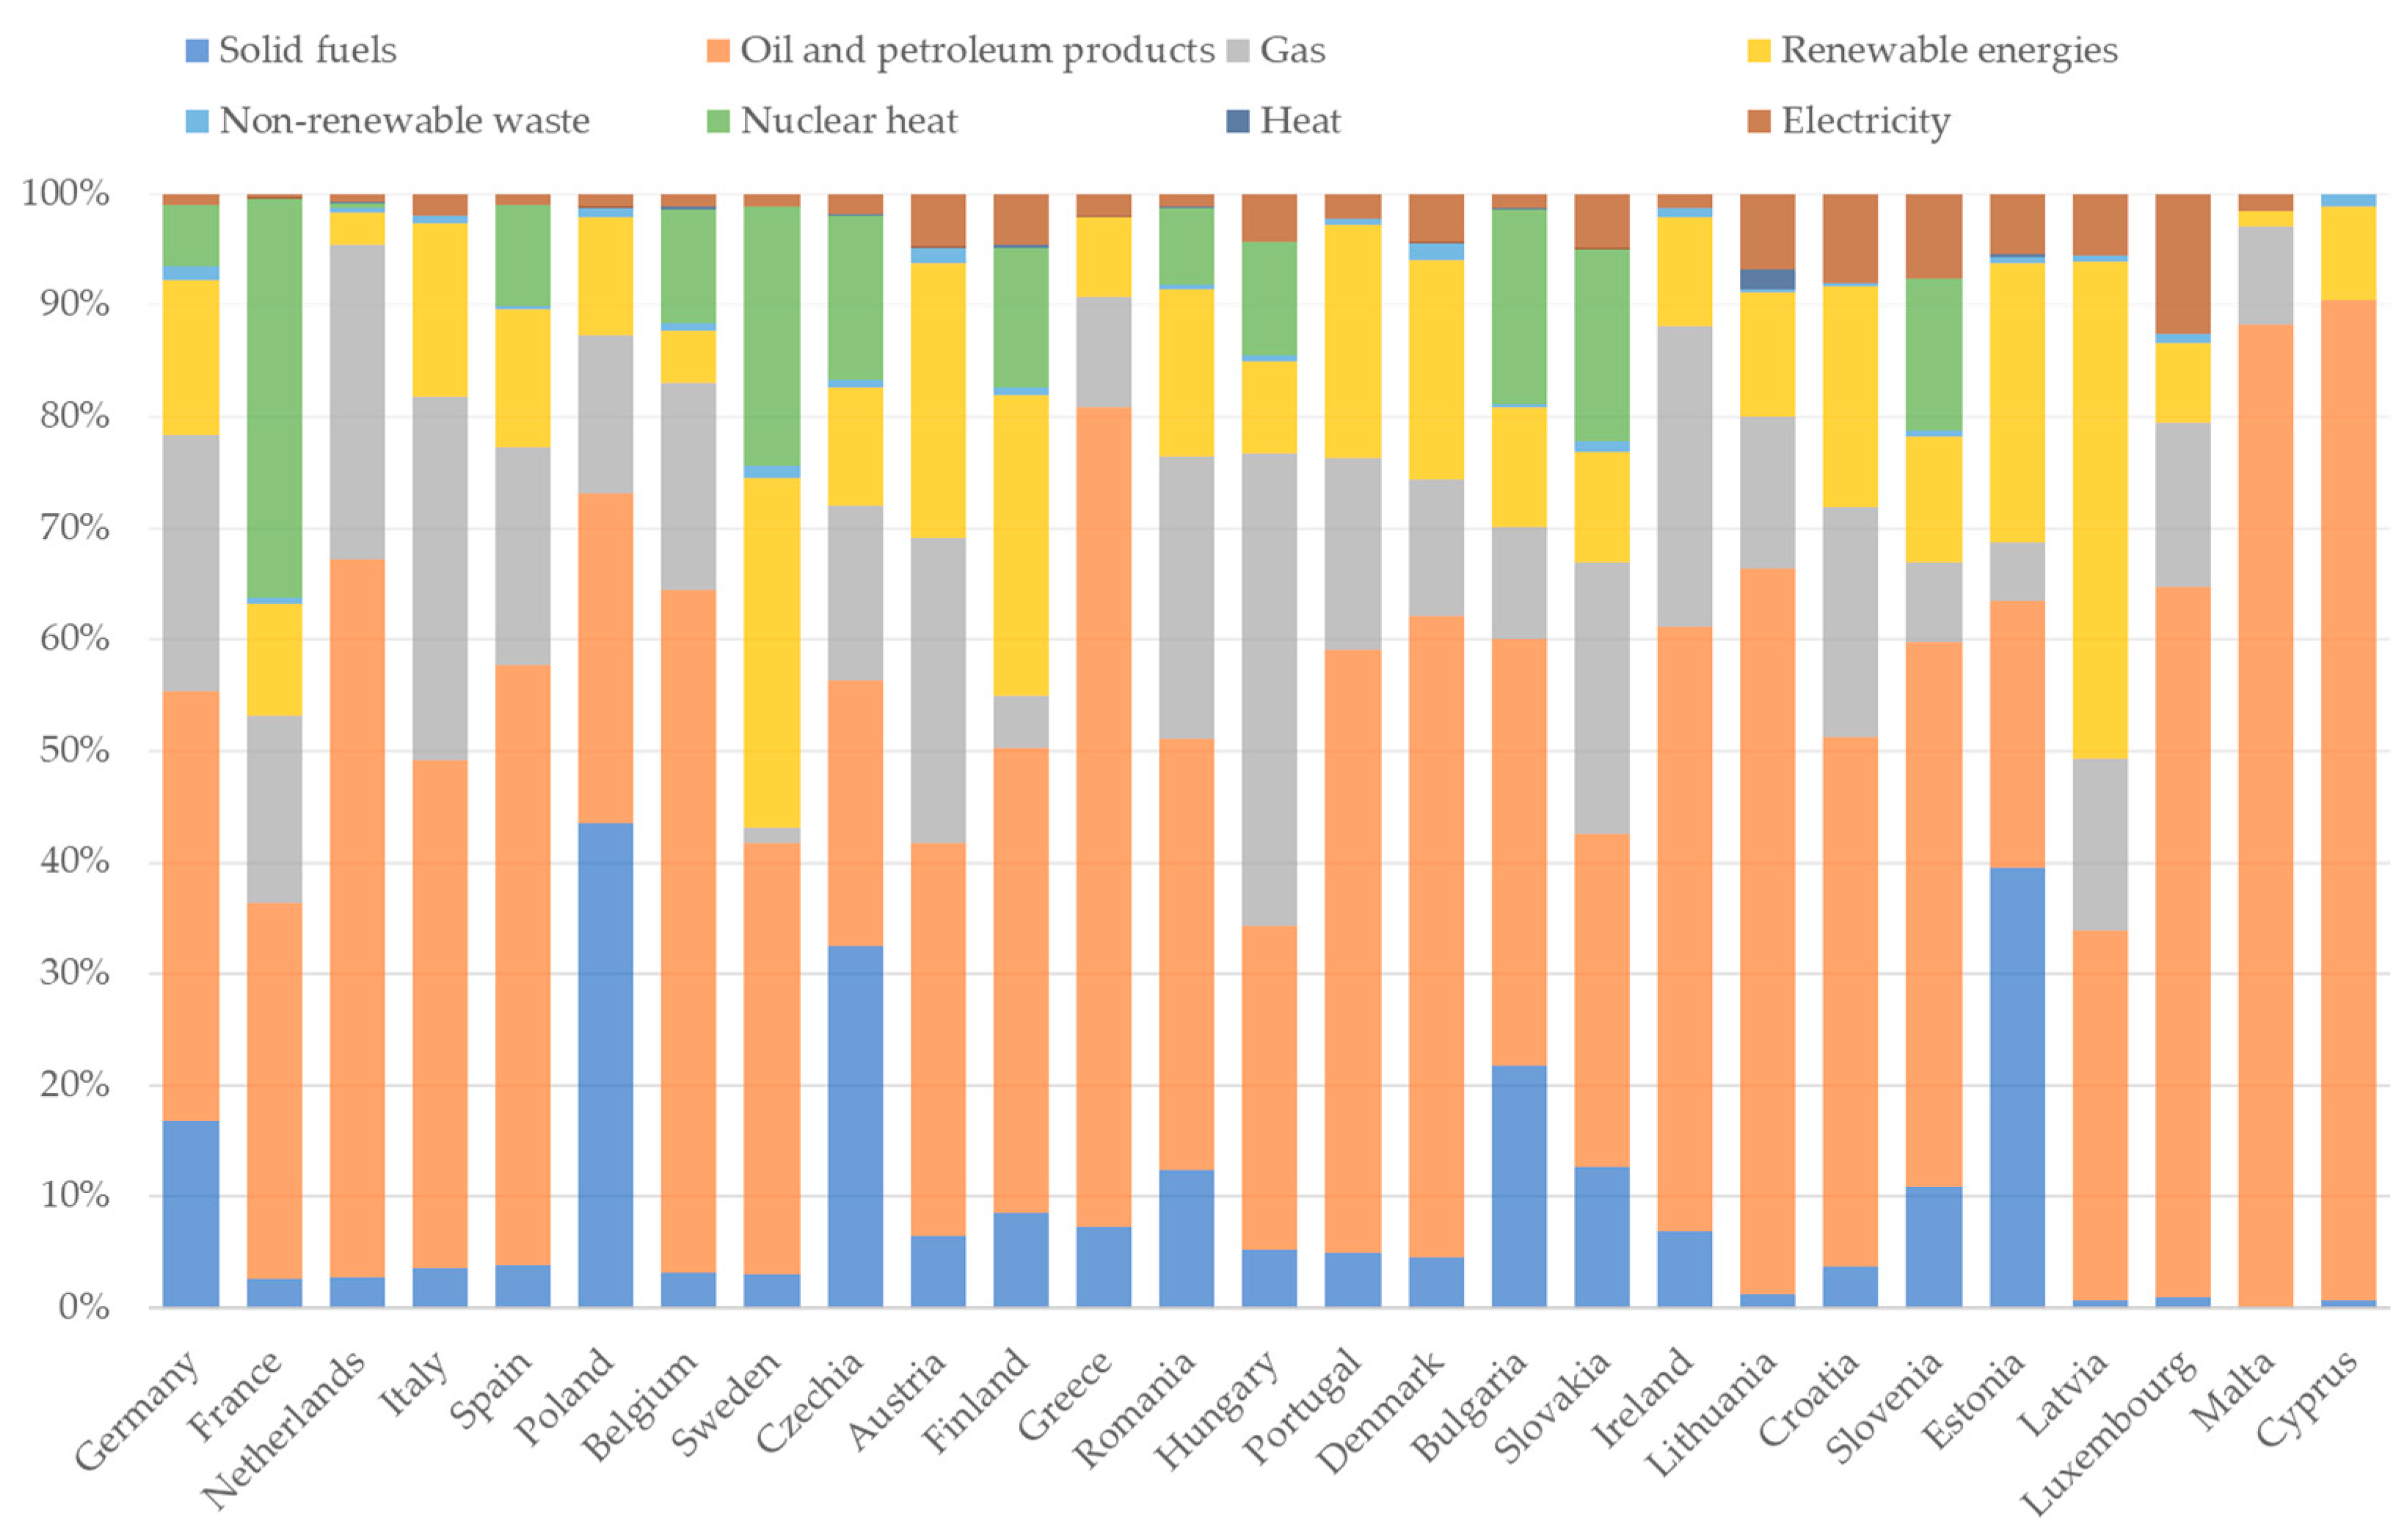
Table 1.
Energy and weight of each energy vector in Portuguese energy mix available from oil and petroleum products in 2019 (from Eurostat data).
Table 1.
Energy and weight of each energy vector in Portuguese energy mix available from oil and petroleum products in 2019 (from Eurostat data).
| Energy Vector Oil and Petroleum Products | ktoe | Weight (%) |
|---|---|---|
| Total | 16,753 | 54% |
| Crude oil | 11,478 | 68.5% |
| Fuel oil | 366 | 2.2% |
| Kerosene-type jet fuel (excluding biofuel portion) | 296 | 1.8% |
| Gas oil and diesel oil (excluding biofuel portion) | 1283 | 7.7% |
| Motor gasoline (excluding biofuel portion) | 268 | 1.6% |
| Other primary oil | 1562 | 9.3% |
| Other petroleum products | 1500 | 8.9% |
Table 2.
Status of the energy vectors available from all sources.
| Energy Vector | Recommendations |
|---|---|
| Renewables and biofuels | The installed power should be increased. Likewise, the type of renewable sources should be diversified, particularly focusing on offshore wind and solar photovoltaic technologies. The cost-benefit analysis of concentrated solar power plants must be evaluated. |
| Solid fossil fuels | No longer exists since November 2021 for electricity generation purposes. Coke oven coke, used in the iron and steel industry, and other solid fossil fuels used in the non-metallic minerals industry must be replaced by disruptive electrical technologies. |
| Electricity import | Legislative mechanisms that ensure the decarbonized origin of the import of this vector must be guaranteed. |
| Non-renewable waste | It is important to guarantee a non-renewable waste reduction mechanism outside the energy sector, supported by a circular economy strategy. Industrial waste should not be allowed to be imported. |
Table 3.
Status of the energy vectors available from all sources.
| Energy Vector | Recommendations |
|---|---|
| Natural gas | After the phase-out of coal for electricity generation, it is important to continue with the total decarbonization of electricity generation in Portugal, which is why it is important to progressively replace the 3154 ktoe of imported natural gas with endogenous renewable sources. |
| Transformation losses | With significant potential for reducing transformation losses, around 3220 ktoe, it is important to take advantage of heat losses for final use and replace inefficient processes. |
Table 4.
Energy and weight of each energy vector in Portuguese energy mix available after transformation in 2019 (from Eurostat data).
Table 4.
Energy and weight of each energy vector in Portuguese energy mix available after transformation in 2019 (from Eurostat data).
| Energy Vector | ktoe | Weight (%) |
|---|---|---|
| Direct carry-over | 8960 | 32%|100% |
| Electricity | 539 | 1.9%|6% |
| Oil and petroleum products | 3081 | 11.1%|34.4% |
| Solid fossil fuels | 288 | 1%|3.2% |
| Renewable energies | 3037 | 11%|33.9% |
| Natural gas | 1927 | 7%|21.5% |
| Non-renewable waste | 88 | 0.3%|1% |
| Transformation output available | 18,727 | 68%|100% |
| Electricity | 4570 | 16.5%|24.4% |
| Oil and petroleum products | 13,400 | 48.3%|71.4% |
| Heat | 500 | 1.8%|2.7% |
| Renewable energies | 257 | 1%|1.5% |
Table 5.
Status of the energy vectors in final energy consumption.
| Energy Vector | Recommendations |
|---|---|
| Oil and petroleum products | It is the biggest energy vector and requires greater articulation with the decarbonization of the electric power generation sector. The transport sector is the sector with the highest consumption of this energy vector and, having as a reference the horizon of 2050, it will be important to create national policies that promote electric mobility and, at the same time, reduce the number of internal combustion vehicles in circulation. In parallel, the penetration of biofuels should be increased and the development of the synthetic fuel industry supported. Regarding the remaining sectors of activity, urgent measures must be taken to mitigate and subsequently prohibit the use of this energy vector, which can easily be replaced by electrical equipment. |
| Natural gas | Urgent measures must be taken in the buildings sector to replace the use of this energy vector. In addition to the electrification of consumption, there are other decarbonized solutions, such as, for example, the use of thermal solar energy.Regarding the industry sector, in a phased manner, taking into account the type of industry, measures should be taken to electrify the sector. It is admitted that there are disruptive technologies still in the development stage to meet the needs, however, given the goal for the 2050 horizon, there do not appear to be any added difficulties. |
Publisher’s Note: MDPI stays neutral with regard to jurisdictional claims in published maps and institutional affiliations. |
© 2022 by the authors. Licensee MDPI, Basel, Switzerland. This article is an open access article distributed under the terms and conditions of the Creative Commons Attribution (CC BY) license (https://creativecommons.org/licenses/by/4.0/).
Share and Cite
MDPI and ACS Style
Martins, F.; Moura, P.; de Almeida, A.T. The Role of Electrification in the Decarbonization of the Energy Sector in Portugal. Energies 2022, 15, 1759. https://0-doi-org.brum.beds.ac.uk/10.3390/en15051759
AMA Style
Martins F, Moura P, de Almeida AT. The Role of Electrification in the Decarbonization of the Energy Sector in Portugal. Energies. 2022; 15(5):1759. https://0-doi-org.brum.beds.ac.uk/10.3390/en15051759
Chicago/Turabian StyleMartins, Fernando, Pedro Moura, and Aníbal T. de Almeida. 2022. "The Role of Electrification in the Decarbonization of the Energy Sector in Portugal" Energies 15, no. 5: 1759. https://0-doi-org.brum.beds.ac.uk/10.3390/en15051759
Note that from the first issue of 2016, this journal uses article numbers instead of page numbers. See further details here.