
Accounting and Market Risk Measures of Polish Energy Companies


Faculty of Economics, University of Warmia and Mazury in Olsztyn, 10-917 Olsztyn, Poland
*
Author to whom correspondence should be addressed.
Energies 2022, 15(6), 2138; https://0-doi-org.brum.beds.ac.uk/10.3390/en15062138
Submission received: 16 February 2022
/
Revised: 7 March 2022
/
Accepted: 11 March 2022
/
Published: 15 March 2022
(This article belongs to the Special Issue Managing Energy Sector Enterprises: Challenges, Methods and Research Trends)
Abstract
:Companies in the energy sector, due to their important role in the economy and the specificity of energy sources, are exposed to many types of risk, ranging from the risk associated with the company’s operations and the global economic and political situation in the world. Energy companies are usually large capital companies whose shares are listed on the stock market. The mentioned risk factors may shape the risk level of these companies. The study aims to examine the relationship between market and accounting risk measures for Polish energy companies listed on the Warsaw Stock Exchange. This paper uses market and accounting betas in the conventional and downside approach. In addition to market measures of total risk, it also examines the variability of ROA for energy companies. The study of the relationship between market risk measures and accounting risk measures was based on Pearson’s correlation coefficient, standard linear regression, and quantile regression. The relationship between market and accounting measures of total and systematic risk was identified. Moreover, quantile regressions revealed that the slope for accounting variables varies across the quantiles. Our research shows that for energy companies not listed on the capital markets, for which no market risk measures can be derived, accounting betas and downside accounting can be useful tools in risk analysis. The contribution of the article to the risk analysis of energy companies is the use of unpopular accounting beta factors and a new modification of these coefficients for downside risk.
Keywords:
energy sector; ROA; downside risk; LPM; semivariance; accounting beta; CAPM; D-CAPM; quantile regression1. Introduction
Considerable fluctuations in power row material costs in the years 2020–2021 caused by the COVID-19 pandemic and the speculative and political actions of countries on the energy markets show how much this sector of the economy is exposed to this risk [1]. Energy companies around the world are struggling with numerous difficulties, such as: the volatility spillovers and co-movements of commodity prices and stock prices [2]; price shocks, especially in the oil and gas market [3,4]; the need to meet the conditions contained in the European Union energy packages; the impact of new technologies and advances in digital technology; and increasing the scale of international actions to prevent global warming [5]. The Polish energy industry is an important element of the European Union’s energy system, and it is a bridge connecting the countries of northern Europe with the countries of western and southern Europe. Over the last few decades, hard coal and lignite were seen as essential energy raw materials. Currently, this sector is undergoing transformation, where the importance of other energy sources such as natural gas, biogas, photovoltaics, wind energy, and hydrogen is growing [6]. These sources are part of the energy mix which is implemented in the European Union’s energy policy [7]. In addition, technologies are being implemented that make better use of traditional fuels, an example of which is the development of high-efficiency cogeneration fired with natural gas. Thus, under the conditions of potential risks, the production, extraction, and distribution of energy will fluctuate. This will probably have a significant impact on changes in the revenues and profits of energy companies. This translates to a further extension into the level of fundamental and investment risk on the capital market. Companies in the broadly understood energy sector attract the attention of stock exchange investors. The risk of investing in such companies then becomes of particular importance. This article is committed to the assessment of the size of the risk of investing in shares of energy companies on the Polish capital market.
Energy companies listed on the Warsaw Stock Exchange (WSE) are beside the stock banks, the most liquid sector of Polish financial markets. The total turnover of energy companies considerably exceeds the turnover of other sectors. A risk analysis of investments in shares of these companies is necessary for the potential pricing of these companies by investors on the capital market.
Risk and uncertainty are inherent in any business. Thus, quantifying, identifying, and controlling risk is essential for business practitioners and scientists. For listed companies, the risk may be considered from the company’s side but also the side of the stock exchange investor. A natural assumption is that the risk to which a listed company is subject translates into the risk borne by a stock exchange investor. This paper considers the investor’s risk in the context of total volatility measured by the standard deviation and semi-deviation of returns on the capital market. In the context of systematic risk, the measure of which may be the beta coefficient from the Sharpe model and its modifications in the context of the downside risk. The volatility of the financial result measures the risk from the side of the enterprise. The return on assets profitability ratio (ROA) is used to measure the enterprise’s relative profitability. The ROA is frequently used as a measure of financial performance [8]. Finally, the accounting beta and downside accounting beta are used to test the sensitivity of the financial result to the general situation in the Polish energy sector.
The paper uses market and accounting betas in the classical and downside approach. In addition to market measures of total risk, it also established the variability of return on assets for energy companies listed on the Warsaw Stock Exchange.
The impact of accounting measures of risk on market measures of risk was found in previous studies on the Warsaw Stock Exchange. It was identified for Polish food, construction, and IT companies, as well as companies composing some of the WSE indices (WIG-20, WIG-40, and WIG-80) [9,10,11,12,13]. Similar research was conducted on the Frankfurt Stock Exchange. It was pointed out that the accounting measure of total and systematic risk has a significant impact on market risk measures for companies included in DAX, MDAX, and SDAX [14]. There is little research in the literature on the impact of accounting measures of risk on market risk measures, in particular those based on the downside risk. Additionally, there is no similar research for Polish energy stock companies and energy companies for other markets. Therefore, the following study takes a step to fill this gap.
The results presented in this paper are the next step in research on the impact of accounting risk measures on market risk measures in the context of total volatility and sensitivity measures. This research uses the downside of accounting risk measures, which are defined in the authors’ earlier works and constitute a new contribution to risk analysis. In this work, the research is supplemented by the Polish energy sector. As mentioned before, the energy sector, which is part of the commodities sector, is key and related to the economy as a whole and the activities of other companies from virtually all sub-sectors. This happens in times of peace, and in times of war, the energy sector is even more important. Even the financial sector consumes enormous resources of energy, the clearest example of which is bitcoin mines.
The study aims to examine the size of the risk and the relationship between market and accounting risk measures for Polish energy companies.
Therefore, our research hypotheses are as follows. Hypothesis 1 (H1): The standard deviation of ROA positively impacts the standard deviation of the rate of return among stock Polish energy companies. Hypothesis 2 (H2): Semi-deviation of ROA positively impacts the semi-deviation of the rate of return among stock Polish energy companies. Hypothesis 3 (H3): Accounting beta has a positive impact on the market beta in variance approach among stock Polish energy companies. Hypothesis 4 (H4): Accounting beta positively impacts market beta in the downside approach among stock Polish energy companies.
This paper is organized as follows: Section 2 extensively reviews the literature related to the presentation and application of measures to assess the risk of capital market assets in both conventional and downside frameworks. Section 3 in the dataset describes the characteristics of the energy companies quoted in the Polish capital market and presents methods for estimating models of relationships between market and accounting risk measures. Section 4, Results, describes the obtained research findings and their interpretation. In Section 5, the discussion and conclusions are presented, and the impact of the research regarding previous studies and future work is considered.
2. Literature Review
The conducted research, and thus the literature review, covers the issue of risk on the capital market. This risk is most often considered in the context of the modern portfolio theory, and capital asset pricing model (CAPM) proposed independently by Sharpe [15], Lintner [16], and Mossin [17]. The first is the theory of risk-based decision-making based on the diversification technique. The second is a method of determining the equilibrium prices of securities depending on the risk they represent. This model identifies the sources and risk measures that are appropriate from the point of view of the portfolio theory. Empirical confirmation of the relationship between profitability and risk is important for decisions making regarding the selection of portfolios.
The CAPM stems from the equilibrium theory in which investors maximize an expected utility function that is based on the mean and variance of returns of their portfolio, and the distributions of return are normal. Despite this, variance may be considered an inappropriate measure of risk. Most of the distributions of rates of return are neither symmetrical nor normal, which is confirmed by many empirical studies. Moreover, investors, usually unevenly risk-averse, treat deviations above the threshold (e.g., expected value) as a profit and below deviation as a potential loss. Risk aversion creates a new concept called downside risk, the possibility of achieving the returns below the assumed rate of return. The main measure of the total downside risk is the semi-variance or semi-deviation of returns. For symmetric distributions, the semi-variance is at least the same appropriate measure of risk as variance, while asymmetric distributions present a much more useful measure than a variance. Semi-variance belongs to the group of asymmetric measures known as lower partial moments (LPM). Bawa (1975) [18] showed that semi-variance is a second-order LPM, and in the case of investors with decreasing risk aversion, it is an appropriate measure of total risk. In addition, downside risk measures can be viewed in the context of the joint changes of two risky assets or portfolios. These measures are asymmetric covariance. Semi-covariance is an example of such measures and was proposed by Hogan and Warren [19]. Bawa and Lindenberg [20] incorporated semi-covariance in the structure of n-degree LPM measures, often called asymmetric co-LPM. The analysis of the mean-risk relationship in the context of the semi-variance for the assumed rate of return can also be found in Fishburn [21]. The risk measures described in the above studies contributed to the development of the CAPM in downside framework theory. The first study in this area was the research by Hogan and Warren [19], who demonstrated the permanence of the downside CAPM (D-CAPM) with the conventional CAPM. Subsequently, Bawa and Lindenberg [20] showed that the conventional CAPM is a mean-lower partial moment model in which the threshold is equal to the risk-free rate. Another more general approach was taken by Harlow and Rao [22], assuming the threshold rate of return as the average rate of return.
Many empirical studies based on risk measures in conventional and downside approaches compared the results regarding the construction of optimal portfolios and capital assets pricing. The construction of a portfolio based on semi-variance was first developed by Markowitz [23]. According to Foo and Eng [24], asset returns are skewed, and then mean-variance portfolio optimization is ineffective. Moreover, when risk aversion is ignored, the (LPM) framework affords a more efficient risk measure. Further, this research shows how to include investor risk aversion into a downside risk asset optimization model. Salah et al. [25] proved that the downside risk model for portfolio optimization overcomes the weakness of the conventional mean-variance model concerning the skewness of returns and the perception of risk among investors. Research supporting the use of downside risk measures in portfolio theory can be found in other works [26,27,28,29].
Further work shows the importance of the downside approach to risk in the pricing of assets. The studies of Estrada [30,31], conducted on developed and emerging capital markets, also show the superiority of downside risk measures over conventional measures based on CAPM. Ang, Chen, and Xing [32], based on individual companies listed on the NYSE, AMEX, and NASDAQ, prove that investors are rewarded with a market premium for the downside risk, which means that securities with higher downside beta ratios achieve higher rates of return on average. Galagedera [33] reveals that the association between the two approaches to systematic risk measures is to a great extent dependent on the volatility of the market portfolio returns and the deviation of the target rate from the risk-free rate. Moreover, downside models indicate a higher level of explanation volatility of rates of return than the classic CAPM [34,35]. Ajrapetova [36] demonstrated that downside beta outperformed conventional beta and other total or systematic risk measures in the developed markets. However, the results of these studies were not confirmed in emerging markets, where total risk measures performed the best. Its results also imply that in emerging markets, the diversifiable risk should be priced. Extensive research in emerging markets, such as those of Slovenia, Croatia, and Serbia, demonstrated that the downside risk is the variable that statistically and significantly explained mean returns [37].
Another point of view is to consider the risk of the company looking at the variability (semi-variability) of profitability ratios. The whole set of measures based on accounting data can be named accounting risk measures. In the article, two kinds of accounting risk measures are used: measures of the total variability (semi-variability) of profitability ratios [9] and accounting betas proposed by Hill and Stone [38], and downside accounting beta proposed by Rutkowska-Ziarko [12].
Many different concepts for measuring a company’s risk from accounting information can be found in the literature. A broad review of the various methods is described in the works of Amorim et al. [39], Latif and Shah [40], or Huang et al. [41]. In this study, the term “accounting beta” (“downside accounting beta”) is understood as a measure of systematic risk that expresses a change in the accounting profitability of a given enterprise caused by a change in the accounting profitability of the relevant sector or market. The list of market and accounting risk measures used in this work are presented in Table 1 and Table 2.
In the research, risk measures were used, referring to the distributions of rates of return, being measures of variability and semi-variability of the rate of return. In finance, they are also referred to as measures of total risk [44,45]. Similar to the volatility of the rates of return obtained by investors on the capital market, one can also consider the dispersion of accounting measures of profitability. In this work, there is a return on the assets profitability ratio (ROA). When determining accounting risk measures, we rely on data from financial statements. The method and reliability of reporting affect the results obtained. In this study, the risk is determined based on return on assets. Górowski, Kurek, and Szarucki pointed out that the adopted accounting standard has a significant impact on the value of assets of energy companies shown in the balance sheet [46], and thus the ROA profitability ratio.
In addition to measures of total risk, the studies also used sensitivity measures, which express the systematic risk borne by the investor. A classic measure of sensitivity is the beta coefficient from the one-factor model [47]. In later years, downside beta equivalents were formulated. They are based on lower partial moments. In this work, to determine the downside beta coefficient, the Harlow and Rao formula was used. The paper also uses sensitivity measures relating to the accounting profitability ratios, in line with the Hill and Stone concept. The downside accounting beta was determined by the modification of the Harlow and Rao formula for accounting data proposed by Rutkowska-Ziarko [14].
3. Materials and Methods
3.1. Dataset
The study included Polish-listed energy companies. These are mainly entities included in the sector indices on the Warsaw Stock Exchange: WIG-Energia, WIG-Paliwa, and WIG-Gornictwo. The study also included companies outside these indices but belonging to the energy industry (Energa). From the WIG-Mining index, only companies dealing with the extraction of energy resources were selected. On this basis, 24 companies were initially selected for the study. For five of them, full quarterly financial quotes were not available, or they were briefly listed on the WSE. Ultimately, 19 listed companies were included in the study. Their activity is closely related to the energy sector; at the same time, their activity covers a wide range of various sub-sectors, from traditional to modern technological solutions. The analysis covered both hard coal mining companies (Bogdanka, JSW) and those from the “renewable energy” sector, e.g., Photon, or entities dealing with nuclear energy solutions such as UNIMOT. The full list of Polish energy companies included in the research is presented in Table 3.
This article focuses on and is limited to Polish energy companies, which available for in-depth analysis of individual entities, their activities, and in what direction they are developing. The authors’ cooperation with practitioners in the field of Polish energy allowed for a better understanding of the results obtained. In the section on quantitative regression, it is shown which entities are typical due to the relationship between accounting and market risk measures and which are outliers.
In total, the shares of the 19 energy companies included in the study account for approximately 18 percent of the WSE capitalization. The capitalization of the five companies omitted due to the lack of data in this article were less than 0.5% of the capitalization of the entire Polish stock market.
The study covered the years 2014–2021. The choice of this research period was a compromise between the number of companies for which stock exchange data and financial data were available and the duration of the time series. Data consisted of quarterly simple rates of return and quarterly ROA profitability ratios. All data used in the study were obtained from the Thomson Reuters Refinitiv Eikon database.
3.2. Empirical Methods
The study of the relationship between market risk measures and accounting risk measures was based on Pearson’s correlation coefficient and linear regression models. In the research, two kinds of linear regression models were used: standard linear regression and quantile regression. Standard least-squares linear regression models conditional means of the explained variable require the normality of the distribution of this variable. However, in practice, continuous variables may have different distributions due to their asymmetry. The analysis of the distributions of risk measures, especially those related to the profitability of companies regarding their assets, indicates the occurrence of numerous outliers in the studied sample of companies. Taking the above into account and the mean or standard deviation, the coefficient regressions are also sensitive to outliers. This phenomenon may cause different strengths of the influence of accounting measures on the relevant market measures in subgroups of companies with a different level of total and systematic market risk. Therefore, apart from the OLS estimator, one of the regression functions most recommended in the case of outliers was used. This method is quantile regression [48]. The special case of quantile regression for a quantile of 0.5 (for the median) is equivalent to the LAD (least absolute deviation) estimator that minimizes the sum of absolute errors. Quantile regression does not assume a particular parametric distribution and a constant variance, unlike least squares regression. Introducing different regression quantiles into the model gives a more complete description of conditional distributions, especially in the case of asymmetric or cut distributions. Thus quantile regression is robust to the shape of an empirical distribution and is resistant to the occurrence of outliers [49,50].
Quantile regression is defined as different quantiles of dependent variables depending on the selected explanatory regressors. The order quantile is the value for which it holds:
and
where is the order of -th quantile; is the value of -th quantile. According to the principle of quantile regression, we define conditional quantiles as follows:
For a linear regression model of the form:
the following linear relationship is assumed:
The simplest variant of quantile regression is median regression. We find the functional form of the conditional median, and the parameters are found by minimizing the following objective function:
Comparatively to the least-squares where the sum of squared error terms is minimized, quantile regression minimizes a weighted sum of the positive and negative error terms:
Optimizing this function results in an estimated linear relationship between and where a portion of the data, , lies below the regression line and the remaining portion of the data, , lies above the estimated regression line.
The optimized function is non-differentiable, and its minimum is found by the linear programming method. The estimators thus found are asymptotically normal. It follows that quantile regression is more resistant to outliers, and we avoid assumptions about error distributions.
4. Results
In the selected period, the average quarterly returns of six energy companies were negative. Investors suffered the biggest losses when investing funds in the shares of the Bogdanka hard coal mine and the Bedzin heat and power plant (operating on hard coal). The highest rates of return could be counted on in the case of Unimot and Photon. Both of these companies support and develop the modern generation techniques of electricity. Unimot entered the market of small nuclear reactors, and Photon is one of the leading companies in the field of photovoltaics on the Polish market. This is a symptom of the positive valuation of innovative companies by the market, and at the same time, investors notice the decline of energy based on hard coal and lignite. Stock market investment risk assessment is closely related to the adoption of specific statistical measures to determine total and systematic risk. The use of symmetric risk measures (e.g., standard deviation) is consistent with the assumption that the distributions of returns are consistent with the normal distribution. If there is no compliance with the normal distribution, the least restrictive assumption justifying the use of measures based on the standard deviation is the lack of significant asymmetry in the distributions of rates of return. To verify this thesis, an analysis of the time series distributions of quarterly rates of return of Polish stock energy companies was performed, with particular emphasis on the asymmetry of distributions and the entire form of the distribution. The Jarque–Bera test was used to test the compliance of empirical distributions of listed companies with the normal distribution. Basic descriptive statistics and the results of the Jarque–Bera normality test are presented in Table 4, where the diminished values represent a significant coincidence from the nominal order.
The results in Table 4 show that the distributions of the rate of return of seven analyzed companies significantly differ from the normal distribution. In the case of these companies, there is a significant positive asymmetry. Moreover, the right-skewness of the rates of return occurs for the Photon company. In the case of eight (42%) of the surveyed entities, we observe significant asymmetry of the rate of return.
Table 5 present the basic descriptive statistics of ROA distributions and Jarque–Bera normality test values. In the case of 14 (74%) energy companies, there is a significant deviation from the normal curve. In most cases, it is associated with the occurrence of the significant positive asymmetry of the return on assets ratio. The average ROA of six energy companies was negative. For three of them, BEDZIN, SERINUS, and ZEPAK, the negative average rate of return was observed.
In the context of the significant skewness of the rate of return distributions and the ROA profitability ratio distributions, the use of downside measures in the analysis and comparison of the risk of Polish energy stock companies is of particular importance.
Next, market betas and accounting betas are calculated using two different approaches: the symmetric and the downside approach (Table 6). Market beta coefficients of nearly half of energy companies are higher than 1, which means that their rates of return react strongly to changes in the rates of return of the market portfolio. The rates of return of two companies (MOL and SERINUS) react similarly to the rates of return of the WIG index; their market betas are roughly equal to one. INTERAOLT’s rates of return are, to a small extent, related to the situation on the stock market. Accounting betas for eight companies are higher than 1, which is usually associated with the simultaneous occurrence of high market beta coefficients. The exception is the team of the ZEPAK power plant; very high accounting beta coefficients do not cause the same strong reaction of the company’s rates of return to changes in the WIG index returns. This phenomenon can be seen in the next section of the article, where quantile regression is employed to find the connections between market and accounting betas. Currently, ZEPAK is transforming traditional lignite-based energy to modern solutions based on green energy and plans to build a nuclear power plant.
The next stage of the research is to determine the correlation between the measures of systematic and total risk used in the study. Results are presented in Table 7. According to the research hypotheses, the relationship between accounting risk measures and the corresponding market risk measures is of particular interest. In the case of market and accounting beta coefficients, there is a positive correlation in the symmetric and downside approach, but it is not statistically significant. The standard deviation of the ROA coefficient is positively correlated with the deviation of the rates of return, a similar phenomenon, but with greater strength, occurs in the case of semi-deviation of the rate of return and semi-deviation of ROA. However, these correlations are not statistically significant. Previous research on the Warsaw Stock Exchange also provided evidence of a positive and statistically significant correlation between various types of market and accounting betas, as well as the relationship between total risk and ROA volatility [10,11]. The aforementioned research covered the food and construction sectors, as well as companies included in the WIG-20, WIG-40, and WIG-80 indices.
The results presented in Table 4, Table 5 and Table 6 show significant deviations from the normal curve, both in the distributions of the rates of return and the ROA coefficient. Additionally, there is the possibility of outlier observations. This may result in the Pearson’s linear correlation coefficient not being adequate to describe the relationship between the considered risk measures (Table 7). Therefore, in the other part of the work, quantile regression was used to identify these relationships.
Based on the research method described above, regression equations for relationships between risk measures are estimated using OLS estimator and quantile regression models. In the case of the latter method, it is assumed that is equal to 0.25, 0.5, and 0.75, thus distinguishing energy companies with a low, middle, and high level of the dependent variable (Table 8, Table 9, Table 10 and Table 11).
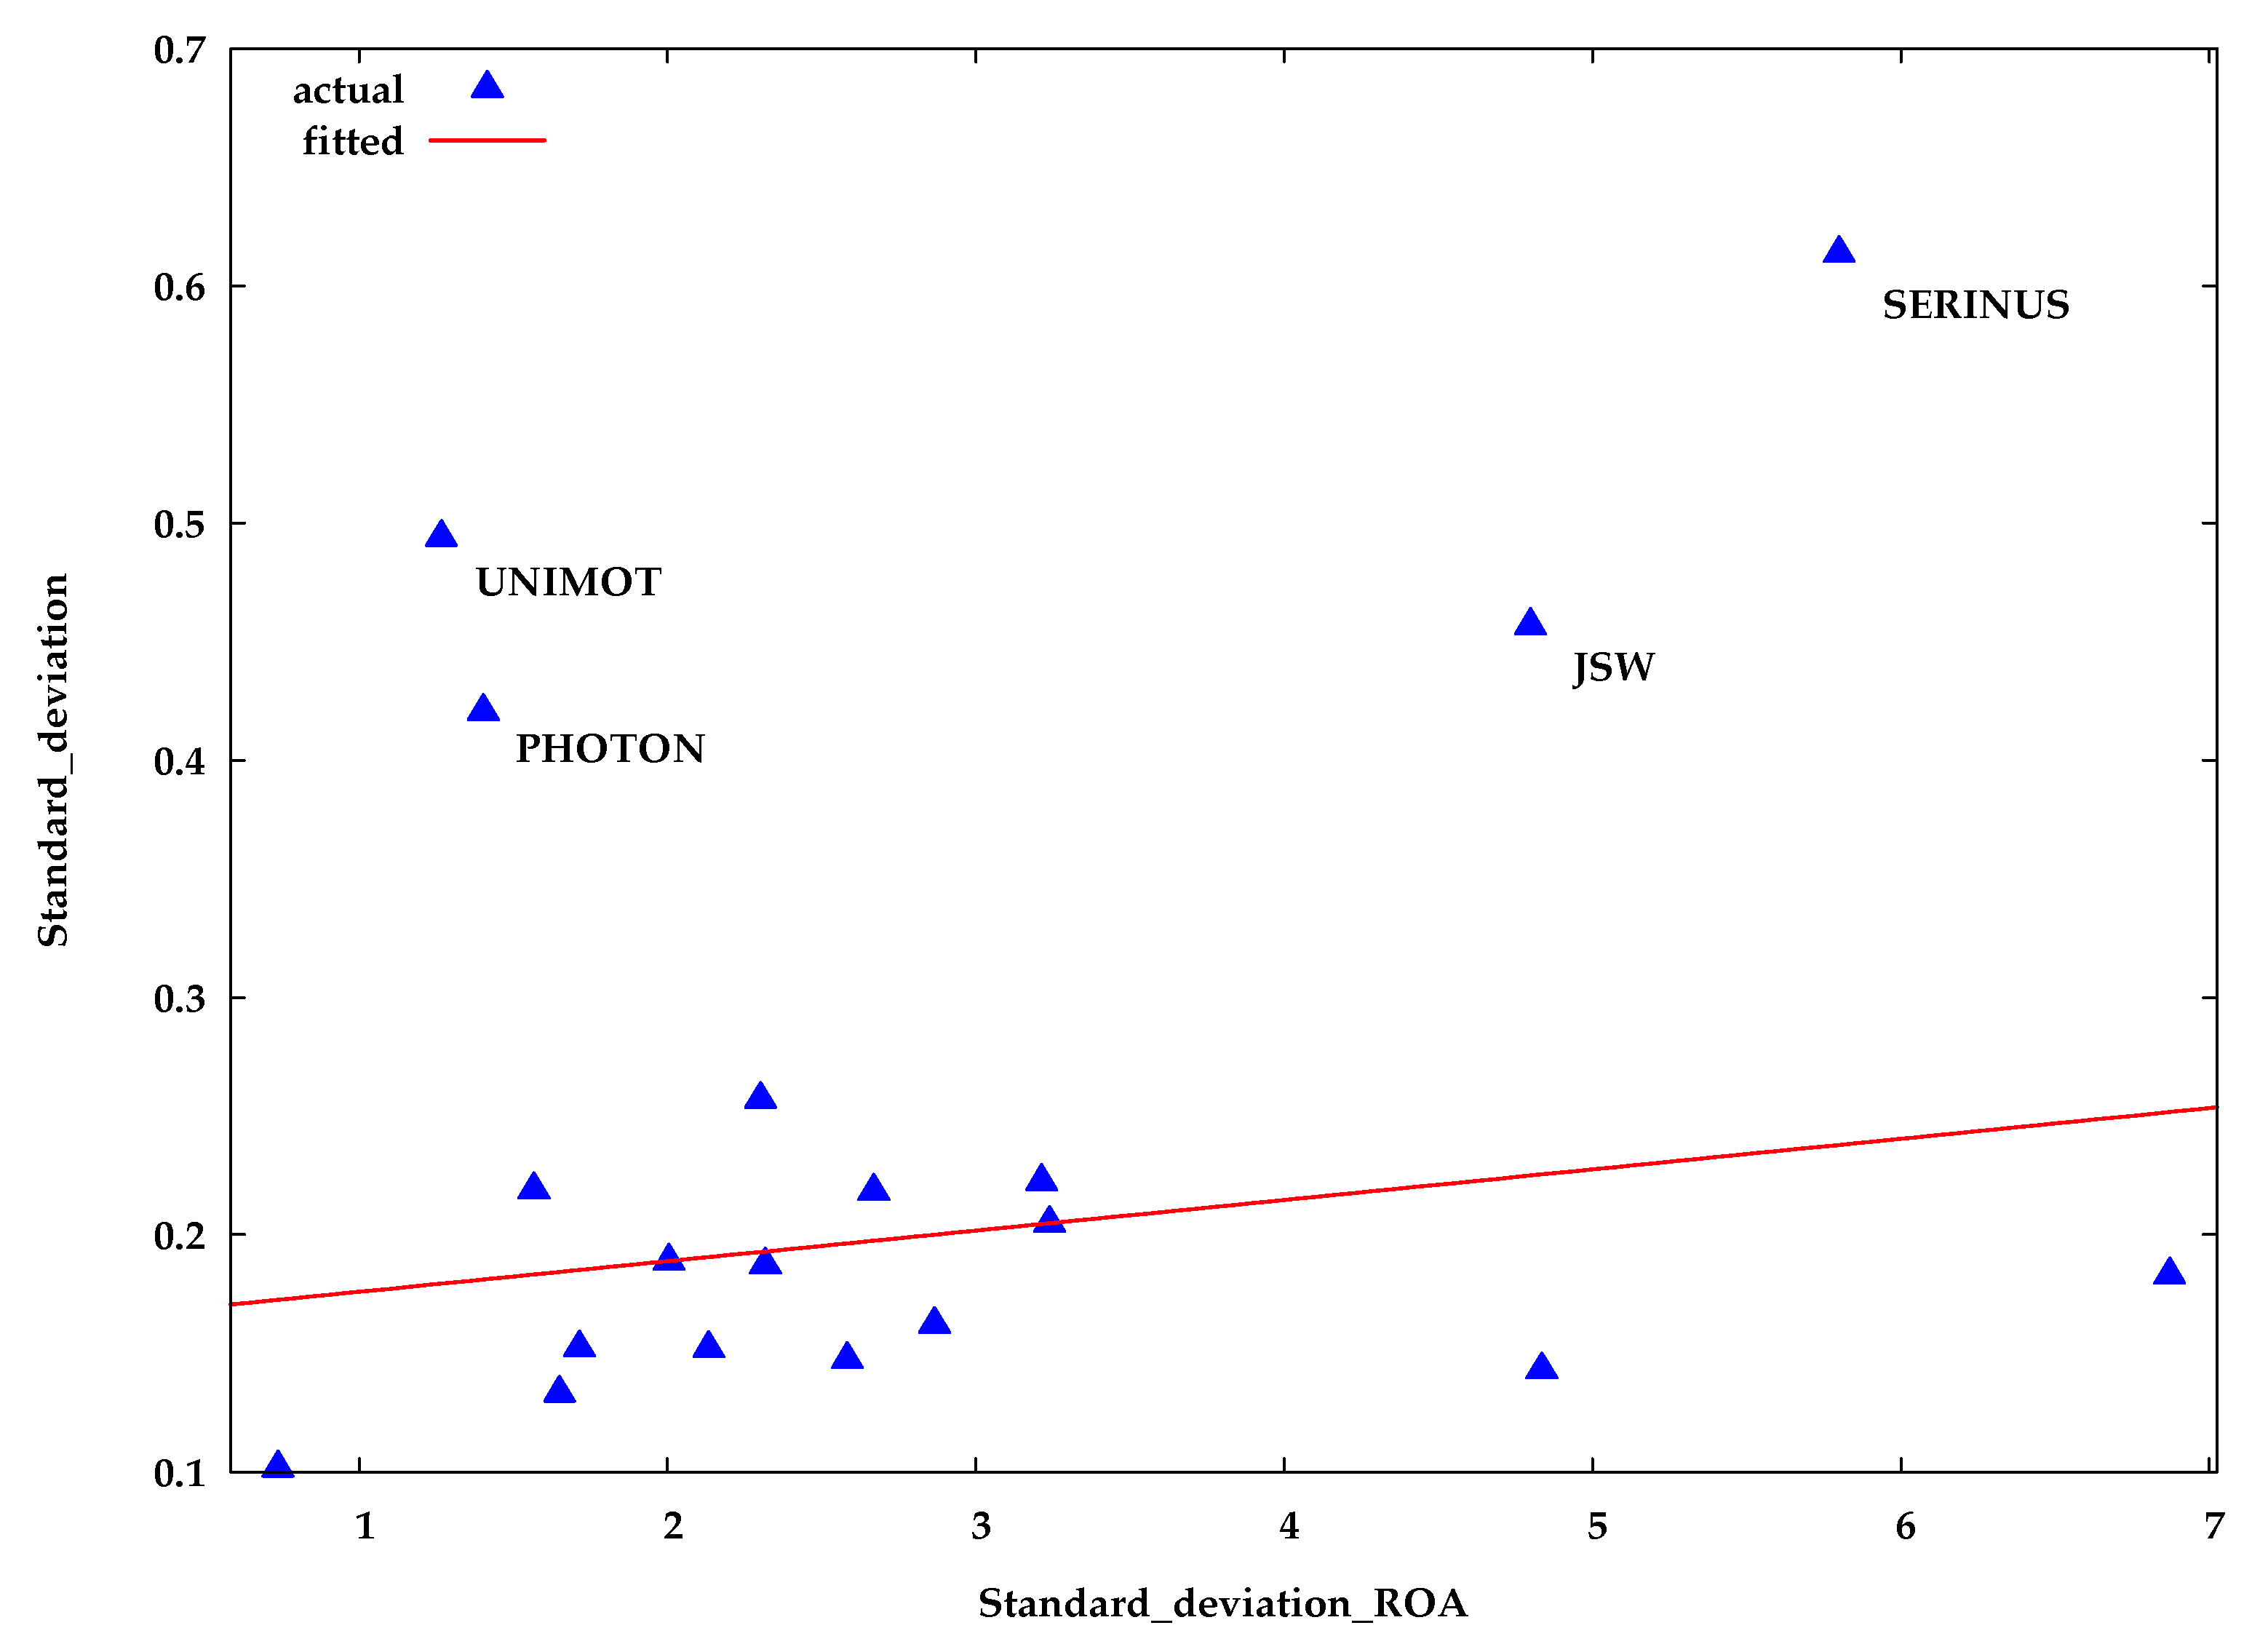
The first relationship concerns the relationship between the standard deviation of rates of return and the standard deviation for the ROA ratio. The estimation results are presented in Table 8. If the OLS estimates are statistically insignificant, the results of quantile regression indicate the statistical significance of the tested relationship for the quantile 0.25 and 0.75. The results indicate that, at the 25, 50, and 75 percentile, a one-unit increase in standard deviation for ROA ratio results in 0.0066, 0.0129, and 0.0800 percentage point increase in the standard deviation of returns, respectively. Taking into account the assessment of all values of the regression coefficient, the conclusion is that the magnitude of impact that ROA ratio on the dispersion of returns increases as a companies’ standard deviation moves from the 25% quantile to those in the 75% quantile.
The graph in Figure 1 shows that quantile regression is much more robust to outliers compared to the OLS method. It plots the outliers for the quantile regression equation for the median (50th quantile) based on the magnitude of residuals in excess of 2.5 standard errors. However, note that only anomalies in the conditional distribution of dependent variables can be detected in this way. Four companies that turned out to be outliers were signed. They form two separate groups. The first one, consisting of JSW and SERINUS, confirms the relationship observed in the quantile regression model. These companies have a high total market risk with a high level of total accounting risk. The second group of UNIMOT and PHOTON companies is much less attractive from the investor’s point of view. These companies are characterized by a high total market risk with a low level of volatility of the achieved ROA ratios.
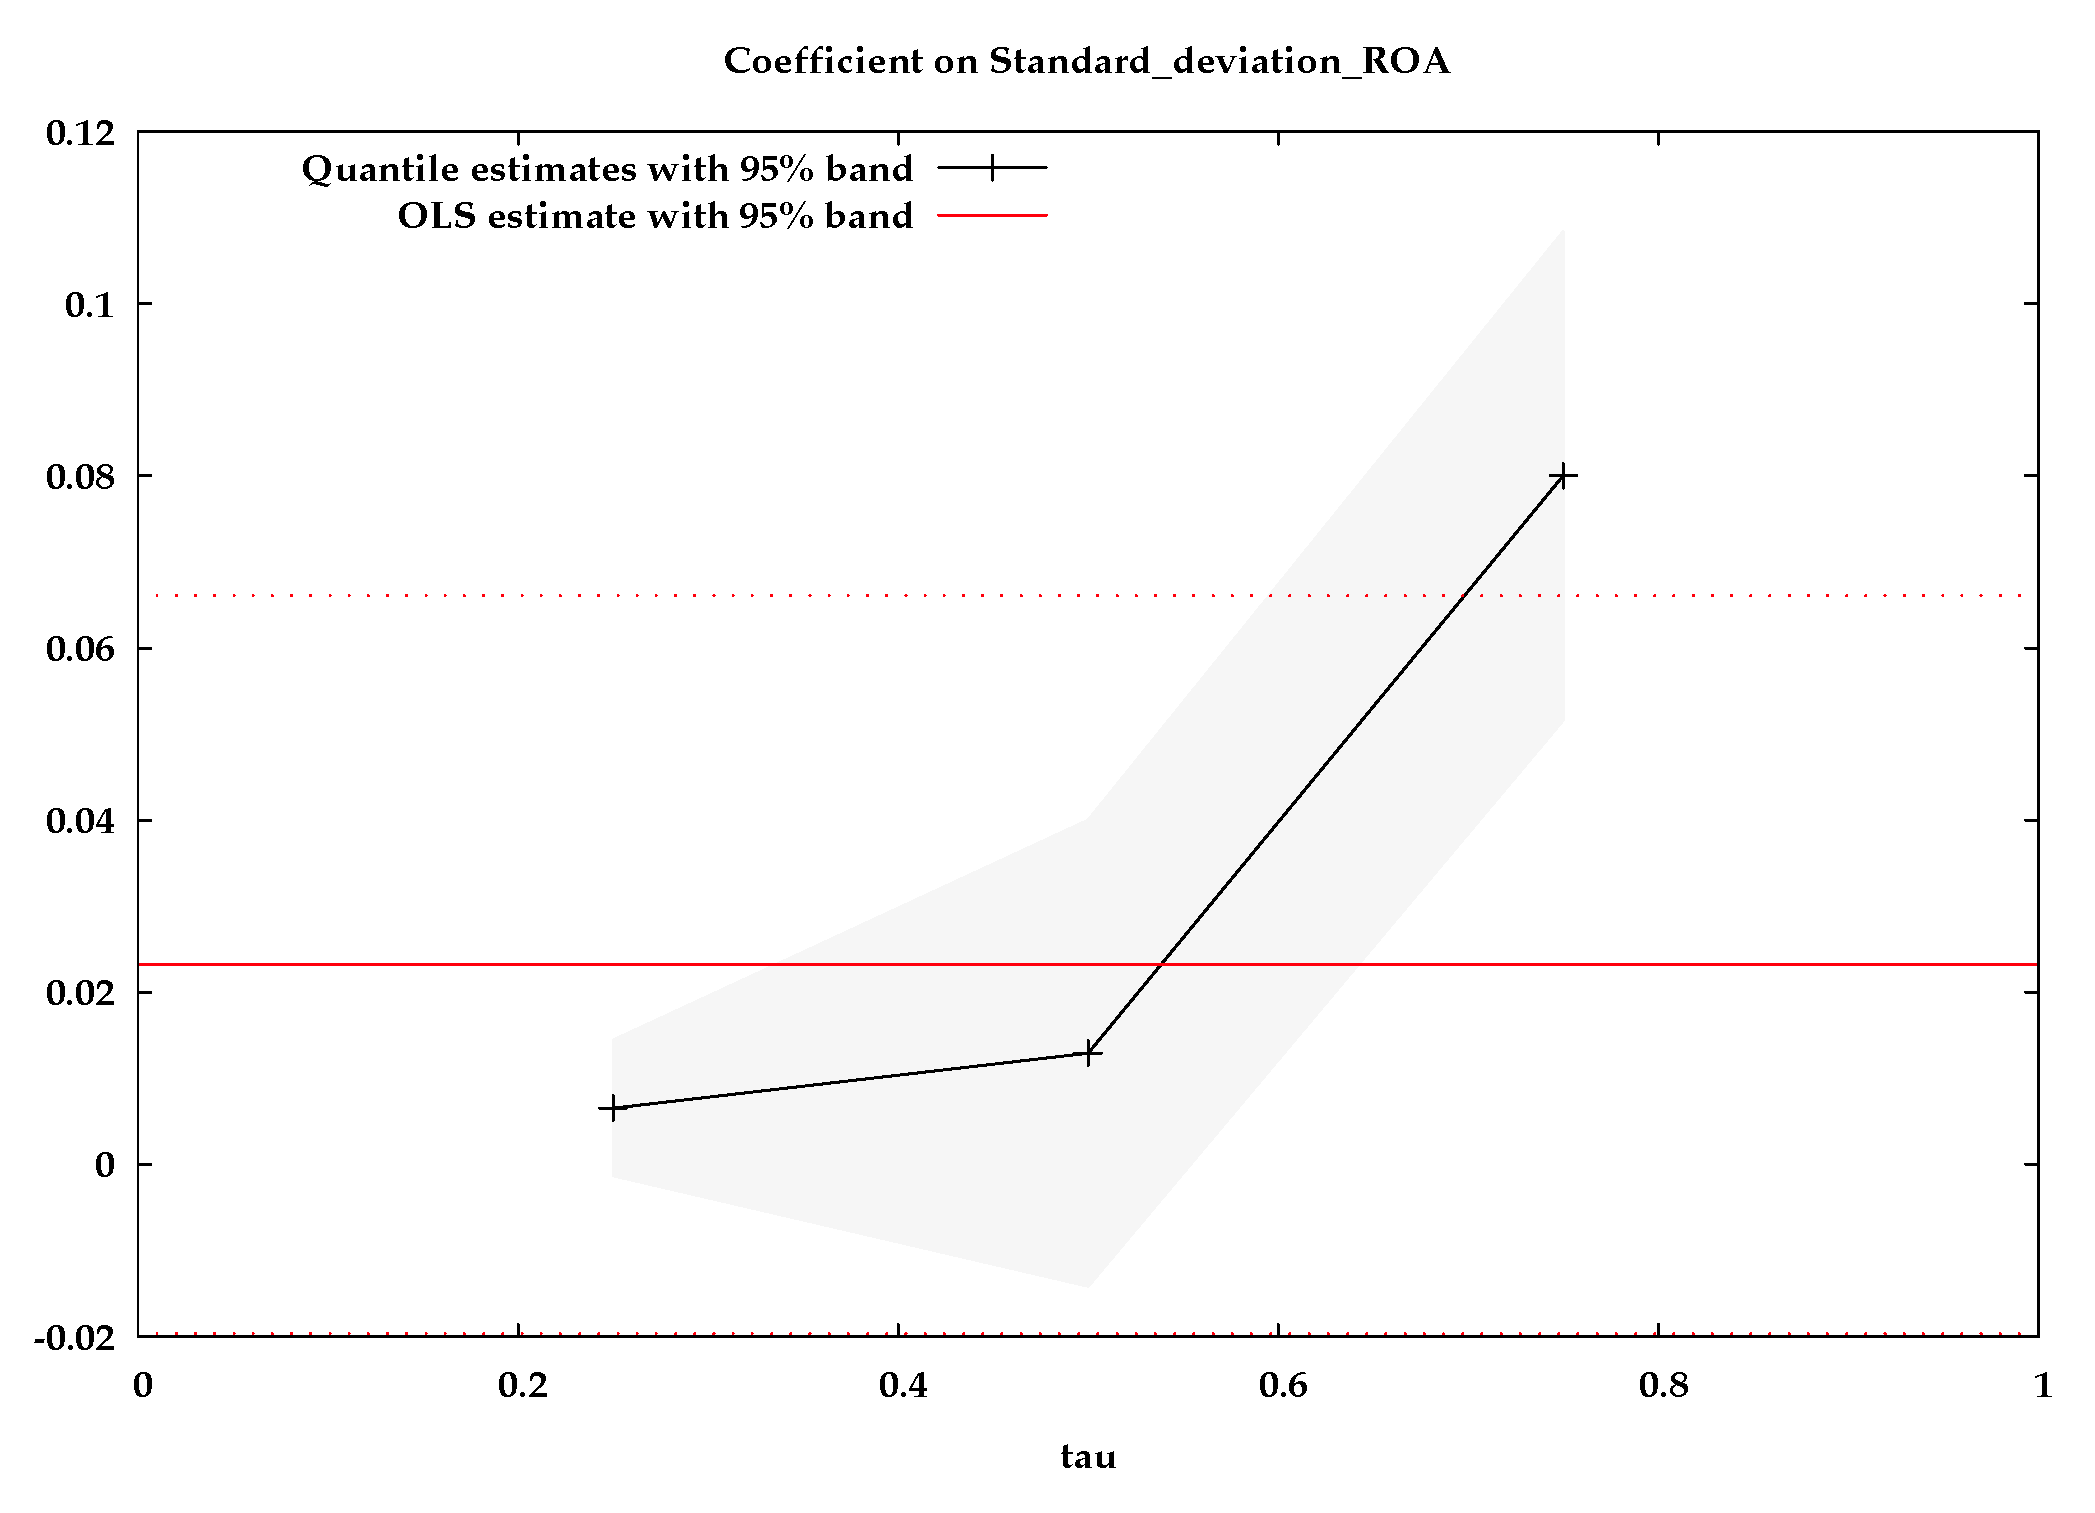
The quantile regression estimates with confidence intervals are presented in Figure 2. The graph on this figure provides a visualization of the difference in coefficients across the quantiles with the bootstrapped confidence intervals. It also includes the OLS estimate, which is constant across all quantiles, and their confidence intervals. This graph indicates that OLS coefficients do not fall within confidence intervals of the quantile regression coefficients for quantile equal to 0.75. This implies that quantile regression results are statistically different from the OLS results.
The relationship between total market and accounting risk was also tested using the downside approach. The estimation results are presented in Table 9, Figure 3 and Figure 4, respectively. The results of quantile regression indicate the statistical significance of the tested relationships for all quantiles at the level of at least 5%. The results indicate that, at the 25, 50, and 75 percentile, a one-unit increase in semi-deviation for ROA ratio results in a 0.0080, 0.0039, and 0.0191 percentage point increase in the semi-deviation of returns, respectively. The downside deviation of the ROA ratio has a much stronger impact on companies with a high level of total downside risk (75% quantile) than on other energy companies. This means that achieving financial results significantly below the average significantly increases the risk of achieving rates of return below the average value. As for conventional relationships, outliers can also be identified in the downside approach. The quantile regression equation for the median (50th quantile) in the downside framework is presented in Figure 3. The outlier company is UNIMOT, for which the relationship between the market and the downside of the standard deviation is not as expected. This company, despite the relatively high ROA ratio with a low level of accounting downside risk, is in the group of companies with the highest total downside risk.
The relationship between market and accounting risk measures is also considered in the context of sensitivity measures. The results of quantile regression indicate the statistical significance of the tested relationship for the quantile 0.50 and 0.75 (Table 10). The accounting beta coefficient for ROA ratio has a much stronger impact on companies with a medium and high level of systematic risk (50% and 75% quantile) than defensive energy companies. The outliers from the quantile regression equation for the median, as shown in Figure 5, are companies representing the electric power generation industry, PGE, and ZEPAK, which have either a high level of systematic market risk or systematic accounting risk. The estimates for these quantiles are more than twice the estimates obtained by the OLS method, which indicates statistical insignificance of the relationship between the beta and beta (ROA) coefficients (Figure 6). The obtained results mean that the measure of energy companies’ reaction to the economic situation on this market significantly influences the growing sensitivity of these companies to the capital market condition.
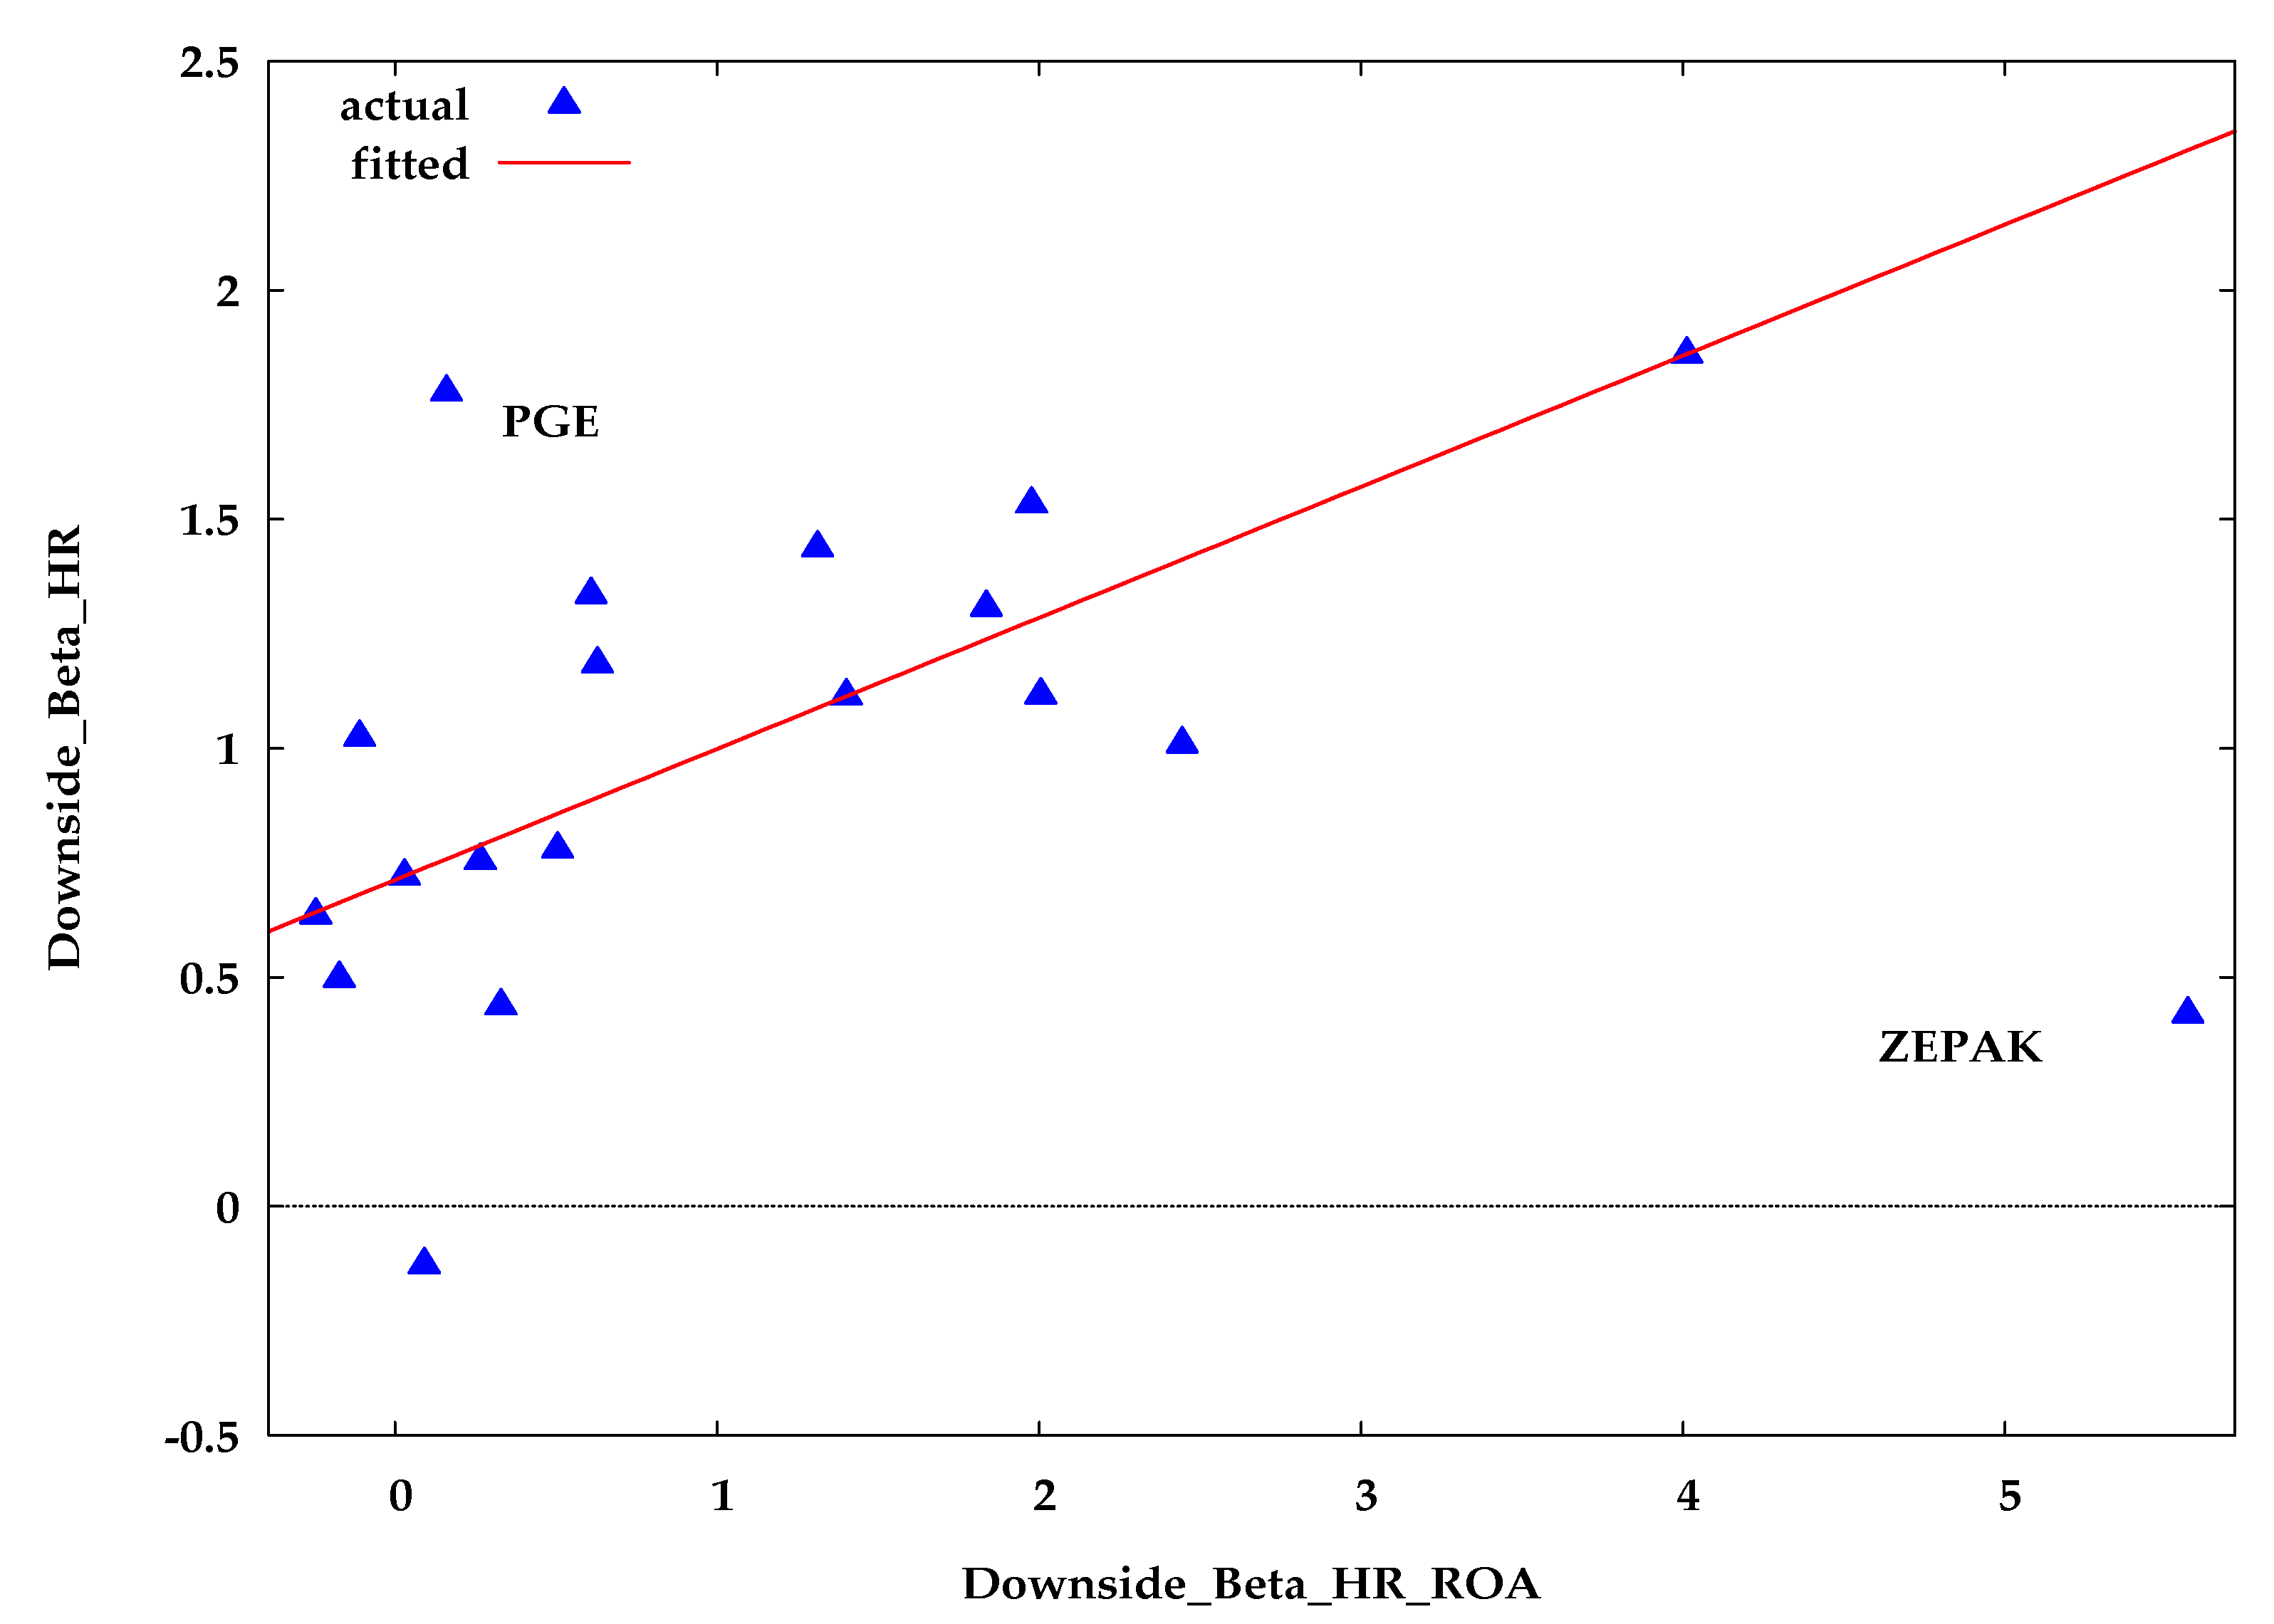
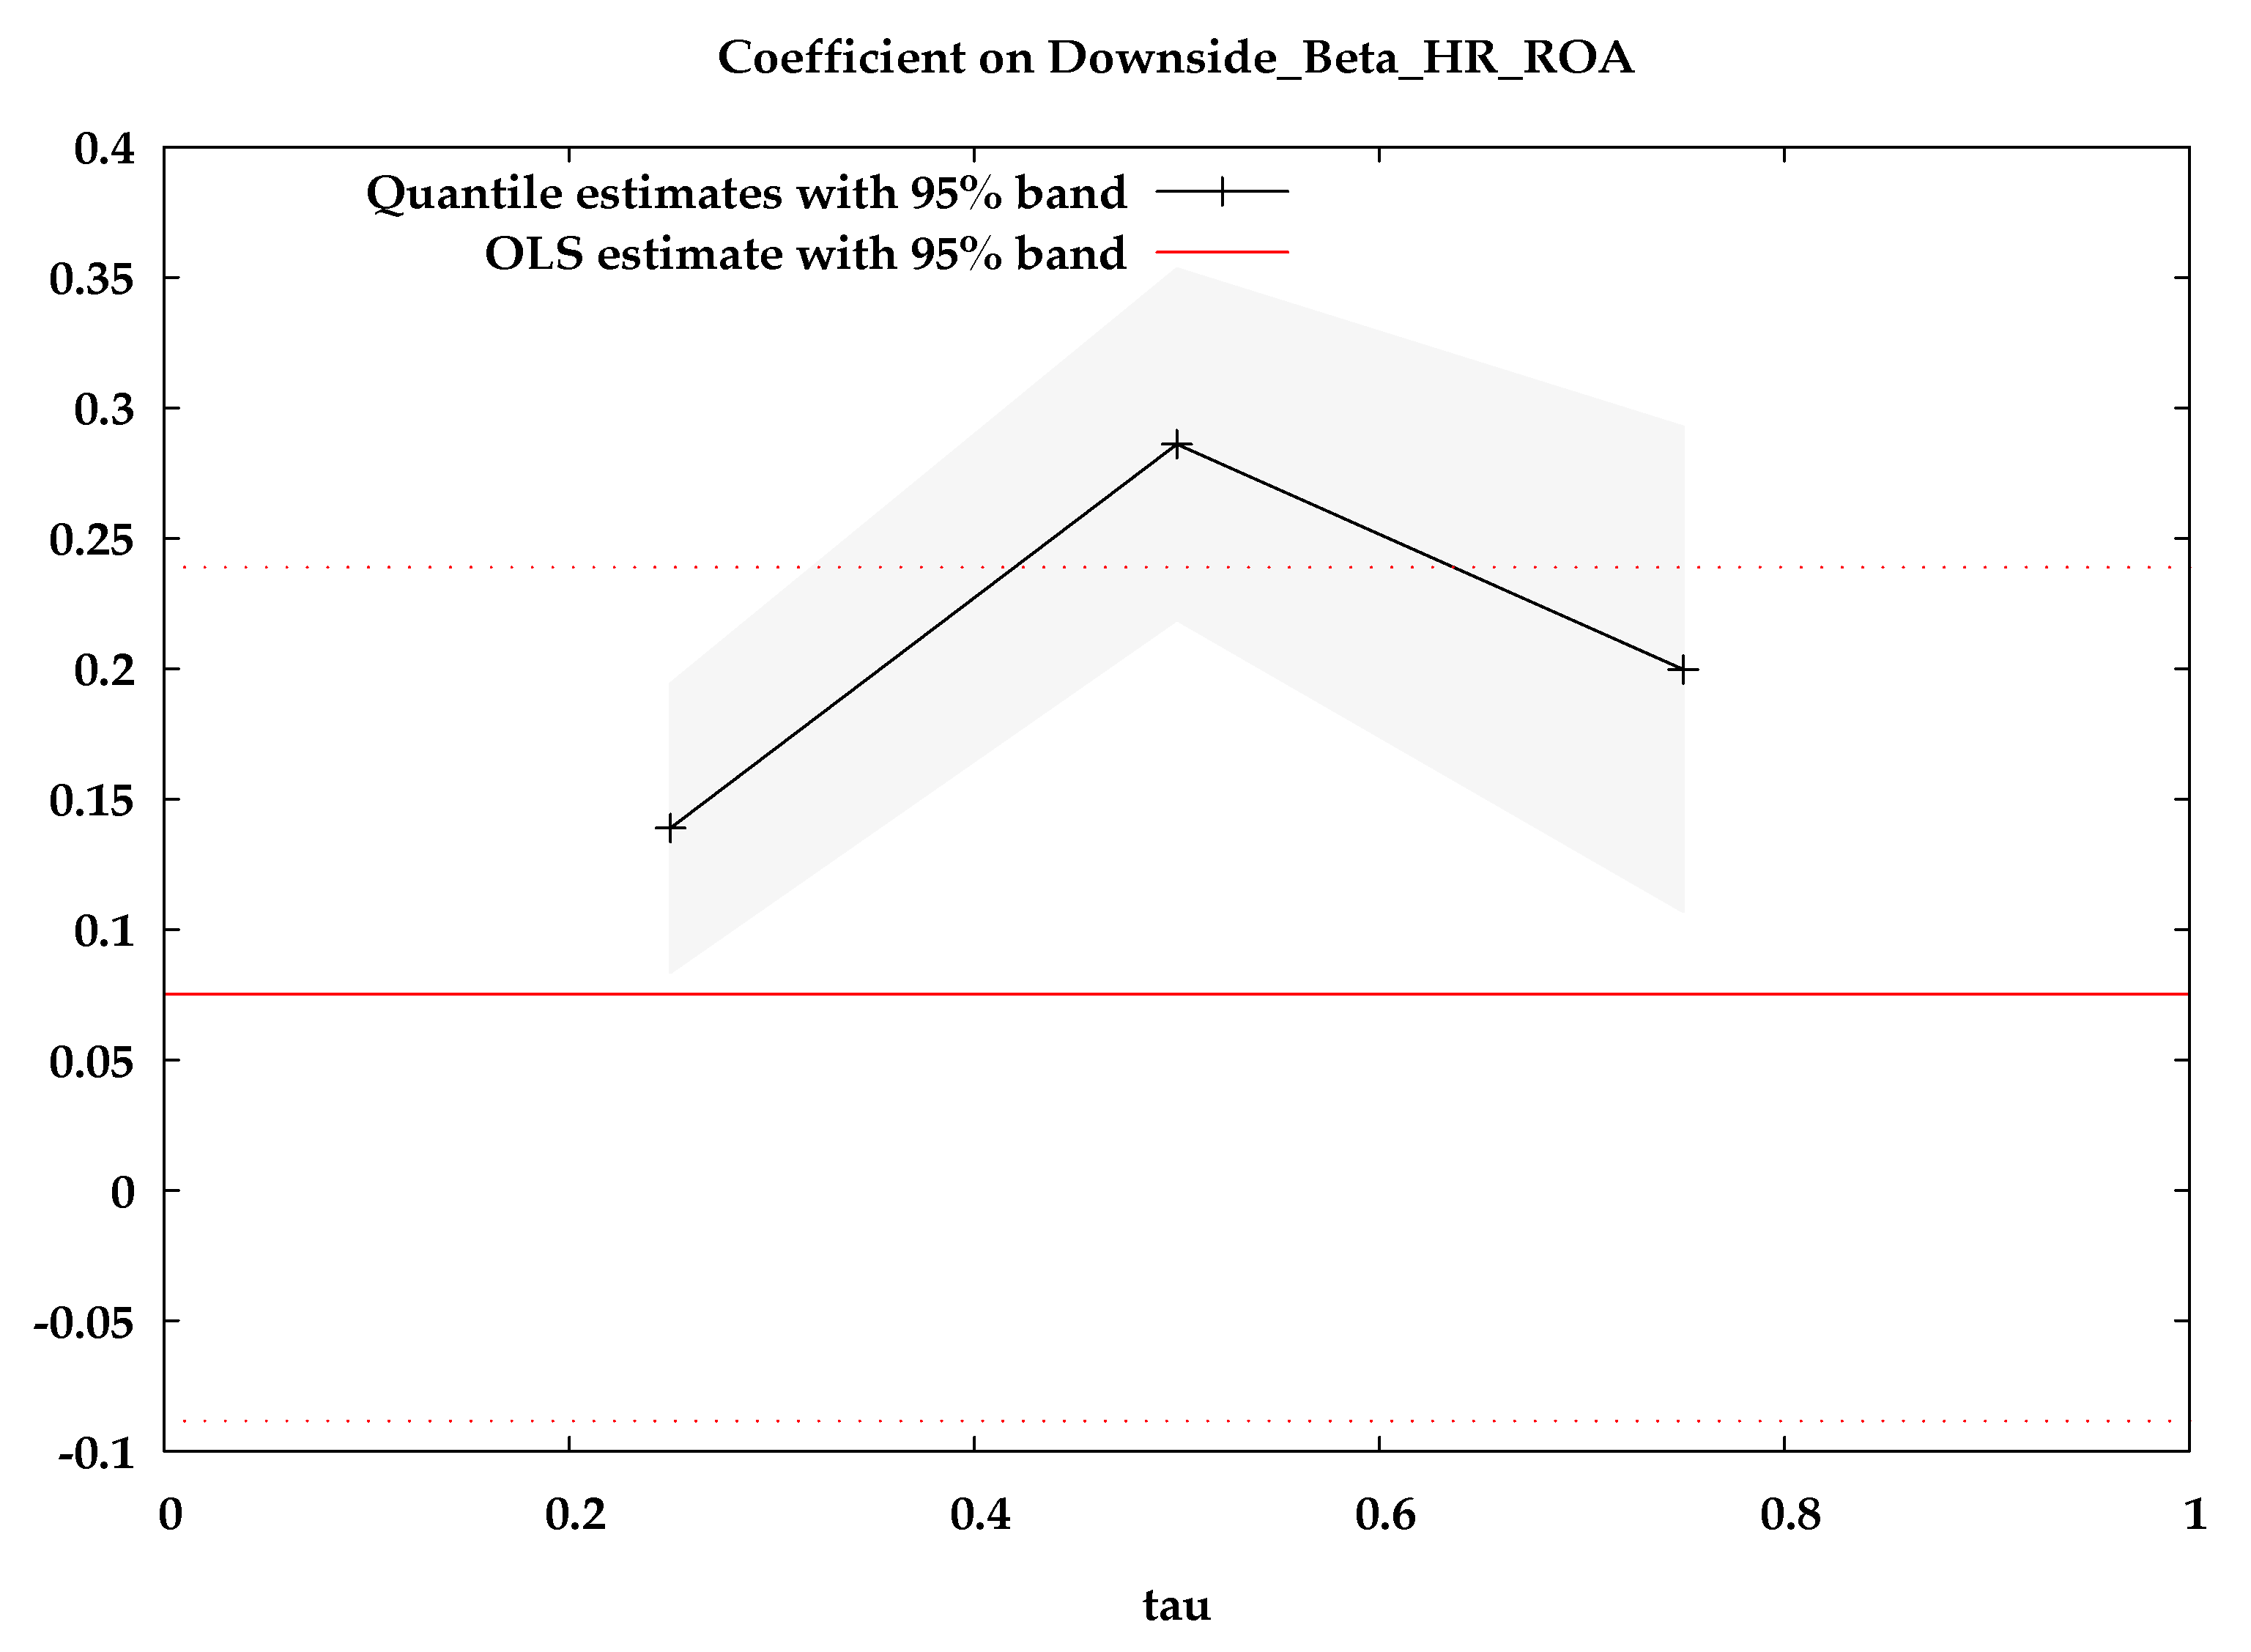
The last relationship to be estimated is the relationship between market and accounting beta coefficients in the downside framework. It is particularly consequential because it considers risk only in the context of actual losses, either in the form of rates of return below the average rate or achieved ROA ratios below the average ROA ratio for the entire industry. The obtained estimates of the quantile regression coefficients turned out to be statistically significant at the level of 1% and, in terms of their value, were higher than the estimates of regression based on conventional coefficients (Table 11). The obtained estimates of the quantile regression coefficients turned out to be statistically significant at the level of 1% and, in terms of their value, were higher than the estimates of regression based on conventional coefficients. The downside accounting beta coefficient for ROA has the greatest impact on energy companies with middle values of downside beta coefficient (50% quantile). One unit increase in downside beta coefficient for ROA ratio results in a 0.2861 unit increase in downside beta coefficient. As in the case of regression for conventional coefficients, the outliers from the quantile regression equation for the quantile equal to 0.50, as shown in Figure 7, are companies PGE and ZEPAK. The graph in Figure 8 indicates that OLS coefficients do not fall within confidence intervals of the quantile regression coefficients for quantile equal to 0.50. This implies that regression results for this quantile are statistically different from the OLS estimates.
The subject of the presented research was not the valuation of the proposed risk measures but the relationships between them. The results of all four analyses confirmed that the risk related to the company’s financial condition has an impact on the risk of investing in the shares of these companies in the capital market.
5. Discussion and Conclusions
This study aimed at assessing the size of the risk of investing in individual companies and analyzing the relationship between risk measures. The risk measurement took into account the volatility of quotations as well as the volatility of financial results achieved by energy companies. Risk measures were considered in terms of conventional and downside approaches, showing the amount of total risk and systematic risk as a measure of sensitivity to market changes. The contribution of the article to the risk analysis of energy companies is the use of unpopular accounting beta factors and a new modification of these indicators for downside risk. Moreover, there is little research on the impact of accounting risk measures on market risk measures, and there are practically no studies for energy companies, both Polish and from other stock markets. It should be emphasized that accounting risk measures may be used for companies not listed on regulated markets.
The analysis of the distributions of rates of return, and especially the ROA ratio distributions, indicated their inconsistency with the normal distribution. This fully justifies the use of risk measures in the downside approach. In the case of total risk, semi-deviation for ROA ratios had greater volatility than semi-deviation for returns. On the other hand, the beta coefficients for the ROA ratio, both in the conventional and downside approach, were characterized by much greater volatility than the beta coefficients for rates of return.
Empirical study enables us to verify the working hypotheses set in this work. Due to the rare risk measures used, the obtained results are difficult to relate to the studies of other authors, as they are simply not there. However, this can be related to the previous research by the same authors on the WSE and FSE. The impact of accounting measures of risk on market measures of risk was identified for Polish food, construction, and IT companies, as well as ones composing some of the WSE for large, medium, and small companies [9,10,11,12,13]. Similar research was conducted on the Frankfurt Stock Exchange. It was pointed out that the accounting measure of total and systematic risk has a significant impact on market risk measures for companies included in DAX, MDAX, and SDAX [14].
Due to the non-normal distribution of the studied variables and numerous outliers, the applied quantile regression, as opposed to the OLS estimates, showed significant relationships between accounting measures of risk and market measures. Moreover, quantile regressions reveal that the slope for accounting variables varies across the quantiles. Taking into account all the results obtained, it should be stated that for all relationships, a significant and positive effect of accounting risk measures on market risk measures was observed. Standard deviation and semi-deviation for the ROA ratio have the strongest impact on companies with the highest values of standard deviation and semi-deviation of rates of return. This impact is several times higher for companies with a low and medium level of total risk. Conventional and downside coefficients of sensitivity for the ROA ratios regarding changes in this indicator for the energy sector have the greatest impact on companies in the 50th quantile in terms of the beta coefficient in both approaches.
The applied analysis allowed for the post verification of the hypotheses. Hypothesis (H1), which maintains that the standard deviation of ROA positively impacts a standard deviation of the rate of return among stock Polish energy companies, was verified positively (see Table 7 and Table 8). This means that an increase in the market value of an energy company’s equity in the long term is a consequence of the company’s ability to generate profits. This is confirmed by the results obtained earlier on the WSE and FSE. According to the quantile regression results, the amount of total risk is an increasing and significant function of accounting for total risk. Such results cannot be observed using the OLS estimator, which is not resistant to outliers (see Table 8).
Hypothesis (H2), implicating that semi-deviation of ROA positively impacts the semi-deviation of the rate of return among stock Polish energy companies, was verified positively (see Table 7 and Table 9). There was a positive correlation between total risk measured based on rates of return and ROA (see Table 7). This is confirmed by the results obtained earlier on the WSE and FSE. The results of the proposed regressions indicate that from the downside approach, total accounting risk has the strongest impact on companies with the highest total risk values. The coefficients obtained for the 75th quantile significantly exceed those for the other quantiles (see Table 9).
Hypothesis (H3), stating that accounting beta has a positive impact on the market beta in variance approach among stock Polish energy companies, was fully confirmed (see Table 7 and Table 10). Thus, it can be assumed that the sensitivity of the profitability of a given energy company to changes in the profitability of the entire sector is an important reason for the sensitivity of the rates of return of this listed company to changes in the returns of the stock exchange index. This is confirmed by the results obtained earlier for Polish food, construction, and IT companies. The quantile regression estimates as compared to the OLS results were significantly higher and indicated the growing impact of systematic accounting risk on the market risk expressed by the beta coefficient. The companies with average values of this coefficient were the most sensitive to this impact. (see Table 10).
Hypothesis (H4), in which we assumed that accounting beta positively impacts market beta in the downside approach among stock Polish energy companies, was confirmed (see Table 7 and Table 11). This was confirmed by the results obtained earlier for Polish food, construction, and IT companies. The obtained results estimating the relationship between downside beta and downside accounting beta indicate an even stronger positive relationship compared to the relationship between these risk measures in the conventional approach. It should be noted that the quantile regression result significantly differs from the results of the OLS obtained (see Table 11).
The importance of this article is that the risk of a company’s financial performance is related to the risk of equity investments in several dimensions. The study covered both total and systematic risk. The analyses were also unique in that they compared the conventional approach to risk with the downside approach.
The theoretical implication will be the application of the accounting risk measures discussed in the paper in capital asset pricing models, both for listed and unlisted companies on regulated financial markets. The practical use of the presented methods is their use in enterprise risk management as well as their inclusion in financial statements.
The presented results and methodology have cognitive limitations that should be mentioned. The empirical limitation of this research is a relatively small research sample. The analyses were carried out only for Polish energy companies; it can be assumed that similar results will be obtained on other European markets. However, this is only a supposition that needs to be verified in further research.
The limitation of the presented method of quantifying the risk using the accounting measures is the quality, availability, and frequency of accounting data. To measure the volatility (semi-volatility) and sensitivity of accounting ratios, the time series, at least with quarterly frequency, is needed. It is important to note that, on regulated stock exchanges, there is an obligation to publish financial statements at least once a quarter. This, unfortunately, is not always the case, even in the case of developed and large stock markets, e.g., companies listed on the largest European stock exchange, the London Stock Exchange, are legally obliged to publish only annual reports. A similar study can therefore be carried out on the Frankfurt Stock Exchange, but not on the London Stock Exchange. The lack of access to quarterly financial data is detrimental to individual and institutional stock investors. Accounting risk measures can be used to assess the risk of unlisted companies. In this case, the lack of access to reliable quarterly or more frequent data may be a significant limitation in the practical use of accounting measures of total and systematic risk.
The direction of the research is examining the relationship between accounting risk measures for energy companies on other stock markets, also using other variants of accounting beta coefficients for other profitability ratios and coefficients based on cash flow. The use of accounting risk measures to identify and compare the risk of energy companies not listed on regulated stock markets should continue to be explored in further research. This research should be repeated in the following years, which will be crucial for the development of Polish and European energetics. It is assumed that the attack of the Russian Federation on Ukraine has changed the direction of modernization in this sector. The departure from coal has slowed down, and the importance of modern solutions is growing, both in the context of renewable energy and nuclear energy. The situation of an armed conflict, for Poland but also for other European countries, is undoubtedly a political factor influencing the risk of the commodities market, taking into account the significant fluctuations in their supplies and spectacular price levels. Polish authorities are looking for new suppliers and energy sources’ distribution channels. Poland has a chance to become a gas hub for Central and Eastern Europe, just like nowadays, Germany is for Western Europe.
Author Contributions
Conceptualization, A.R.-Z. and L.M.; methodology, A.R.-Z. and L.M.; formal analysis, A.R.-Z. and L.M.; investigation, A.R.-Z. and L.M.; resources, A.R.-Z. and L.M.; data curation, A.R.-Z.; writing—original draft preparation, A.R.-Z. and L.M.; writing—review and editing, A.R.-Z. and L.M.; visualization, L.M.; supervision, A.R.-Z. and L.M.; project administration, A.R.-Z. and L.M.; funding acquisition, A.R.-Z. and L.M. All authors have read and agreed to the published version of the manuscript.
Funding
This research received no external funding.
Data Availability Statement
All data used in the study were obtained from the Thomson Reuters Refinitiv Eikon database. The database is only available for a fee to subscribers.
Acknowledgments
The author would like to acknowledge Gabriel Miczka for his enormous support in understanding technical details related to modern solutions such as nuclear energy, photovoltaics, and cogeneration (CHP).
Conflicts of Interest
The authors declare no conflict of interest.
References
- Wielechowski, M.; Czech, K. Companies’ Stock Market Performance in the Time of COVID-19: Alternative Energy vs. Main Stock Market Sectors. Energies 2022, 15, 106. [Google Scholar] [CrossRef]
- Antonakakis, N.; Cunado, J.; Filis, G.; Gabauer, D.; Perez de Gracia, F. Oil Volatility, Oil and Gas Firms and Portfolio Diversification. Energy Econ. 2018, 70, 499–515. [Google Scholar] [CrossRef] [Green Version]
- Kang, W.; Perez de Gracia, F.; Ratti, R.A. Oil Price Shocks, Policy Uncertainty, and Stock Returns of Oil and Gas Corporations. J. Int. Money Financ. 2017, 70, 344–359. [Google Scholar] [CrossRef]
- Diaz, E.M.; de Gracia, F.P. Oil Price Shocks and Stock Returns of Oil and Gas Corporations. Financ. Res. Lett. 2017, 20, 75–80. [Google Scholar] [CrossRef]
- Sitek, M.; Tvaronavičienė, M. Innovation Management in Polish Real Estate Developers in the Renewable Energy Sources Context. Energies 2021, 14, 1702. [Google Scholar] [CrossRef]
- Wolniak, R.; Skotnicka-Zasadzień, B. Development of Photovoltaic Energy in EU Countries as an Alternative to Fossil Fuels. Energies 2022, 15, 662. [Google Scholar] [CrossRef]
- Miciuła, I.; Wojtaszek, H.; Bazan, M.; Janiczek, T.; Włodarczyk, B.; Kabus, J.; Kana, R. Management of the Energy Mix and Emissivity of Individual Economies in the European Union as a Challenge of the Modern World Climate. Energies 2020, 13, 5191. [Google Scholar] [CrossRef]
- Kludacz-Alessandri, M.; Cygańska, M. Corporate Social Responsibility, and Financial Performance among Energy Sector Companies. Energies 2021, 14, 6068. [Google Scholar] [CrossRef]
- Rutkowska-Ziarko, A. The Influence of Profitability Ratios and Company Size on Profitability and Investment Risk in the Capital Market. Folia Oecon. Stetin. 2015, 15, 151–161. [Google Scholar] [CrossRef] [Green Version]
- Rutkowska-Ziarko, A.; Pyke, C. The development of downside accounting beta as a measure of risk. Econ. Bus. Rev. 2017, 45, 55–65. [Google Scholar] [CrossRef]
- Rutkowska-Ziarko, A.; Pyke, C. Validating downside accounting beta: Evidence from the Polish construction industry. In Contemporary Trends and Challenges in Finance; Jajuga, K., Locarek-Junge, H., Orlowski, L., Eds.; Springer Proceedings in Business and Economics; Springer: Cham, Switzerland, 2018; pp. 81–87. [Google Scholar] [CrossRef]
- Rutkowska-Ziarko, A. Profitability Ratios in Risk Analysis. In Contemporary Trends and Challenges in Finance; Jajuga, K., Locarek-Junge, H., Orlowski, L., Staehr, K., Eds.; Springer Proceedings in Business and Economics; Springer: Cham, Switzerland, 2020; pp. 77–88. [Google Scholar] [CrossRef]
- Rutkowska-Ziarko, A. Dolne księgowe współczynniki beta w analizie ryzyka polskich spółek informatycznych. In Finanse Publiczne a Finanse Prywatne—Problemy, Diagnozy, Perspektywy; Adamczyk, A., Franek, S., Eds.; Uniwersytet Szczeciński: Szczecin, Poland, 2020; pp. 277–289. Available online: https://katalog.nukat.edu.pl/lib/item?id=chamo:5079997&fromLocationLink=false&theme=nukat (accessed on 2 February 2022).
- Rutkowska-Ziarko, A. Market and Accounting Measures of Risk: The Case of the Frankfurt Stock Exchange. Risks 2022, 10, 14. [Google Scholar] [CrossRef]
- Sharpe, W.F. Capital Asset Prices: A Theory of Market Equilibrium Under Conditions of Risk. J. Financ. 1964, 19, 425–442. [Google Scholar] [CrossRef] [Green Version]
- Lintner, J. The valuation of risk assets and the selection of risky investments in stock portfolio and capital budgets. Rev. Econ. Stat. 1965, 47, 13–37. [Google Scholar] [CrossRef]
- Mossin, J. Equilibrium in a capital asset market. Econometrica 1966, 34, 768–783. [Google Scholar] [CrossRef]
- Bawa, V.S. Optimal Rules for Ordering Uncertain Prospects. J. Financ. Econ. 1975, 2, 95–121. [Google Scholar] [CrossRef]
- Hogan, W.; Warren, J. Toward the development of an equilibrium capital-market model based on semivariance. J. Financ. Quant. Anal. 1974, 9, 1–11. [Google Scholar] [CrossRef]
- Bawa, V.S.; Lindenberg, E.B. Capital Market Equilibrium in a Mean-Lower Partial Moment Framework. J. Financ. Econ. 1977, 5, 189–200. [Google Scholar] [CrossRef]
- Fishburn, P.C. Mean-Risk Analysis with Risk Associated with Below-Target Returns. Am. Econ. Rev. 1977, 67, 116–126. [Google Scholar]
- Harlow, W.V.; Rao, R.K.S. Asset pricing in a generalized mean-lower partial moment framework: Theory and evidence. J. Financ. Quant. Anal. 1989, 24, 285–311. [Google Scholar] [CrossRef]
- Markowitz, H. Portfolio Selection: Efficient Diversification of Investments; Wiley: New York, NY, USA, 1959; Available online: https://trove.nla.gov.au/version/260173474 (accessed on 2 February 2022).
- Foo, T.; Eng, S. Asset allocation in a downside risk framework. J. Real Estate Portf. Manag. 2000, 6, 213–223. [Google Scholar] [CrossRef]
- Salah, H.B.; Chaouch, M.; Gannoun, A.; De Peretti, C.; Trabelsi, A. Mean and median-based nonparametric estimation of returns in mean-downside risk portfolio frontier. Ann. Oper. Res. 2018, 262, 653–681. [Google Scholar] [CrossRef] [Green Version]
- Boasson, V.; Boasson, E.; Zhou, Z. Portfolio optimization in a mean-semivariance framework. Invest. Manag. Financ. Innov. 2011, 8, 58–68. [Google Scholar]
- Pla-Santamaria, D.; Bravo, M. Portfolio optimization based on downside risk: A mean-semivariance efficient frontier from Dow Jones blue chips. Ann. Oper. Res. 2013, 205, 189–201. [Google Scholar] [CrossRef]
- Ling, A.; Sun, J.; Wang, M. Robust multi-period portfolio selection based on downside risk with asymmetrically distributed uncertainty set. Eur. J. Oper. Res. 2020, 285, 81–95. [Google Scholar] [CrossRef]
- Markowski, L. Capital asset pricing in the classical and downside approaches to risk. Pol. Stat. Wiadomości Stat. 2019, 64, 58–75. [Google Scholar] [CrossRef]
- Estrada, J. Systematic risk in emerging markets: The D-CAPM. Emerg. Mark. Rev. 2002, 3, 365–379. [Google Scholar] [CrossRef]
- Estrada, J. Mean-semivariance behaviour: Downside risk and capital asset pricing. Int. Rev. Econ. Financ. 2007, 16, 169–185. [Google Scholar] [CrossRef]
- Eng, A.; Chen, J.; Xing, Y. Downside risk. Rev. Financ. Stud. 2006, 19, 1191–1239. [Google Scholar] [CrossRef]
- Galagedera, D.U.A. An analytical framework for explaining relative performance of CAPM beta and downside beta. Int. J. Theor. Appl. Financ. 2009, 12, 341–358. [Google Scholar] [CrossRef]
- Chen, D.; Chen, C.; Chen, J. Downside risk measures and equity returns in the NYSE. Appl. Econ. 2009, 41, 1055–1070. [Google Scholar] [CrossRef]
- Tsai, H.; Chen, M.; Yang, C. A time-varying perspective on the CAPM and downside betas. Int. Rev. Econ. Financ. 2014, 29, 440–454. [Google Scholar] [CrossRef]
- Ajrapetova, T. Cross-Section of Asset Returns: Emerging Markets and Market Integration. Eur. Financ. Account. J. 2018, 13, 41–60. [Google Scholar] [CrossRef] [Green Version]
- Momcilovic, M.; Zivkov, D.; Vlaovic-Begovic, S. The downside risk approach to cost of equity determination for Slovenian, Croatian and Serbian capital markets. Ekon. Manag. 2017, 3, 147–158. [Google Scholar] [CrossRef]
- Hill, N.C.; Stone, B.K. Accounting Betas, Systematic Operating Risk, and Financial Leverage : A Risk-Composition Approach to the Determinants of Systematic Risk. J. Financ. Quant. Anal. 1980, 15, 595–637. [Google Scholar] [CrossRef]
- Amorim, A.L.; Lima, I.S.; Dal-Ri Murcia, F. Analysis of the Relationship between Accounting Information and Systematic Risk in the Brazilian Market. Rev. Contab. Finanç. 2012, 23, 199–211. [Google Scholar] [CrossRef] [Green Version]
- Latif, A.S.; Shah, A. The Impact of Quality of Accounting Information on Cost of Capital: Insight from an Emerging Economy. Asian Econ. Financ. Rev. 2021, 11, 292–307. [Google Scholar] [CrossRef]
- Huang, W.; Luo, Y.; Zhang, C. Accounting-Based Downside Risk and Stock Price Crash Risk: Evidence from China. Financ. Res. Lett. 2021, 45, 102152. [Google Scholar] [CrossRef]
- Pearson, K. Contributions to the Mathematical Theory of Evolution. Philos. Trans. R. Soc. Lond. Ser. A 1894, 185, 71–110. [Google Scholar]
- Markowitz, H.M. Portfolio Selection. J. Financ. 1952, 7, 77–91. [Google Scholar] [CrossRef]
- Jajuga, K. Teoretyczne podstawy pomiaru ryzyka. In Zarządzanie Ryzykiem, 2nd ed.; Jajuga, K., Ed.; Wydawnictwo Naukowe PWN: Warsaw, Poland, 2019; pp. 51–96.003A. [Google Scholar]
- Kuziak, K. Measurement of Enterprise Risk—Measurement Models and Their Risk; Wydawnictwo Uniwersytetu Ekonomicznego we Wrocławiu: Wrocław, Poland, 2011; pp. 97–103. [Google Scholar]
- Górowski, I.; Kurek, B.; Szarucki, M. The Impact of a New Accounting Standard on Assets, Liabilities and Leverage of Companies: Evidence from Energy Industry. Energies 2022, 15, 1293. [Google Scholar] [CrossRef]
- Sharpe, W.F. A Simplified Model of Portfolio Analysis. Manag. Sci. 1963, 9, 277–293. [Google Scholar] [CrossRef] [Green Version]
- Koenker, R.; Bassett, G. Regression Quantiles. Econometrica 1978, 46, 33–50. [Google Scholar] [CrossRef]
- Huber, P.J. Robust Regression: Asymptotics, Conjectures and Monte Carlo. Ann. Stat. 1973, 1, 799–821. [Google Scholar] [CrossRef]
- Onyedikachi, O.J. Robustness of Quantile Regression to Outliers. Am. J. Appl. Math. Stat. 2015, 3, 86–88. [Google Scholar] [CrossRef]
Figure 1.
Quantile regression line for the standard deviation of returns vs. standard deviation for ROA ().
Figure 1.
Quantile regression line for the standard deviation of returns vs. standard deviation for ROA ().

Figure 2.
Coefficients across the quantiles with the bootstrapped confidence intervals for regression of standard deviation of returns vs. standard deviation for ROA (, the OLS confidence interval is from −0.0196 to 0.0661).
Figure 2.
Coefficients across the quantiles with the bootstrapped confidence intervals for regression of standard deviation of returns vs. standard deviation for ROA (, the OLS confidence interval is from −0.0196 to 0.0661).

Figure 3.
Quantile regression line for semi-deviation of returns vs. semi-deviation for ROA ().

Figure 4.
Coefficients across the quantiles with the bootstrapped confidence intervals for regression of semi-deviation of returns vs. semi-deviation for ROA (, the OLS confidence interval is from −0.0028 to 0.0201).
Figure 4.
Coefficients across the quantiles with the bootstrapped confidence intervals for regression of semi-deviation of returns vs. semi-deviation for ROA (, the OLS confidence interval is from −0.0028 to 0.0201).

Figure 5.
Quantile regression line for beta coefficient vs. beta coefficient for ROA ().

Figure 6.
Coefficients across the quantiles with the bootstrapped confidence intervals for regression of beta coefficient vs. beta coefficient for ROA (, the OLS confidence interval is from −0.1206 to 0.3153).
Figure 6.
Coefficients across the quantiles with the bootstrapped confidence intervals for regression of beta coefficient vs. beta coefficient for ROA (, the OLS confidence interval is from −0.1206 to 0.3153).

Figure 7.
Quantile regression line for downside beta coefficient vs. downside beta coefficient for ROA ().
Figure 7.
Quantile regression line for downside beta coefficient vs. downside beta coefficient for ROA ().

Figure 8.
Coefficients across the quantiles with the bootstrapped confidence intervals for regression of downside beta coefficient vs. downside beta coefficient for ROA (, the OLS confidence interval is from −0.0884 to 0.2389).
Figure 8.
Coefficients across the quantiles with the bootstrapped confidence intervals for regression of downside beta coefficient vs. downside beta coefficient for ROA (, the OLS confidence interval is from −0.0884 to 0.2389).


Table 1.
Selected market risk measures in symmetrical (variance) and asymmetrical approaches.
| Symmetrical Market Risk Measures | ||
| Risk | Author (Year) | Formula |
| Systematic | beta coefficient Sharpe (1963) | , |
| Total | standard deviation Pearson as a statistical parameter (1894) [42] Markowitz as a risk measure (1952) [43] | |
| Asymmetrical Market Risk Measures | ||
| Risk | Author (Year) | Formula |
| Systematic | Harlow and Raodownside beta Harlow and Rao (1989) | |
| Total | semi-deviation Markowitz (1959) | , |
where is the number of time units, is the rate of return achieved in the time t by i-th company, is thecovariance of the rate of return of the i-th company and market portfolio, is the variance of the market portfolio, and are, respectively, the average rates of return of the i-th company and market portfolio.
Table 2.
Selected accounting risk measures in symmetrical (variance) and asymmetrical approaches.
| Symmetrical Accounting Risk Measures | ||
| Risk | Author (Year) | Formula |
| Systematic | accounting beta for ROA Hill and Stone (1980) | , |
| Total | standard deviation of ROA | |
| Asymmetrical Accounting Risk Measures | ||
| Risk | Author (Year) | Formula |
| Systematic | downside accounting beta for ROA Rutkowska-Ziarko (2020) | , |
| Total | semi-deviation of ROA | |
where is the return on assets ratio of the i-th company in time t, long-term average rate of return on assets on the market (in the sector), is the return on assets ratio on the market (in the sector) in time t, is the long-term average rate of return on assets on the market (in the sector). is the market value of the i-th company. −, is the number of companies. is the covariance of the profitability ratio of the i-th company and the market portfolio (in practice, the index of the market or sector based on the given profitability ratio) and is the variance of the profitability ratio for the market (sector).
Table 3.
Polish stock energy companies.
| Short Name | Official Name | Industry Name 1 | IPO Date |
|---|---|---|---|
| BEDZIN | Elektrocieplownia Bedzin SA | Electric Power Generation | 08.12.1998 |
| BOGDANKA | Lubelski Wegiel Bogdanka SA | Coal Mining | 28.06.2018 |
| CEZ | CEZ SA | Electric Power Generation | 22.06.1993 |
| ENEA | Enea SA | Electric Power Generation | 17.11.2008 |
| ENERGA | Energa SA | Electric Power Generation | 11.12.2013 |
| INTERAOLT | Inter RAO Lietuva AB | Electric Power Generation | 19.12.2012 |
| JSW | Jastrzebska Spolka Weglowa SA | Coal Mining | 08.08.2011 |
| KOGENERA | Zespol Elektrocieplowni Wroclawskich Kogeneracja SA | Electric Power Generation | 26.05.2000 |
| LOTOS | Grupa Lotos SA | Petroleum Refineries | 25.06.2009 |
| MOL | MOL Magyar Olajes Gazipari Nyrt | Petroleum Refineries | 06.07.2011 |
| PEP | [Polenergia SA | Electric Power Transmission, Control, and Distribution | 13.05.2005 |
| PGE | PGE Polska Grupa Energetyczna SA | Electric Power Generation | 06.11.2009 |
| PGNIG | Polskie Gornictwo Naftowe i Gazownictwo SA | Pipeline Transportation of Natural Gas | 09.09.1993 |
| PHOTON | Photon Energy NV | Electric Power Generation | 26.11.1999 |
| PKNORLEN | Polski Koncern Naftowy Orlen SA | Petroleum Refineries | 09.06.2005 |
| SERINUS | Serinus Energy PLC | Oil and Gas Extraction | 28.11.1995 |
| TAURONPE | Tauron Polska Energia SA | Electric Power Generation | 30.06.2010 |
| UNIMOT | Unimot SA | Fuel Dealers | 23.09.2005 |
| ZEPAK | Zespol Elektrowni Patnow Adamow Konin SA | Electric Power Generation | 30.10.2012 |
1 Thompson Reuters EIKON classification “NAICS International Industry Name”.
Table 4.
Summary statistics of energy companies’ quarterly returns.
| Company | J-B Test | |||||
|---|---|---|---|---|---|---|
| BEDZIN | −0.0173 | 0.1407 | 0.1095 | 0.0206 | −0.9518 | 1.24 [0.539] |
| BOGDANKA | −0.0224 | 0.2188 | 0.1662 | 0.1409 | 0.8198 | 0.39 [0.820] |
| CEZ | 0.0174 | 0.1001 | 0.0585 | 0.2293 | 0.0347 | 0.27 [0.873] |
| ENEA | 0.0015 | 0.1857 | 0.1209 | 0.5225 | 0.7888 | 1.51 [0.471] |
| ENERGA | −0.0114 | 0.1498 | 0.1137 | −0.0833 | −0.7917 | 0.95 [0.621] |
| INTERAOLT | 0.0118 | 0.2014 | 0.1161 | 1.2038 *** | 3.4410 *** | 15.64 [0.000] |
| JSW | 0.0533 | 0.4492 | 0.1851 | 3.0458 *** | 13.3881 *** | 194.84 [0.000] |
| KOGENERA | −0.0023 | 0.1495 | 0.0969 | 0.7624 ** | 1.1290 * | 3.33 [0.189] |
| LOTOS | 0.0320 | 0.1842 | 0.1185 | −0.3102 | 0.9080 | 0.84 [0.657] |
| MOL | 0.0247 | 0.1450 | 0.0814 | 0.4893 | 1.8950 * | 3.53 [0.171] |
| PEP | 0.0531 | 0.2153 | 0.1156 | 0.2521 | −0.4831 | 0.74 [0.692] |
| PGE | 0.0037 | 0.2147 | 0.1281 | 1.3958 *** | 6.3849 *** | 42.26 [0.000] |
| PGNIG | 0.0171 | 0.1311 | 0.0814 | 0.1866 | −0.4979 | 0.63 [0.731] |
| PHOTON | 0.1184 | 0.4135 | 0.1686 | 1.0395 *** | 0.5378 | 4.95 [0.084] |
| PKNORLEN | 0.0343 | 0.1596 | 0.1013 | −0.4338 | −0.2506 | 1.05 [0.591] |
| SERINUS | −0.0059 | 0.6034 | 0.1869 | 4.3972 *** | 21.0644 *** | 470.82 [0.000] |
| TAURONPE | 0.0151 | 0.2528 | 0.1135 | 2.7819 *** | 11.2271 *** | 141.77 [0.000] |
| UNIMOT | 0.1623 | 0.4857 | 0.1805 | 1.0388 *** | 0.4761 | 4.92 [0.086] |
| ZEPAK | −0.0140 | 0.1800 | 0.1331 | 0.1359 | 0.1126 | 0.09 [0.953] |
Notes: —mean return; —standard deviation; —semi-deviation; —asymmetry; —kurtosis; J-B—Jarque–Bera normality test; *, **, ***, denotes statistical significance at 10%, 5%, and 1%, respectively.
Table 5.
Summary statistics of energy companies’ quarterly ROA.
| Company | J-B Test | |||||
|---|---|---|---|---|---|---|
| BEDZIN | −1.0166 | 4.7542 | 3.8641 | −1.0944 *** | 3.5672 *** | 15.24 [0.000] |
| BOGDANKA | 1.1447 | 3.1591 | 2.2009 | 0.3751 | 12.8530 *** | 141.48 [0.000] |
| CEZ | 0.5649 | 0.7240 | 0.5225 | −0.2172 | −0.2023 | 0.38 [0.828] |
| ENEA | 0.3919 | 1.9712 | 1.8451 | −2.8326 *** | 8.2529 *** | 93.05 [0.000] |
| ENERGA | 0.5069 | 1.6852 | 1.5737 | −3.0787 *** | 10.2000 *** | 130.57 [0.000] |
| INTERAOLT | 5.8595 | 3.1843 | 2.1607 | 0.4242 | 0.6278 | 0.95 [0.622] |
| JSW | −0.0789 | 4.7176 | 4.0036 | −2.4108 *** | 10.3427 *** | 116.58 [0.000] |
| KOGENERA | 1.0500 | 2.0977 | 1.4501 | 0.0910 | −0.3040 | 0.29 [0.865] |
| LOTOS | 0.5931 | 2.2780 | 1.9324 | −1.6125 *** | 3.6487 *** | 22.05 [0.000] |
| MOL | 0.6840 | 2.5394 | 2.4005 | −3.9320 *** | 18.1725 *** | 354.23 [0.000] |
| PEP | 0.4222 | 1.5403 | 1.0118 | 1.3143 *** | 7.1254 *** | 116.16 [0.000] |
| PGE | 0.3165 | 2.6239 | 2.4497 | −2.9919 *** | 9.4920 *** | 42.26 [0.000] |
| PGNIG | 1.5395 | 1.6219 | 0.7829 | 2.8375 *** | 11.2537 *** | 143.69 [0.000] |
| PHOTON | −0.6742 | 1.3792 | 0.9546 | 0.2212 | −0.0036 | 0.27 [0.874] |
| PKNORLEN | 1.4167 | 2.8174 | 2.5049 | −2.6080 *** | 9.6978 *** | 109.88 [0.000] |
| SERINUS | −3.1510 | 5.7026 | 4.9565 | −1.6893 *** | 3.4101 *** | 21.80 [0.000] |
| TAURONPE | −0.0183 | 2.2630 | 2.0890 | −2.6750 *** | 7.6425 *** | 80.81 [0.000] |
| UNIMOT | 1.3213 | 1.2451 | 0.9437 | −0.3877 | −0.2770 | 0.90 [0.636] |
| ZEPAK | −1.7731 | 6.7566 | 6.4966 | −3.5532 *** | 13.8201 *** | 220.14 [0.000] |
Notes: —mean ROA; —standard deviation for ROA; —semi-deviation for ROA; —asymmetry; —kurtosis; J-B—Jarque–Bera normality test; ***, denotes statistical significance at 10%, 5%, and 1%, respectively.
Table 6.
Market and accounting beta coefficients for energy companies.
| Company | ||||
|---|---|---|---|---|
| BEDZIN | 0.5575 | 0.4383 | 0.5169 | 0.3284 |
| BOGDANKA | 1.5072 | 1.5338 | 1.6034 | 1.9771 |
| CEZ | 0.7982 | 0.7209 | 0.1297 | 0.0290 |
| ENEA | 1.6462 | 1.4381 | 1.0764 | 1.3121 |
| ENERGA | 0.7938 | 0.7555 | 0.2253 | 0.2640 |
| INTERAOLT | −0.0643 | −0.1273 | 0.3878 | 0.0903 |
| JSW | 1.8200 | 1.8604 | 3.6482 | 4.0125 |
| KOGENERA | 0.7061 | 0.6361 | 0.1815 | −0.2470 |
| LOTOS | 1.2369 | 1.1143 | 1.2966 | 1.4013 |
| MOL | 0.8772 | 1.0099 | 1.9963 | 2.4454 |
| PEP | 0.5912 | 0.4982 | −0.1424 | −0.1732 |
| PGE | 1.9347 | 1.7777 | 0.3599 | 0.1593 |
| PGNIG | 0.8688 | 0.7801 | 0.8078 | 0.5049 |
| PHOTON | 1.2543 | 1.1846 | 0.5316 | 0.6287 |
| PKNORLEN | 1.1721 | 1.1169 | 1.9379 | 2.0057 |
| SERINUS | 0.7978 | 1.3359 | 0.4667 | 0.6088 |
| TAURONPE | 1.9263 | 1.3076 | 1.6653 | 1.8364 |
| UNIMOT | 0.9910 | 1.0245 | −0.0376 | −0.1106 |
| ZEPAK | 0.4665 | 0.4204 | 4.4310 | 5.5692 |
Notes: —beta coefficient; —downside beta coefficient of Harlow–Rao formula; —accounting beta coefficient for ROA; —downside accounting beta coefficient for ROA.
Table 7.
Correlation coefficient between risk measures for energy companies.
| Risk Measure | ||||||||
|---|---|---|---|---|---|---|---|---|
| 1 | ||||||||
| 0.923 *** | 1 | |||||||
| 0.207 | 0.423 * | 1 | ||||||
| 0.288 | 0.468 ** | 0.872 *** | 1 | |||||
| 0.223 | 0.227 | 0.008 | 0.177 | 1 | ||||
| 0.212 | 0.229 | 0.033 | 0.208 | 0.992 *** | 1 | |||
| −0.149 | −0.002 | 0.267 | 0.390 * | 0.634 *** | 0.637 *** | 1 | ||
| −0.084 | 0.048 | 0.247 | 0.359 | 0.682 *** | 0.695 *** | 0.981 *** | 1 |
Notes: *, **, ***, denotes statistical significance at 10%, 5% and 1%, respectively.
Table 8.
Estimates of the relationship between total market risk and total accounting risk.
| Variable | OLS | Quantile Regression | ||
|---|---|---|---|---|
| 25% | 50% | 75% | ||
| Const. | 0.1793 ** | 0.1381 *** | 0.1631 *** | 0.0730 |
| t-Student | 2.710 | 11.390 | 3.902 | 1.667 |
| 0.0232 | 0.0066 * | 0.0129 | 0.0800 *** ↑ | |
| t-Student | 1.143 | 1.759 | 1.006 | 5.951 |
Notes: *, **, ***, denotes statistical significance at 10%, 5% and 1%, respectively. ↑ sign denotes that the quantile coefficient is outside the OLS confidence interval.
Table 9.
Estimates of the relationship between the total market downside risk and total accounting downside risk.
Table 9.
Estimates of the relationship between the total market downside risk and total accounting downside risk.
| Variable | OLS | Quantile Regression | ||
|---|---|---|---|---|
| 25% | 50% | 75% | ||
| Const. | 0.1050 *** | 0.0813 *** | 0.1076 *** | 0.0973 *** |
| t-Student | 6.992 | 8.380 | 21.55 | 6.924 |
| 0.0086 | 0.0080 ** | 0.0039 ** | 0.0191 *** | |
| t-Student | 1.585 | 2.269 | 2.167 | 3.556 |
Notes: **, ***, denotes statistical significance at 10%, 5% and 1%, respectively.
Table 10.
Estimates of the relationship between systematic market risk and systematic accounting risk.
Table 10.
Estimates of the relationship between systematic market risk and systematic accounting risk.
| Variable | OLS | Quantile Regression | ||
|---|---|---|---|---|
| 25% | 50% | 75% | ||
| Const. | 0.9383 *** | 0.7163 *** | 0.7441 *** | 1.1578 *** |
| t-Student | 5.561 | 6.902 | 9.237 | 9.219 |
| 0.0974 | −0.0564 | 0.2209 *** | 0.1815 ** | |
| t-Student | 0.942 | −0.887 | 4.479 | 2.361 |
Notes: **, ***, denotes statistical significance at 10%, 5% and 1%, respectively.
Table 11.
Estimates of the relationship between systematic market downside risk and systematic accounting downside risk.
Table 11.
Estimates of the relationship between systematic market downside risk and systematic accounting downside risk.
| Variable | OLS | Quantile Regression | ||
|---|---|---|---|---|
| 25% | 50% | 75% | ||
| Const. | 0.9011 *** | 0.6704 *** | 0.7126 *** | 1.0591 *** |
| t-Student | 6.077 | 13.360 | 11.690 | 12.570 |
| 0.0753 | 0.1388 *** | 0.2861 *** ↑ | 0.1997 *** | |
| t-Student | 0.970 | 5.289 | 8.970 | 4.533 |
Notes: ***, denotes statistical significance at 10%, 5% and 1%, respectively. sign denotes that the quantile coefficient is outside the OLS confidence interval.
Publisher’s Note: MDPI stays neutral with regard to jurisdictional claims in published maps and institutional affiliations. |
© 2022 by the authors. Licensee MDPI, Basel, Switzerland. This article is an open access article distributed under the terms and conditions of the Creative Commons Attribution (CC BY) license (https://creativecommons.org/licenses/by/4.0/).
Share and Cite
MDPI and ACS Style
Rutkowska-Ziarko, A.; Markowski, L. Accounting and Market Risk Measures of Polish Energy Companies. Energies 2022, 15, 2138. https://0-doi-org.brum.beds.ac.uk/10.3390/en15062138
AMA Style
Rutkowska-Ziarko A, Markowski L. Accounting and Market Risk Measures of Polish Energy Companies. Energies. 2022; 15(6):2138. https://0-doi-org.brum.beds.ac.uk/10.3390/en15062138
Chicago/Turabian StyleRutkowska-Ziarko, Anna, and Lesław Markowski. 2022. "Accounting and Market Risk Measures of Polish Energy Companies" Energies 15, no. 6: 2138. https://0-doi-org.brum.beds.ac.uk/10.3390/en15062138
Note that from the first issue of 2016, this journal uses article numbers instead of page numbers. See further details here.