Article

Reserve-Constrained Unit Commitment Considering Adjustable-Speed Pumped-Storage Hydropower and Its Economic Effect in Korean Power System

1
Department of Electronic and Electrical Engineering, Hongik University, Seoul 04066, Korea
2
Master’s Space, Gwangmyeong-si 14348, Korea
*
Author to whom correspondence should be addressed.
Submission received: 3 January 2022 / Revised: 10 March 2022 / Accepted: 18 March 2022 / Published: 24 March 2022

Abstract

:
The Korean government has declared the goal of net-zero-carbon emissions with a focus on renewable energy expansion. However, a high proportion of baseload generators and an increasing proportion of variable renewable energy (VRE) may cause problems in the power system operation owing to the low cycling capability of baseload generators and variability of VRE. To maintain system reliability, the government is planning to construct pumped-storage hydropower (PSH) plants, which can provide flexibility to the system. This study evaluated the operating cost savings obtained by different types of PSH: the adjustable-speed PSH (AS-PSH) and fixed-speed PSH (FS-PSH), based on the duck-curve phenomenon and the increase in spinning reserve requirement. In this study, the reserve-constrained unit commitment was formulated using a mixed-integer-programming considering the operational characteristics of AS-PSH and conventional generators. To consider the duck-shaped net-load environment, the projected VRE output data were calculated through physical models of wind turbines and photovoltaic modules. The operating costs for the non-PSH, FS-PSH, and AS-PSH construction scenarios were KRW 43,129.38, 40,038.44, and 34,030.46, respectively. The main factor that derived this difference was determined to be the primary reserve of AS-PSH’s pumping mode.

1. Introduction

1.1. Research Motivation

The Korean government has declared the goal of achieving net-zero carbon emissions by 2050. Therefore, Korea is planning to significantly increase the proportion of renewable energy resources. In the generation expansion plan, which determines the Korean investment in power generation facilities, 2030 was set as the target year to ensure that 20% of the annual power is generated by renewable energy resources [1]. Among the renewable energy resources, 75% is expected to be generated from wind and solar energy, which are variable renewable energy (VRE) resources. However, VRE resources may cause difficulties in balancing the supply and demand within a power system owing to their output variability and uncertainty [2]. Specifically, solar power generation makes the system net-load have the characteristics of a duck-curve, which is a concept first introduced by the California Independent System Operator [3]. It has a duck-shaped net-load pattern, which is carried by conventional generators. The VRE’s long-term and short-term variability require increased cycling capabilities of the generator and operating reserves, respectively. Therefore, it is difficult for the system operator to maintain system reliability while maintaining the operating proportion of baseload generators during the daytime.
In 2020, the first output reduction of nuclear power generators was conducted by the system operator to maintain reliability in the Korean power system. Shinkori nuclear power generators (#3 and #4) have a total capacity of 2800 MW. The power system operator was scheduled to reduce the total output power to 600 MW for 8 h, and the scheduled output power was maintained for 13 h. The system operator predicted that the system demand was lower than usual owing to long special holidays and analyzed that it would be difficult to meet the system frequency maintenance range if a nuclear power generator with the maximum output (1400 MW) is tripped. There are similar issues with implementing net-zero carbon emissions. Although the coal-fired and nuclear power generators are expected to gradually phase out, the proportion of these baseload generators is still expected to be high in 2030. It is especially difficult to expect frequent output adjustments or startup/shutdown operations with nuclear power generators. In addition, existing nuclear power generators in Korea do not provide frequency response capabilities. Accordingly, situations can occur where several nuclear power generators would need to be operated at a minimum generation level or even excluded from scheduling. In those cases, the operating cost of the power system can increase significantly, and the existing baseload generators may even become stranded assets.
Grid-scale energy storage systems, such as battery energy storage systems (BESS) and pumped-storage hydropower (PSH), can provide solutions to operating costs by mitigating the effect of the duck-curve phenomenon of the net-load and increasing the utilization of nuclear power generators. Although BESSs are capable of providing load shifting and fast frequency responses, PSH is technically proven and more desirable in that it has a large energy capacity and the capability of providing operating reserves. The Korean government is planning to build PSH plants [1]. However, there are three types of PSH plants: fixed-speed (FS), adjustable-speed (AS), and ternary (T) types. As a quick-start resource, a conventional FS-PSH can be rapidly deployed to the system in case of a generator’s forced outage or insufficient reserve [4]. AS-PSHs and T-PSHs can provide the same operational advantages as FS-PSHs. In addition, AS-PSH can control its rotor speed using power electronic devices, which enables a rapid power adjustment in the generating and pumping modes and is therefore expected to further improve the flexibility of the power system. Given that the pump and turbine of T-PSH can rotate simultaneously on the same shaft in the same direction, it has the advantage of adjusting the pumping power in the hydraulic short-circuit mode and requires less time to transition between the generating and pumping modes [5]. Therefore, we needed to decide which type will be of benefit to our system when they are constructed, which was the motivation of our research. In this paper, we focused on the economic effect obtained by AS-PSH using the unit commitment (UC) optimization approach in a future Korean power system. In the case of T-PSH, there are three modes: generating mode, pumping mode, and short-circuit mode, which each have different operational characteristics. Therefore, future research is needed to model the operational characteristics of T-PSH in UC formulation.

1.2. Related Research

Typically, PSH charges at night when the system demand is low and discharges during peak-demand hours. However, owing to the large-scale integration of VREs, the economic benefits that can be obtained from the PSH have been studied from new perspectives [6,7,8,9,10,11,12]. In [6], the impact of reducing the operating cost achieved by the input of FS-PSH in a power system with high wind energy was analyzed, and FS-PSH was found to reduce the scheduling cost by reducing the startup and shutdown costs of thermal power generators. In [7], the effect of reducing operating costs through FS-PSH in a wind energy environment was analyzed through a genetic algorithm. The paper derived the reduction in energy purchase cost and environmental cost of the power system. In [8], it was found that as the initial upper reservoir volume of PSH increases, the overall operating cost consisting of grid power purchase cost, demand response program purchase cost, and solar power sale income decreases. In [9], the effect of reduction in the wind power curtailment and the total operating cost consisting of energy cost, ancillary service cost, and startup cost were derived using FS-PSH as a reserve resource. In [10], the energy cost in a standalone hybrid wind/solar/biomass system was lower in the scenario when PSH was the input than when battery storage was the input. In [11], the authors evaluated the potential contribution of PSH to the Greek power system’s future scenario. Through UC simulation, it was deduced that the PSH contributes to energy balance by absorbing the over-generation of wind and solar energy. Ref. [12] proposes a stochastic scheduling approach considering price-based demand response and PSH in a microgrid. In [12], the operating cost was reduced by PSH’s discharging at the peak time and charging at the off-peak time. However, given the proposed methods in [6,7,8,9,10,11,12], it is difficult to verify the economic contribution obtained from the flexibility of AS-PSH.
The reduction in operating costs due to the flexibility of AS-PSH was studied in [13,14,15]. In [13], the dynamic dispatch optimization problem was solved with the reserve and network constrained in a wind energy environment, and an economic analysis was performed on FS-PSH, T-PSH, and AS-PSH. However, in [13], it was difficult to verify probable changes in operating conditions within the duck-curve phenomenon, given that the influence on solar energy was not considered. In [14], the economic impact of AS-PSH was analyzed under the conditions of minimizing fuel, cycling, and startup cost. It was modeled as having an operating range in the pumping mode and was derived to reduce the operating cost. In [15], the cost benefits obtained with AS-PSH from the viewpoint of daily operation were compared with those of FS-PSH. However, the study focused on the AS-PSH’s flexible operating range in pumping. Therefore, it is still necessary to focus on the reserve capability of AS-PSH that can respond to VRE’s short-term variations.
In addition to PSH-related studies, UC optimization research is ongoing from various perspectives. Authors in [16,17,18] developed methods to efficiently find the UC solution at a high time resolution to cope with the variability and intermittent nature of renewable energy. Ref. [16] proposes a thermal unit commitment algorithm through dynamic programming that combines a priority list method to perform UC and ED at a time resolution of less than 60 min. In [17], the authors pointed out that the branch and cut strategy may exceed the allowable value in the sub-hourly UC problem due to large numbers of virtual transactions. In [17], the authors reduced the calculation time by including the concept of ordinal-optimization in surrogate absolute-value Lagrangian relaxation [19]. Ref. [18] proposes an approach to reduce calculation time by implementing soft constraints of reserve and transmission capacity within the surrogate absolute-value Lagrangian relaxation framework. References [20,21] analyzed the impact of greenhouse gas emissions on the UC problem. In [20], the authors formulated the environmental UC problem considering greenhouse gas emission constraints and carbon taxes in the existing UC approach. In [21], the authors adopted the piecewise linearized greenhouse gas function of the generator’s loading level to the UC based on the MIP method. The greenhouse gas function was applied in the form of cost by applying a weighting factor.

1.3. Contribution

Previous studies on PSH verified its effects on the operating cost savings of power systems with integrated VRE and PSH. However, the majority of these studies focused on the traditional FS-PSH’s contribution to power systems in terms of energy saving. The other studies [13,14,15] on AS-PSH did not consider its capability to supply primary and secondary reserves, particularly in the pumping mode. In a system with a considerable amount of solar energy resources, system operators need large operating reserves, and most generation sources need to be off-lined owing to an over-generation; on the other hand, most PSHs are required to operate in pumping mode. Therefore, to analyze the economic contribution of AS-PSH in a power system with a high proportion of renewable energy resources, it is necessary to model the AS-PSH to provide various reserves, including the primary reserve. Based on the above discussion, the purpose of this study is to verify the economic contribution of AS-PSH’s reserve capability compared with that of FS-PSH in the Korean power system.
To achieve the objective of this study, a reserve-constrained UC (RCUC) was formulated using mixed-integer-programming (MIP) to consider the cycling characteristics of conventional thermal generators in the duck-curve environment and reflect the Korean operating reserve services. The primary, secondary, and regulation reserves defined by the Korean power market were modeled in the RCUC formulation. This formulation can be widely used in other power systems with a similar scheme of system frequency restoration by primary and secondary reserves. The time-series data of the VRE were calculated through physical models, including the output model of wind turbines and photovoltaic (PV) modules. The short-term variation of the VRE was extracted from the time-series data. The increment in the spinning reserves was considered under the n-sigma criterion, assuming that the distribution of the VRE’s short-term output variation follows a Gaussian distribution. With the operation range set in the generating and pumping modes, the AS-PSH was modeled to provide primary, secondary, and regulation reserves. Simulations were performed on the 2030 generation mix in Korea. Scenarios were set depending on the types of new PSH plants, namely, non-PSH, FS-PSH, and AS-PSH plants. The simulation was implemented using the optimization solver Xpress-MP.
The main contributions in this paper are listed below:
  • An MIP-based RCUC problem was formulated. FS-PSH was modeled to provide the primary and secondary/regulation reserves in the generation mode, while AS-PHS was modeled to provide the primary and the secondary/regulation reserve both in the generating and pumping modes.
  • A comparative analysis was performed on the Korean power system considering the generation mix in 2030 using the developed RCUC. The Korean power system is expected to consist of more than 200 large generators, including eighteen nuclear power generators with a capacity of 20.4 GW and a peak demand of 110 GW in 2030.
  • The comparative study showed that the AS-PSH was superior to the FS-PSH in terms of operating costs, which are mainly dependent on the procurement of primary and secondary reserves. It is partly because the system is isolated and partly because the share of non-flexible nuclear power generators is high. We verified that the most critical factor is the capability of supplying the primary reserve.

2. Variable Renewable Energy in Future Korean Power System

Before analyzing the influence of the new PSH on the future power system in Korea, a methodology to generate the time-series data of the 2030 VRE is introduced. Based on the data, the increment in the spinning reserve due to the short-term variation of the VRE was estimated.

2.1. Modeling of Variable Renewable Energy’s Output Power

The 2030 target capacity of the VRE is about 54.2 GW, and wind and solar energy account for 17.7 GW and 36.5 GW, respectively [1]. Based on the capacity of the VRE to be installed, the 2030 output power can be calculated using historic regional meteorological data. From the Korea Meteorological Administration (KMA), the regional wind speed, solar irradiance, and temperature data measured every minute were used [22].

2.1.1. Wind Energy Output Power Model

To calculate the total output power of wind energy in 2030, it is necessary to determine the location and capacity of each wind farm. To solve the problem, it was assumed that the total capacity of wind energy in which the location is not determined would be distributed to areas with high energy potentials. Therefore, the capacity was distributed proportionally to the locations with high average annual wind speed. Finally, a total of 94 locations of the 2030 wind farms and their capacity were determined.
In a wind farm, each wind turbine is installed at a distance. Therefore, input data conversion was performed without applying the same wind speed to all wind turbines in the same wind farm. Each wind farm consists of N turbine units, and the wind speed after (n − 1) minutes is applied to calculate the output power of the nth wind turbine at time t.
P W F ( t ) = n = 1 N P W T , n ( t ) = n = 1 N P W T , n ( V h ( t n + 1 ) )
To calculate the output power of the wind turbine, Equations (2) and (3) were used [23]. For the convenience of calculation, each wind turbine group was modeled with one unit. The data in Table 1 were used for the specifications of onshore and offshore wind turbines [24].
P W T , n ( t ) = { 0 f o r   V h ( t n + 1 ) < V i n   a n d   V h ( t n + 1 ) > V o u t , P c u r v e f i t ( V h ( t n + 1 ) ) · C W F P r · N f o r   V i n V h ( t n + 1 ) V r , C W F N f o r   V r < V h ( t n + 1 ) V o u t .
P c u r v e f i t ( V h ( t ) ) = a 1 V h ( t ) 6 + a 2 V h ( t ) 5 + a 3 V h ( t ) 4 + a 4 V h ( t ) 3 + a 5 V h ( t ) 2 + a 6 V h ( t ) + a 7
Given that wind speed increases with an increase in altitude, the wind speed used as input data for Equations (2) and (3) should be measured at the tower height. However, the wind speed data of the KMA are measured at an altitude of 10 m. Therefore, using Equation (4) based on the wind power law, we estimated wind speed data at the tower height [25].
V h = V m ( Z h Z m ) α

2.1.2. Solar Energy Output Power Model

By 2030, 36.5 GW of PV plants is expected to be installed. As in the case of wind power, it is necessary to determine the capacity and the location of each PV plant. However, most PV plants are expected to be installed at a small scale and dispersed over the nation. Therefore, it is necessary to estimate insolation data for areas where KMA does not observe the insolation. To address this problem, we expanded the number of observation stations using a two-dimensional interpolation method [26]. The capacity of each PV plant was assigned in proportion to historical accumulated solar insolation.
The solar insolation data were converted to the irradiance data. The PV output power, which is determined by the irradiance and temperature on the PV module surface, can be expressed as Equation (5) [27].
P P V , M = P P V , M * · G G * [ 1 γ · ( T C 25 ) ]
Given that each PV plant consists of PV arrays of several PV modules, the output power of each PV plant can be calculated using Equation (6).
P P V = P P V , M · C P V / P P V , M *
Given that the temperature on the PV module surface used in Equation (5) is difficult to measure, it can be approximated using Equation (7) based on the irradiance and the air temperature [28].
T C = T A + T N O C T 20 800 G

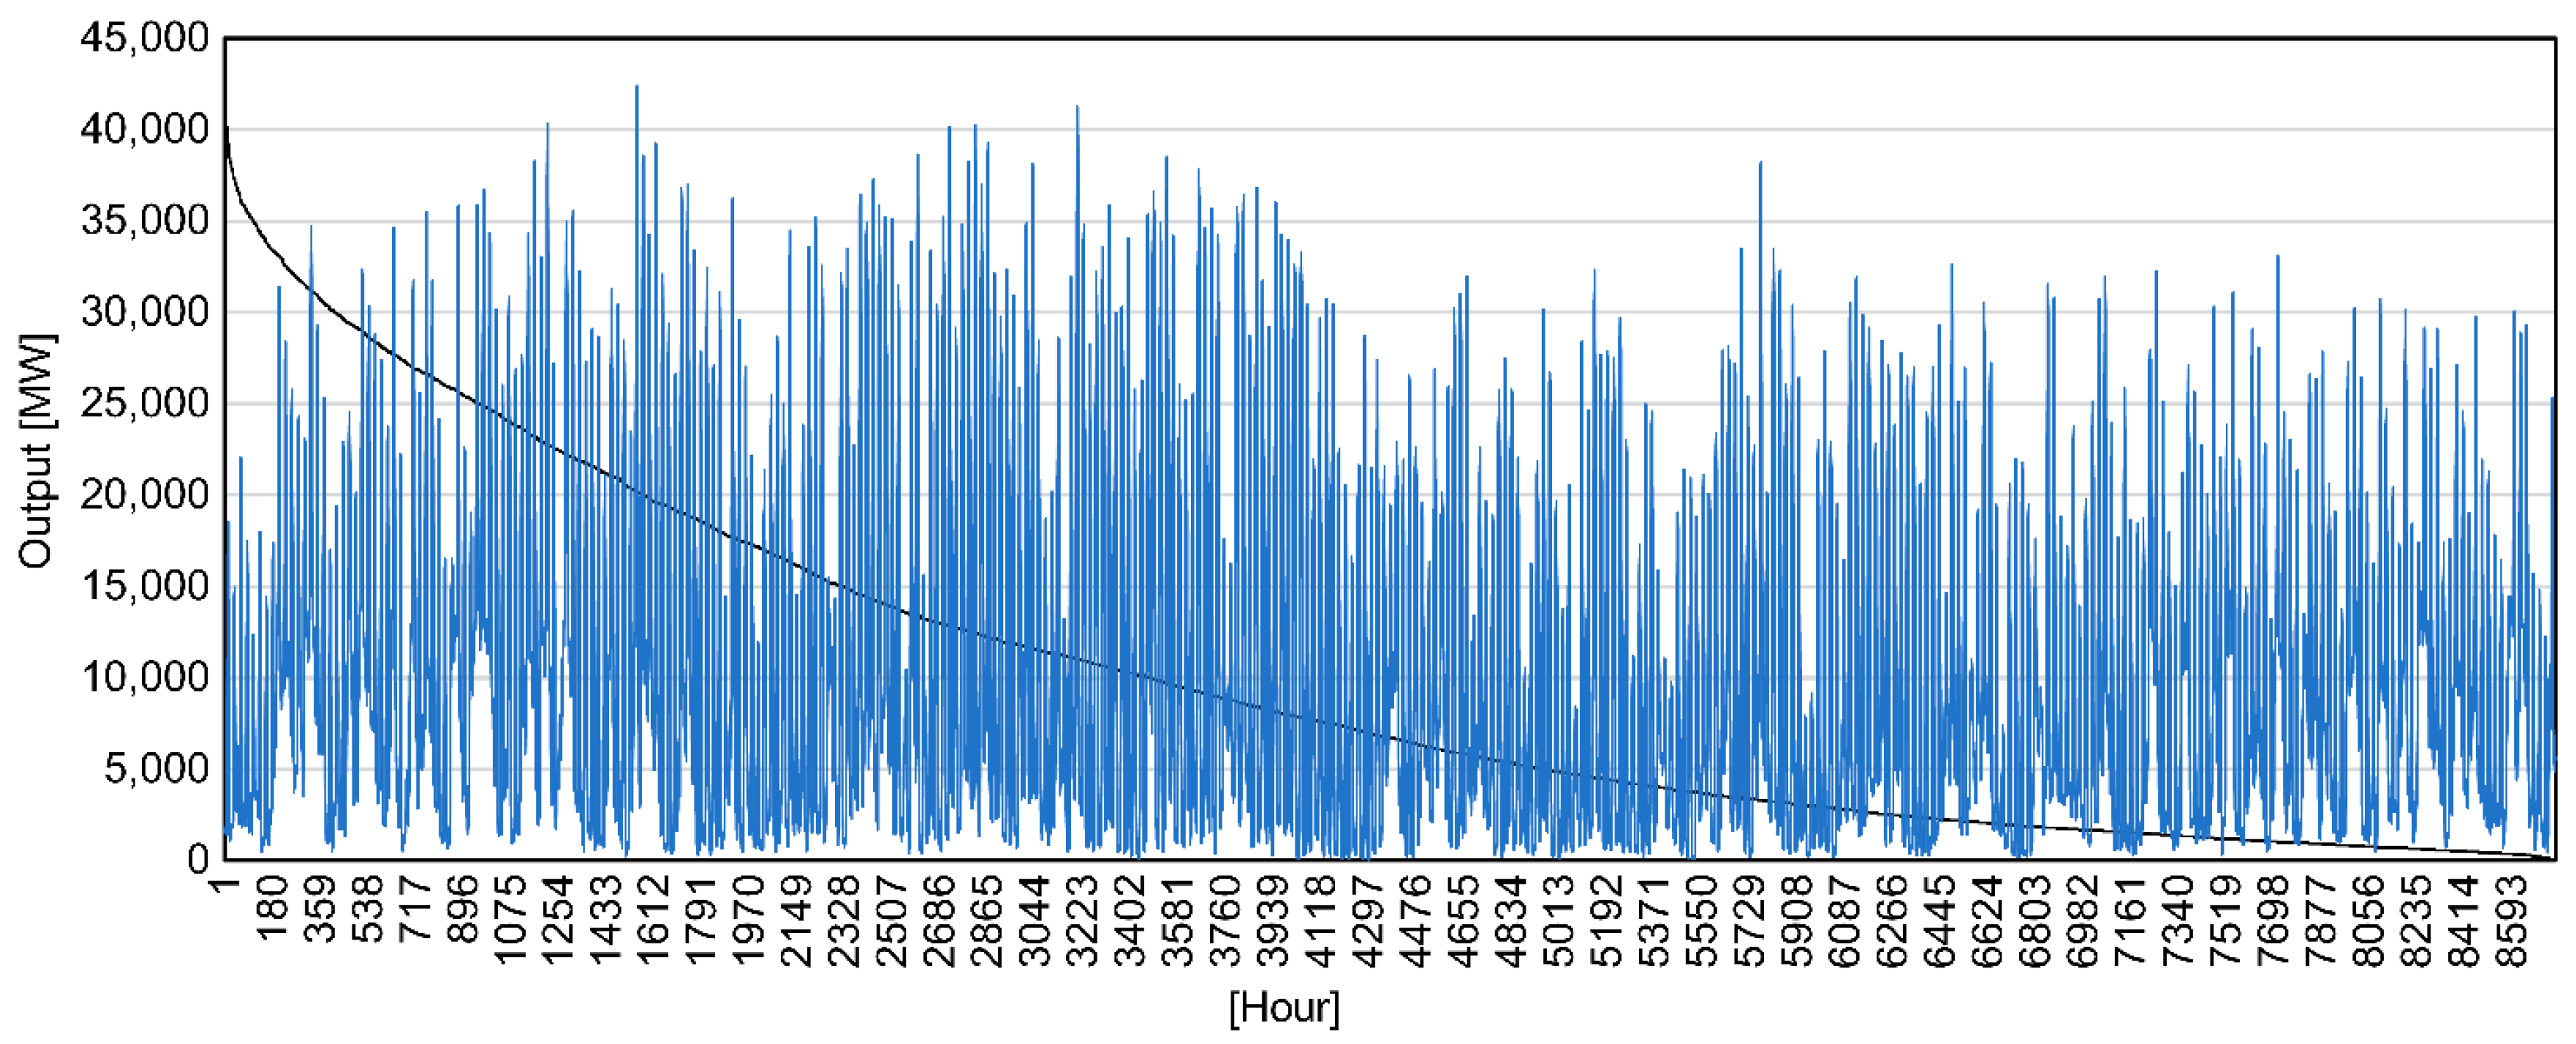
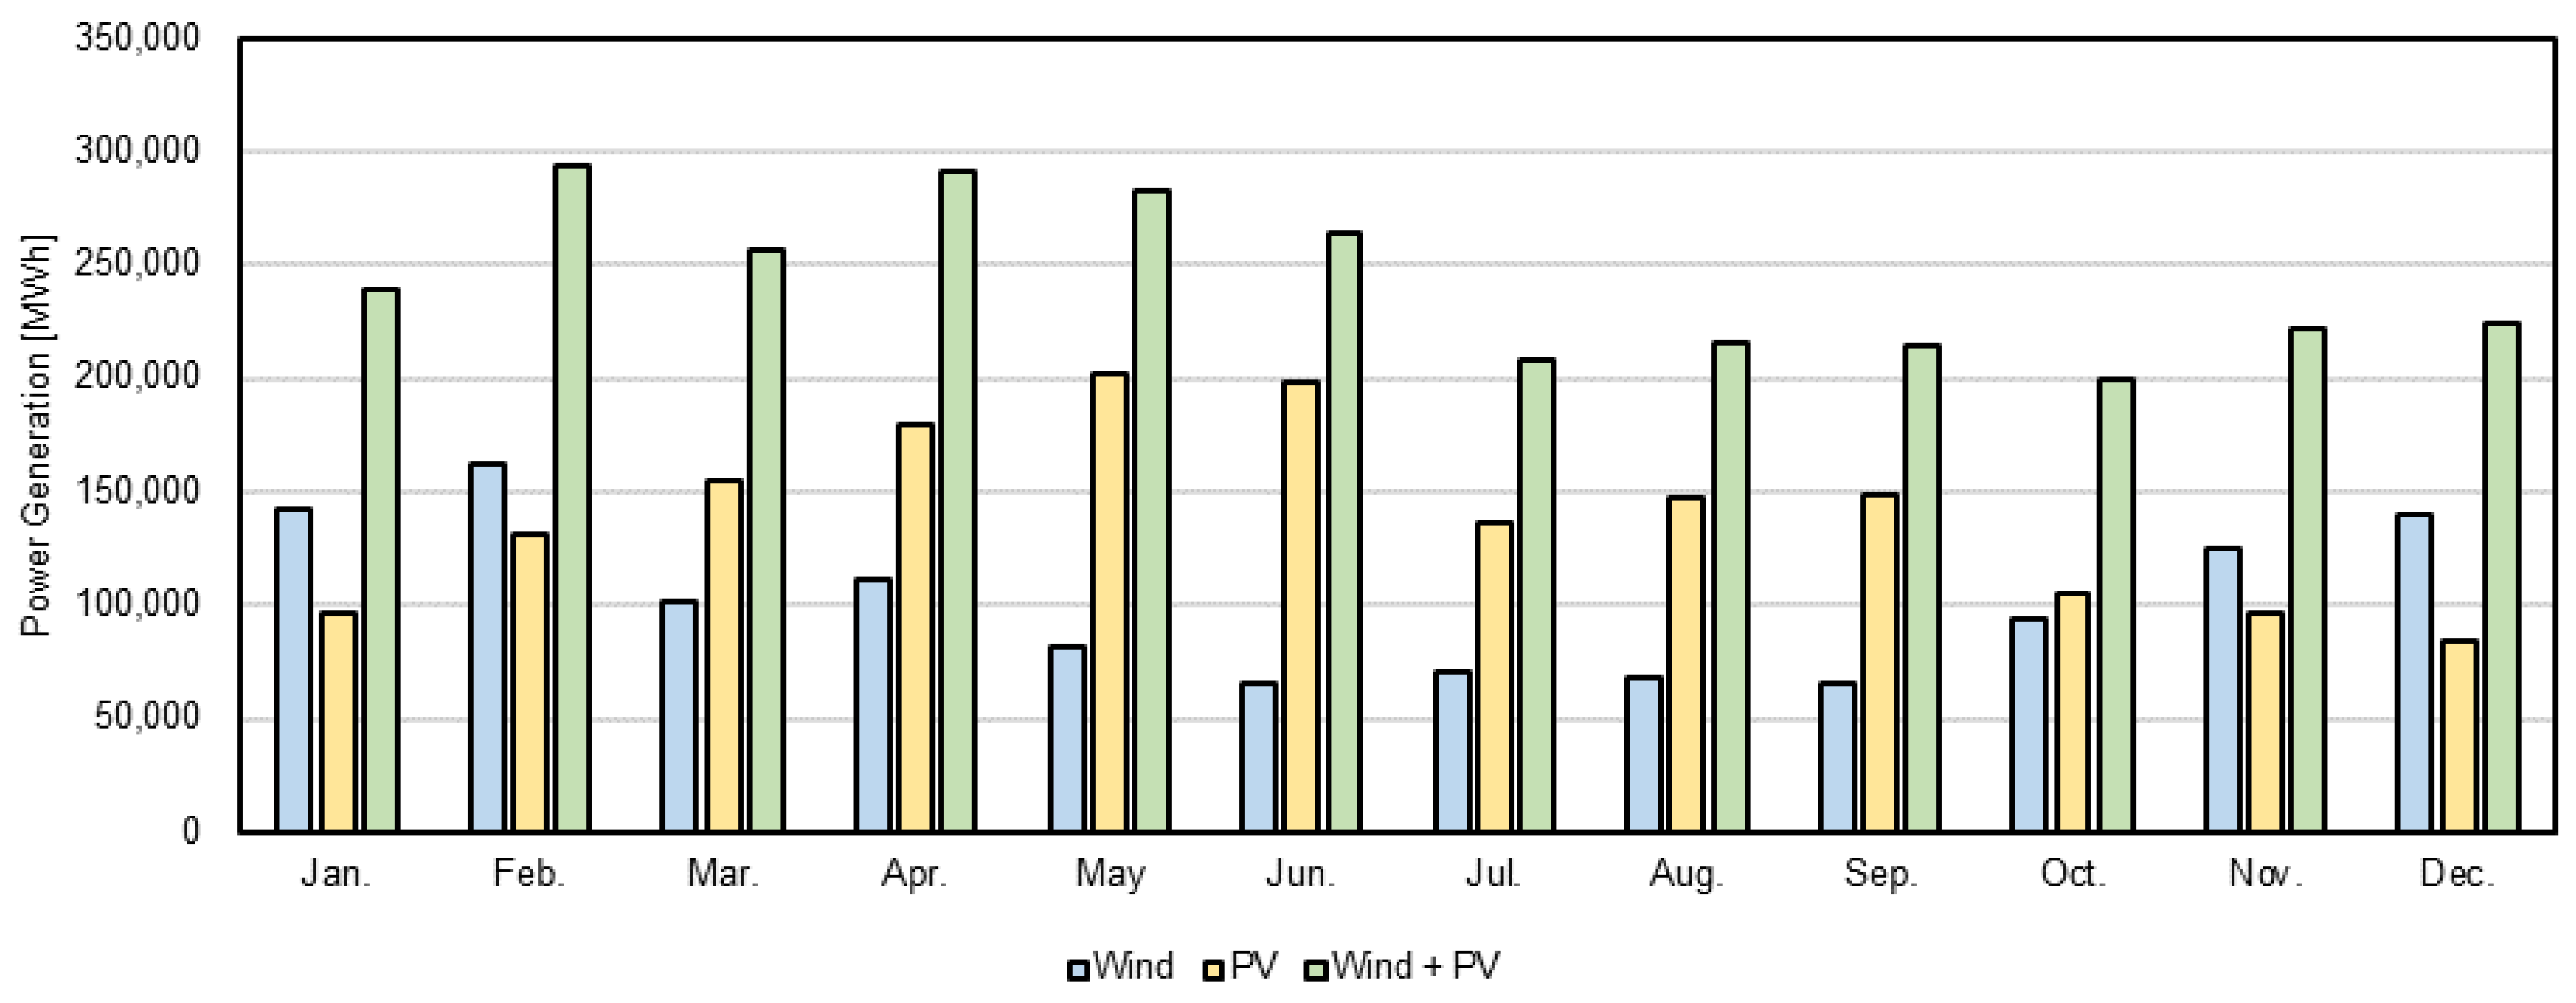
2.2. Characteristics of Variable Renewable Energy in Korea

In this subsection, the output power characteristic of the 2030 VRE is described. Figure 1 depicts the calculated time-series output power of the VRE and its duration curve for the year 2030.
Figure 2 presents the average daily wind and solar power generation of each month. The average daily wind power generation is highest in winter and lowest in summer. The average daily solar power generation is highest in spring and lowest in winter. Based on these results, the average daily VRE power generation is highest in spring and lowest in autumn.
Figure 3 illustrates the hourly average output power for wind and solar energy throughout the year 2030. Wind energy demonstrates the highest output power between 14:00 and 15:00, and the highest PV output power and both wind and solar output power are between 12:00 and 13:00.

2.3. Influence of Variable Renewable Energy on Reserve Requirements of the Korean Power System

Traditionally, most power system operators have used the N−1 contingency method, which secures a reserve equal to one or more largest units [29]. The system operator of the Korean power system uses the traditional reserve procurement approach to cover the largest generator outage (1400 MW). Table 2 outlines the operating reserve requirements for the Korean power market [30].
The primary reserve prevents the system frequency from dropping immediately after an instantaneous event, such as a generator’s forced outage by the synchronized generator’s governor response, and the secondary reserve is used to restore the system frequency to the nominal frequency (60 Hz). The required primary reserve in Table 2 was calculated based on the value at the time of a quasi-steady state of the system frequency after the outage of the largest unit (1400 MW) in Korea. In this process, an unused capacity of 1400 MW is required as the secondary reserve to restore the system frequency to the nominal frequency (60 Hz). Immediately after restoration to the nominal frequency by the secondary reserve, the primary reserve is automatically resecured. The regulation reserve is estimated as 700 MW to respond to non-instantaneous events, such as short-term load fluctuations. The tertiary reserve is secured by resources in the standstill state to cover the case of reserve shortages, and the quick-start reserve responds to load forecasting errors.
The unit capacity of VRE resources is lower than that of conventional generators, and the short-term variation of the VRE can influence the system frequency. Therefore, the traditional approach of securing a spinning reserve equal to one or more of the largest units is not effective, and it is necessary to adopt an approach that can cover the short-term variation of the VRE.
Based on the operating reserve concept presented in [2], we divided the VRE output fluctuation into event and non-event cases. The reserve for an event is assumed necessary for instantaneous events, such as generator outages and short-term output variations of VRE. These events can be covered by the governor response of the generator. The non-event reserve can be provided by the generator ramping capability according to AGC signals or manual operation. In this study, a 1 min variation in the VRE was assigned to the primary reserve and a 5 min variation to the secondary and regulation reserve. The 1 min and 5 min variations were calculated using Equations (8) and (9), respectively, based on the VRE output data calculated at 1 min intervals, as presented in the previous subsection.
P ( t ) P ( t 1 ) = P 1 min
P ( t ) P ( t 5 ) = P 5 min
As outlined in Table 3, the n-sigma criterion was used to calculate the increment in each spinning reserve requirement due to the output fluctuation of the VRE. The standard deviation σ refers to the time series variability of the VRE. Assuming that the output variability of the VRE follows a normal distribution, an additional reserve to cover ±σ of the variability can respond to 68% of the statistical data, a reserve of ±2σ to 95%, and that of ±3σ to 99.7% [31]. Table 3 presents the specifications of the method for allocating additional spinning reserve requirements under the assumption that the current spinning reserve requirement is maintained.
The simple arithmetic addition of the estimated reserve requirement for VRE to the existing reserve requirement for load variability can result in an overestimation, which can be costly. This problem can be solved by using geometric additions [32]. Figure 4 illustrates the method of calculating the primary reserve requirement secured through the governor response, and Figure 5 presents the calculation method for the requirement of the secondary reserve and regulation reserve activated by AGC signals.

3. RCUC Considering Adjustable-Speed Pumped-Storage Hydropower

This section introduces the RCUC formulation. Section 3.1 presents the features of AS-PSH. Section 3.2 presents the objective function for the optimization, which is to minimize the operating costs of the power system. Section 3.3 presents the constraints considering AS-PSH’s operational characteristics.

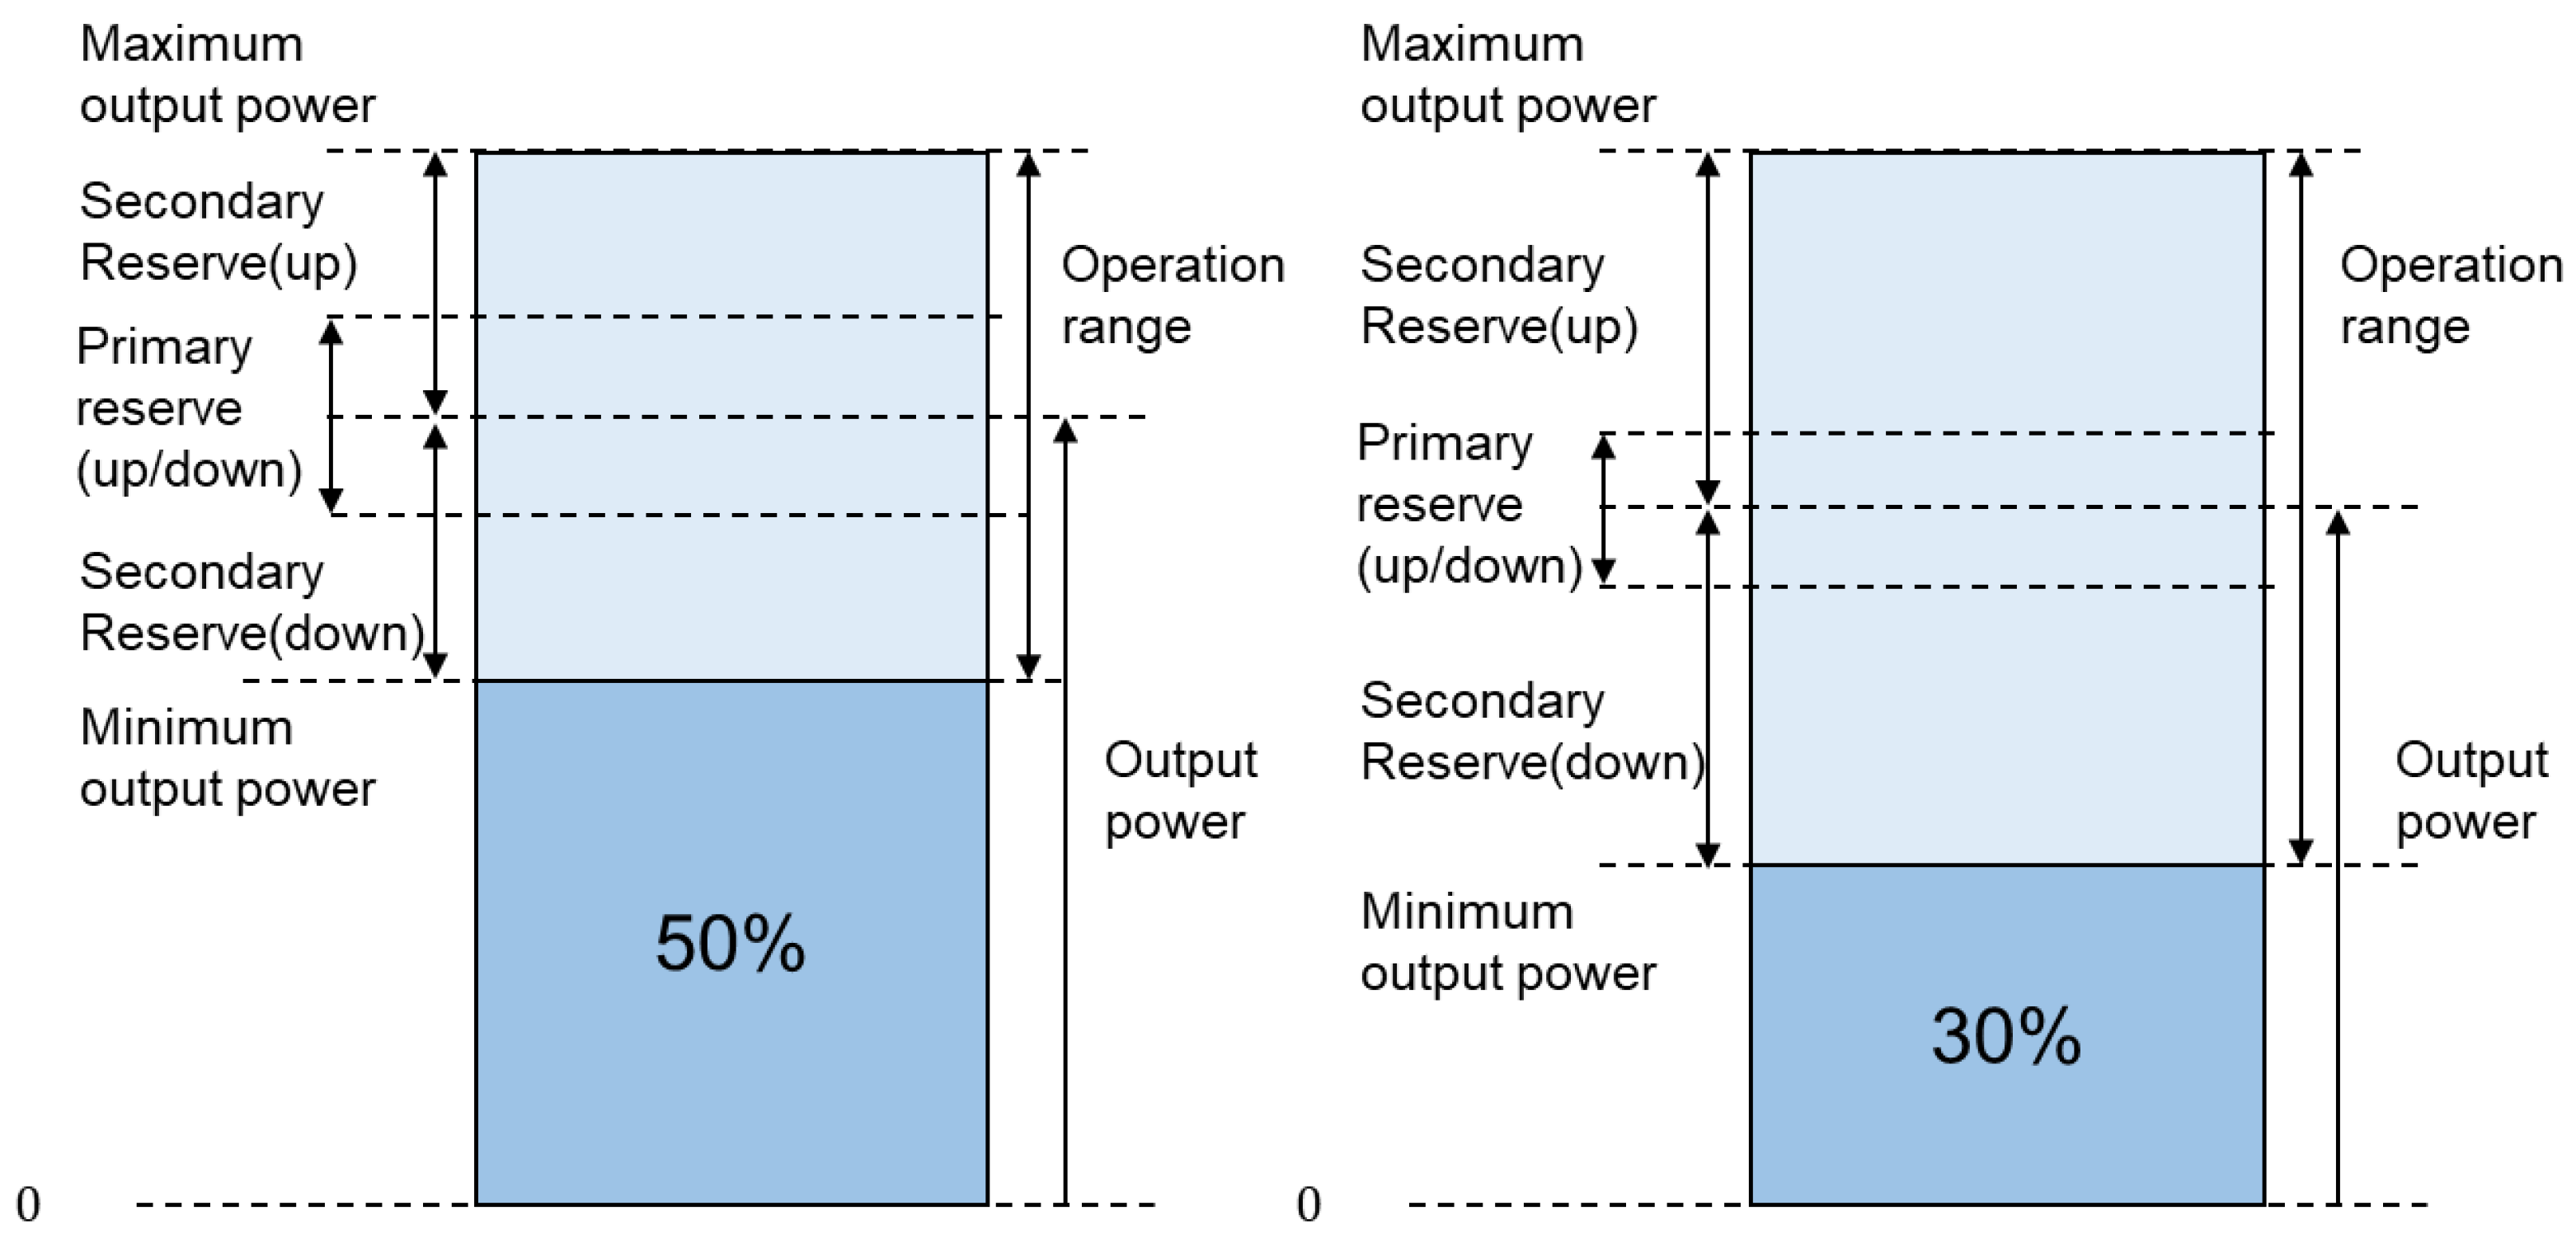
3.1. Flexibility of Adjustable-Speed Pumped-Storage Hydropower

AS-PSH is a resource that can provide a higher quality of flexibility to power systems than FS-PSH by adjusting the rotor speed and electrical output/input of the generator/motor. With respect to power system operations, AS-PSH has the following advantages when compared with FS-PSH.
(1)
AS-PSH can be operated over a wider operational range in the generating mode, and the input power can be controlled in the pumping mode.
(2)
AS-PSH can provide primary, secondary, and regulation reserves in the generating and pumping modes.
The critical factors for the advantages of AS-PSH in power system operation are its operation range and spinning reserve capacity. Therefore, it is necessary to determine the operation range and spinning reserve capacity of AS-PSH. In this study, the operation range and spinning reserve capacity were determined based on an investigation of the technical reports and AS-PSH plants in practice.
The operation range is defined by the difference between the minimum and maximum powers. The operation ranges of FS-PSH and AS-PSH were reviewed in reports [5] and [33], and the comparison is shown in Table 4. However, the operation ranges of practical PSH plants vary. For example, in the Kazunogawa PSH plant [34], Unit #4 is an AS-type, and Units #1 and #2 are FS-type. In the generating mode, the operation range of Unit #1 is wider than that of Units #1 and #2 by 32.5%. In the pumping mode, the operation range of Unit #1 is approximately 32%. In this study, the operation range of future AS-PSH plants was set as 30–100% in the generating mode and 60–100% in the pumping mode.
The primary reserve keeps the system frequency within operation range directly after a disturbance. Therefore, the capacity with which AS-PSH can instantaneously control the power within a few seconds was assumed to be the primary reserve. The range of the primary reserve was set based on the example of the AS-PSH in practical operation. Unit #4 of the Okawachi PSH in Japan is capable of a step response output change of 32 MW (10% of the maximum rated power) within 0.2 s in the generating mode, and 80 MW (20% of the maximum rated power) within 0.2 s in the pumping mode [35]. Accordingly, we set the range of the primary reserve to be secured by AS-PSH to 10% of the maximum rated power in the generating mode and 20% in the pumping mode. The range of secondary/regulation reserves can be set based on the capacity to control the power for several minutes. Given that AS-PSH has a high ramping capability, the maximum capacity of the secondary/regulation reserves was set as the difference between the minimum and maximum power. The operation and reserve range of each PSH type are shown in Figure 6 and Figure 7 and Table 5. The reserves were divided into upward and downward directions.

3.2. Objective Function to Minimize the Operating Cost of the Power System

To predict the output pattern of the conventional generators of the future power system, it was assumed that the generators produced an economic output under the spinning reserve constraints and generator cycling characteristics. Accordingly, we formulated an objective function to minimize the operating cost of the power system. The system operating cost was divided into the fuel and startup costs of the generator. To implement the constraints of the minimum output, minimum downtime, and minimum uptime of generators, the objective function containing integer variables can be defined as follows:
M i n :   i G U t = 1 T { F C i ( p i , t g ) + S T C i · u i , t }
In general, the power generation cost function is expressed as a quadratic function. However, in this study, we modeled the cost function of the quadratic function as a piecewise linearization function [36,37].

3.3. Constraints Considering AS-PSH

AS-PSH increases the total system load during its pumping mode and can provide primary, secondary, and regulation reserves in the pumping mode, which should be considered in the constraints. This subsection presents the constraints of the RCUC containing the modeling of AS-PSH.

3.3.1. Integer Variable Constraints

Constraints (11) and (12) represent the startup and shutdown states of a generator and prevent the simultaneous occurrence of the startup and shutdown states. Constraint (13) prevents the concurrent occurrence of the PSH generating and pumping modes.
u i , t d i , t = i i , t i i , t 1
u i , t + d i , t 1
i i , t + l i , t 1

3.3.2. Load Balance Constraints

At each hour, the total generated power and the difference between the load and VRE power were set as equal. In addition, considering the pumping input power of the PSH plants, the load balance constraint can be expressed by Constraint (14).
P t Load P t VRE + i P P p i , t p = i G U p i , t g

3.3.3. Power Limit Constraints

The output power of generators and the input power of AS-PSH plants in the pumping mode can range from the minimum to maximum power, as expressed by Constraints (15) and (16).
P i m i n × i i , t p i , t g P i m a x × i i , t
P P i m i n × l i , t p i , t p P P i m a x × l i , t

3.3.4. Minimum Uptime/Downtime Constraints

During the daytime, when the power generated by VRE resources increases, a valley is created in the net-load curve, and generator cycling operations can be required. In the case of a coal-fired power generator in an offline state during the period wherein the net-load is lowered, the offline state should be maintained for a minimum of 8–12 h. Therefore, it is difficult to provide ramping capabilities during the period wherein the net-load increases due to the decrease in the VRE’s output. The minimum downtime and minimum up-time constraints were thus considered through Constraints (17) and (18).
t = k k + M U i 1 i i , t M U i × u i , k
t = k k + M D i 1 ( 1 i i , t ) M D i × d i , k )

3.3.5. Generator Ramp-rate Constraints

The difference in output power between hour t and t − 1 of a generator is limited by the ramp rate and expressed by Constraints (19) and (20).
p i , t g p i , t 1 g 60 × R U i
p i , t 1 g p i , t g 60 × R D i

3.3.6. Spinning Reserve Provision Constraints

The spinning reserve requirements should be secured under the constraints of the generator operation range. The target value of a synchronized generator for governor response is determined by the system frequency deviation and its droop characteristic [38]. To maintain the system frequency, the governor response that each unit can provide should be within the operation range of the system frequency. Therefore, the maximum capacity of the primary reserve of each unit can be expressed by Constraint (21) and the primary reserve of a generator at hour t by Constraints (22) and (23).
G R i C G , u p , m a x = G R i C G , d o w n , m a x = P i m a x · S F l R i · S F s
0 g r i , t C G , u p G R i C G , u p , m a x × i i , t
0 g r i , t C G , d o w n G R i C G , d o w n , m a x × i i , t
As discussed in the previous subsection, the maximum primary reserve provided in the generating and pumping modes of the AS-PSH is expressed by Constraints (24) and (25). The primary reserve provided by an AS-PSH at hour t is expressed by Constraints (26), (27), (28), and (29).
P R i g , u p , m a x = P R i g , d o w n , m a x = P i m a x × 10 %
P R i p , u p , m a x = P R i p , d o w n , m a x = P P i m a x × 20 %
0 p r i , t g , u p P R i g , u p , m a x × i i , t
0 p r i , t g , d o w n P R i g , d o w n , m a x × i i , t
0 p r i , t p , u p P R i p , u p , m a x × l i , t
0 p r i , t p , d o w n P R i p , d o w n , m a x × l i , t
The secondary/regulation reserves are provided by the ACG signals according to the ramp-rate of each generator. Therefore, a ramp-rate should be reflected in the ACG capacity available to each generator. The UC problem in this study considers the constraints of secondary and regulation reserves at 5 min intervals. The secondary and regulation reserves available to each generator can be calculated using Constraints (30) and (31), and the AGC capacity secured by a generator at hour t is expressed by Constraints (32) and (33).
A G C i C G , u p , m a x = 5 × R R i u p
A G C i C G , d o w n , m a x = 5 × R R i d o w n
0 a g c i , t C G , u p A G C i C G , u p , m a x × i i , t
0 a g c i , t C G , d o w n A G C i C G , d o w n , m a x × i i , t
The secondary/regulation reserve capacities of the AS-PSH are defined by Constraints (34) and (35). The reserves of the AS-PSH in the generating and pumping modes at hour t are expressed by Constraints (36)–(39).
A G C i g , u p , m a x = A G C i g , d o w n , m a x = P i m a x P i m i n
A G C i p , u p , m a x = A G C i p , d o w n , m a x = P P i m a x P P i m i n
0 a g c i , t g , u p A G C i g , u p , m a x × i i , t
0 a g c i , t g , d o w n A G C i g , d o w n , m a x × i i , t
0 a g c i , t p , u p A G C i p , u p , m a x × l i , t
0 a g c i , t p , d o w n A G C i p , d o w n , m a x × l i , t

3.3.7. Power Limit Constraints Considering Spinning Reserve

The output range of a conventional generator should consider its spinning reserve at hour t, as expressed by Constraints (40) and (41).
p i , t g + a g c i , t C G , u p + g r i , t C G , u p P i m a x
p i , t g a g c i , t C G , d o w n g r i , t C G , d o w n P i m i n
The output and input power range of AS-PSH can be further expressed by Constraints (42), (43), (44), and (45).
p i , t g + a g c i , t g , u p + p r i , t g , u p P i m a x × i i , t
p i , t g a g c i , t g , d o w n p r i , t g , d o w n P i m i n × i i , t
p i , t p a g c i , t p , u p p r i , t p , d o w n P P i m a x × l i , t
p i , t p + a g c i , t p , d o w n + p r i , t p , d o w n P P i m i n × l i , t

3.3.8. Spinning Reserve Requirement Constraints

The spinning reserve procured at each hour should satisfy Constraints (46) and (47), which specify the requirements of the primary reserve and secondary/regulation reserves, respectively. In this study, the up-spinning and down-spinning reserve requirements were assumed to be identical. The primary reserve requirement in the Korean power market is secured for the largest unit loss as the change in the generators’ output power in a quasi-steady state after a generator outage. The Korean power system has an average governor response of 1000 MW at the quasi-steady state for the largest unit outage [39]. The requirement of a 1400 MW secondary reserve is the capacity required to remove the steady-state error of the system frequency after the largest unit loss. In addition, the standard deviations of VRE are set to vary according to its output power, preventing the overestimation of spinning reserves during the night when the output power of the VRE is low. Based on the reserve requirement determination method in [40], we derived the standard-deviation function of VRE’s output.
S R t P R , u p = S R t P R , d o w n = P R L U + n · σ V R E 1 m i n ( P t V R E )
S R t A G C , u p = S R t A G C , d o w n = S R L U + ( n · σ L 5 m i n . ) 2 + ( n · σ V R E 5 m i n ( P t V R E ) ) 2
The spinning reserve secured by AS-PSHs and conventional generators should satisfy the reserve requirements at each hour, as expressed by Constraints (48), (49), (50), and (51).
i A P c g r i , t C G , u p + i A P ( p r i , t g , u p + p r i p , u p ) S R t P R , u p
i A P c g r i , t C G , d o w n + i A P ( p r i , t g , d o w n + p r i p , d o w n ) S R t P R , d o w n
i A P c a g c i , t C G , u p + i A P ( a g c i , t g , u p + a g c i , t p , u p )   S R t A G C , u p
i A P c a g c i , t C G , d o w n + i A P ( a g c i , t g , d o w n + a g c i , t p , d o w n )   S R t A G C , d o w n

3.3.9. Upper Reservoir of PSH Constraint

The PSH has an energy constraint based on its upper reservoir volume. Constraints (52) and (53) consider the efficiency when the PSH charges and discharges. The upper reservoir volume at hour t was measured based on electrical energy.
v i , t   = v i , t 1 p i , t 1 g + p i , t 1 p × E F F i
0   v i , t V i m a x

4. Simulation

This section presents the scenarios, simulation results, and discussion.

4.1. Scenarios

The construction of three new PSH plants by 2030, with reference to [1], was assumed; and the following scenarios were set. Scenario A denotes no PSH plant construction, Scenario B denotes FS-PSH plant construction, and Scenarios C and D denote AS-PSH plant construction. To verify the contribution of the AS-PSH operating in the pumping mode to primary reserve provision, Scenario C constrained the AS-PSH to provide only secondary/regulation reserves in pumping mode, and the AS-PSH in Scenario D was modeled to provide all the reserves. Table 6 outlines each scenario. Both FS-PSH and AS-PSH were assumed to have the same capacity for the generating and pumping modes.
Given the low frequency of the high output power of VRE, in addition to the low investment efficiency of transmission and distribution facilities required, we considered curtailing approximately 5% of the target power generation of VRE. If the VRE output is limited to a maximum of 26 GW in 2030, 5% of the total generation can be curtailed, and the VRE output curve in Figure 1 can be depicted as shown in Figure 8.
The calculated output of VRE in Korea differs by month, and the generation of VRE is highest in spring. Generally, the load curve on weekends tends to be lower than that on weekdays. The effects of VRE were assumed to be significant on weekends. Therefore, UC simulation was performed on a weekend daily load curve with high VRE generation in spring 2030. To verify the VRE effect in a typical load curve pattern, special days, such as traditional holidays, were excluded.
The daily load, net-load, and output power of the VRE considering the output limit are shown in Figure 9. The requirements of the spinning reserves with respect to Constraints (46) and (47), which adopt the 2σ criterion of the short-term variation of the VRE, are plotted in Figure 10. The current standard adopting the 3σ criterion for the short-term variation of the load was maintained.

4.2. Results

In the UC simulation, the following two assumptions were made:
(1)
All of the available nuclear power generators are maintained in an online state for 24 h.
(2)
Nuclear power generators do not provide spinning reserves.
Assumption 1 implies that there is no startup or shutdown operation of nuclear power generators for 24 h. Nuclear power generators are set to have a significantly limited ramp-rate. Assumption 2 implies that the UC results do not count as a spinning reserve, even if nuclear power generators have unused capacity. The total available capacity of nuclear power generators was assumed to be 16.4 GW out of 20.4 GW in 2030, with reference to their historical planned outage rates. Starting with the case where all available capacity of nuclear power generators is operable, the feasible solution was found by excluding the online state nuclear power generators. Table 7 presents the feasible solutions to the optimization problem according to the capacity of the nuclear power generators in the online state for each scenario.
In all scenarios, the UC problem was found to be infeasible when nuclear power generators were employed at the maximum capacity of 16.4 GW. In Scenarios A and B, the maximum available capacities of the nuclear power generators were derived as 4.2 GW and 7 GW, respectively. Similarly, the maximum available capacities of the nuclear power generators in Scenarios B and D were 7 GW and 12.4 GW, respectively. Figure 11, Figure 12, Figure 13 and Figure 14 present the diagram of the UC solution for each scenario when the feasible solution is operated as per the maximum capacity of the nuclear power plant, as derived in Table 7.
Table 8 presents the operating cost results of each scenario. Given the characteristics of the Korean power market, which is based on fuel cost, the costs of VRE and hydro energy were not considered. In Figure 11, Figure 12, Figure 13 and Figure 14, the resources named ‘others’ consists of new energy resources, such as fuel cells and by-product gases. Using the expected power generation of the new energy resources in 2030, the output power was assumed to be uniform throughout the day [1]. Given that the 24 h power generation pattern of the energy sources was applied in all scenarios, their costs were neglected.
The total operating costs decreased in the order of Scenarios A, B, C, and D. The proportion of nuclear power generation was 6.8%, 11.4%, 11.4%, and 19.9% in Scenarios A, B, C, and D, respectively, and that of thermal power generation was calculated as 55.3%, 50.8%, 50.8%, and 42.3%, respectively. Based on the operating cost result of Scenario A, the operating cost savings for scenarios B, C, and D were KRW 3090.94, 3774.46, and 9098.92, respectively.

4.3. Discussion

The results shown in Table 8 and Figure 11, Figure 12, Figure 13 and Figure 14 were found to be strongly related to the generator output limit in Constraints (15), (40), and (41); the generator’s spinning reserve provision in Constraints (21)–(23) and (30)–(33); and the spinning reserve requirement in Constraints (46)–(51). If nuclear power generators with a total capacity of 16.4 GW are operating, the thermal power generators carry a given net-load, excluding the output power of the nuclear power generators. However, in this case, the spinning reserve requirement is not satisfied. In contrast, if the nuclear power generator is operating at 16.4 GW and the thermal power generators procure the requirement of spinning reserves, the supply and demand balance of Constraint (14) is violated.
Therefore, the AS-PSH operating in pumping mode during low net-load and providing primary reserves was the main factor for the result of Scenario D. The primary reserve from a conventional generator is dominated by its droop and not its ramp-rate characteristics. As mentioned above, the primary reserve that can be secured for each generator is considerably limited when compared with the secondary/regulation reserve. For example, under Constraint (21), if the system-frequency maintenance range is ±0.2 Hz, the primary reserve that can be secured by a 500 MW generator with droop 6% is merely 25 MW (5% of the maximum rated power of the generator). In this case, with a 25 MW increase in the primary reserve, 500 MW of thermal power generation must be committed sequentially.
An increase in the primary reserve requirements requires an increased number of thermal power generators in the online state, but the duck-curve phenomenon limits the number of online generators. The FS-PSH operated in pumping mode, contributing only to mitigating the duck-curve phenomenon, while the AS-PSH operated in pumping mode and contributed to both primary reserve provision and mitigating the duck-curve phenomenon. As shown in Figure 15, the results of the AS-PSH securing all the unused capacity as the primary reserve in the low net-load period were derived. Therefore, the maximum available capacity of nuclear power generators, which are economic resources, was the highest in Scenario D.

5. Conclusions

In this study, we performed RCUC simulations for the Korean power system projected for 2030 and analyzed the economic effect obtained by the flexibility of AS-PSH. Prior literature focused on the traditional advantages of PSHs, such as energy storage and quick-start capabilities, and provided insufficient analysis on the economic effect from the primary reserve capability of AS-PSH. In this study, we focused on the reserve capability of AS-PSH, considering that AS-PSH in pumping mode can provide primary, secondary, and regulation reserves. To analyze the economic effect obtained by AS-PSH in environments with a high share of VRE, we considered the short-term variations of VRE in the spinning reserve requirement defined by the Korean power market. We then divided the flexibility provided by AS-PSH into primary, secondary, and regulation reserves and modeled them in the RCUC formulation to allow for a range of operations in the pumping mode. In the simulation, it was postulated that the spinning reserve is procured only through generators, including PSHs. We simulated four scenarios: Scenario A denoted no PSH plant construction, Scenario B denoted FS-PSH plant construction. Scenarios C and D denoted AS-PSH plant construction. Scenario D showed the best cost result.
The key findings of this study are as follows.
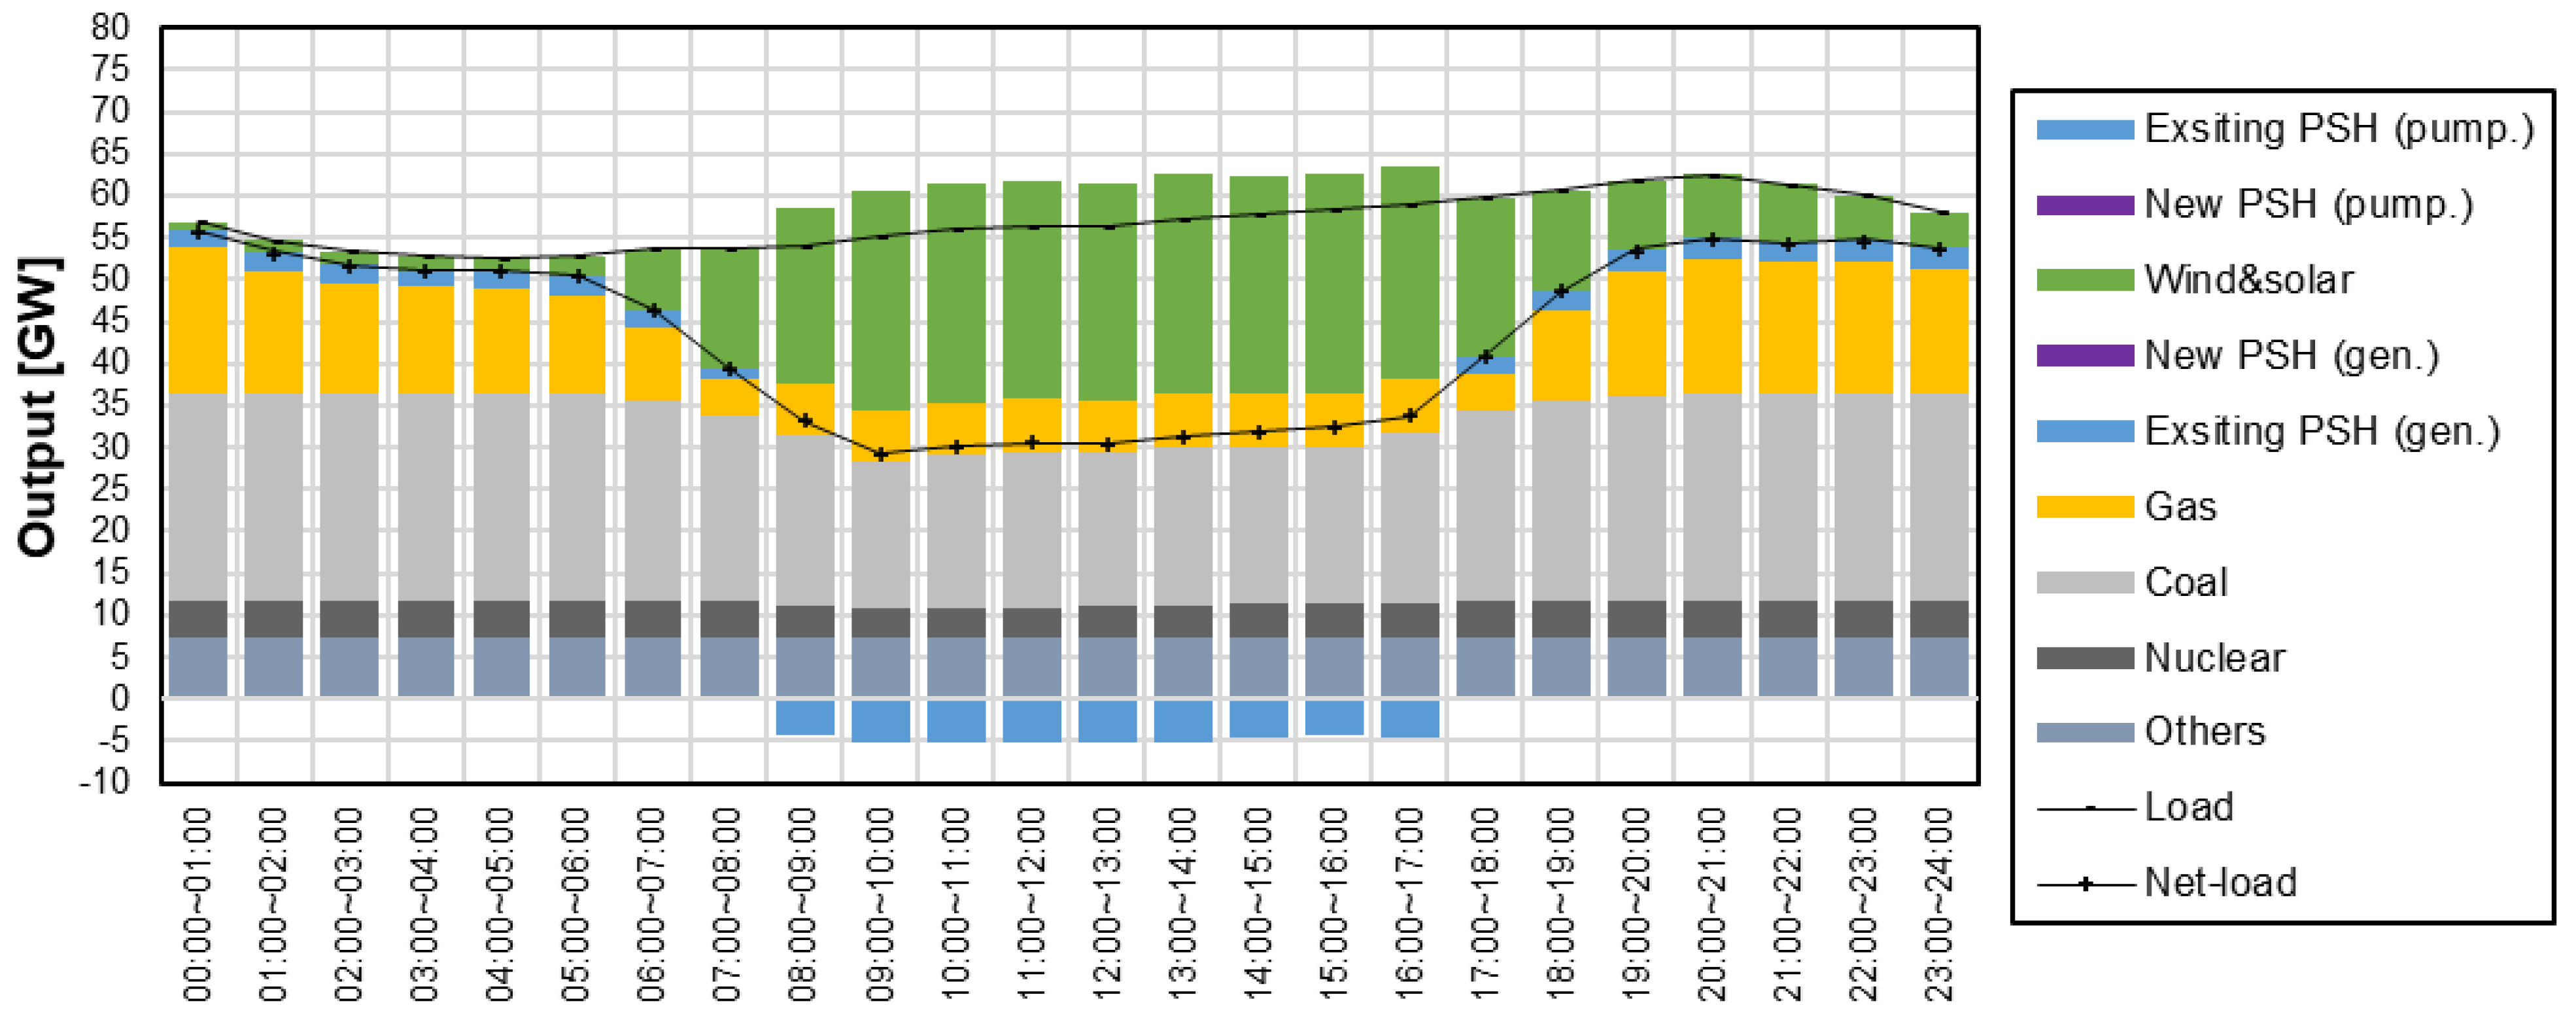
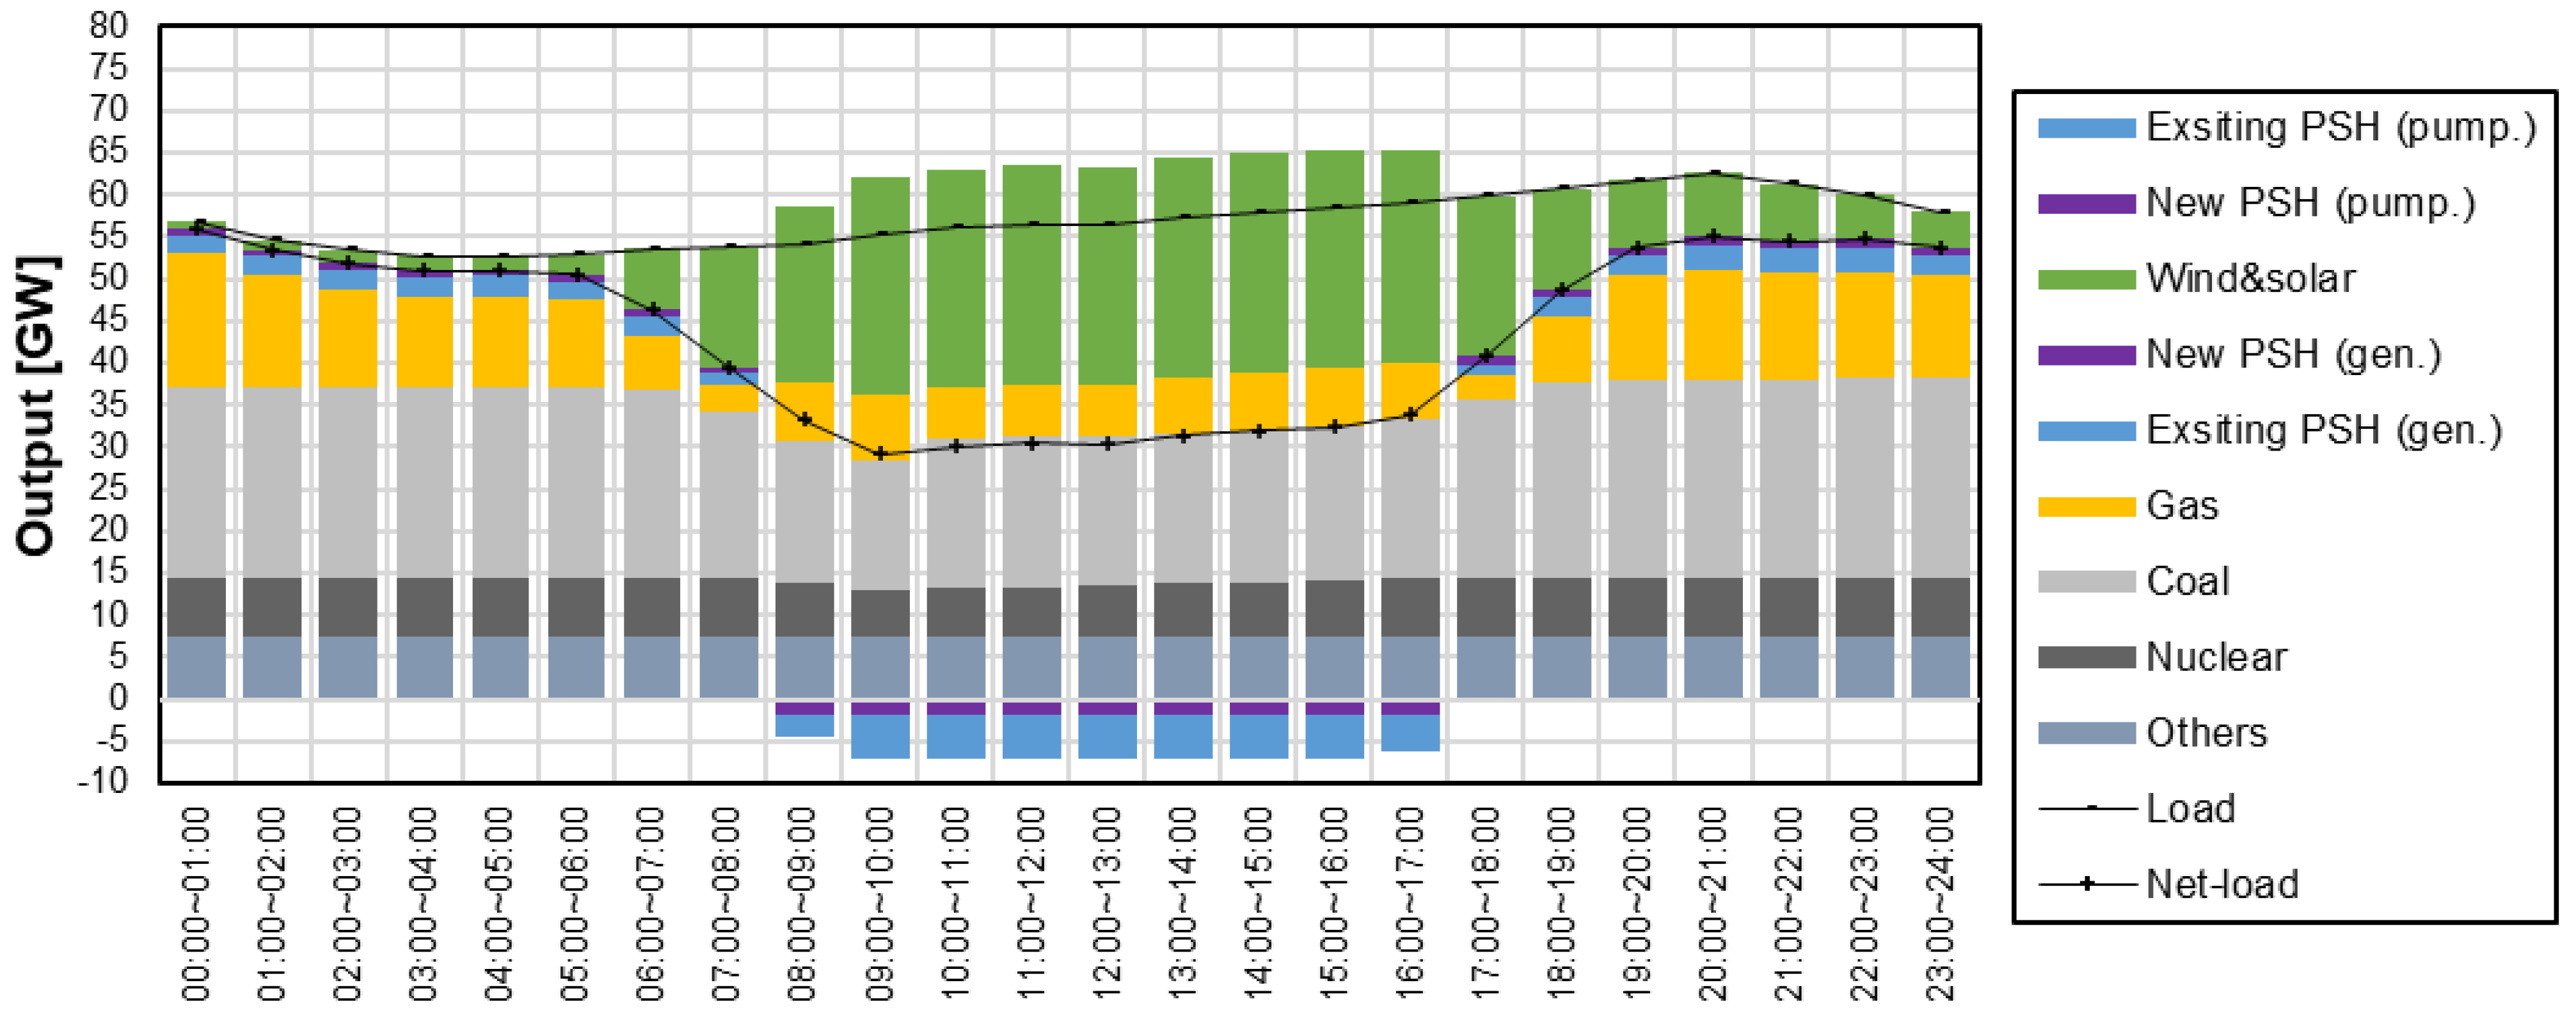
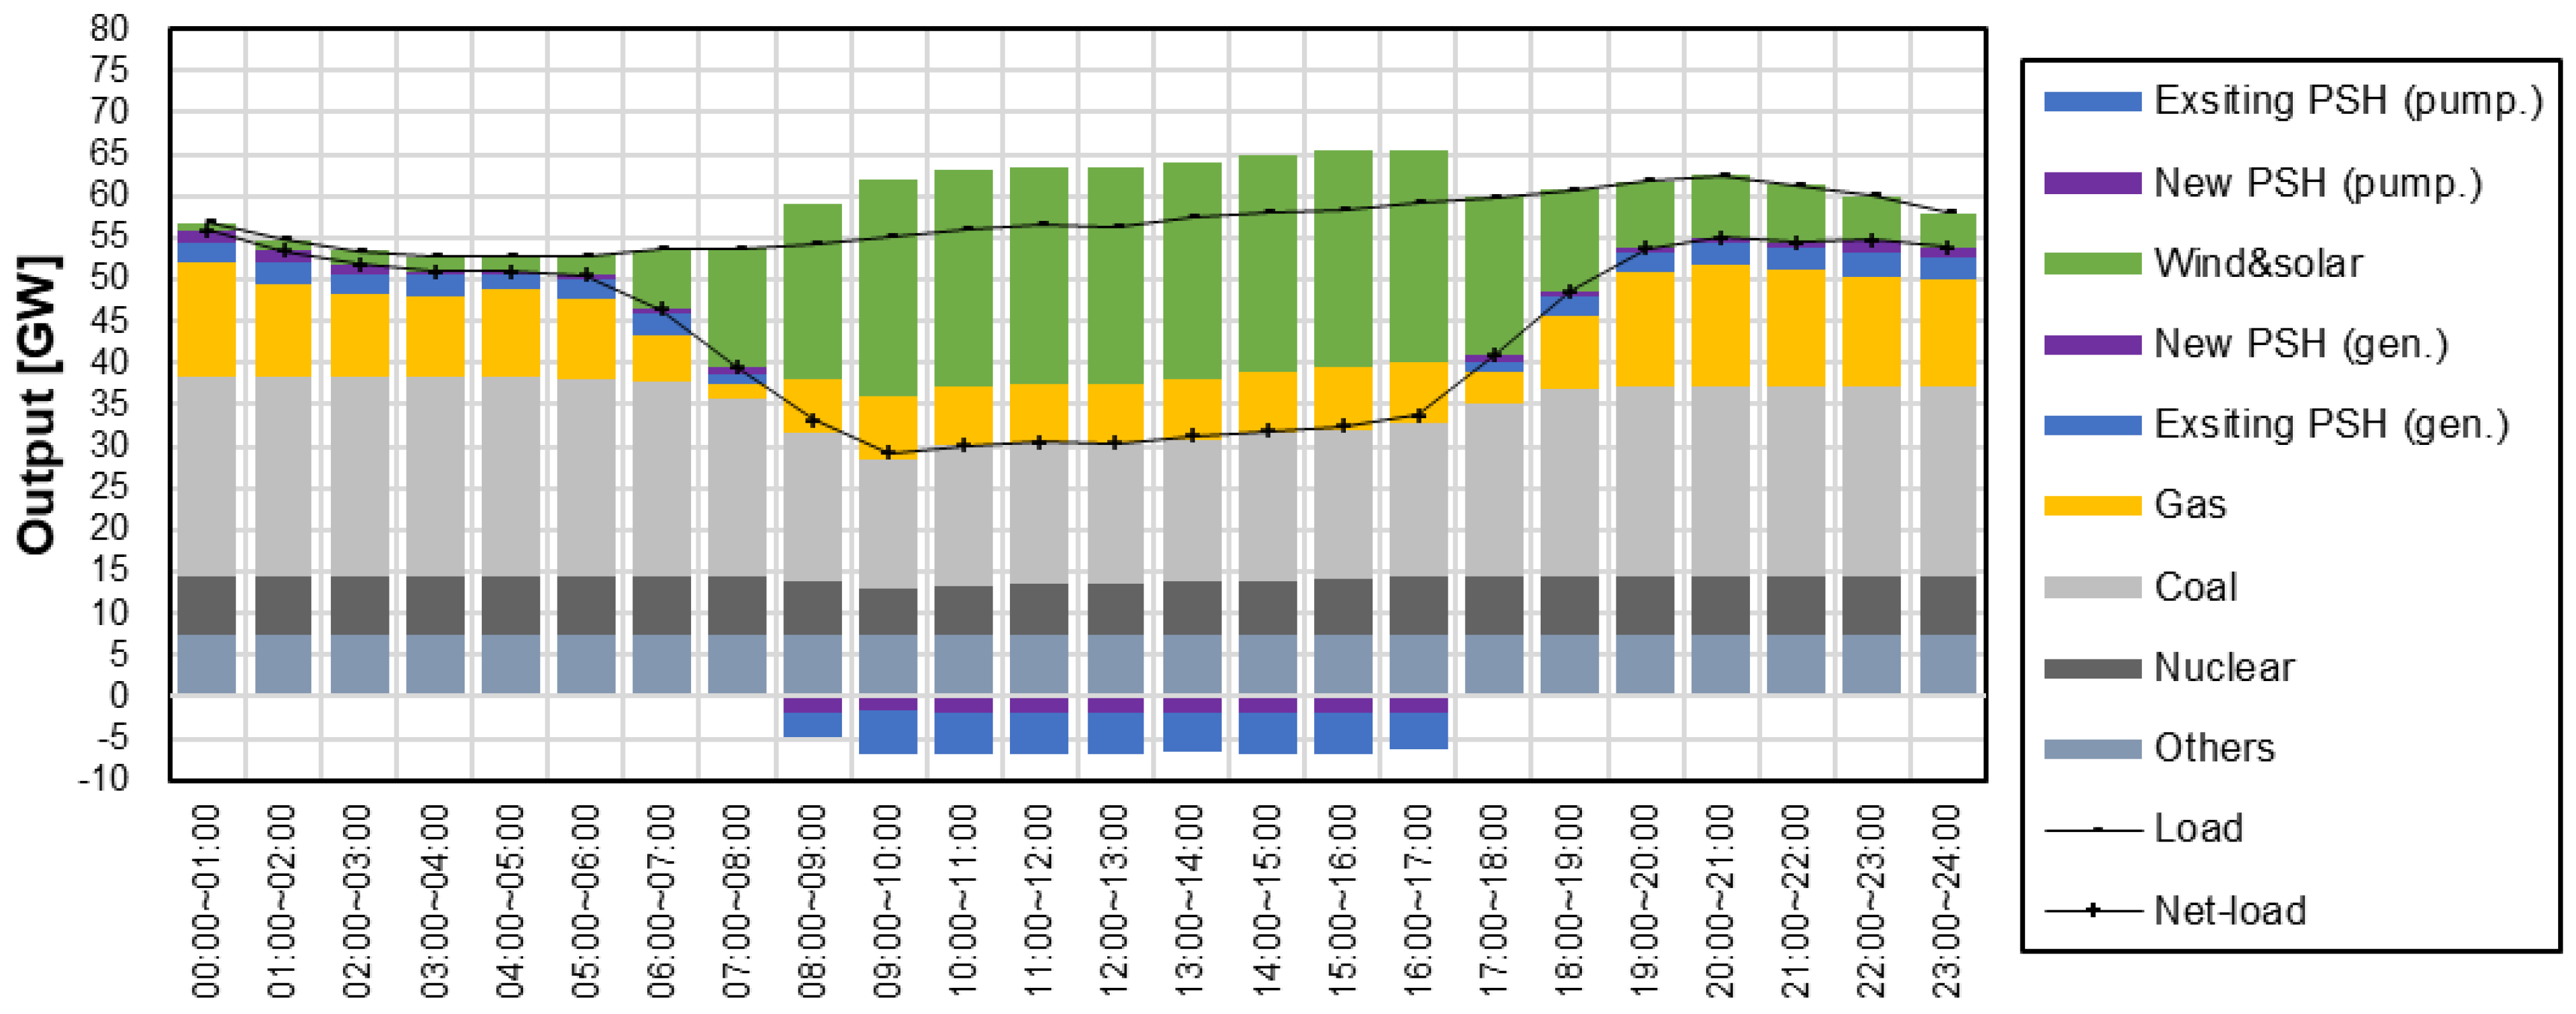
  • In the duck-curve environment with an increased spinning reserve requirement, it was difficult to operate nuclear power generators at their maximum capacities. In the results of Scenario A, the maximum available capacity of the nuclear power generators was 4.2 GW out of 16.4 GW.
  • New PSH plants contributed to mitigating the duck-curve phenomenon and increased the maximum available capacity of the nuclear power generators, resulting in operating cost savings.
  • The costs in Scenarios A, B, C, and D were KRW 43,129.38, 40,038.44, 39,354.92, and 34,030.46. The results were mainly derived from the provision of the primary reserve by AS-PSH’s pumping mode.
This study is limited in that the patterns of load curves vary depending on weekdays or weekends and are influenced by the seasons. The characteristics of VRE are also influenced by the seasons. Therefore, it is necessary to evaluate the economic effect over a longer timeframe in a follow-up study. In a long-term evaluation, a more simplified model for long-term economic analysis should be developed because the computational burden of the MIP model increases significantly as the analysis period increases. However, in a simplified model, the results of a short-term analysis model may not be guaranteed. Therefore, in a future long-term economic evaluation model, it will be necessary to develop a novel algorithm capable of considering the operational characteristics derived from the short-term economic evaluation model.

Author Contributions

Conceptualization, W.-J.K.; data curation, W.-J.K.; formal analysis, W.-J.K.; funding acquisition, Y.-H.C.; investigation, W.-J.K. and Y.-S.L.; methodology, W.-J.K. and Y.-S.L.; software, W.-J.K. and H.-S.J.; supervision, Y.-H.C.; validation, W.-J.K. and Y.-S.L.; writing—original draft, W.-J.K., Y.-S.L., and H.-S.J.; writing—review and editing, W.-J.K. and Y.-H.C. All authors have read and agreed to the published version of the manuscript.

Funding

This work was supported by the Korea Institute of Energy Technology Evaluation and Planning (KETEP) and the Ministry of Trade, Industry and Energy (MOTIE) of the Republic of Korea (No. 2019371010006B).

Conflicts of Interest

The authors declare no conflict of interest.

Nomenclature

Sets and indices
GUSet of all generating units
PPSet of PSH units, PP ⊂ GU
APSet of AS-PSH units, AP ⊂ PP ⊂ GU
TOperation period, index by t
iIndex for unit, iGU, PP, or AP
tIndex for time interval, t = 1, …, T
Parameters and functions
FCi(∙)Fuel cost function of unit i at hour t $
STCiStartup cost of Unit i, $
P t Load System load at Time t, MW
P t VRE Output of renewable energy sources at Time t, MW
P i m i n Minimum output power of Unit i, MW
P i m a x Maximum output power of Unit i, MW
P P i m i n Minimum pumping input power of PSH plant i, MW
P P i m a x Maximum pumping input power of PSH plant i, MW
MUiMinimum up-time of Unit i, hour
MDiMinimum down-time of Unit i, hour
RUiUp-ramping limit of Unit i, MW/minute
RDiDown-ramping limit of Unit i, MW/minute
RiDroop of Unit i, p.u.
SFiOperational limit deviation of system frequency, Hz
SFsStandard system frequency, Hz
PRLURequirement of primary reserve respond to largest unit loss, MW
SRLURequirement of secondary reserve respond to largest unit loss, MW
σ V R E 1 m i n Standard deviation of VRE’s 1 min variation
σ V R E 5 m i n Standard deviation of VRE’s 5 min variation
σ L 5 m i n . Standard deviation of load’s 5 min variation
EFFiPumping efficiency of PSH plant i
V i m a x Maximum volume of upper reservoir of PSH plant i, MWh
A G C i C G , u p , m a x Maximum up-secondary and regulation reserve of unit i, MW
A G C i g , up , m a x Maximum up-secondary and regulation reserve of AS-PSH i (generating), MW
A G C i p , up , m a x Maximum up-secondary and regulation reserve of AS-PSH i (pumping), MW
G R i C G , u p , m a x Maximum up-primary reserve of unit i, MW
P R i g , u p , m a x Maximum up-primary reserve of AS-PSH (generating) i, MW
P R i p , u p , m a x Maximum up-primary reserve of AS-PSH (pumping) i, MW
A G C i C G , d o w n , m a x Maximum down-secondary and regulation reserve of unit i, MW
A G C i g , d o w n , m a x Maximum down-secondary and regulation reserve of AS-PSH i (generating), MW
A G C i p , d o w n , m a x Maximum down-secondary and regulation reserve of AS-PSH i (pumping), MW
G R i C G , d o w n , m a x Maximum down-primary reserve of unit i, MW
P R i g , d o w n , m a x Maximum down-primary reserve of AS-PSH (generating) i, MW
P R i p , d o w n , m a x Maximum down-primary reserve of AS-PSH (pumping) i, MW
S R t P R , u p Up-primary reserve requirement at hour t, MW
S R t P R , d o w n Down-primary reserve requirement at hour t, MW
S R t A G C , u p Up-secondary and regulation reserve requirement at hour t, MW
S R t A G C , d o w n Down- secondary and regulation reserve requirement at hour t, MW
Variables
ui,tInteger variable for startup, 1 when off to on at hour t
di,tInteger variable for shutdown, 1 when on to off at hour t
ii,tInteger variable for on/off, on = 1/off = 0 at hour t
li,tInteger variable for on/off (pumping mode of PSH), on = 1/off = 0 at hour t
p i , t g Output of unit i at hour t, MW
p i , t p Pumping output of PSH plant i at hour t, MW
a g c i , t C G , u p Up-secondary and regulation reserve of unit i at hour t, MW
a g c i , t g , u p Up-secondary and regulation reserve of AS-PSH (generating) i at hour t, MW
a g c i , t p , u p Up-secondary and regulation reserve of AS-PSH (pumping) i at hour t, MW
g r i , t C G , u p Up-primary reserve of unit i at hour t, MW.
p r i , t g , u p Up-primary reserve of AS PSH (generating) i at hour t, MW
p r i p , u p Up-primary reserve of AS PSH (pumping) i at hour t, MW
a g c i , t C G , d o w n Down-secondary and regulation reserve of unit i at hour t, MW
a g c i , t g , d o w n Down-secondary and regulation reserve of AS-PSH (generating) i at hour t, MW
a g c i , t p , d o w n Down-secondary and regulation reserve of AS-PSH (pumping) i at hour t, MW
p r i , t g , d o w n Down-primary reserve of AS-PSH (generating) i at hour t, MW
p r i p , d o w n Down-primary reserve of AS-PSH (pumping) i at hour t, MW
g r i , t C G , d o w n Down-primary reserve of unit i at hour t, MW
vi,tVolume of PSH plant i at hour t
Solar and wind power model parameters
nIndex for a wind turbine in a wind farm, n = 1, 2, 3, …, N
PWT,nOutput power of nth wind turbine in a wind farm, MW
PcurvefitPolynomial function of output power for (VinVVr), MW
PrRated output power of wind turbine, MW
VinCut-in wind speed, m/s
VrRated wind speed, m/s
VoutCut-out wind speed, m/s
PWFOutput power of wind farm, MW
CWFCapacity of wind farm, MW
VmWind speed at height Zm, m/s
VhWind speed at height Zh, m/s
ZmHeight 1 (lower height, 10m), m
ZhHeight 2 (upper height, Tower hub height), m
αPower-law exponent
PPV,MOutput power of PV module, W
P P V , M * Rated output power of PV module in STC, W
GActual solar irradiance, W/m2
G*Solar irradiance in STC, 1000 W/m2
γModule maximum power temperature coefficient, 1/°C
TCPV module temperature, °C
PPVOutput power of PV power plant, MW
CPVCapacity of PV power plant, MW
TAAir temperature, °C
TNOCTNominal operating cell temperature, °C

References

  1. Ministry of Trade, Industry and Energy of South Korea. The 9th Basic Plan for Long-Term Electricity Supply and Demand; Ministry of Trade Industry and Energy Republic of Korea: Sejong, Korea, 2020.
  2. Ela, E.; Milligan, M.; Kirby, B. Operating Reserves and Variable Generation; Technical Report; National Renewable Energy Laboratory: Golden, CO, USA, 2011. [Google Scholar] [CrossRef] [Green Version]
  3. California, ISO. Fast Fact, What the Duck Curve Tells us about Managing a Green Grid. 2016. Available online: https://www.caiso.com/Documents/FlexibleResourcesHelpRenewables_FastFacts.pdf (accessed on 29 October 2020).
  4. Kim, W.J.; Lee, Y.S.; Chun, Y.H. Assessment of Primary Control Reserve Requirement from Generator Considering a Battery Energy Storage System. J. Electr. Eng. Technol. 2020, 15, 315–324. [Google Scholar] [CrossRef]
  5. Koritarov, V.; Veselka, T.D.; Gasper, J.; Bethke, B.M.; Botterud, A.; Wang, J.; Mahalik, M.; Zhou, Z.; Milostan, C.; Feltes, J. Modeling and Analysis of Value of Advanced Pumped Storage Hydropower in the United States. Science 2014, 246, 25–31. [Google Scholar] [CrossRef]
  6. Pérez-Díaz, J.I.; Jiménez, J. Contribution of a Pumped-Storage Hydropower Plant to Reduce the Scheduling Costs of an Isolated Power System with High Wind Power Penetration. Energy 2016, 109, 92–104. [Google Scholar] [CrossRef] [Green Version]
  7. Al-Masri, H.M.K.; Al-Quraan, A.; AbuElrub, A.; Ehsani, M. Optimal Coordination of Wind Power and Pumped Hydro Energy Storage. Energies 2019, 12, 4387. [Google Scholar] [CrossRef] [Green Version]
  8. Bakhshaei, P.; Alireza, A.; Reza, A. Operation optimization of a grid-connected photovoltaic/pumped hydro storage considering demand response program by an improved crow search algorithm. J. Energy Storage 2021, 44, 103326. [Google Scholar] [CrossRef]
  9. Rahmati, I.; Foroud, A.A. Pumped-storage units to address spinning reserve concerns in the grids with high wind penetration. J. Energy Storage 2020, 31, 101612. [Google Scholar] [CrossRef]
  10. Alturki, F.A.; Awwad, E.M. Sizing and Cost Minimization of Standalone Hybrid WT/PV/Biomass/Pump-Hydro Storage-Based Energy Systems. Energies 2021, 14, 489. [Google Scholar] [CrossRef]
  11. Dianellou, A.; Christakopoulos, T.; Caralis, G.; Kotroni, V.; Lagouvardos, K.; Zervos, A. Is the Large-Scale Development of Wind-PV with Hydro-Pumped Storage Economically Feasible in Greece? Appl. Sci. 2021, 11, 2368. [Google Scholar] [CrossRef]
  12. Ma, Y.; Li, C.; Zhou, J.; Zhang, Y. Comprehensive stochastic optimal scheduling in residential micro energy grid considering pumped-storage unit and demand response. J. Energy Storage 2020, 32, 101968. [Google Scholar] [CrossRef]
  13. Nag, S.; Lee, K.Y. Network and Reserve Constrained Economic Analysis of Conventional, Adjustable-Speed and Ternary Pumped-Storage Hydropower. Energies 2020, 13, 4140. [Google Scholar] [CrossRef]
  14. Aburub, H.; Basnet, S.; Ward, T.J. On the use of adjustable-speed pumped hydro storage operation in the U.S. electricity market. J. Energy Storage 2019, 23, 495–503. [Google Scholar] [CrossRef]
  15. Feng, C.; Zheng, Y.; Li, C.; Mai, Z.; Wu, W.; Chen, H. Cost advantage of adjustable-speed pumped storage unit for daily operation in distributed hybrid system. Renew. Energy 2021, 176, 1–10. [Google Scholar] [CrossRef]
  16. Kazemi, M.; Siano, P.; Sarno, D.; Goudarzi, A. Evaluating the impact of sub-hourly unit commitment method on spinning reserve in presence of intermittent generators. Energy 2016, 113, 338–354. [Google Scholar] [CrossRef]
  17. Wu, J.; Luh, P.; Chen, Y.; Bragin, M.; Yan, B. A novel optimization approach for sub-hourly unit commitment with large numbers of units and virtual transactions. IEEE Trans. Power Syst. 2021. [Google Scholar] [CrossRef]
  18. Raghunathan, N.; Bragin, M.A.; Yan, B.; Luh, P.B.; Moslehi, K.; Feng, X.; Yu, Y.; Yu, C.-N.; Tsai, C.-C. Exploiting Soft Constraints within Decomposition and Coordination Methods for Sub-hourly Unit Commitment. Int. J. Electr. Power Energy Syst. 2022, 139, 108023. [Google Scholar] [CrossRef]
  19. Bragin, M.A.; Luh, P.B.; Yan, B.; Sun, X. A scalable solution methodology for mixed-integer linear programming problems arising in automation. IEEE Trans. Autom. Sci. Eng. 2018, 16, 531–541. [Google Scholar] [CrossRef]
  20. Yurdakul, O.; Sivrikaya, F.; Albayrak, S. Quantification of the Impact of GHG Emissions on Unit Commitment in Microgrids. In Proceedings of the IEEE/PES Transmission and Distribution Conference and Exposition: Latin America, Montevideo, Uruguay, 28 September 2020. [Google Scholar] [CrossRef]
  21. Nicolosi, F.F.; Alberizzi, J.C.; Caligiuri, C.; Renzi, M. Unit commitment optimization of a micro-grid with a MILP algorithm: Role of the emissions, bio-fuels and power generation technology. Energy Rep. 2021, 7, 8639–8651. [Google Scholar] [CrossRef]
  22. Korea Meteorological Administration. Available online: https://data.kma.go.kr/cmmn/main.do (accessed on 15 January 2020).
  23. Marčiukaitis, M.; Žutautaitė, I.; Martišauskas, L.; Jokšas, B.; Gecevičius, G.; Sfetsos, A. Non-Linear Regression Model for Wind Turbine Power Curve. Renew. Energy 2017, 113, 732–741. [Google Scholar] [CrossRef]
  24. Doosan Heavy Industries & Construction. Available online: https://www.doosanheavy.com/download/pdf/products/energy/DHI_Wind_Power_Brochure_Eng.pdf (accessed on 21 July 2021).
  25. Irwin, J.S. A Theoretical Variation of the Wind Profile Power-Law Exponent as a Function of Surface Roughness and stability. Atmos. Environ. 1979, 13, 191–194. [Google Scholar] [CrossRef]
  26. Cherenack, P. Conditions for Cubic Spline Interpolation on Triangular Elements. Comp. Math. Appl. 1984, 10, 235–244. [Google Scholar] [CrossRef] [Green Version]
  27. Osterwald, C.R. Translation of Device Performance Measurements to Reference Conditions. Solar Cells 1986, 18, 269–279. [Google Scholar] [CrossRef]
  28. Stultz, J.W. Thermal and Other Tests of Photovoltaic Modules Performed in Natural Sunlight. J. Energy 1979, 3, 363–372. [Google Scholar] [CrossRef] [Green Version]
  29. Billinton, R.; Allan, R.N. Operating reserve. In Reliability Evaluation of Power Systems, 2nd ed.; Springer: Boston, MA, 1996. [Google Scholar] [CrossRef]
  30. Korea Power Exchange 2021. The Rules and Regulation of Power Market Operation. Available online: https://www.kpx.or.kr/www/selectBbsNttList.do?bbsNo=114&key=29 (accessed on 19 November 2021).
  31. Holttinen, H. Impact of Hourly Wind Power Variations on the System Operation in the Nordic Countries. Wind. Energy 2005, 8, 197–218. [Google Scholar] [CrossRef]
  32. Holttinen, H.; Milligan, M.; Ela, E.; Menemenlis, N.; Dobschinski, J.; Rawn, B.; Bessa, R.J.; Flynn, D.; Gomez-Lazaro, E.; Detlefsen, N.K. Methodologies to Determine Operating Reserves Due to Increased Wind Power. IEEE Trans. Sustain. Energy 2012, 3, 713–723. [Google Scholar] [CrossRef]
  33. Tokyo Electric Power Company. Final Report on Feasibility Study on Adjustable Speed Pumped Storage Generation Technology; Japan International Cooperation Agency: Tokyo, Japan, 2012. Available online: https://openjicareport.jica.go.jp/643/643/643_000_12044822.html. (accessed on 6 January 2020).
  34. Takashi, F.; Hirotaka, T.; Hajime, K. Commencement of Commercial Operation of Kazunogawa Hydroelectric Power Station Unit 4 of Tokyo Electric Power Co., Inc. Employing World’s Largest Capacity Adjustable-Speed System. Toshiba Rev. 2015, 70, 7–10. Available online: https://www.global.toshiba/jp/technology/corporate/review/abstract/2015-01.html. (accessed on 24 August 2021).
  35. Kawabara, T.; Shibuya, A.; Furata, H.; Kita, E.; Mitsuhasi, K. Design and dynamic response characteristics of 400 MW adjustable speed pump storage built for Ohkawachi Power Station. IEEE Trans. Energy Convers. 1998, 11, 376–384. [Google Scholar] [CrossRef]
  36. Carrión, M.; Arroyo, J.M. A Computationally Efficient Mixed-Integer Linear Formulation for the Thermal Unit Commitment Problem. IEEE Trans. Power Syst. 2006, 21, 1371–1378. [Google Scholar] [CrossRef]
  37. Ostrowski, J.; Anjos, M.F.; Vannelli, A. Tight Mixed Integer Linear Programming Formulations for the Unit Commitment Problem. IEEE Trans. Power Syst. 2012, 27, 39–46. [Google Scholar] [CrossRef]
  38. Kundur, P. Control of active power and reactive power. In Power System Stability and Control; McGraw-Hill: New York, NY, USA, 1994. [Google Scholar]
  39. Park, M.-S.; Kim, W.-J.; Chun, Y.-H. Calculation of Primary Reserve Requirements Based on Measurements of Frequency Trajectories of Korean Power System. Trans. Korean Inst. Electr. Eng. 2019, 68, 399–404. [Google Scholar] [CrossRef]
  40. Corbus, D.; King, J.; Mousseau, T. Eastern Wind Integration and Transmission Study; US Department of Energy, National Renewable Energy Laboratory: Golden, CO, USA, 2010. Available online: https://www.energy.gov/eere/wind/downloads/eastern-wind-integration-and-transmission-study-ewits-revised. (accessed on 21 January 2022).
Figure 1. Output and duration curve of VRE for 2030.
Energies 15 02386 g001
Figure 2. Average daily VRE power generation of each month for 2030.
Energies 15 02386 g002
Figure 3. Hourly average output (MW) of wind and PV power projected for 2030.
Energies 15 02386 g003
Figure 4. Primary reserve requirement for governor response.
Energies 15 02386 g004
Figure 5. Secondary and regulation reserve requirement for AGC operation.
Energies 15 02386 g005
Figure 6. Operation and reserve ranges of PSH (generating mode).
Energies 15 02386 g006
Figure 7. Operation and reserve ranges of PSH (pumping mode).
Energies 15 02386 g007
Figure 8. Output and duration curve of 2030 VRE with an output limit of 26 GW.
Energies 15 02386 g008
Figure 9. Curves of load, net-load, and VRE output power on spring Sunday, 2030.
Energies 15 02386 g009
Figure 10. Spinning reserve requirement at each hour.
Energies 15 02386 g010
Figure 11. The UC solution diagram of Scenario A.
Energies 15 02386 g011
Figure 12. The UC solution diagram of Scenario B.
Energies 15 02386 g012
Figure 13. The UC solution diagram of Scenario C.
Energies 15 02386 g013
Figure 14. The UC solution diagram of Scenario D.
Energies 15 02386 g014
Figure 15. Reserves of AS-PSHs and conventional generators in Scenario D.
Energies 15 02386 g015
Table 1. Parameters of wind turbines (onshore and offshore).
OnshoreOffshore
Rated power3 MW8 MW
Cut-in wind speed3 m/s3.5 m/s
Rated wind speed10 m/s10 m/s
Cut-out wind speed20 m/s25 m/s
Tower hub height120 m130 m
Table 2. Operating reserve requirements for the Korean power system.
Operating ReservesRequirementStateActivated bySecured for
Regulation reserve700 MWSpinningAGC signalShort-term load variation
Frequency
restoration
reserves
Primary reserve1000 MWSpinningGoverning systemLargest unit loss
Secondary reserve1400 MWSpinningAGC signalLargest unit loss
Tertiary reserve1400 MWStandstillManualReserve restoration
Quick-start reserve2000 MWStandstillManualLoad forecast error, etc.
Table 3. Allocation method of the increment amount of reserve requirement.
ReservesActivated byCurrent StandardIncrements of Reserve
Primary reserveGoverning systemLargest unit lossnσ of one-min. variation
of wind and solar output
Secondary reserveAGC signalLargest unit lossnσ of five-min. variation
of wind and solar output
Regulation reserve3σ of five-min. variation of load
Table 4. Example of pumped-storage hydropower (PSH) operation range.
Operation RangeFS-PSHAS-PSH
Generating modeArgonne Report [5]16–100%16~100%
JICA Report [33]30–100%30~100%
Pumping modeArgonne Report60–100%60~100%
JICA Report70–100%70~100%
Table 5. Operation and reserve range of FS-PSH and AS-PSH.
Operation RangeMax. Primary Reserve (Up/Downward)Max. Secondary/Regulation Reserve
(Up/Downward)
FS-PSHGenerating mode50~100%10%50%
Pumping modeConstant at 100%--
AS-PSHGenerating mode30~100%10%70%
Pumping mode60~100%20%40%
Table 6. Scenario description of RCUC simulation.
ScenarioExisting PSH Plants New PSH Plants in 2030Total Capacity of PSH Plants, MW
FS-Type, MWFS-Type, MWAS-Type, MW
A4700004700
B4700600 × 3 = 180006500
C47000600 × 3 = 18006500
D47000600 × 3 = 18006500
Table 7. Feasibility of each scenario.
ScenarioTotal Online Capacity of Nuclear Power Generators, GW
16.415.414.413.412.411.410.49.48.475.64.2
AInfeasibleFeasible
BInfeasibleFeasible
CInfeasibleFeasible
DInfeasibleFeasible
Table 8. Cost result of each scenario.
Fuel-TypeScenario AScenario BScenario CScenario D
Cost, KRW Share,
%
Cost,
KRW
Share,
%
Cost,
KRW
Share,
%
Cost,
KRW
Share,
%
Nuclear493.246.8822.8411.4825.0011.41,427.1619.9
Coal25,078.8938.023,594.9235.523,453.9135.419,604.1029.4
Gas17,557.2517.315,620.6815.315,076.0015.412,999.1912.9
Total costs43,129.3862.140,038.4462.239,354.9262.234,030.4662.2
Publisher’s Note: MDPI stays neutral with regard to jurisdictional claims in published maps and institutional affiliations.

