
Analogies in the Analysis of the Thermal Status of Batteries and Internal Combustion Engines for Mobility †


Institute of Science and Technologies for Sustainable Energy and Mobility—CNR, Via G. Marconi, 4, 80125 Naples, Italy
*
Author to whom correspondence should be addressed.
†
This paper is an extended version of our SAE paper 2019-24-0182, https://0-doi-org.brum.beds.ac.uk/10.4271/2019-24-0182 .
Energies 2022, 15(7), 2700; https://0-doi-org.brum.beds.ac.uk/10.3390/en15072700
Submission received: 11 March 2022
/
Revised: 30 March 2022
/
Accepted: 5 April 2022
/
Published: 6 April 2022
(This article belongs to the Special Issue Thermal Management of Internal Combustion Engines)
Abstract
:Thermal management is an important research area for the automotive sector in order to make high-efficiency and low-impact future vehicles. The transition from internal combustion engines to battery systems in the automotive field requires new skills to be achieved in the shortest possible time. The well-consolidated knowledge of thermal management of engine systems can be rearranged to face new challenges regarding the thermal control of batteries. The present work aims to show the analogies between the thermal behavior of an engine component, such as the piston, and of a battery. The thermodynamic processes involved during the operation are described, experimentally investigated, and modeled. The external temperature of the piston window is measured once per cycle with a K-type sheathed thermocouple, while the surface temperature of the battery is detected via infrared imaging. An almost-fixed stabilization time of 500 s is observed for the engine while it varies with the current load for the battery ranging from 1800 s to 3000 s, for the tested cases. Different temperature increments are also observed. Two mono-dimensional (1D) models of heat transfer are built using the finite-difference method. Good agreement with the experimental data is quantitatively demonstrated by a Normalize Root Mean Square Error lower than 0.07 for all the test cases and systems, except for the battery charging phase. The analysis of the temperature provides an estimation of the heat losses for the two systems, spanning from 15% to 27% for the engine and from 6% to 10% for the battery. The analysis carried out in this work can provide a methodology to understand and improve the thermal management of the new mobility system.
1. Introduction
Automotive thermal management is a very important research area for the creation and development of efficient and comfortable vehicles for sustainable mobility. The main objectives of thermal management are the control of the operating temperature of the components of the vehicle according to the environmental conditions and the maintenance of passenger comfort inside the cabin. The thermal management system of a modern internal combustion engine vehicle mainly consists of cooling of the power system, turbocharge, exhaust gas recirculation, lubrication, and the control of the air conditioning or heat pump. In hybrid and electric vehicles, it mainly includes battery cooling/preheating, cooling of electric machines, and air warming in winter and air cooling in summer within the cabin [1]. Moreover, considering that energy is lost within the exhaust and cooling systems during engine/battery operation, and within the air conditioning system and the radiator fan, it is necessary to manage thermal behavior with particular attention and precision to save fuel [2,3,4,5].
In this scenario, thermal management is going through drastic evolutions toward more complexity and system integration; moreover, smart solutions are necessary: (I) to increase the operating range of internal combustion engines (ICEs), Plug-in Hybrid Electric Vehicles (PHEVs), and Battery Electric Vehicles (BEVs) [6,7,8,9]; (II) to allow batteries to be recharged rapidly [10,11,12,13]; and (III) to ensure optimum comfort in the vehicle.
Regarding internal combustion engines, it must be considered that there are not many high-fidelity time-resolved experimental descriptions in the literature concerning heat flux and temperature profiles near the cylinder and the piston walls. The majority of experiments simulate the thermal behavior and validation is not always possible. In a paper from Pillai et al. [14], they assessed that about 16% of global CO2 emissions are due to the road transport sector; thus, it is urgently necessary to improve the thermal efficiencies of compression ignition (CI) engines, which are a type of widely used internal combustion engine. This can be achieved by reducing the heat losses through the cylinder wall/combustion chamber of the engine, which are almost 30% of the energy released during combustion. Consequently, a good understanding of the wall heat loss mechanism under different combustion conditions, such as engine size, fuel injection rate, etc., is critical for the development of energy-efficient engines. In their work, the authors investigated the dependence of heat loss through the wall on the fuel injection rate via 3D numerical analysis and investigated the relationship between the Nusselt number and the Reynolds number relative to the heat transfer of the wall during the spray flame-wall interaction process. Similarly, Impagnatiello et al. [15] presented a data-driven algebraic wall heat transfer model for ICEs by coupling neural network applications to the context of the LES channel flow. They used experimental data from an optical engine, even though engine speed was limited to 800 rpm in reactive conditions. In papers from the authors [16,17], piston heat losses during engine functioning in WLTC operating conditions have been determined via an experimental procedure. The piston temperature, in both motored and fired mode, was measured and used to set up a 1D model of heat transfer through the piston optical window.
On the other hand, as we are witnessing a rapid transition from motor vehicles to hybrid and electric vehicles, it is necessary to intensify studies and research relating to the thermal management of batteries [18,19,20]. In a review paper by Budin [21], it was highlighted that for prismatic and pouch passengers’ batteries, widely used in commercial vehicles, liquid cooling plates are one of the most implemented cooling systems, thanks to their good thermal capacity and compact arrangement. However, most research studies did not consider the uneven heat generation in batteries, which is even more significant for larger prismatic and pouch batteries, indicating that more attention should be paid to the study of local heat generation, on a single cell as well as on the module, thus improving the temperature distribution. In a recent work by Surya et al. [22], the importance of knowing the internal temperature of a lithium-ion (Li-ion) battery for effective thermal management, fault detection, and operational safety was highlighted. The authors believe that it is not practical to measure the internal temperature of each cell using physical sensors. For this reason, they analyzed thermal models of Li-ion batteries based on first- and second-order thermal resistors for both internal and surface temperature estimation using extensive laboratory test data and simulation studies. Balasingam et al. [23] highlighted the necessity of estimating the crucial parameters of a battery system: battery impedance, battery capacity, state of charge, etc., measuring three characteristic quantities, such as battery voltage, current, and temperature. These estimates are important for a correct approach to battery management, validation of the operation of optimal charging algorithms, identification of charging and thermal balancing strategies, and battery safety mechanisms. In papers from the authors [24,25], the thermal parameters of batteries have been evaluated using experimental data and theoretical correlations. A methodology for these kinds of estimations has been set, highlighting the importance of monitoring both the heating and the cooling processes for the determination of the required parameters. In particular, in [25], the information on the thermal status of a Li-polymer battery, collected from experiments, has been used as input for the online estimation of the state of charge of the battery while compensating for errors due to self-discharge phenomena.
It is evident from the analysis of the works in the literature that the thermal management of the components of hybrid and electric vehicles plays a fundamental role in the creation of reliable models and robust simulations. Furthermore, an analogy can be found by analyzing the systems of the engine and battery. In particular, the experimental characterization of the heat flows and thermal profiles from the coils, as well as from the pistons, requires the experimental determination of the coefficients as well as the validation of the thermal flows in real conditions. In the present work, the temperature and other working parameters are collected during the real-life operation of two vehicle components: the battery cell in a controlled environment and the piston window in a research optical compression ignition engine. The well-consolidated knowledge about the thermal analysis of internal combustion engines is applied to the investigation of modern configurations for sustainable mobility based on energy storage systems. Experimental measurements are performed to build and set up predictive models of the components’ temperature. Several analogies are found and highlighted between the two systems of the engine and battery. Finally, the amount of heat losses versus the power output is evaluated to find an indicative trend.
2. Experimental Apparatus
2.1. The Research Compression Ignition Engine
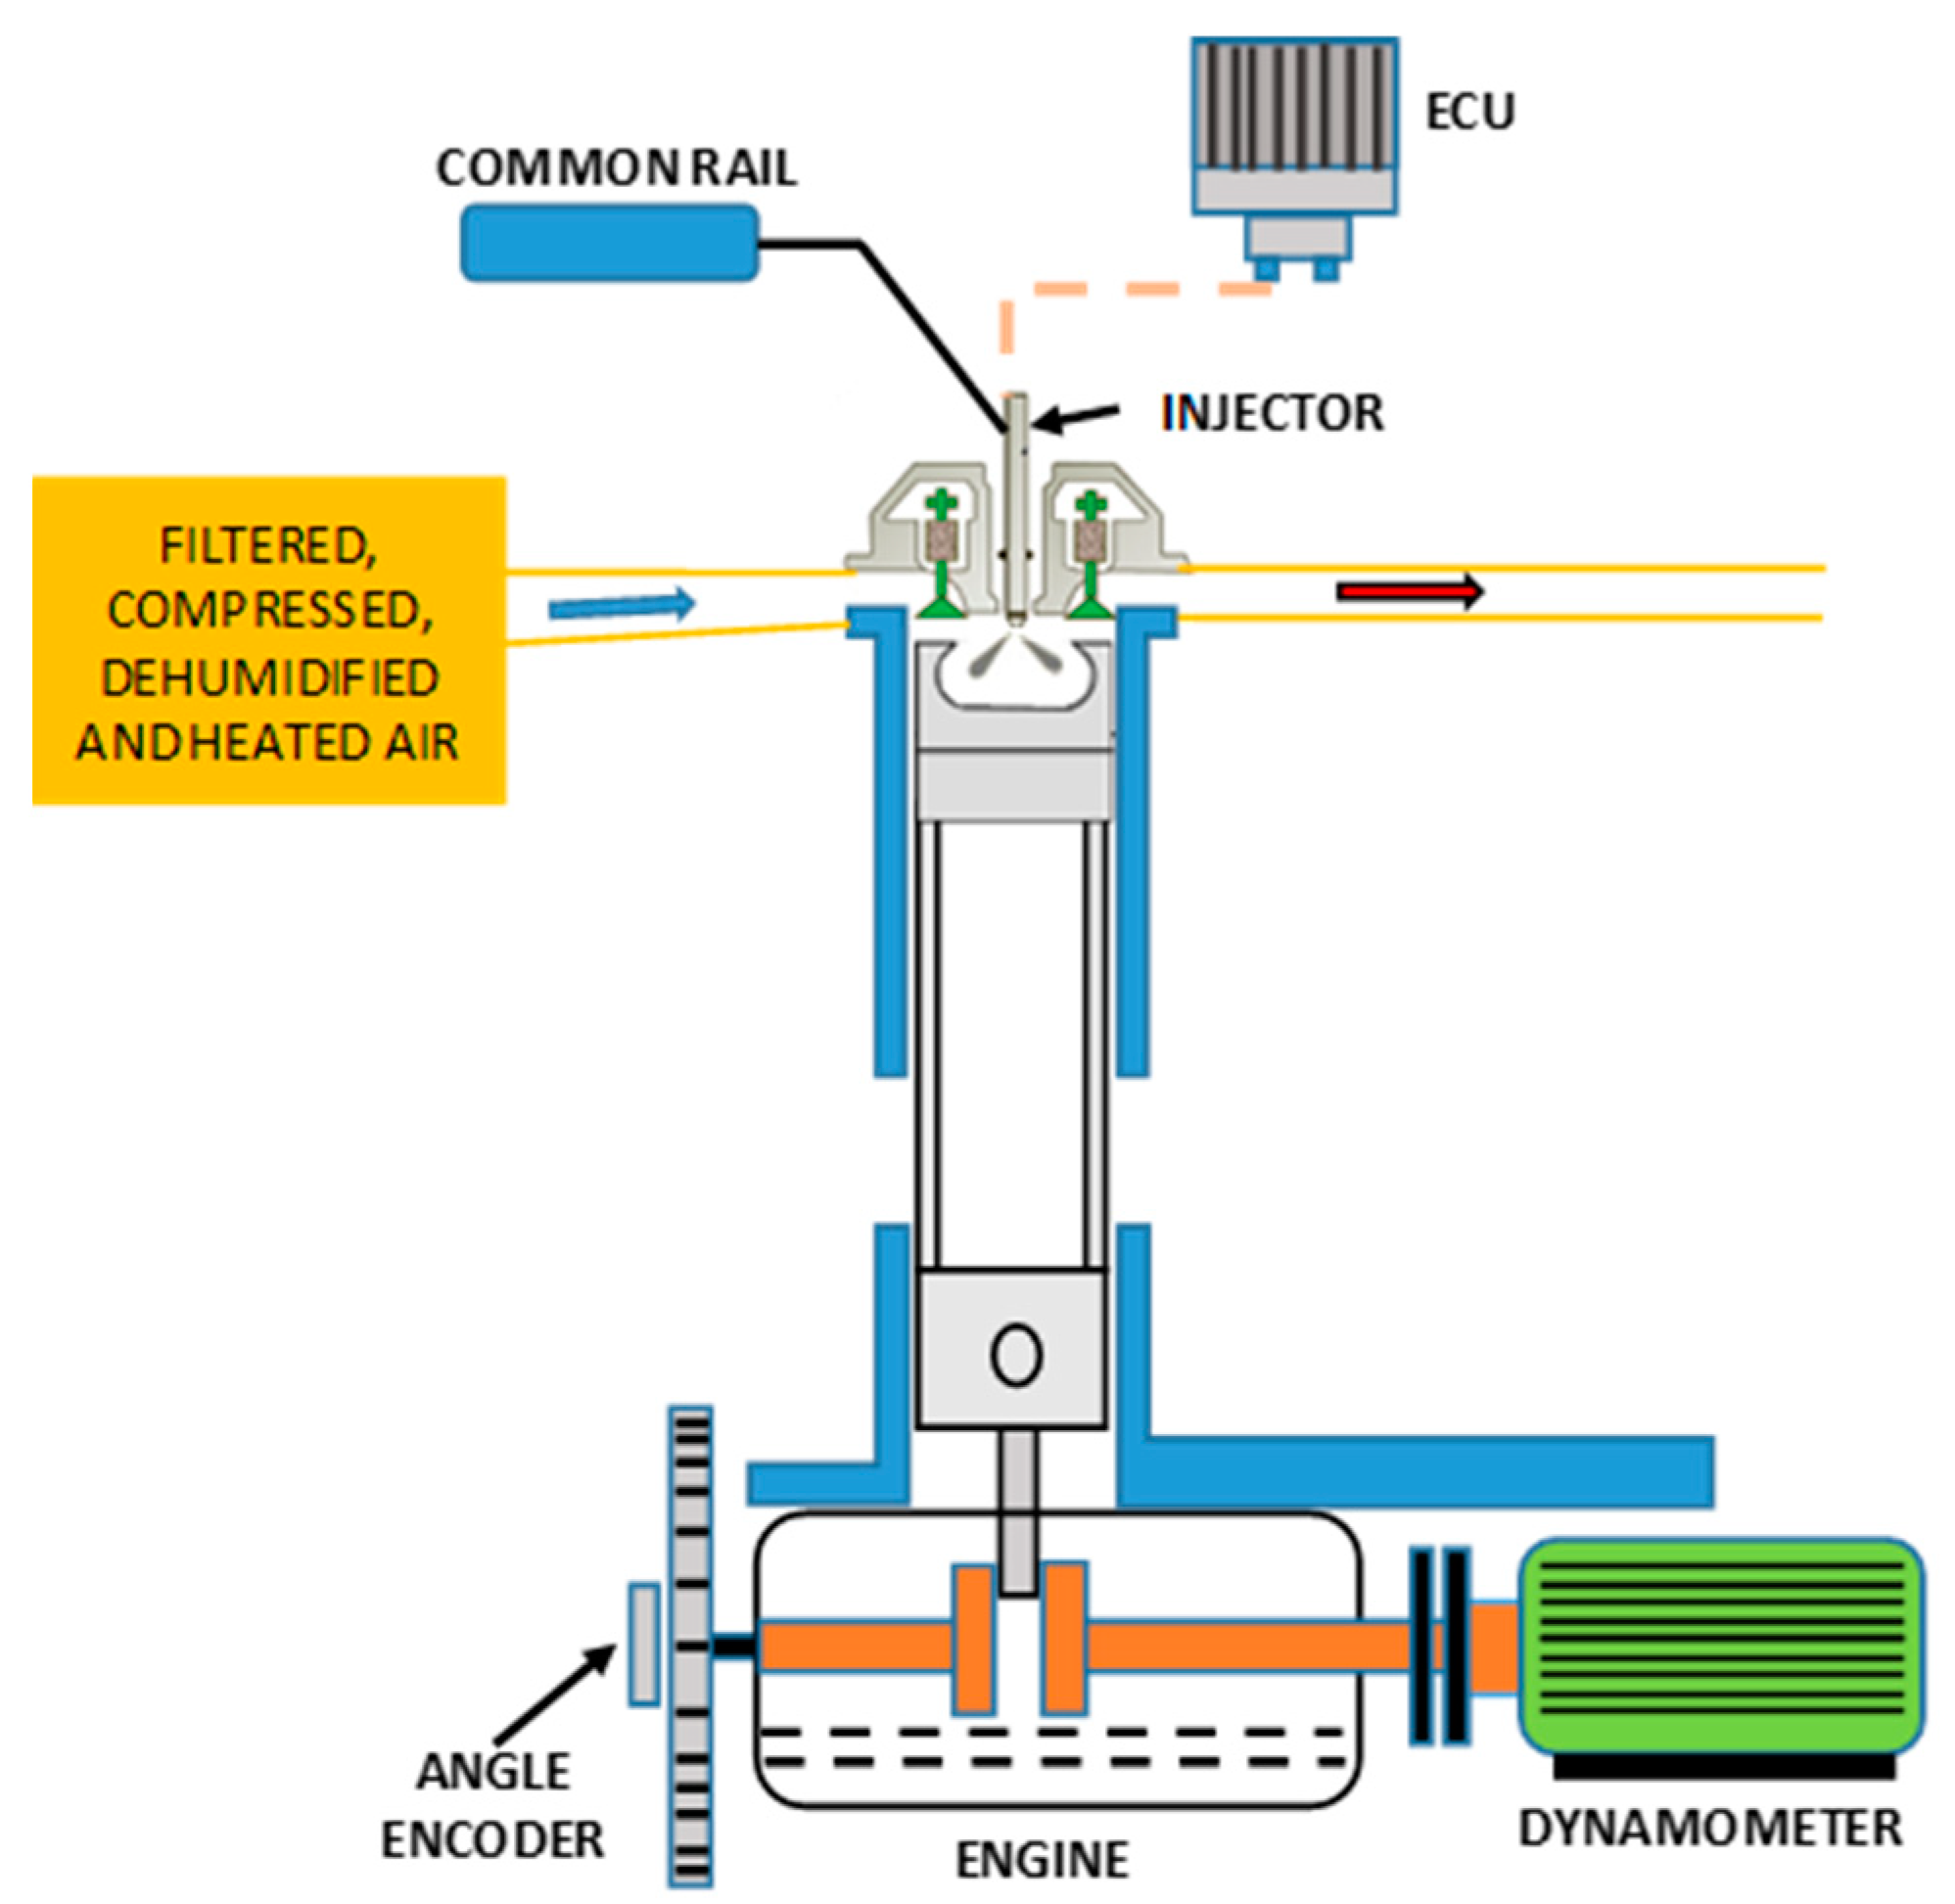
A single-cylinder compression ignition optical engine is equipped with the combustion system architecture and injection system of a modern four-cylinder engine for passenger cars. A schematic of the engine is reported in Figure 1 and its specifications are listed in Table 1. The engine has a characteristic extended piston with a crown window of 46 mm diameter; optical diagnostics is performed via a 45° inclined mirror placed inside the extended piston. The material of the window is sapphire [26]. Pressurized, conditioned intake air is provided by an external air compressor. A solenoid-driven injector and a common rail injection system are managed by a fully opened electronic control unit. A piezoelectric pressure transducer measures the in-cylinder pressure. The heat release rate is derived by applying the first law of thermodynamics and the perfect gas model [27] from the ensemble-averaged curve of in-cylinder pressure over 200 consecutive cycles.
The engine working conditions are collected during the Worldwide harmonized Light vehicles Test Cycle (WLTC) and derived from a D-class vehicle. The engine speed is 1500 rpm and there are two values of brake mean effective pressure (BMEP): 2 and 5 bar; labeled 1500 × 2 and 1500 × 5. Table 2 describes the tested points. The indicated power (IP) is calculated by multiplying the indicated mean effective pressure (IMEP) by the displacement and dividing by the duration of one combustion cycle.
Temperature Measurements of the Piston Window
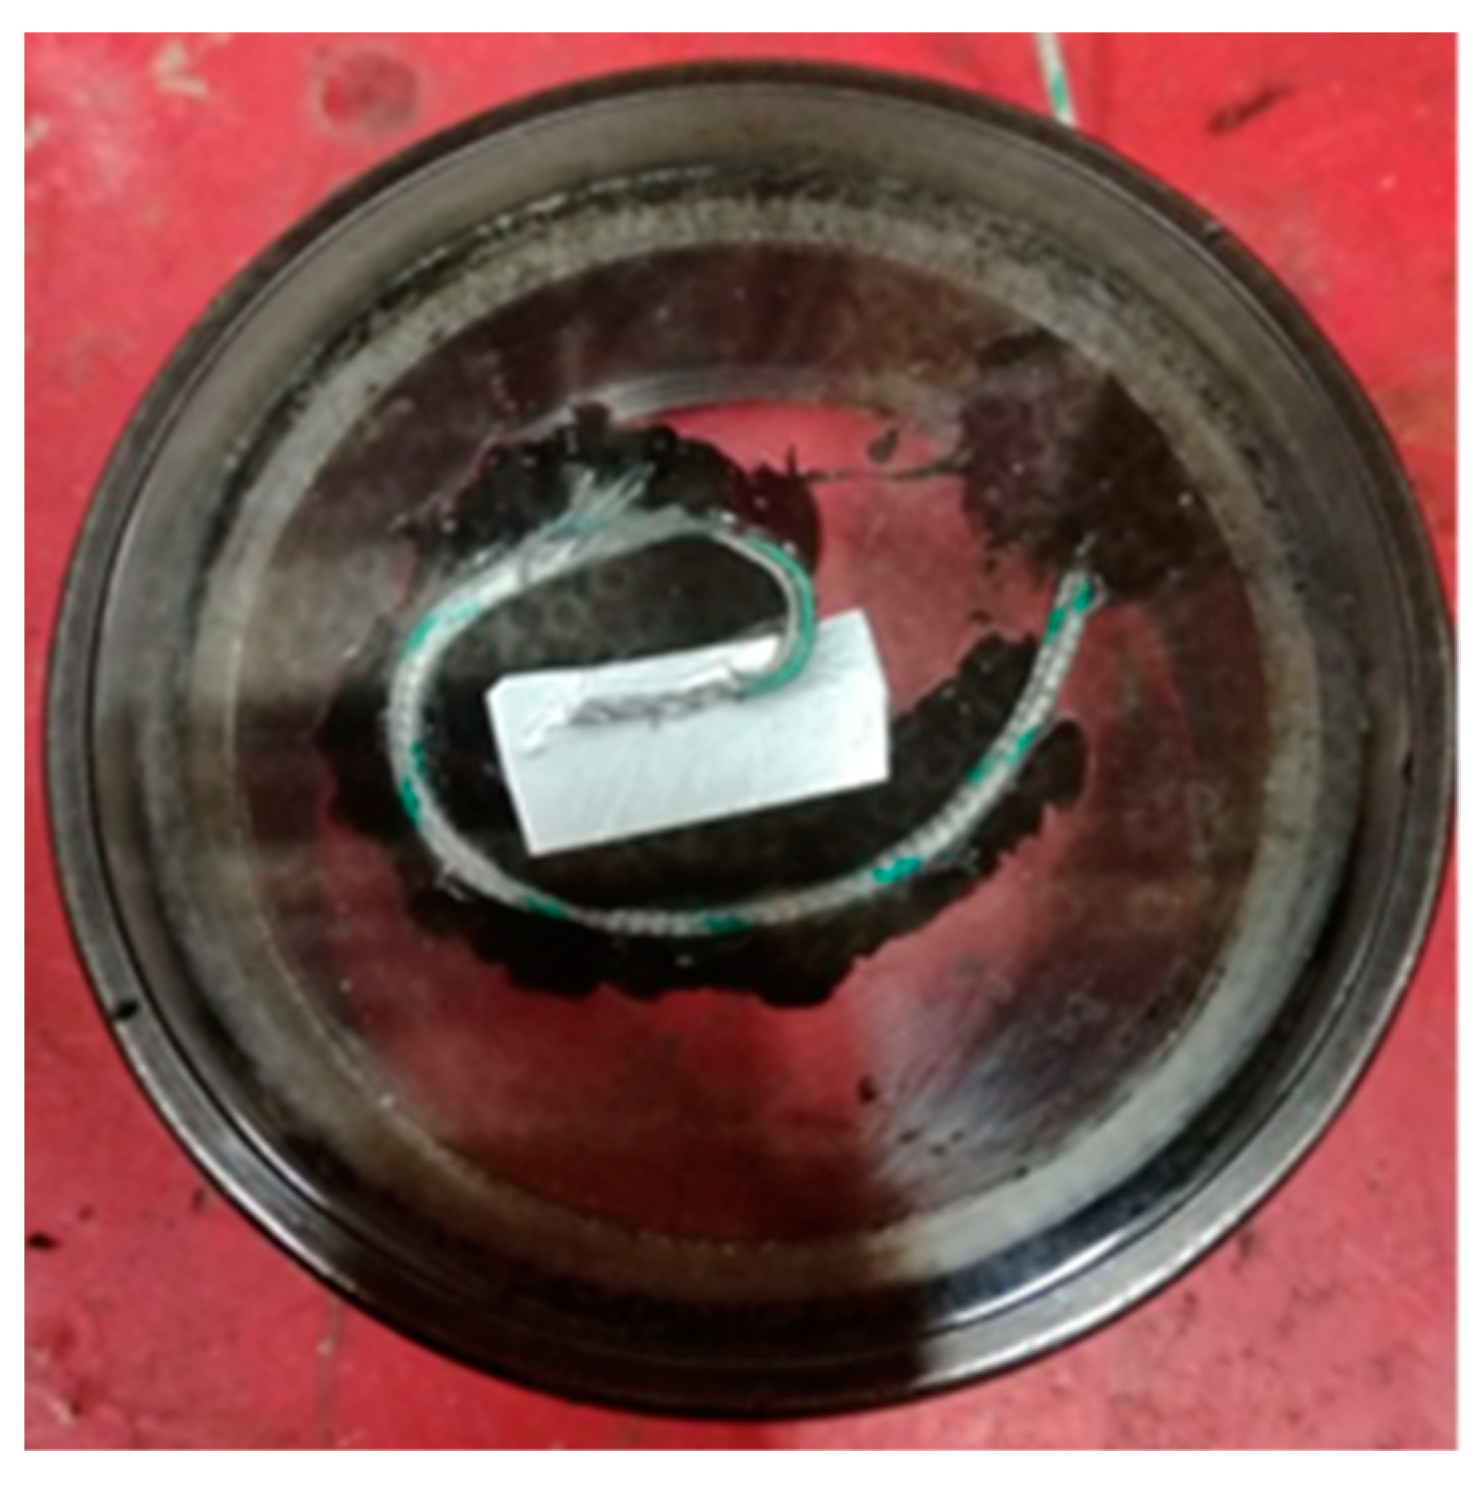
The external temperature of the piston window is measured once per cycle with a K-type sheathed thermocouple. It has an accuracy of ±1.5 °C and a sensitivity of 41 µV/°C. It works up to a maximum temperature of 450 °C, which was selected according to the literature [28]. The thermocouple is fixed to the window using silicone glue that resists up to 400 °C (Figure 2). Temperature measurements of a moving component inside the engine have always been very challenging because of several issues concerning the set-up and data transmission. For instance, there can be problems with the sensor fixation, wire bending, fatigue phenomena, and connection with external support for data acquisition. To allow the piston to move from the top dead center (TDC) to the bottom dead center (BDC), the thermocouple wire must be long enough to avoid stretching. However, a long wire can be worn out by contact inside the elongated piston. During this study, several installations using a wire connection between the thermocouple and the acquisition system were tested and failed. The main cause of failure was the breaking of the wire, which occurred in different locations depending on the type of installation.
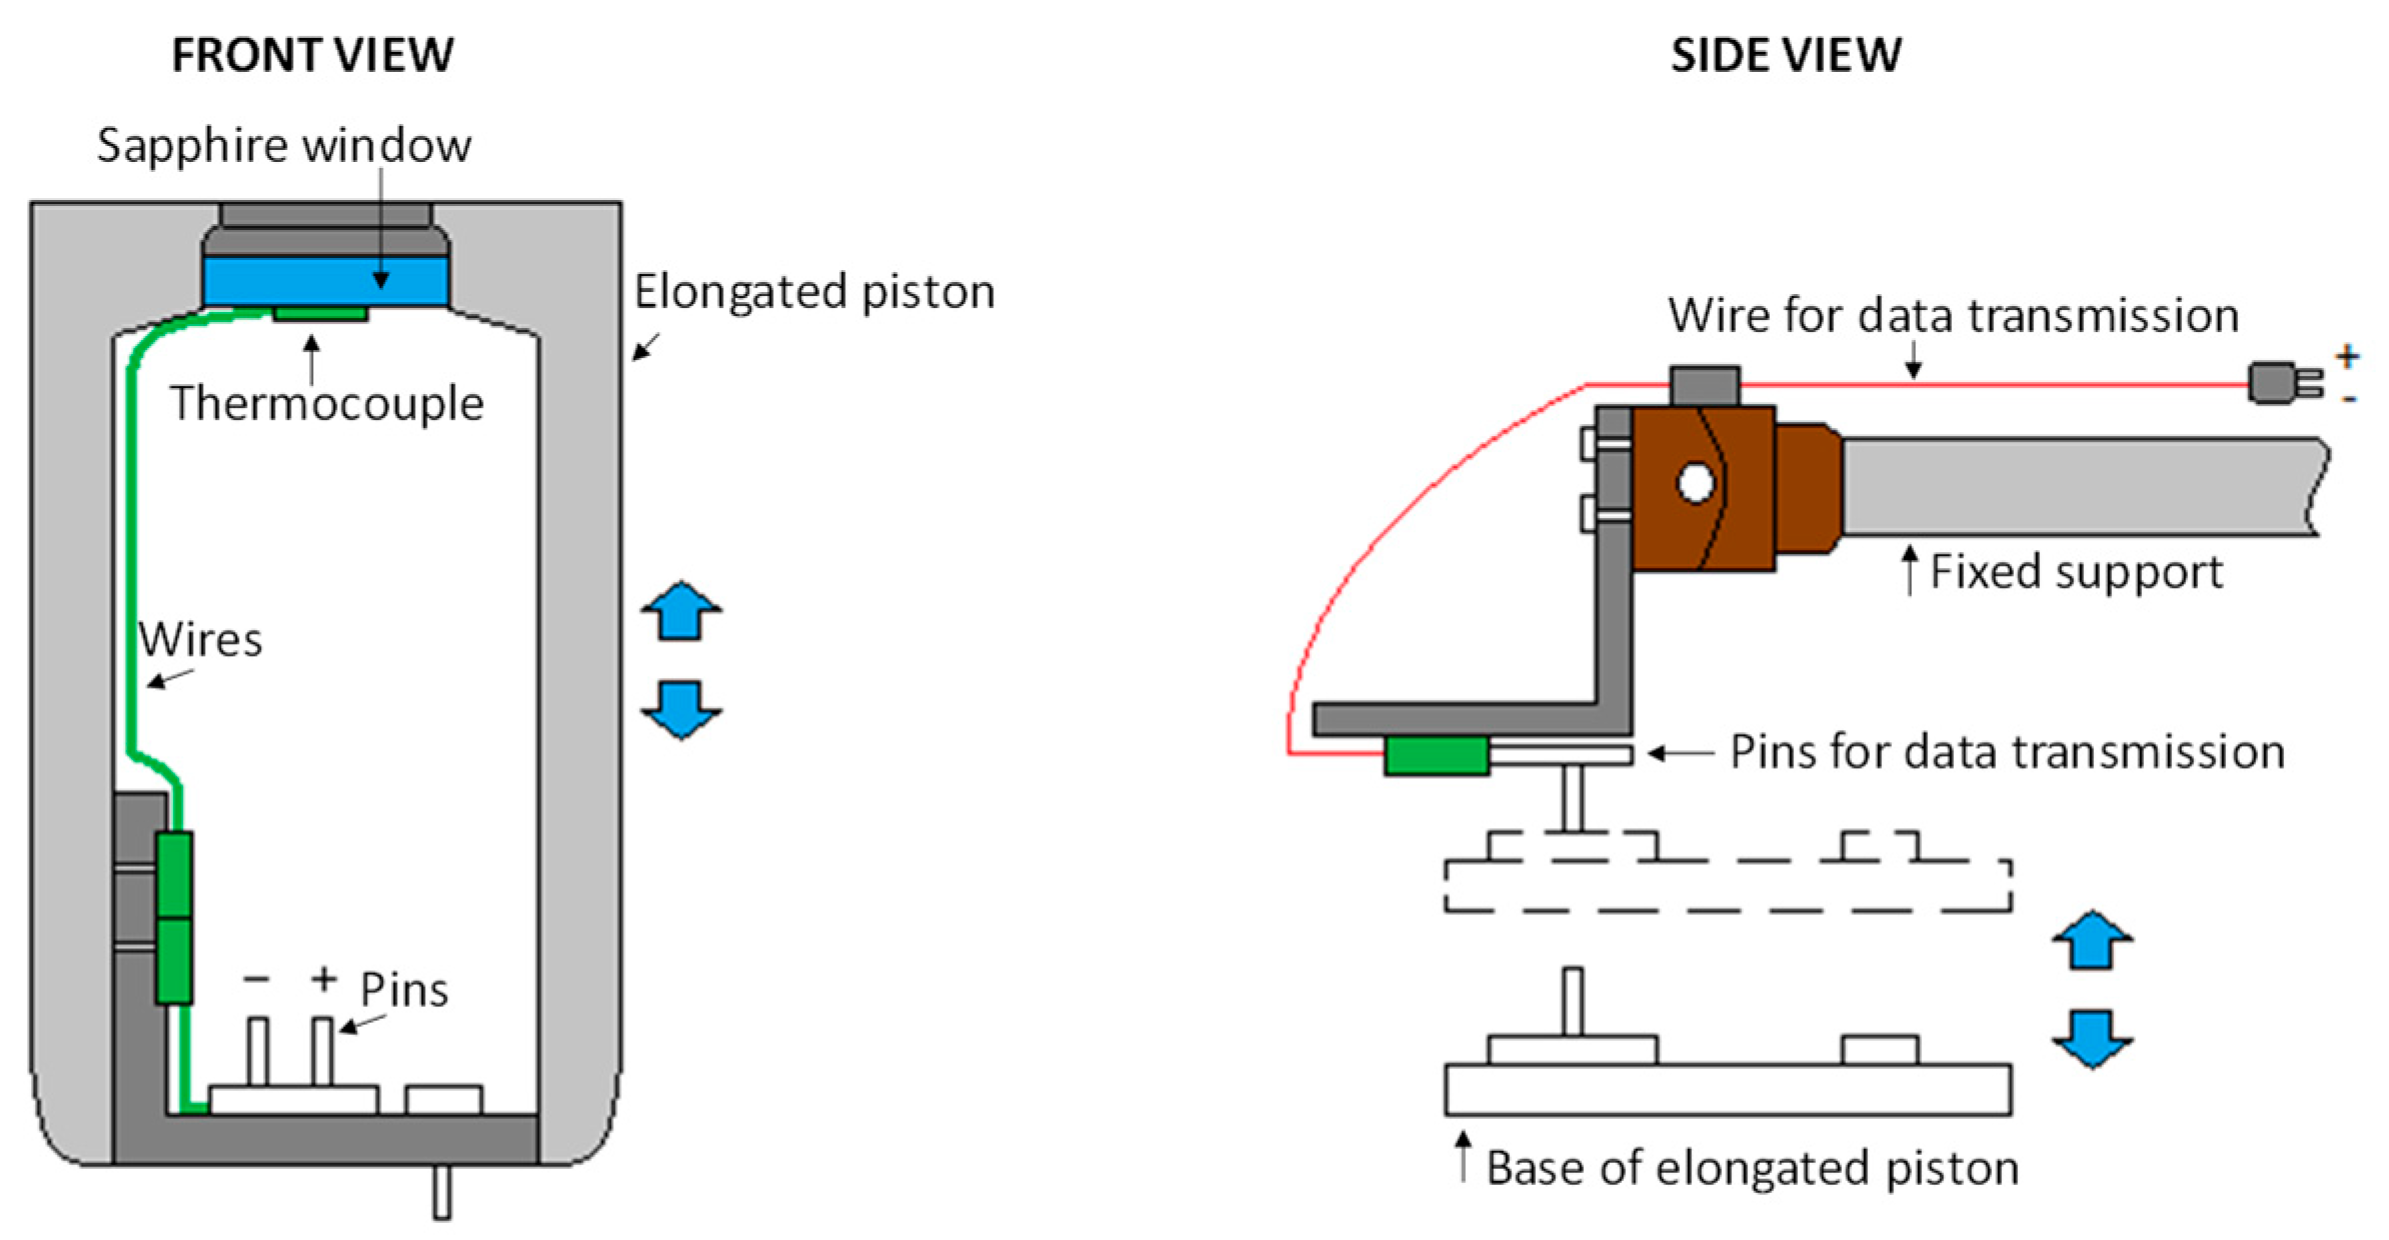
However, all the tested methods using wires were not reliable; therefore, a new solution is adopted to transmit the signals. The thermocouple, which moves with the piston, and the acquisition system, which is fixed, are both disjointed. The contact between them is realized in a particular way to occur only once per cycle. The mobile part (piston) and the fixed part (acquisition system) are in contact only at the TDC at the closed valves. Hence, one value of window temperature is obtained for each engine cycle. The acquisition system designed for this application is reported in Figure 3. It is composed of a K-type thermocouple with the hot joint glued to the sapphire window and another thermocouple that goes down, inside the elongated piston, and up to a plate with two free pins. To send the signal to the acquisition module, a connector with two plates is placed on the fixed support that protrudes into the elongated piston. When, at the TDC, the piston is at the highest position, the two pins and the plates of the connector come into contact, transmitting the voltage signal. The measured temperature is visualized as a curve versus time. The acquisition frequency is one measurement per combustion cycle and depends on the engine speed.
2.2. The Battery
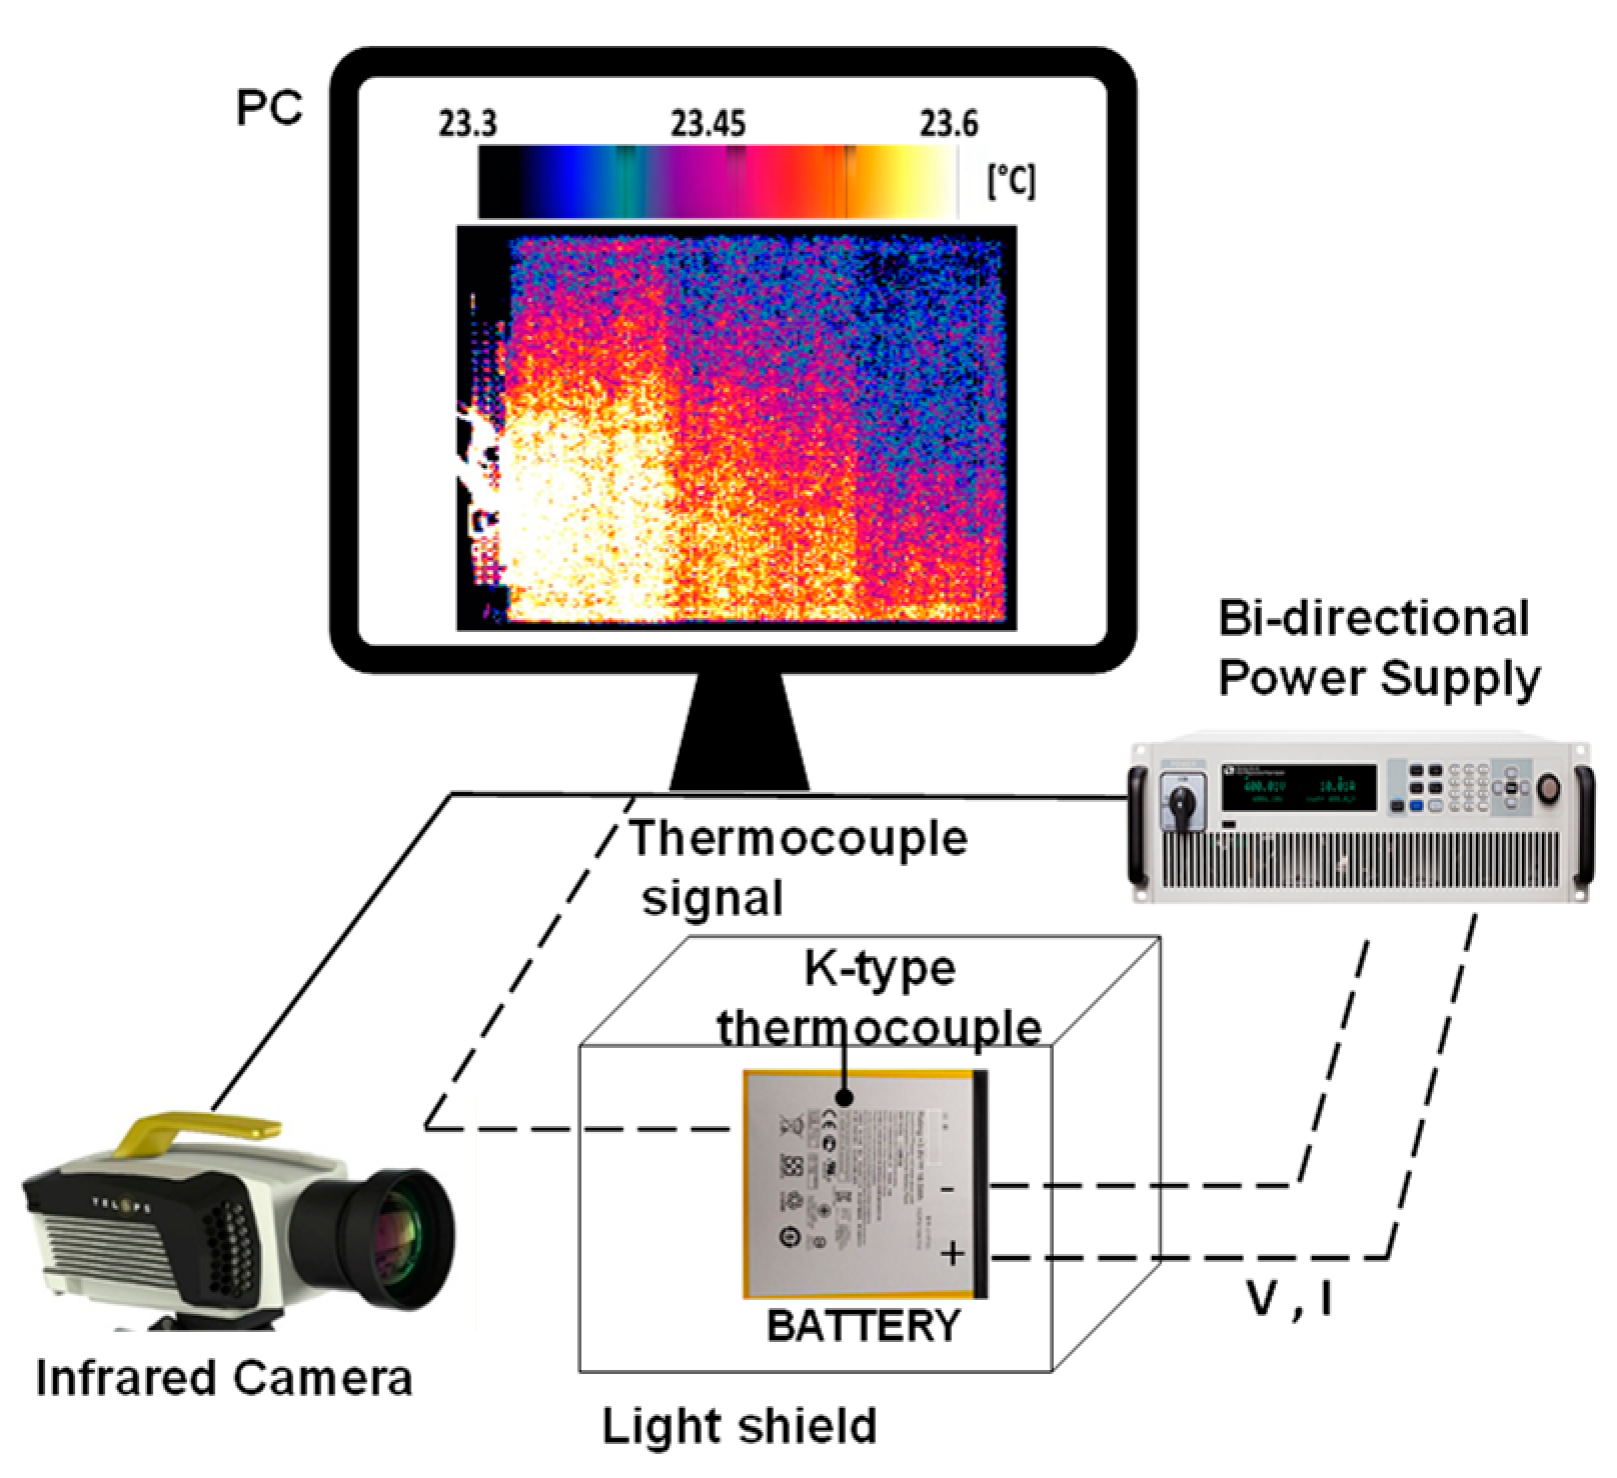
Figure 4 shows a scheme of the experimental setup used and two images of the battery with visible (left) and infrared (right) cameras. The battery is a Li-polymer battery of the kind that could be part of a battery pack in a hybrid/electric vehicle. It has a capacity of 4890 mAh, a discharge nominal voltage of 3.8 V, and a rated power of 18.5 Wh. The battery dimensions are 100 × 110 × 3 mm. The weight is 75 g, resulting in a specific capacity of 65.2 mAh/g. The current collectors are made of aluminum-tin alloy.
Infrared diagnostics is chosen because it has a higher sensitivity and resolution than thermocouples for the tests reported in this investigation. The low currents produce small variations of temperature and the battery simulations require a preliminary analysis of the temperature homogeneity of the battery surface.
In this work, a test box is built to carry on the experimental investigation on the battery. The wall inside the box is covered with a black coating to prevent reflections in the infrared band. Moreover, the incidence of radiation from the surrounding environment is blocked by an additional shield placed around the optical access to avoid alteration of the measurements. The battery is placed vertically and it is supported by an adiabatic material to avoid the exchange of heat towards the supports. Further, the surface of the battery is coated with a rough material with high emissivity in the infrared to reduce the reflected radiation and increase the accuracy of the measurements. The measurement conditions are controlled by dry-bulb temperature and relative humidity.
The tests are composed of a process of two discharge phases and one charge phase. The discharge phase lasts until a State Of Charge (SOC) of 50% is reached. Using a current of 1 C, which would completely discharge the battery in 1 h, the test’s duration is 0.5 h; for a current of 0.5 C, the test lasts 1 h. The resting phase is recorded for about 15 min to allow the battery temperature to return to the ambient temperature; more details about the tests are reported in Table 3. A bi-directional power supply (IT6015C) from ITECH® and its integrated digital acquisition system are used to record and monitor the voltage and the current signals. The thermal camera measures the 2D battery temperature across the surface. The infrared measurements refer to the range of 3.0–5.5 µm. Every 10 s, one image is recorded with an exposure time of 260 µs. This ensures good image quality and prevents saturation phenomena. The infrared camera is calibrated and checked by the supplier during regular maintenance. According to the camera test report, the median error of the detected temperature is 0.05 K with a standard deviation across the image of 0.11%; the maximum temperature error is 0.2 K at 50% of well filling. The data of local temperature detected by the camera are validated with the values of a K-type thermocouple placed on the top-left corner of the battery. The thermocouple has an accuracy of ±1.5 °C and a sensitivity of 41 µV/°C. Its signal is managed and recorded with an I/O analog module and a homemade acquisition interface.
Temperature Measurement of the Battery Surface
The temperature of the battery is derived from the infrared images via a post-processing procedure. Two targets are identified in the image: the battery and the background, which gives information on the ambient temperature, checked with the ambient temperature sensor value. The raw values of the pixels for the two targets are first corrected using the emissivity value and the ambient temperature. The images provide a bi-dimensional distribution of the temperature across the battery surface. Local peaks and gradients of temperature are analyzed to investigate the surface homogeneity.
In the bottom-right part of Figure 4, the infrared image shows a maximum temperature gap of 0.3 °C from the current collectors in the top left corner to the bottom right part. This value corresponds to 1.3% of the average temperature across the battery surface and, for this reason, it is considered not significant. Then, the battery temperature distribution is assumed as homogeneous and the lumped parameter model can be used for thermal simulation. The average temperature is considered instead of the local one. The evaluation is performed both for the background and for the battery surface. The temperature values are collected over time for all the images and then plotted.
3. 1D Thermal Model of the Piston in Transient Conditions
3.1. System Main Characteristics
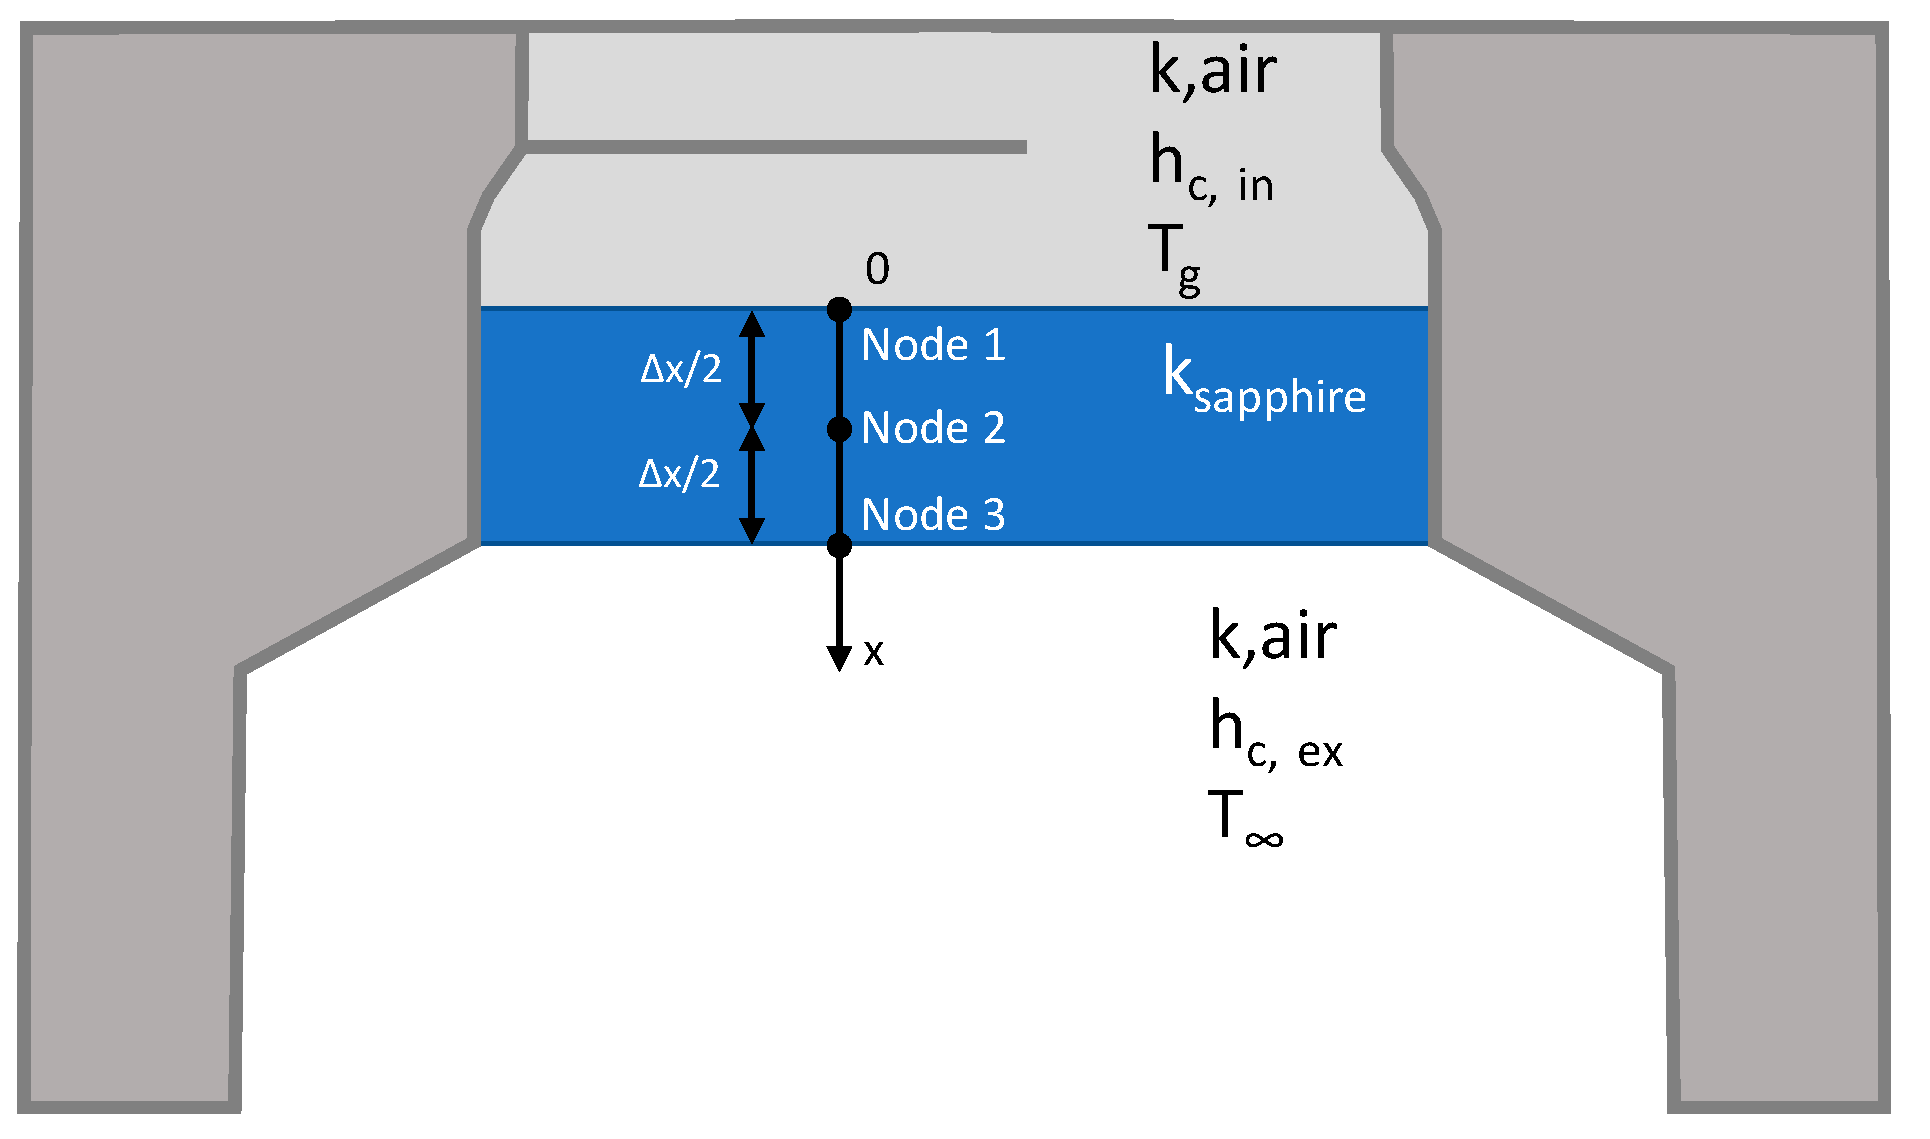
A mono-dimensional (1D) model of heat transfer through the window is set up to evaluate the temperature of the sapphire during the transient engine operation. The path from inside the cylinder to the bottom of the window is discretized into three nodes: one “skin node” relative to the in-cylinder side (node 1), one in the middle of the window (node 2), and another “skin node” on the external face (node 3) where the thermocouple is located.
A schematic of the model definition is reported in Figure 5, where the properties of the fluids and the material are also indicated. The in-cylinder temperature is variable over time while a constant value can be assumed in the external ambient temperature, below the piston window. Hence, the heat flux through the window is variable over time. With regards to the heat transfer modes, convective heat transfer is considered from the in-cylinder gases to the sapphire window surface, conduction across the window thickness, and convection between the external surface of the window and the ambient air inside the elongated piston. The radiative contribution of the flames to the heat transfer is not considered because the sooting flames have a short permanence time in the cylinder compared to the entire engine cycle (aspiration-compression-expansion-exhaust) [27].
The thermal status of the piston window can be described using the following balance equation:
where ‘m’ is the mass of the window, ‘cp’ its specific heat capacity, ‘t’ the time, ‘Tg’ the in-cylinder gas temperature, ‘T∞’ the ambient temperature, ‘A’ the heat exchange area, and ‘h’ the internal or external convective heat transfer coefficient. The temperature of the window increases because of the heat exchange with the hot gas inside the cylinder and the fresh air below the piston, for the type of research engine under investigation.
3.2. 1D Thermal Model of the Piston
The finite differences method can be applied to solve the heat transfer problem. The equations used are reported below:
Node 1 (combustion chamber side)
Node 2 (inside the window)
Node 3 (external side)
where ‘T’ is the unknown temperature of each node, and ‘H’ and ‘K’ are non-dimensional terms relative to convection and diffusion, respectively, defined as follows:
with ‘h’ being convective heat transfer coefficient, ‘ρ’ sapphire density, ‘α’ sapphire diffusivity, ‘cp’ sapphire specific heat at constant pressure, and ‘∆x’ the window thickness. ‘∆τ’ is the characteristic time, calculated as:
where ‘λ’ is the kinematic viscosity.
3.3. Evaluation of the Convective Heat Transfer Coefficient
The term ‘H’, used in Equations (2) and (4) for the “skin nodes” and defined in Equation (5), considers the convective heat transfer coefficient. Different correlations are used according to the location under examination. For node 3, the assumption of fluid below a hot plate is made [29]. The convective heat transfer coefficient for the external face, ‘hc,ex’, is:
with ‘Ra’ being the Rayleigh number, ‘ka’ the conductivity of air, and ‘L’ the characteristic length, which is the window diameter. Additional information on the values used in Equation (8) is reported in [17]. For the internal side of the window, Woschni’s correlation [27] is selected. The convective heat transfer coefficient for the inner face, ‘hc,in’, is calculated as:
where ‘B’ is the cylinder bore, ‘p’ the measured in-cylinder pressure, ‘T’ the temperature, and ‘v’ the average cylinder gas velocity, defined as:
where = 2cn (c is the stroke and n is the engine speed), ‘V’ is the displaced volume, ‘T0’, ‘p0’, and ‘V0’ are the temperature, pressure, and volume at a reference instant (inlet valve closure at −132° crank angle), and ‘pm’ is the motored cylinder pressure trace.
4. 1D Thermal Model of the Battery in Transient Conditions
4.1. System Main Characteristics
The chemical reactions between the electrodes inside the battery and the Joule effects due to the current flow [30] produce battery heating during the working phase. The power generated per surface unit, , is correlated to the current and the voltage values according to the following equation:
where I is the current, Voc is the open-circuit voltage, and V is the actual voltage. represents the heat generated by the cell polarization and considers the reversible change of entropy in the cell. This derivative term is very small and, in the literature values lower than 0.001 V/°C are found [31]; therefore, the difference between the open-circuit and the actual voltage is the main driver of power loss. In general, the Voc can be measured after a long resting time of the battery and the actual voltage can be detected online during the functioning.
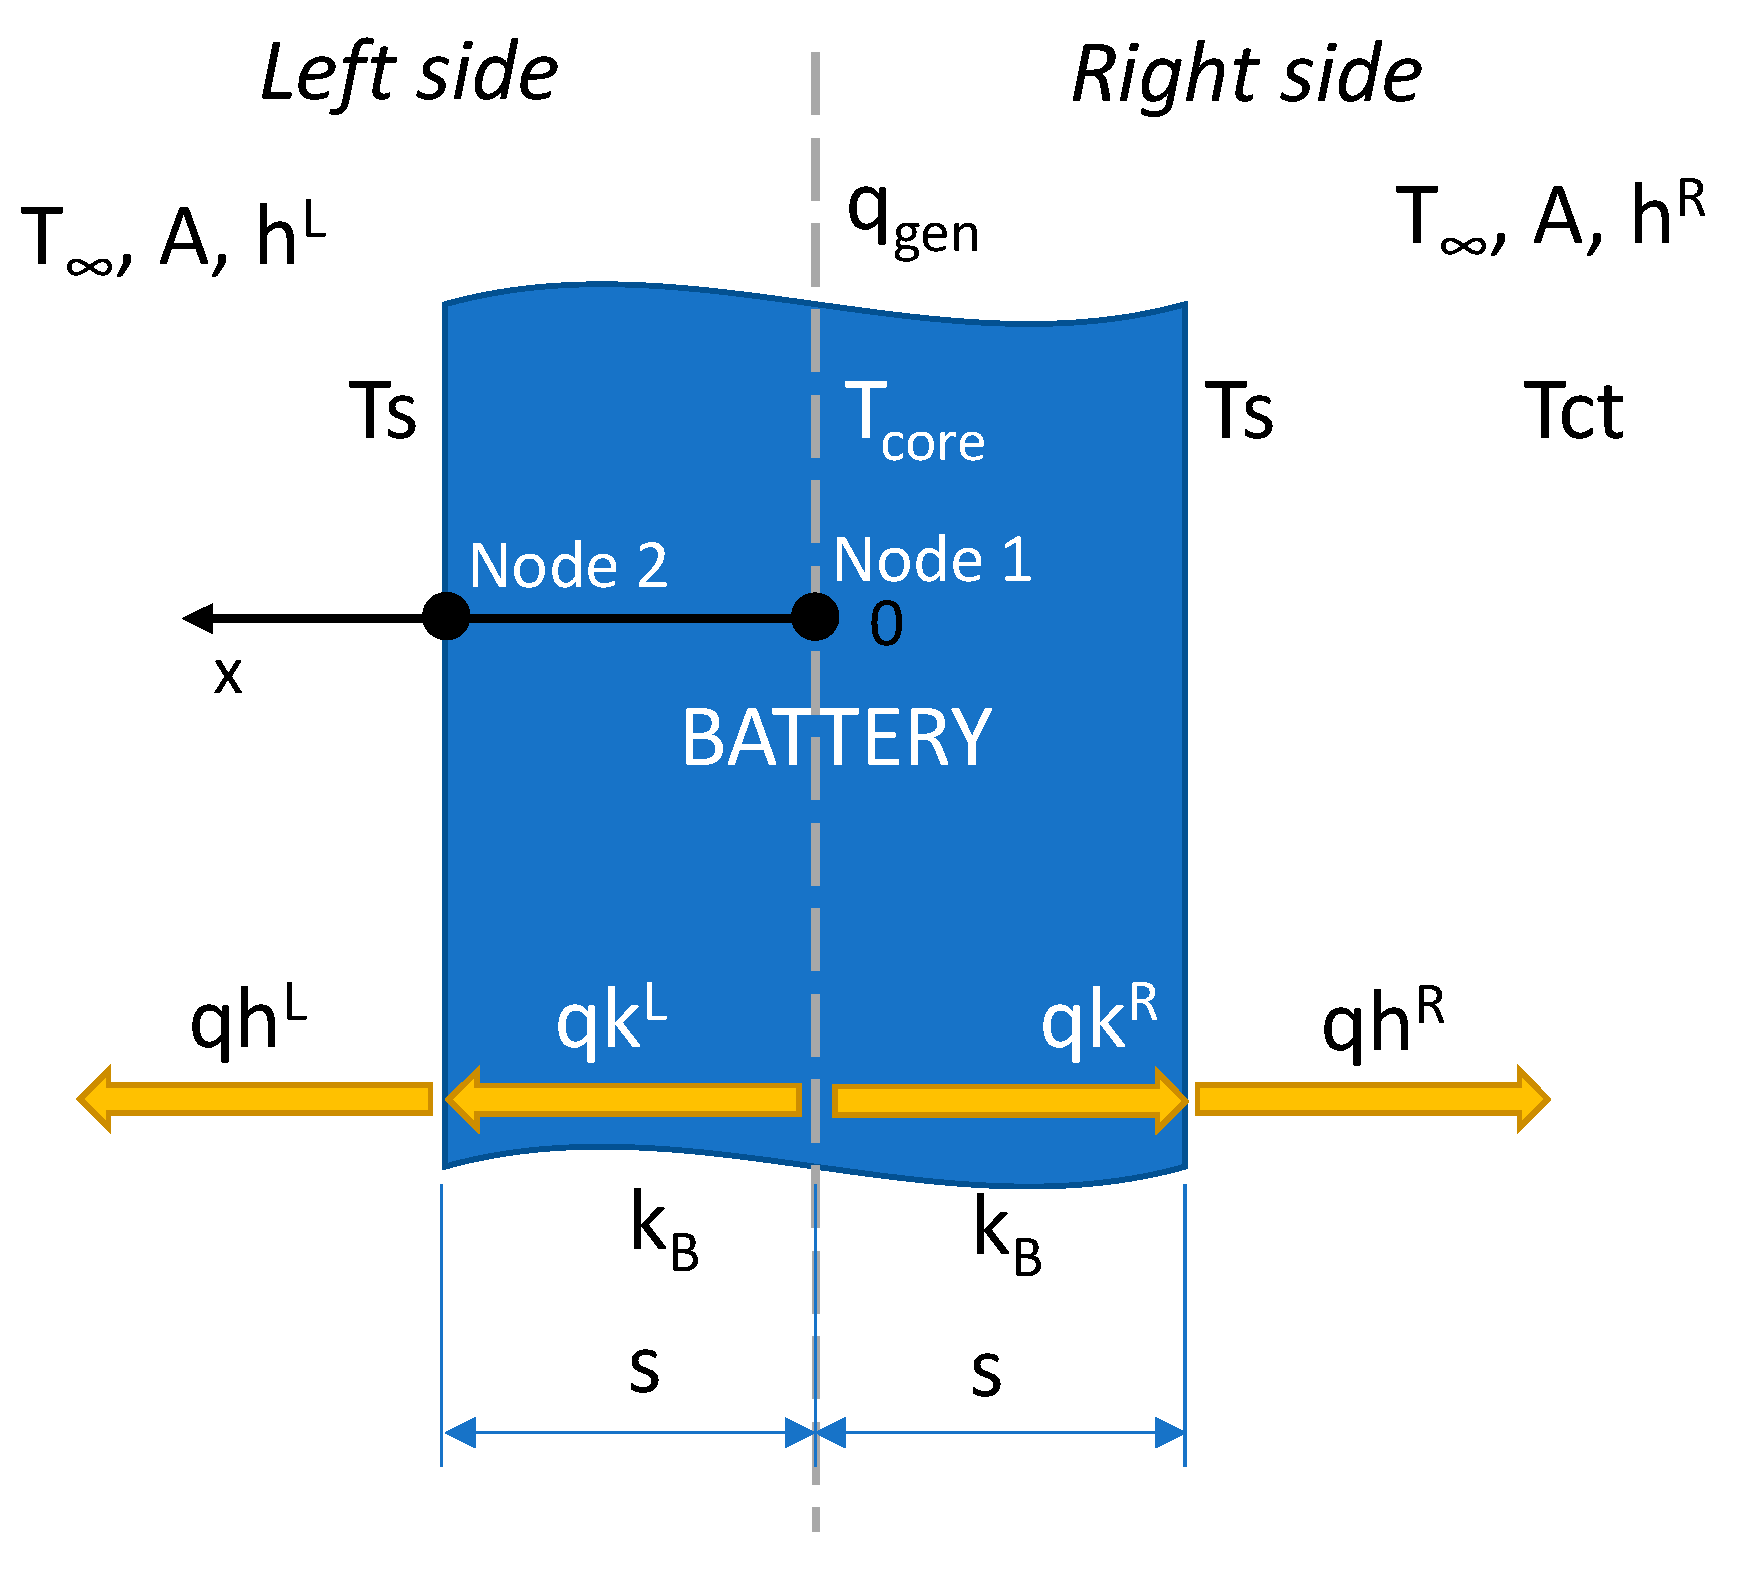
In this work, the Biot Number (which compares the effects of convection and conduction) is much lower than 1 (Bi << 1) due to the small thickness of the battery [32]. As such, the lumped parameter model is used. The thermal status of the battery is described by the following balance equation:
where ‘m’ is the mass of the battery, ‘cp’ its specific heat capacity, ‘t’ the time, ‘Ts’ the battery surface temperature, ‘T∞’ the ambient temperature, ‘A’ the battery surface area, and ‘h’ the convective heat transfer coefficient. The temperature of the battery increases because of the internal heat generated and decreases due to the heat exchange with the surrounding ambient air. Figure 6 reports the scheme of the thermal model of the battery.
4.2. 1D Thermal Model of the Battery
To perform a specular analysis of the two investigated systems, also for the battery, the finite differences method is applied to solve the heat transfer problem, differently from previous works [24,25]. Battery symmetry has been considered for the analysis and two nodes have been identified: the temperature of the core, ‘Tc’, and that of the surface, ‘Ts’. The equations used are:
Node 1 (core temperature)
Node 2 (surface temperature)
where ‘Tc’ and ‘Ts’ are the unknown variable for each time step, ‘k’ is the thermal conductivity of the battery, and ‘s’ is the thickness.
4.3. Evaluation of the Convective Heat Transfer Coefficient
When the battery reaches the stationary condition, Equation (12) simplifies:
Knowing the internal heat generation and the battery surface temperature from the experimental test, the convective heat transfer coefficient is determined. The value of ‘h’ is evaluated for a series of tests with different current loads and ambient temperatures in the range of 20–40 °C and an average value of 26 W/m2 K is taken [25]. This is used as an input parameter in the finite-difference model above.
5. Results and Discussion
In this section, the temperature measurements in the engine and on the battery are presented and discussed, illustrating the phenomena involved in the processes. Then, these are modeled using the equations presented above to reproduce the thermal behavior in transient conditions. Finally, the collected data are used to evaluate the extent of the heat losses on the total delivered power.
5.1. Analysis of the Temperature Transient in the Engine
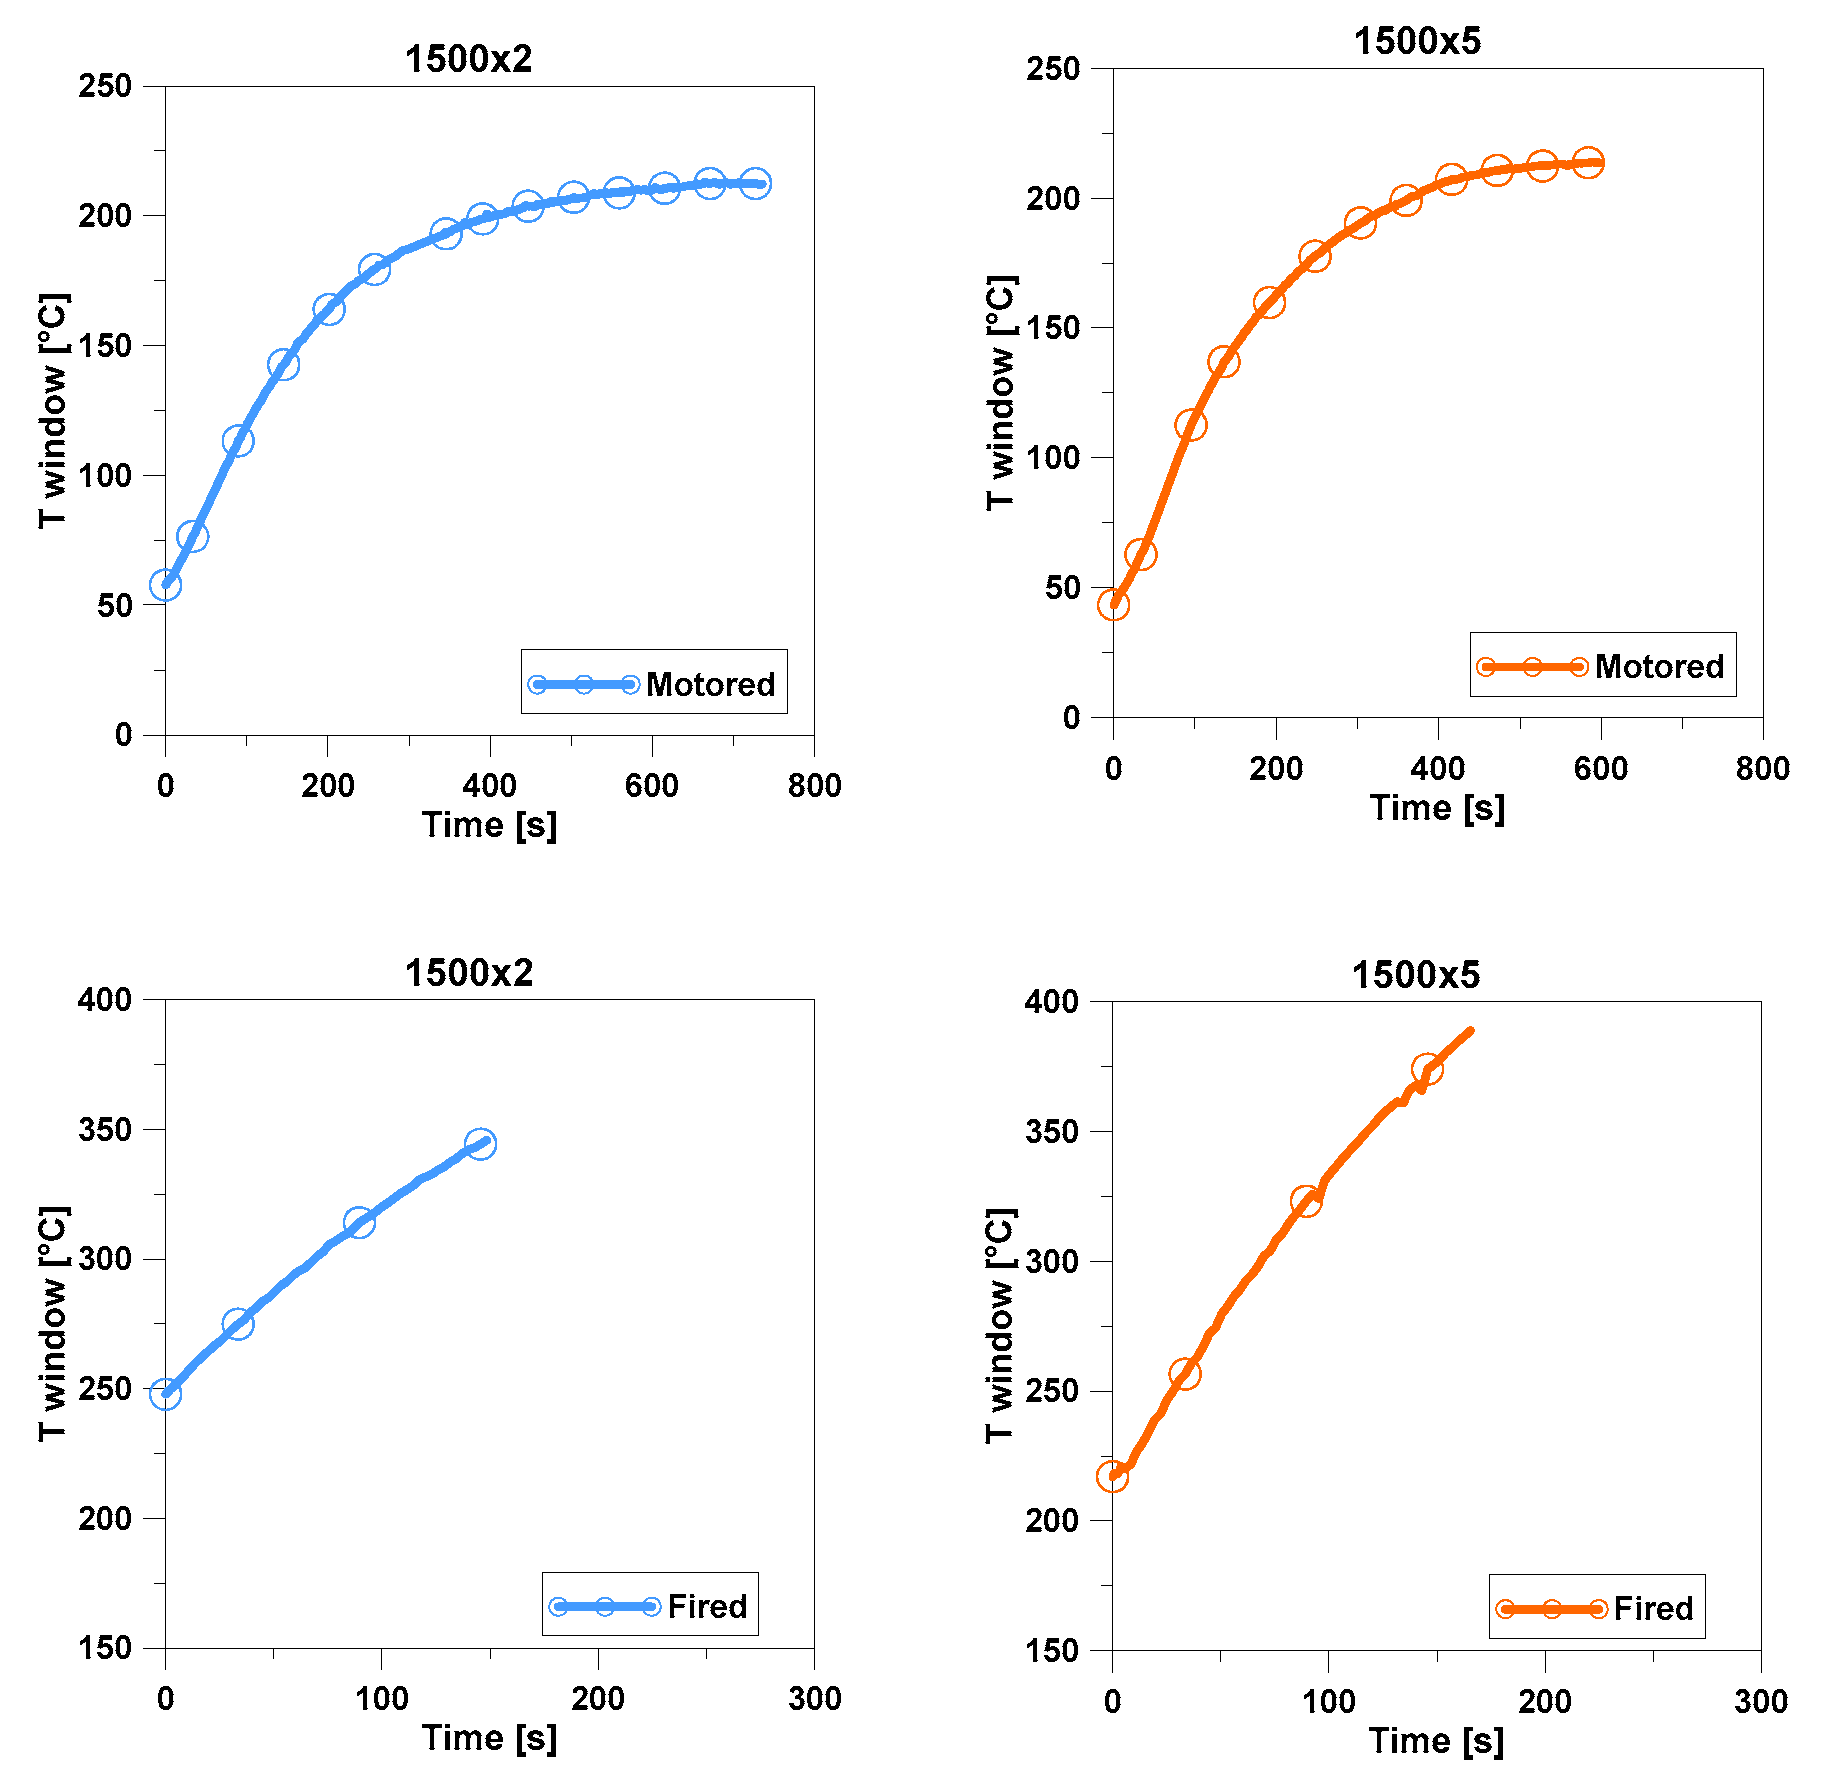
For the piston in the engine, two transients of temperature are investigated: the first is during the warm-up of the research engine and is not typical of real engines, and the second one occurs when the engine is switched from motored conditions (no fuel injection) to fired conditions (fuel injection and combustion). While the first case is required for the preliminary set up of the single research engine operation, the second can be representative of a real engine in the case of an accelerator pedal release and the following push at a constant speed. The tests concerned different engine loads at fixed engine speeds, in motored and fired conditions, according to the specifications of Table 2. In Figure 7, the data of temperature collected at an engine speed of 1500 rpm with 2 and 5 bar of brake mean effective pressure are reported.
For the motored data, one value of piston temperature is collected at each engine cycle over consecutive cycles during warm-up operation. The engine starts from the standstill condition and is warmed up, bringing and maintaining the engine water temperature at 50 °C, while the speed is increased up to the desired value with a ramp of 20 s. The measurement begins when the engine is started. For the fired mode, the measurement starts when the engine is in a steady motored condition and the injection is activated. The fired transient temperature cannot be investigated up to the steady-state because of the hardware limitations of the optical engine. Figure 7 shows that the test finishes (injection and combustion are deactivated) after about 150 s to preserve the experimental apparatus.
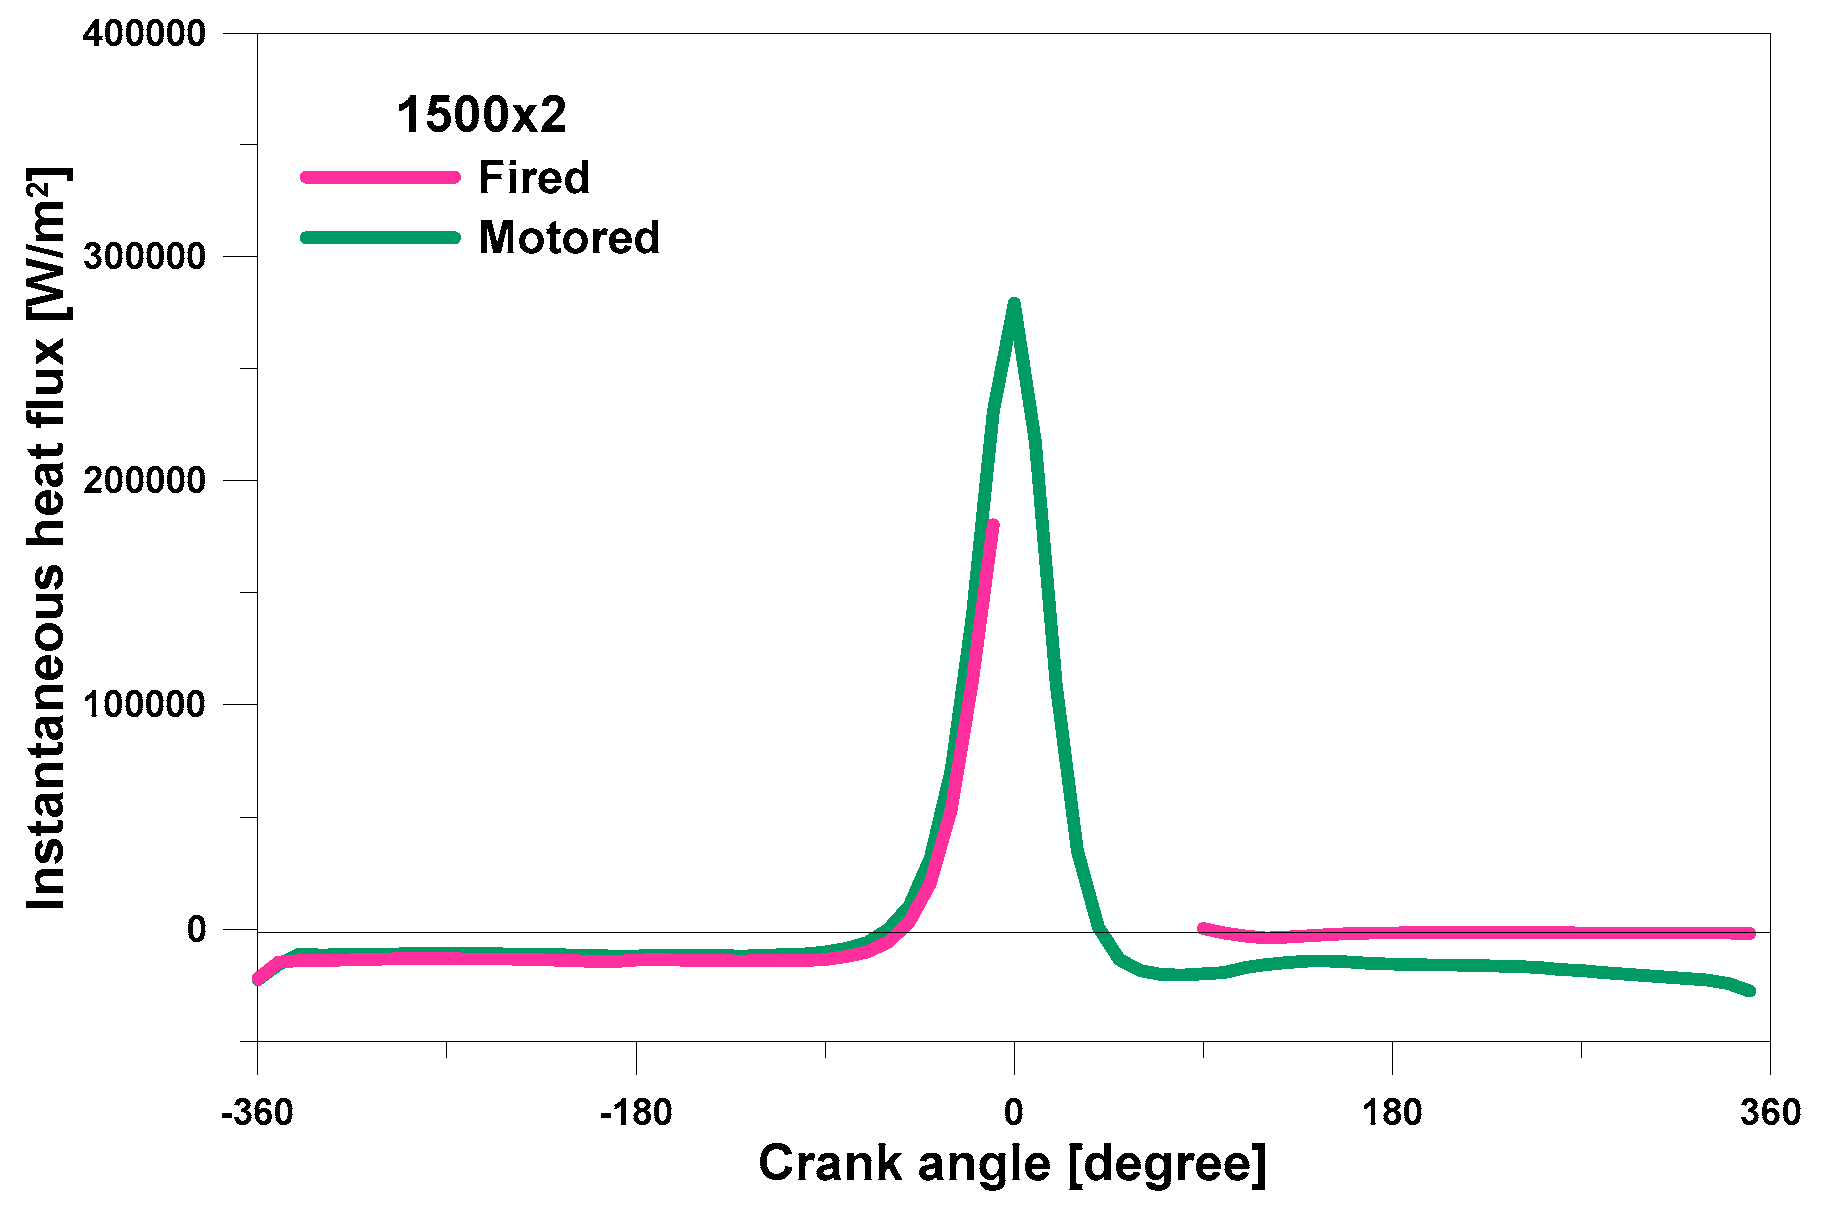
The transient of temperature in motored mode shows typical cooling/heating behavior characterized by an initial sharp slope and then a convergence toward a stationary value at the equilibrium. The rate of temperature variation is ruled by the difference in temperature between the object and the surrounding environment. In the present case, the piston window acts as a separator between the two environments, with different conditions above and below. The phenomena that drive the process are the heat exchanges of the piston window with the ambient air on the lower side and with the hot air inside the cylinder on the upper side. For the former, the heat exchange with the ambient air always has the same direction, from the window to the ambient air, because the temperature of the window increases over time while the ambient temperature remains almost constant. For the latter, the dynamic of the process is more complex. The aspired air in the cylinder coming from the inlet air collector has a fixed value of temperature and it is controlled according to the working conditions, which range between 40 °C and 55 °C. Hence, as the temperature of the window increases, the heat exchange with the air inside the cylinder has different directions across a complete engine cycle. This process can be better understood by looking at Figure 8. In a previous paper by the authors [33], the instantaneous heat flux between the piston window and in-cylinder air has been measured using high-speed, cycle-resolved, non-intrusive diagnostics for temperature detection. It can be seen that the heat flux varies according to the combustion phases. It is negative during the intake and exhaust strokes (the exhaust only in motoring) and it is positive for the compression and expansion strokes. This means that the temperature of the piston window is not easily predictable, it being the result of alternate cooling and heating processes with a high frequency of inversion and differing duration depending on the piston temperature itself. Concerning the heat transfer between the piston and the cylinder wall: at the start of the test, they are at the same temperature, and when the engine runs, their temperature changes in almost the same way, producing minor thermal flows that can be neglected in the present analysis. The result of the whole thermal balance between the piston window and air, inside and outside the cylinder, is a temperature increment of about +160 °C in 500 s for both cases shown in Figure 7, top.
Once the steady motored condition is reached, the fuel injection is activated and the combustion takes place. Then, the starting temperature of the fired mode corresponds to the stabilized value of the motored one. Again, from Figure 7, bottom, a sharp increase in temperature can be observed. However, even if the stationary condition in fired cases is not reached, the involved processes are the same as in the motored case but with higher in-cylinder temperatures and a more turbulent flow caused by the combustion process. Concerning the non-stationary phase, a higher temperature rate can be appreciated for the fired mode (about +1 °C/s) than for the motored mode (about +0.6 °C/s).
Due to the lack of information during combustion in the stationary condition, the model presented in the previous section, implemented and validated in [17], is used to predict the thermal behavior of the piston window in fire mode once the in-cylinder temperature and all the boundary conditions are known.
5.2. Modeling of the Temperature Transient in the Engine
The 1D model of heat transfer for the transient condition is used to simulate the temperature variation of the piston window during the transition from engine start to steady motored conditions and then up to the fired steady state. The time-variable in-cylinder gas temperature, derived by the in-cylinder pressure trace and the volume variation over crank angle and for consecutive cycles, is used as input for the temperature of the upper surface of the window (inside the cylinder). For the open-valves cycle, the temperatures measured in the intake and the exhaust manifolds are used. On the lower face of the window, a constant temperature of 35 °C is assumed.
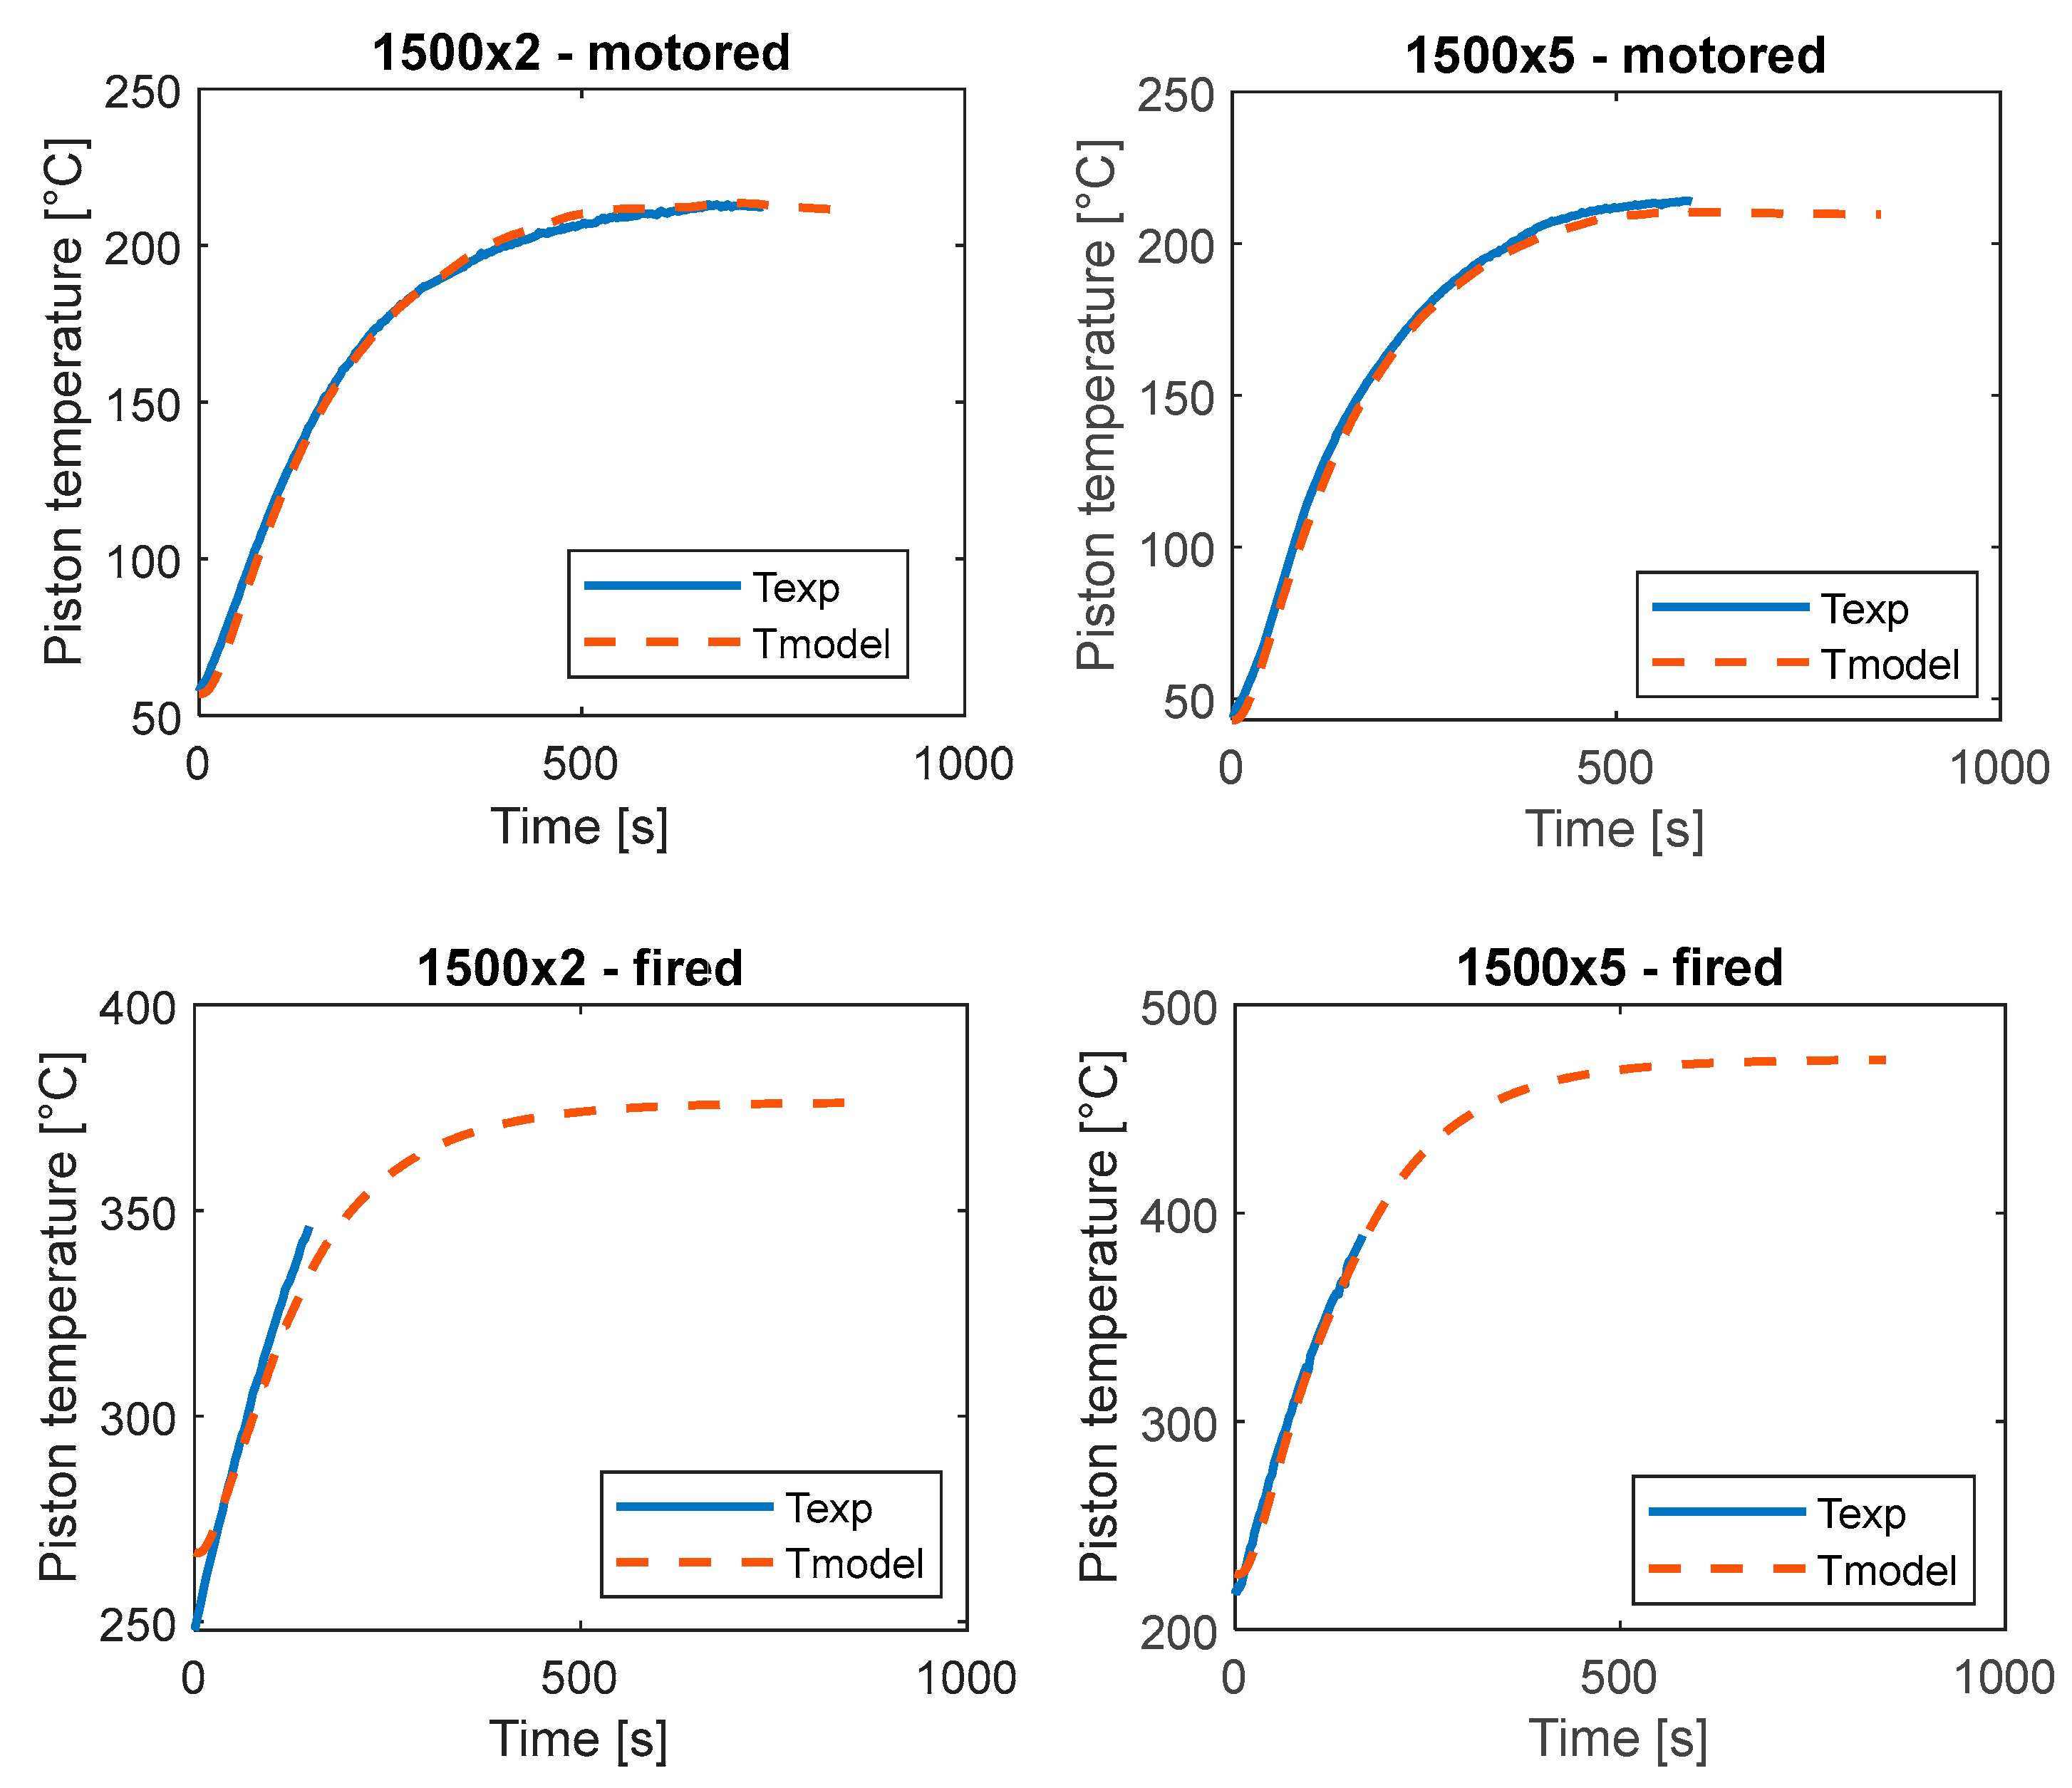
Figure 9, top, reports the model and the measured window temperature during the motored mode to assess the accuracy of the model. A good match of the curves can be appreciated. To quantify the difference between experimental and model curves, the Normalized Root Mean Squared Error (NRMSE) is calculated: it is 0.015 and 0.013 for the test 1500 × 2 motored and 1500 × 5 motored, respectively. Therefore, the model can be run in fired conditions to obtain information on the stationary phase not available from the experiments. The simulations in fired mode are reported in Figure 9, bottom, and compared to the available experimental data of temperature during the high-rate initial phase. The model shows a very good match with the data that are available up to 150 s; the values of NRMSE calculated in this interval are 0.066 and 0.033, at 1500 × 2 fired and 1500 × 5 fired, respectively. Therefore, the predictions for the stationary state (up to 800 s) can be considered reliable with this semi-empirical approach. At about 500 s the temperature settles, the same time was found for the motored condition. The final temperature value seems to depend on the engine load: a variation of about +120 °C is obtained for the low-load condition (2 bar of BMEP), while variation is about +220 °C for the medium-load condition (5 bar of BMEP). It can be concluded that the working load is the main parameter that affects the temperature evolution of the piston window, but its effect is limited to the stationary value without influencing the time needed to reach it.
5.3. Analysis of the Temperature Transient of the Battery
To carry out a comparative analysis between the two investigated systems, the battery operations are put in correlation to the engine working conditions and measurements are performed. Differently from the previous case, for the battery only one transient of temperature is investigated, which is when the power is switched on. This condition can be compared to the switch-on of the engine from motored to fire; highlighting that the battery does not need a preliminary phase before the operation, unlike the engine. However, it is worth mentioning the potential application of a self-heating device to heat up the battery in the case of very cold conditions, which has been investigated in the literature [34].
The transient under investigation is analyzed for different working conditions: two discharge phases at different current values and one charge phase. The first two discharges can be related to the two engine loads of 2 and 5 bar of BMEP; hence, low and medium loads. The current of discharge is 0.5 C and 1 C, respectively. Charging does not have an equivalent phase in the engine’s operation, but it is a fundamental phase of the battery working and, for this reason, it is investigated.
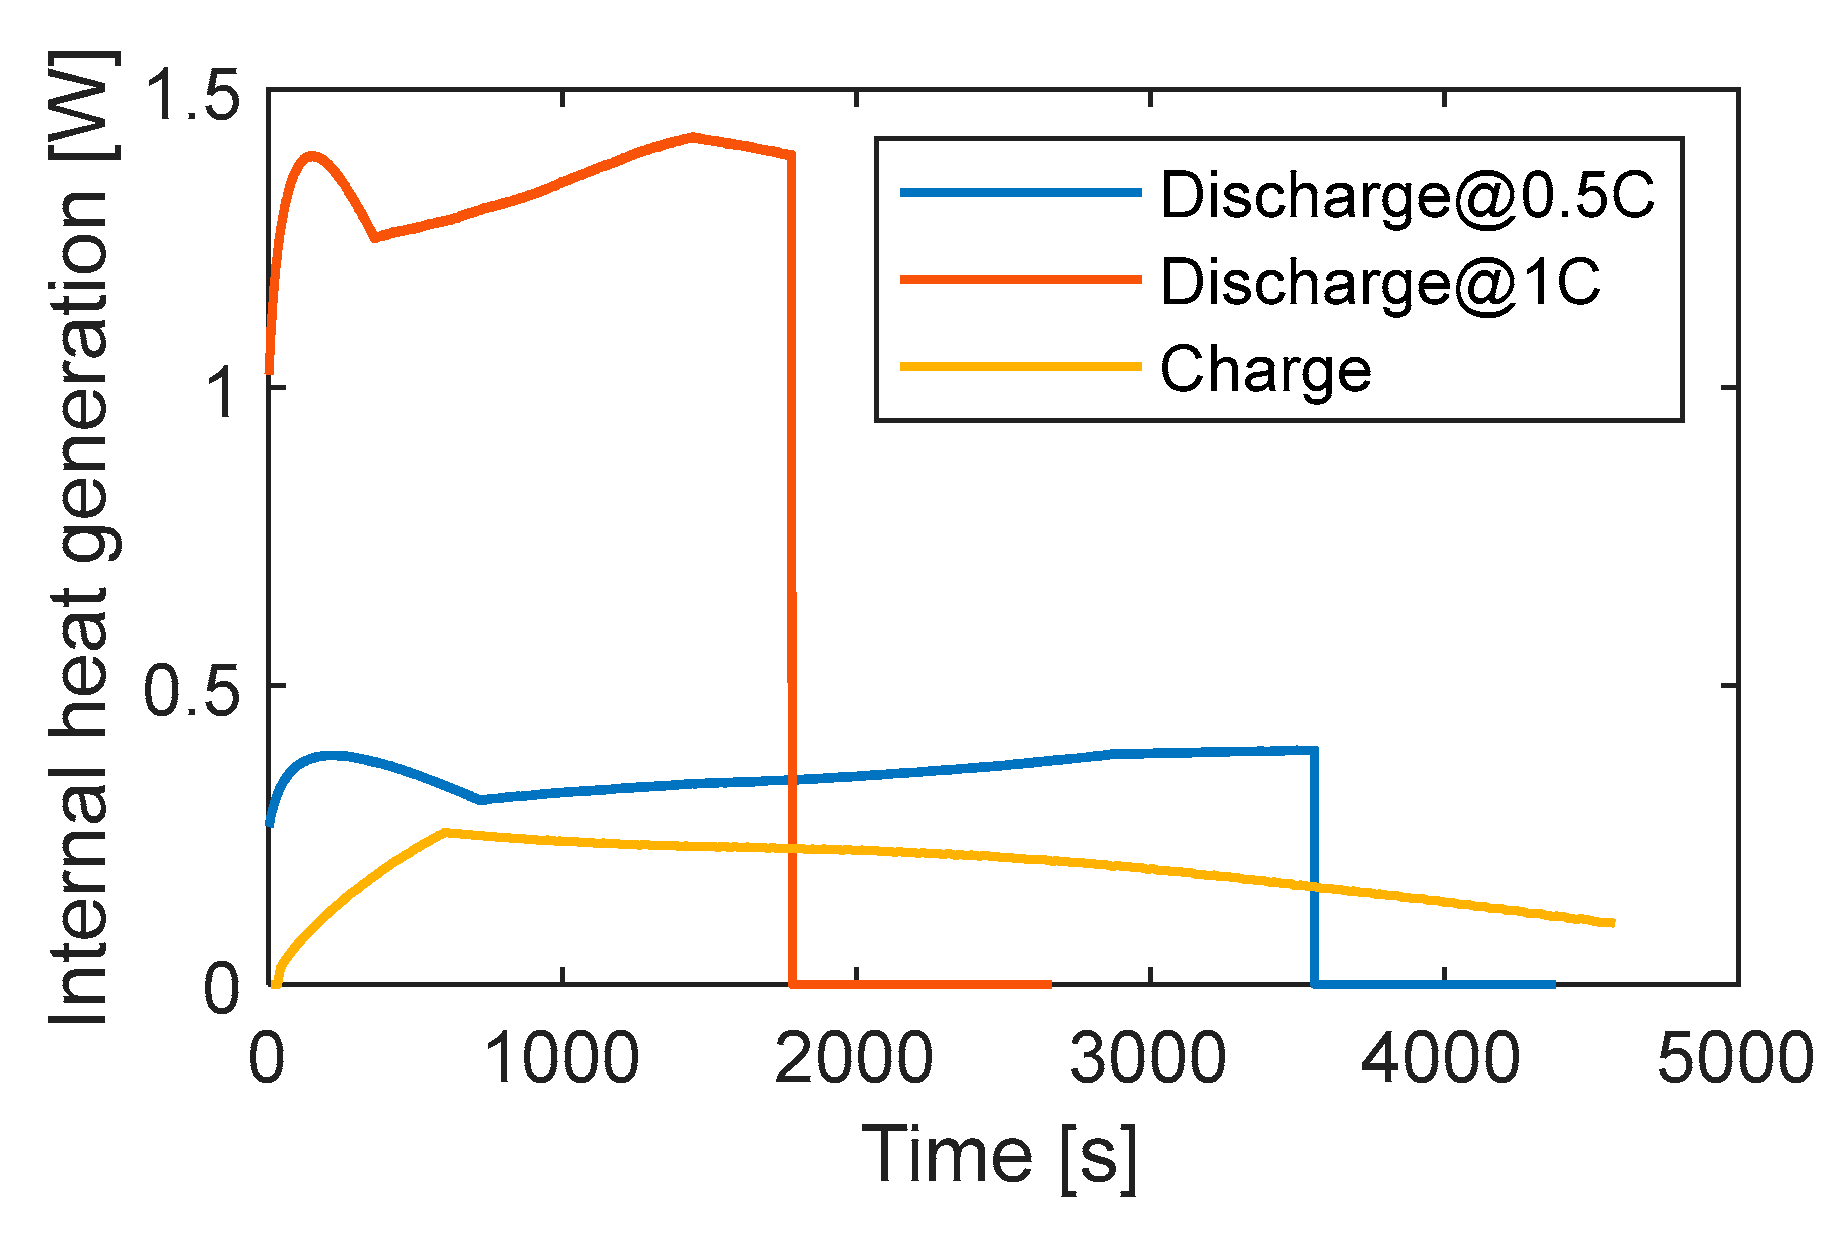
From the thermal point of view, the battery behavior is characteristic of Newton’s cooling law: before the current cut-off, it is with internal heat generation, and after the current cut-off, it is without. The discharge phases are characterized by almost constant heat generation, while this decreases for the charge phase. It is worth noting that even if the current is constant, the heat generated is not constant, because of the voltage drop and voltage derivative terms in Equation (11). Figure 10 reports the curves of heat generated for all tested cases. The discharge phases have a high slope at the beginning, a local peak at the start of the test due to the shape of the Voc-SOC curve for high values of SOC, and then an almost constant behavior, while for the charge phase they have an initial rise and then a decreasing trend.
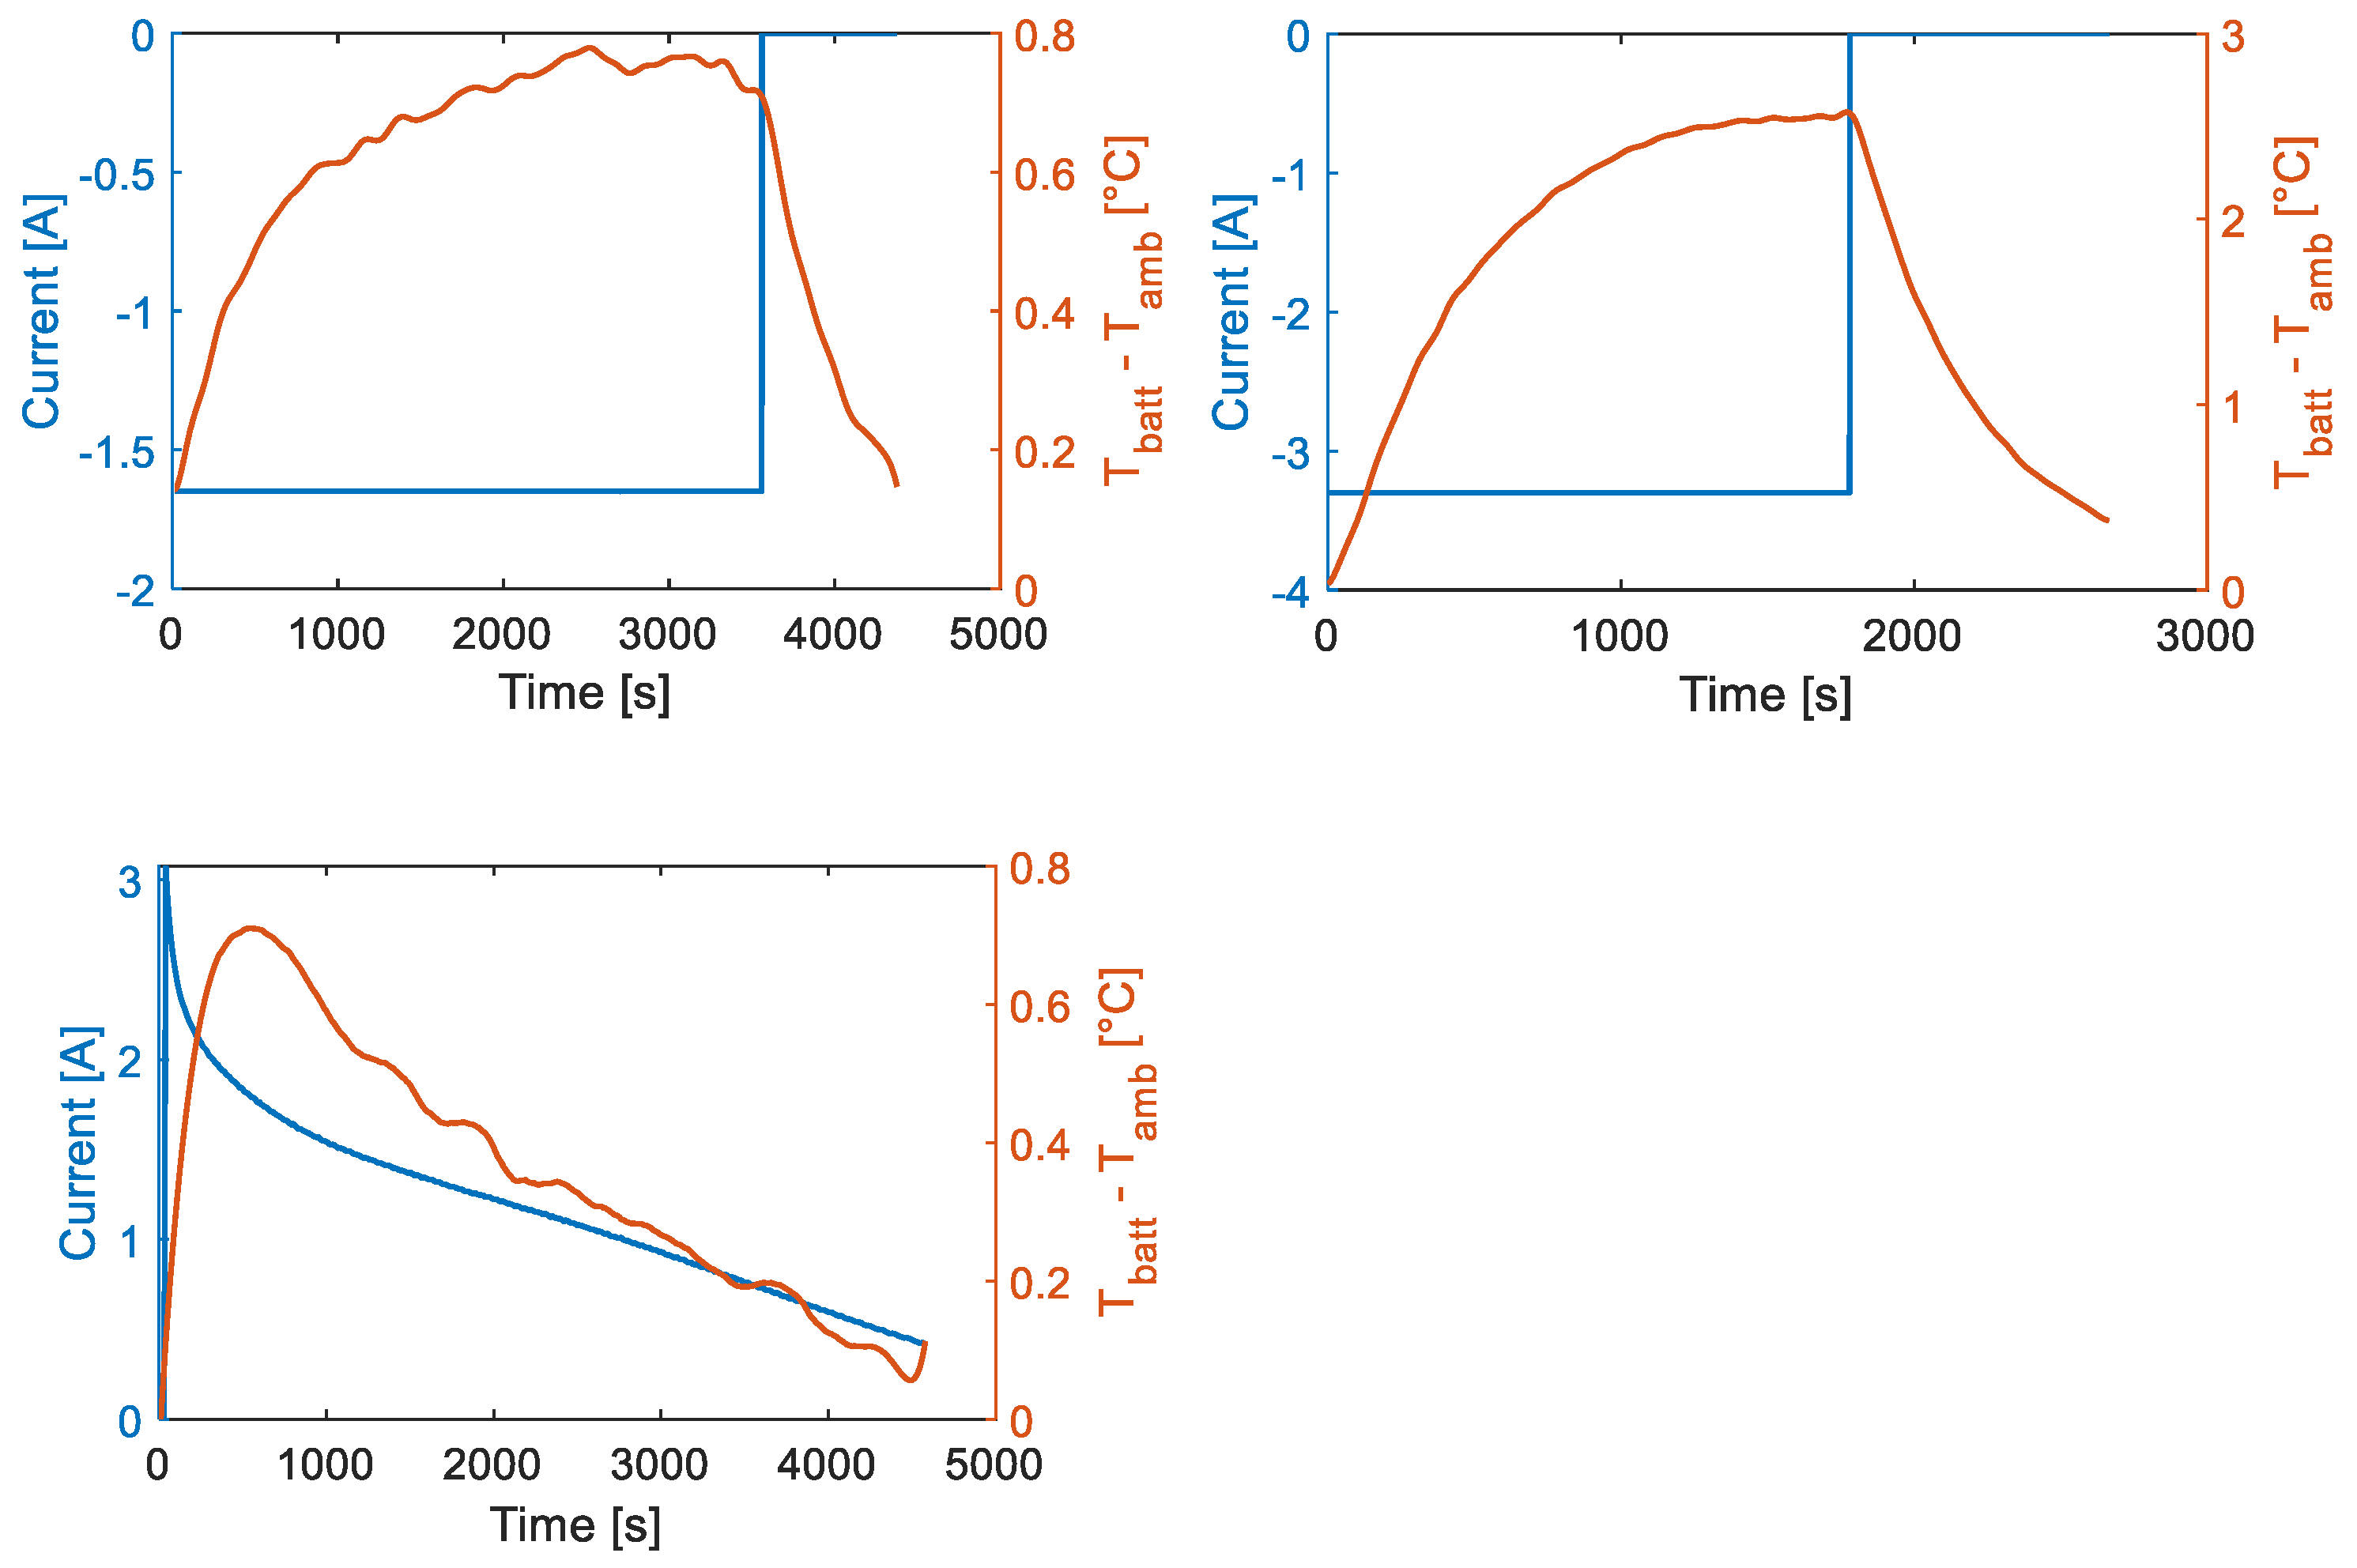
Infrared images of the battery are recorded every 10 s and averaged over the surface from the start of the charge/discharge phase to a time that is different according to the test. For the discharge, the current is deactivated when the extracted charge is 50% of the capacity (30 min @ 1 C, 1 h @ 0.5 C) and then the following cooling is recorded for 15 min (Figure 11, top). On the other hand, for the charge, the Constant Current Constant Voltage (CCCV) method is applied. This consists of an initial constant current until the maximum voltage of 4.2 V is reached, and then a constant voltage with decreasing current down to 0 at the end of the charge. The recorded images contain only the charging phase when the current is applied; the cooling process at the time of the current cut-off is not investigated. The presence of an internal source of heat produces an increment in the temperature of the battery during its operation. The graphs at the top of Figure 11 report the curves of temperature and current for the discharge at 0.5 C and 1 C. It can be seen that the typical heating behavior is reproduced; the temperature increase is fast at the beginning and then decreases according to the balance equation reported in Equation (12). At the start, the battery is in thermal equilibrium with the surrounding environment; the term relative to the convective heat transfer is small because of the low temperature variation; on the contrary, the one due to the heat accumulation is greater.
After a certain time, the difference in temperature increases and the heat transfer to the ambient air becomes more significant. This exchange of heat lowers the slope of the curve leading to the temperature settlement. This point is reached at about 3000 s for the test at 0.5 C and about 1500 s for the one at 1 C. In the case with a lower current, lower internal heat is generated: the rate of temperature in the first 500 s is about 0.3 °C/500 s and the total increment of temperature is 0.7 °C; on the other side, at 1 C they are 1.5 °C/500 s and 2.5 °C, respectively. The small effect of the thermal phenomena involved in the case with lower current results in a long duration of heat storage (3000 s), as the convective heat transfer is limited due to the narrow difference in temperature. After 3600 s of testing at 0.5 C and 1800 s at 1 C, the current is cut off and the battery is allowed to cool down via natural convection. The term due to the heat generation is removed from Equation (12) and the convective heat transfer is the only phenomenon that regulates the process. This condition is representative of Newton’s cooling law with the body temperature being higher than the ambient temperature without internal heat generation. The temperature decreases with an exponential trend proportional to the temperature difference and very slowly approaches the ambient temperature.
Concerning the charging phase shown in Figure 11, bottom, the current profile and the temperature variation are very different from the previous cases. The shape of the current signal is forced by the voltage value according to the charging method used (CCCV). As consequence, variable heat generation that decreases over time is obtained. The battery temperature is the result of the equilibrium among the processes reported in Equation (12). Again, in the beginning, the heat accumulation is the main driver of the process, producing a high-temperature rate, but the heat generated, which is decreasing quickly, soon equals the heat exchange with the ambient temperature, slowing down the increment of temperature to reverse the trend. The temperature curve has a peak and then decreases to match the ambient temperature at the end of the test. After the peak, the heat exchange is higher than the generated one. The first decreases because of the reduction of the delta of temperature, and the second because of the reduction of current.
5.4. Modeling of the Temperature Transient of the Battery
The finite differences method, using Equations (13) and (14), is applied to calculate the temperature of the battery for each time step with a resolution of 1 s. In the beginning, the core and the surface of the battery are at ambient temperature. The heat generated in the centerline of the battery during its functioning produces an increment of the core temperature. Conductive heat transfer inside the battery also makes the surface temperature increase, while it exchanges heat via convection to the surrounding environment.
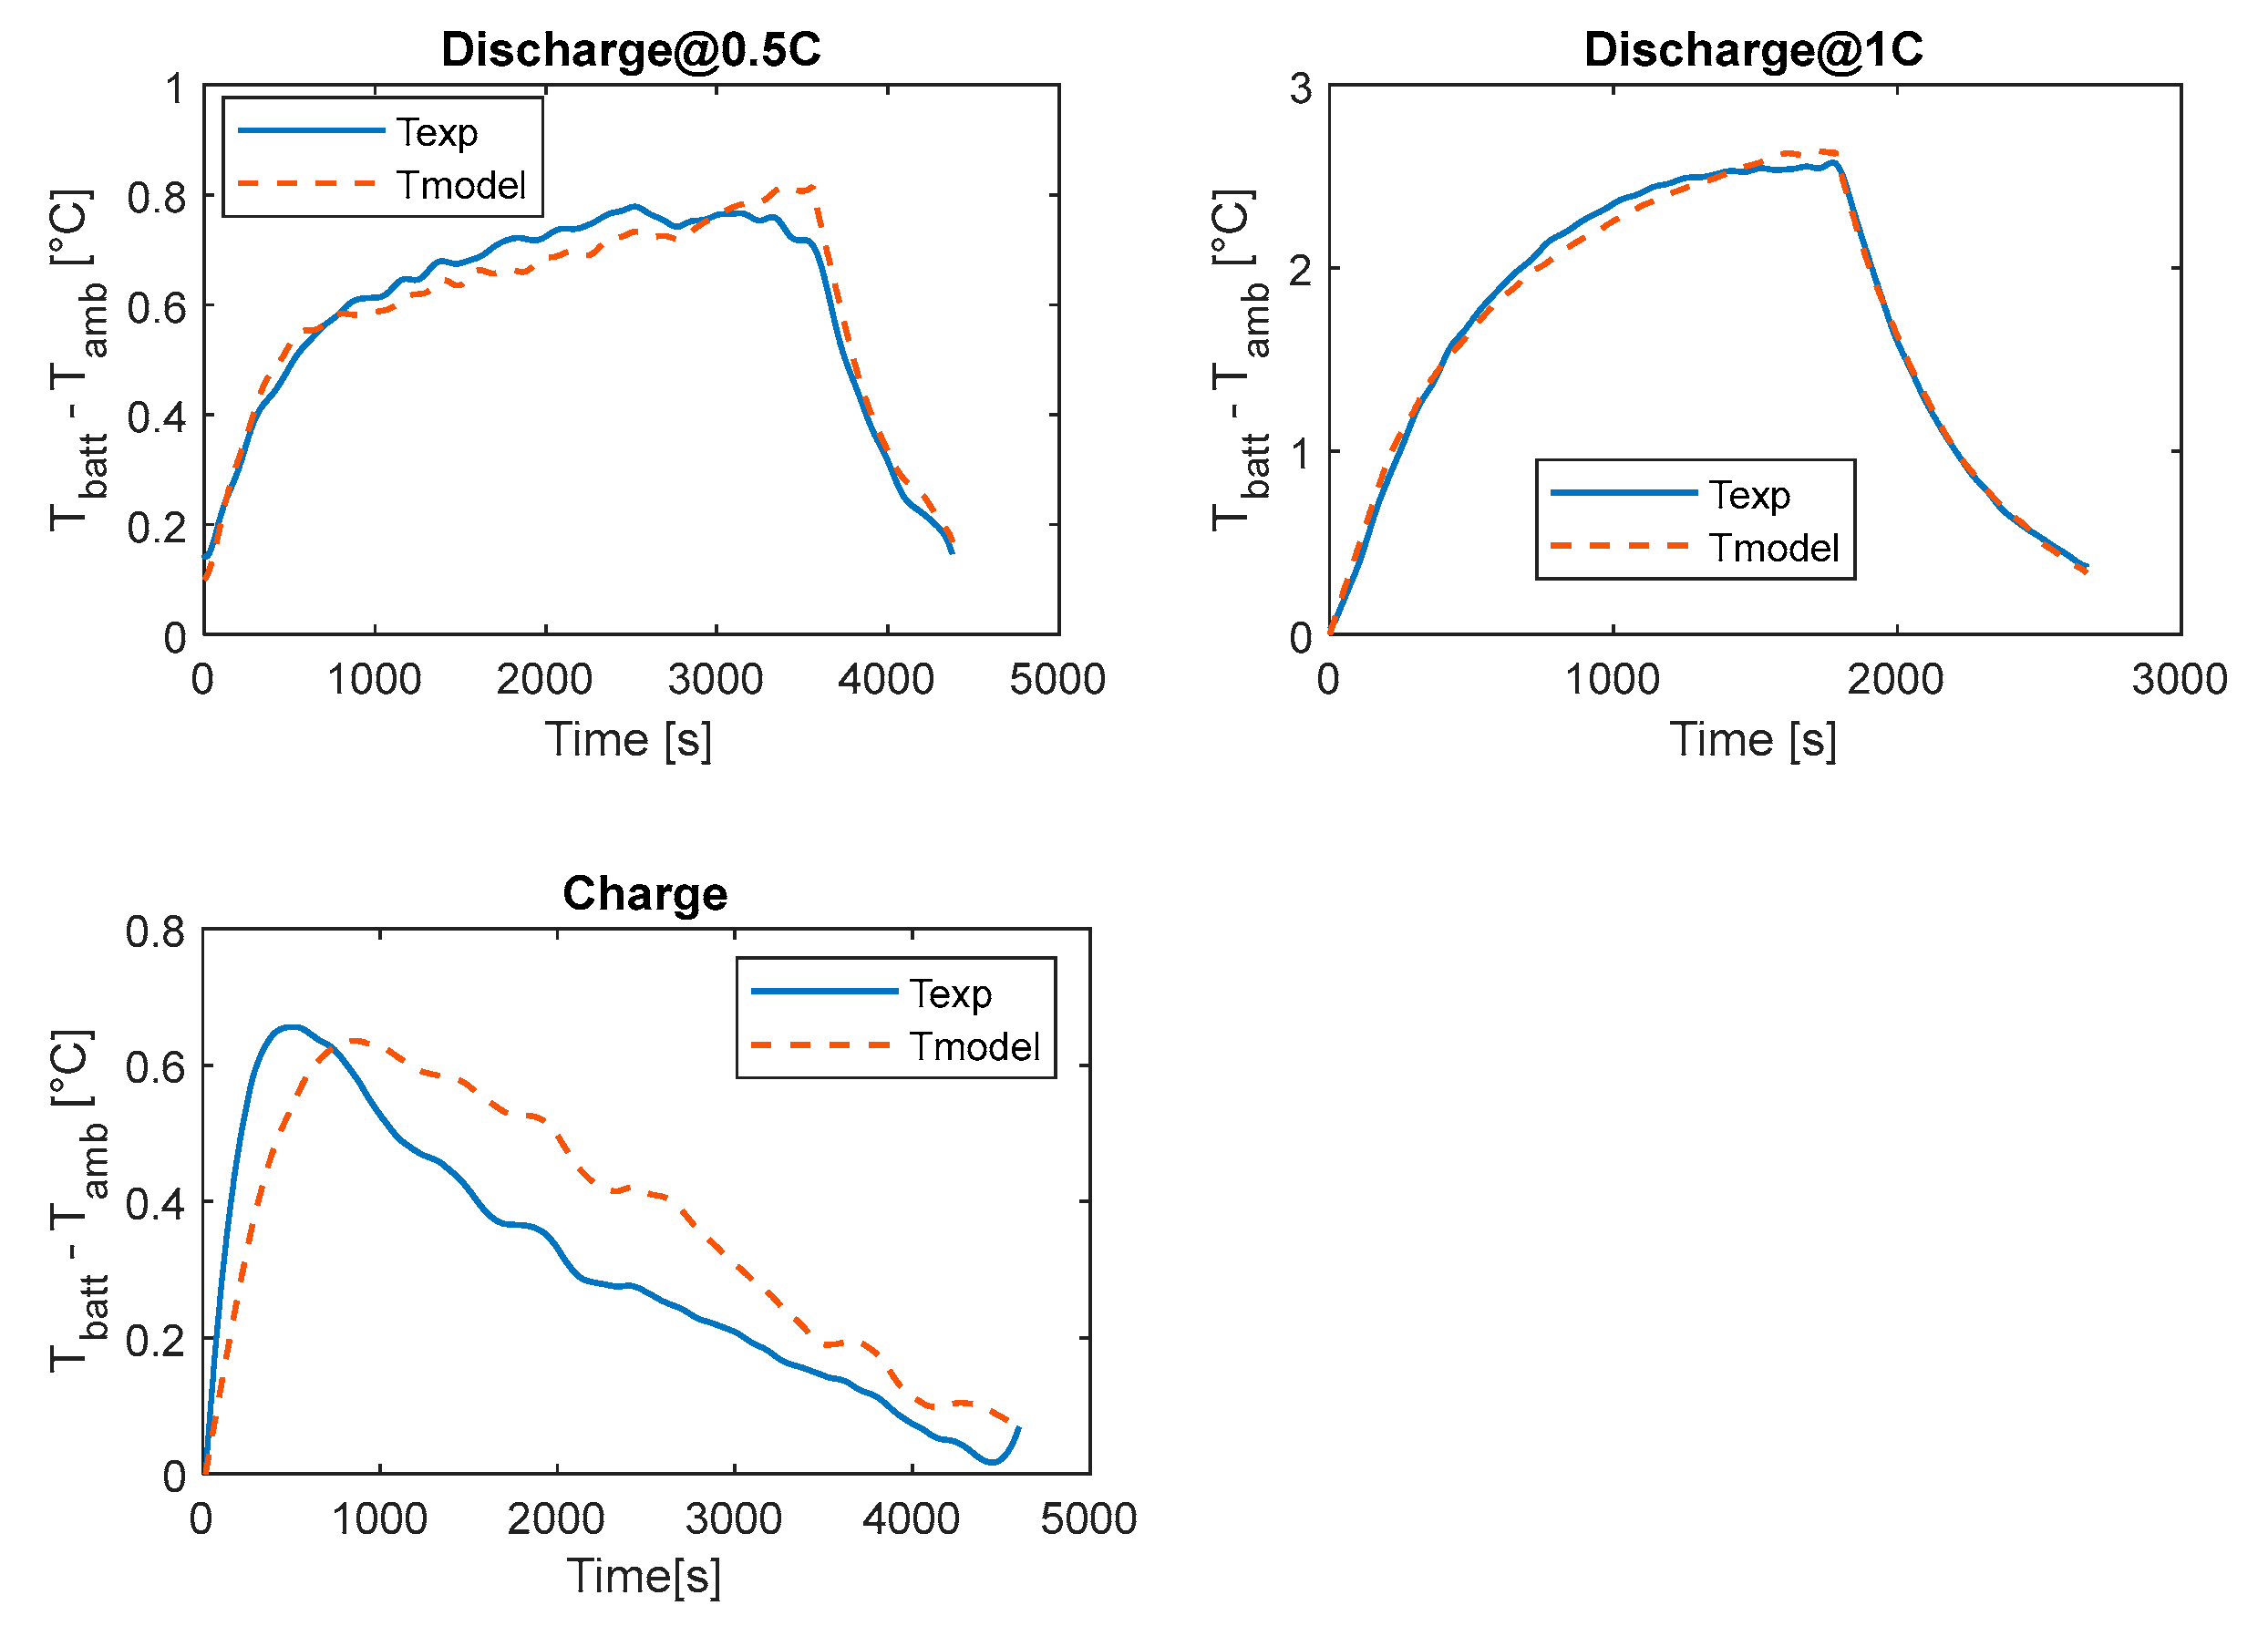
The modeled curves of temperature are reported in Figure 12 along with the measured ones for all investigated conditions. A good match is obtained for both the heating/discharge and the cooling/resting phases. The NRMSE for these tests are 0.07 and 0.015 for the discharges at 0.5 C and 1 C, respectively. Some discrepancies can be seen in the charging phase during both the temperature increase and decrease phases. This is quantitatively confirmed by a higher NRMSE, which in this case is 0.16. This is likely due to the estimation of the heat generated that is affected by the sharp current variation at the beginning (see Figure 11, bottom) and by the evaluation of the open-circuit voltage, Voc, from the look-up tables of the battery electric behavior. Moreover, the shape of the Voc that changes slope when the SOC approaches 100% can also affect the simulation at the end. Finally, with regards to the discharge, the model is able to provide the regime temperature for the cooling phase by running the simulation for as much time as needed without additional costs or effort.
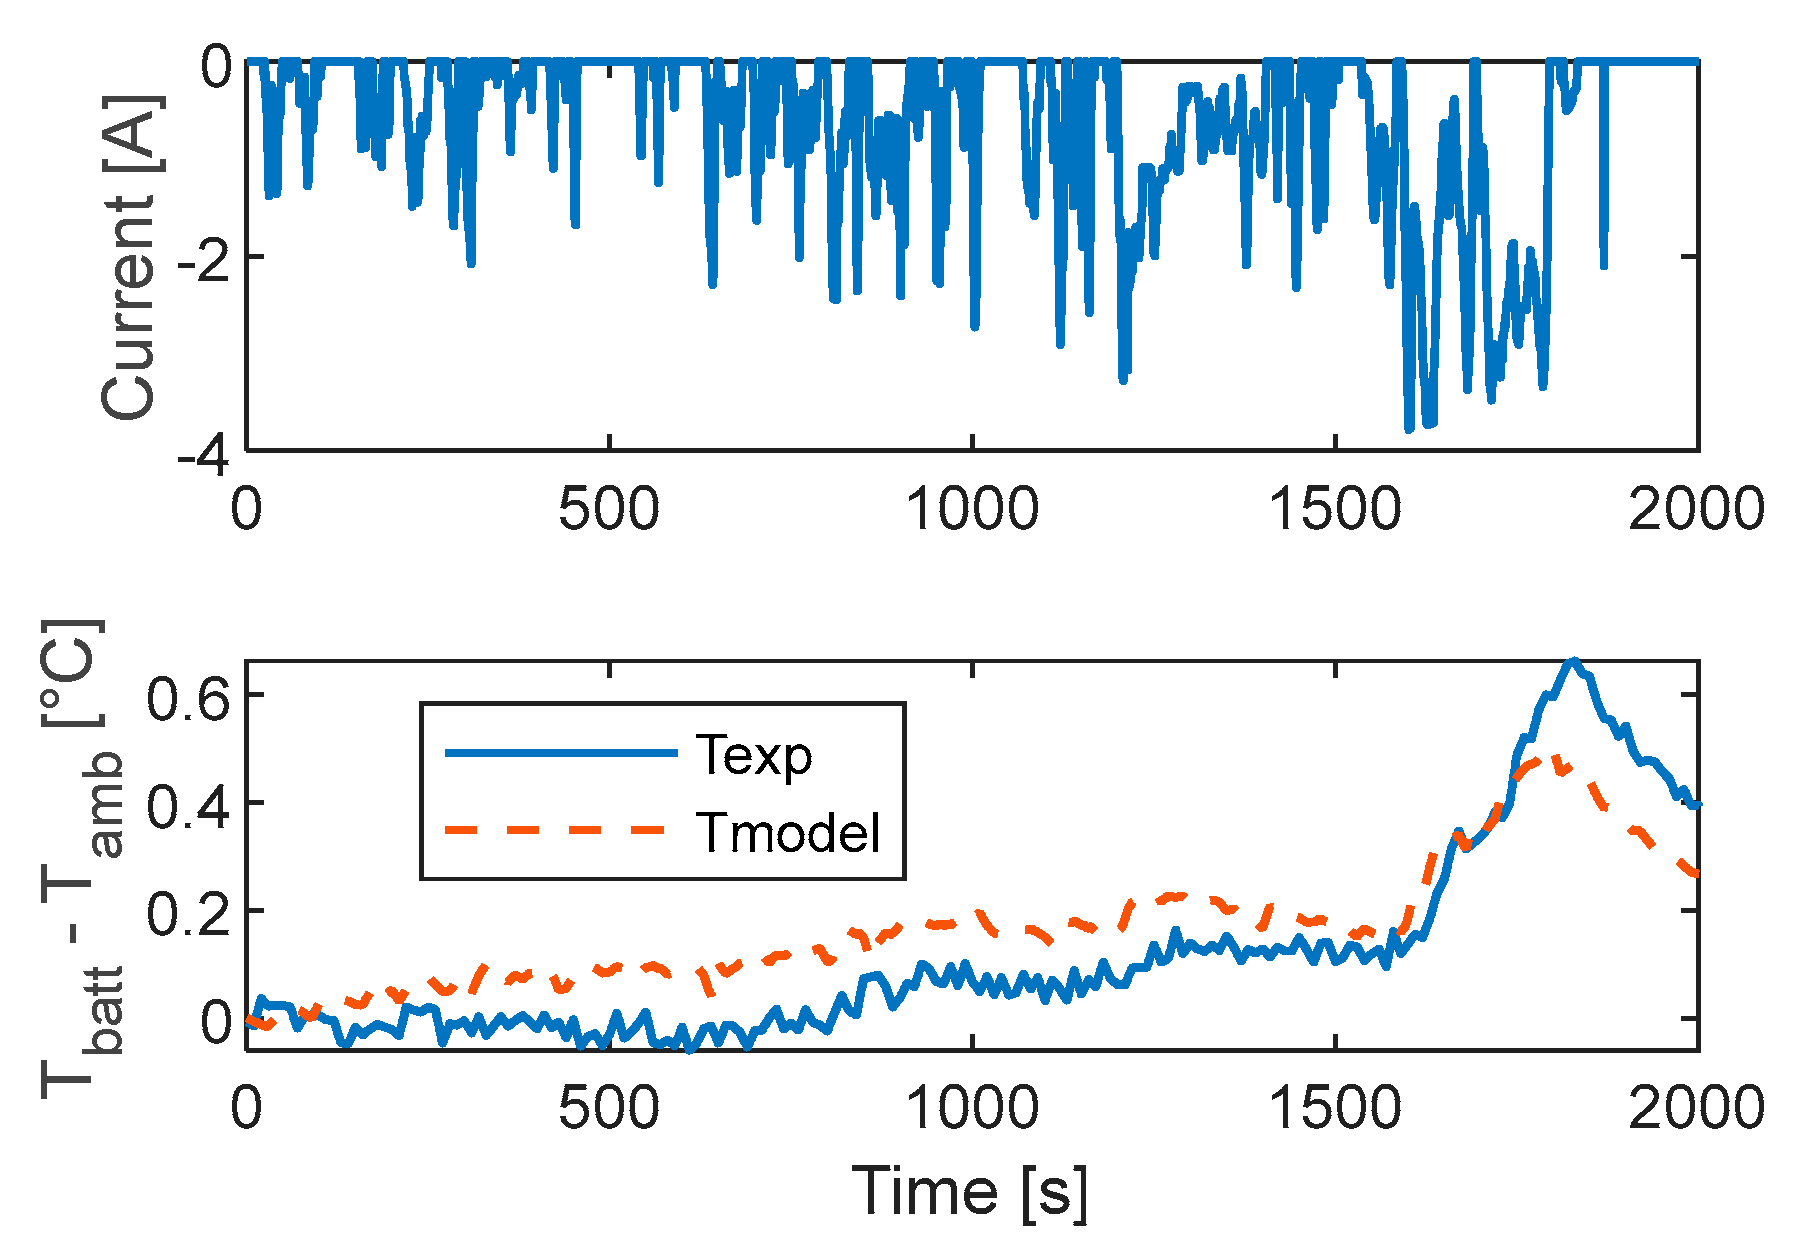
To briefly introduce and highlight the potential and the benefits of tuning a temperature model with a single battery at constant charge/discharge currents, the graphs in Figure 13 are reported. At the top, the current demand during the homologation driving cycle WLTC is shown, the curve being accurately derived/calculated from measurements on an internal combustion engine at an engine test bench [35]. In the bottom of Figure 13, there is a comparison between the measured and modeled battery surface temperature. The current profile is strongly variable over time, with pulses of different durations and intensities. In this case, the model can predict the temperature variation of the battery during the drive cycle, helping in the detection and analysis of the most critical working conditions right from the design stage of the battery pack.
5.5. Evaluation and Comparison of the Heat Losses
Modeling the thermal behavior of the piston inside an internal combustion engine and a single battery, as part of a battery pack, has allowed for an understanding of the physical processes that drive temperature variation. For the first case, as indicated in Equation (1), the in-cylinder temperature, Tg, is responsible for the temperature increment of the piston. In the second, it is not the temperature but the heat flux, more precisely the internally generated heat, which produces the increment of temperature. Equations (16) and (17) aim to illustrate the parameters that contribute to the power delivery of the two investigated components. For the piston, in Equation (16), the power output is given by the engine geometrical parameter D, which is the displacement, and the engine load parameters: the in-cylinder pressure, p, and the shaft speed, n. Similarly, for the battery, a load parameter and a component parameter can be identified. The relationship for the battery power is reported in Equation (17). The load is represented by the current demand, I, while the battery characteristics are linked to the operating voltage, V.
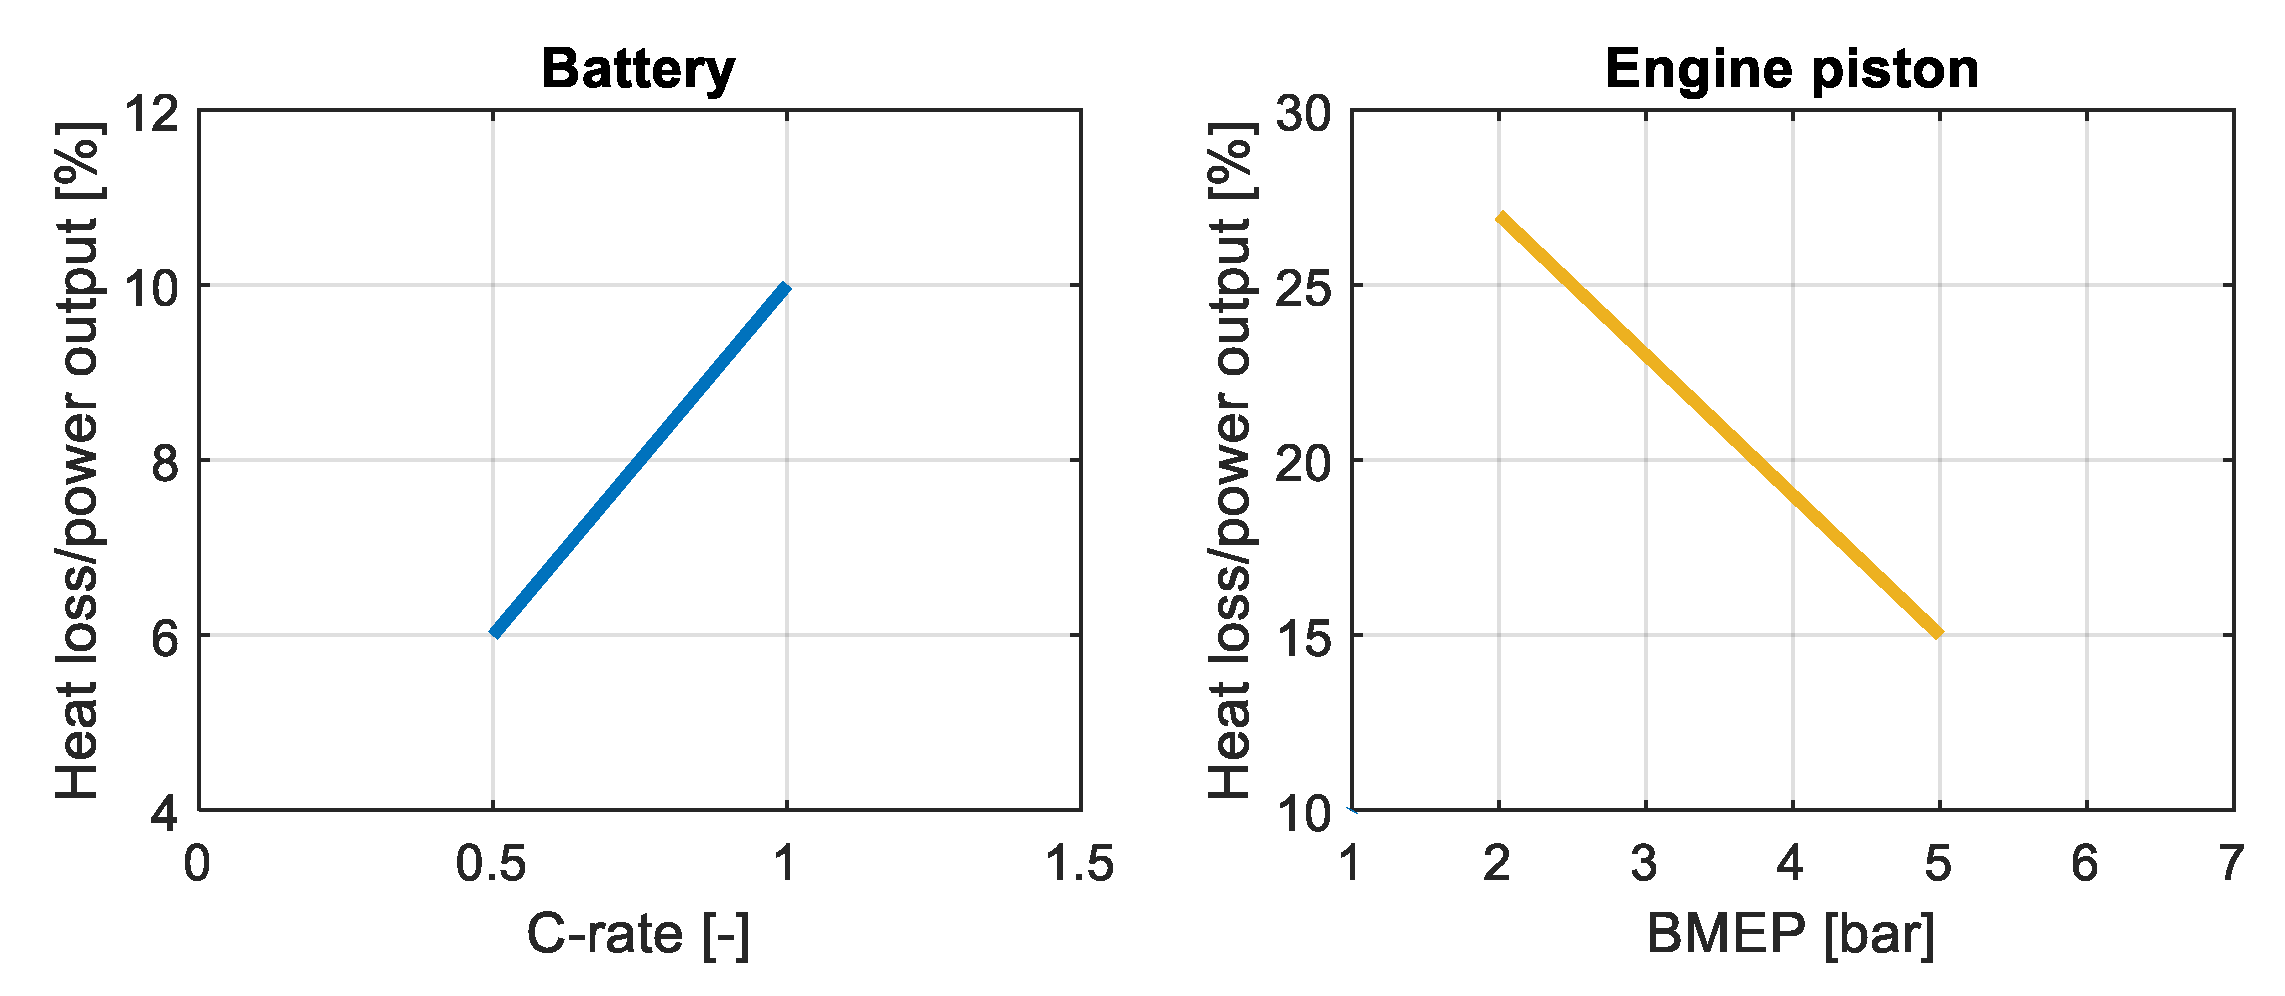
Putting in correlation the dissipated heat and the power output for the two investigated systems in the tested conditions, 0.5 C and 1 C for the battery and 1500 × 2 and 1500 × 5 for the engine, it is possible to obtain more insights into the trend of heat losses. Figure 14 shows the percentage of heat dissipated per unit of power output versus the load. It can be seen that increasing the battery load means increasing the heat losses. Therefore, to limit energy waste and to prevent thermal runaway of the battery, it is suggested to have a larger number of batteries working in low-load conditions. On the contrary, for the engine, a higher load results in lower heat loss. Hence, running the engine at a high load is suggested to limit energy waste. In particular, for the engines, the optimum is to work at the highest efficiency point, as is commonly made for vehicles with hybrid configurations.
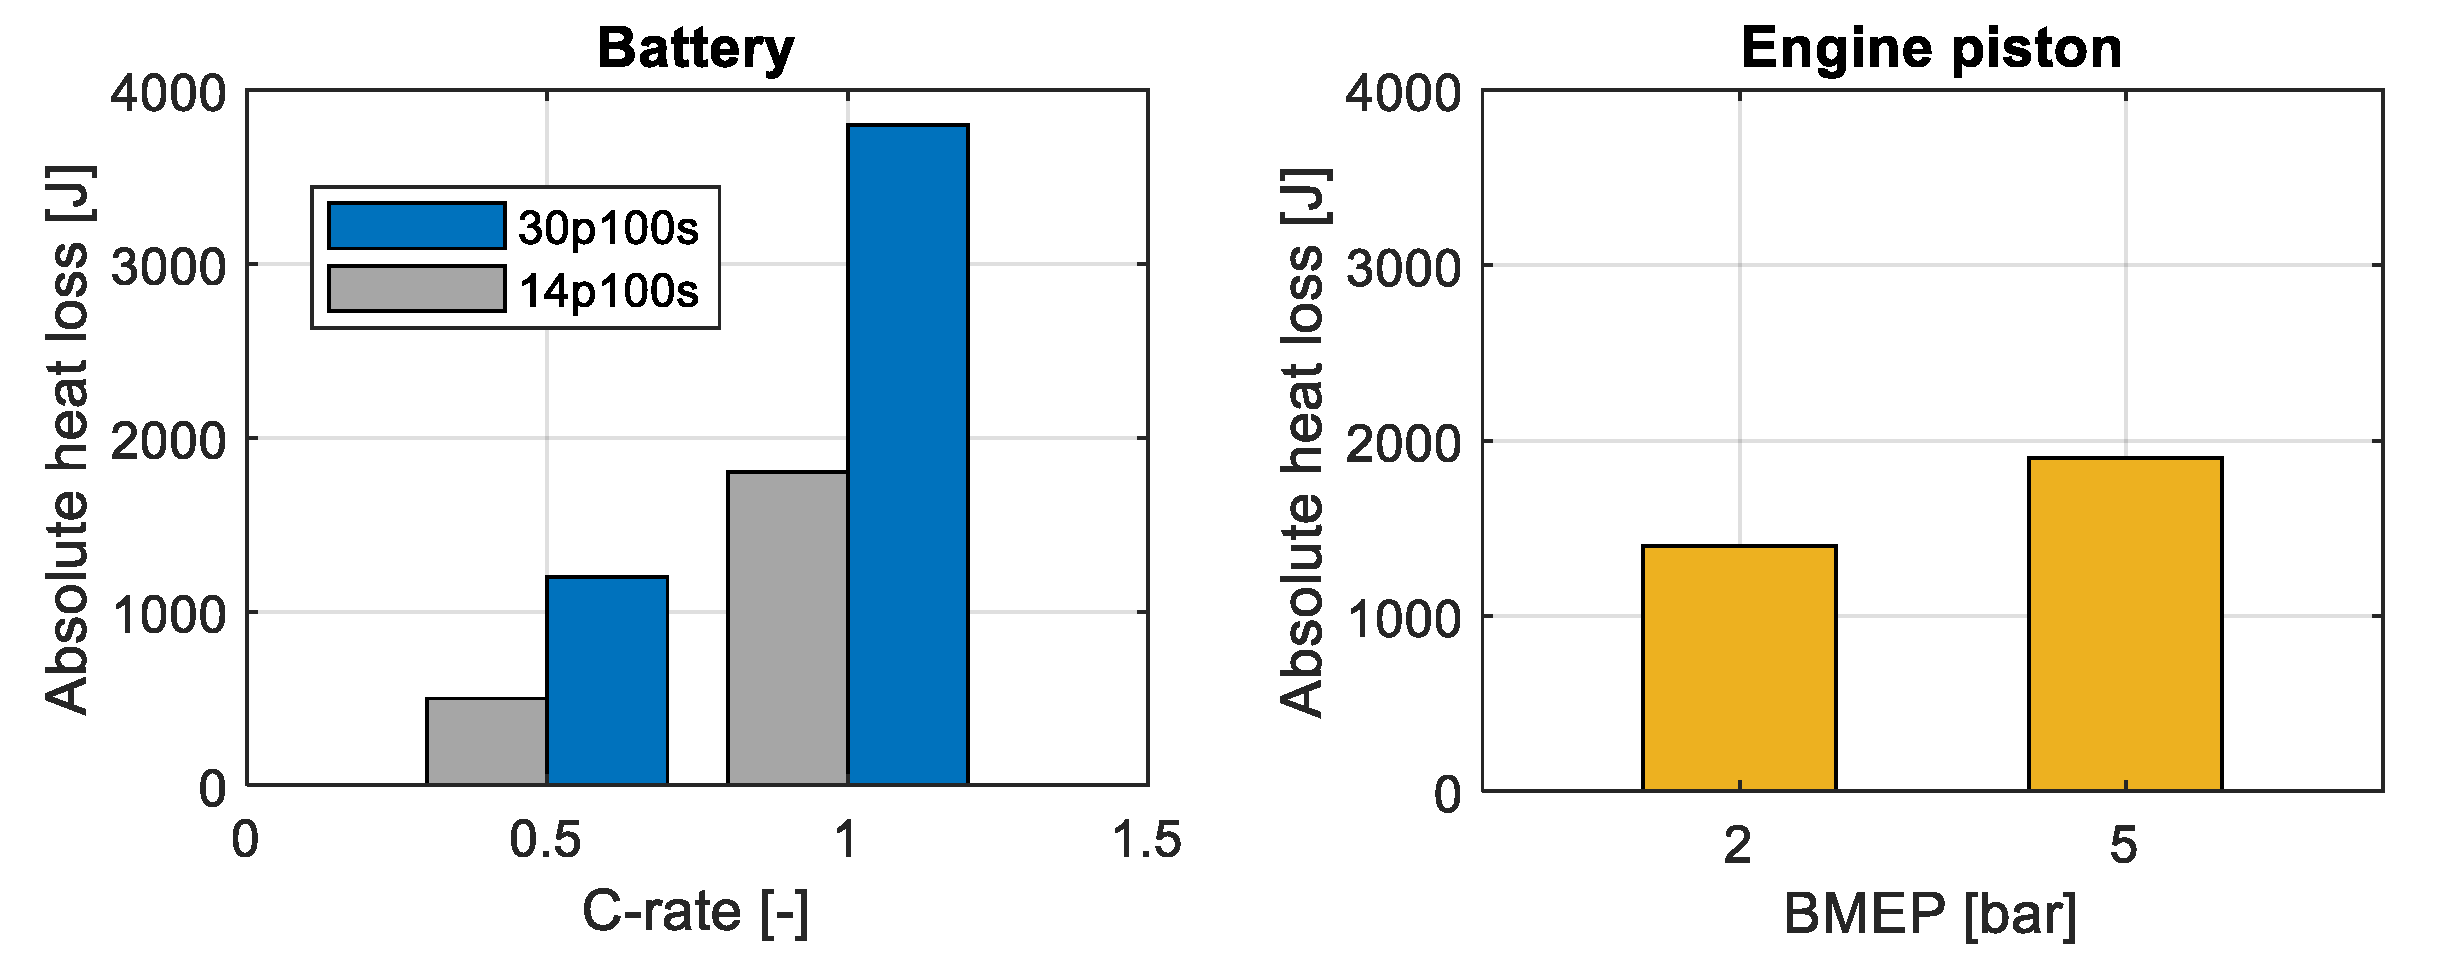
The previous comments can be very important in the design of future mobility systems, independently of the kind of configurations used between full electric and hybrid vehicles. In the following Figure 15, the amount of absolute heat losses is compared between a four-cylinder engine and an equivalent battery pack for a full electric vehicle. According to the results and observations in Figure 14, two configurations are analyzed. The first has 30 cells in parallel and 100 in series to provide 37 kWh and 99 A at 1 C; whereas the second has 14 cells in parallel and 100 in series with 18 kWh and 46 A at 1 C. These configurations are selected because the average current of a WLTC cycle is 44 A. Therefore, during the homologation cycle, the first pack will work at 0.5 C on average and the second at 1 C. Figure 15 reports the absolute heat losses for the two cases, considering the percentage heat losses values of Figure 14, the total number of cells, and the C-rating, for the battery, while the displacement and the number of cylinders are considered for the engine. The data refer to a time of 1 s, which corresponds to 12.5 engine working cycles at 1500 rpm. The results support the previous conclusions and provide additional insights. Considering the engine heat losses to the piston window as a reference, the amount of energy ranges between 1400 J and 1900 J. For the battery, a wider interval can be observed, depending on the configuration and the working operation. The heat losses span from 500 J to almost 4000 J. However, if the packs are used inside the design criteria, the pack 30 p 100 s at 0.5 C and the 14 p 100 s at 1 C, the heat losses are similar and close to those of the engine.
Additionally, in the present case, a further criterion can be introduced concerning the battery pack weight. If the current load is almost constant or lower than the nominal value, the pack 14 p 100 s can be preferred, with a gain in weight and heat cooling systems’ power demand.
6. Conclusions
Real-time diagnostics and adaptive control of thermal behavior are necessary for the improvement of operating range of future PHEVs and BEVs. The phenomena that rule the thermal status of the piston of an internal combustion engine and battery for automotive applications have been investigated with both experimental and modeling approaches.
The temperature of the piston of a research optical engine during typical operating conditions has been used to set up a model and to predict the temperature variation in more stressful conditions, such as the fired mode, when experimental data are very difficult to detect. A temperature variation of about 160 °C in 500 s has been observed. The time of stabilization is 500 s for both the engine load conditions. Model results showed the shape of the temperature curve across a transient operation of the engine, i.e., moving from different engine operating points of the homologation driving cycle. The model is more accurate in the simulation of the motored conditions, where the calculated NRMSE is between 0.013 and 0.015, whilst a higher discrepancy is found for the predictions in fired mode, where the NRMSE is between 0.033 and 0.066.
The analysis of the batteries pointed out a crucial aspect of their functioning due to their internal heat generation that produces an increment of temperature. The heat flux goes from the core to the surface. Higher temperatures have been detected for higher loads during the discharge phase, while non-significant increments of temperature have been observed during the charge phase at nominal current. The gradients of temperature are very limited compared to the engine; they reach a maximum of 1.5°/500 s for the discharge at 1 C. The stabilization time varies depending on the test case; it is 3000 s at 0.5 C and 1800 s at 1 C. The model has been shown to fit the experimental data well, providing a NRMSE between 0.015 and 0.07 for the discharge tests, while some discrepancies are found for the charging case, with a NRMSE of 0.16. Some improvements to the model are still needed for a non-constant current signal as for the case of the WLTC drive cycle; however, the main trend of the temperature is caught well.
Comparing the heat losses to the power output for the two investigated systems, it was found that the ratio increases with the load for the batteries and decreases for the engine. Moreover, the normalized heat losses are higher for the engine, spanning from 15% to 27% for the investigated cases, while they are lower for the battery, passing from 6% to 10%, increasing the current demand. The absolute value of the heat losses, calculated across 1 s of functioning, revealed similar values for the two systems, noting that only the piston window is considered for the engine, with a range from 1400 J to 1900 J. Both the battery packs with 3000 cells and with 1400 cells produced almost the same amount of heat, but for the first, the higher weight was a drawback.
The analysis performed in this work has allowed further understanding of the processes involved in the functioning of the two investigated systems and the phenomena that rule their thermal behavior. Their analogies and similarities help us to better face new challenges in the design and optimization of modern mobility systems.
Author Contributions
Conceptualization, L.S.; Formal Analysis, investigation, Writing, L.S. and E.M.; Supervision, B.M.V. All authors have read and agreed to the published version of the manuscript.
Funding
This research received no external funding.
Acknowledgments
The authors would like to thank Eng. Gaetano Sebastianelli for his support in the experimental activity; Carlo Rossi and Bruno Sgammato for the help in the setup of the experiments.
Conflicts of Interest
The authors declare no conflict of interest.
References
- Wang, Y.; Gao, Q.; Zhang, T.; Wang, G.; Jiang, Z.; Li, Y. Advances in Integrated Vehicle Thermal Management and Numerical Simulation. Energies 2017, 10, 1636. [Google Scholar] [CrossRef]
- Shu, G.; Hu, C.; Tian, H.; Li, X.; Yu, Z.; Wang, M. Analysis and Optimization of Coupled Thermal Management Systems Used in Vehicles. Energies 2019, 12, 1265. [Google Scholar] [CrossRef] [Green Version]
- Tete, P.R.; Gupta, M.M.; Joshi, S.S. Developments in battery thermal management systems for electric vehicles: A technical review. J. Energy Storage 2021, 35, 102255. [Google Scholar] [CrossRef]
- Wang, Y.; Wang, Z.; Min, H.; Li, H.; Li, Q. Performance investigation of a passive battery thermal management system applied with phase change material. J. Energy Storage 2021, 35, 102279. [Google Scholar] [CrossRef]
- Chen, S.; Wan, C.; Wang, Y. Thermal analysis of lithium-ion batteries. J. Power Sources 2005, 140, 111–124. [Google Scholar] [CrossRef]
- Shi, X.; Pan, J.; Wang, H.; Cai, H. Battery electric vehicles: What is the minimum range required? Energy 2019, 166, 352–358. [Google Scholar] [CrossRef]
- Nykvist, B.; Sprei, F.; Nilsson, M. Assessing the progress toward lower priced long range battery electric vehicles. Energy Policy 2019, 124, 144–155. [Google Scholar] [CrossRef]
- Hiermann, G.; Hartl, R.F.; Puchinger, J.; Vidal, T. Routing a mix of conventional, plug-in hybrid, and electric vehicles. Eur. J. Oper. Res. 2019, 272, 235–248. [Google Scholar] [CrossRef] [Green Version]
- Liimatainen, H.; van Vliet, O.; Aplyn, D. The potential of electric trucks–An international commodity-level analysis. Appl. Energy 2019, 236, 804–814. [Google Scholar] [CrossRef]
- Tomaszewska, A.; Chu, Z.; Feng, X.; O’Kane, S.; Liu, X.; Chen, J.; Ji, C.; Endler, E.; Li, R.; Liu, L.; et al. Lithium-ion battery fast charging: A review. eTransportation 2019, 1, 100011. [Google Scholar] [CrossRef]
- Mussa, A.S.; Klett, M.; Behm, M.; Lindbergh, G.; Lindström, R.W. Fast-charging to a partial state of charge in lithium-ion batteries: A comparative ageing study. J. Energy Storage 2017, 13, 325–333. [Google Scholar] [CrossRef]
- Zhu, G.; Zhao, C.; Huang, J.; He, C.; Zhang, J.; Chen, S.; Xu, L.; Yuan, H.; Zhang, Q. Fast Charging Lithium Batteries: Recent Progress and Future Prospects. Small 2019, 15, e1805389. [Google Scholar] [CrossRef] [PubMed]
- Liu, Y.; Zhu, Y.; Cui, Y. Challenges and opportunities towards fast-charging battery materials. Nat. Energy 2019, 4, 540–550. [Google Scholar] [CrossRef]
- Pillai, A.L.; Kai, R.; Murata, T.; Ikedo, T.; Masuda, R.; Kurose, R. Numerical analysis of heat transfer characteristics of spray flames impinging on a wall under CI engine-like conditions. Combust. Flame 2021, 111615. Available online: https://0-www-sciencedirect-com.brum.beds.ac.uk/science/article/pii/S0010218021003588 (accessed on 11 March 2022). [CrossRef]
- Impagnatiello, M.; Bolla, M.; Keskinen, K.; Giannakopoulos, G.; Frouzakis, C.E.; Wright, Y.M.; Boulouchos, K. Systematic assessment of data-driven approaches for wall heat transfer modelling for LES in IC engines using DNS data. Int. J. Heat Mass Transf. 2022, 183, 122109. [Google Scholar] [CrossRef]
- Mancaruso, E.; Sequino, L. Measurements and modeling of piston temperature in a research compression ignition engine during transient conditions. Results Eng. 2019, 2, 100007. [Google Scholar] [CrossRef]
- Mancaruso, E.; Sequino, L.; Vaglieco, B.M. Temperature Measurements of the Piston Optical Window in a Research Compression Ignition Engine to Set-Up a 1d Model of Heat Transfer in Transient Conditions; SAE Paper 2019-24-0182; SAE International: Warrendale, PA, USA, 2019. [Google Scholar] [CrossRef]
- Kim, J.; Oh, J.; Lee, H. Review on battery thermal management system for electric vehicles. J. Appl. Therm. Eng. 2019, 149, 192–212. [Google Scholar] [CrossRef]
- Raijmakers, L.; Danilov, D.; Eichel, R.-A.; Notten, P. A review on various temperature-indication methods for Li-ion batteries. Appl. Energy 2019, 240, 918–945. [Google Scholar] [CrossRef]
- Wu, W.; Wang, S.; Wu, W.; Chen, K.; Hong, S.; Lai, Y. A critical review of battery thermal performance and liquid based battery thermal management. Energy Convers. Manag. 2019, 182, 262–281. [Google Scholar] [CrossRef]
- Buidin, T.; Mariasiu, F. Battery Thermal Management Systems: Current Status and Design Approach of Cooling Technologies. Energies 2021, 14, 4879. [Google Scholar] [CrossRef]
- Surya, S.; Samanta, A.; Marcis, V.; Williamson, S. Smart Core and Surface Temperature Estimation Techniques for Health-Conscious Lithium-Ion Battery Management Systems: A Model-to-Model Comparison. Energies 2022, 15, 623. [Google Scholar] [CrossRef]
- Balasingam, B.; Ahmed, M.; Pattipati, K. Battery Management Systems—Challenges and Some Solutions. Energies 2020, 13, 2825. [Google Scholar] [CrossRef]
- Sequino, L.; Vaglieco, B.M. Infrared Diagnostics of a Li-Polymer Battery for the Estimation of the Surface Temperature Distribution and the Heat Transfer Parameters; SAE Paper 2020-01-2026; SAE International: Warrendale, PA, USA, 2020. [Google Scholar] [CrossRef]
- Sequino, L.; Vaglieco, B.M. Potential of infrared temperature measurements for the online estimation of the state-of-charge of a Li-polymer battery. J. Energy Storage 2021, 44, 103532. [Google Scholar] [CrossRef]
- Sapphire Properties. Available online: http://www.eot.it/italpage_1/products/IRMaterials/irmaterials.html (accessed on 11 March 2022).
- Heywood, J.B. Internal Combustion Engine Fundamentals; Mcgraw-Hill: New York, NY, USA, 1988; Volume 930. [Google Scholar]
- Springer. Piston and Engine Testing; Springer: Berlin/Heidelberg, Germany, 2012. [Google Scholar]
- Bergman, T.L.; Incropera, F.P.; Lavine, A.S.; Dewitt, D.P. Introduction to Heat Transfer; John Wiley & Sons: Hoboken, NJ, USA, 2011. [Google Scholar]
- Scrosati, B.; Garche, J.; Tillmetz, W. Advances in Battery Technologies for Electric Vehicles; Woodhead Publishing: Cambridge, UK, 2015. [Google Scholar]
- Farmann, A.; Sauer, D.U. A study on the dependency of the open-circuit voltage on temperature and actual aging state of lithium-ion batteries. J. Power Sources 2017, 347, 1–13. [Google Scholar] [CrossRef]
- Landolt, H.; Börnstein, R. Thermodynamic Properties of Inorganic Materials Compiled by SGTE: Heat Capacities, Enthalpies, Entropies and Gibbs Energies, Phase Transition Data. Pure Substances. Subvol. A; Springer: Berlin/Heidelberg, Germany, 1999. [Google Scholar]
- Mancaruso, E.; Sequino, L.; Vaglieco, B.M. Temperature Measurements of the Piston Optical Window in a Research Compression Ignition Engine via Thermography and Templugs; SAE Paper 2018-01-0083; SAE International: Warrendale, PA, USA, 2018. [Google Scholar] [CrossRef]
- Qu, Z.; Jiang, Z.; Wang, Q. Experimental study on pulse self–heating of lithium–ion battery at low temperature. Int. J. Heat Mass Transf. 2019, 135, 696–705. [Google Scholar] [CrossRef]
- Sequino, L.; Mancaruso, E.; Vaglieco, B.M. Modeling Study of the Battery Pack for the Electric Conversion of a Commercial Vehicle; SAE Paper 2021-24-0112; SAE International: Warrendale, PA, USA, 2021. [Google Scholar] [CrossRef]
Figure 1.
Optical single-cylinder engine [17]. Reprinted with permission from ref. [17] Copyright 2019 SAE International.

Figure 2.
Piston window instrumented with a K-type thermocouple [17]. Reprinted with permission from ref. [17] Copyright 2019 SAE International.

Figure 3.
Scheme of the system for the measurement of the piston window temperature [17]. Reprinted with permission from ref. [17] Copyright 2019 SAE International.

Figure 4.
Experimental layout, a photograph of the battery, and a thermal color image.

Figure 5.
Scheme of the 1D model and fluids/material properties used as input of the piston window model.
Figure 5.
Scheme of the 1D model and fluids/material properties used as input of the piston window model.

Figure 6.
Scheme of the 1D model and fluids/material properties used as input of the battery model.

Figure 7.
Transient of temperature in motored (top) and fired (bottom) conditions of the piston, for an engine running at 1500 rpm [17]. Reprinted with permission from ref. [17] Copyright 2019 SAE International.

Figure 8.
Cycle-resolved measure of the instantaneous heat flux from the in-cylinder gas to the piston head obtained using infrared visualization [33]. Reprinted with permission from ref. [33] Copyright 2018 SAE International.

Figure 9.
Comparison of the modeled and experimental measurements of the transient of temperature in motored (top) and fired (bottom) conditions of the piston, for the engine running at 1500 rpm [17] Reprinted with permission from ref. [17] Copyright 2019 SAE International.

Figure 10.
Heat generation in the battery over time for all investigated conditions.

Figure 11.
Transient of temperature and signal of current for the battery under discharge at different loads (top) and under charge (bottom).
Figure 11.
Transient of temperature and signal of current for the battery under discharge at different loads (top) and under charge (bottom).

Figure 12.
Comparison of the modeled and experimental transient of temperature for the battery under discharge at different loads (top) and under charge (bottom).
Figure 12.
Comparison of the modeled and experimental transient of temperature for the battery under discharge at different loads (top) and under charge (bottom).

Figure 13.
Signal of current (top) and comparison of the modeled and experimental temperature (bottom) of the battery running the homologation drive cycle WLTC.
Figure 13.
Signal of current (top) and comparison of the modeled and experimental temperature (bottom) of the battery running the homologation drive cycle WLTC.

Figure 14.
Indicative trend of the heat losses/power output ratio for the battery and the engine increasing the load demand.
Figure 14.
Indicative trend of the heat losses/power output ratio for the battery and the engine increasing the load demand.

Figure 15.
Absolute heat losses for two battery packs and an equivalent engine.


Table 1.
Engine specifications [17]. Reprinted with permission from ref. [17] Copyright 2019 SAE International.
| Engine Type | 4-Stroke Single Cylinder |
|---|---|
| Bore | 85 mm |
| Stroke | 92 mm |
| Swept volume | 522 cm3 |
| Combustion bowl | 19.7 cm3 |
| Vol. compression ratio | 16.5:1 |
Table 2.
Main parameters of the engine operating conditions.
| Engine Speed | BMEP | IMEP | Indicated Power | Combustion Cycle Duration |
|---|---|---|---|---|
| [rpm] | [bar] | [bar] | [W] | [s] |
| 1500 | 2 | 2.2 | 1425 | 0.08 |
| 1500 | 5 | 5.5 | 3580 | 0.08 |
Table 3.
Specifications of the investigated test cases for the battery.
| Test | Initial SOC | Initial Voltage | Current Rating | Discharge/Charge Time | Resting Time |
|---|---|---|---|---|---|
| 1 | 100% | 4.2 V | 0.5 C | 3600 s | 900 s |
| 2 | 100% | 4.2 V | 1 C | 1800 s | 900 s |
| 3 | 50% | 3.9 V | Variable | 4500 s |
Publisher’s Note: MDPI stays neutral with regard to jurisdictional claims in published maps and institutional affiliations. |
© 2022 by the authors. Licensee MDPI, Basel, Switzerland. This article is an open access article distributed under the terms and conditions of the Creative Commons Attribution (CC BY) license (https://creativecommons.org/licenses/by/4.0/).
Share and Cite
MDPI and ACS Style
Sequino, L.; Mancaruso, E.; Vaglieco, B.M. Analogies in the Analysis of the Thermal Status of Batteries and Internal Combustion Engines for Mobility. Energies 2022, 15, 2700. https://0-doi-org.brum.beds.ac.uk/10.3390/en15072700
AMA Style
Sequino L, Mancaruso E, Vaglieco BM. Analogies in the Analysis of the Thermal Status of Batteries and Internal Combustion Engines for Mobility. Energies. 2022; 15(7):2700. https://0-doi-org.brum.beds.ac.uk/10.3390/en15072700
Chicago/Turabian StyleSequino, Luigi, Ezio Mancaruso, and Bianca Maria Vaglieco. 2022. "Analogies in the Analysis of the Thermal Status of Batteries and Internal Combustion Engines for Mobility" Energies 15, no. 7: 2700. https://0-doi-org.brum.beds.ac.uk/10.3390/en15072700
Note that from the first issue of 2016, this journal uses article numbers instead of page numbers. See further details here.