
The Effect of Different Pressure Conditions on Shock Waves in a Supersonic Steam Ejector

National Joint Engineering Research Center for Thermal Energy Integration, School of Energy and Power Engneering, Dalian University of Technology, Dalian 116024, China
*
Author to whom correspondence should be addressed.
Energies 2022, 15(8), 2903; https://0-doi-org.brum.beds.ac.uk/10.3390/en15082903
Submission received: 27 February 2022
/
Revised: 4 April 2022
/
Accepted: 12 April 2022
/
Published: 15 April 2022
(This article belongs to the Special Issue Challenges and Research Trends of Multiphase Flow)
Abstract
:The complex flow phenomena in a three-dimensional supersonic steam ejector were simulated with a non-equilibrium condensation model including real physical properties in different pressure conditions. The different working conditions include discharge pressure, motive pressure, and suction pressure. The influence of different pressures on shock waves in the steam ejector was investigated comprehensively. The intrinsic causes of shock wave variation with pressure conditions were explained in detail. The results show that the width of the primary shock train region expand with an increase in the motive pressure or a decrease in suction pressure. The diamond shock waves move downstream with an increase in motive pressure or a decrease in suction pressure. The shocking position in the diffuser moves upstream until it reaches the diffuser entrance with an increase in discharge pressure or a decrease in motive pressure or suction pressure. The intensity and number of oblique shock waves in the diffuser increase with an increase in motive pressure and suction pressure or a decrease in discharge pressure. The existence of only one shock wave in the diffuser is a necessary and insufficient condition for the ejector to enter a double choking mode.
1. Introduction
A steam ejector relies on the ejection effect of the motive steam to suck low-pressure steam to a relatively high pressure [1]. It is widely used in the fields of steam parameter adjustment and low-grade energy recovery from steam systems, refrigeration [2,3], seawater desalination [4,5], etc. The performance of steam ejectors affects the operation of and investment in equipment in various industrial fields. Therefore, shock waves in supersonic steam ejectors, which play an influential role in ejector performance, are worthy of investigation.
In the study of the relationship between shock waves and ejector performance, Allouche et al. [6] assumed that water vapor was an ideal gas to simulate a steam ejector. They stated that when there is only one shock wave in the diffuser and the ejector is in a double choking state, the loss in the diffuser is the lowest and the working condition is the best. Han et al. [7] neglected the condensing effect to simulate a supersonic steam ejector. They interpreted that the typical shock wave in the diffuser of a steam ejector prevented the disturbance caused by discharge pressures, maintaining the operation of the ejector in fit-choked flow conditions. Sriveerakul et al. [8] stated that the critical discharge pressure would increase if the shock position moved downstream through an analysis of Mach number contour lines and static pressure distribution along the centerline. Zhu and Jiang [9] discovered that the ejector entrainment performance decreases as the primary shock wave length increased at a given motive pressure in the N2 convergent and convergent–divergent nozzle ejectors. They also found that decreasing the primary shock wave length increases the suction mass flow rate at the sub-critical mode in the N2 convergent nozzle ejector [10]. On the premise that steam is an ideal gas, Tang et al. [11] systematically and quantitatively compared the mixing of two steams from the perspective of mass, momentum, and energy transfer by using the steam ejector double-choking theory based on one-dimensional flow. Their results show that the effects of the shock wave on the mixing process are comparably consistent from the perspectives of mass, momentum, and energy transfer, but the momentum mixing process is more sensitive to the shock wave.
The pressure condition has a significant impact on shock waves in the ejector [12]. Han et al. [7] neglected the condensing effect and pointed out that as the discharge pressure exceeded the critical discharge pressure, the normal shock wave disappeared, and the choking condition was eliminated, resulting in a dramatic drop in pumping efficiencies. Chong et al. [13] reported that the location of the second shockwave region moves upstream as the discharge pressure increases until it disappears in an air ejector. Chen et al. [14] proposed that the second shock train moves further upstream and is combined with the primary shock train to form a single shock train as the discharge pressure rises in the supersonic air ejector. They also indicated that the position of the shock train is affected when the discharge pressure is greater than the critical discharge pressure, which represents a directly proportional relationship with the primary shock train length. Furthermore, the primary shock train length increases with an increase in motive pressure or suction pressure. Zhu and Jiang [9,10] reported that the wavelength of the shock wave increases while the number of shock waves decreases with an increase in the motive pressure in the N2 ejector. Under the same motive pressure, the primary shock train length decreases as the suction pressure increases. Under the same motive pressure, the wavelength of the primary shock wave decreases with an increase in the suction pressure.
Non-equilibrium condensation inevitably leads to significant changes in the flow field of supersonic steam ejectors [15]. Sharifi et al. [16] stated that steam condensation in supersonic regions reduces the maximum value of the Mach flow number in the ejector and increases the ejector’s performance parameters compared to those of hypothetical steam as a dry gas. Wang et al. [17] found that compared with the ideal gas model, the critical discharge pressure obtained by the condensation model increased. Ariafar et al. [18] reported that the entrainment ratio and critical discharge pressure calculated by the wet steam model are 10% and 7% higher than that of the ideal gas law, respectively. Bonelli et al. [19] used a high-performance computing (HPC) method to study the fluid dynamic structure of underexpanded hydrogen jets. They found that the values of Mach number and pressure just behind the Mach disk are affected by the use of real gas equations. Therefore, a condensation model that includes real physical properties that can accurately capture the complex flow phenomenon inside the steam ejector is essential [20].
Although shock waves in the supersonic steam ejector have recently attracted the attention of scholars from different research fields, the influence of different pressures on the shock waves is still not fully understood because non-equilibrium condensation and 3D effects are neglected in many numerical simulations. Mazzelli et al. [21] pointed out that the prediction in off-design conditions is only acceptable with three-dimensional models, making three-dimensional simulations mandatory in order to correctly predict the critical pressure and achieve reasonable results in off-design conditions. The novelty of this study lies in investigating the influence of different pressure conditions on shock wave position, shock wave intensity, shock wave number, and the length and width of the primary shock train region in a three-dimensional supersonic steam ejector considering non-equilibrium condensing and three-dimensional effects. The different working conditions are discharge pressure, motive pressure, and suction pressure. The intrinsic causes of shock wave variation with pressure conditions are explained in detail. The present work provides novel insights into and a deeper understanding of the phenomena of shock waves in a supersonic steam ejector.
2. Numerical Simulation Method
2.1. Mathematical Model
The steady-state fluid flow behavior in a steam ejector is characterized by the three conservation equations.
The turbulent behavior is treated with the k-ω standard turbulence model.
Considering the compressibility of the steam flow in the ejector, the steam properties are calculated using the real-gas state equation, which adopts the third-order virial-type thermodynamic expression [22]:
where B and C are the second and third virial coefficients, respectively, given by the following empirical functions:
where τ = 1500/T, α = 10,000.0, α1 = 0.0015, α2 = −0.000942, and α3 = −0.0004882. C is described as follows:
where τ = T/647.286, τ0 = 0.8978, α = 11.16, a = 1.772, and b = 1.5 × 10⁻⁶.
The two empirical functions that define the virial coefficients B and C cover a temperature range from 273 K to 1073 K.
The vapor isobaric specific heat capacity Cpv is given by the following.
The vapor specific enthalpy hv is given by the following.
The vapor specific entropy sv is given by the following.
The isobaric specific heat at zero pressure is defined by the following empirical equation:
where α1 = 46.0, α2 = 1.47276, α3 = 8.3893 × 10⁻⁴, α4 = −2.19989 × 10⁻⁷, α5 = 2.46619 × 10⁻¹⁰, and α6 = −9.70466 × 10⁻¹⁴. The following is the case:
and we also obtain the following.
Both h0 (T) and s0 (T) are functions of temperature, and they are defined by the following:
where hc and sc are arbitrary constants.
The vapor dynamic viscosity μv and thermal conductivity kv are also functions of temperature and were obtained from [23]. The mixture properties are related to vapor and liquid properties via the wetness factor using the following mixing law:
where φ represents any of the following thermodynamic properties: h, s, Cp, Cv, μ, or k.
The nucleation and droplet growth models are coupled in the flow model to solve non-equilibrium condensation in a steam ejector. The liquid-phase mass-fraction transport equation and the droplet number density transport equation are as follows [24]:
where J is the nucleation rate, and Γ is the liquid mass generation rate, which are introduced in the subsequent section.
The liquid mass condensation rate Γ in the non-equilibrium process is affected by two factors. As shown on the right side of Equation (7), the first item represents the quality of the liquid phase produced by spontaneous nucleation: that is, the formation of critical size droplets. The second item represents the mass of the liquid phase produced by the growth of droplets after nucleation [24]:
where is the critical droplet’s radius. The droplet will grow above and evaporate below :
where S is the super-saturation ratio, which is defined as follows.
The nucleation rate equation and the non-isothermal correction coefficient θ are presented below, respectively [25].
The Young-Gyarmathy model simplified by Senoo is adopted to calculate the droplet’s growth rate [26].
The droplet number density η is the number of droplets per unit volume. After replacing the liquid phase parameter distribution of the multi-element dispersed phase with the average homogeneous parameter distribution, the relationship between η and β can be expressed as follows.
where Vd is the average droplet volume.
The average droplet radius can be derived by combining β and η.
2.2. Numerical Scheme
The finite volume method is utilized to solve the steady-state three-dimensional N-S equation with the k-ω Standard turbulent model. The nucleation and droplet growth models are coupled in the flow model. The pressure-based [27] Navier-Stokes solution algorithm is enabled. The absolute velocity formulation is used in the calculation. The coupled scheme is adopted in pressure–velocity couplings. The convection and diffusion terms are discretized with second-order upwind schemes. Variable gradient discretization adopts the Green-Gauss node-based method.
2.3. Boundary Conditions
Figure 1 shows the structural dimension of the steam ejector. The calculated results are compared with the experimental results of Chen and Sun [28]. The computation parameters are given in Table 1. Given that the inlet and outlet cross-sectional pressures are constant, all walls are assumed to be adiabatic smooth solid walls with no-slip and no-permeation boundary conditions. The turbulence intensity and turbulent viscosity ratios have been used as turbulence boundary conditions. The turbulent viscosity ratios for the motive steam and the suction steam are 500 and 100, respectively. The turbulence intensity for the motive steam and the suction steam are 5% and 2%, respectively [29].
2.4. Meshing Approach
A three-dimensional structured mesh of the steam ejector with refinement processing in the boundary layer area and shock wave area is established, as shown in Figure 2.
The mesh independence study is performed based on three mesh levels, as can be seen in Figure 3. The coarse mesh level is 1.1 million elements. The medium mesh level is 2.0 million elements. The fine mesh level is 2.9 million elements. The Mach number profiles along the mixing chamber centerline are presented in Figure 3. The simulation results show that the Mach number profiles are quite close for the medium mesh and the fine mesh. The grid convergence index (GCI) method is a measure of the relative discrete error of the computed solution involving a comparison of discretization solutions at different grid spacings [30]. This procedure can be performed on any quantity of interest in the computational solution, while the static pressure at the centerline has been chosen as an example to elucidate the method [31]. Table 2 reports the results of the GCI study with fine mesh 1, medium mesh 2, and coarse mesh 3. Medium mesh 2 (2.0 million elements) has a low GCI value. Additionally, its solution duration and memory usage are lower than those of fine mesh 3. Therefore, the mesh with 2.0 million elements was chosen as a size-independent mesh configuration throughout this work.
2.5. Validation of CFD Models
Figure 4a shows the critical discharge pressure predicted by CFD and the experimental results of Chen and Sun [28]. The maximum relative error of the Pd* is −11.7%, and the average relative error is −7.5%. This indicates that the CFD model is credible.
Figure 4b shows the droplet radius comparisons of the CFD results and the experimental results of Nozzle A by Moore et al. [32]. The simulation result of the 2-D model is 0.0201 μm smaller than the experimental value, and the simulation result of the 3-D model is 0.0163 μm larger than the experimental value. The simulation results of the three-dimensional model are closer to the experimental values than those of the two-dimensional model. Therefore, a three-dimensional model was adopted in this paper.
3. Results and Discussion
3.1. The Effect of Different Discharge Pressures on the Shock Waves in a Supersonic Steam Ejector
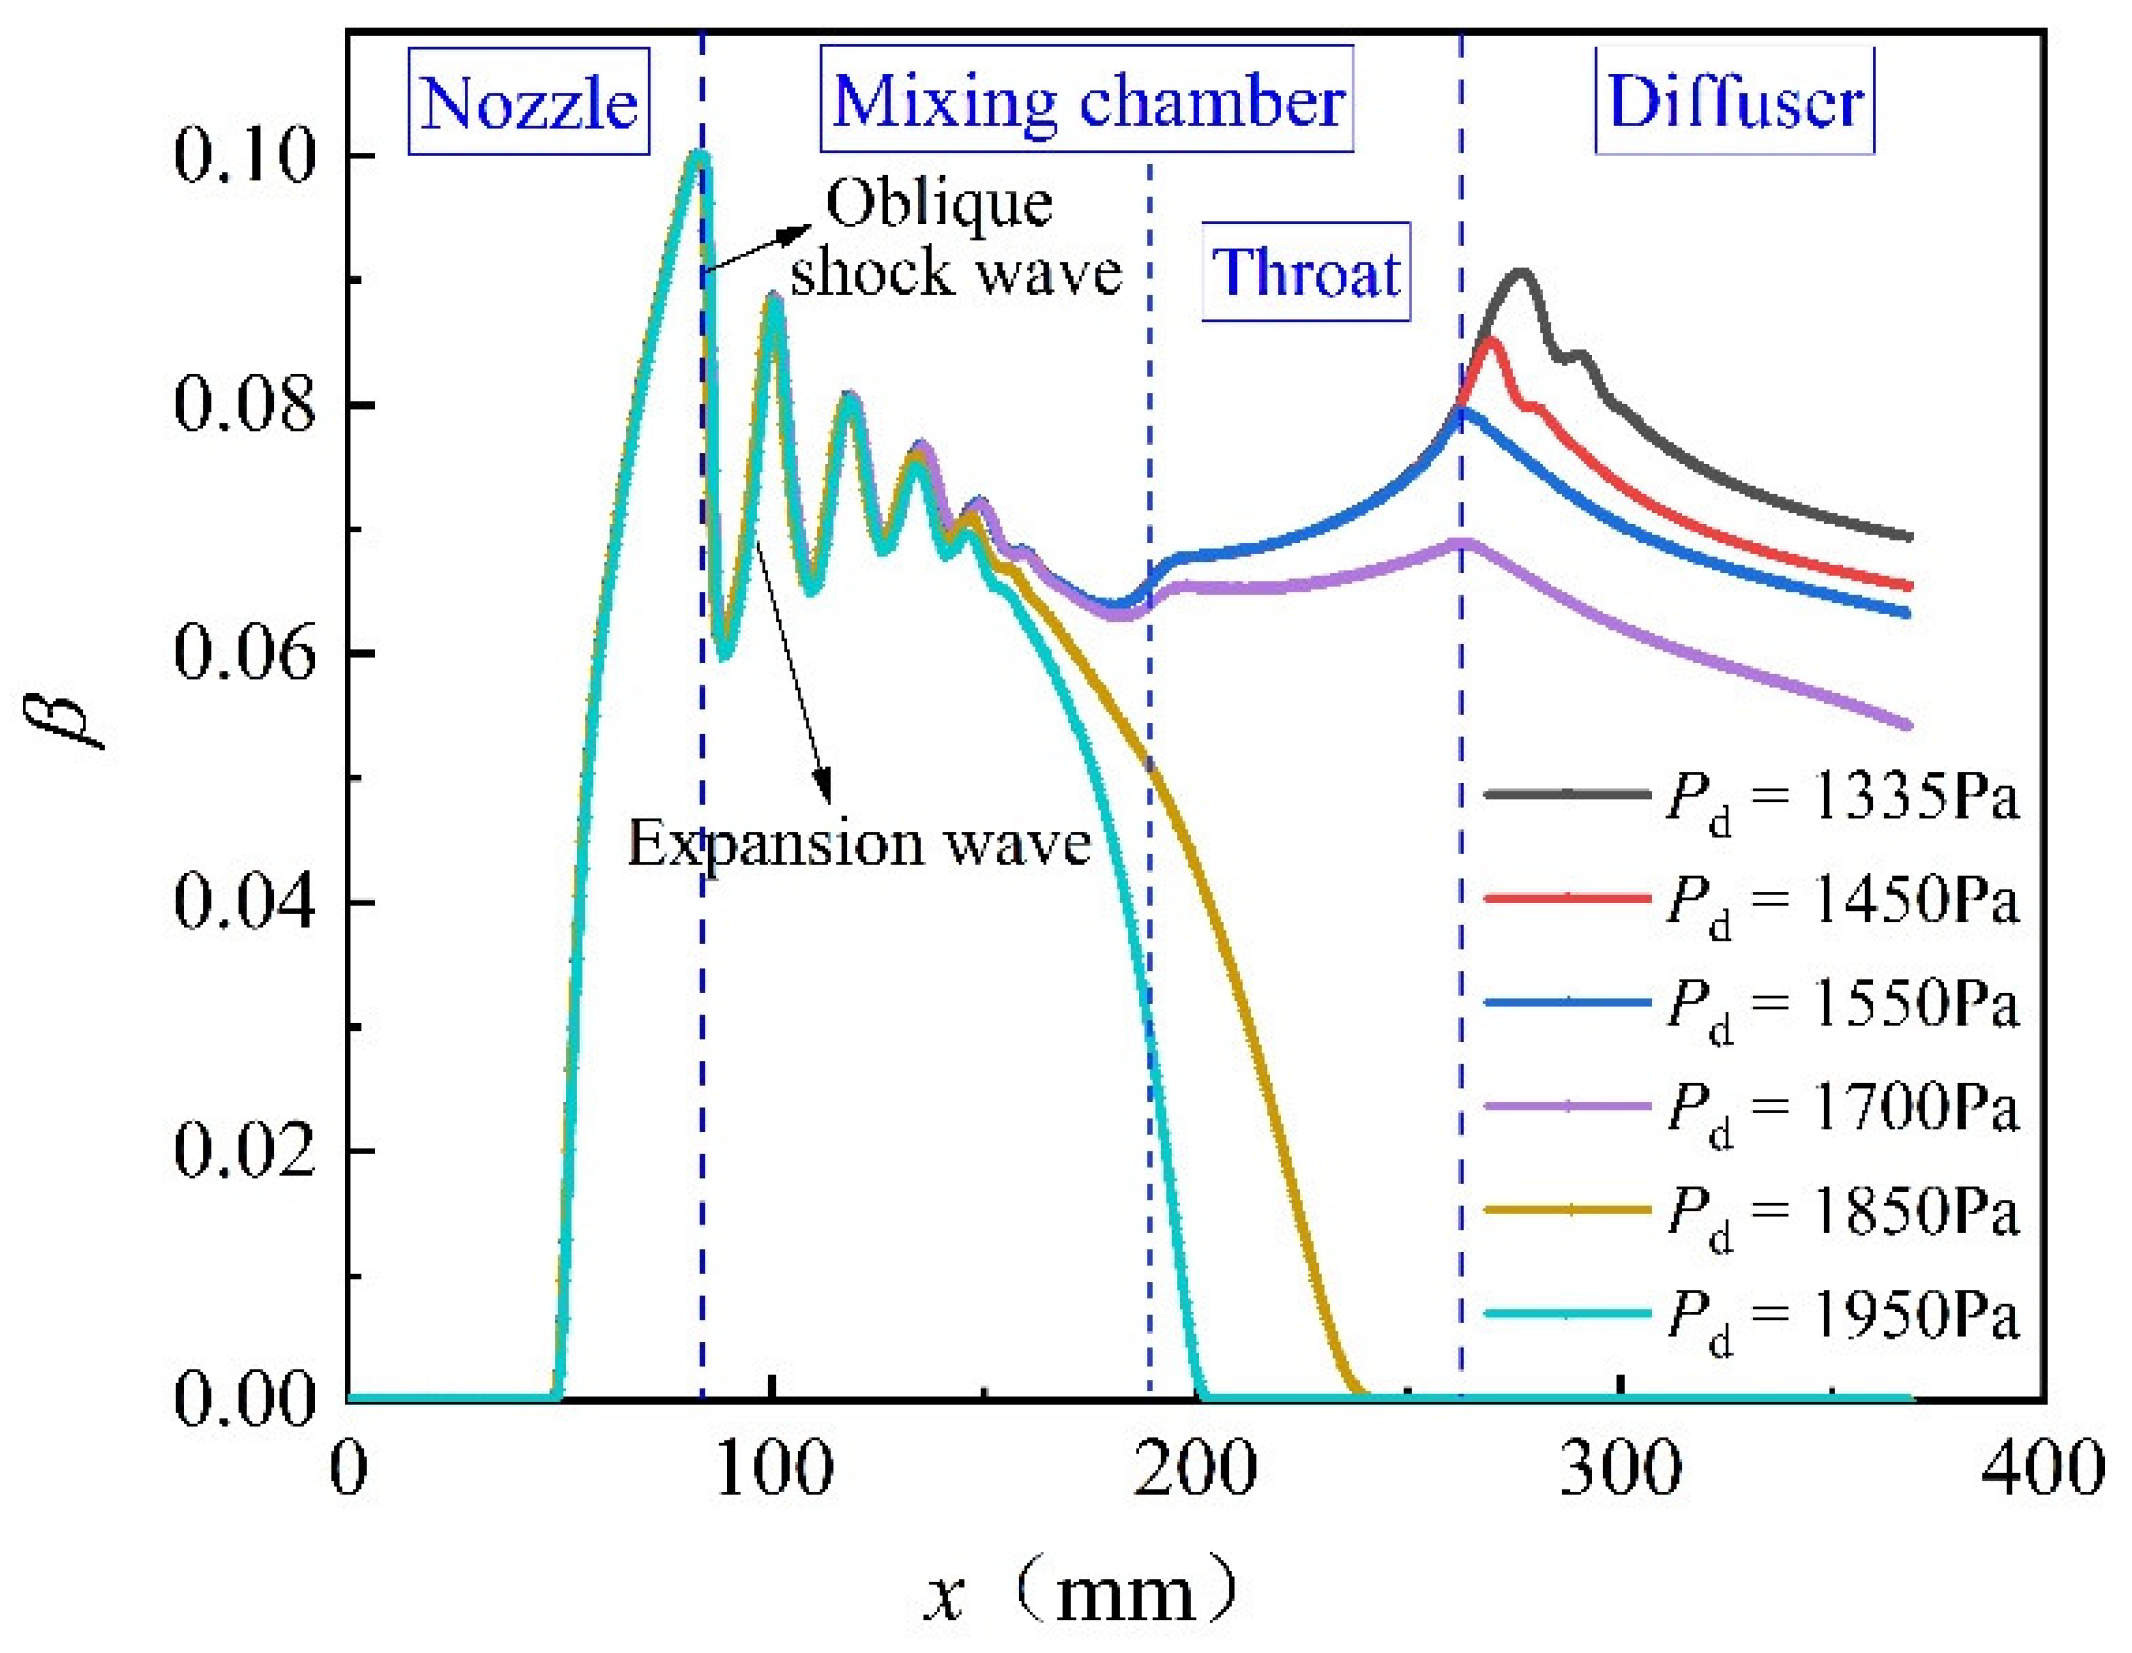
The oblique shock wave sharply reduces velocity and increases static temperature, resulting in a sharp decrease in the Mach number and the condensate mass fraction. Therefore, the number and degree of the fluctuation of the Mach number and the condensate mass fraction in Figure 5 and Figure 6 reflect both the number and intensity of oblique shock waves. The intensity of oblique shock waves is positively related to the magnitude of the mutations. The sudden drop in the Mach number or the condensate mass fraction indicates that an oblique shock wave occurs in the flow field, and the sudden rise indicates that an expansion wave occurs in the flow field. An oblique shock wave and an expansion wave around the nozzle exit constitute a diamond shock wave. Multiple diamond shock waves in the jet core of the mixing chamber compose the primary shock train region. The primary shock train length is the length between the first and last sharp variation in Ma in the mixing chamber. When the pressure of the mixed steam must be reduced to adapt to a low discharge pressure, one or more oblique shock waves will appear again in the diffuser to consume excess energy. The position where the Mach number or the condensate mass fraction drops abruptly is the shocking position.
When Pd is less than or equal to 1550 Pa, the ejector is in the double choking mode because the change in Pd cannot affect the mixing behavior in the upstream flow field of the second choking position, as observed in Figure 7. When Pd increases from 1550 Pa to 1650 Pa, the sonic velocity line at the diffuser entrance begins to move away from the ejector wall, indicating that the compression ratio is too large to resist the adverse pressure gradient imposed by Pd. Downstream information is transmitted back to the mixing chamber, and the mixing process is affected by Pd. Therefore, 1550 Pa is the Pd* under Pm (11,900 Pa) and Ps (1300 Pa). When Pd gradually increased from 1550 Pa to 1700 Pa, the adverse pressure gradient exerted downstream by Pd only affects the throat of the mixing chamber despite the disappearance of the second choking, as shown in Figure 5 and Figure 6. The primary shock train region is not affected. When Pd increased from 1700 Pa to 1850 Pa, the position affected by the adverse downstream pressure gradient gradually moves upstream. The downstream information is transmitted back to the entire mixing chamber, resulting in a shortened primary shock train length and reduced shock intensity. Therefore, the primary shock train length is independent of Pd when the ejector is in the double choking mode. When the ejector is in the single choking mode, the primary shock train length decreases with an increase in Pd only when the mixing process in the entire mixing chamber is affected by the adverse pressure gradient downstream.
When Pd is less than 1550 Pa, there are multiple shock waves in the diffuser that consume excess energy to achieve a low discharge pressure, as observed in Figure 5 and Figure 6. When Pd increased from 1550 Pa to 1650 Pa, there is only one oblique shock wave in the diffuser. When Pd is greater than 1650 Pa, the oblique shock wave in the diffuser disappears. When the second shock wave in the diffuser disappears, leaving only one shock wave, the ejector is in a double choking mode. The existence of only one shock wave in the diffuser is a necessary and insufficient condition for the ejector to be in a double choking mode. The shocking position moves upstream toward the diffuser entrance with an increase in Pd. The diffuser entrance is the critical shocking position.
3.2. The Effect of Different Motive Pressure on the Shock Waves in a Supersonic Steam Ejector
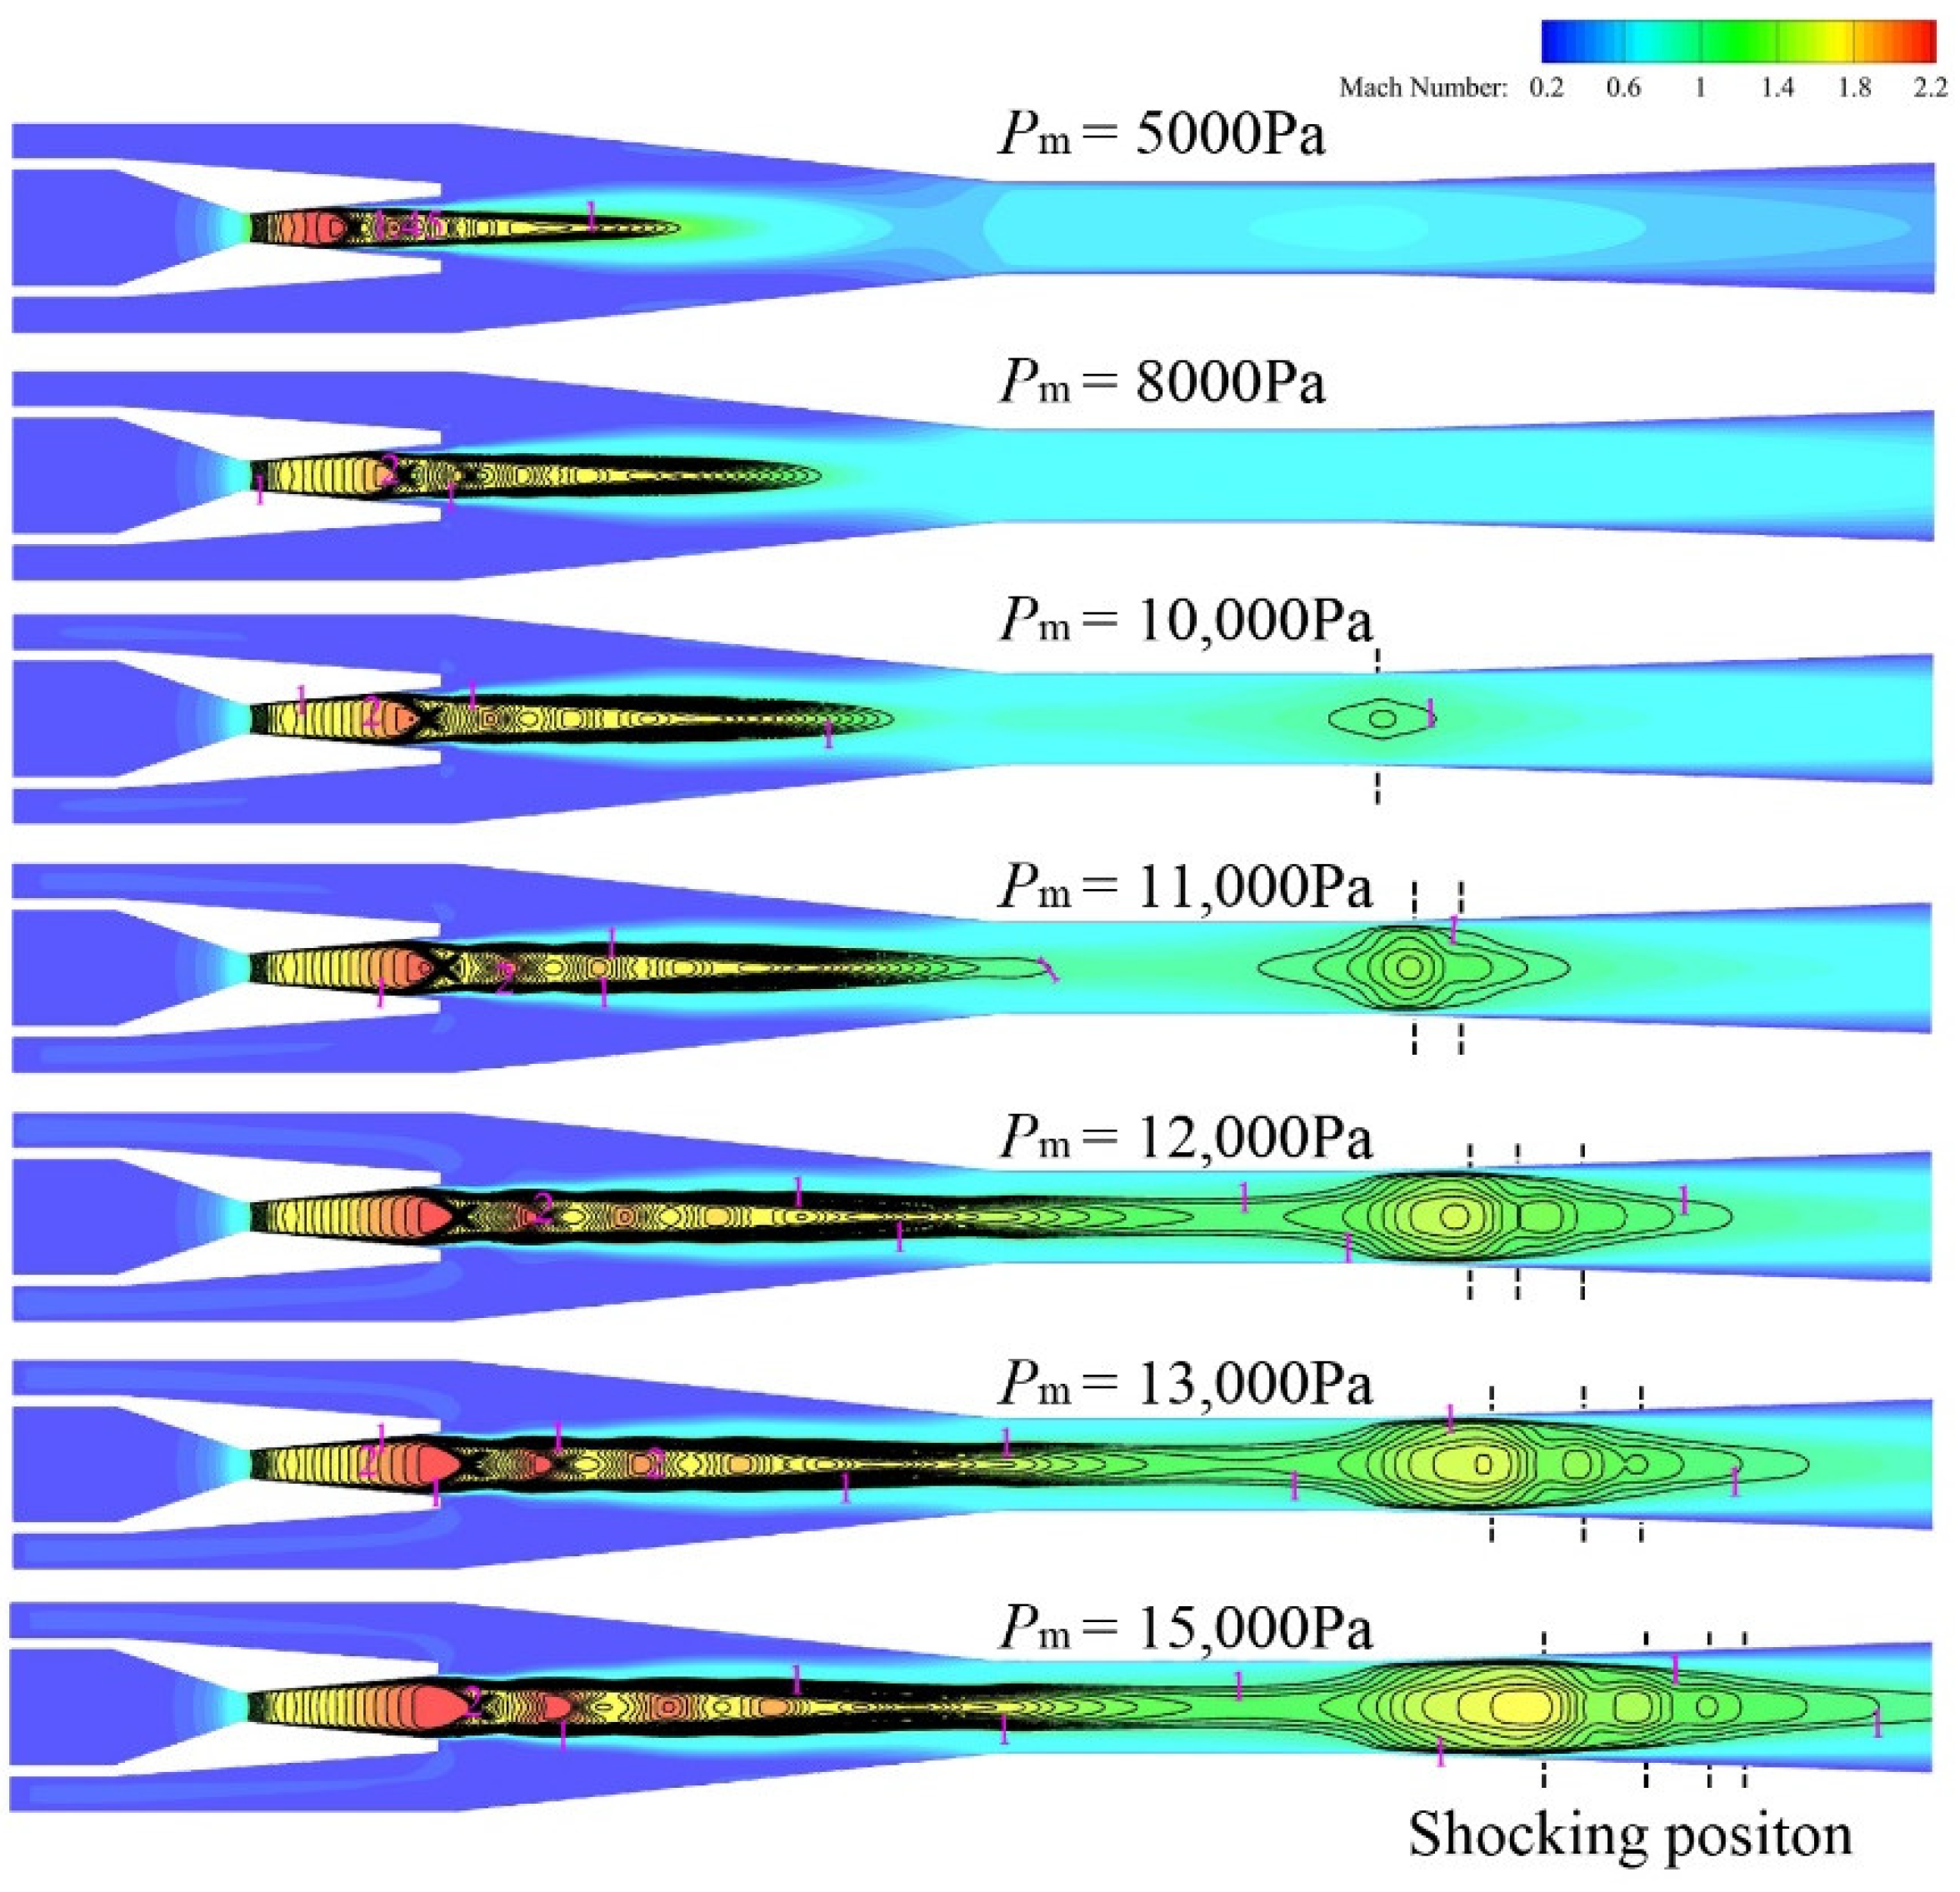
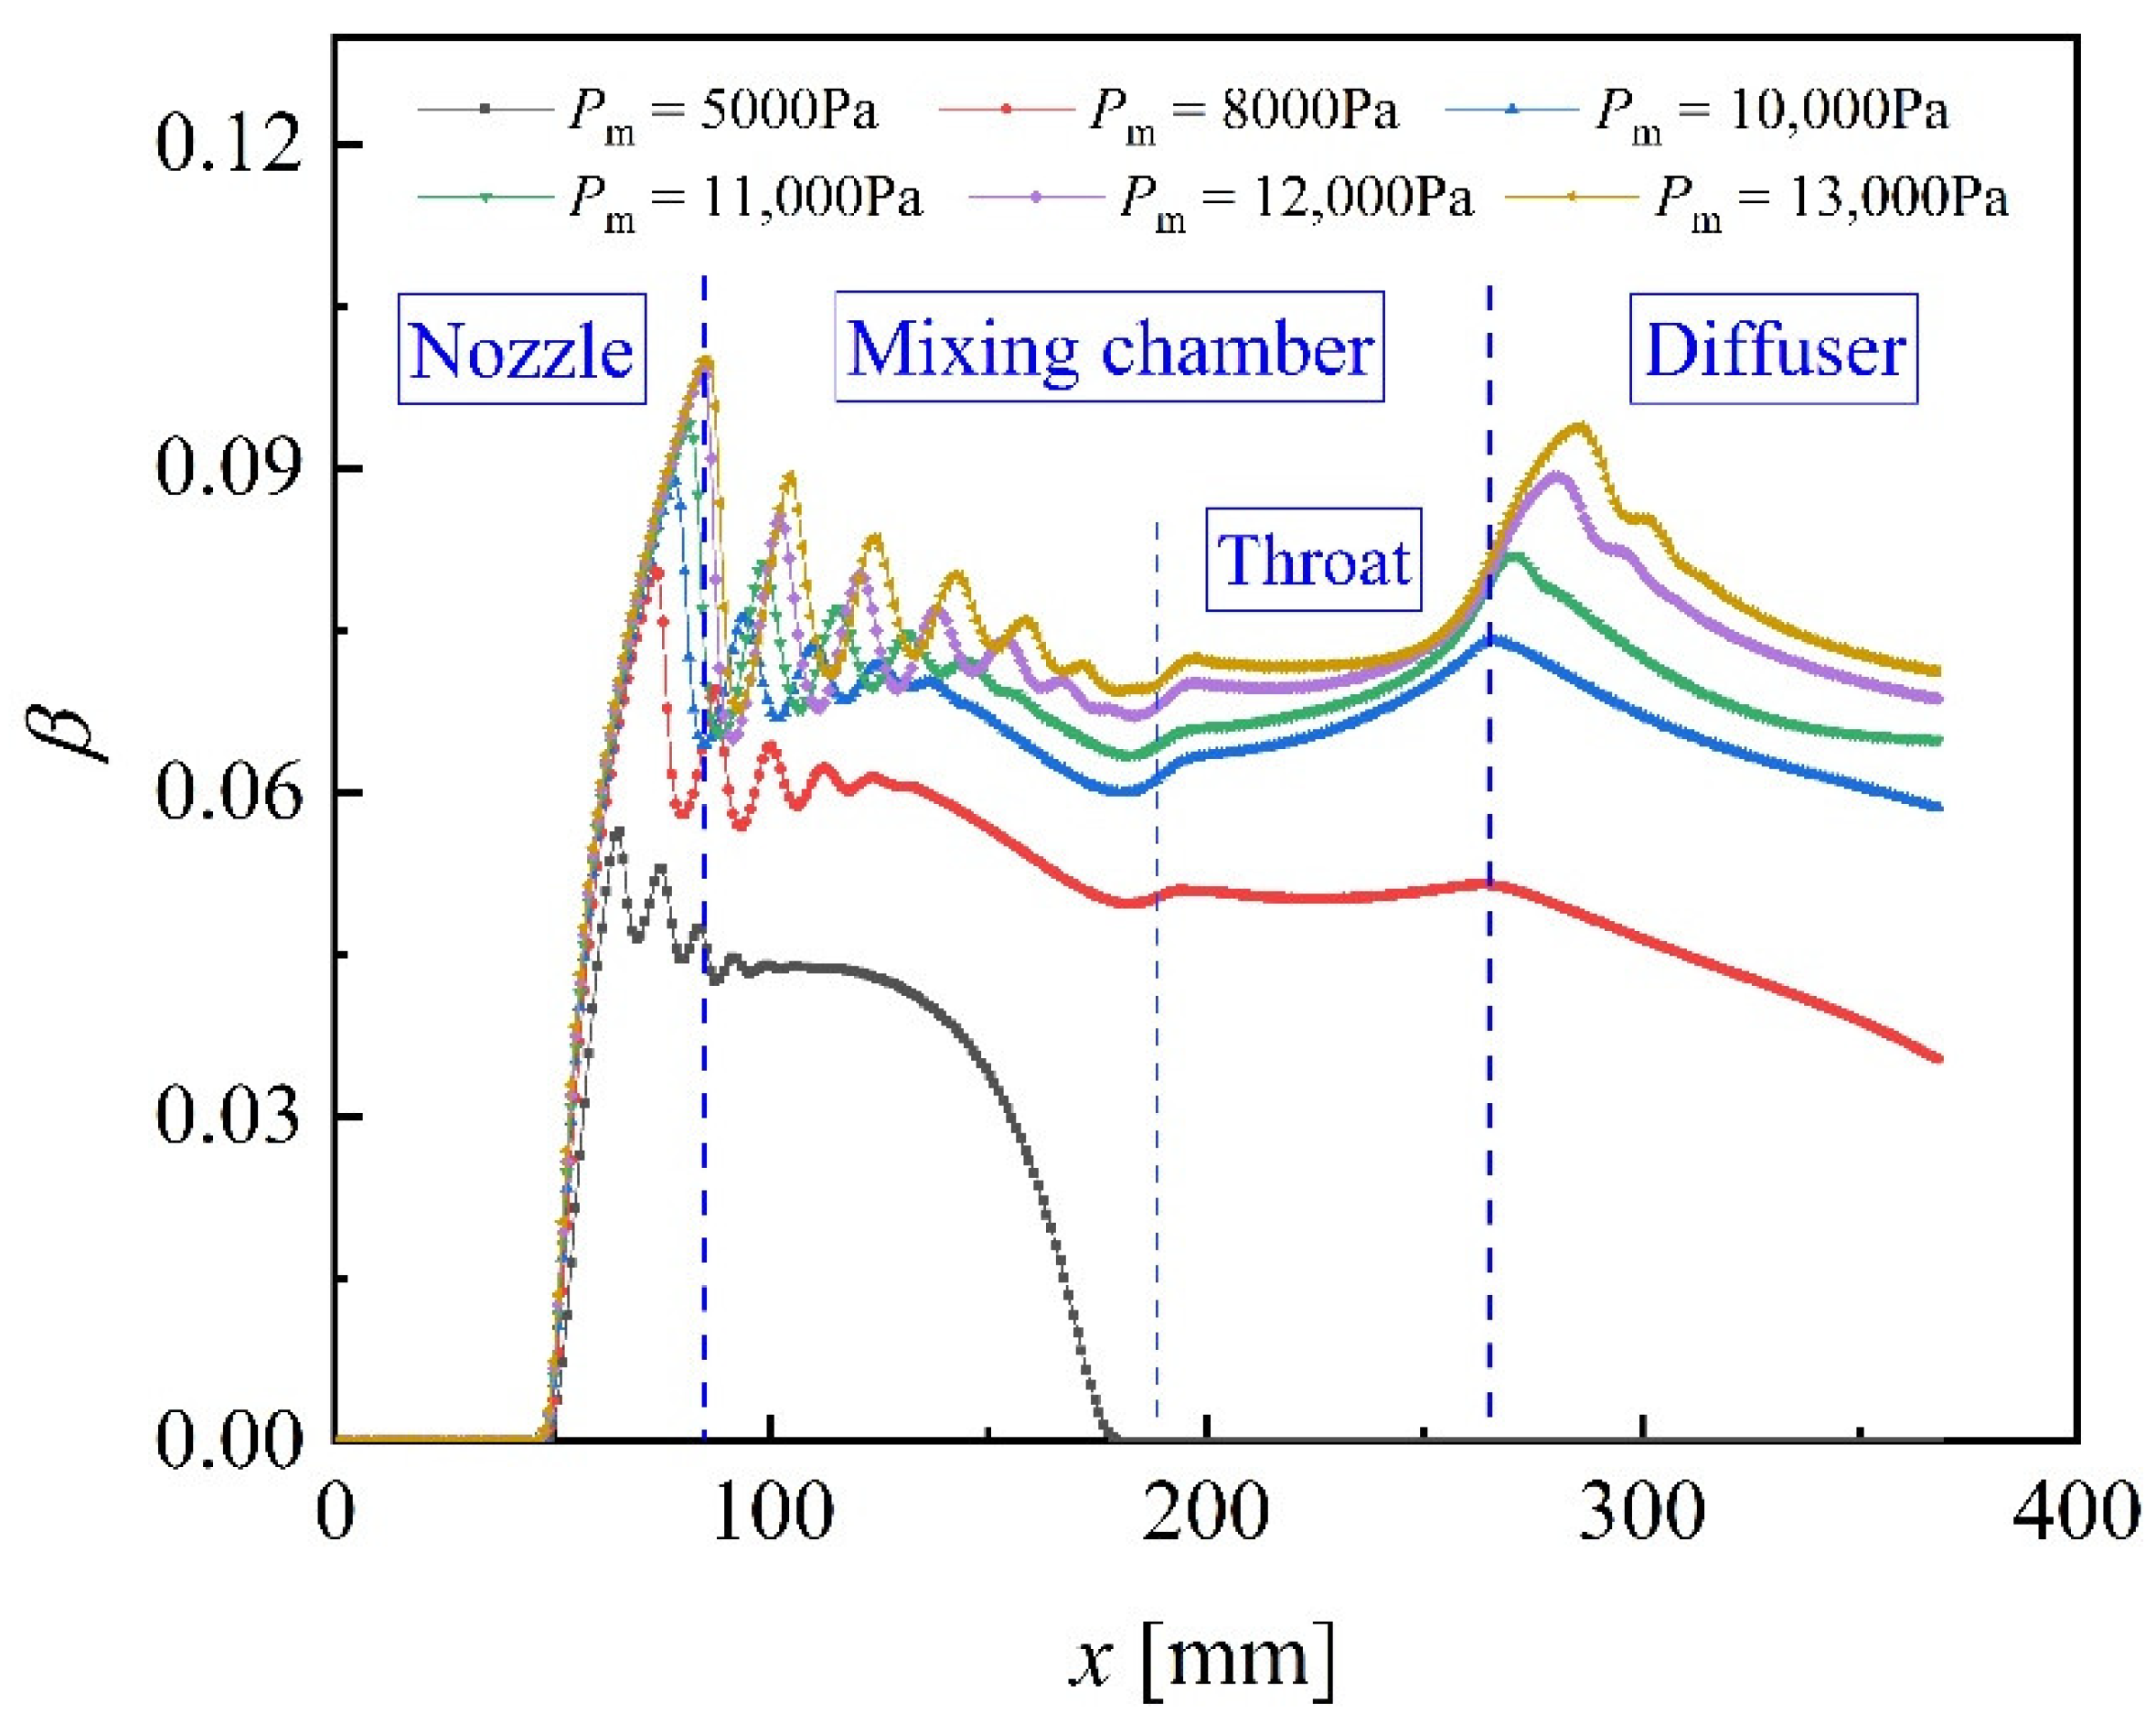
When motive pressure increases from 5000 Pa to 15,000 Pa with a constant Ps (1250 Pa) and Pd (1335 Pa), the diamond shock waves and the shocking position in the diffuser move downstream, the length and the maximum width of the primary shock train region expand, and the intensity and number of oblique shock waves increases, as shown in Figure 8 and Figure 9.
Two main reasons lead to diamond shock waves moving downstream with an increase in Pm. First, a larger Pm pushes the first shock wave downstream. Second, the shock waves are dissipated and attenuated due to the viscous mixing of the motive steam and the suction steam. The dissipated and attenuated speed of the shock waves depends on the energy of the supersonic fluid, which is positively correlated with Pm. Therefore, the dissipated and attenuated speed of shock waves slows down with an increase in Pm. The length and the maximum width of the primary shock train region expand with an increase in Pm.
In the mixing chamber, the pressure difference between Pm and Ps increases with an increase in Pm, resulting in an increase in intensity and the number of shock waves. In the diffuser, the energy of the mixed steam is positively related to Pm. When Pm is larger, more energy is required from oblique shock waves for mixed fluid consumption in order to reach a low discharge pressure. Therefore, the intensity and number of oblique shock waves increase with an increase in Pm.
3.3. The Effect of Different Suction Pressure on the Shock Waves in a Supersonic Steam Ejector
When suction pressure increases from 1000 Pa to 1300 Pa with a constant Pm (11,900 Pa) and Pd (1450 Pa), the diamond shock waves move upstream, the shocking position in the diffuser moves downstream, the length and the maximum width of the primary shock train region decrease, the intensity and number of oblique shock waves increases in the diffuser, and the intensity and number of oblique shock waves decrease in the mixing chamber, as shown in Figure 10 and Figure 11.
In the mixing chamber, the pressure difference between Pm and Ps decreases with an increase in Ps. Therefore, the diamond shock waves move upstream, the length and the maximum width of the primary shock train region shorten, and the intensity and number of oblique shock waves decrease. In the diffuser, the energy of the mixed steam is positively related to Ps. The larger Ps is, mixed fluids will need to consume more energy by using oblique shock waves to reach a low discharge pressure. Therefore, the intensity and number of oblique shock waves increase with an increase in Ps.
4. Conclusions
The novelty of this study lies in our comprehensive investigation of the effects of different pressure conditions on shock waves in a supersonic steam ejector while considering non-equilibrium condensation and three-dimensional effects. From the systematic analysis and discussion provided above, the following key points emerged from this study:
- (1)
- The primary shock train length is independent of the discharge pressure when the ejector is in the double choking mode. When the ejector is in the single choking mode, the primary shock train length decreases with an increase in Pd only when the mixing process in the entire mixing chamber is affected by the adverse pressure gradient downstream. The number and intensity of shock waves in the diffuser decrease with an increase in Pd. The shocking position in the diffuser moves upstream until it reaches the diffuser’s entrance with an increase in Pd.
- (2)
- When the second shock wave in the diffuser disappears, leaving only one shock wave, the ejector is in a double choking mode. The existence of only one shock wave in the diffuser is a necessary and insufficient condition for the ejector to be in a double choking mode.
- (3)
- When motive pressure increases, the diamond shock waves and the shocking position in the diffuser move downstream, the length and the maximum width of the primary shock train region expand, and the intensity and number of oblique shock waves increase.
- (4)
- When the suction pressure increases, the diamond shock waves move upstream, the shocking position in the diffuser moves downstream, the length and the maximum width of the primary shock train region decrease, the intensity and number of oblique shock waves in the diffuser increase, and the intensity and number of oblique shock waves in the mixing chamber decrease.
- (5)
- When considering non-equilibrium condensation, the simulation results of the three-dimensional model are more consistent with the experimental results than those of a two-dimensional model.
Author Contributions
Conceptualization, Y.L. and S.S.; methodology, Y.L.; software, Y.L.; validation, Y.L., C.N. and L.Z.; formal analysis, Y.L.; investigation, Y.L.; resources, S.S.; data curation, Y.L.; writing—original draft preparation, Y.L.; writing—review and editing, C.N.; visualization, C.N.; supervision, Y.G.; project administration, Y.G.; funding acquisition, S.S. All authors have read and agreed to the published version of the manuscript.
Funding
This research was funded by NATIONAL NATURAL SCIENCE FOUNDATION OF CHINA, grant number 51936002; LIAONING MAJOR SPECIAL PROJECT OF SCIENCE AND TECHNOLOGY, grant number 2019JH1/10300003; MAJOR PROJECT OF DALIAN SCIENCE AND TECHNOLOGY INNOVATION FUND, grant number 2019J11CY020.
Institutional Review Board Statement
Not applicable.
Informed Consent Statement
Not applicable.
Data Availability Statement
The data presented in this study are available on request from the corresponding author.
Conflicts of Interest
The authors declare no conflict of interest.
Nomenclature
| Cp | (J/(kg∙K)) | Isobaric heat capacity |
| F | (N/m3) | Source term |
| G | (kg/s) | Mass flow rate |
| h | (J/kg) | Specific enthalpy |
| hlv | (J/(kg)) | Latent heat of condensation |
| J | (1/s) | Nucleation rate |
| k | (W/(m2∙K)) | Heat transfer coefficient |
| kB | (–) | Boltzmann constant |
| Ma | (–) | Mach number |
| R | (–) | Gas-law constant |
| r | (m) | Droplet radius |
| S | (–) | Super-saturation ratio |
| s | (J/(kg∙mol∙K)) | Specific entropy |
| ST | (kg∙K/(m3∙s)) | Viscous dissipative term |
| T | (K) | Temperature |
| Special characters | ||
| β | (–) | Liquid mass fraction |
| Г | (kg/s) | Liquid mass generation rate |
| ρ | (kg/m3) | Density |
| γ | (–) | Specific heat capacities ratio |
| μ | (Pa/s) | Dynamic viscosity |
| σ | (N/m) | Liquid surface tension |
| η | (1/m3) | Droplet number density |
| θ | (–) | Non-isothermal correction factor |
| v | (m2/s) | Kinematic viscosity |
| λ | (W/(m∙K)) | Thermal conductivity |
| Subscripts | ||
| sat | Saturation | |
| m | Motive steam | |
| s | Suction steam | |
| d | Discharge steam | |
| l | Liquid | |
| v | Vapor | |
References
- Mukhtar, H.K.; Ghani, S. Hybrid Ejector-Absorption Refrigeration Systems: A Review. Energies 2021, 14, 6576. [Google Scholar] [CrossRef]
- Han, Y.; Wang, X.; Sun, H.; Zhang, G.; Guo, L.; Tu, J. CFD simulation on the boundary layer separation in the steam ejector and its influence on the pumping performance. Energy 2019, 167, 469–483. [Google Scholar] [CrossRef]
- Chen, W.; Shi, C.; Zhang, S.; Chen, H.; Chong, D.; Yan, J. Theoretical analysis of ejector refrigeration system performance under overall modes. Appl. Energy 2017, 185, 2074–2084. [Google Scholar] [CrossRef]
- Zheng, Y.; Hatzell, K.B. Technoeconomic analysis of solar thermal desalination. Desalination 2020, 474, 114168. [Google Scholar] [CrossRef]
- Wen, C.; Gong, L.; Ding, H.; Yang, Y. Steam ejector performance considering phase transition for multi-effect distillation with thermal vapour compression (MED-TVC) desalination system. Appl. Energy 2020, 279, 115831. [Google Scholar] [CrossRef]
- Allouche, Y.; Bouden, C.; Varga, S. A CFD analysis of the flow structure inside a steam ejector to identify the suitable experimental operating conditions for a solar-driven refrigeration system. Int. J. Refrig. 2014, 39, 186–195. [Google Scholar] [CrossRef]
- Han, Y.; Wang, X.; Yuen, A.C.Y.; Li, A.; Guo, L.; Yeoh, G.H.; Tu, J. Characterization of choking flow behaviors inside steam ejectors based on the ejector refrigeration system. Int. J. Refrig. 2020, 113, 296–307. [Google Scholar] [CrossRef]
- Sriveerakul, T.; Aphornratana, S.; Chunnanond, K. Performance prediction of steam ejector using computational fluid dynamics: Part 2. Flow structure of a steam ejector influenced by operating pressures and geometries. Int. J. Therm. Sci. 2007, 46, 823–833. [Google Scholar] [CrossRef]
- Zhu, Y.; Jiang, P. Experimental and analytical studies on the shock wave length in convergent and convergent–divergent nozzle ejectors. Energy Convers. Manag. 2014, 88, 907–914. [Google Scholar] [CrossRef]
- Zhu, Y.; Jiang, P. Experimental and numerical investigation of the effect of shock wave characteristics on the ejector performance. Int. J. Refrig. 2014, 40, 31–42. [Google Scholar] [CrossRef]
- Tang, Y.; Liu, Z.; Li, Y.; Zhao, F.; Fan, P.; Chua, K.J. Mixing process of two streams within a steam ejector from the perspectives of mass, momentum and energy transfer. Appl. Therm. Eng. 2021, 185, 116358. [Google Scholar] [CrossRef]
- Wang, X.; Dong, J.; Zhang, G.; Fu, Q.; Li, H.; Han, Y.; Tu, J. The primary pseudo-shock pattern of steam ejector and its influence on pumping efficiency based on CFD approach. Energy 2019, 167, 224–234. [Google Scholar] [CrossRef]
- Chong, D.; Hu, M.; Chen, W.; Wang, J.; Liu, J.; Yan, J. Experimental and numerical analysis of supersonic air ejector. Appl. Energy 2014, 130, 679–684. [Google Scholar] [CrossRef]
- Chen, W.; Xue, K.; Chen, H.; Chong, D.; Yan, J. Experimental and numerical analysis on the internal flow of supersonic ejector under different working modes. Heat Transfer Eng. 2017, 39, 700–710. [Google Scholar] [CrossRef]
- Mazzelli, F.; Giacomelli, F.; Milazzo, A. CFD modeling of condensing steam ejectors: Comparison with an experimental test-case. Int. J. Therm. Sci. 2018, 127, 7–18. [Google Scholar] [CrossRef]
- Sharifi, N.; Boroomand, M.; Sharifi, M. Numerical assessment of steam nucleation on thermodynamic performance of steam ejectors. Appl. Therm. Eng. 2013, 52, 449–459. [Google Scholar] [CrossRef]
- Wang, X.-D.; Lei, H.-J.; Dong, J.-L.; Tu, J.-Y. The spontaneously condensing phenomena in a steam-jet pump and its influence on the numerical simulation accuracy. Int. J. Heat Mass Transf. 2012, 55, 4682–4687. [Google Scholar] [CrossRef]
- Ariafar, K.; Buttsworth, D.; Al-Doori, G.; Malpress, R. Effect of mixing on the performance of wet steam ejectors. Energy 2015, 93, 2030–2041. [Google Scholar] [CrossRef]
- Bonelli, F.; Viggiano, A.; Magi, V. A Numerical Analysis of Hydrogen Underexpanded Jets Under Real Gas Assumption. J. Fluids Eng. 2013, 135, 121101. [Google Scholar] [CrossRef] [Green Version]
- Zhang, G.; Dykas, S.; Li, P.; Li, H.; Wang, J. Accurate condensing steam flow modeling in the ejector of the solar-driven refrigeration system. Energy 2020, 212, 118690. [Google Scholar] [CrossRef]
- Mazzelli, F.; Little, A.B.; Garimella, S.; Bartosiewicz, Y. Computational and experimental analysis of supersonic air ejector: Turbulence modeling and assessment of 3D effects. Int. J. Heat Fluid Flow 2015, 56, 305–316. [Google Scholar] [CrossRef]
- Young, J.B. An equation of state for steam for turbomachinery and other flow calculations. J. Eng. Gas Turbines Power 1988, 110, 1–7. [Google Scholar] [CrossRef]
- Young, J.B. Spontaneous condensation of steam in supersonic nozzles. Physicochem. Hydrodyn. 1982, 3, 57–82. [Google Scholar]
- Daiguji, H.; Ishazaki, K.; Ikohagi, T. A High-Resolution Numerical Method for Transonic Non-equilibrium Condensation Flows through a Steam Turbine Cascade. In Proceedings of the 6th International Symposium on Computational Fluid Dynamics, Lake Tahoe, CA, USA, 4–8 September 1995; Volume 1, pp. 479–484. [Google Scholar]
- Kantrowitz, A. Nucleation in very rapid vapor expansions. J. Chem. Phys. 1951, 19, 1097–1100. [Google Scholar] [CrossRef]
- Shigeki, S.; Yoshio, S. Two-dimensional analysis for non-equilibrium homogeneously condensing flows through steam turbine cascade. JSME Int. J. Ser. B Fluids Therm. Eng. 2002, 45, 865–871. [Google Scholar]
- Tashtoush, B.M.; Al-Nimr, M.A.; Khasawneh, M.A. A comprehensive review of ejector design, performance, and applications. Appl. Energy 2019, 240, 138–172. [Google Scholar] [CrossRef]
- Chen, Y.; Sun, C. Experimental study of the performance characteristics of a steam-ejector refrigeration system. Exp. Therm. Fluid Sci. 1997, 15, 384–394. [Google Scholar] [CrossRef]
- Besagni, G.; Mereu, R.; Chiesa, P.; Inzoli, F. An Integrated Lumped Parameter-CFD approach for off-design ejector performance evaluation. Energy Convers. Manag. 2015, 105, 697–715. [Google Scholar] [CrossRef]
- Celik, I.B.; Ghia, U.; Roache, P.J.; Freitas, C.J. Procedure for estimation and reporting of uncertainty due to discretization in CFD applications. J. Fluids Eng. 2008, 130, 78001. [Google Scholar]
- Semlitsch, B.; Mihăescu, M. Evaluation of Injection Strategies in Supersonic Nozzle Flow. Aerospace 2021, 8, 369. [Google Scholar] [CrossRef]
- Moore, M.J.; Walters, P.T.; Crane, R.I.; Davidson, B.J. Predicting the fog-drop size in wet steam turbines. In Proceedings of the Wet Steam 4 Conference, Coventry, UK, 3–5 April 1973; pp. C37–C73. [Google Scholar]
Figure 1.
Structure and size of the steam ejector.

Figure 2.
Schematic diagram of the 3D steam ejector mesh.

Figure 3.
Mesh independence study using Mach number along the centerline of the mixing chamber.

Figure 4.
(a) Pd* comparisons of CFD and experimental results. (b) Droplet radius comparisons of CFD and experimental results.
Figure 4.
(a) Pd* comparisons of CFD and experimental results. (b) Droplet radius comparisons of CFD and experimental results.


Figure 5.
Ma counters with different Pd.

Figure 6.
Condensate mass fraction profiles of the axis with different Pd.

Figure 7.
Sonic lines with different Pd.

Figure 8.
Ma counters with different Pm.

Figure 9.
Condensate mass fraction profiles of the axis with different Pm.

Figure 10.
Ma counters with different Ps.

Figure 11.
Ma profiles of the axis with different Ps.


Table 1.
Computation parameters.
| Pm/Pa | Tm/°C | Ps/Pa | Ts/°C | Pd/Pa | Td/°C |
|---|---|---|---|---|---|
| 11,900 | 51.3 | 1300 | 10.9 | 1335~1950 | 11.3~17.2 |
| 5000~15,000 | 34.9~56.0 | 1250 | 10.3 | 1335 | 11.3 |
| 11,900 | 51.3 | 1000~1300 | 7.0~10.9 | 1450 | 12.5 |
Table 2.
Calculated results of the GCI method.
| Apparent Order | eext/(%) | e21/(%) | ||
|---|---|---|---|---|
| mean | 4.16 | 0.76 | 0.40 | 0.45 |
| min | 0.11 | 4.80 × 10⁻³ | 4.60 × 10⁻⁵ | 1.17 × 10⁻⁴ |
| max | 18.99 | 18.21 | 5.92 | 26.48 |
Publisher’s Note: MDPI stays neutral with regard to jurisdictional claims in published maps and institutional affiliations. |
© 2022 by the authors. Licensee MDPI, Basel, Switzerland. This article is an open access article distributed under the terms and conditions of the Creative Commons Attribution (CC BY) license (https://creativecommons.org/licenses/by/4.0/).
Share and Cite
MDPI and ACS Style
Li, Y.; Shen, S.; Niu, C.; Guo, Y.; Zhang, L. The Effect of Different Pressure Conditions on Shock Waves in a Supersonic Steam Ejector. Energies 2022, 15, 2903. https://0-doi-org.brum.beds.ac.uk/10.3390/en15082903
AMA Style
Li Y, Shen S, Niu C, Guo Y, Zhang L. The Effect of Different Pressure Conditions on Shock Waves in a Supersonic Steam Ejector. Energies. 2022; 15(8):2903. https://0-doi-org.brum.beds.ac.uk/10.3390/en15082903
Chicago/Turabian StyleLi, Yiqiao, Shengqiang Shen, Chao Niu, Yali Guo, and Liuyang Zhang. 2022. "The Effect of Different Pressure Conditions on Shock Waves in a Supersonic Steam Ejector" Energies 15, no. 8: 2903. https://0-doi-org.brum.beds.ac.uk/10.3390/en15082903
Note that from the first issue of 2016, this journal uses article numbers instead of page numbers. See further details here.