
Experimental Interharmonic Sensitivity Evaluation of LED Lamps Based on the Luminous Flux Flicker Model

1
State Grid Beijing Electric Power Research Institute, State Grid Beijing Electric Power Company, Beijing 100075, China
2
School of Electrical Engineering and Automation, Anhui University, Hefei 230601, China
*
Author to whom correspondence should be addressed.
Energies 2022, 15(9), 2990; https://0-doi-org.brum.beds.ac.uk/10.3390/en15092990
Submission received: 22 February 2022
/
Revised: 22 March 2022
/
Accepted: 18 April 2022
/
Published: 19 April 2022
(This article belongs to the Special Issue Energy, Electrical and Power Engineering 2021-2022)
Abstract
:LED lamps have gradually replaced other lighting sources and have become mainstream in the lighting industry. The research on interharmonic sensitivity affecting their lighting quality cannot be ignored. By deconstructing the lamp-eye-brain module in the International Electrotechnical Commission (IEC) flicker model, a luminous flux flicker model without the constraints of a specific light source was proposed. The test system and corresponding analysis method of the interharmonic-luminous flux transfer coefficient in the model were described in detail, and the accuracy of the test results of the system was verified via incandescent lamp heat balance model simulations. Based on the test results, the conversion method of the interharmonic ratio of LED lamps under the flicker limit based on the interharmonic-flicker limit curve of incandescent lamps was deduced. By testing and comparing the differences in interharmonic-flicker limit curves of different driving types of LED lamps, the experimental evaluation of their sensitivity was completed, and the reference for LED lamp selection, driver design, and compatibility standard formulation in different application scenarios was provided.
1. Introduction
Lighting is an indispensable part of the normal operation of modern society. With people becoming more concerned with lighting quality, energy conservation, and environmental protection, LED lamps relying on semiconductor technology have gradually replaced incandescent lamps, fluorescent lamps, and compact energy-saving lamps and have become the new mainstream lighting source [1,2]. Presently, the lighting change as a result of voltage fluctuations caused by interharmonics in the power grid is one of the most important factors affecting lighting quality [3,4,5]. The evaluation of LED lamp sensitivity to interharmonics is an essential part of product application selection, drive design optimization, and compatibility standard formulation.
Flicker quantifies the impact of light changes on human vision, and the measurement method for flicker is given by the International Electrotechnical Commission (IEC) 61000-4-15 standard based on the flicker effect of amplitude modulation voltage on tungsten incandescent lamps (referred to as incandescent lamps) [6,7,8,9]. Based on this, researchers have made various improvements, studied the flicker effect of interharmonics, and obtained the interharmonic level corresponding to the flicker limit [10,11]. However, these studies are based on the thermal radiation balance of incandescent lamps. This model is not applicable to the study of light sources with different luminous principles [12]. In this regard, the interharmonic sensitivity of fluorescent lamps has been studied by establishing the interharmonic flux flicker test platform and using the iterative approximation method, and the interharmonic-flicker limit curve of fluorescent lamps has been drawn one by one [13,14]. However, this method has some problems such as low efficiency and complexity; yet, there is little research on LED flicker. In [15], an actual case where the flicker meter could not detect exceedance of the standard was introduced, but the human eye could observe the light and shade changes of LED lights. The problem was solved by replacing different brands of LED lights. In [16], an incandescent lamp as the control group of the existing light source was used, and under the condition of the same voltage fluctuation level, the relative change in illuminance of different light sources was compared and analyzed to measure the degree of influence. In [17], the flicker effect of LED lamps with different color temperatures was studied; however, in the comparison between cool white and warm white lamps, the flicker value was measured via FULKE 435, the algorithm of which belongs to the IEC flicker model based on incandescent lamps. Therefore, its measurement results are not referential. In [18,19,20,21], the response distribution of different types of LED lamps under the same interharmonic conditions was analyzed with the percent flicker and flicker index from the perspective of luminous flux as the bases for evaluating the quality of lighting products. These studies lack the quantitative analysis of the corresponding relationship between the light and dark changes of LED lights caused by interharmonics. However, [22] proposed a flicker meter based on the general model of the lamp. The flicker test for different types of light sources was based on the changes in three parameters derived from the lamp type and its circuit, but sufficient experimental data to demonstrate the rationality and accuracy of the derived parameters are still needed. Although LED lamps are widely used, it is still necessary to study a new flicker model that is separate from incandescent lamps and take the flicker limit as a constraint to realize the evaluation of the interharmonic sensitivity of LED lamps.
By deconstructing the lamp-eye-brain module in the IEC flicker model, this paper proposed a luminous flux flicker model that is free from the constraints of specific light sources and describes in detail the test system and corresponding analysis method of lamp interharmonic luminous flux transfer coefficient in the model. The accuracy of the test results of the system was verified via incandescent lamp heat balance model simulations. Based on the results, the conversion method of the interharmonic ratio of LED lamps based on the interharmonic-flicker limit curve of incandescent lamps under the flicker limit was deduced. The experimental evaluation of its sensitivity was completed by testing and comparing the differences between interharmonic-flicker limit curves of different driving types of LED lamps.
The main contributions of this paper could be summarized as follows:
- The lamp-eye-brain module in the IEC flicker model was deconstructed, and the luminous flux flicker model, free from the constraints of incandescent lamps, was obtained, providing a general model for the flicker effect measurement of any light source.
- Through simulations and measurements of a specific incandescent lamp, the test system and corresponding analysis method of the interharmonic-luminous flux transfer coefficient composed of a programmable power supply, an illuminance sensor, a shading box, a multi-channel data acquisition device, and a data analysis system were verified. The luminous flux flicker model accuracy provided a test platform for its application.
- Using the incandescent lamp given by IEC as a reference, and by applying the transfer coefficient of interharmonic voltage and luminous flux fluctuation of different light sources to calculate the corresponding interharmonic-flicker limit curve of the light source, the proposed method simplified the test operation steps while overcoming the programmable power limitations.
- By comparing the magnitude of the interharmonic-flicker limit curves of different light sources at different frequencies, the sensitivity to interharmonics was measured.
The remainder of this paper is organized as follows. The luminous flux flicker model, derived based on the IEC flicker model, is described in Section 2. In Section 3, the core interharmonic-luminous flux testing system in the luminous flux flicker model is established and verified. The interharmonic sensitivity evaluation is presented in Section 4 via LED lamp interharmonics-flicker limit curve calculation. Section 5 discusses and analyzes the interharmonic sensitivity test results for LED lamps classified according to drive. The conclusions are presented in Section 6.
2. Luminous Flux Flicker Model
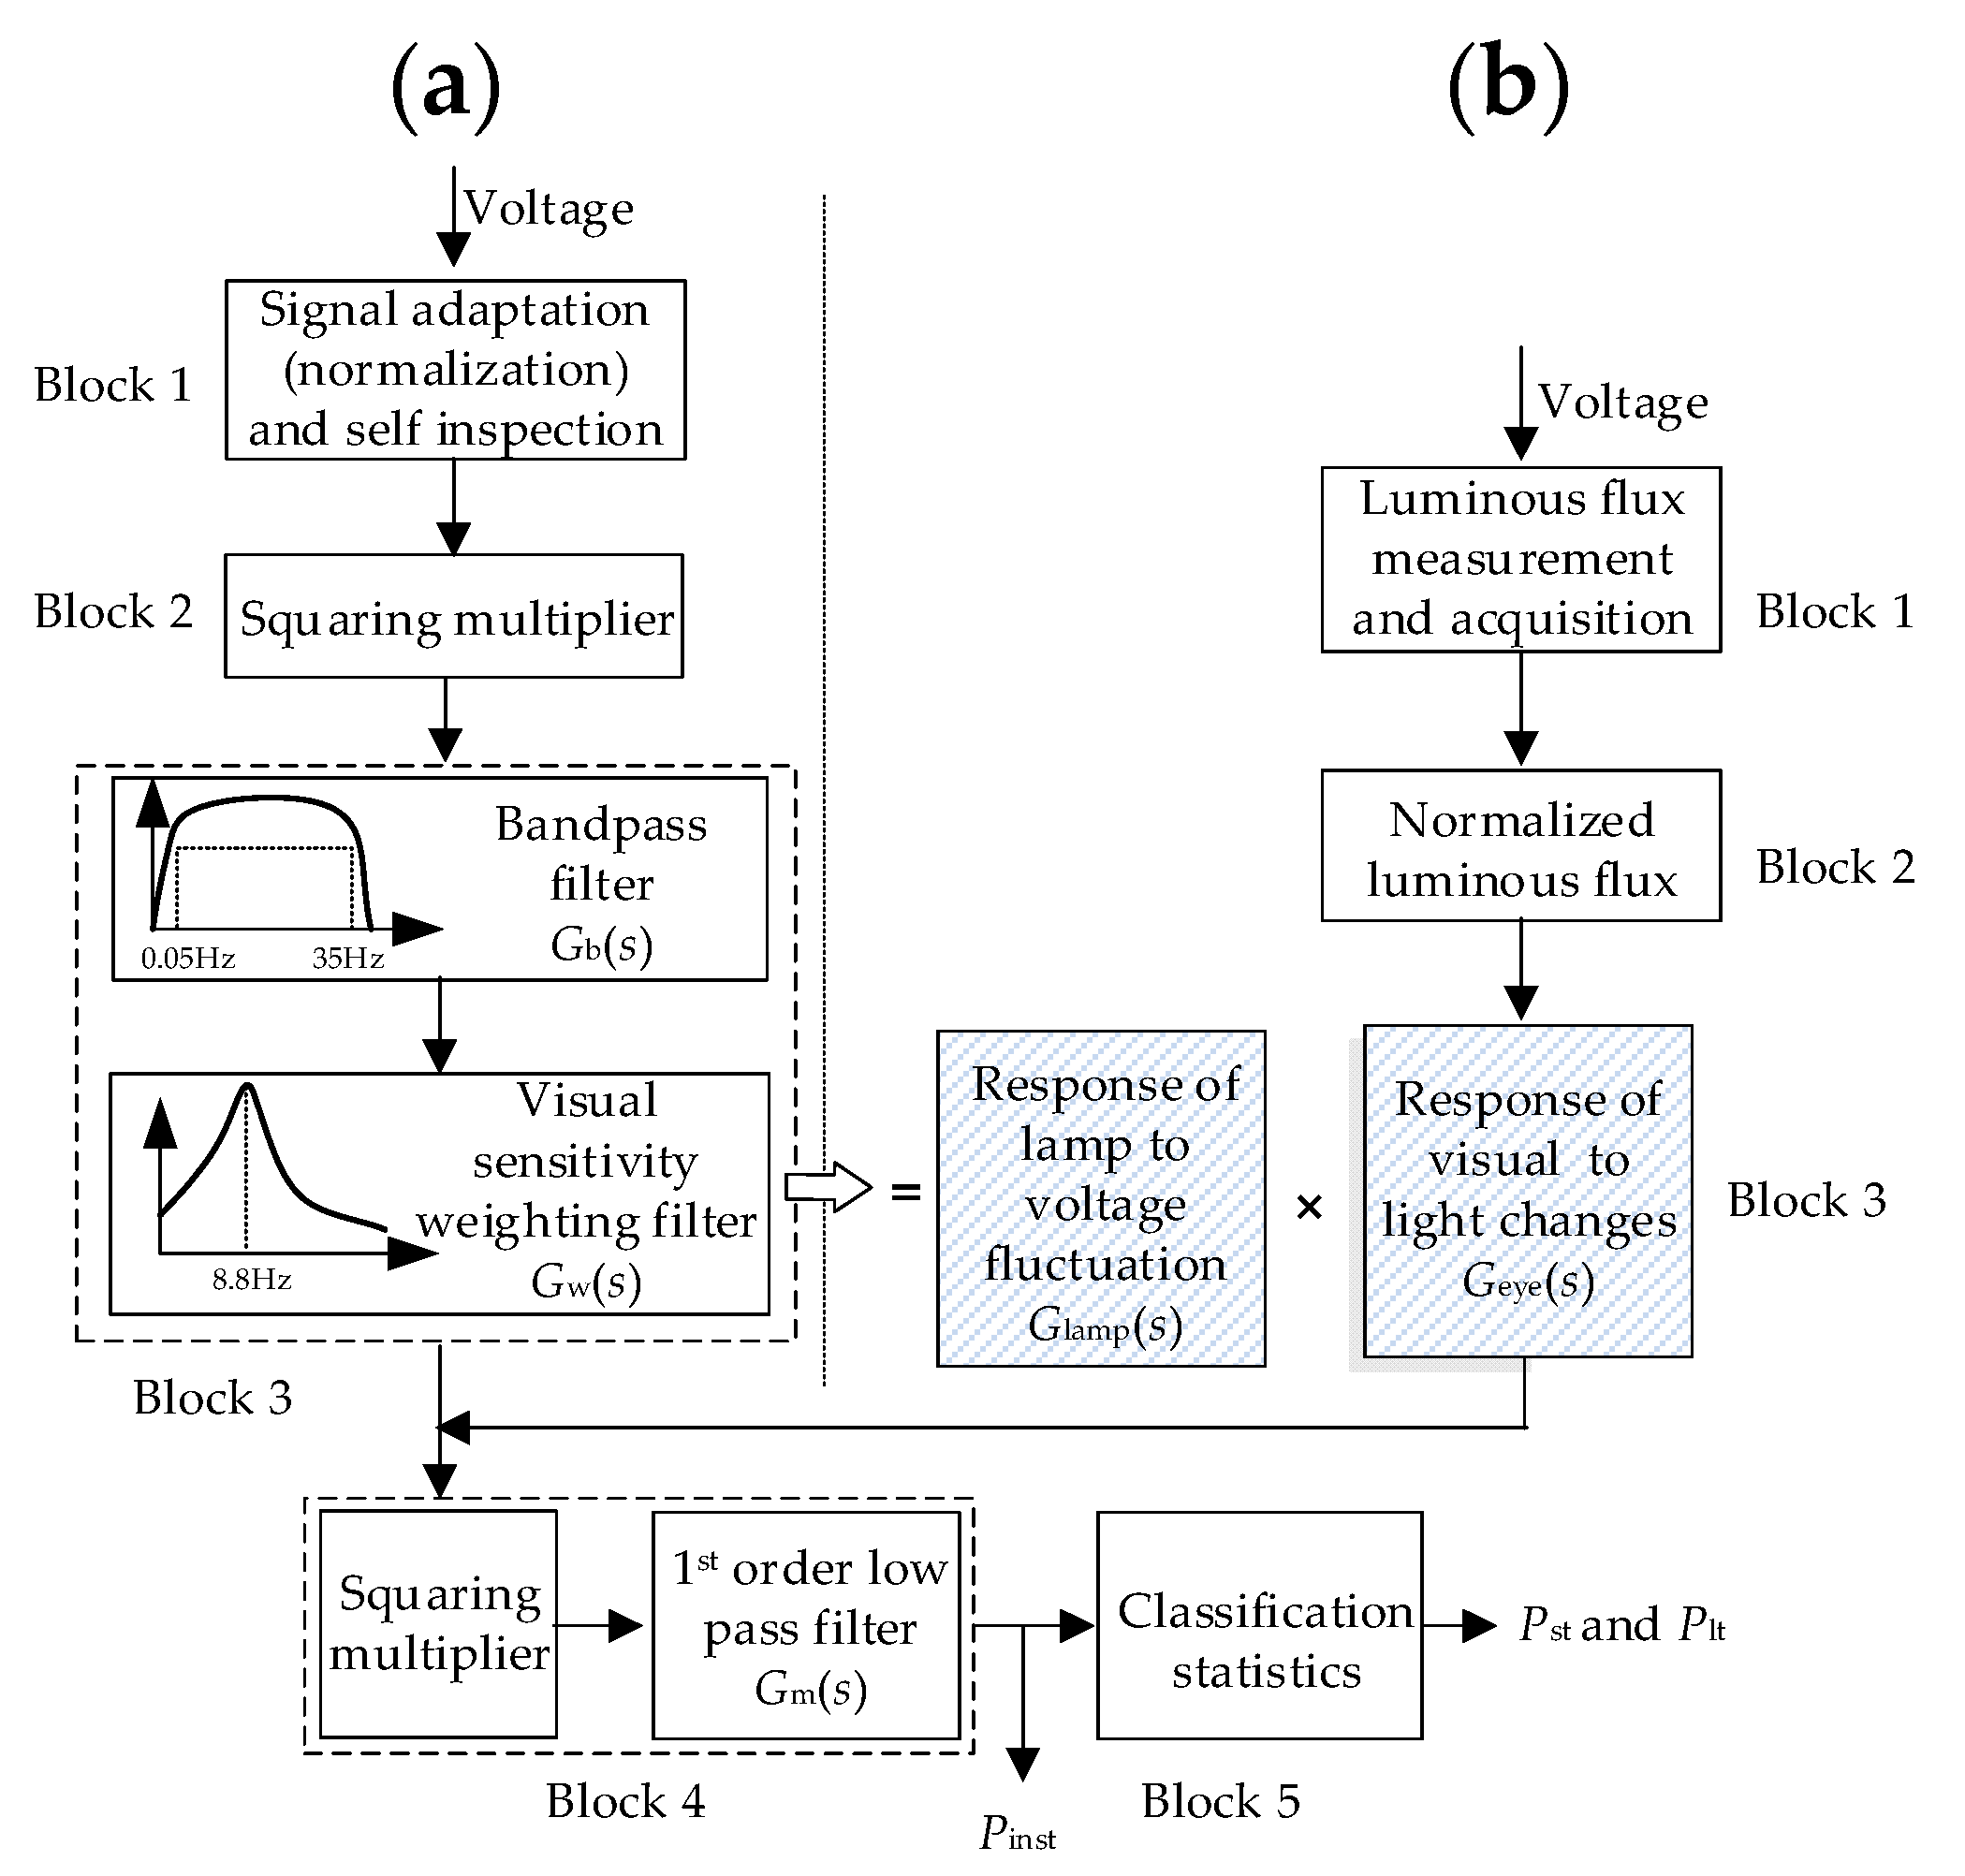
Flicker is the subjective visual perception of human eyes on the change in light brightness. Considering differences between individuals, to obtain a relatively objective flicker evaluation value, it is necessary to statistically analyze the observation data of human eyes under specific lamp conditions. Presently, the flicker measurement model provided by IEC 61000-4-15 is widely used. It is based on the test results of 60 W incandescent lamps at 120 V/60 Hz and 230 V/50 Hz. It is mainly composed of two parts: simulating the response of lamp-eye-brain to fluctuating voltage and statistical data processing, as shown in Figure 1a [23].
Block 1 adapts (normalizes) the input voltage based on the half-wave RMS value. Blocks 2, 3, and 4 form the analogue part of the lamp-eye-brain link. Block 2 adopts the square detection method to measure the voltage fluctuation of the modulated power frequency and simulate the behavior of incandescent lamps. Block 3 consists of a 0.05–35 Hz bandpass filter Gb(s) that extracts the frequency components that cause flicker, and a visual sensitivity weighting filter Gw(s) that simulates the response of the human eye to light changes. Block 4 simulates the reflection and memory effects of the optic nerve in the human brain on the eyes. The squaring multiplier simulates the nonlinear reflection process of the human brain, and the first order low-pass filter Gm(s) simulates the human brain’s visual perception and memory effect and outputs the instantaneous flicker value Pinst. Finally, Block 5 obtains the short-term flicker value Pst (10 min) and the long-term flicker value Plt (2 h) through the classification statistics of the evaluation indicators [6].
The visual sensitivity weighting filter is the core of the IEC flicker model. The transfer function is shown in (1), which is expressed with parameters k, λ, ω1, ω2, ω3, and ω4, and is closely related to the specific parameters of incandescent lamps, and the details are shown in Table 1 [6], which in turn makes it impossible for other types of light sources to use this model for correct flicker measurement.
The transfer function of the visual sensitivity weighting filter can be disassembled into two parts: the lamp response to voltage fluctuation Glamp(s) and the visual response to light change Geye(s) [8,24,25], as shown in Figure 1b. Glamp(s) completely depends on the light source parameters. When the transfer function of the response of the incandescent lamp to voltage fluctuation is obtained in an effective way, the visual response part, independent of the light source, can be separated according to (2). Through light change measurements, the corresponding flicker level can be obtained, making it possible to test the flicker effect of other light sources.
The flicker model oriented to light change consists of two parts: the light parameters inputted by the model and the processing of light change signals. Luminous flux is a parameter describing the ability of light source radiation to generate a visual response in unit time, and it is the best choice for model input. In addition, to reduce the differential impact of different spectral luminous efficiencies and the complexity of the human eye perception system [7], the relative change in the luminous flux obtained by processing is the key to the model. Therefore, referring to Figure 1a, the luminous flux flicker model can be divided into five parts, as shown in Figure 1b: Block 1 tests the changes of voltage and luminous flux through an appropriate system; Block 2 normalizes the signal to obtain the relative change of luminous flux and tests the behavior of the lamp, which is only related to the light source parameters; Block 3 strips the visual response of the light source to light changes to simulate the behavior of the human eye; and Blocks 4 and 5 function in the same way as the IEC standard flicker model.
The luminous flux flicker model is suitable for measuring the flicker effect of light sources with different luminous principles, which solves the light source limitation of the IEC flicker model. In addition, because the band-pass filter is removed from the model, it is possible to test the flicker effect of interharmonics on different light sources.
3. Construction and Verification of the Test System
3.1. Interharmonics-Luminous Flux Test System
To realize the luminous flux flicker model, the key is to obtain an accurate visual response Geye(s) to light changes. An interharmonic luminous flux test system based on the frequency sweep principle could be constructed to realize Block 1 of the luminous flux flicker model, obtain the Glamp(s) of the incandescent lamp in the IEC flicker model, and calculate Geye(s) according to (2).
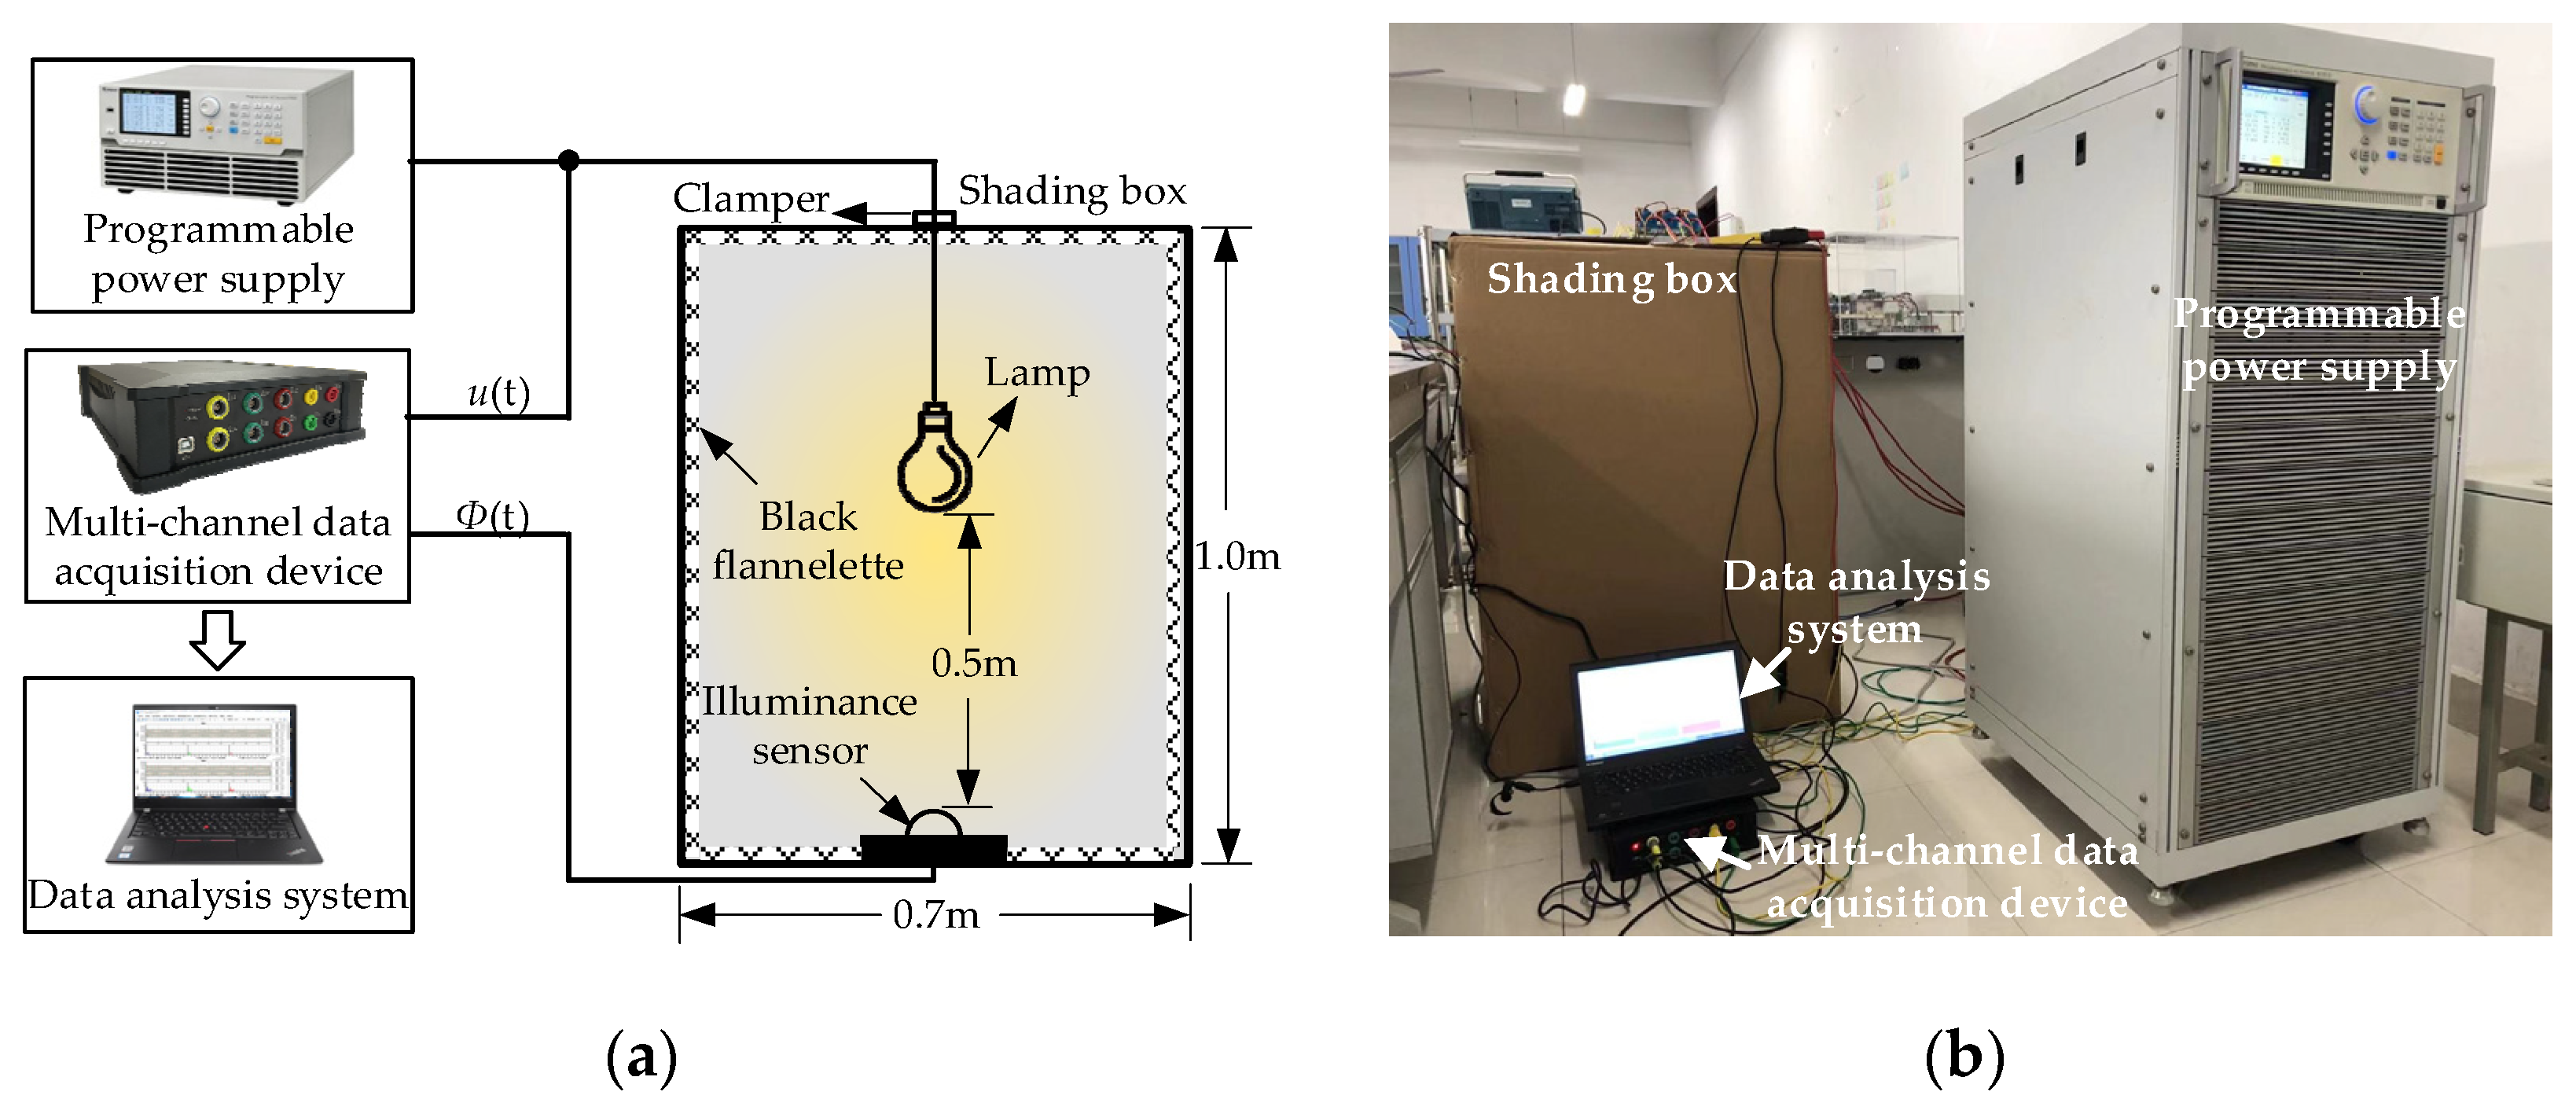
As the model measures flicker using the relative change of luminous flux, the linear relationship between illuminance and luminous flux makes the test system use illuminance instead of luminous flux. As shown in Figure 2, the interharmonic-luminous flux test system could be divided into five main parts:
- Programmable power supply: Used to output “fundamental + interharmonic set frequency” voltage, which could be realized via Chroma 61860. At the same time, considering factors such as data processing volume and observation error, the minimum interharmonic frequency interval was set to not exceed 1 Hz (1 Hz is recommended).
- Illuminance sensor: Used to test the lamp light brightness change caused by interharmonic voltage and simulate the response to light changes as seen by human eyes. Konica Minolta T-10A with an analogue output function (0–3 V) was selected because its measurement accuracy and reliability meet DIN 5032 Class B requirements and its spectral luminous efficiency deviation does not exceed 6%.
- Shading box: Used as the confined space where the lamp was tested and the illuminance sensor was placed. It has the ability to isolate external light changes and eliminate internal irregular reflection interference. In this study, the shading box was a 0.7 × 0.7 × 1.0 m (L× W × H) box the inner wall of which was evenly covered with black flannelette.
- Multi-channel data acquisition device: Used for multi-channel data synchronous acquisition and recording, it recorded the illuminance data of the programmable power supply output interharmonic voltage and illuminance sensor test. The device sampling frequency was not lower than 12.8 kHz.
- Data analysis system: Based on MATLAB coding, it could realize DFT data analysis in different time windows.
During the test, a clamp was used to fix the lamp to be tested in the middle of the shading box and the illuminance sensor was placed horizontally directly below the lamp, with the distance between them maintained at 0.5 m, and we then set the illuminance sensor to be in the appropriate range. Then, the shading box was closed. Finally, the programmable power supply connected to the voltage test line was started and controlled to generate a 230 V/50 Hz fundamental wave voltage. A frequency sweep interval of 1 Hz was used, the interharmonics with a duration of no less than 1 s and a constant ratio (5% is recommended) were stacked, and a multi-channel data acquisition device was used to synchronously measure the test voltage and the corresponding luminous flux fluctuation data.
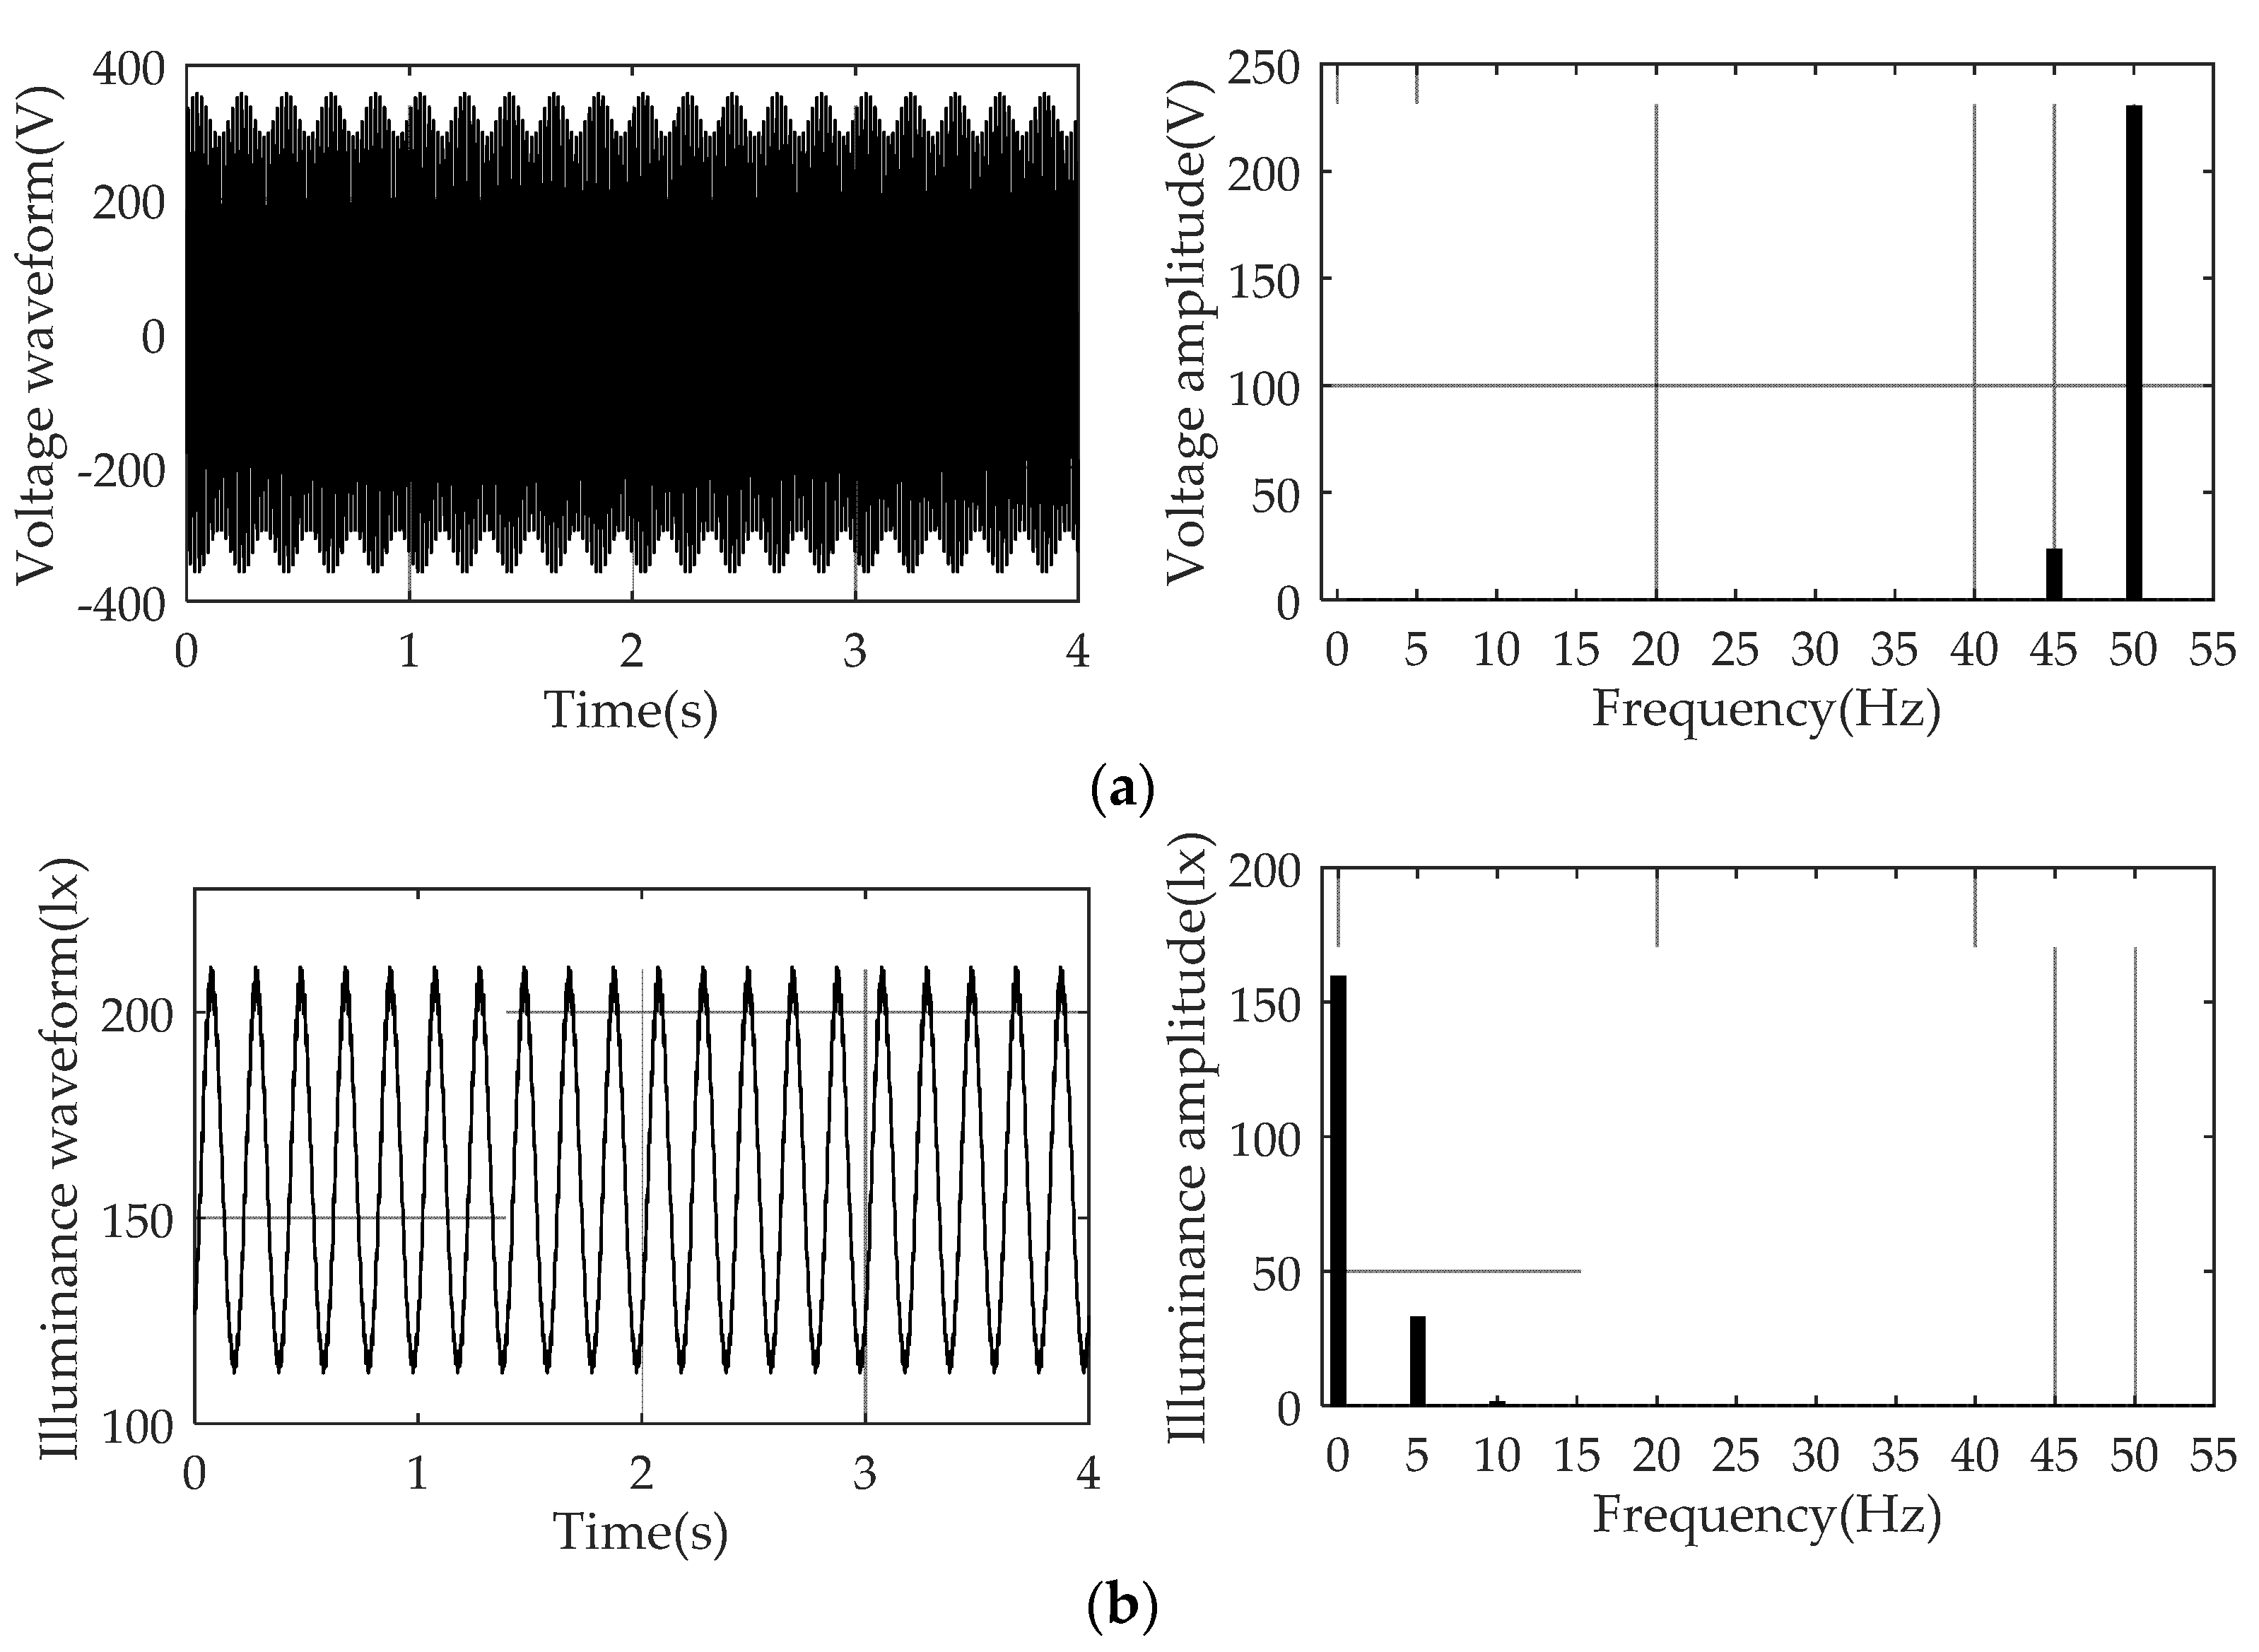
The measured data were analyzed by fast Fourier transform (FFT) at a time interval of 50 cycles to obtain the corresponding luminous flux fluctuation component of the lamp to be tested under different interharmonic frequencies. The interharmonic voltage and luminous flux fluctuation transfer coefficient of the lamp were calculated using (3).
where U1 is the fundamental wave amplitude, U(fIH) is the interharmonic wave amplitude with a frequency of fIH, ΦDC is the DC component of the luminous flux, and Φ(fM) is the luminous flux amplitude with a fluctuation frequency of fM. The relationship between this frequency and the interharmonic frequency is shown in (4).
where f1 is the fundamental voltage frequency, h is the odd harmonic number closest to fIH, h = 1, 3, 5, ..., and fIH ≠ h × f1; thus, fM < 50 Hz.
Taking a 60 W incandescent lamp of 230 V/50 Hz as an example, the programmable power output was superposed with a 45 Hz interharmonic voltage and the analysis results of the measured data in the time and frequency domains are shown in Figure 3. At this time, the illuminance fluctuation frequency (i.e., light flux) was 5 Hz, which corresponds to the relationship expressed in (4).
3.2. Verification of the Test System Based on an Incandescent Lamp
An incandescent lamp is a typical thermal radiation light source. The relationship between voltage and filament temperature can be deduced by using the heat balance equation as follows:
where T(t) is the temperature of the filament of the incandescent lamp that changes with time t, Cθ is the heat capacity of the filament, Rθ is the thermal resistance of the filament, u(t) is the voltage across the incandescent lamp that changes with time t, and R is the filament resistance.
Using (5), the filament temperature T(t) can be expressed as (6), where Tc is room temperature.
In [7], it was pointed out that the luminous flux produced by incandescent lamps is a nonlinear function determined by the temperature of the filament. The physical properties of the material and the geometric shape, with a small temperature variation range, can be approximately described as an exponential function:
In (7), α and β were constants related to the temperature of the filament (usually α = 1.7).
By substituting (6) into (7), the quantitative relationship between voltage and luminous flux under incandescent lamp conditions could be determined, and the simulation model could be established in MATLAB/Simulink. For the 230 V/50 Hz 60 W incandescent lamp in the IEC flicker model, under an average operating temperature of 2700 K, its thermal time constant was RθCθ = 19 ms and the filament resistance was R = 883 Ω. These parameters were brought into the simulation model, and the relative fluctuation of luminous flux at different frequencies was obtained by changing the input interharmonic voltage frequency of the model. As the IEC flicker model is aimed at voltage modulation, interharmonics could be used for simulation, the frequency relationship meets (4), and the |Glamp| value was calculated with the corresponding frequency according to (3). In addition, the test system in Figure 2 was used to test the 230 V/50 Hz 60 W incandescent lamp, and the results of the two were verified and compared.
The experimental and simulated curves of a 230 V/50 Hz 60 W incandescent lamp were highly coincident, which verified that the constructed interharmonic-luminous flux test system could accurately measure the lamp’s response to voltage fluctuations. Observing the differential relationship between the power supply voltage and luminous flux of the incandescent lamp described by (6) and (7), it was determined that it is equivalent to a first-order system in the frequency domain. Thus, data fitting was performed based on the experimental test analysis results, as shown in Figure 4, and the response transfer function of the test incandescent lamp to voltage fluctuation was obtained as in (8), which is consistent with the results of [8].
The result obtained using (2) was used to calculate the visual response Geye (s) to light changes, as shown in (9).
Here, the relative fluctuation data of luminous flux of any light source under the action of interharmonic voltage could be obtained through the test system, which could be input into the luminous flux flicker model to quantify the flicker level of the light source caused by the luminous flux fluctuation.
4. Interharmonic Sensitivity Evaluation of LED Lamps
Using the luminous flux flicker model, the interharmonic level of different light sources under the flicker limit can be obtained by repeatedly adjusting the amplitude of interharmonics at different frequencies to approach the flicker limit in the interharmonic-luminous flux test system. However, there are significant differences in the flicker effect of different light sources, and the method lacks a reference initial value, which greatly increases the number of test repetitions, the tediousness of operation steps, and the complexity of the data analysis. In addition, the accuracy of the measurement results is also limited by the minimum adjustment step size of the programmable power supply amplitude. Therefore, taking the incandescent lamp as the reference, using the transmission coefficient of interharmonic voltage and luminous flux fluctuation of different light sources, the calculation method of the interharmonic-flicker limit curve was proposed to simplify the test ratio and overcome the programmable power supply limitation simultaneously.
According to the luminous flux flicker model in Figure 1b, the short-term flicker of any light source caused by interharmonics of a certain frequency could be expressed by (10).
The fluctuation of the luminous flux in (10) could be obtained by using the interharmonic-luminous flux testing system. Assuming that there are two lamps, A and B, the difference in the short-term flicker measurement could be expressed by (11).
By substituting (3) into (11), (12) could be obtained.
Based on (12), if the transfer coefficient |Glamp,B| of the interharmonic voltage of lamp B and the luminous flux fluctuation and the ratio of the interharmonic to the fundamental of different frequencies caused by Pst,B = 1 are known, then based on the transfer coefficient |Glamp,A| of the interharmonic voltage of lamp A and the luminous flux fluctuation, the ratio of the interharmonic to the fundamental corresponding to different frequencies of lamp A when Pst,A = 1 could be calculated.
Based on (8), the transfer coefficient |Glamp,ref| of the interharmonic voltage and luminous flux fluctuation of a 230 V/50 Hz 60 W incandescent lamp is given by:
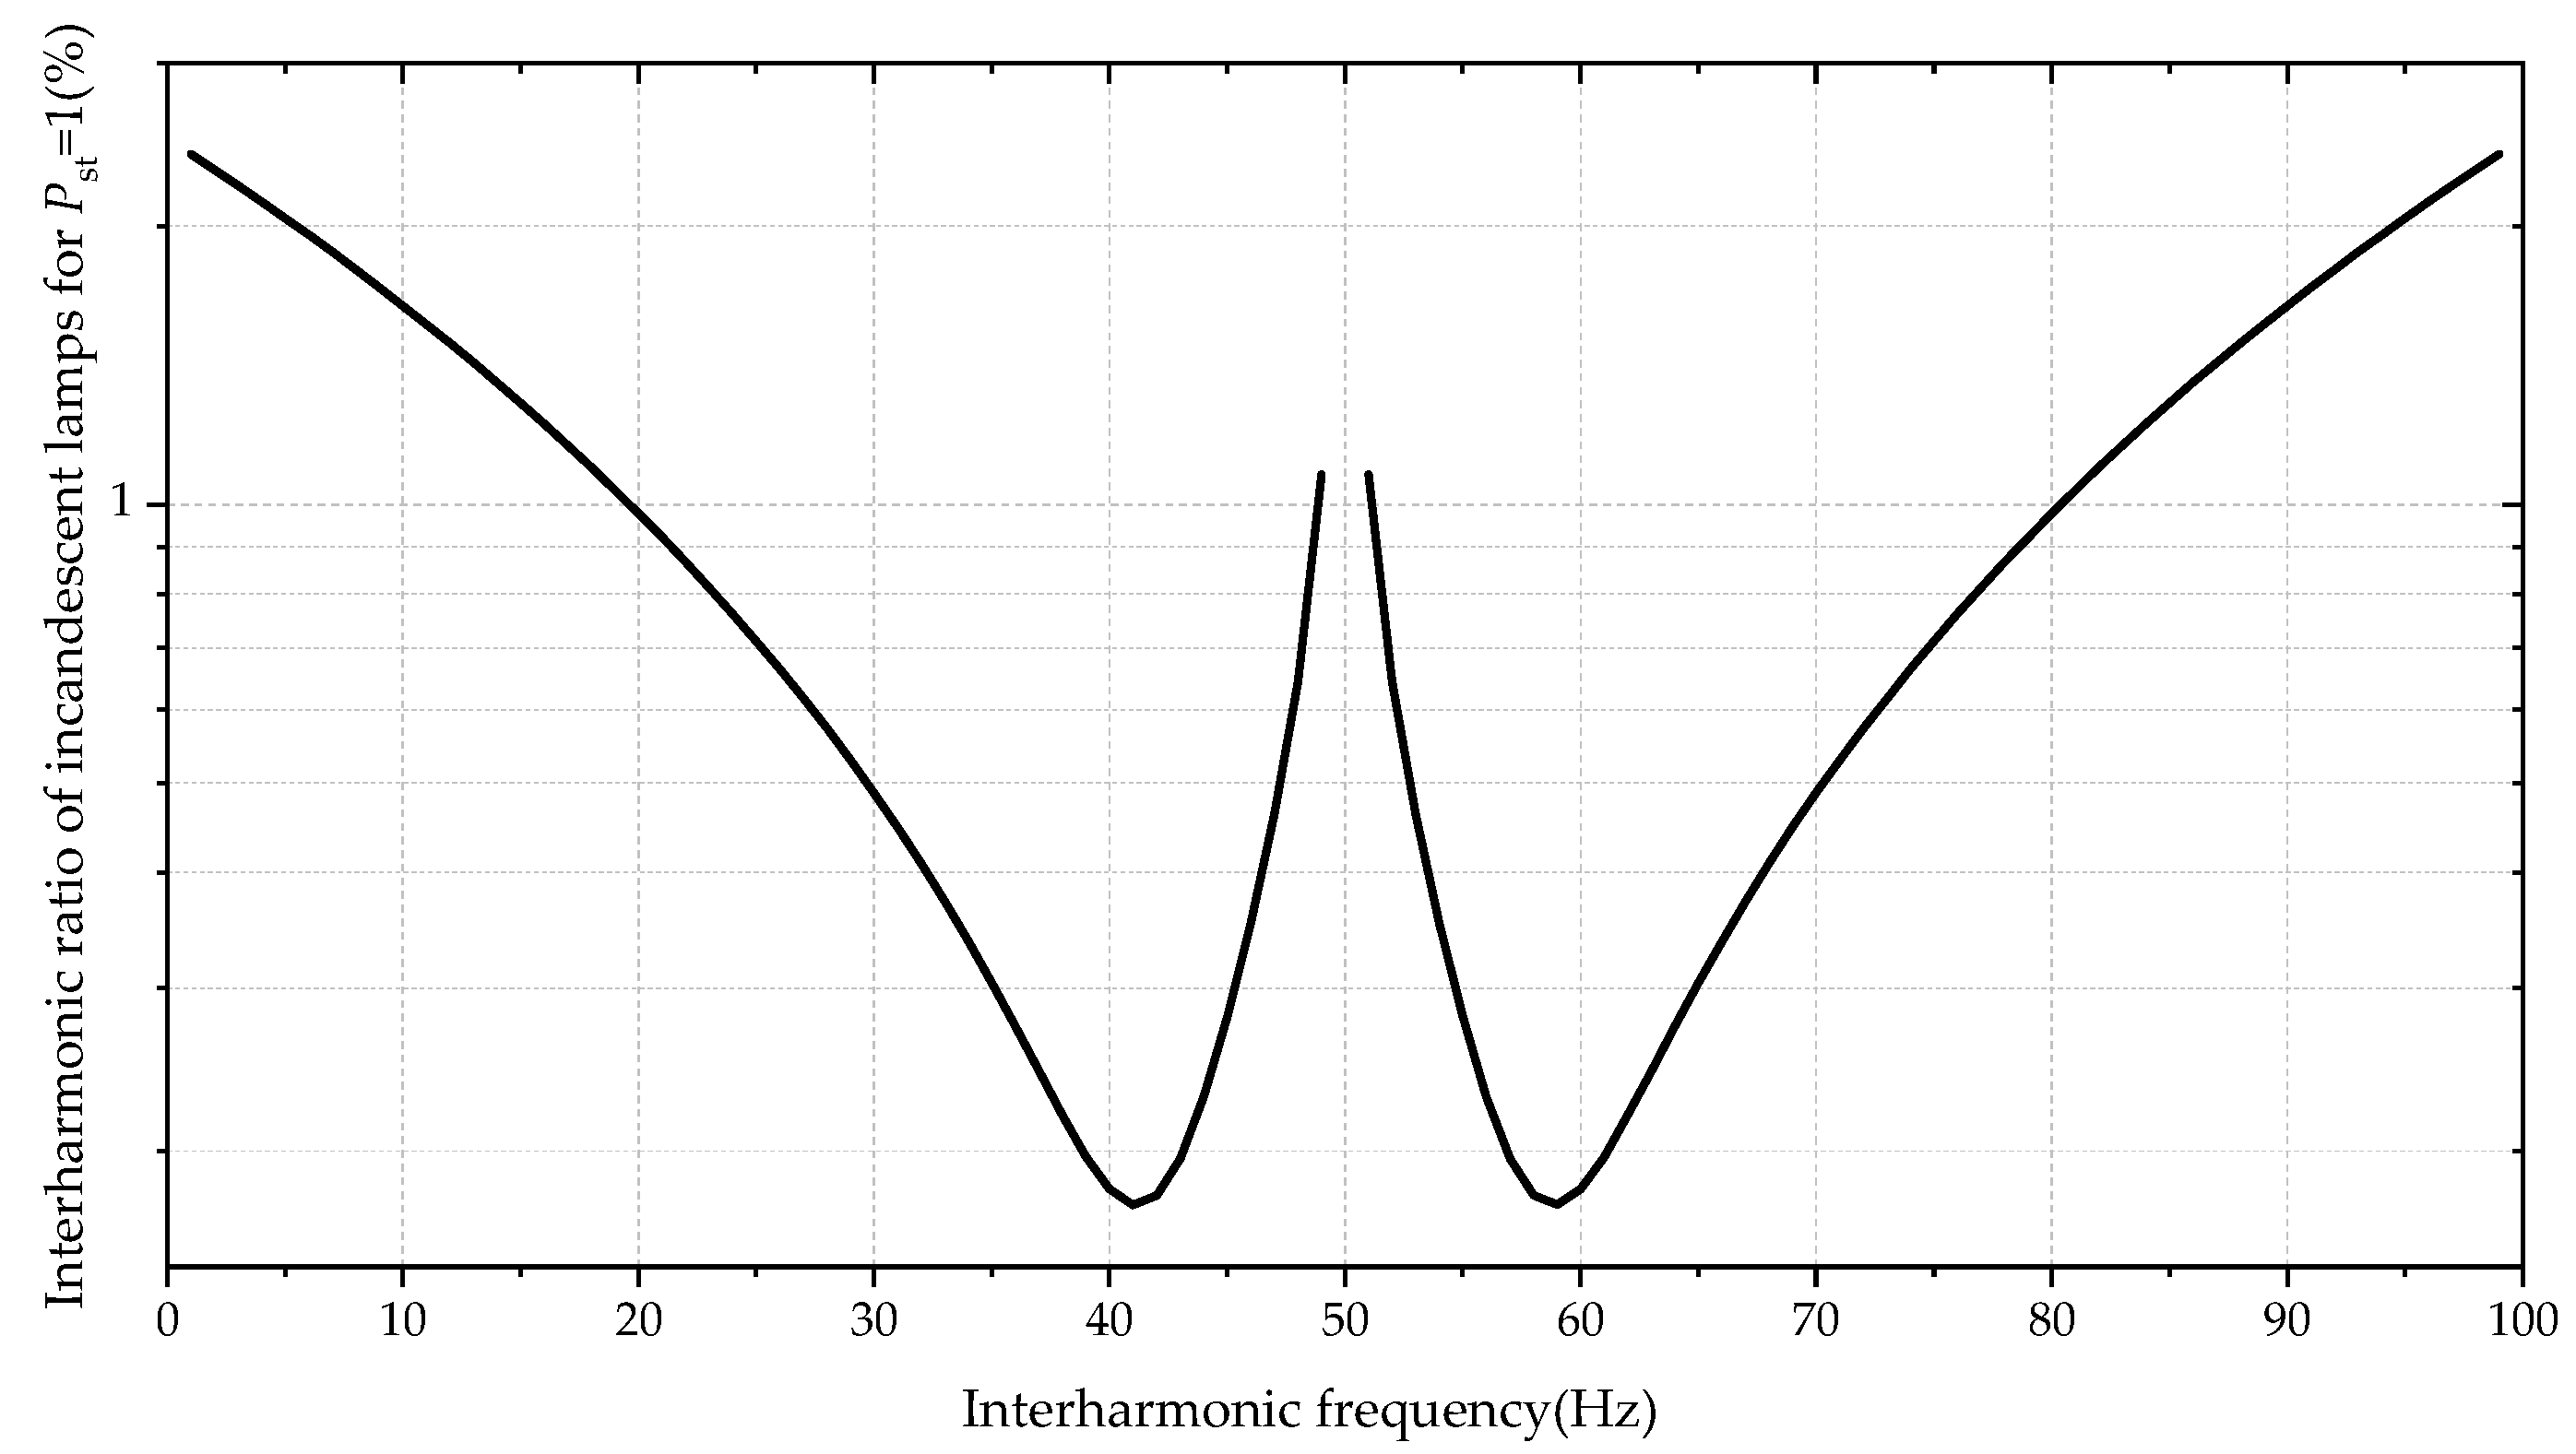
In addition, s = j2π × |fIH – h × f1|, and the transfer function of the visual sensitivity weighting filter of the 230 V/50 Hz 60 W incandescent lamp brought into (1) could calculate the modulus corresponding to the transfer function at different frequencies to obtain the visual sensitivity weighting coefficient |Gw(fIH)|. Then, according to the corresponding relationship between single interharmonic and flicker given in [26], the ratio of the interharmonics to the fundamental (interharmonic ratio, expressed as a percentage) of different frequencies of the incandescent lamp with Pst = 1 was calculated according to (14), as shown in Figure 5.
The interharmonic ratio takes the 230 V/50 Hz 60 W incandescent lamp as the reference standard, uses the interharmonic-luminous flux test system, superimposes the non-specific constant interharmonic amplitude value within the allowable voltage range of the lamp, and sweeps the frequency to obtain the transmission coefficient |Glamp,A| between the interharmonic voltage and luminous flux fluctuation of any light source. Then, according to (15), the interharmonic ratio of different frequencies corresponding to this lamp for Pst = 1 could be calculated, and the interharmonic-flicker limit curve could be drawn.
The interharmonic-flicker limit curve of an LED lamp could be calculated by using the interharmonic-luminous flux test system, taking the incandescent lamp as the benchmark. If the interharmonic ratio of the power supply voltage of the LED lamp is in the area above the curve, the interharmonic ratio causes the flicker value to exceed the limit. This means that the LED lamp with a lower curve level is more sensitive to interharmonics. Therefore, the evaluation of the sensitivity of the LED lamp to interharmonics could be completed by comparing the interharmonic ratio at the same frequency.
5. Results and Discussion
As the light-emitting body of an LED lamp is a semiconductor device, it can work normally only with a DC power supply. Facing the AC low-voltage power grid, it needs a driving device to convert the AC-DC power supply. This is the core component of LED lamps and has the most significant impact on their working performance. Therefore, in the face of a wide variety of LED lamp products, LED lamps are orderly classified according to the type of power drive to compare and study the influence of interharmonics on LED lamps with different driving modes.
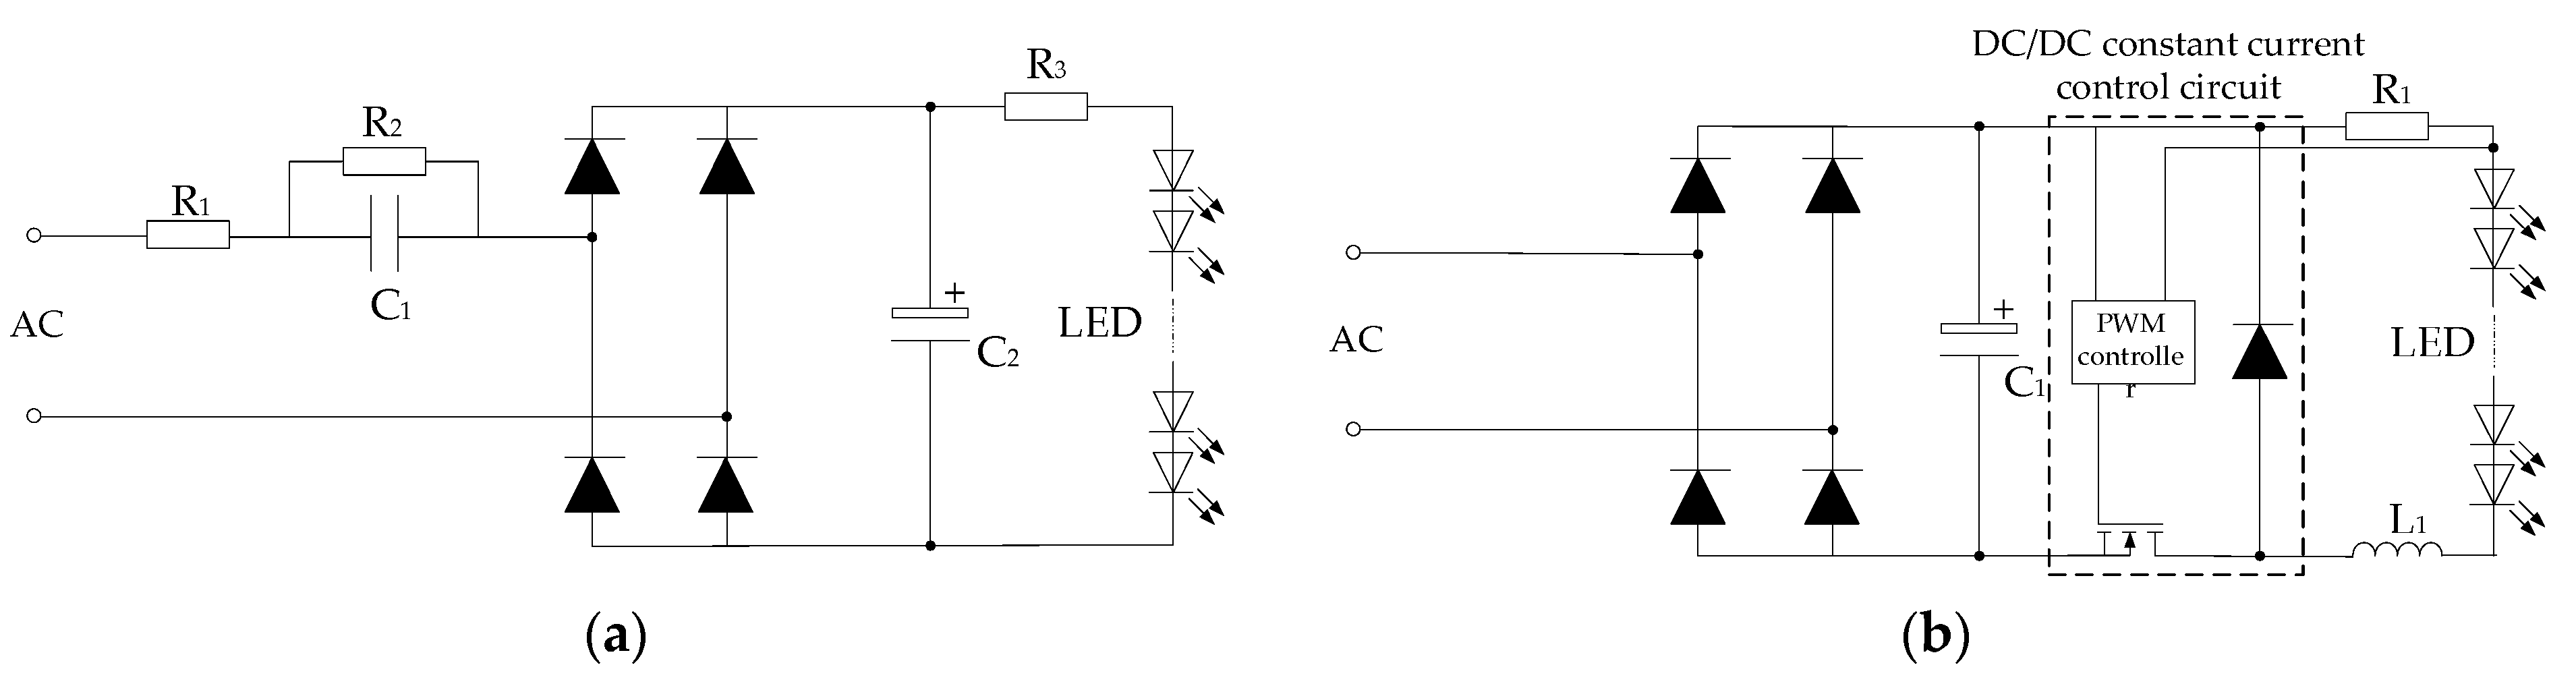
Presently, LED drives are mainly divided into two types: constant voltage and constant current [27,28,29,30,31]. An RC buck drive is a representative constant voltage drive. Its structure is shown in Figure 6a. This circuit forms a voltage-dividing circuit through two capacitors to reduce the power supply voltage amplitude and limits the current flowing through the LED lamp through a resistance. It has low cost, simple circuit structure, and high universality. Therefore, it is widely used in some low-end LED products. To improve energy efficiency, a constant current drive (Figure 6b) is favored in the commercial market. It uses the principle of switching power supply for DC-DC conversion to achieve a stable LED current.
According to the type of driving circuit, LED lamps with representative brands are selected, and the interharmonic sensitivity test evaluation is carried out. The test object information is listed in Table 2.
Each LED lamp in Table 2 was tested in the interharmonic-luminous flux testing system, and the transfer coefficient analysis of interharmonic voltage and luminous flux fluctuation was carried out according to (3). The results are shown in Figure 7.
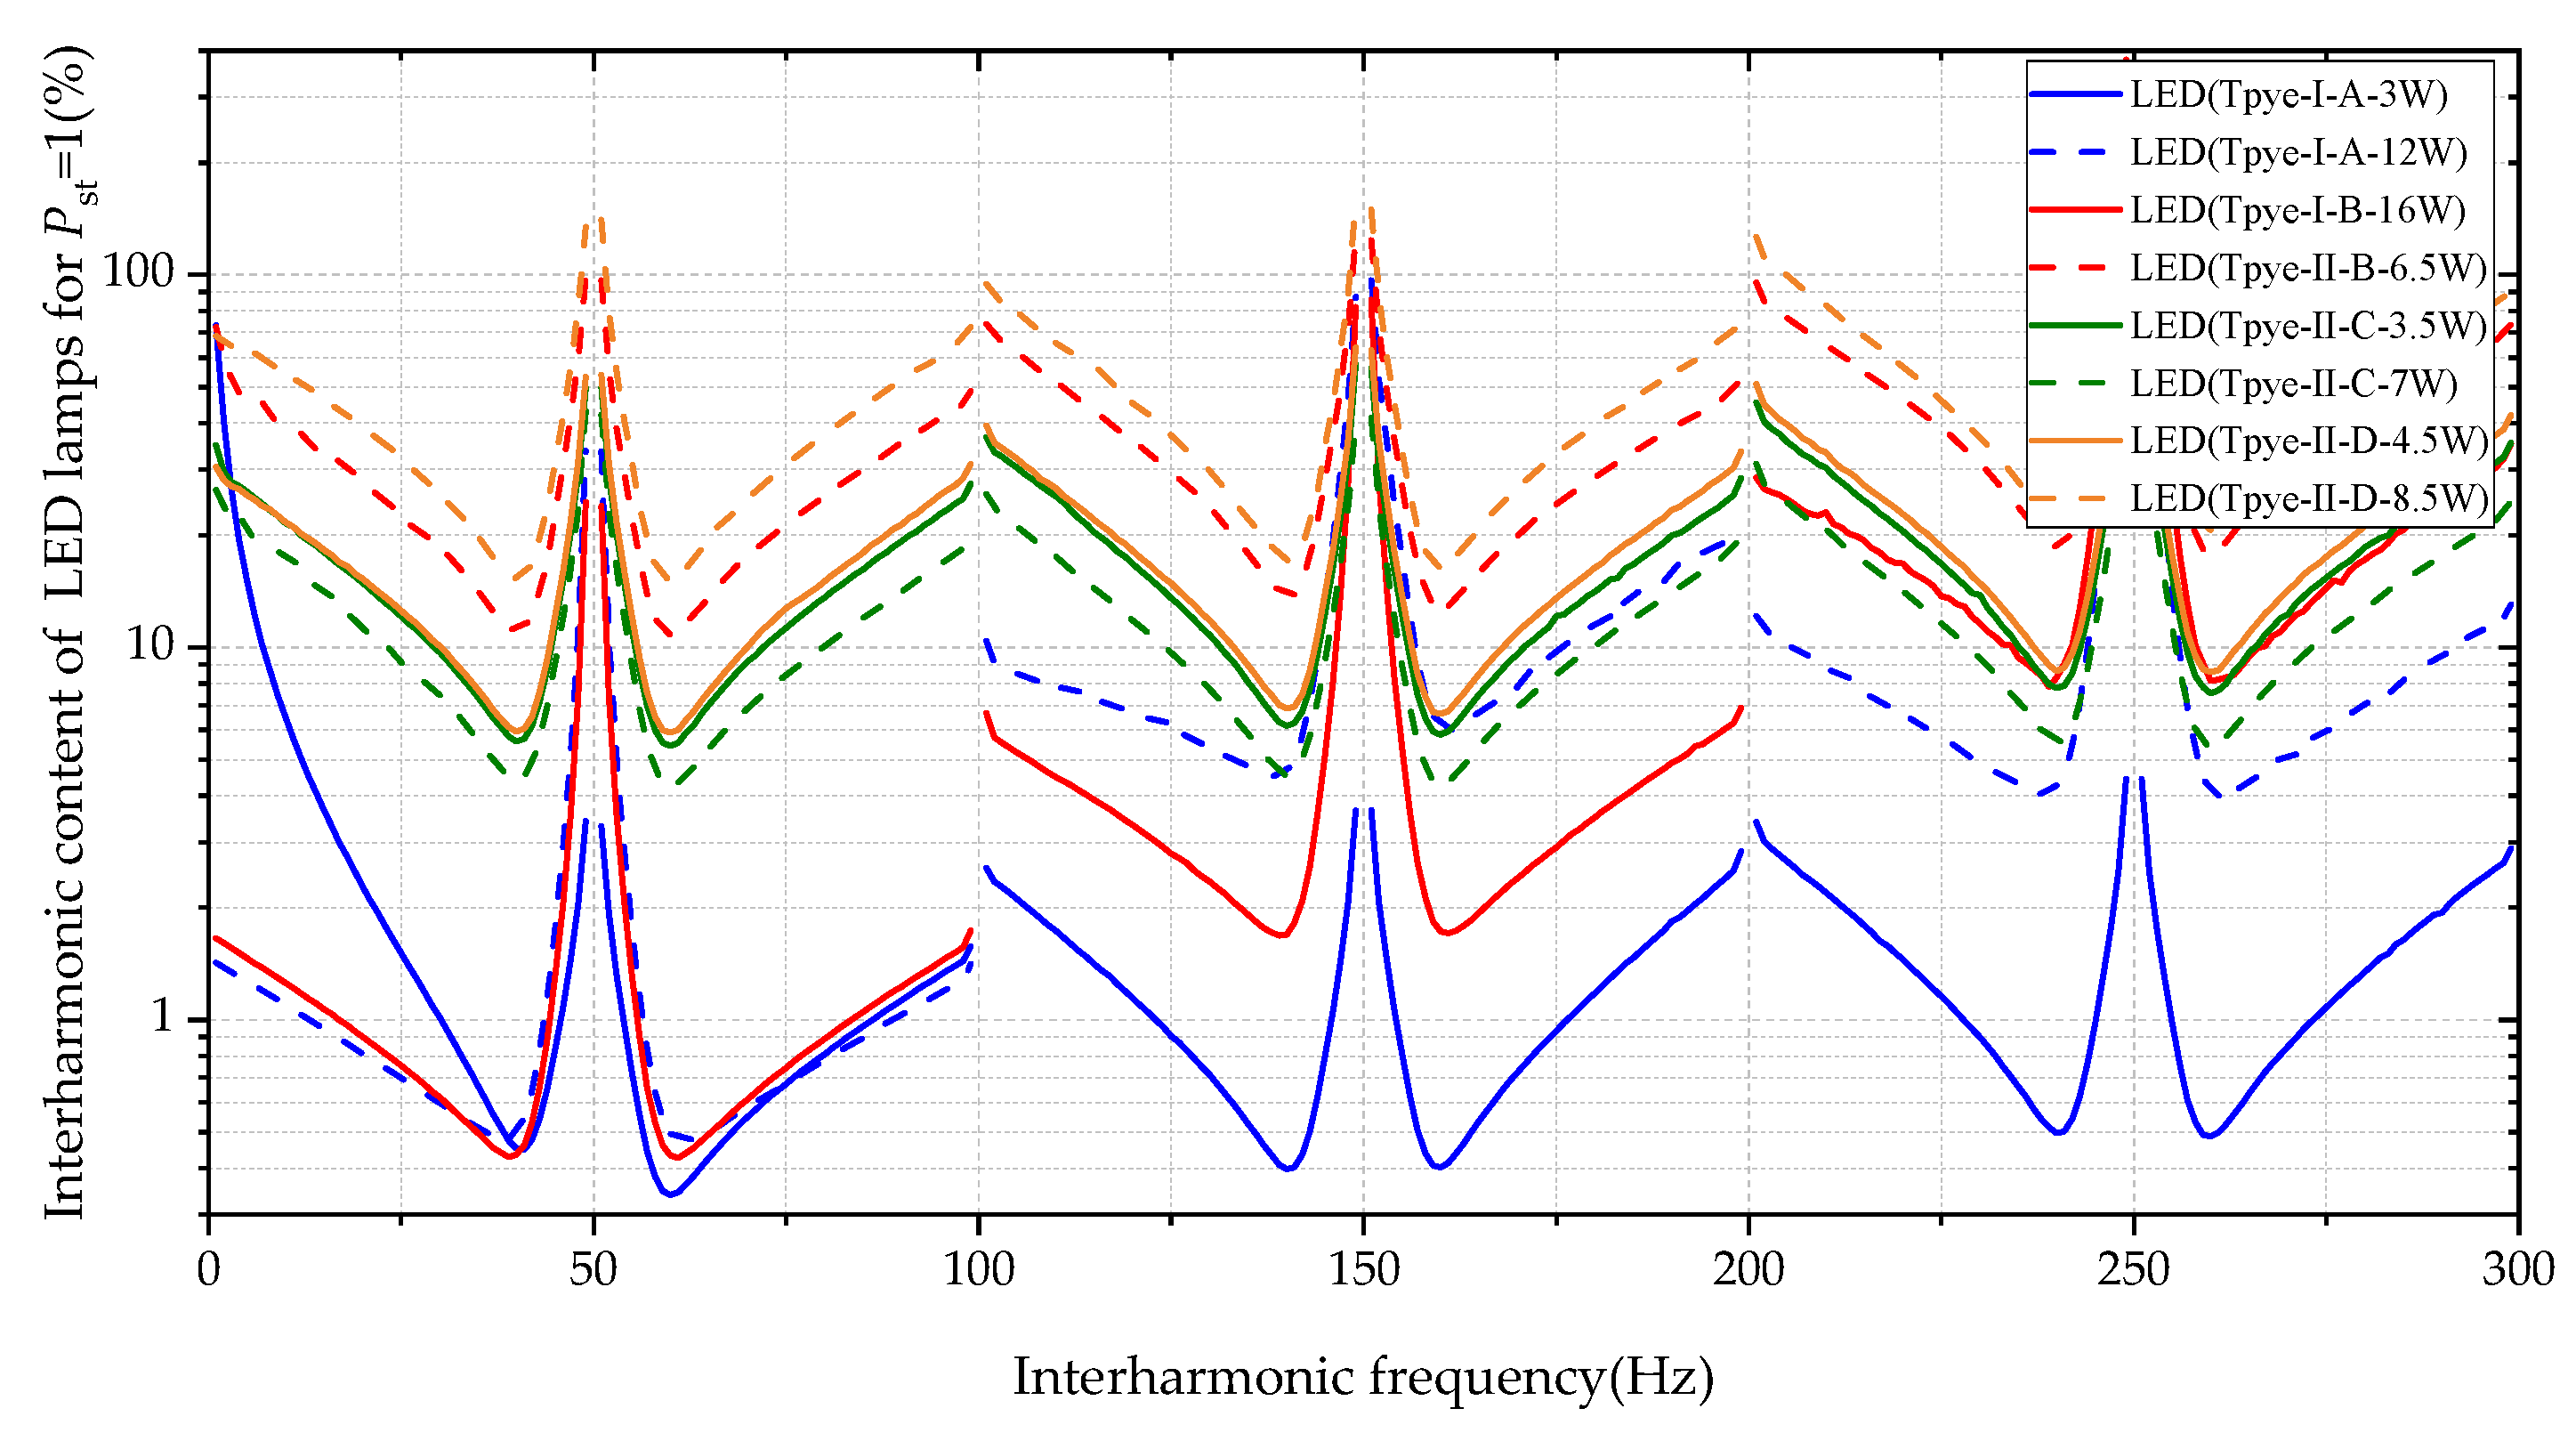
Figure 7 shows that the responses of different LED lamps to the interharmonic voltage are different, especially between LED lamps with different drivers. Combining Figure 5 and Figure 7, when Pst = 1, the interharmonic ratio of eight LED lamps tested at different frequencies could be calculated according to (15), and the interharmonic-flicker limit curve of each LED lamp could be drawn, as shown in Figure 8.
According to the LED lamp test results in Figure 8, the following were inferred:
- In contrast with incandescent lamps, high-frequency interharmonics (more than 100 Hz) can cause flicker of LED lamps. Taking the odd harmonic frequency as the center, it follows that the higher the frequency is, the higher the interharmonic-flicker limit curve is, indicating that the LED is less sensitive to interharmonics with higher frequency.
- The interharmonic-flicker limit curve of the RC-buck-driven LED lamp is significantly lower than that of the constant-current-driven LED lamp, which shows that the former lacks a control circuit and is more vulnerable to external voltage fluctuation; thus, the RC-buck-driven LED lamp is more sensitive to interharmonics. For LED lamps with different drives, the minimum interharmonic ratio causing flicker out-of-limit is shown in Figure 9. The minimum interharmonic ratio of RC-buck-driven LEDs is below 1%, while the minimum interharmonic ratio of constant-current-driven LEDs is more than 4%, and can even reach approximately 15%. In the current power grid environment, constant-current-driven LEDs have low probability of light intensity changes that can be detected by the naked eye. Therefore, in scenes with high lighting quality, it is recommended to use constant-current-driven LED lights.
- The higher the power of LED lamps of the same brand and driving type, the higher the overall level of the interharmonic-flicker limit curve, which indicates that higher-power LEDs are less sensitive to interharmonics.
6. Conclusions
The influence of interharmonics on the lighting quality of LED lamps widely used in the market cannot be ignored. The “weakness” of LED lamps in interharmonics can be quantified in terms of flicker. Through the deconstruction of the IEC flicker model, this paper proposed a luminous flux flicker model that is free from the constraints of specific light sources. In the interharmonic luminous flux test system in the model, the calculation method of the LED interharmonic-flicker limit curve based on incandescent lamps was deduced, and the experimental evaluation of LED interharmonic sensitivity was completed. Based on the results, the following conclusions were drawn:
- The interharmonic luminous flux test system composed of a programmable power supply, shading box, illuminance sensor, data acquisition device, and data analysis system could accurately eliminate the part that depends on incandescent lamp parameters in the visual sensitivity weighting filter of the IEC flicker model and realize a luminous flux flicker model suitable for any light source.
- Taking a 230 V/50 Hz 60 W incandescent lamp as the reference, using the interharmonic-luminous flux test system, superimposing the non-specific constant interharmonic amplitude, and sweeping the frequency to obtain the transfer coefficient of the interharmonic voltage and luminous flux fluctuation of any light source, the interharmonic-flicker limit curves could be quickly drawn, improving the efficiency of existing methods and eliminating the limitations of programmable power hardware.
- The interharmonic-flicker limit curve could describe the interharmonic sensitivity of LED lamps. The lower the curve level, the more sensitive the LED lamps were to interharmonics, and vice versa.
- The test results showed that the driving power supply is an important factor affecting the sensitivity of interharmonics. The RC-buck-driven LED lamp was more sensitive to interharmonics than the constant-current-driven LED lamp. In a scene with high lighting quality, the constant-current-driven LED lamp is recommended. In addition, high-frequency interharmonics (more than 100 Hz) also caused flicker of LED lamps. The higher the frequency centered on odd harmonics, the lower the interharmonic sensitivity, while the higher the power, the lower the interharmonic sensitivity of LED lamps.
Owing to the relatively small number of brands and types of LED lamps tested in this study and the focus on the influence of driving types on interharmonic sensitivity, the evaluation results are not widely representative. In future work, it is necessary to apply the luminous flux flicker model to various other tests. Further interharmonic sensitivity evaluations for LED lamps can be performed to investigate aspects such as illuminance, appearance, light irradiation angle, and dimming. This should provide a test basis for determining the electromagnetic compatibility limits and aid the iterative improvement of LED lamp product technology.
Author Contributions
Conceptualization, H.L. and M.Z.; methodology, H.L., Y.S., M.Z., and Y.J.; validation, Y.S., M.Z., and Y.J.; investigation, H.L., Y.S., M.Z., and Y.J.; writing—original draft preparation, Y.S. and Y.J.; writing—review and editing, H.L., Y.S., M.Z., and Y.J.; project administration, H.L. and M.Z. All authors have read and agreed to the published version of the manuscript.
Funding
This research was funded by the Science and Technology Project Foundation of State Grid Beijing Electric Power Company, grant number 52022320006D.
Institutional Review Board Statement
Not applicable.
Informed Consent Statement
Not applicable.
Data Availability Statement
The data presented in the study are available in the article.
Conflicts of Interest
The authors declare no conflict of interest.
References
- Kar, A. New Generation Illumination Engineering-An Overview of Recent Trends in Science & Technology. In Proceedings of the 2014 First International Conference on Automation, Control, Energy and Systems (ACES), Adisaptagram, India, 1–2 February 2014; pp. 1–6. [Google Scholar]
- Lokesh, J.; Kini, S.G.; Mahesha, M.G.; Padmasali, A.N. A study on the performance characteristics of light emitting diodes from reliability prospective. In Proceedings of the 2021 IEEE 2nd International Conference on Smart Technologies for Power, Energy and Control (STPEC), Bilaspur, India, 19–22 December 2021; pp. 1–6. [Google Scholar]
- Tayjasanant, T.; Wang, W.; Li, C.; Xu, W. Interharmonic-flicker curves. IEEE Trans. Power Deliv. 2005, 20, 1017–1024. [Google Scholar] [CrossRef]
- Jing, Y.; Sun, C.; Xu, W. Voltage flicker caused by two interharmonics. In Proceedings of the 2006 Canadian Conference on Electrical and Computer Engineering, Ottawa, ON, Canada, 7–10 May 2006; pp. 239–242. [Google Scholar]
- Yong, J.; Sun, C.X.; Jian-Bo, L.I.; Zhou, H.B.; Chen, L. Light flicker characteristics caused by interharmonics and flicker limit curve. Proc. CSEE 2008, 28, 88–93. [Google Scholar]
- Standard 61000-4-15; Electromagnetic Compatibility (EMC)-Part 4: Testing and Measurement Techniques Section 15: Flicker Meter-Functional and Design Specifications. International Electrotechnical Commission (IEC): Geneva, Switzerland, 2010.
- Peretto, L.; Emanuel, A.E. A theoretical study of the incandescent filament lamp performance under voltage flicker. IEEE Trans. Power Deliv. 1997, 12, 279–288. [Google Scholar] [CrossRef]
- Cho, S.H.; Jung, J.A.; Jang, G.; Kwon, S.H.; Kang, M.H. Experimental verification of 220V incandescent lamp characteristics for the IEC flickermeter. In Proceedings of the 2008 13th International Conference on Harmonics & Quality of Power, Wollongong, NSW, Australia, 28 September–1 October 2008; pp. 1–4. [Google Scholar]
- Hooshyar, A.; El-Saadany, E.F. Development of a flickermeter to measure non-incandescent lamps flicker. IEEE Trans. Power Deliv. 2013, 28, 2103–2115. [Google Scholar] [CrossRef]
- Gallo, D.; Landi, C.; Langella, R.; Testa, A. IEC flickermeter response to interharmonic pollution. In Proceedings of the 2004 11th International Conference on Harmonics and Quality of Power, Lake Placid, NY, USA, 12–15 September 2004; pp. 489–494. [Google Scholar]
- Jiao, P.; Ma, C. Study on IEC flickermeter applicability based on flux parameters. Power Syst. Prot. Control. 2015, 43, 85–90. [Google Scholar]
- Hui, S.Y.; Qin, Y.X. A General photo-electro-thermal theory for light emitting diode (LED) systems. IEEE Trans. Power Electron. 2009, 24, 1967–1976. [Google Scholar] [CrossRef]
- Lin, Y.; Yang, Y.; Lan, C. Formulation of flicker curve for inter-harmonic of fluorescent lamps. Northeast. Electr. Power Technol. 2021, 42, 56–59. [Google Scholar]
- Chen, S.; Heah, M.Y.; Then, A.B.; Foo, M.K. Automatic evaluation of flickering sensitivity of fluorescent lamps caused by interharmonic voltages. In Proceedings of the 2008 13th International Conference on Harmonics & Quality of Power, Wollongong, NSW, Australia, 28 September–1 October 2008; pp. 1–6. [Google Scholar]
- Drapela, J.; Langella, R.; Testa, A.; Grappe, J.E. A real life light flicker case-study with LED lamps. In Proceedings of the 2018 18th International Conference on Harmonics and Quality of Power, Ljubljana, Slovenia, 13–16 May 2018; pp. 1–6. [Google Scholar]
- Chmielowiec, K. Flicker effect of different types of light sources. In Proceedings of the 2011 11th International Conference on Electrical Power Quality and Utilisation, Lisbon, Portugal, 17–19 October 2011; pp. 1–6. [Google Scholar]
- Kumar, K.J.; Sudhir Kumar, R. Voltage flicker from warm and cool white LED bulbs. In Proceedings of the 2020 IEEE PES Innovative Smart Grid Technologies Europe (ISGT-Europe), The Hague, The Netherlands, 26–28 October 2020; pp. 934–938. [Google Scholar]
- Petrinska, I.; Ivanov, D. Estimation of flicker of contemporary LED lamps and luminaires. In Proceedings of the 2019 11th Electrical Engineering Faculty Conference (BulEF), Varna, Bulgaria, 11–14 September 2019; pp. 1–4. [Google Scholar]
- Lehman, B.; Wilkins, A.; Berman, S.; Poplawski, M.; Miller, N.J. Proposing measures of flicker in the low frequencies for lighting applications. In Proceedings of the 2011 IEEE Energy Conversion Congress and Exposition, Phoenix, AZ, USA, 17–22 September 2011; pp. 2865–2872. [Google Scholar]
- Chaki, R.; Anand, V.; Ghosh, S.; Ghosh, M. A Comparative Analysis of Flicker Index and Modulation Depth on Few Existing Dimmable LED Drivers. In Proceedings of the 2018 2nd International Conference on Power, Energy and Environment: Towards Smart Technology (ICEPE), Shillong, India, 1–2 June 2018; pp. 1–5. [Google Scholar]
- In, C.; Kim, J.; Oh, Y.; Cho, K. Flicker Characteristics of a Multi-Channel Current-Controlled PWM Dimming Method of LED Lightings. In Proceedings of the 2019 IEEE 60th International Scientific Conference on Power and Electrical Engineering of Riga Technical University (RTUCON), Riga, Latvia, 7–9 October 2019; pp. 1–7. [Google Scholar]
- Drapela, J.; Langella, R.; Slezingr, J.; Testa, A. A tunable flickermeter to account for different lamp technologies. IEEE Trans. Power Deliv. 2016, 32, 872–880. [Google Scholar] [CrossRef]
- Wang, J.; Liu, H. A calculation method for interharmonics-caused flicker and flicker source identification. Autom. Electr. Power Syst. 2011, 35, 57–63, 80. [Google Scholar]
- Cai, R.; Cobben, J.; Myrzik, J.; Blom, J.H.; Kling, W.L. Flicker responses of different lamp types. IET Gener. Transm. Distrib. 2009, 3, 816–824. [Google Scholar] [CrossRef] [Green Version]
- Wang, C.S.; Devaney, M.J.; Yang, S.W. Decomposition of the IEC flickermeter weighting curves [light flicker due to fluctuating current]. In Proceedings of the 21st IEEE Instrumentation and Measurement Technology Conference, Como, Italy, 18–20 May 2004; pp. 1378–1382. [Google Scholar]
- Zeng, Q.; Yang, H.; Wang, Z.; Hongping, L.I. Application of all-phase spectrum method to flicker detection. Proc. CSU-EPSA 2017, 29, 66–71. [Google Scholar]
- Abdalaal, R.M.; Man Ho, C.N. Characterization of commercial LED lamps for power quality studies. IEEE Can. J. Electr. Comput. Eng. 2021, 44, 94–104. [Google Scholar] [CrossRef]
- Padmavathi, P.; Natarajan, S. A survey on efficient converter driver techniques for LED lighting applications. In Proceedings of the 2019 Innovations in Power and Advanced Computing Technologies (i-PACT), Vellore, India, 22–23 March 2019; pp. 1–7. [Google Scholar]
- Gupta, N.; Verma, D. A review and analysis of topologies of light emitting diode (LED) drivers. In Proceedings of the 2021 IEEE 2nd International Conference on Electrical Power and Energy Systems (ICEPES), Bhopal, India, 10–11 December 2021; pp. 1–6. [Google Scholar]
- Luo, Q.; Huang, J.; He, Q.; Ma, K.; Zhou, L. Analysis and design of a single-stage isolated AC–DC LED driver with a voltage doubler rectifier. IEEE Trans. Ind. Electron. 2017, 64, 5807–5817. [Google Scholar] [CrossRef]
- Petrinska, I.; Ivanov, D.; Pavlov, D.; Kassev, K. Photometric flicker of LED luminaires according to driver type. In Proceedings of the 2020 21st International Symposium on Electrical Apparatus & Technologies (SIELA), Bourgas, Bulgaria, 3–6 June 2020; pp. 1–4. [Google Scholar]
Figure 1.
Relationship between IEC and the luminous flux flicker model: (a) IEC and (b) luminous flux flicker meter models.
Figure 1.
Relationship between IEC and the luminous flux flicker model: (a) IEC and (b) luminous flux flicker meter models.

Figure 2.
Interharmonics-luminous flux test system: (a) schematic and (b) actual layout.

Figure 3.
Test results of an incandescent lamp response to 45 Hz interharmonics: (a) voltage and (b) illuminance.
Figure 3.
Test results of an incandescent lamp response to 45 Hz interharmonics: (a) voltage and (b) illuminance.

Figure 4.
Response of the 60 W incandescent lamp at 230 V/50 Hz under different voltage modulation frequencies.
Figure 4.
Response of the 60 W incandescent lamp at 230 V/50 Hz under different voltage modulation frequencies.

Figure 5.
Interharmonic-flicker limit curve of the incandescent lamp.

Figure 6.
Schematic of common LED lamp driving types: (a) type Ⅰ: RC buck drive; (b) type Ⅱ: constant current drive.
Figure 6.
Schematic of common LED lamp driving types: (a) type Ⅰ: RC buck drive; (b) type Ⅱ: constant current drive.

Figure 7.
Interharmonic voltage and luminous flux fluctuation transfer coefficient of test LED lamps.
Figure 7.
Interharmonic voltage and luminous flux fluctuation transfer coefficient of test LED lamps.

Figure 8.
Interharmonic-flicker limit curve of test LED lamps.

Figure 9.
Minimum interharmonic ratio of out-of-limit flicker.


Table 1.
Parameters of the visual sensitivity weighted filter.
| Variable | 60 W Incandescent Lamp (230 V/50 Hz) | 60 W Incandescent Lamp (120 V/60 Hz) |
|---|---|---|
| k | 1.74802 | 1.6357 |
| λ | 2π × 4.05981 | 2π × 4.167375 |
| ω1 | 2π × 9.15494 | 2π × 9.077169 |
| ω2 | 2π × 2.27979 | 2π × 2.939902 |
| ω3 | 2π × 1.22535 | 2π × 1.394468 |
| ω4 | 2π × 21.9 | 2π × 17.31512 |
Table 2.
Performance index parameters of the test LED lamp.
| Drive Type | Brand Code | Power (W) | Luminous Flux (lm) | Color Temperature (K) |
|---|---|---|---|---|
| Type I | A | 3 | 170 | 3000 |
| A | 12 | 1000 | 5000 | |
| B | 16 | 1800 | 6500 | |
| Type II | B | 6.5 | 600 | 6500 |
| C | 3.5 | 249 | 6500 | |
| C | 7 | 550 | 5000 | |
| D | 4.5 | 380 | 6500 | |
| D | 8.5 | 860 | 6500 |
Publisher’s Note: MDPI stays neutral with regard to jurisdictional claims in published maps and institutional affiliations. |
© 2022 by the authors. Licensee MDPI, Basel, Switzerland. This article is an open access article distributed under the terms and conditions of the Creative Commons Attribution (CC BY) license (https://creativecommons.org/licenses/by/4.0/).
Share and Cite
MDPI and ACS Style
Li, H.; Song, Y.; Zhu, M.; Jiao, Y. Experimental Interharmonic Sensitivity Evaluation of LED Lamps Based on the Luminous Flux Flicker Model. Energies 2022, 15, 2990. https://0-doi-org.brum.beds.ac.uk/10.3390/en15092990
AMA Style
Li H, Song Y, Zhu M, Jiao Y. Experimental Interharmonic Sensitivity Evaluation of LED Lamps Based on the Luminous Flux Flicker Model. Energies. 2022; 15(9):2990. https://0-doi-org.brum.beds.ac.uk/10.3390/en15092990
Chicago/Turabian StyleLi, Hongtao, Yifan Song, Mingxing Zhu, and Yadong Jiao. 2022. "Experimental Interharmonic Sensitivity Evaluation of LED Lamps Based on the Luminous Flux Flicker Model" Energies 15, no. 9: 2990. https://0-doi-org.brum.beds.ac.uk/10.3390/en15092990
Note that from the first issue of 2016, this journal uses article numbers instead of page numbers. See further details here.