
The Application of Radiochemical Measurements of PWR Spent Fuel for the Validation of Burnup Codes


Faculty of Energy and Fuels, AGH University of Science and Technology, al. Mickiewicza 30, 30-059 Krakow, Poland
Energies 2022, 15(9), 3041; https://0-doi-org.brum.beds.ac.uk/10.3390/en15093041
Submission received: 16 March 2022
/
Revised: 14 April 2022
/
Accepted: 19 April 2022
/
Published: 21 April 2022
(This article belongs to the Special Issue Storage and Disposal Options for Nuclear Waste)
Abstract
:The paper shows the usage of destructive assay data from PWR fuel samples for the validation of the NFCSS burnup system developed by the IAEA. The results of radiochemical measurements of spent fuel isotopic composition were compared with the results of numerical modelling. In total, 254 samples from 15 PWRs, incorporated in the SFCOMPO database, were applied in the validation study. The paper shows the trends observed in the calculated-to-experimental ratios for eight major actinides and six minor actinides present in spent nuclear fuel. The data were quantified and analysed considering the enrichment, burnup and origin. The obtained results were compared with other studies on burnup validation using different numerical tools. In general, the results of numerical modelling for major actinides show rather good consistency with radiochemical measurements, while the results for minor actinides are less accurate.
1. Introduction
The burnup validation presented in this paper focuses on the usage of measured reference actinide concentrations from the Spent Fuel COMPOsition database (SFCOMPO) for the evaluation of the Nuclear Fuel Cycle Simulation System (NFCSS) in predicting the final concentrations of actinides in spent nuclear fuel [1,2]. The SFCOMPO database contains a vast set of verified radiochemical measurements along with their descriptions, which makes it the most reliable source of data for burnup validation. The NFCSS system is a numerical tool developed by the International Atomic Energy Agency (IAEA), capable of performing the first approximation calculations of spent fuel isotopic composition in the function of initial fuel enrichment and burnup. The comparative analysis based on the Calculated-to-Experimental ratios (C/E) was performed using measured actinide concentrations obtained in a destructive assay of 254 fuel samples from fifteen Pressurised Water Reactors (PWR). The samples are characterised by the enrichment from 1.7% to 4.5% and burnup from 6.9 to 75 GWd/tHM. In the analysis, 235U, 236U, 238U, 237Np, 238Pu, 239Pu, 240Pu, 241Pu, 242Pu, 241Am, 242mAm, 243Am, 242Cm and 244Cm were taken into consideration.
The results of burnup validation, i.e., (C/E) ratios and numerical actinide concentrations, are mainly used for the evaluation of numerical tools for designing a whole nuclear fuel cycle, from the conceptual reactor core design to nuclear waste management. The development of numerical tools aims mostly at increasing the accuracy of burnup and neutron transport calculations, which limits the demand for expensive experiments. In particular, the results of burnup validation are important for partitioning, transmutation and general nuclear waste management, including fuel storage, reprocessing, handling, transportation and disposal. If a numerical tool could predict the characteristics of spent nuclear fuel in a long time span to a large extent, the costs of the back-end fuel cycle could be optimised. One is especially interested in the concentrations of the long-lived actinides, which are important for the post-closure safety of the final geological repositories.
There are a lot of examples where results of burnup validation are used, e.g., the reprocessing of spent nuclear fuel in the Plutonium–Uranium Extraction process (PUREX) demands the fulfilment of the requirements according to the composition and radiological properties of compound isotopes, while the neutron and gamma-ray source terms are estimated in the shielding calculations, which are used in the safety evaluation of special casks for nuclear waste transportation. Moreover, results of burnup validation are commonly used in burnup credit and criticality safety analysis, which determines the reactivity of nuclear fuel not only during the reactor operation but also after the fuel discharge for the interim or long-term repository storages. Therefore, the criticality calculations are performed for the predicted isotopic composition at a defined point in time or for a defined time period. The fuel isotopic composition also determines other core parameters, such as activity, release of decay heat, shielding effects and reactor behaviour in case of a severe accident.
Some of the previous studies on burnup validation using radiochemical measurements of spent nuclear fuel composition are already available for the scientific community. The papers by Michel-Sendis and Gauld present the general capabilities of the SFCOMPO database [3,4]. The works performed at the Oak Ridge National Laboratory focus on the burnup validation of the ORIGEN and SCALE codes [5,6]. Comprehensive studies on burnup validation for BWR reactors are presented in the papers by Gauld [7]. Price shows the application of burnup validation in multiphysics modelling of Boiling Water Reactor (BWR) reactor core [8]. Additionally, Detkina describes the application of burnup validation for burnup credit and criticality safety [9,10,11]. The validation of Japanese SWAT4 burnup code using PWR Mixed Oxide Fuel (MOX) fuel is presented by Kashima [12]. High-burnup PWR MOX and UO2 fuels were used by Yamamoto for the validation of the MPV-BURN and SRAC burnup code [13]. The importance of burnup calculation reliability for criticality safety and spent fuel disposal is described in the papers by Frankl and Vasiliev [14,15]. The aforementioned papers show some possible areas for the usage of burnup validation. However, there are a lot more works, e.g., the previous paper by Oettingen and Cetnar, where burnup validation was used as part of more comprehensive research [16,17].
Section 2.1 describes the NFCSS numerical system, while Section 2.2 presents the SFCOMPO database, containing reference radiochemical measurements. Section 2.3 focuses on the reference data used for the validation of NFCSS. Section 2.4 introduces the applied validation procedure. The results of validation are presented in Section 3.1. In Section 3.2, a comparative study of the NFCSS and SCALE systems is shown. Section 4 summarises and concludes the study.
2. Materials and Methods
2.1. NFCSS System
The Nuclear Fuel Cycle Simulation System (NFCSS) is a numerical tool capable of modelling nuclear fuel cycles for commercial nuclear reactors [2]. The system contains modules for the mass flow calculations for front-end fuel cycle, in-core burnup and back-end fuel cycle. The system uses a simplified approach for the estimation of fuel cycle requirements for PWR, BWR, Canada Deuterium Uranium (CANDU) and fast reactors with various fuel types. The system, formerly known as VISTA [18], has been developed by the IAEA since 1990. The tool is available to the scientific community as part of the IAEA NUCLEUS system [19]. In order to initiate the calculations, the user has to provide a set of parameters related to the considered nuclear fuel cycle, such as the type of reactor, type of fuel, initial fuel composition, initial fuel load, power of reactors, operational time, discharge burnup, etc. In the first step, the system calculates material demand for the production of fresh fuel loads for a given number of nuclear reactors of fixed power for the chosen operational time. Afterwards, the system calculates the mass and isotopic composition of spent fuel using the incorporated burnup module. Therefore, in the end, one obtains the total mass flow and isotopic composition of spent nuclear fuel for fourteen actinides and lumped fission products. The system was partly validated in the previous studies, however, the latest study related to the estimation of radiotoxicities of spent nuclear fuel has revealed the demand for its further validation [20]. Therefore, all available radiochemical measurements of UO2 fuel samples from PWR reactors accessible in the SFCOMPO database were applied for the system validation in this study. The main advantage of the system is its capability of fast estimation of spent isotopic fuel composition before the application of more complex numerical tools for detailed modelling of the reactor physics. In the study, the system was used to obtain numerical isotopic concentrations of actinides in spent nuclear fuel for given enrichment and discharge burnup.
2.2. SFCOMPO Database
The actinide concentrations from the SFCOMPO database obtained in experimental measurements were used for the comparison with the numerical concentrations obtained in the NFCSS numerical modelling. The SFCOMPO database contains a large set of spent nuclear fuel assay data from various nuclear reactors, i.e., PWR, BWR, CANDU, Water-Water Energetic Reactor (WWER) and others. It contains data about approximately 750 fuel samples obtained from 296 fuel rods dismantled from 116 fuel assemblies and irradiated in 44 power reactors, which gives about 24,000 measurement entries in total. The data were obtained from various irradiation campaigns performed in many international projects in Europe, United States and Japan. The measurement method depends on the experiment design, irradiation campaign and laboratory. Generally, the following steps were applied to obtain the isotopic concentration: sampling, sample dissolution, isotopic separation and mass spectrometry. In the majority, the following methods were used for mass spectrometry: α-, β-, γ-spectrometry or a combination of them. In addition, the SFCOMPO contains design data of fuel assemblies, fuel rods and fuel samples, irradiation histories as well as burnup of each sample. This allows for a detailed reconstruction of the irradiation conditions for simplified tools such as NFCSS, and for advanced physical codes for inventory calculations such as SCALE, MCB and others [5,21,22]. The Organisation for Economic Cooperation and Development, Nuclear Energy Agency (OECD, NEA) manages the SFCOMPO database, while the NEA Expert Group on Assay Data of Spent Nuclear Fuel (EGADSNF) reviews, qualifies and standardises the data. Thus, the SFCOMPO is nowadays the most reliable source of spent nuclear fuel assay data for validation purposes. Moreover, the database allows for advanced plotting and visualisation capabilities, which considerably simplifies the use and interpretation of the available data.
2.3. Reference Data
The experimental data used in the analysis for the burnup validation include 269 radiochemical measurements on fuel samples extracted from 15 nuclear reactors in Japan (five units), United States (five units), Germany (two units), Switzerland (one unit), Italy (one unit) and Spain (one unit). The number of fuel samples is 254 and is lower compared to the number of measurements, because some samples were analysed in different laboratories using different mass spectrometry techniques, i.e., five samples from Trino Vercellese-1, four samples from Vandellos-2 and four samples from Obrigheim-1. The analysis also considers radiochemical measurements on eight samples containing gadolinium burnable poison Gd2O3 obtained from Japanese Nuclear Power Plants (NPP)—five samples from Takahama-3 and three samples from Ohi-2. In the analysis, the samples from the Swiss Beznou-1 PWR were not included, because they contain MOX fuel. A detailed description and naming of the samples are available in an open SFCOMPO database and are not repeated in the paper. The database contains references to the performed irradiation and measurement campaigns as well as to the applied experimental setup, if available. The database also contains a detailed description of sampling positions in the fuel assemblies and engineering data about the assemblies design. The concentrations of the aforementioned 14 actinides (235U, 236U, 238U, 237Np, 238Pu, 239Pu, 240Pu, 241Pu, 242Pu, 241Am, 242mAm, 243Am, 242Cm, 244Cm) were considered in the analysis. Table 1, Table 2, Table 3 and Table 4 show the number of measurements for all the actinides considered. The highest number of entries was reported for the fissionable 235U and 239Pu (269) and the lowest for 242mAm (66).
It is worth mentioning that measured actinide concentrations are reported with measurement uncertainties. However, reconstruction of the methodology used for the uncertainty calculations is rather impossible. The uncertainties contain only contributions from individual steps of the applied measurement process rather than uncertainty propagation along the whole analytical process. The uncertainty may be related to the measurements themselves or to the precision of the applied mass spectrometer. Nevertheless, the average uncertainties (UAV) for each isotope are shown in Table 1. The uncertainties have indicative character and were calculated as an average of all available individual uncertainties for each measurement entry considered in the study. The definition of the method for the uncertainty propagation along all the steps of sample preparation, in-core irradiation, extraction, dilution, isotopic separation, measurements and final numerical data processing is a complex scientific topic, which must be established before the irradiation experiment. The work on the standardised process for the uncertainty evaluation is performed by the OECD/NEA EGADSNF team.
2.4. Validation Procedure
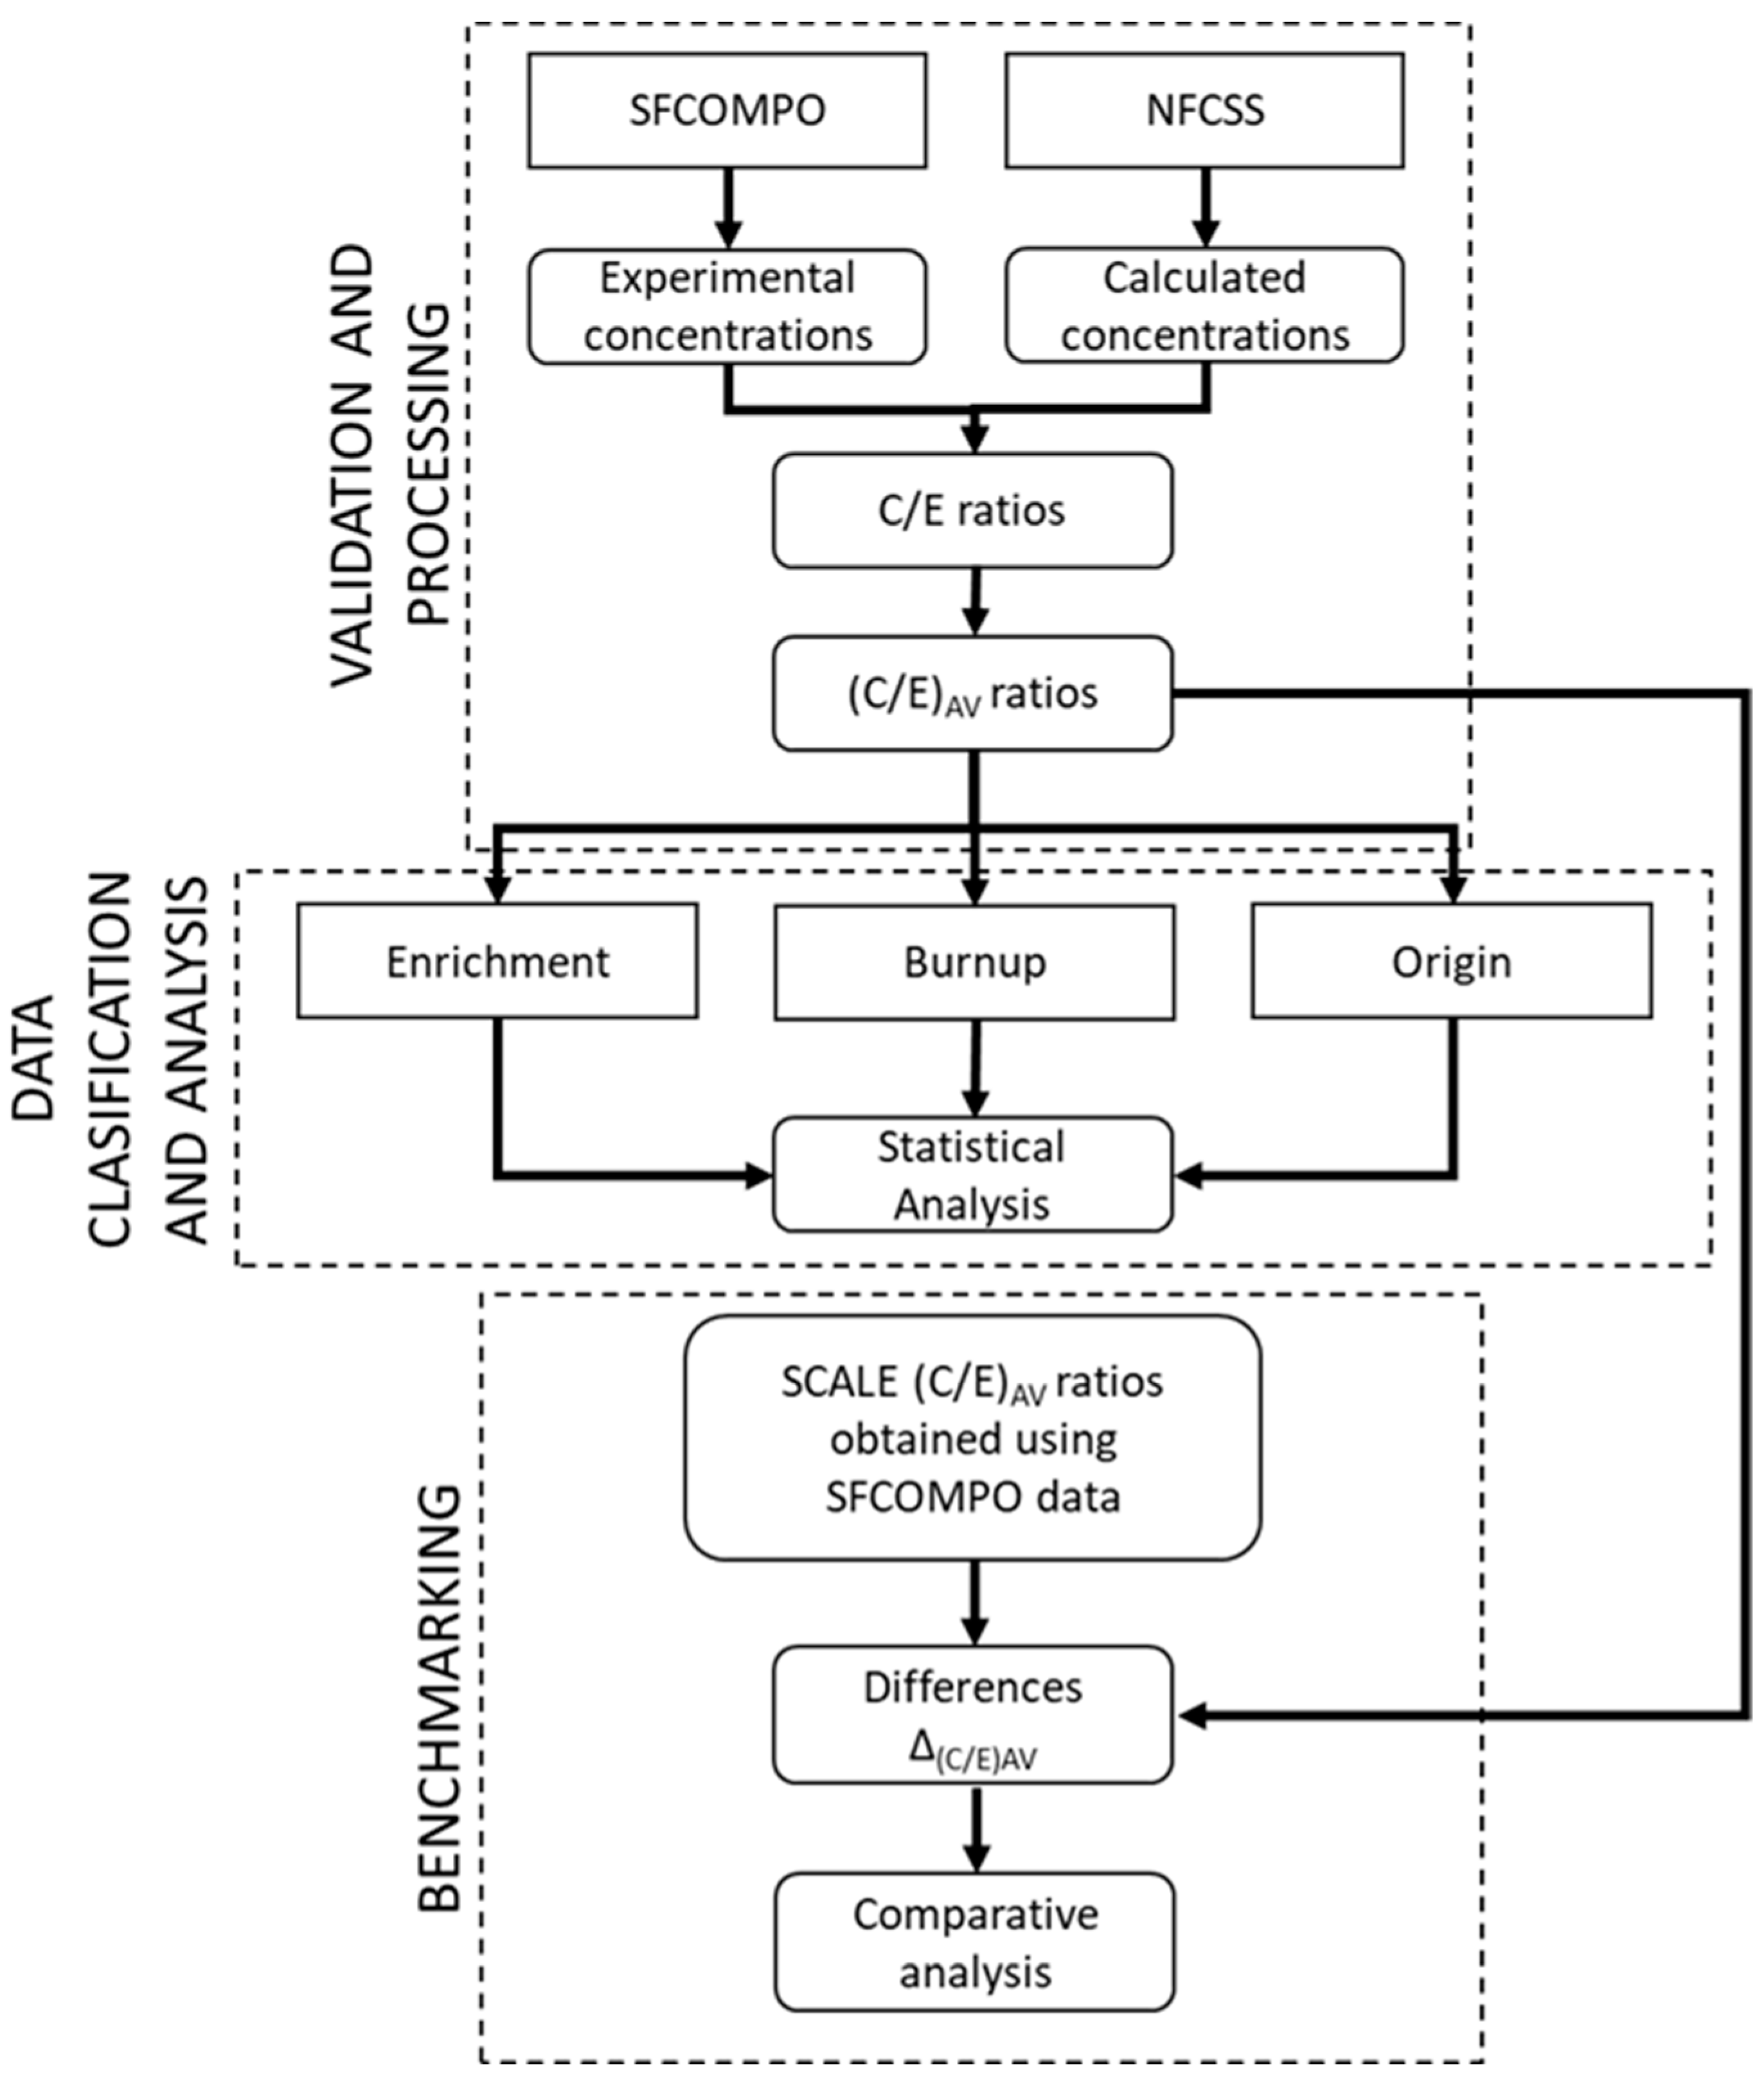
Figure 1 shows the applied procedure for the calculation of the (C/E) ratios. Initially, the measured concentrations for 14 actinides for 254 PWR fuel samples were extracted from the SFCOMPO database. The availability of the data depends on the radiochemical procedure applied for the measurements, as well as on the purpose of the irradiation campaign. Therefore, for some samples, only measurements for some chosen actinides are available, especially those for major actinides. The extracted concentrations were qualified according to the initial enrichment, discharge burnup and origin (reactor unit and nuclear power plant). In addition, in the case of some samples, measurements using different methods are available. Such actinide concentrations for the same sample are treated independently. Table 1, Table 2, Table 3 and Table 4 show the classification of the fuel samples according to the defined criteria.
Subsequently, the calculations using the NFCSS system for given sample enrichment and discharge burnup were performed. Where the data about cooling time after the discharge of the sample from the reactor core were available, pure decay calculations were performed using the MCB code [23]. The numerically obtained actinide concentrations in mg/U units were used to calculate the (C/E) ratios for further processing. The obtained (C/E) ratios show very high (above 2.0) or very low (below 0.1, especially for 241Am) values in only a few cases, therefore, all (C/E) factors were used in the analysis without rejection. Afterwards, the method defined by Ilas and Gauld [5] was applied for a statistical analysis and data visualisation using box plots with median. In the method, the average (C/E)AV factors, mean, median, minimum, maximum, and 1st and 3rd quartiles were calculated and presented. The calculations for the aforementioned statistical parameters depend on the data classification with respect to the enrichment, burnup and origin. Finally, the results of the statistical analysis were discussed with regard to the performance of the NFCSS system in the predicted isotopic concentrations. Moreover, the results were compared with the available results obtained using the 3D SCALE code system [5]. The recommendations for further research and improvements on NFCSS were proposed.
3. Results
3.1. Validation
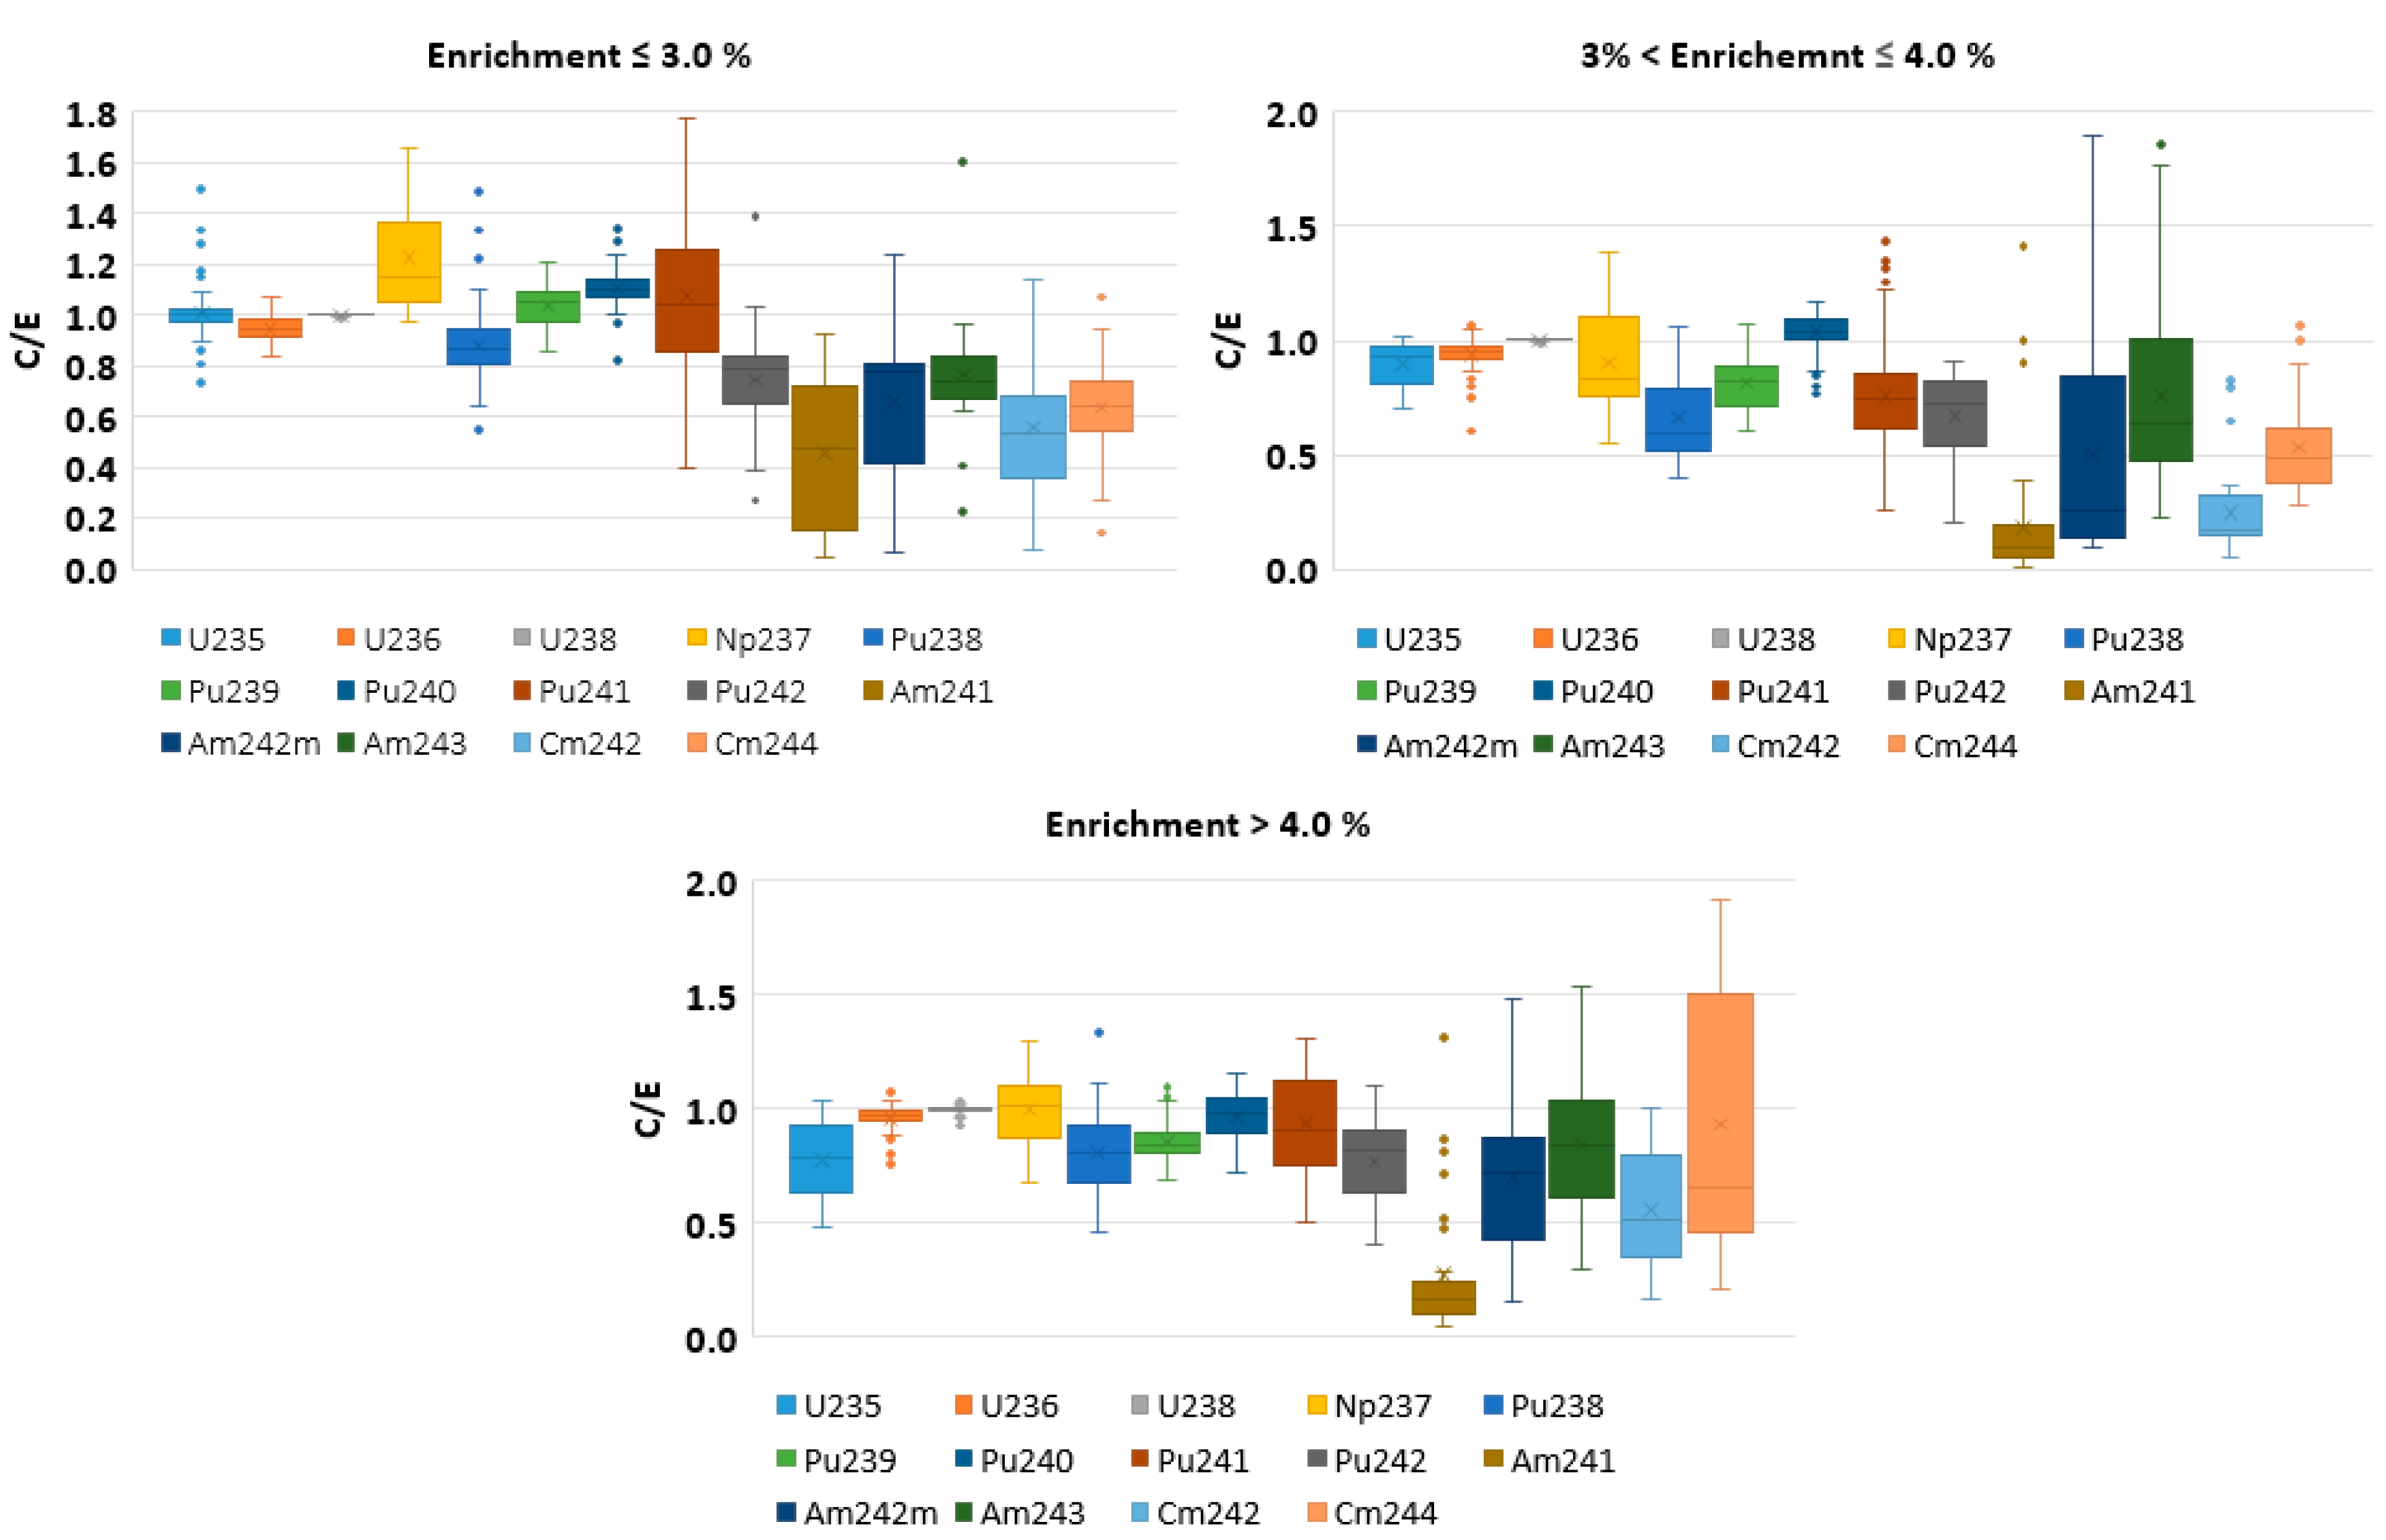
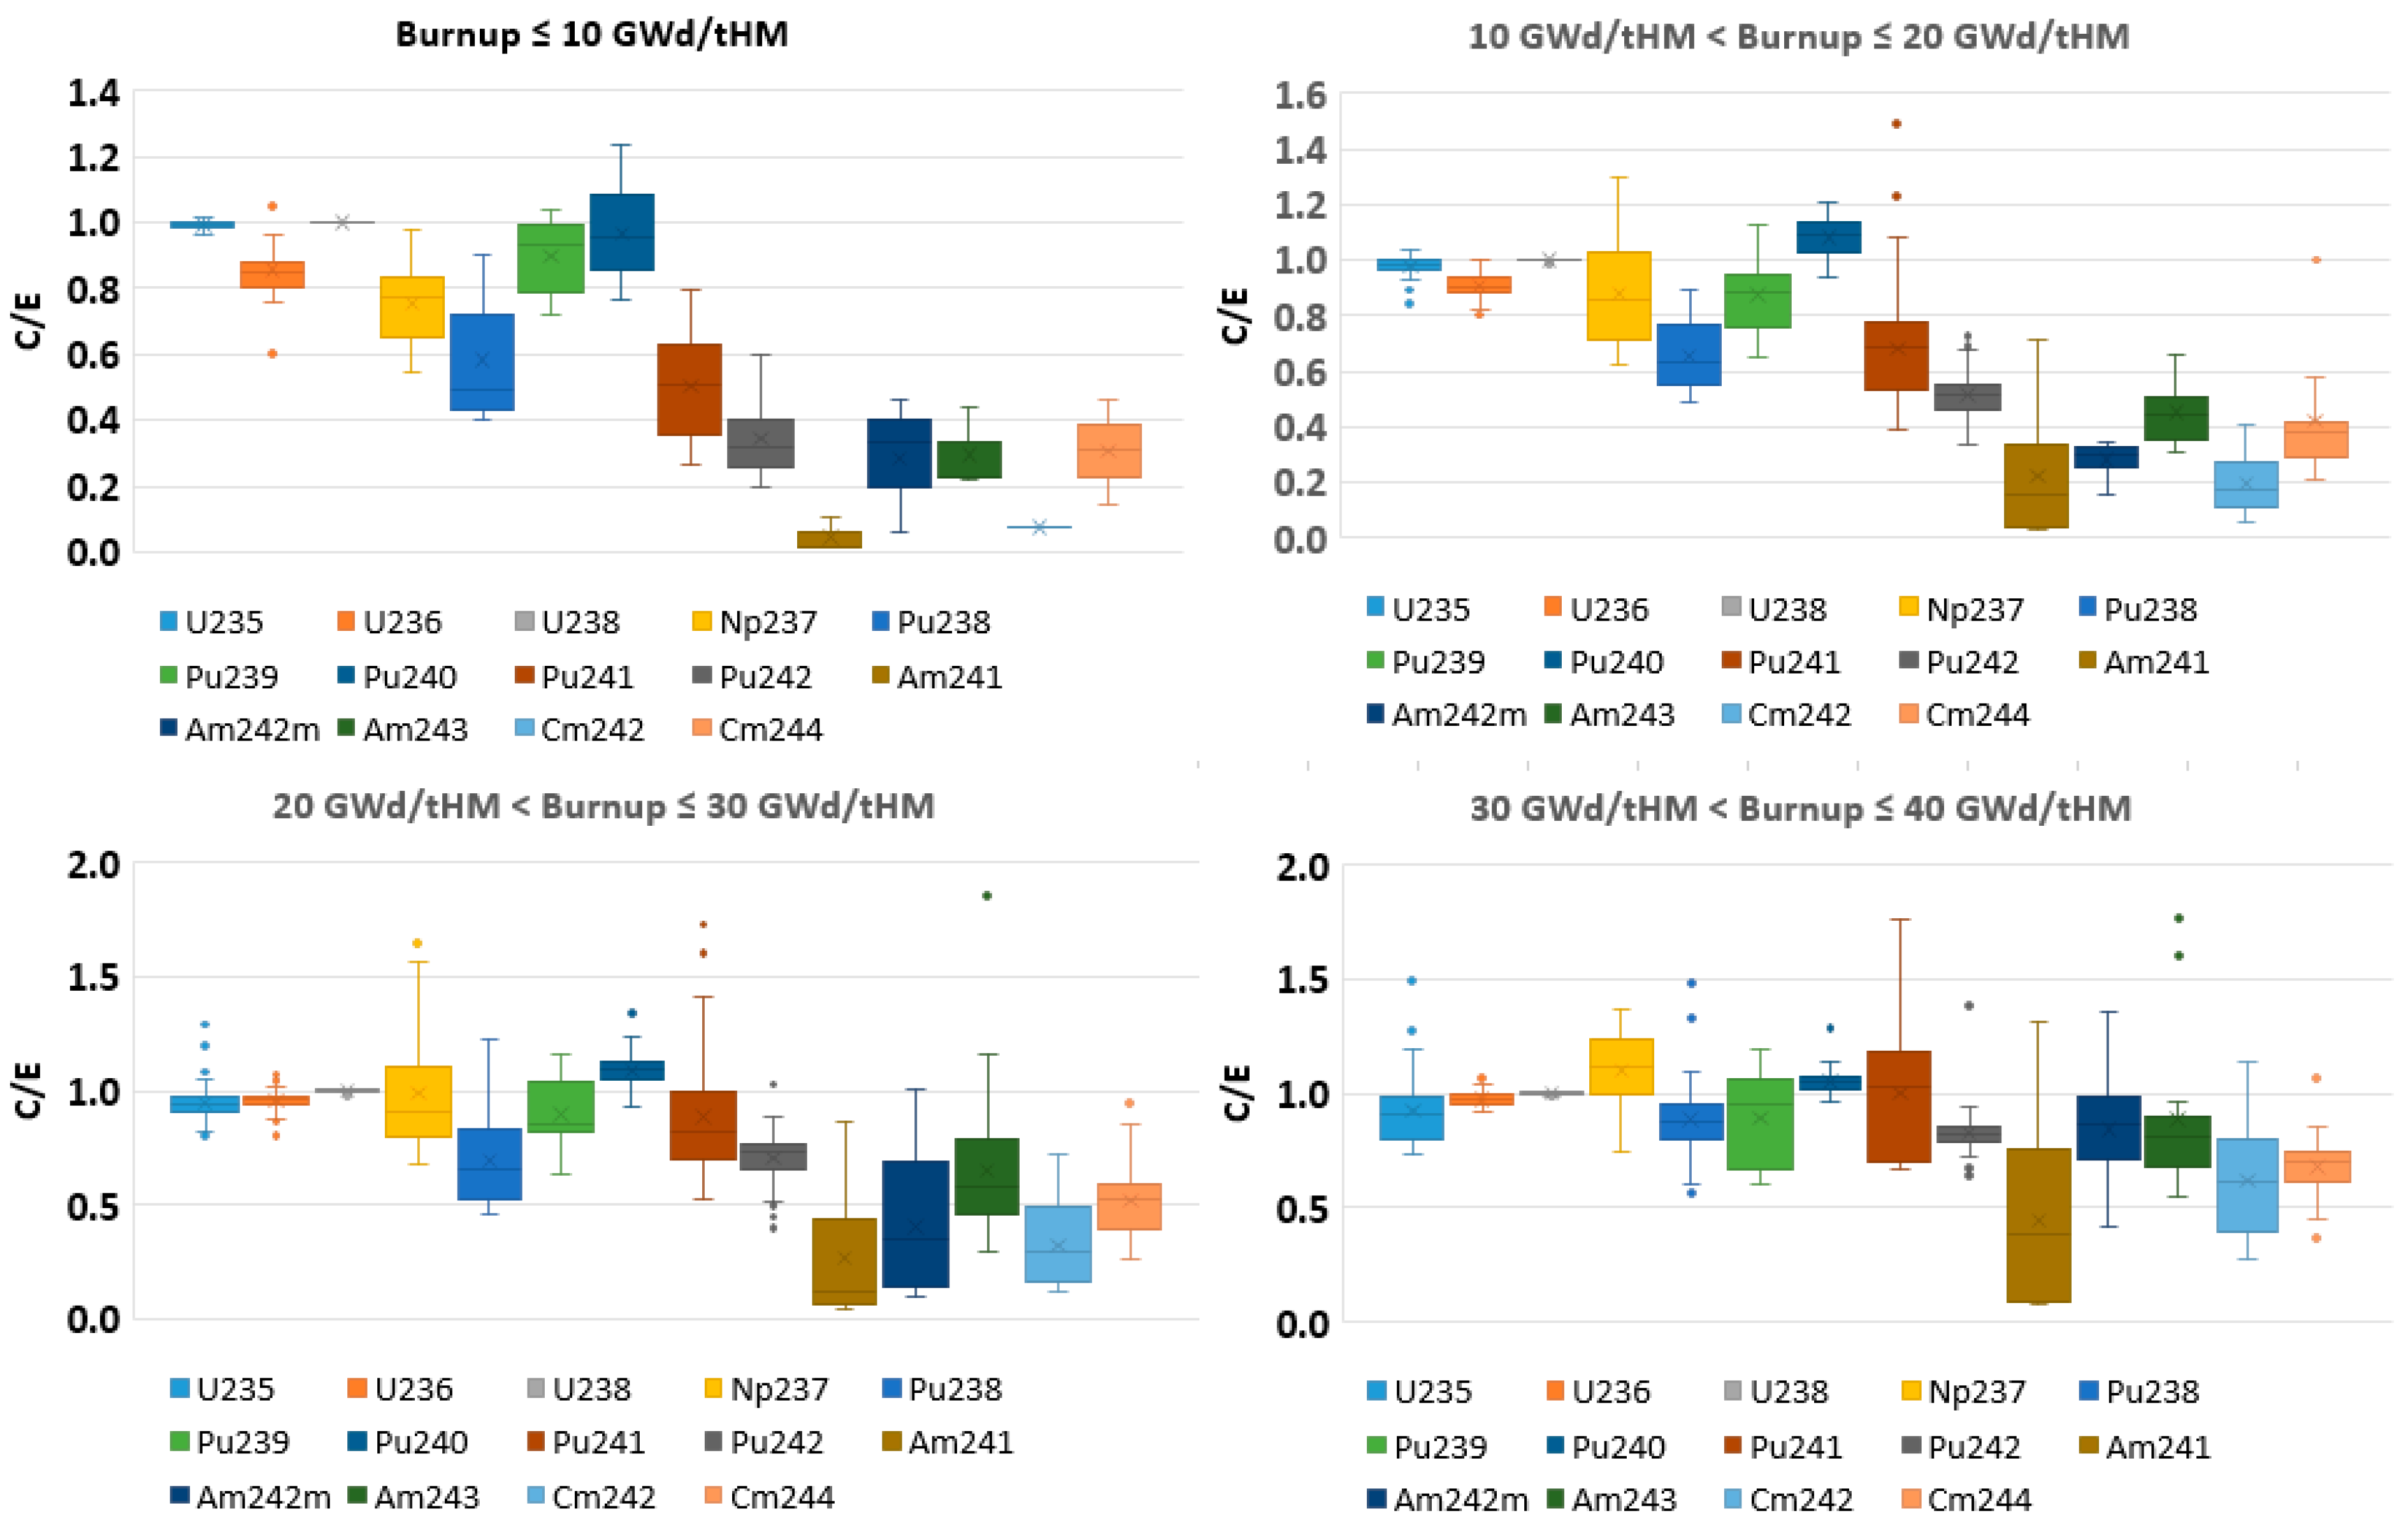
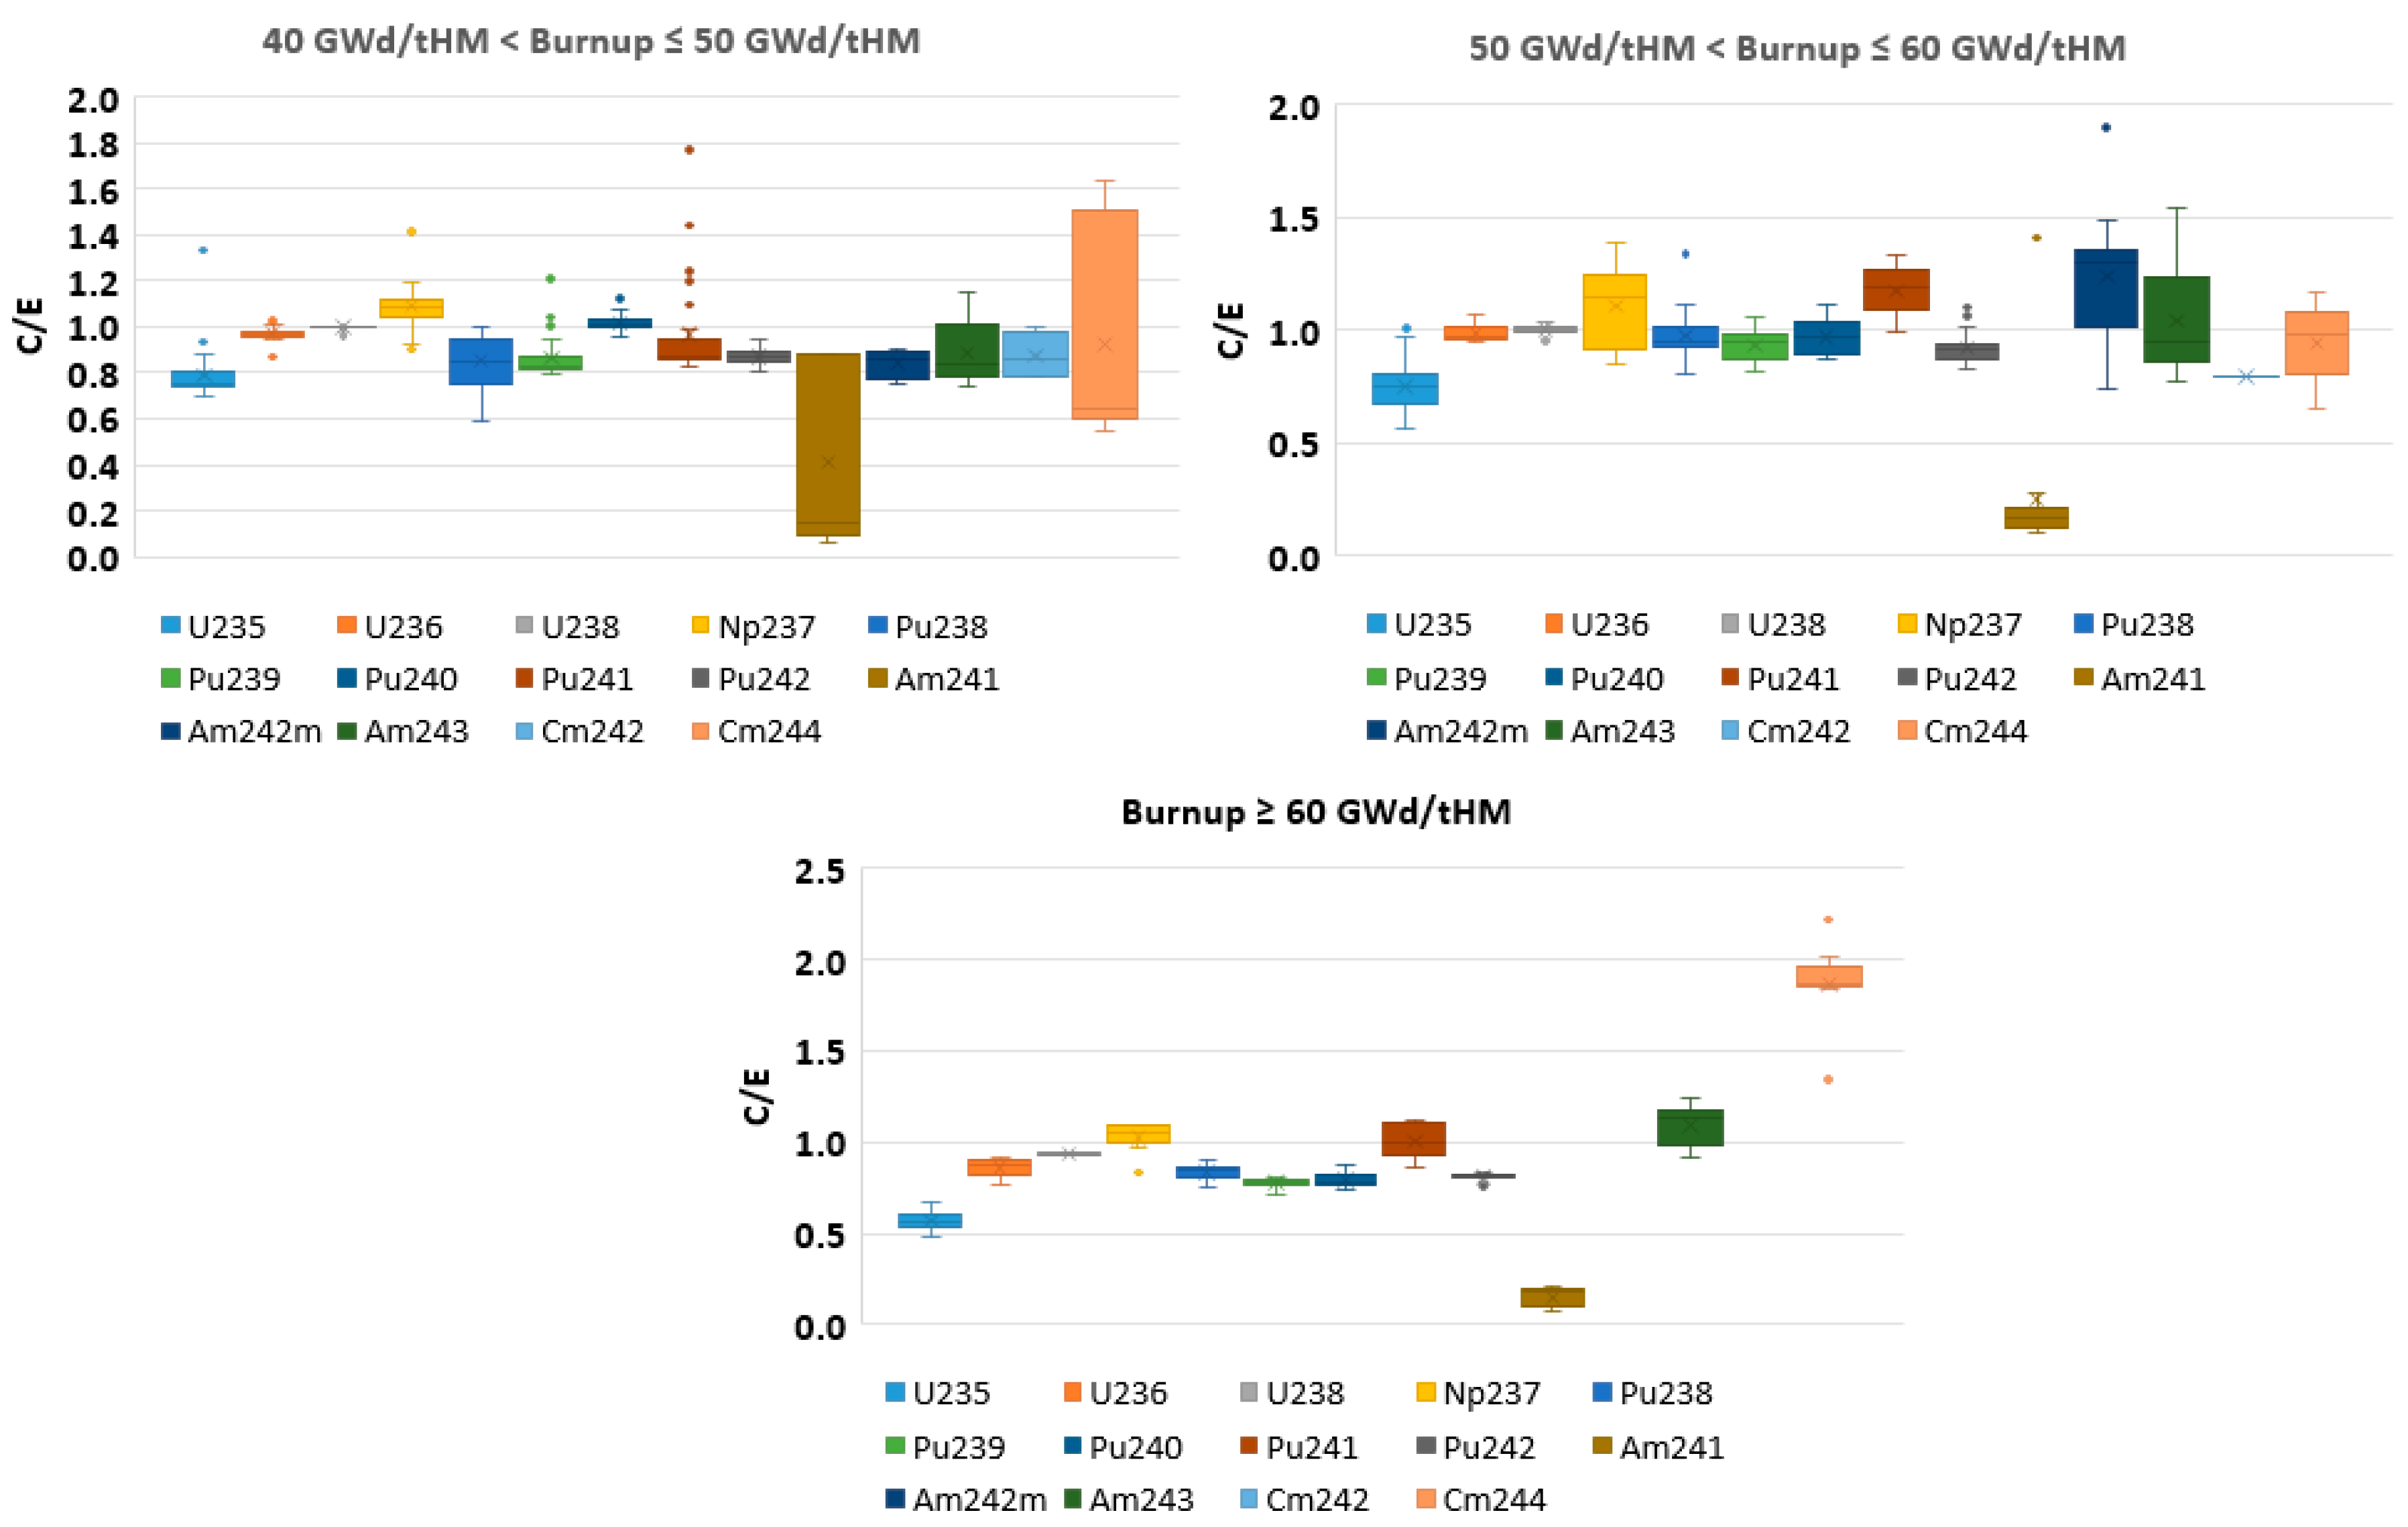
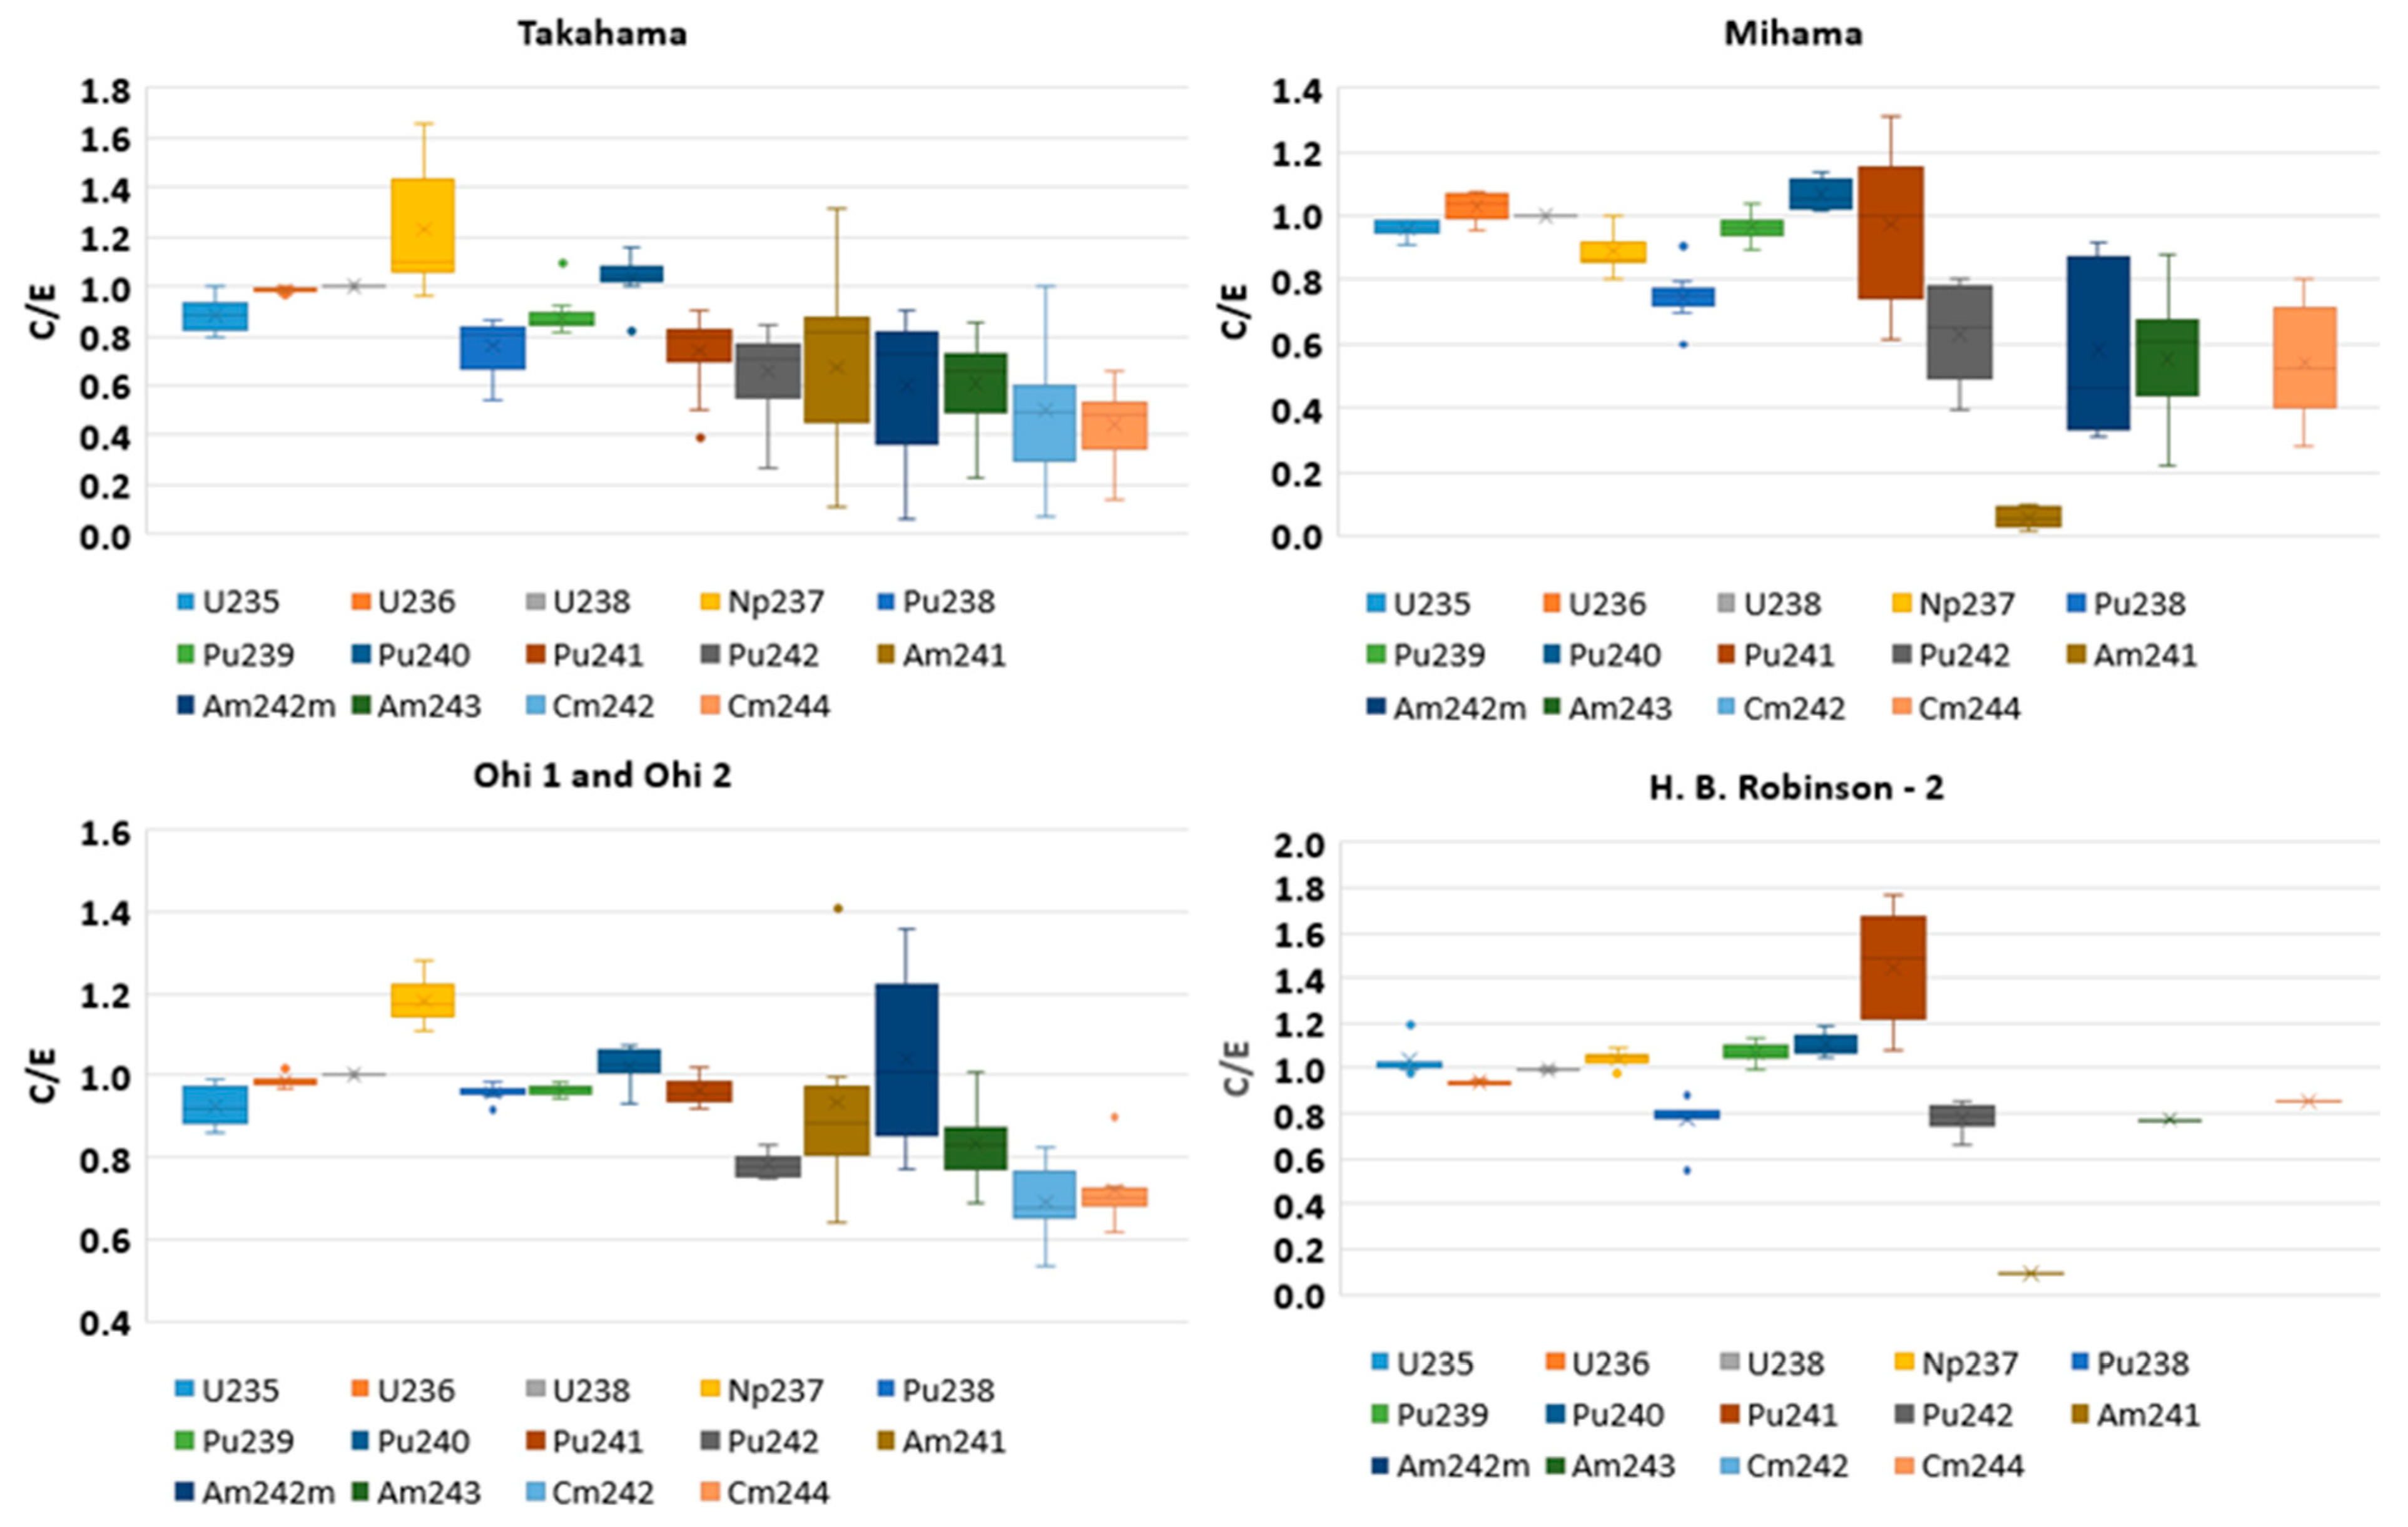
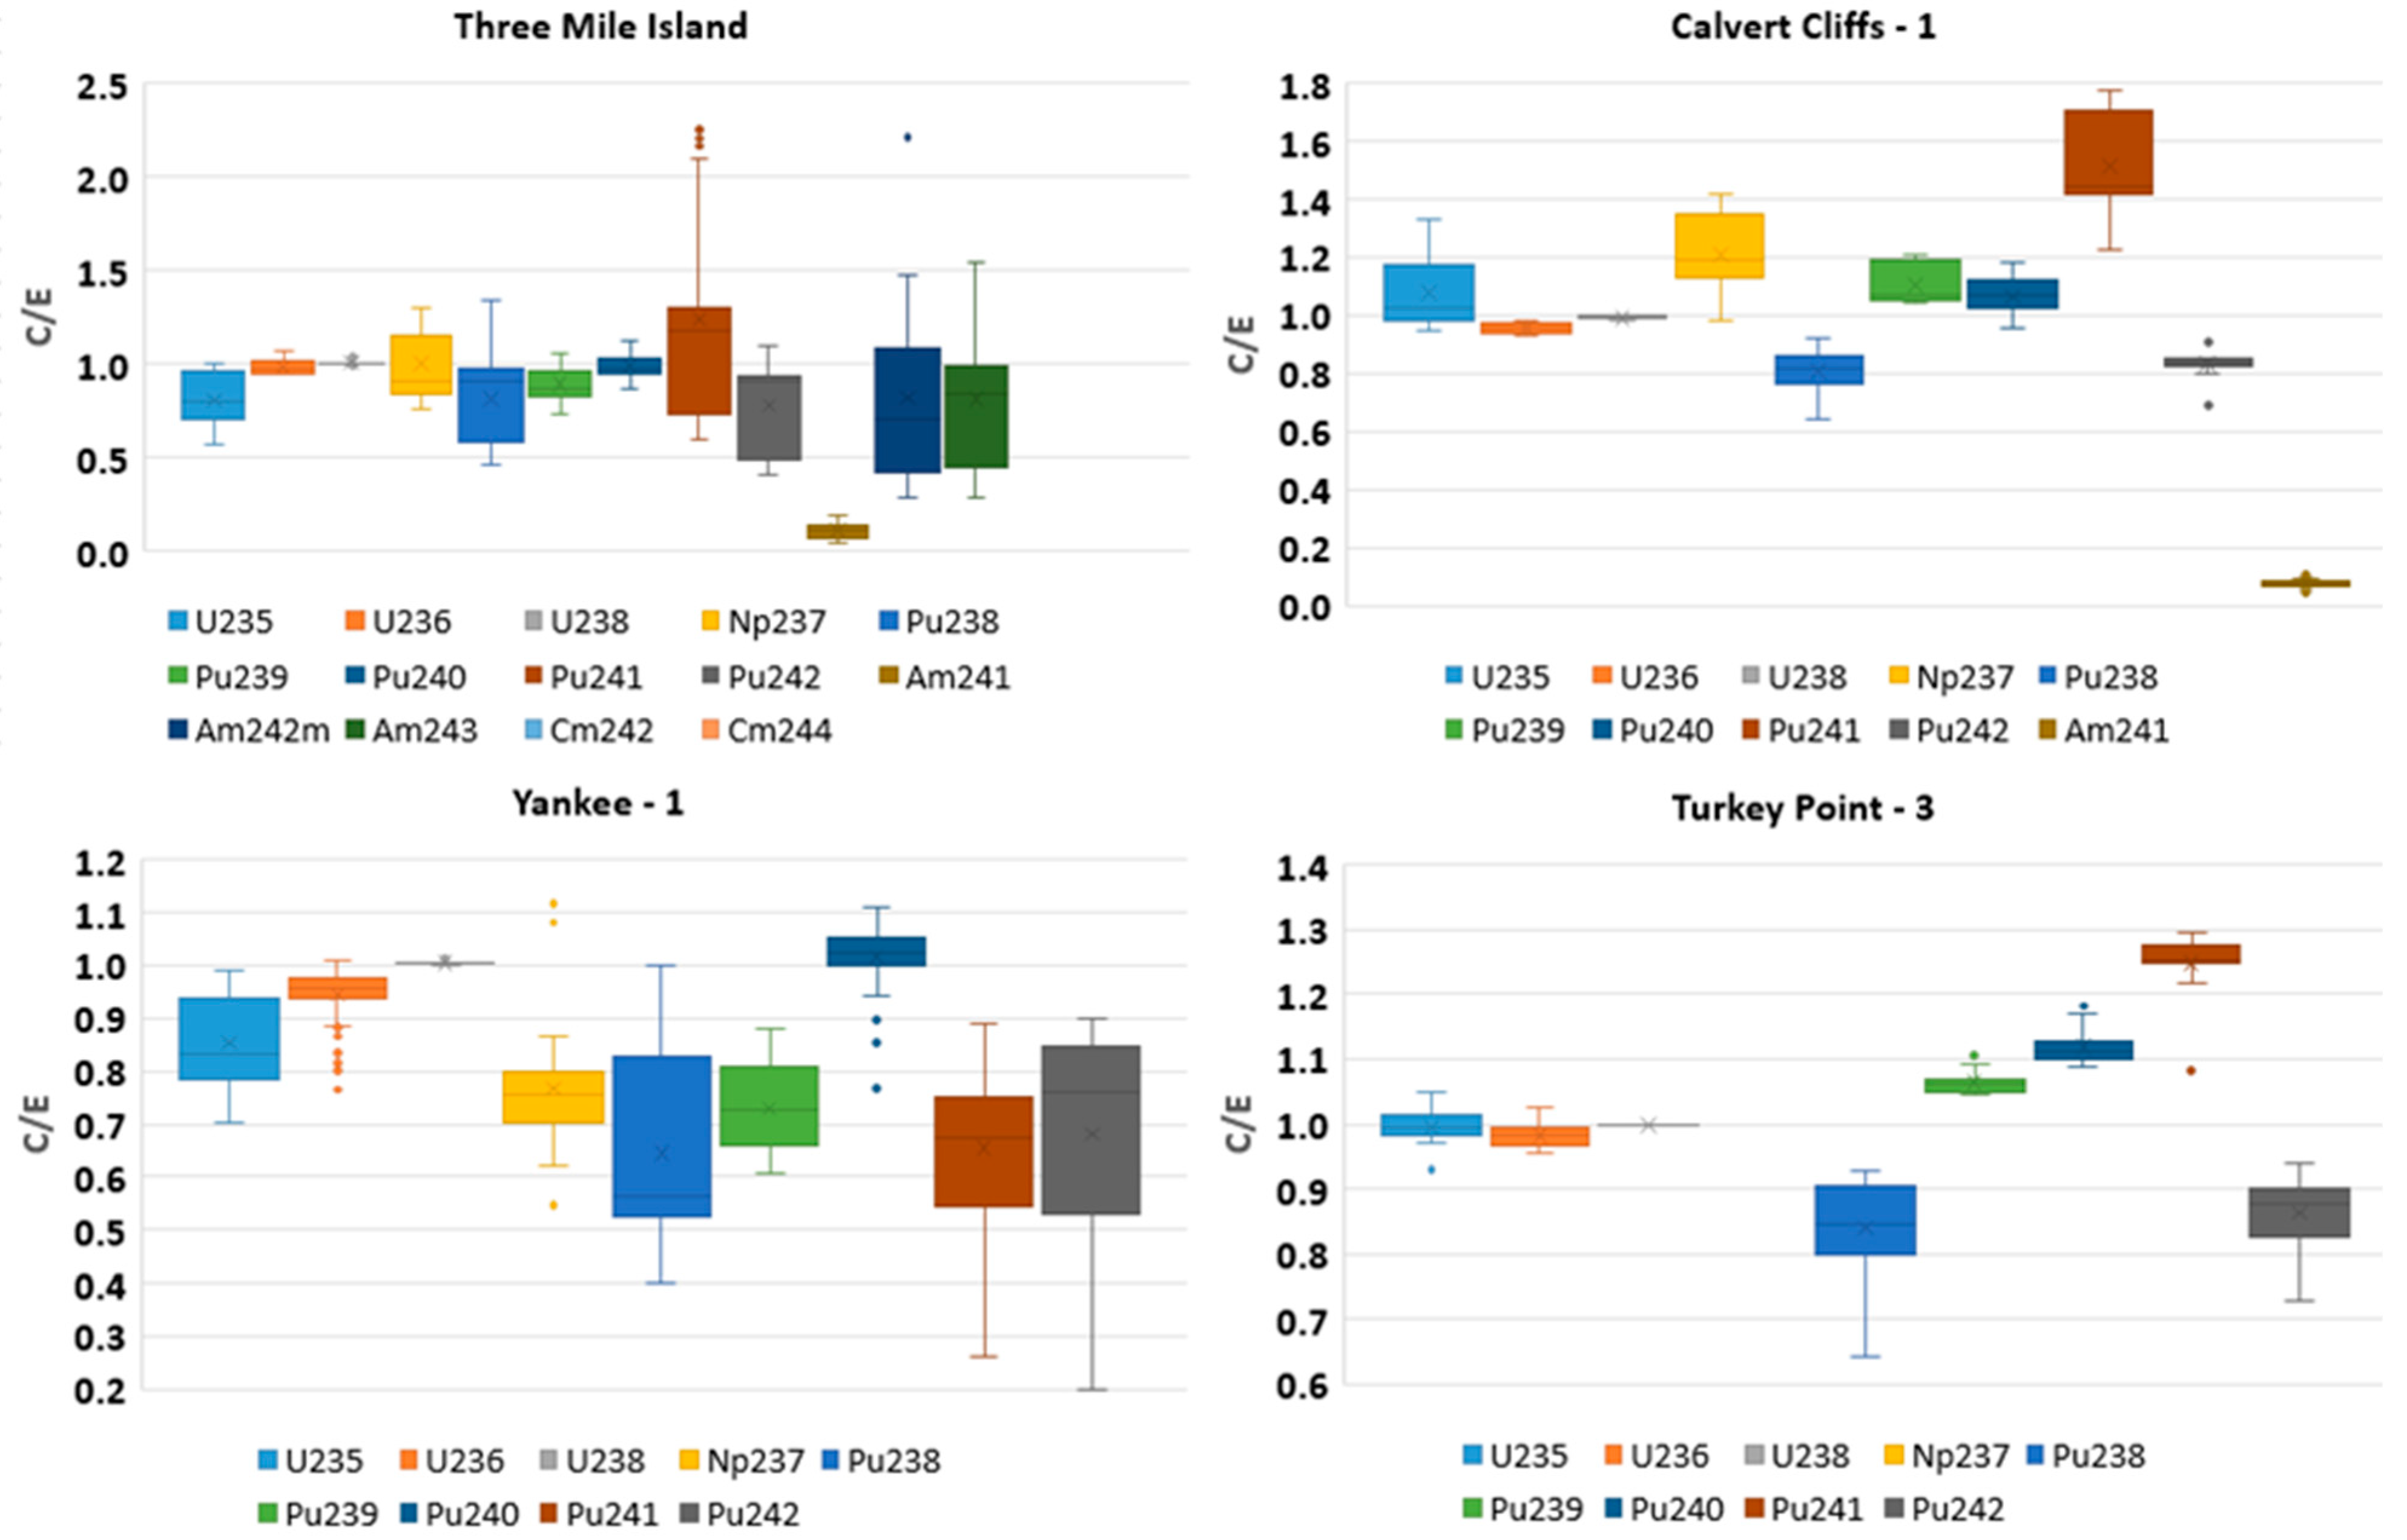
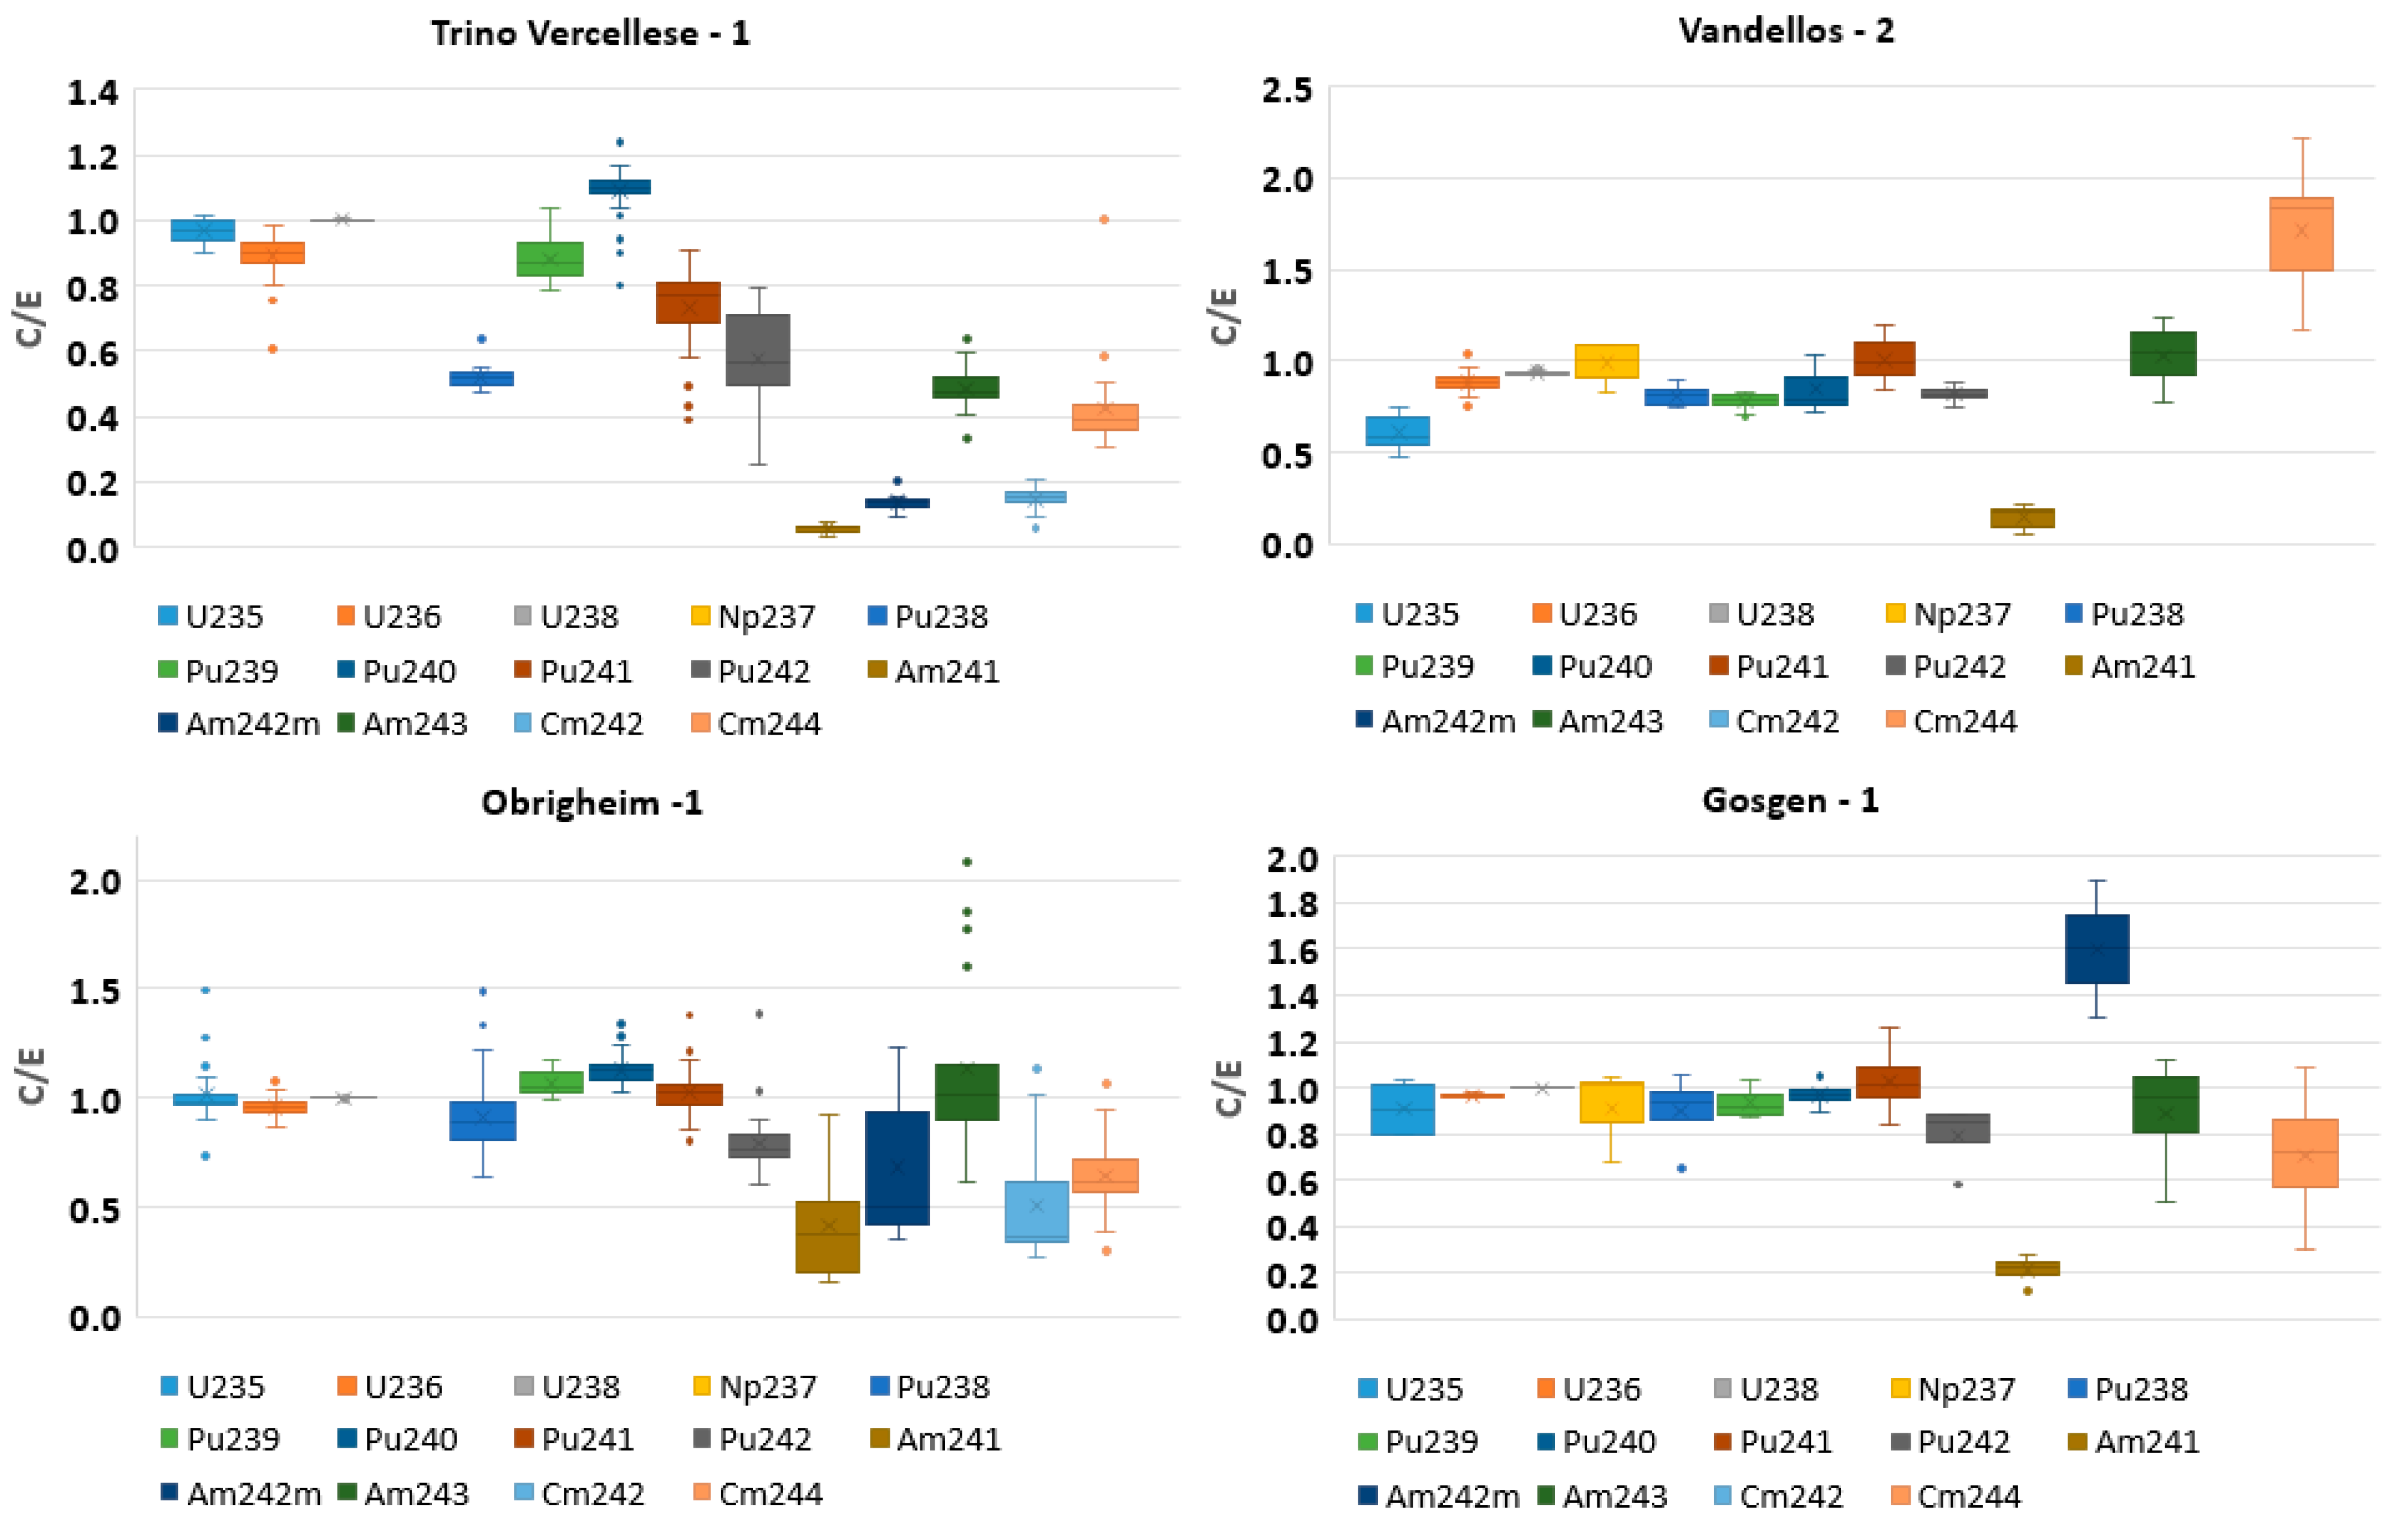
In the following section, the results of the statistical analysis in the form of box plots are shown. The samples were classified according to the enrichment level, burnup and origin. Figure 2, Figure 3, Figure 4, Figure 5, Figure 6 and Figure 7 show the distribution of the average (C/E)AV ratios for the applied classifications. The obtained results depend strongly on the isotope and the applied classification criteria. However, some general trends and outcomes can be presented. It is worth mentioning that the parameters of the box plots depend on the number of entries for each criteria, which are shown in Table 1, Table 2, Table 3 and Table 4.
Table 5 shows general results for all the fuel samples investigated. The results for major actinides show good consistency with the experimental measurements, while the results for minor actinides are less accurate. In many cases, the average (C/E)AV ratios are characterised by high standard deviations. The results are rather underestimated than overestimated. It means that the numerical isotopic concentrations are lower compared to the experimental concentrations. It also points to the limited general predictive capabilities of the NFCSS system.
With reference to the samples’ enrichment, the results for major actinides are closer to unity, especially for uranium isotopes, while the results for minor actinides are further from unity. The interquartile ranges for minor actinides are usually larger and vary depending on the enrichment. Quite a significant number of outliers is presented, especially in the case of 235U for the enrichment below 3% and in the case of 241Am for the enrichment above 4%. The largest systematic spread between the maximum and minimum values was observed in the case of 242mAm for all enrichments.
Considering the samples’ burnup, the (C/E)AV ratios seem to approach unity with the increasing burnup, especially in the case of heavier actinides, starting from 242Pu. The results for burnups between 40 and 60 GWd/tHM show the highest number of the (C/E)AV ratios close to unity. The Am and Cm isotopes show the highest statistical spread among the analysed results. The number of outliers is not significant.
As for the classification according to the samples’ origin, the (C/E)AV ratios being closest to unity were obtained for the US Three Mile Island as well as for the European Vandellos-2 and Gosgen-1 nuclear power plants. The same tendency as in the previous classifications was observed, i.e., the results for major actinides were more consistent with the experimental measurements.
3.2. Comparative Analysis
This section contains a presentation of a comparative analysis of the results obtained using the NFCSS and SCALE systems. The SCALE system is capable of detailed numerical modelling of fuel assembly with neutron transport and burnup calculations considering 3D geometry. Therefore, the SCALE results can be treated as a reference point for the NFCSS modelling. The SCALE code was validated using the experimental measurements from the SFCOMPO database. The authors of the reference paper (Germina Ilas, Ian C. Gauld and Georgeta Radulescu) validated two versions of the SCALE system (5.1 and 6.1) using two Evaluated Nuclear Data File (ENDF) nuclear data libraries (ENDF/B-VII and ENDF/B-V) [5]. However, the reference analysis does not include a detailed description of the chosen fuel sample used in the validation. A general characterisation of the data is provided, but it does not allow to identify each sample used. Therefore, in the present study, all samples that match the description of the samples used for the SCALE validation were applied. The applied samples are characterised by similar parameters, i.e., origin, burnup, enrichment range, assembly design, etc. As a result, the total number of the applied samples, presented in Table 6, is higher (except for 237Np) than the number of samples used in the SCALE validation. The comparative analysis does not consider 242mAm and 242Cm, because these isotopes were not presented in the SCALE modelling. In addition, a comparative analysis with (C/E)AV for all samples used in the NFCSS validation is presented.
The obtained average (C/E)AV ratios using the NFCSS system for SCALE fuel samples for 235U, 236U, 238U, 237Np, 238Pu, 239Pu, 240Pu and 242Pu are close to unity, which is shown in Table 7. This means that the numerical isotopic concentrations show good consistency with the results of the experimental measurements, considering the nature of the applied numerical tool. The consistency for the remaining actinides, 238Pu, 241Pu, 241Am, 243Am and 244Cm, is rather low. It is worth mentioning that the obtained standard deviations are higher compared to the results of the numerical tools with the capability of geometry modelling as SCALE. The average (C/E)AV ratios show various behaviours, depending on the isotope. However, in general, the results are closer to unity, except for 235U and 238Pu. In addition, the general trend shows that the standard deviation of the (C/E)AV ratio increases in the case of all fuel samples, which originates from the inclusion of all outliers presented in the previous sections in the statistics. Table 7 also shows the relative differences (Δ(C/E)AV = ((C/E)AV,REF − (C/E)AV)/(C/E)AV,REF)) between the average (C/E)AV ratios for all sets of data obtained, differences in a number of samples (ΔSAMPLES), as well as differences between experimental measurements and simulations for the SCALE modelling (ΔSCALE = ((C/E)AV − 1)/(C/E)AV) [5]. In the majority, the differences present similar trends for all compared SCALE and NFCSS data sets. For 235U, 236U, 238U, 237Np, 239Pu, 240Pu and 241Pu, the differences are acceptable, mostly below 10%, but for the remaining actinides, i.e., 238Pu, 242Pu, 241Am, 243Am and 244Cm, the differences are large. The most consistent results (the smallest Δ(C/E)AV) were obtained for SCALE6.1 with the ENDF/B-VII nuclear data libraries and NFCSS with SCALE fuel samples. This set of data is also the most reliable, considering the comparative analysis performed.
4. Discussion and Conclusions
The study presents the usage of spent fuel destructive assay data for the validation of the NFCSS burnup system. The SFCOMPO database was used as a source of radiochemical measurements of spent fuel compositions for PWR reactors. The available experimental measurements were compared with the results of numerical modelling using the NFCSS system developed by the IAEA. In the study, the capability of the NFCSS system in predicting the isotopic concentrations for given burnup and enrichment of nuclear fuel was evaluated. The results show that the NFCSS cannot be used as a reliable tool for such calculation—it can only provide the first approximation results, which can serve as an indicator for further, more advanced calculations. In particular, some improvements in the modelling of minor actinides concentrations are necessary.
The reason for high discrepancies in the obtained result may be the treatment of the cross-sections and neutron fluxes in NFCSS inventory calculations. The NFCSS takes one-group neutron cross-sections and fluxes for a given enrichment derived from ORIGEN libraries and calculation results, for the chosen fuel type. More accurate calculations would be possible along with the application of multi-group cross-sections or even continuous energy cross-section representation like e.g., in Monte Carlo neutron transport methods [24,25].
The performed validation shows that the obtained average (C/E)AV ratios depend strongly on the investigated isotope. However, the general trend is that the numerical isotopic concentrations for major actinides are more consistent with the experimental measurements than the isotopic concentrations for minor actinides. In addition, the obtained numerical concentrations seem to be underestimated compared to the experimental measurements.
In general, the following conclusions may be drawn from the study:
- (a)
- The NFCSS system is not mature enough to reliably predict the isotopic concentrations of spent nuclear fuel. However, it is suitable for the first approximation calculations before using the numerical tools considering the 3D geometry of burnup system, e.g., Monte Carlo tools.
- (b)
- The obtained average (C/E)AV ratios show that a better consistency with the experimental measurements was obtained in the case of major actinides. The results for minor actinides are characterised by the average (C/E)AV ratios further to unity and by high standard deviations.
- (c)
- The less accurate results in average (C/E)AV ratios for Np, Am, and Cm isotopes may also originate from the higher experimental uncertainties for minor actinides.
- (d)
- The obtained numerical isotopic concentrations using the NFCSS system are rather underestimated compared to the experimental measurements, which leads to the average (C/E)AV ratios below unity and indicates the need for improvements in the NFCSS system.
- (e)
- The sources of inconsistencies between the experimental measurements and numerical simulations are related to the nature of the NFCSS system rather than to the erroneous results of the destructive assay.
- (f)
- The comparative analysis with the results of a more advanced numerical tool (SCALE) shows acceptable differences between both calculation systems, however, the standard deviations for NFCSS are higher.
- (g)
- The behaviour of the obtained average (C/E)AV ratios, regardless of the applied criteria, do not show any direct trends, which indicates the need for individual analysis of each fuel sample in a more comprehensive validation study.
- (h)
- In the case of some isotopes, especially 238U, the interquartile ranges and whiskers are small, mainly due to large atomic mass and small relative mass depletion with burnup.
- (i)
- The standardised methodology of the uncertainty assessment of the measured and calculated isotopic concentrations should be developed and applied in new irradiation, measurement and validation campaigns. This will provide a reliable basis for the final uncertainty assessment.
Funding
The financial support of this study under the scientific subvention 16.16.210.476 by the Polish Ministry of Science and Higher Education is kindly acknowledged.
Institutional Review Board Statement
Not applicable.
Informed Consent Statement
Not applicable.
Data Availability Statement
Not applicable.
Acknowledgments
The research was partially supported by PL Grid Infrastructure, available at the Academic Computer Centre CYFRONET AGH. In addition, partial financial support of this study under the scientific subvention 16.16.210.476 by the Polish Ministry of Science and Higher Education is kindly acknowledged.
Conflicts of Interest
The author declares no conflict of interest.
References
- The Organisation for Economic Cooperation and Development. Nuclear Energy Agency. Expert Group on Assay Data of Spent Nuclear Fuel. Available online: https://www.oecd-nea.org/jcms/pl_21515/sfcompo-2-0-spent-fuel-isotopic-composition (accessed on 24 February 2022).
- International Atomic Energy Agency. Nuclear Fuel Cycle Simulation System. Available online: https://infcis.iaea.org/NFCSS/About.cshtml (accessed on 24 February 2022).
- Michel-Sendis, F.; Gauld, I.; Martinez, J.S.; Alejano, C.; Bossant, M.; Boulanger, D.; Cabellos, O.; Chrapciak, V.; Conde, J.; Fast, I.; et al. SFCOMPO-2.0: An OECD NEA database of spent nuclear fuel isotopic assays, reactor design specifications, and operating data. Ann. Nucl. Energy 2017, 110, 779–788. [Google Scholar] [CrossRef]
- Gauld, I.C.; Williams, M.L.; Michel-Sendis, F.; Martinez, J.S. Integral nuclear data validation using experimental spent nuclear fuel compositions. Nucl. Eng. Technol. 2017, 49, 1226–1233. [Google Scholar] [CrossRef]
- Ilas, G.; Gauld, I.C.; Radulescu, G. Validation of new depletion capabilities and ENDF/B-VII data libraries in SCALE. Ann. Nucl. Energy 2012, 46, 43–55. [Google Scholar] [CrossRef]
- Francis, M.W.; Weber, C.F.; Pigni, M.T.; Gauld, I.C. Reactor Fuel Isotopics and Code Validation for Nuclear Applications. Oak Ridge National Laboratory. Reactor and Nuclear Systems Division; ORNL/TM-2014/464; Oak Ridge National Laboratory: Oak Ridge, TN, USA, 2014. [Google Scholar]
- Gauld, I.C.; Mertyurek, U. Validation of BWR Spent Nuclear Fuel Isotopic Predictions with Applications to Burnup Credit. Nucl. Eng. Des. 2019, 345, 110–124. [Google Scholar] [CrossRef]
- Price, D.; Radaideh, M.I.; Mui, T.; Katare, M.; Kozlowski, T. Multiphysics Modeling and Validation of Spent Fuel Isotopics Using Coupled Neutronics/Thermal-Hydraulics Simulations. Sci. Technol. Nucl. Install. 2020, 2020, 2764634. [Google Scholar] [CrossRef]
- Detkina, A.; Litskevitch, D.; Peakman, A.; Merk, B. Criticality Analysis for BWR Spent Fuel Based on the Burnup Credit Evaluation from Full Core Simulations. Appl. Sci. 2021, 11, 1498. [Google Scholar] [CrossRef]
- Detkina, A.; Litskevitch, D.; Peakman, A.; Merk, B. Burnup Credit Evaluation for BWR Spent Fuel from Full Core Calculations. Appl. Sci. 2020, 10, 7549. [Google Scholar] [CrossRef]
- Detkina, A.; Peakman, A.; Litskevich, D.; Liang, J.-H.; Merk, B. Evaluation of BWR Burnup Calculations Using Deterministic Lattice Codes SCALE-6.2, WIMS-10A and CASMO5. Energies 2020, 13, 2573. [Google Scholar] [CrossRef]
- Kashima, T.; Suyama, K.; Mochizuki, H. Validation of Burnup Calculation Code SWAT4 by Evaluation of Isotopic Composition Data of Mixed Oxide Fuel Irradiated in Pressurized Water Reactor. Energy Procedia 2015, 71, 159–167. [Google Scholar] [CrossRef] [Green Version]
- Yamamoto, T.; Suzuki, M.; Ando, Y.; Nagano, H. Analysis of measured isotopic compositions of high-burnup PWR MOX and UO2 fuels in the MALIBU program. J. Nucl. Sci. Technol. 2012, 49, 910–925. [Google Scholar] [CrossRef] [Green Version]
- Frankl, M.; Hursin, M.; Rochman, D.; Vasiliev, A.; Ferroukhi, H. Nuclear Data Uncertainty Quantification in Criticality Safety Evaluations for Spent Nuclear Fuel Geological Disposal. Appl. Sci. 2021, 11, 6499. [Google Scholar] [CrossRef]
- Vasiliev, A.; Herrero, J.; Pecchia, M.; Rochman, D.; Ferroukhi, H.; Caruso, S. Preliminary Assessment of Criticality Safety Constraints for Swiss Spent Nuclear Fuel Loading in Disposal Canisters. Materials 2019, 12, 494. [Google Scholar] [CrossRef] [PubMed] [Green Version]
- Oettingen, M.; Cetnar, J. Validation of gadolinium burnout using PWR benchmark specification. Nucl. Eng. Des. 2014, 273, 359–366. [Google Scholar] [CrossRef]
- Oettingen, M.; Cetnar, J. Comparative analysis between measured and calculated concentrations of major actinides using destructive assay data from Ohi-2 PWR. Nukleonika 2015, 60, 571–580. [Google Scholar] [CrossRef] [Green Version]
- International Atomic Energy Agency. Nuclear Fuel Cycle Simulation System: Improvements and Applications; IAEA-TECDOC-1864; International Atomic Energy Agency: Vienna, Austria, 2019. [Google Scholar]
- International Atomic Energy Agency. Nucleus Information Resource Portal. Available online: https://nucleus.iaea.org (accessed on 24 February 2022).
- Oettingen, M. Assessment of the Radiotoxicity of Spent Nuclear Fuel from a Fleet of PWR Reactors. Energies 2021, 14, 3094. [Google Scholar] [CrossRef]
- Cetnar, J.; Stanisz, P.; Oettingen, M. Linear Chain Method for Numerical Modelling of Burnup Systems. Energies 2021, 14, 1520. [Google Scholar] [CrossRef]
- Tavakkoli, E.; Zangian, M.; Minuchehr, A.; Zolfaghari, A. Development and Validation of ISOBURN, a New Depletion Code. Ann. Nucl. Energy 2021, 159, 108319. [Google Scholar] [CrossRef]
- Oettingen, M.; Cetnar, J.; Mirowski, T. The MCB code for numerical modelling of fourth generation nuclear reactors. Comput. Sci. 2015, 16, 329–350. [Google Scholar] [CrossRef]
- Stanisz, P.; Oettingen, M.; Cetnar, J. Development of a Trajectory Period Folding Method for Burnup Calculations. Energies 2022, 15, 2245. [Google Scholar] [CrossRef]
- Oettingen, M.; Stanisz, P. Monte Carlo modelling of Th-Pb fuel assembly with californium neutron source. Nukleonika 2018, 63, 87–91. [Google Scholar] [CrossRef] [Green Version]
Figure 1.
Scheme of the applied validation procedure.

Figure 2.
Average (C/E)AV ratios for samples with different enrichment.

Figure 3.
Average (C/E)AV ratios for samples with burnup below 40 GWd/tHM.

Figure 4.
Average (C/E)AV ratios for samples with burnup above 40 GWd/tHM.

Figure 5.
Average (C/E)AV ratios for samples from three Japanese and one US nuclear power plant.

Figure 6.
Average (C/E)AV ratios for samples from the US nuclear power plants.

Figure 7.
Average (C/E)AV ratios for samples from the European nuclear power plants.


Table 1.
Number of measurements for each actinide for defined enrichment and burnup intervals.
| Isotope | Enrichment [wt.%] | Burnup [GWd/tUi] | Total | UAV [%] | ||||||||
|---|---|---|---|---|---|---|---|---|---|---|---|---|
| 3.0< | 3.0–4.0 | >4.0 | 10< | 10–20 | 20–30 | 30–40 | 40–50 | 50–60 | 60< | |||
| 235U | 74 | 142 | 53 | 14 | 51 | 88 | 58 | 28 | 19 | 11 | 269 | 1.67 |
| 236U | 74 | 140 | 50 | 14 | 51 | 88 | 56 | 28 | 18 | 9 | 264 | 2.23 |
| 238U | 74 | 142 | 48 | 14 | 51 | 88 | 58 | 26 | 19 | 8 | 264 | 0.31 |
| 237Np | 19 | 30 | 44 | 7 | 10 | 25 | 12 | 13 | 18 | 8 | 93 | 6.78 |
| 238Pu | 60 | 75 | 49 | 6 | 22 | 75 | 39 | 15 | 19 | 8 | 184 | 5.31 |
| 239Pu | 74 | 142 | 53 | 14 | 51 | 88 | 58 | 28 | 19 | 11 | 269 | 1.98 |
| 240Pu | 74 | 141 | 53 | 14 | 51 | 88 | 57 | 28 | 19 | 11 | 268 | 2.25 |
| 241Pu | 74 | 141 | 49 | 14 | 51 | 88 | 57 | 27 | 19 | 8 | 264 | 2.24 |
| 242Pu | 74 | 141 | 47 | 14 | 51 | 88 | 57 | 27 | 19 | 6 | 262 | 2.88 |
| 241Am | 33 | 41 | 44 | 3 | 11 | 47 | 24 | 10 | 15 | 8 | 118 | 18.17 |
| 242mAm | 15 | 26 | 25 | 3 | 6 | 30 | 14 | 4 | 9 | 0 | 66 | 14.33 |
| 243Am | 16 | 38 | 53 | 3 | 6 | 43 | 15 | 10 | 19 | 11 | 107 | 19.03 |
| 242Cm | 32 | 46 | 12 | 3 | 9 | 48 | 22 | 4 | 4 | 0 | 90 | 33.38 |
| 244Cm | 35 | 48 | 25 | 3 | 11 | 50 | 24 | 6 | 6 | 8 | 108 | 11.84 |
Table 2.
Number of measurements for the Japanese reactors.
| Isotope | Japan | Total | ||||
|---|---|---|---|---|---|---|
| Takahama-3 | Miham-3 | Ohi-1 | Ohi-2 | Genkai-1 | ||
| 235U | 16 | 9 | 1 | 5 | 2 | 33 |
| 236U | 16 | 9 | 1 | 5 | 0 | 31 |
| 238U | 16 | 9 | 1 | 5 | 2 | 33 |
| 237Np | 11 | 5 | 1 | 5 | 1 | 23 |
| 238Pu | 16 | 9 | 1 | 5 | 2 | 33 |
| 239Pu | 16 | 9 | 1 | 5 | 2 | 33 |
| 240Pu | 16 | 9 | 1 | 5 | 2 | 33 |
| 241Pu | 16 | 9 | 1 | 5 | 2 | 33 |
| 242Pu | 16 | 9 | 1 | 5 | 2 | 33 |
| 241Am | 16 | 9 | 1 | 5 | 2 | 33 |
| 242mAm | 16 | 7 | 1 | 5 | 1 | 30 |
| 243Am | 16 | 9 | 1 | 5 | 1 | 32 |
| 242Cm | 16 | 8 | 1 | 5 | 0 | 30 |
| 244Cm | 16 | 9 | 1 | 5 | 1 | 32 |
Table 3.
Number of measurements for the US reactors.
| Isotope | USA | Total | ||||
|---|---|---|---|---|---|---|
| Three Mile Island-1 | Turkey Point-3 | H.B. Robinson-2 | Yankee-1 | Calvert Cliffs-1 | ||
| 235U | 24 | 13 | 7 | 78 | 9 | 131 |
| 236U | 24 | 13 | 7 | 78 | 9 | 131 |
| 238U | 24 | 13 | 7 | 78 | 9 | 131 |
| 237Np | 24 | 0 | 5 | 17 | 9 | 55 |
| 238Pu | 24 | 13 | 7 | 23 | 9 | 76 |
| 239Pu | 24 | 13 | 7 | 78 | 9 | 131 |
| 240Pu | 24 | 13 | 7 | 77 | 9 | 130 |
| 241Pu | 24 | 13 | 7 | 77 | 9 | 130 |
| 242Pu | 24 | 13 | 7 | 77 | 9 | 130 |
| 241Am | 19 | 0 | 1 | 0 | 9 | 29 |
| 242mAm | 13 | 0 | 0 | 0 | 0 | 13 |
| 243Am | 24 | 0 | 1 | 0 | 0 | 25 |
| 242Cm | 0 | 0 | 1 | 0 | 0 | 1 |
| 244Cm | 0 | 0 | 1 | 0 | 0 | 1 |
Table 4.
Number of measurements for the European reactors.
| Isotope | Germany | Spain | Italy | Switzerland | Total | |
|---|---|---|---|---|---|---|
| Neckerwestheim-2 | Obrigheim-1 | Vandellos-2 | Trino Vercellese-1 | Gosgen-1 | ||
| 235U | 1 | 36 | 15 | 49 | 4 | 105 |
| 236U | 1 | 36 | 12 | 49 | 4 | 102 |
| 238U | 1 | 36 | 10 | 49 | 4 | 100 |
| 237Np | 1 | 0 | 11 | 0 | 3 | 15 |
| 238Pu | 1 | 36 | 11 | 23 | 4 | 75 |
| 239Pu | 1 | 36 | 15 | 49 | 4 | 105 |
| 240Pu | 1 | 36 | 15 | 49 | 4 | 105 |
| 241Pu | 1 | 36 | 11 | 49 | 4 | 101 |
| 242Pu | 1 | 36 | 9 | 49 | 4 | 99 |
| 241Am | 1 | 28 | 11 | 12 | 4 | 56 |
| 242mAm | 1 | 7 | 0 | 13 | 2 | 23 |
| 243Am | 1 | 17 | 15 | 13 | 4 | 50 |
| 242Cm | 1 | 33 | 0 | 23 | 2 | 59 |
| 244Cm | 1 | 36 | 11 | 23 | 4 | 75 |
Table 5.
Results of burnup validation for all samples and isotopes.
| Isotope | No of Samples | Mean (C/E)AV | Standard Deviation | Median (C/E)AV | Minimum | Maximum | 1st Quartile | 3th Quartile | 10th Percentile | 90th Percentile |
|---|---|---|---|---|---|---|---|---|---|---|
| 235U | 269 | 0.90 | 0.14 | 0.94 | 0.48 | 1.49 | 0.81 | 0.98 | 0.73 | 1.01 |
| 236U | 264 | 0.95 | 0.06 | 0.96 | 0.60 | 1.08 | 0.92 | 0.98 | 0.87 | 1.00 |
| 238U | 264 | 1.00 | 0.01 | 1.00 | 0.93 | 1.04 | 1.00 | 1.00 | 1.00 | 1.01 |
| 237Np | 92 | 1.01 | 0.22 | 1.02 | 0.55 | 1.66 | 0.85 | 1.13 | 0.76 | 1.28 |
| 238Pu | 183 | 0.77 | 0.19 | 0.80 | 0.40 | 1.49 | 0.60 | 0.91 | 0.52 | 0.98 |
| 239Pu | 269 | 0.88 | 0.14 | 0.87 | 0.61 | 1.21 | 0.79 | 1.02 | 0.69 | 1.07 |
| 240Pu | 268 | 1.04 | 0.09 | 1.05 | 0.72 | 1.34 | 1.00 | 1.10 | 0.94 | 1.14 |
| 241Pu | 264 | 0.90 | 0.33 | 0.84 | 0.26 | 2.25 | 0.69 | 1.06 | 0.55 | 1.28 |
| 242Pu | 262 | 0.71 | 0.18 | 0.75 | 0.20 | 1.39 | 0.57 | 0.84 | 0.45 | 0.89 |
| 241Am | 118 | 0.29 | 0.31 | 0.17 | 0.01 | 1.41 | 0.08 | 0.44 | 0.06 | 0.83 |
| 242mAm | 66 | 0.64 | 0.45 | 0.58 | 0.06 | 2.21 | 0.28 | 0.86 | 0.14 | 1.26 |
| 243Am | 107 | 0.81 | 0.35 | 0.81 | 0.22 | 2.08 | 0.53 | 1.00 | 0.40 | 1.20 |
| 242Cm | 78 | 0.41 | 0.26 | 0.35 | 0.06 | 1.13 | 0.17 | 0.58 | 0.14 | 0.80 |
| 244Cm | 108 | 0.70 | 0.44 | 0.58 | 0.14 | 2.42 | 0.43 | 0.74 | 0.34 | 1.22 |
Table 6.
Summary of NFCSS modelling.
| Isotope | NFCSS | NFCSS | ||||
|---|---|---|---|---|---|---|
| Chosen Samples | All Samples | |||||
| Samples | (C/E)AV | σ | Samples | (C/E)AV | σ | |
| 235U | 123 | 0.97 | 0.07 | 269 | 0.90 | 0.14 |
| 236U | 123 | 0.93 | 0.06 | 264 | 0.95 | 0.06 |
| 238U | 123 | 1.001 | 0.003 | 264 | 1.00 | 0.01 |
| 237Np | 32 | 1.09 | 0.25 | 92 | 1.01 | 0.22 |
| 238Pu | 97 | 0.74 | 0.19 | 184 | 0.77 | 0.19 |
| 239Pu | 123 | 0.95 | 0.11 | 269 | 0.88 | 0.14 |
| 240Pu | 123 | 1.08 | 0.08 | 268 | 1.04 | 0.09 |
| 241Pu | 123 | 0.91 | 0.28 | 264 | 0.90 | 0.33 |
| 242Pu | 123 | 0.68 | 0.18 | 262 | 0.71 | 0.18 |
| 241Am | 69 | 0.31 | 0.30 | 118 | 0.29 | 0.31 |
| 243Am | 53 | 0.68 | 0.33 | 107 | 0.81 | 0.35 |
| 244Cm | 71 | 0.52 | 0.18 | 108 | 0.70 | 0.44 |
Table 7.
Differences in (C/E)AV for SCALE and NFCSS modelling.
| Isotope | ΔSAMPLES | ΔSCALE | Δ(C/E)AV | |||||||
|---|---|---|---|---|---|---|---|---|---|---|
| NCH | NAL | S61 | S51 | S61-NCH | S61-NAL | S51-NCH | S51-NAL | S61-S51 | NCH-NAL | |
| 235U | 31 | 177 | 1.19% | 0.30% | 4.46% | 10.60% | 3.61% | 9.80% | 0.89% | 6.43% |
| 236U | 46 | 187 | −1.94% | −1.32% | 4.69% | 3.54% | 5.27% | 4.12% | −0.61% | −1.22% |
| 238U | 31 | 172 | −0.10% | −0.10% | −0.16% | −0.06% | −0.16% | −0.06% | negl | 0.10% |
| 237Np | −4 | 56 | 3.75% | 6.72% | −4.71% | 2.47% | −1.49% | 5.47% | −3.18% | 6.85% |
| 238Pu | 20 | 107 | −13.25% | −9.41% | 16.36% | 12.31% | 19.20% | 15.28% | −3.51% | −4.84% |
| 239Pu | 31 | 177 | 3.94% | 2.91% | 9.14% | 15.03% | 8.17% | 14.12% | 1.06% | 6.48% |
| 240Pu | 31 | 176 | 2.15% | 1.86% | −5.74% | −2.12% | −6.05% | −2.42% | 0.29% | 3.42% |
| 241Pu | 31 | 172 | −1.42% | −2.56% | 8.17% | 8.47% | 7.13% | 7.43% | 1.12% | 0.32% |
| 242Pu | 32 | 171 | −6.27% | −1.63% | 28.25% | 24.64% | 31.39% | 27.93% | −4.57% | −5.04% |
| 241Am | 30 | 79 | 9.26% | 7.83% | 72.30% | 73.24% | 71.86% | 72.82% | 1.54% | 3.40% |
| 243Am | 15 | 69 | 2.82% | 10.39% | 34.37% | 21.26% | 39.48% | 27.40% | −8.45% | −19.97% |
| 244Cm | 14 | 51 | −4.60% | −1.42% | 45.35% | 27.04% | 47.02% | 29.26% | −3.14% | −33.50% |
S61—SCALE6.1 modelling, S51—SCALE5.1 modelling, NCH—difference between number of chosen fuel samples used in NFCSS and SCALE validation, NAL—difference between number of all fuel samples used in NFCSS and SCALE validation, (S61-NCH) and (S61-NAL)—differences between SCALE6.1 and NFCSS results, (S51-NCH) and (S51-NAL)—differences between SCALE5.1 and NFCSS results, (S61-S51)—differences between SCALE6.1 and SCALE51 results, (NCH-NAL)—differences between NFCSS results.
Publisher’s Note: MDPI stays neutral with regard to jurisdictional claims in published maps and institutional affiliations. |
© 2022 by the author. Licensee MDPI, Basel, Switzerland. This article is an open access article distributed under the terms and conditions of the Creative Commons Attribution (CC BY) license (https://creativecommons.org/licenses/by/4.0/).
Share and Cite
MDPI and ACS Style
Oettingen, M. The Application of Radiochemical Measurements of PWR Spent Fuel for the Validation of Burnup Codes. Energies 2022, 15, 3041. https://0-doi-org.brum.beds.ac.uk/10.3390/en15093041
AMA Style
Oettingen M. The Application of Radiochemical Measurements of PWR Spent Fuel for the Validation of Burnup Codes. Energies. 2022; 15(9):3041. https://0-doi-org.brum.beds.ac.uk/10.3390/en15093041
Chicago/Turabian StyleOettingen, Mikołaj. 2022. "The Application of Radiochemical Measurements of PWR Spent Fuel for the Validation of Burnup Codes" Energies 15, no. 9: 3041. https://0-doi-org.brum.beds.ac.uk/10.3390/en15093041
Note that from the first issue of 2016, this journal uses article numbers instead of page numbers. See further details here.