
Studying the Bond Performance of Full-Grouting Rock Bolts Based on the Variable Controlling Method


1
State Key Laboratory of Coal Resources in Western China, Xi’an University of Science and Technology, Xi’an 710054, China
2
Shaanxi Key Laboratory of Geotechnical and Underground Space Engineering, Xi’an University of Architecture and Technology, Xi’an 710055, China
3
School of Energy and Mining Engineering, China University of Mining and Technology (Beijing), Beijing 100083, China
*
Authors to whom correspondence should be addressed.
Energies 2022, 15(9), 3157; https://0-doi-org.brum.beds.ac.uk/10.3390/en15093157
Submission received: 22 February 2022
/
Revised: 27 March 2022
/
Accepted: 19 April 2022
/
Published: 26 April 2022
(This article belongs to the Special Issue Rock Burst Disasters in Coal Mines)
Abstract
:This paper studied the bond performance of full-grouting rock bolts with a theoretical analysis. The variable controlling method was used to study the effect of parameters on the load-carrying force of bars. The results showed that when the bar diameter grew from 15 mm to 25 mm, the maximum force of the bars rose from 194 kN to 349 kN, growing by 80%. As for the stiffness, it grew by 108%. Moreover, when the elastic modulus grew from 50 GPa to 200 GPa, the maximum force rose from 229 kN to 269 kN, only growing by 17%. As for the stiffness, it grew by 100%. When the grouting length increased from 2 m to 3 m, the maximum force rose from 269 kN to 364 kN, growing by 35%. However, the grouting length had almost no effect on the stiffness. Lastly, for the bond slip when the bond strength was reached, when it grew from 1 mm to 3 mm, the maximum force dropped from 281 kN to 258 kN, dropping by 8%. As for the stiffness, it dropped by 44%. This paper is conducive to enriching the base of knowledge.
1. Introduction
Full-grouting rock bolting is commonly used in roadway reinforcement, in particular in mining and tunnelling reinforcement [1]. Because of its advantages in significantly reinforcing resistance and effectively improving the self-bearing capacity of rock masses, rock bolting has been widely applied in rock and soil reinforcement [2].
However, in situ practice results showed that failure of the reinforcement system still occurred [3]. Previous research summarised that the failing of the reinforcement system could be caused by bolt rupture or bond failure [4]. It is more common to encounter bond failure at the boundary surface between bars and grout [5]. The reason is that the bond stress at the boundary surface between bars and grout is beyond the bond strength [6]. More importantly, it is highly related to the bond capacity of bars [7].
To study the bond mechanism of rock bolts, numerous techniques have been used, such as laboratory tests, analytical modelling, numerical simulation, and engineering practices [8]. For example, Zhang et al. [9] conducted in situ tests on gob-side roadways to monitor the loading state of bars under the thick coal seam mining condition. Skrzypkowski et al. [10] performed laboratory pulling tests on bars with different diameters to compare the performance of bars. Chen et al. [11] used the experimental approach to study the anchorage performance of bars installed in a bedded rock mass. Chen and Li [12] adopted the modified elements to study the interaction between bars and in situ rock masses.
Among those methods, analytical modelling has the advantage that it can effectively reveal the bond course between bars and rock masses subjected to loading [13]. Therefore, this paper studied the bond capacity of bars based on analytical modelling.
In analytical modelling, former investigators performed numerous investigations regarding the bond capacity of bars [14]. Wang et al. [15] analysed the coupling effect of bars installed in rock masses. Zou and Zhang [16] used a non-linear equation to illustrate the debonding behaviour of the boundary surface between bars and grout. Ren et al. [17] studied the shear failure course of the boundary surface between bars and grout. Zheng et al. [18] studied the reinforcing system composed of bars and rock masses. Ma et al. [19] established the distributing link of the bond stress at the boundary surface between bars and grout. He et al. [20] deduced the interaction link between the tensile stress in bars and the bond stress after bars were loaded. Saleem [21] developed an analytical model to study the bond performance of bars under the impact loading condition. The superiority of their model was that it could be used to predict the bond performance of different bar types. Lv et al. [22] deduced the load-carrying force of cables based on an elastoplastic model. Wang et al. [23] developed a three-dimensional model to study the bond performance of full-grouting bars based on a closed tri-linear relationship. Their results showed that there was a critical grouting length. Zhang et al. [24] considered the mutual interaction link between bars and grout. Saleem and Hosoda [25] employed the Latin Hypercube sampling approach to analyse the test data regarding several full-grouting bars. Their findings showed that grouting length had a greater effect on the load-carrying force of bars compared with bar diameter.
The aforementioned analytical modelling research successfully revealed the coupling link between bars and rock masses. However, much less work has been performed to quantitatively study the influence of parameters on the bond performance of full-grouting bars. Moreover, little work has been conducted to quantitatively examine the bond stress distribution at the boundary surface between bars and grout.
To overcome these shortcomings, this paper used the new analytical model developed by the authors to quantitatively examine the bond performance of full-grouting rock bolts [26]. The originality of this paper is that it used the newly developed analytical model to quantitatively examine the bond performance of full-grouting bars. Moreover, relying on this analytical model, the bond stress distribution at the boundary surface between bars and grout was quantitatively studied.
In this paper, first, the calculating principle of this analytical model was illustrated. Then, this analytical model was used to calculate and analyse the load-carrying force of bars. The effect of four different parameters on the load-carrying force of bars and the bond stress distributing state was studied. This study is conducive to enriching the base of knowledge.
2. Calculating Principle of the Constitutive Equation
The authors of this paper previously conducted a theoretical analysis on the load-carrying force of bars. During modelling, the shear course of the boundary surface was simulated with a tri-linear equation (Figure 1) [26].
where τ is the bond stress at the boundary surface, k is the slope of the tri-linear equation, δ is the bond slip of the boundary surface, and τ’ is the compensating stress.
τ = kδ + τ’
The tri-linear equation was revised from the elastic perfectly plastic model and the bi-linear model. However, the shortcoming of the elastic perfectly plastic model was that it neglected the post-failure performance of the boundary surface. As for the bi-linear model, its shortcoming was that it did not consider the residual shear strength of the boundary surface [27]. Therefore, in a combination of those two models, the tri-linear equation was used.
The tri-linear equation assumed that the bond stress of the boundary surface grew linearly with the bond slip. When the bond slip grew to a specific value, the bond stress reached the bond strength. After that, with the continuous growth of the bond slip, the bond stress at the boundary surface decreased to the residual shear strength [28]. Lastly, with the further growth of the bond slip, the bond stress at the boundary surface remained constant, equalling the residual shear strength.
The credibility of the tri-linear equation was confirmed by previous experimental research. For example, Benmokrane et al. [29] conducted pulling tests on full-grouting bars to study the bond behaviour of the boundary surface. Their results showed that after the peak, the shear stress at the boundary surface dropped gradually. Moreover, with the slipping further growing, the shear stress was likely to be constant. Based on this phenomenon, this paper used the tri-linear equation to depict the bond behaviour of the boundary surface.
Then, this tri-linear equation was incorporated into the anchorage body, and a governing equation was developed, as calculated with Equation (2).
d2δ(x)/dx2 − λ2τ(x) = 0
In this equation, the coefficient of λ can be expressed with Equation (3):
where D is the bar diameter, E1 is the elastic modulus of the bars, E2 is the elastic modulus of the rock masses, and A is the cross-sectional area of the rock masses.
λ2 = 4(1/DE1 + πD/(4E2A))
With the loading of the bars, the boundary surface successively experienced five stages, including the elastic stage, the elastic-weakening stage, the elastic-weakening-friction stage, the weakening-friction stage, and the friction stage [30]. Then, an analysis was conducted on the tensile stress in the bars and the bond stress on the boundary surface during those five stages. Therefore, the equations describing the tensile stress distribution of the bars and the bond stress spread at the boundary surface were obtained. The loading terminal of the bars was regarded as the research objective. Then, the link between the load-carrying force and the loading displacement of the bars was obtained.
3. Parameter Study
The input parameters of this model included bar diameter, bar modulus, grouting length, the modulus of the rock masses, the cross-sectional area of the rock masses, and the properties of the boundary surface. Then, this paper studied the effects of relevant parameters on the load-carrying force of the bars.
3.1. Bar Diameter
In this section, it was assumed that the bar diameter was 20 mm and that the modulus of the bars was 200 GPa. The grouting length was 2 m. As for the rock masses, the modulus was 15 GPa, and the cross-sectional area was 0.5 m2. These parameters are tabulated in Table 1.
More importantly, the properties of the boundary surface determined the bond capacity of the bars. They were tabulated in Table 2.
To study the effect of bar diameter on the load-carrying force, besides the bar diameter used in Table 1, two other bar diameters were used: 15 mm and 25 mm. During the pulling course, the load-carrying force and loading displacement at the loading terminal were recorded. Then, the bond capacity under the loading condition was obtained (Figure 3). It shows that bar diameter significantly affected the load-carrying force of the bars. When three different bar diameters were used, the maximum force was 194 kN, 269 kN, and 349 kN. With the growth of the bar diameter, the maximum force grew significantly. This finding was consistent with the experimental test results obtained by Kilik et al. [32]. Moreover, it shows that the stiffness of the anchorage body grew. When the bar diameter was 15 mm, the initial stiffness of the anchorage body was 50 kN/mm. However, when the bar diameter grew to 25 mm, the stiffness of the anchorage body grew to 104 kN/mm.
Moreover, this finding also shows that the bar diameter had specific effect on the post-failure performance of the reinforcement system. For instance, when the bar diameter was small, such as 15 mm, after the bars reached their maximum force, the loading displacement showed an apparent snapback phenomenon. This was because the boundary surface entered the weakening-friction stage. Moreover, it resulted directly from the continuous growth of the friction length. This phenomenon also occurred in previous research [33]. By contrast, when the bar diameter was relatively larger, such as 25 mm, after the bars reached their maximum force, this snapback phenomenon was not apparent.
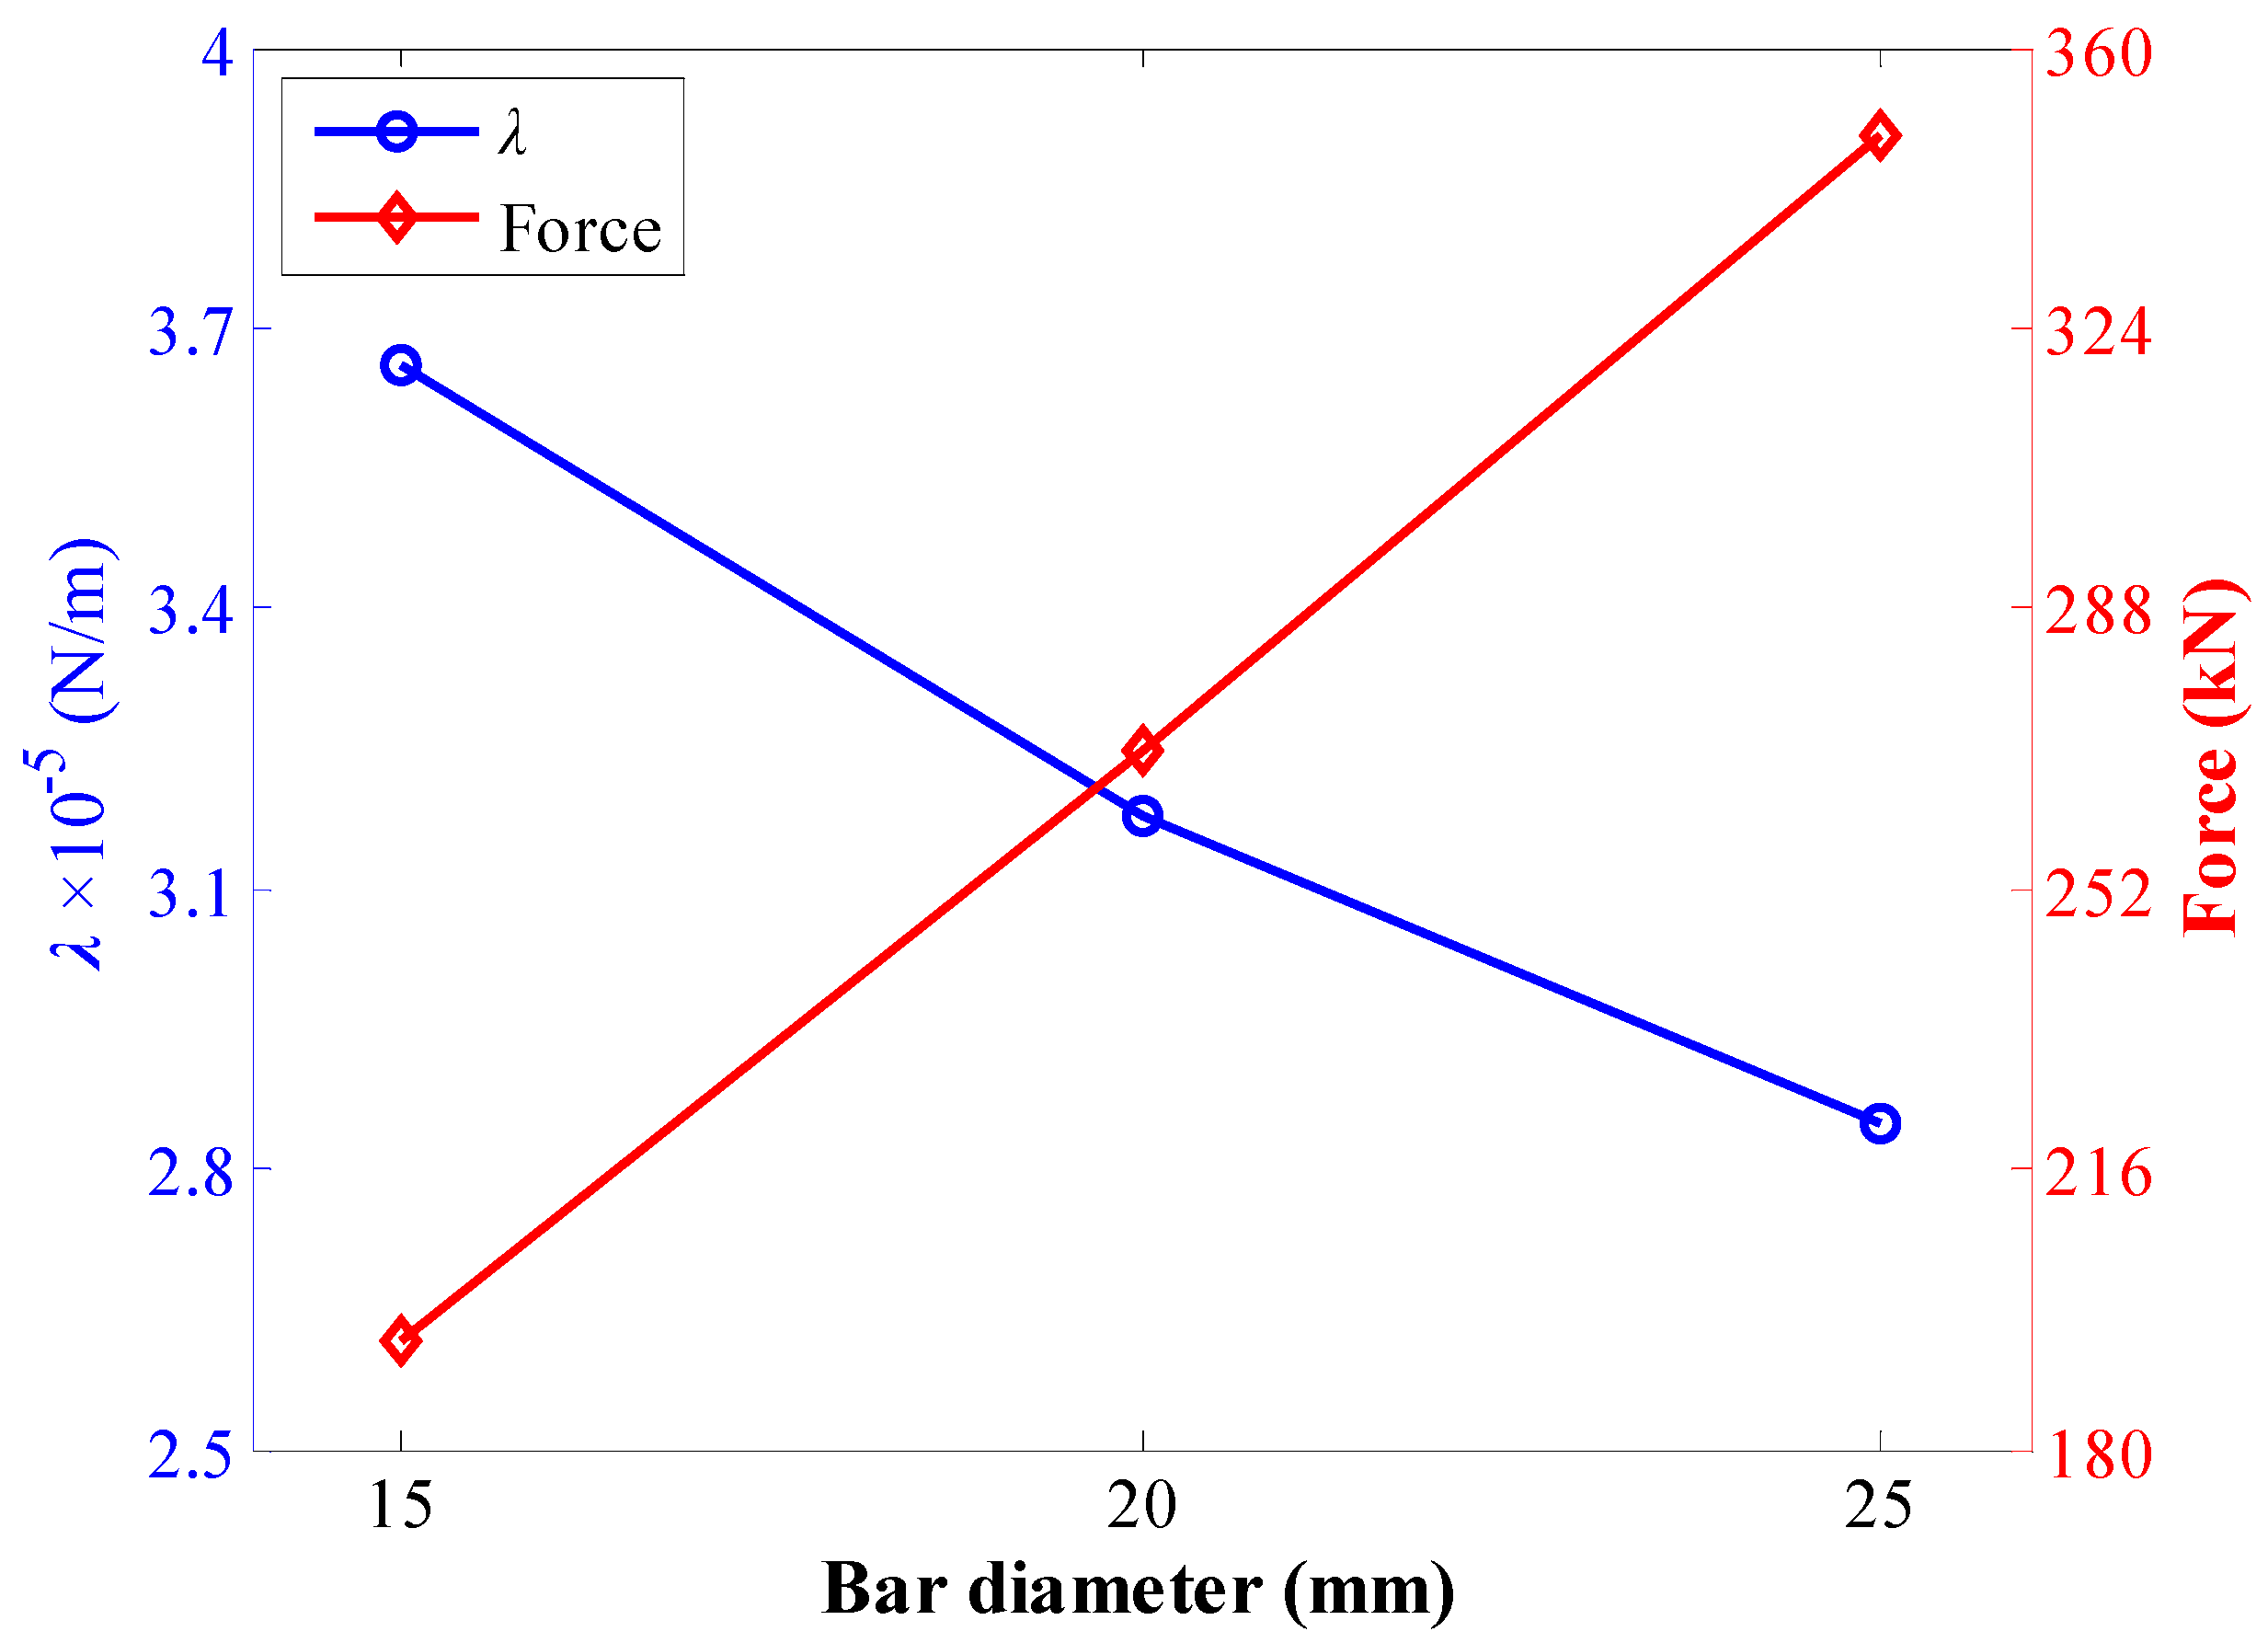
Additionally, the relationship between the maximum force of the bars and λ was analysed. With bar diameter growing, the corresponding λ dropped from 3.66 × 10⁻⁵ N/m to 2.85 × 10⁻⁵ N/m (Figure 4). As for the maximum force of the bars, it grew directly. Therefore, there was a negative relationship between the maximum force of the bars and λ.
This paper mainly focused on the maximum force of the bars. Therefore, when the bars with three different diameters reached their maximum force, the bond stress distribution of the boundary surface was examined (Figure 5). It shows that when the bars with the three aforementioned different diameters reached their maximum force, the bond stress at the boundary surface was in the elastic-weakening-friction stage.
Furthermore, for bars with a smaller diameter, when the maximum force was reached, the length of the friction section was larger. For instance, when the bar diameter was 15 mm, the corresponding friction length was 828 mm. However, when the bar diameter was 25 mm, the friction length dropped to 493 mm. This was related to the reinforcement stiffness of the anchorage body. When the bar diameter was small, the reinforcement stiffness was also slight. Therefore, to reach the maximum force, a relatively large loading displacement was needed. However, under the effect of the large loading displacement, the boundary surface experienced a rather large bond slip. Then, the friction length grew.
3.2. Elastic Modulus of Bars
In the in situ condition, rock bolts with different moduli may be used. For instance, in the permanent reinforcement, steel bars with a modulus of 200 GPa were always used. However, for a roadway along the working face side, fibre-reinforced polymer bars with a modulus of 50 GPa may be used.
Therefore, the modulus of the bars was regarded as the research objective. The purpose was to analyse its effect on the load-carrying force of the bars. In this section, a calculation was conducted on bars with a diameter of 20 mm. To study the effect of the modulus of the bars, three pulling analyses were conducted. The corresponding moduli of the bars were 50 GPa, 100 GPa, and 200 GPa. The other input parameters were the same as the values used in Section 3.1. The compared results of the three pulling tests are shown in Figure 6. It shows that the elastic modulus of the bars significantly affected the pre-peak and post-peak performance of the full-grouting bars. Firstly, with the modulus of the bars growing from 50 GPa to 200 GPa, the maximum force grew from 229 kN to 269 kN, growing by 17%. This indicates that, although increasing the modulus of the bars was conducive to improving the bond performance of the bars, this impact was not significant. Secondly, the modulus of the bars had a significant impact on the initial stiffness of the anchorage body. Specifically, when the modulus of the bars was 50 GPa, the corresponding initial stiffness of the anchorage body was 38 kN/m. When the modulus of the bars grew to 200 GPa, the corresponding initial stiffness of the anchorage body was 76 kN/m, growing by 100%. Therefore, the larger the modulus of the bars, the greater the stiffness of the anchorage body.
Thirdly, the modulus of the bars significantly influenced the loading displacement where the maximum force of the bars was reached. For example, when bars with a modulus of 50 GPa were tested, the loading displacement at the peak force was 18.1 mm. When the modulus of the bars grew to 100 GPa, the loading displacement at the peak force dropped to 10.6 mm. When bars with a modulus of 200 GPa were tested, the loading displacement dropped to 6.49 mm. Therefore, the loading displacement at the peak force significantly dropped with the modulus of the bars. Lastly, the modulus of the bars influenced the post-peak performance of the bars. When the modulus of the bars was 50 GPa, after the peak load, there was a gradual drop in the load-carrying force. By contrast, when the modulus of the bars grew to 200 GPa, after the peak force, the load-carrying force dropped dramatically.
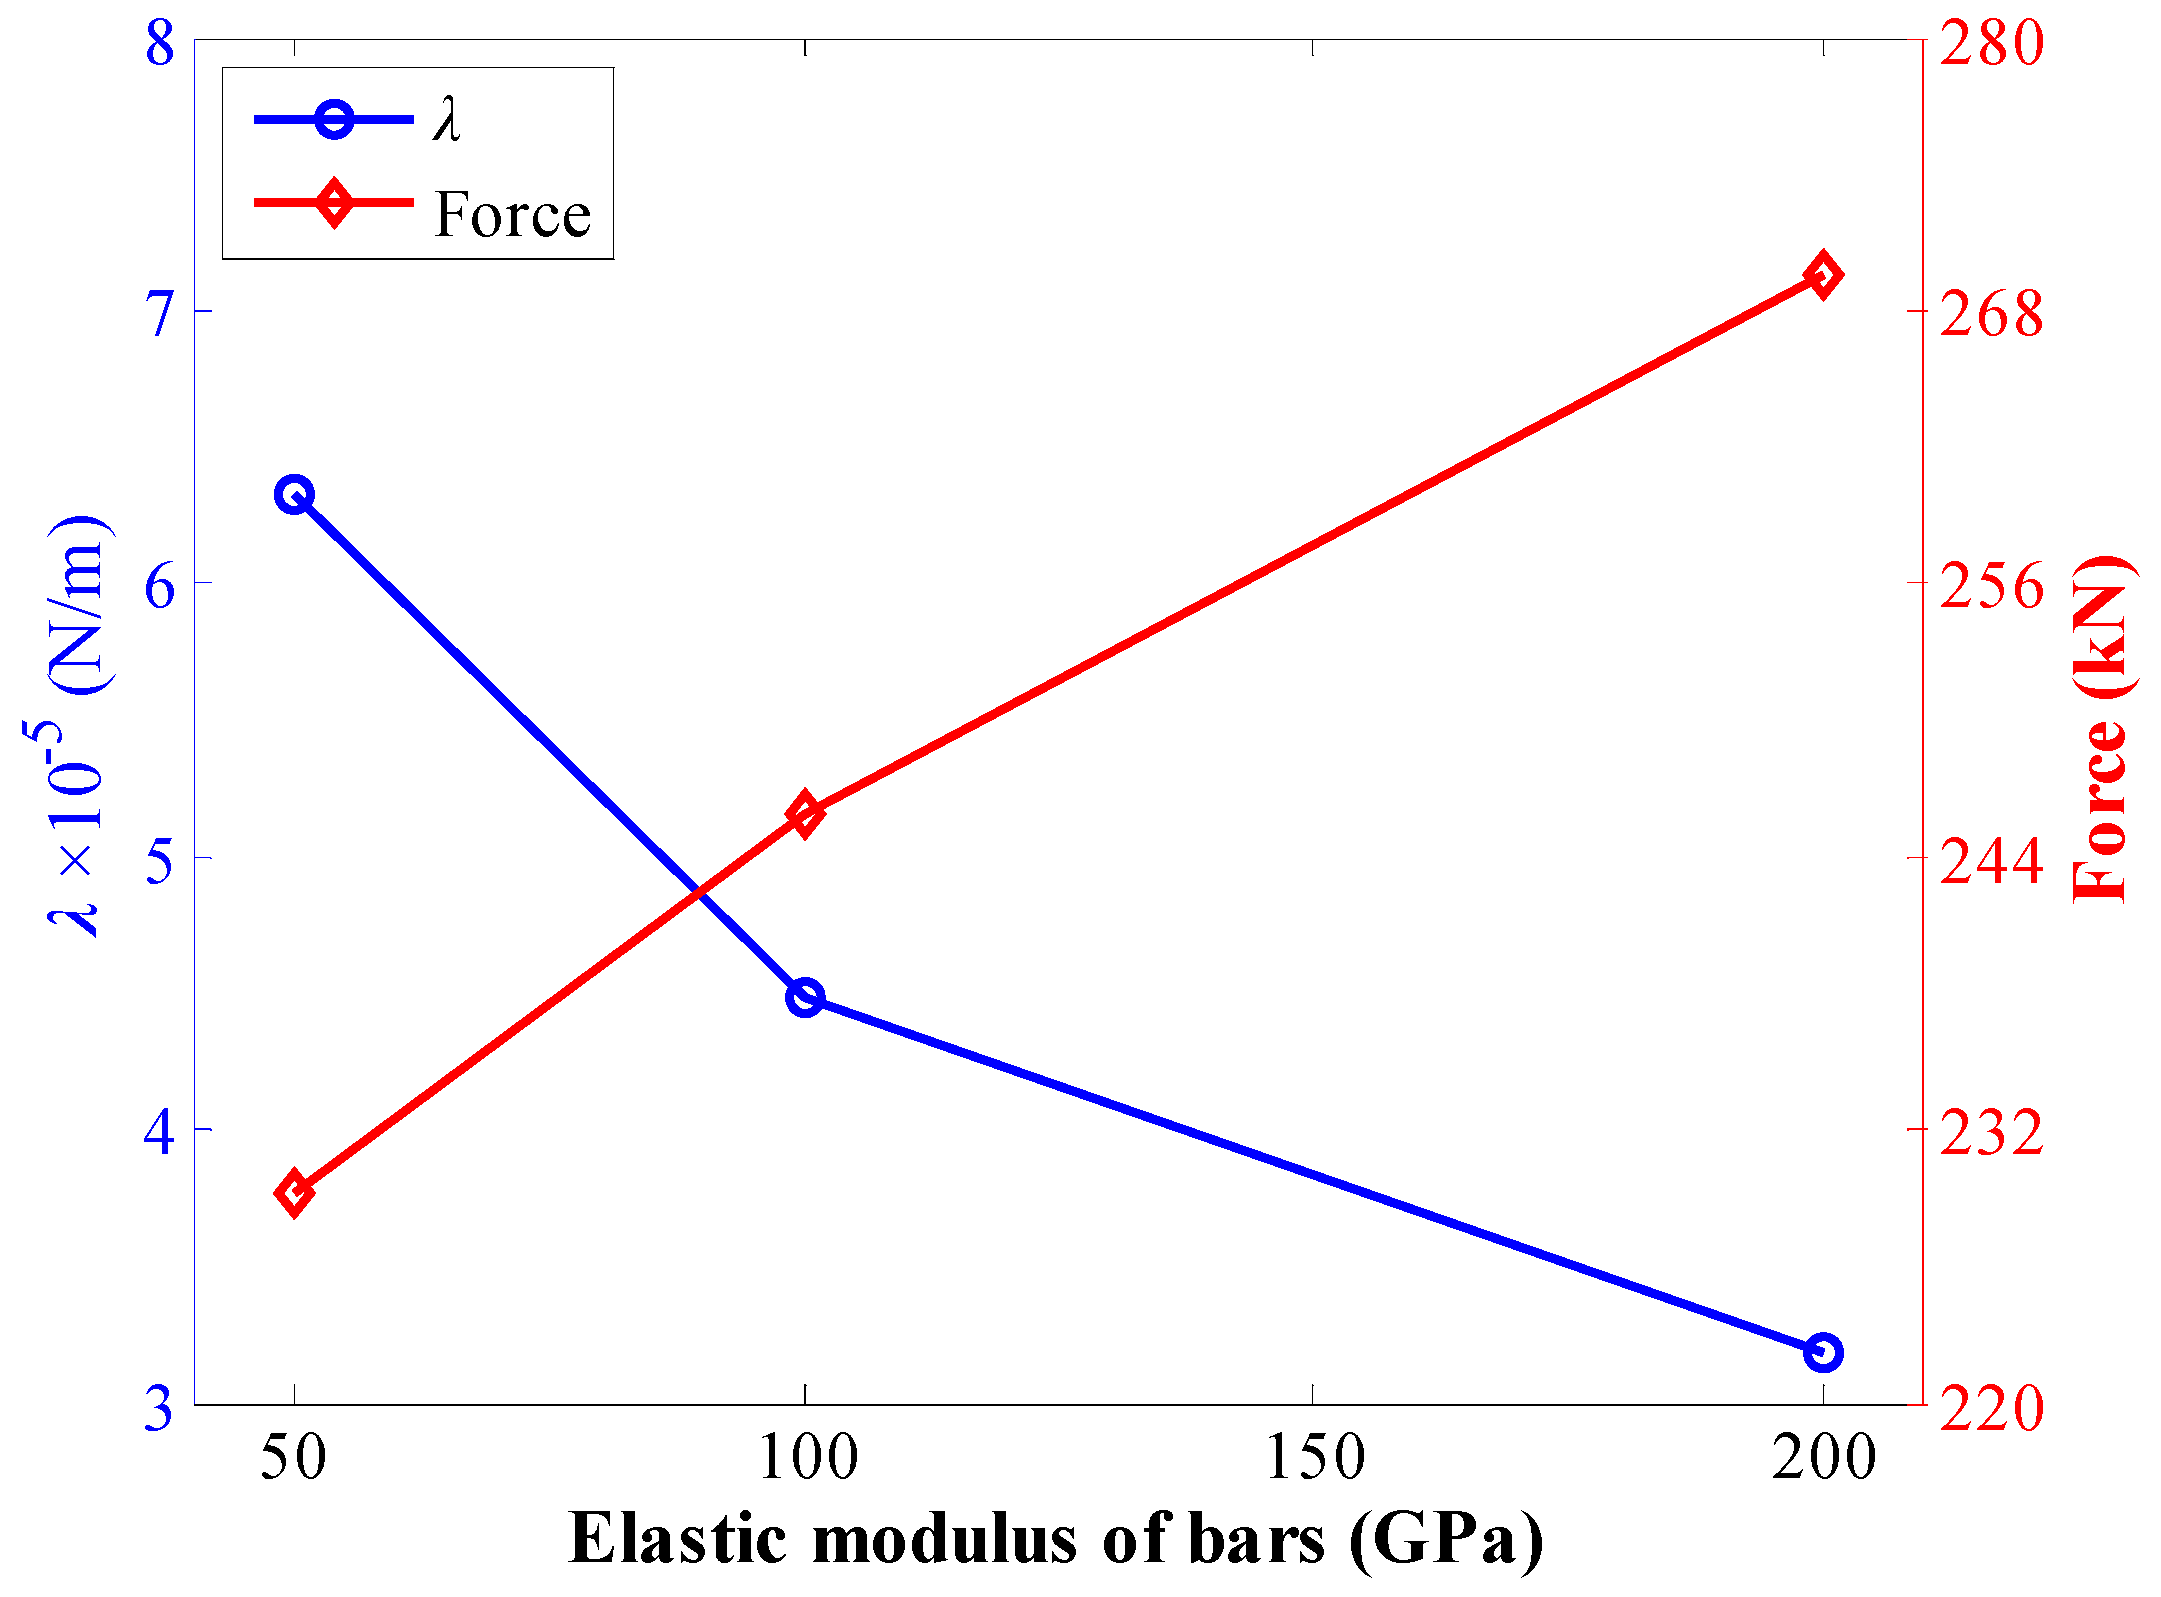
Moreover, the relationship between the maximum force of the bars and λ was analysed. In this case, λ dropped from 6.33 × 10⁻⁵ N/m to 3.18 × 10⁻⁵ N/m (Figure 7). By contrast, the maximum force of the bars grew. Therefore, for this case, the smaller the λ, the larger the maximum force of the bars.
When the bars reached their maximum force, the bond stress distribution at the boundary surface was examined (Figure 8). The modulus of the bars had a significant effect on the bond stress distribution at the boundary surface. When the modulus of the bars was small, the friction length of the boundary surface was relatively large. For instance, when the modulus of the bars was 50 GPa, the friction length of the boundary surface was 1322 mm. However, when the modulus of the bars was 200 GPa, the friction length of the boundary surface was 648 mm. This was because, when the modulus of the bars was small, the stiffness of the reinforcement system was relatively small. Therefore, after a rather large displacement, the bars finally reached the maximum force. Moreover, when a large loading displacement was generated, the boundary surface experienced relatively significant bond slip. Therefore, the friction length was relatively large.
3.3. Grouting Length of Bars
In engineering practices, the grouting length can be significantly different [34]. Therefore, in this section, the effect of grouting length on the load-carrying force of bars was studied. The calculation was conducted on bars with a diameter of 20 mm and a modulus of 200 GPa. During the calculating course, the grouting length ranged between 2 m and 3 m. The other input parameters were the same as the values used in Section 3.1. Then, under those three different grouting length conditions, the bond capacity of the bars was acquired (Figure 9). It shows that the growth of the grouting length did not affect the initial reinforcement stiffness of the bars. Under those three different grouting length conditions, in the elastic stage, the initial stiffness was almost the same. However, the grouting length had a significant effect on the maximum force of the bars. With the growth of the grouting length, the maximum force of the bars grew significantly. When the grouting length grew from 2 m to 3 m, the maximum force of the bars grew from 269 kN to 364 kN.
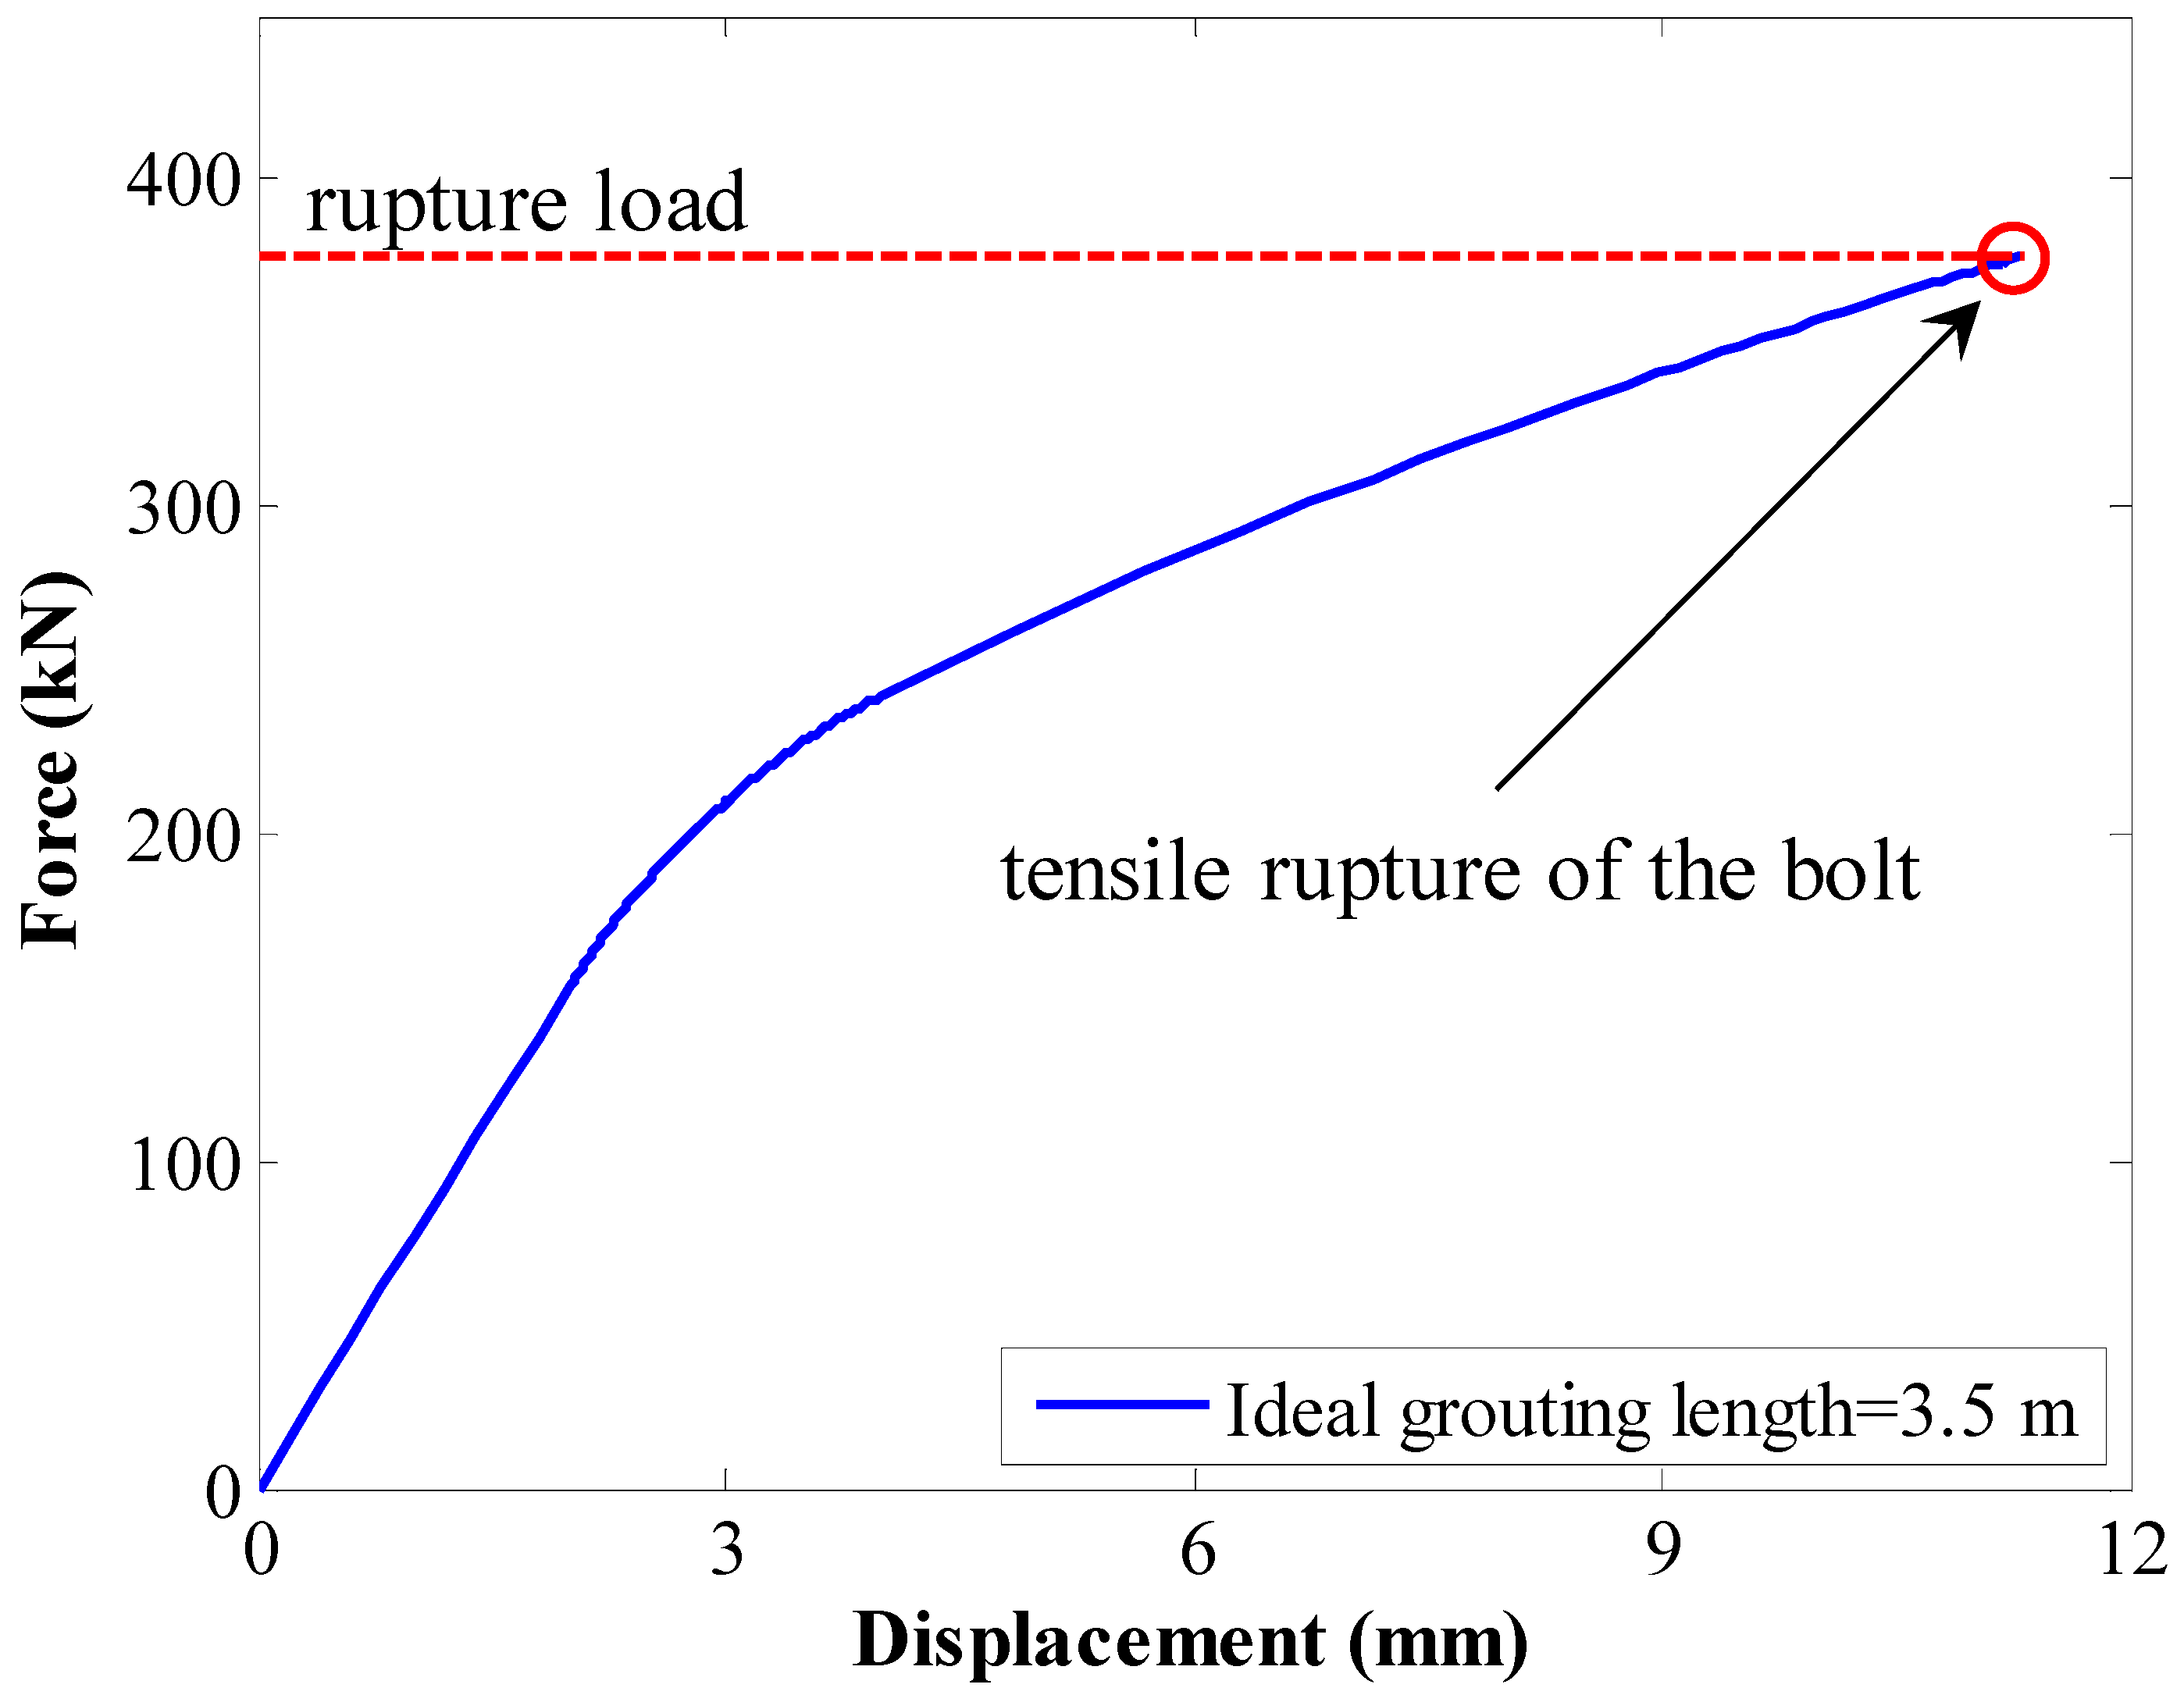
This analytical model can be used to calculate the ideal grouting length for bars. For example, in this case, it is assumed that the tensile strength of the bars was 1200 MPa. Then, this tensile strength was substituted into Equation (4) to calculate the rupture force of the bars.
where Fr is the rupture force of the bars.
Fr = σtπD2/4
The calculating result showed that the rupture force of the bars was 377 kN. Then, this rupture force could be substituted into the present analytical model to reverse-calculate the ideal grouting of the bars. For this case, the results showed that the ideal grouting length of the bars was around 3.5 m, as shown in Figure 10.
When the bars reached the maximum force, the bond stress at the boundary surface was examined (Figure 11, Figure 12 and Figure 13). Since it was different from other parameters, the grouting length had a marginal effect on the bond stress distribution state at the boundary surface. Under three different grouting length conditions, the elastic length of the boundary surface was around 552 mm. All the weakening length was around 800 mm. The only difference was the friction length. Under those three grouting length conditions, the friction lengths were 648 mm, 1149 mm, and 1648 mm.
Figure 12 shows the bond stress distribution at the boundary surface at the peak force when the grouting length was 2.5 m. It clearly indicates that when the peak force was reached, the bond stress at the boundary surface was in the elastic-weakening-friction state. At the free end of the bars, the bond stress was 2.42 MPa. When the distance from the free end grew, the bond stress grew non-linearly. When the distance from the free end grew to 0.55 m, the bond stress reached a peak of 3 MPa. When the distance from the free end grew further, the bond stress dropped non-linearly. When the distance from the free end grew to 1.35 m, the bond stress dropped to a residual bond strength of 1.5 MPa. After that, the bond stress remained constant, levelling at 1.5 MPa.
Figure 13 shows the bond stress distribution at the boundary surface at the peak force when the grouting length was 3 m. It shows that, although the grouting length grew, the bond stress distribution was still in the elastic-weakening-friction state when the maximum force was reached. More interestingly, the positions where the bond strength and the residual bond strength were reached were identical with those in Figure 12. However, the only difference was that the friction length grew. In this case, the friction length grew to 1648 mm, 499 mm longer than the friction length shown in Figure 12.
3.4. Bond Slipping When the Bond Strength Was Reached
Considering that the properties of the boundary surface affected the bond capacity of the bars, the bond slip in the bond strength was regarded as a factor for conducting the analysis. During the study, a calculation was conducted on a bar with a diameter of 20 mm, a modulus of 200 GPa and a grouting length of 2 m. To study the effect of the bond slip, it ranged between 1 mm and 3 mm. The corresponding tri-linear equation is shown in Figure 14.
During the calculation, the other parameters were the same as the values used in Section 3.1. After that, the analytical pulling test was conducted on bars, and the corresponding load-carrying force was obtained (Figure 15). It shows that with the growth of bond slipping in the bond strength, the maximum force of the bars decreased gradually. Furthermore, the stiffness of the reinforcing system gradually decreased. However, this bond slip did not affect the residual load-carrying force of the bars. Therefore, under those three different conditions, the residual load-carrying force of the bars remained around 188 kN.
When the maximum force of the bars was reached, the bond stress at the boundary surface was examined (Figure 16). With the growth of the bond slip in the bond strength, the elastic length and the friction length of the boundary surface gradually grew. For instance, as the bond slip in the bond strength grew from 1 mm to 3 mm, the elastic length of the boundary surface grew from 300 mm to 785 mm. Moreover, the corresponding friction length of the boundary surface grew from 483 mm to 814 mm. The weakening length dramatically declined from 1218 mm to 400 mm.
4. Limitation of the Current Paper
The limitation of the current paper is that it neglected the influence of the filling grout in the borehole. It only considered the interaction between full-grouting bars and the surrounding rock mass.
5. Recommendation for Further Work
After the current study, the authors plan to incorporate this analytical model into underground reinforcement scenarios. Then, the bond performance of full-grouting bars reinforced in underground roadways and tunnels can be studied. In this way, the reinforcement parameters of full-grouting bars used in the underground roadways and tunnels can be optimised.
6. Conclusions
This paper conducted an analytical study on the bond performance of full-grouting rock bolts based on the variable controlling method. Relying on this approach, the effect of bar diameter, bar modulus, grouting length, and bond slip in the bond strength on the load-carrying force of the bars was studied. Moreover, the bond stress distribution at the boundary surface was studied. This paper is conducive to enriching the base of knowledge. The main conclusions are listed below:
(1) With bar diameter growing, the maximum force of the bars grew significantly. In this case, when the bar diameter grew from 15 mm to 25 mm, the maximum force of the bars grew from 194 kN to 349 kN, growing by 80%. Furthermore, the stiffness of the reinforcement system grew by 108%. When the bars reached their maximum force, the bond stress at the boundary surface was in the elastic-weakening-friction state. Moreover, the smaller the bar diameter, the longer the friction length.
(2) The elastic modulus of the bars significantly affected the load-carrying force of the bars. With the growth of the bar modulus, the maximum force of the bars gradually grew. When the elastic modulus grew from 50 GPa to 200 GPa, the maximum force grew from 229 kN to 269 kN, only growing by 17%. However, the stiffness of the reinforcement system grew by 100%. Moreover, the friction length at the boundary surface declined.
(3) The grouting length had a significant effect on the maximum force of the bars. With the grouting length growing, the maximum force of the bars apparently grew. With the grouting length growing from 2 m to 3 m, the maximum force rose from 269 kN to 364 kN, growing by 35%. However, the grouting length had almost no effect on the stiffness. When the bars reached their maximum force, the bond stress distribution of the boundary surface was consistent. With the grouting length growing, the lengths of the elastic part and the weakening part were equal. By contrast, only the friction length grew. With the tensile strength of the bars provided, the current analytical model can be used to reverse-calculate the ideal grouting length of bars.
(4) The bond slip in the bond strength affected the load-carrying force of the bars. When it grew from 1 mm to 3 mm, the maximum force dropped from 281 kN to 258 kN, dropping by 8%. As for the stiffness, it dropped by 44%. Moreover, the elastic length and the friction length grew. By contrast, the weakening length declined.
Author Contributions
Conceptualization, Z.D. and J.Z.; investigation, J.C. and S.W. All authors have read and agreed to the published version of the manuscript.
Funding
National Natural Science Foundation of China, grant number 52034009, 51904302, 52174093; State Key Laboratory of Coal Resources in Western China, Xi’an University of Science and Technology, grant number sklcrkf20-11; Shaanxi Key Laboratory of Geotechnical and Underground Space Engineering, Xi’an University of Architecture and Technology, grant number yt202006.
Institutional Review Board Statement
Not applicable.
Informed Consent Statement
Not applicable.
Data Availability Statement
Data are contained within the article.
Conflicts of Interest
The authors declare no conflict of interest.
References
- Skrzypkowski, K. An experimental investigation into the stress-strain characteristic under static and quasi-static loading for partially embedded rock bolts. Energies 2021, 14, 1483. [Google Scholar] [CrossRef]
- Chong, Z.; Yue, T.; Yao, Q.; Li, X.; Zheng, C.; Xia, Z.; Li, H. Experimental and numerical investigation of crack propagation in bolting systems strengthened with resin-encapsulated rock bolts. Eng. Fail. Anal. 2021, 122, 105259. [Google Scholar] [CrossRef]
- Ma, S.; Chen, Y. Application of hydraulic fracturing and energy-absorption rockbolts to improve the stability of a gob-side roadway in a 10-m-thick coal seam: Case study. Int. J. Geomech. 2017, 17, 05017002. [Google Scholar] [CrossRef]
- Yu, S.; Zhu, W.; Niu, L.; Zhou, S.; Knag, P. Experimental and numerical analysis of fully grouted long rockbolt load-transfer behaviour. Tunnel. Undergr. Space Technol. 2019, 85, 56–66. [Google Scholar] [CrossRef]
- Feng, X.; Zhang, N.; Yang, S.; He, F. Mechanical response of fully bonded bolts under cyclic load. Int. J. Rock Mech. Min. Sci. 2018, 109, 138–154. [Google Scholar] [CrossRef]
- Chen, J.; Liu, P.; Zhao, H.; Zhang, C.; Zhang, J. Analytical studying the axial performance of fully encapsulated rock bolts. Eng. Fail. Anal. 2021, 128, 105580. [Google Scholar] [CrossRef]
- Wang, Y.; Gao, Y.; Wang, E.; He, M.; Yang, J. Roof deformation characteristics and preventive techniques using a novel non-pillar mining method of gob-side entry retaining by roof cutting. Energies 2018, 11, 627. [Google Scholar] [CrossRef]
- Ma, S.; Zhu, X.; Qin, W.; Hu, S. Determination of the bond-slip relationship of fully grouted rockbolts. Environ. Earth Sci. 2018, 77, 325–326. [Google Scholar] [CrossRef]
- Zhang, Z.; Yu, X.; Wu, H.; Deng, M. Stability control for gob-side entry retaining with supercritical retained entry width in thick coal seam longwall mining. Energies 2019, 12, 1375. [Google Scholar] [CrossRef] [Green Version]
- Skrzypkowski, K.; Korzeniowski, W.; Zagórski, K.; Zagórska, A. Flexibility and load-bearing capacity of roof bolting as functions of mounting depth and hole diameter. Energies 2019, 12, 3754. [Google Scholar] [CrossRef] [Green Version]
- Chen, Y.; Teng, J.; Bin Sadiq, R.A.; Zhang, K. Experimental study of bolt-anchoring mechanism for bedded rock mass. Int. J. Geomech. 2020, 20, 04020019. [Google Scholar] [CrossRef]
- Chen, J.; Li, D. Numerical simulation of fully encapsulated rock bolts with a tri-linear constitutive relation. Tunnel. Undergr. Space Technol. 2022, 120, 104265. [Google Scholar] [CrossRef]
- Ma, H.; Tan, X.; Qian, J.; Hou, X. Theoretical analysis of anchorage mechanism for rock bolt including local stripping bolt. Int. J. Rock Mech. Min. Sci. 2019, 122, 104080. [Google Scholar] [CrossRef]
- Cao, C.; Ren, T.; Cook, C.; Cao, Y. Analytical approach in optimising selection of rebar bolts in preventing rock bolting failure. Int. J. Rock Mech. Min. Sci. 2014, 72, 16–25. [Google Scholar] [CrossRef]
- Wang, G.; Han, W.; Jiang, Y.; Luan, H.; Wang, K. Coupling analysis for rock mass supported with CMC or CFC rockbolts based on viscoelastic method. Rock Mech. Rock Eng. 2019, 52, 4565–4588. [Google Scholar] [CrossRef]
- Zou, J.; Zhang, P. Analytical model of fully grouted bolts in pull-out tests and in situ rock masses. Int. J. Rock Mech. Min. Sci. 2019, 113, 278–294. [Google Scholar] [CrossRef]
- Ren, F.; Yang, Z.J.; Chen, J.F.; Chen, W.W. An analytical analysis of the full-range behaviour of grouted rockbolts based on a tri-linear bond-slip model. Constr. Build. Mater. 2010, 24, 361–370. [Google Scholar] [CrossRef]
- Zheng, X.; Zhang, N.; Xue, F. Study on stress distribution law in anchoring section of prestressed bolt. J. Min. Saf. Eng. 2012, 29, 365–370. (In Chinese) [Google Scholar]
- Ma, S.; Nemcik, J.; Aziz, N. An analytical model of fully grouted rock bolts subjected to tensile load. Constr. Build. Mater. 2013, 49, 519–526. [Google Scholar] [CrossRef]
- He, F.; Shi, W.; Wu, J. Stress distribution law analysis of extensible bolting of pre-stressed anchor. Saf. Coal Mines 2016, 47, 212–215. (In Chinese) [Google Scholar] [CrossRef]
- Saleem, M. Multiple crack extension model of steel anchor bolts subjected to impact loading. Constr. Build. Mater. 2018, 180, 364–374. [Google Scholar] [CrossRef]
- Lv, Q.; Tao, Z.; Li, Z.; He, M.; An, W. Elasto-plastic mechanics analysis of large deformation anchor. Chin. J. Rock Mech. Eng. 2018, 37, 792–800. (In Chinese) [Google Scholar] [CrossRef]
- Wang, Y.; Wu, Z.; Zheng, J.; Zhou, X. Three-dimensional analytical model for the pull-out response of anchor-mortar-concrete anchorage system based on interfacial bond failure. Eng. Struct. 2019, 180, 234–248. [Google Scholar] [CrossRef]
- Zhang, W.; Huang, L.; Juang, C.H. An analytical model for estimating the force and displacement of fully grouted rock bolts. Comput. Geotech. 2020, 117, 103222. [Google Scholar] [CrossRef]
- Saleem, M.; Hosoda, A. Latin hypercube sensitivity analysis and non-destructive test to evaluate the pull-out strength of steel anchor bolts embedded in concrete. Constr. Build. Mater. 2021, 290, 123256. [Google Scholar] [CrossRef]
- Chen, J.; Yang, S.; Zhao, H.; Zhang, J.; He, F.; Yin, S. The analytical approach to evaluate the load-displacement relationship of rock bolts. Adv. Civ. Eng. 2019, 2019, 2678905. [Google Scholar] [CrossRef]
- Yuan, H.; Teng, J.G.; Seracino, R.; Wu, Z.S.; Yao, J. Full-range behavior of FRP-to-concrete bonded joints. Eng. Struct. 2004, 26, 553–565. [Google Scholar] [CrossRef]
- Blanco Martín, L.; Tijani, M.; Hadj-Hassen, F. A new analytical solution to the mechanical behaviour of fully grouted rockbolts subjected to pull-out tests. Constr. Build. Mater. 2010, 25, 633–642. [Google Scholar] [CrossRef] [Green Version]
- Benmokrane, B.; Chennouf, A.; Mitri, H.S. Laboratory evaluation of cement-based grouts and grouted rock anchors. Int. J. Rock Mech. Min. Sci. 1995, 32, 633–642. [Google Scholar] [CrossRef]
- Blanco Martín, L.; Tijani, M.; Hadj-Hassen, F.; Noiret, A. Assessment of the bolt-grout interface behaviour of fully grouted rockbolts from laboratory experiments under axial loads. Int. J. Rock Mech. Min. Sci. 2013, 63, 50–61. [Google Scholar] [CrossRef]
- Bai, X.; Zhang, M.; Yan, N. Field contrast test and mechanism analysis on anchorage performance of anti-floating anchors with two different materials. China Civ. Eng. J. 2015, 48, 38–46+59. [Google Scholar] [CrossRef]
- Kilik, A.; Yasar, E.; Celik, A.G. Effect of grout properties on the pull-out load capacity of fully grouted rock bolt. Tunnel. Undergr. Space Technol. 2002, 17, 355–362. [Google Scholar] [CrossRef]
- Vaculik, J.; Sturm, A.B.; Visintin, P.; Griffith, M.C. Modelling FRP-to-substrate joints using the bilinear bond-slip rule with allowance for friction-Full-range analytical solutions for long and short bonded lengths. IJSS 2018, 135, 245–260. [Google Scholar] [CrossRef]
- Cai, Y.; Esaki, T.; Jiang, Y. An analytical model to predict axial load in grouted rock bolt for soft rock tunnelling. Tunnel. Undergr. Space Technol. 2004, 19, 607–618. [Google Scholar] [CrossRef]
Figure 1.
Tri-linear equation.

Figure 2.
Comparison between experimental test and modelling [26].
Figure 2.
Comparison between experimental test and modelling [26].

Figure 3.
Effect of bar diameter on the load-carrying force of bars.

Figure 4.
Relationship between the maximum force of the bars, λ, and the bar diameter.

Figure 5.
Effect of bar diameter on the bond stress distributing on the boundary surface when peak load occurred.
Figure 5.
Effect of bar diameter on the bond stress distributing on the boundary surface when peak load occurred.

Figure 6.
Effect of the modulus of the bars on the load-carrying force.

Figure 7.
Relationship between the maximum force of the bars, λ, and the elastic modulus of the bars.
Figure 7.
Relationship between the maximum force of the bars, λ, and the elastic modulus of the bars.

Figure 8.
Effect of the modulus on the bond stress distribution on the boundary surface when peak force was reached.
Figure 8.
Effect of the modulus on the bond stress distribution on the boundary surface when peak force was reached.

Figure 9.
Effect of the grouting length on the load-carrying force of the bars.

Figure 10.
Reverse-calculating the ideal grouting length of the bars.

Figure 11.
Bond stress distribution at the boundary surface at the peak force when the grouting length was 2 m.
Figure 11.
Bond stress distribution at the boundary surface at the peak force when the grouting length was 2 m.

Figure 12.
Bond stress distribution at the boundary surface at the peak force when the grouting length was 2.5 m.
Figure 12.
Bond stress distribution at the boundary surface at the peak force when the grouting length was 2.5 m.

Figure 13.
Bond stress distribution at the boundary surface at the peak force when the grouting length was 3 m.
Figure 13.
Bond stress distribution at the boundary surface at the peak force when the grouting length was 3 m.

Figure 14.
Inputted tri-linear equation.

Figure 15.
Effect of the bond slip in the bond strength on the load-carrying force of the bars.

Figure 16.
Effect of the bond slip in the bond strength on the bond stress distribution of the boundary surface.
Figure 16.
Effect of the bond slip in the bond strength on the bond stress distribution of the boundary surface.


Table 1.
Properties of the anchorage body.
| D (mm) | E1 (GPa) | L (m) | E2 (GPa) | A (m2) |
|---|---|---|---|---|
| 20 | 200 | 2 | 15 | 0.5 |
Table 2.
Properties of the boundary surface.
| τ1 (MPa) | δ1 (mm) | τ2 (MPa) | δ2 (mm) |
|---|---|---|---|
| 3 | 2 | 1.5 | 4 |
Publisher’s Note: MDPI stays neutral with regard to jurisdictional claims in published maps and institutional affiliations. |
© 2022 by the authors. Licensee MDPI, Basel, Switzerland. This article is an open access article distributed under the terms and conditions of the Creative Commons Attribution (CC BY) license (https://creativecommons.org/licenses/by/4.0/).
Share and Cite
MDPI and ACS Style
Chen, J.; Ding, Z.; Wu, S.; Zhang, J. Studying the Bond Performance of Full-Grouting Rock Bolts Based on the Variable Controlling Method. Energies 2022, 15, 3157. https://0-doi-org.brum.beds.ac.uk/10.3390/en15093157
AMA Style
Chen J, Ding Z, Wu S, Zhang J. Studying the Bond Performance of Full-Grouting Rock Bolts Based on the Variable Controlling Method. Energies. 2022; 15(9):3157. https://0-doi-org.brum.beds.ac.uk/10.3390/en15093157
Chicago/Turabian StyleChen, Jianhang, Ziwei Ding, Saisai Wu, and Junwen Zhang. 2022. "Studying the Bond Performance of Full-Grouting Rock Bolts Based on the Variable Controlling Method" Energies 15, no. 9: 3157. https://0-doi-org.brum.beds.ac.uk/10.3390/en15093157
Note that from the first issue of 2016, this journal uses article numbers instead of page numbers. See further details here.